Embed Size (px)
DESCRIPTION
Heat and Power Integration. CHEN 4460 – Process Synthesis, Simulation and Optimization Dr. Mario Richard Eden Department of Chemical Engineering Auburn University Lecture No. 10 – Heat and Power Integration: Network Design November 6, 2012 - PowerPoint PPT Presentation
Citation preview

Heat and Power Integration
CHEN 4460 – Process Synthesis, Simulation and Optimization
Dr. Mario Richard EdenDepartment of Chemical Engineering
Auburn University
Lecture No. 10 – Heat and Power Integration: Network DesignNovember 6, 2012
Contains Material Developed by Dr. Daniel R. Lewin, Technion, Israel

Lecture 9 – Objectives
Compute the pinch temperatures
Compute the Maximum Energy Recovery (MER) targets using graphical and/or algebraic methods
Design a simple Heat Exchanger Network (HEN) to meet the MER targets
Given data on the hot and cold streams of a process, you should be able to:
Last time!
Last time!

Reviewing Simple Example
Stream TS
(oC) TT
(oC) H
(kW) CP
(kW/oC)
H1 180 80 100 1.0 H2 130 40 180 2.0 C1 60 100 160 4.0 C2 30 120 162 1.8
Design a network of steam heaters, water coolers and exchangers for the process streams. Where possible, use exchangers in preference to utilities.
Utilities:Steam @ 150 oC, CW @ 25oC
30° 120°
180° 80°
130° 40°
60° 100°
ΔH=162
ΔH=160
ΔH=100
ΔH=180

Simple Example - Targets
30° 120°
180° 80°
40°
60°
ΔH=162
ΔH=60ΔH=18130°
ΔH=100
100°
Units: 4Steam: 60 kWCooling water: 18 kW
Are these numbers optimal??

H=150
H
180
130
CP = 3.0
80
40
H=50
H=80
C P =
1.0
C P = 2.
0
T
30° 120°
180° 80°
130° 40°
60° 100°
ΔH=162
ΔH=160
ΔH=100
ΔH=180
H=150
T
H
180
130
C P =
1.0
C P = 2.0
80
40
H=50
H=80Not to scale!
!
Not to scale!
!
Reviewing Simple Example

H=232
T
H
120
100
CP = 5.8
60
30
H=36
H=54
C P =
1.8
C P =
1.8
30° 120°
180° 80°
130° 40°
60° 100°
ΔH=162
ΔH=160
ΔH=100
ΔH=180
H=232
T
H
120
100
C P =
1.8
CP = 4.0
60
30
H=36
H=54Not to scale!
!
Not to scale!
!
Reviewing Simple Example
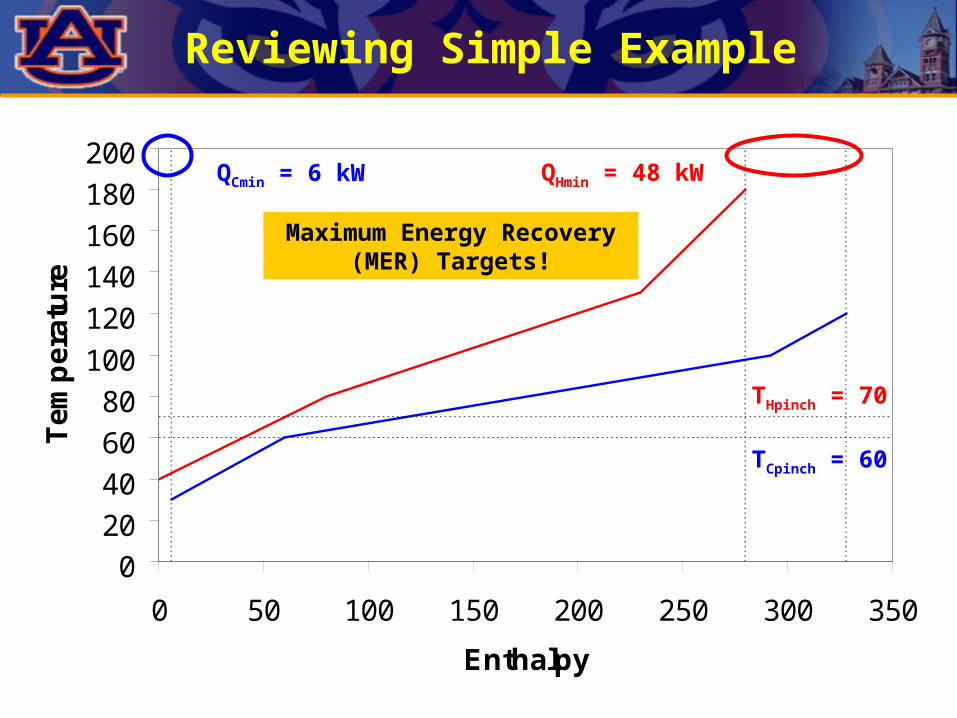
020406080
100120140160180200
0 50 100 150 200 250 300 350
Enthalpy
Temperature
QCmin = 6 kW QHmin = 48 kW
TCpinch = 60
THpinch = 70
Maximum Energy Recovery (MER) Targets!
Reviewing Simple Example

Reviewing Simple Example
Near Optimal Solution
30°
40°
60°
ΔH=62
ΔH=49100°
120°
ΔH=100
ΔH=7180°
80°
ΔH=111
H1
H2
C1
C2
180oC 80oC
130oC
100oC
120oC
40oC
60oC
30oC111
H
49
62
7C
100

Reviewing Simple Example
HEN Representation (Grid Diagram)
H1
H2
C1
C2
180oC 80oC
130oC
100oC
120oC
40oC
60oC
30oC111
H
49
62
7C
100

HEN Grid Diagram
H1
H2
C1
C2
Thot
H
CThot
Tcold
Thot
Tcold
Tcold
Tcold
The pinch divides the HEN into two parts: the left hand side (above the pinch) the right hand side (below the pinch)
At the pinch, ALL hot streams are hotterthan ALL cold streams by Tmin.

MER Network Design
H1
H2
C1
C2
170oC 60oC
150oC
135oC
140oC
30oC
20oC
80oC
CP
3.0
1.5
2.0
4.0
Step 1:MER TargetingPinch at 90° (Hot) and 80°
(Cold)
Energy Targets: Total Hot Utilities: 20 kWTotal Cold Utilities: 60 kW

MER Network Design
Step 2:Divide the problem at the pinch
H1
H2
C1
170oC 60oC
150oC
135oC
140oC
30oC
20oC
80oC
CP
3.0
1.5
2.0
4.0C2
80oC 80oC
90oC90oC
90oC 90oC

MER Network DesignStep 3:Design hot-end starting at the pinch
Pair up exchangers according to CP-constraints.
Immediately above the pinchPair up streams such that: CPHOT CPCOLD(This ensures that TH TC Tmin)
H1
H2
C1
CP
3.0
1.5
2.0
4.0C2
Violates Tmin constraint
H1
H2
C1
CP
3.0
1.5
2.0
4.0C2
Meets Tmin constraint
Tmin
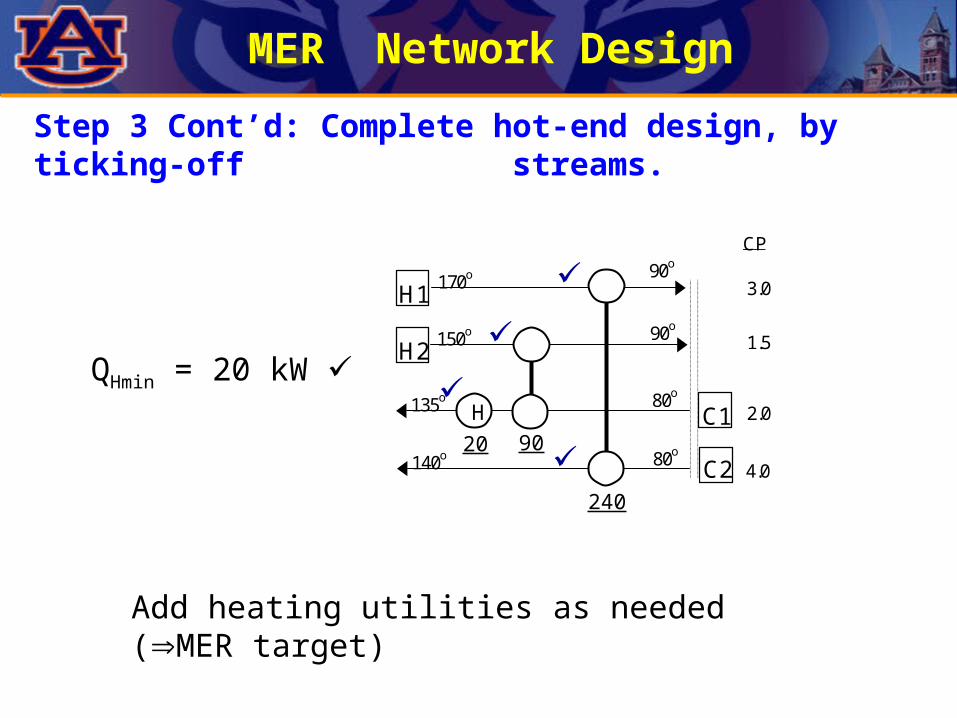
MER Network DesignStep 3 Cont’d: Complete hot-end design, by ticking-off streams.
H1
H2
C1
CP
3.0
1.5
2.0
4.0C2
170o
150o
135o
140o
90o
90o
80o
80o
90
240
H
Add heating utilities as needed (MER target)
QHmin = 20 kW
20

MER Network DesignStep 4:Design cold-end starting at the pinch
Pair up exchangers according to CP-constraints.
Immediately below the pinchPair up streams such that: CPHOT CPCOLD(This ensures that TH TC Tmin)
H1
H2
C1
CP
3.0
1.5
2.0
Violates Tmin constraint
H1
H2
C1
CP
3.0
1.5
2.0
Meets Tmin constraint
Tmin

MER Network DesignStep 4 Cont’d: Complete cold-end design, by ticking-off streams.
H1
H2
C1
CP
3.0
1.5
2.0
90o
90o
80o20o
60o
30o
C
Add cooling utilities as needed (MER target)
QCmin = 60 kW
3090
6035o

MER Network Design
Completed Design
H1
H2
C1
CP
3.0
1.5
2.0
4.0C2
170o
150o
135o
140o
90o
90o
80o
80o
240
9020
H125o
90 30
6035o
70o
20o
60o
30o
C
Note that this design meets the MER targets:
QHmin = 20 kW and QCmin = 60 kW

Steps in MER Network Design
MER targeting: Define pinch temperatures, Qhmin and QCmin
Divide problem at the pinch Design hot-end, starting at the pinch: Pair up exchangers according to CP-constraints. Immediately above the pinch, pair up streams such that: CPHOT CPCOLD. “Tick off” streams in order to minimize costs. Add heating utilities as needed (up to QHmin). Do not use cold utilities above the pinch. Design cold-end, starting at the pinch: Pair up exchangers according to CP-constraints. Immediately below the pinch, pair up streams such that: CPHOT CPCOLD. “Tick off” streams in order to minimize costs. Add heating utilities as needed (up to QCmin). Do not use hot utilities below the pinch.

Simple Example Revisited
Near Optimal Solution
30°
40°
60°
ΔH=62
ΔH=49100°
120°
ΔH=100
ΔH=7180°
80°
ΔH=111
H1
H2
C1
C2
180oC 80oC
130oC
100oC
120oC
40oC
60oC
30oC111
H
49
62
7C
100
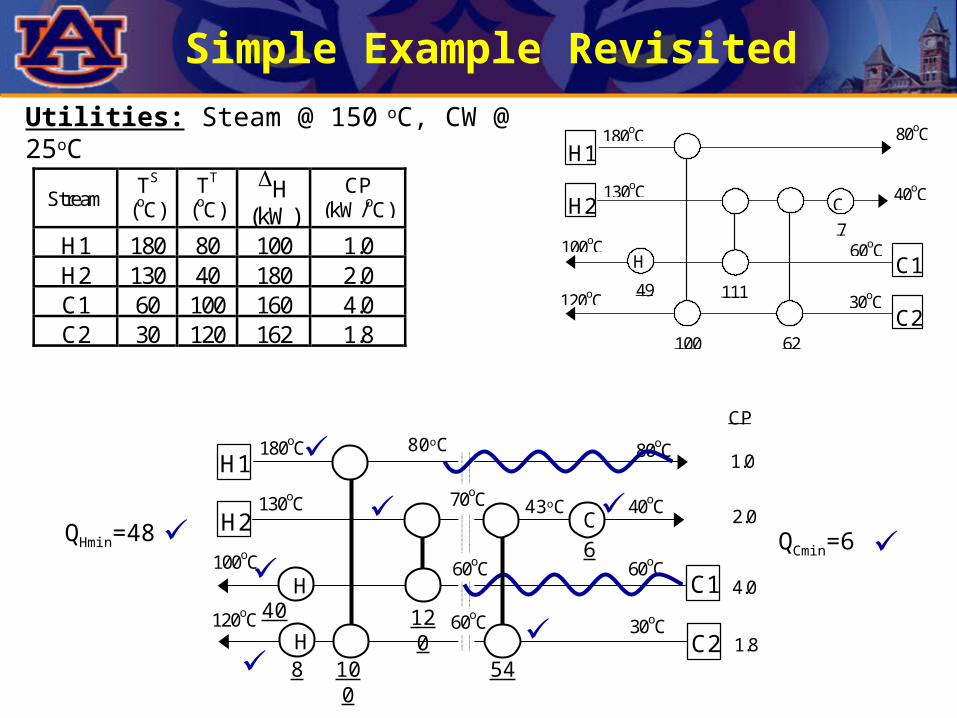
Simple Example Revisited
Stream TS
(oC) TT
(oC) H
(kW) CP
(kW/oC)
H1 180 80 100 1.0 H2 130 40 180 2.0 C1 60 100 160 4.0 C2 30 120 162 1.8
Utilities: Steam @ 150 oC, CW @ 25oC
H1
H2
C1
180oC 80oC
130oC
100oC
120oC
40oC
60oC
CP
1.0
2.0
4.0
1.8C2
60oC
70oC
60oC 30oC
QHmin=48 QCmin=6
80oC
H54
C
120
43oC
6
100
H
8
40
H1
H2
C1
C2
180oC 80oC
130oC
100oC
120oC
40oC
60oC
30oC111
H
49
62
7C
100

Compute the pinch temperatures
Compute the Maximum Energy Recovery (MER) targets using graphical and/or algebraic methods
Design a simple Heat Exchanger Network (HEN) to meet the MER targets
Given data on the hot and cold streams of a process, you should be able to:
Last time!
Last time!
Summary – Heat Integration

Other Business• Next Lectures – November 13 & 27
– Class review
• Simulation Project Reports– Due Thursday November 29
• Final Exam – December 3– Ross 136– 8:00 AM – 10:30 AM