Embed Size (px)
Citation preview
Heat, air and moisture transport properties of several
North American bricks and mortar mixes Kumaran, M.K.; Lackey, J.C.; Normandin, N.;
Tariku, F.; van Reenen, D. NRCC-46422
A version of this document is published in / Une version de ce document se trouve dans : Journal of Testing and Evaluation, v. 32, no. 5, Sept. 2004, pp. 383-389
http://irc.nrc-cnrc.gc.ca/ircpubs
Mavinkal K. Kumaran1, John C. Lackey2, Nicole Normandin2, Fitsum Tariku2 and David van
Reenen2
Heat, Air and Moisture Transport Properties of Several North
American Bricks and Mortar Mixes REFERENCE: Mavinkal K. Kumaran, John C. Lackey, Nicole Normandin, Fitsum Tariku and
David van Reenen., “Heat, Air and Moisture Transport Properties of Several North American Bricks and Mortar Mixes, ” Journal of Testing and Evaluation, JTEVA, Vol. 32, No. 5, 2004, pp.
383-389. ABSTRACT: Hygrothermal models are emerging as practical building design tools. These
models require a set of reliable inputs to provide results that are meaningful to the designers. One
of these inputs is the set of heat, air and moisture transport properties of materials. For any given
class of building materials the properties may vary within a broad range. This paper reports the
porosity, density, matrix density, thermal conductivity, equilibrium moisture content, water vapor
permeability, water absorption coefficient, liquid diffusivity and air permeability of six types of
bricks and four mortar mixes that are commonly used in North America. The experimental and
analytical procedures follow either international standards or well-established methodologies.
KEYWORDS: brick, mortar, porosity, density, matrix density, thermal conductivity, equilibrium
moisture content, water vapor permeability, water absorption coefficient, liquid diffusivity, air
permeability.
1 Principal Research Officer, 2 Technical Officer, Institute for Research in Construction, National
Research Council of Canada, Ottawa, K1A 0R6, Canada
2
With the advent of high power personal computers, hygrothermal computer models have
become powerful tools for building physicists and building practitioners alike. Researchers active
in the field of hygrothermal analyses have developed many such models in recent years [1,2]. All
these models require a very reliable set of inputs to yield meaningful results. Among these inputs
include the properties of the building materials. The most commonly used properties today are
those from an International Energy Agency Annex [3]. As building materials evolve there is a
need for continuous updating of the information on their hygrothermal properties. At the Institute
for Research in Construction two recently concluded projects have generated detailed information
on the hygrothermal properties of more than 70 building products that are currently used in
Canada and the United States of America [4,5]. One of these projects [5] was specifically looking
at the ranges of the properties shown by contemporary products in North America. The products
chosen for that investigation included wood and wood based materials, bricks, mortar, stucco and
building membranes. This paper reports the properties of six types of bricks and four types of
mortars that are currently used in North America.
The properties that have been measured include:
1. porosity, density and matrix density as basic material characteristics
2. thermal conductivity
3. equilibrium moisture content
4. water vapor permeability
5. water absorption coefficient
6. moisture diffusivity and
7. air permeability
Materials
The six types of bricks used in this investigation are all commercial products and they can
be identified as:
Brick 1: White concrete brick
Brick 2: Red matt clay brick
Brick 3: Buff matt clay brick
Brick 4: Textured coated clay brick
Brick 5: Concrete brick and
Brick 6: Calcium silicate brick
The four types of mortar mixes used in this investigation are as shown in Table 1.
3
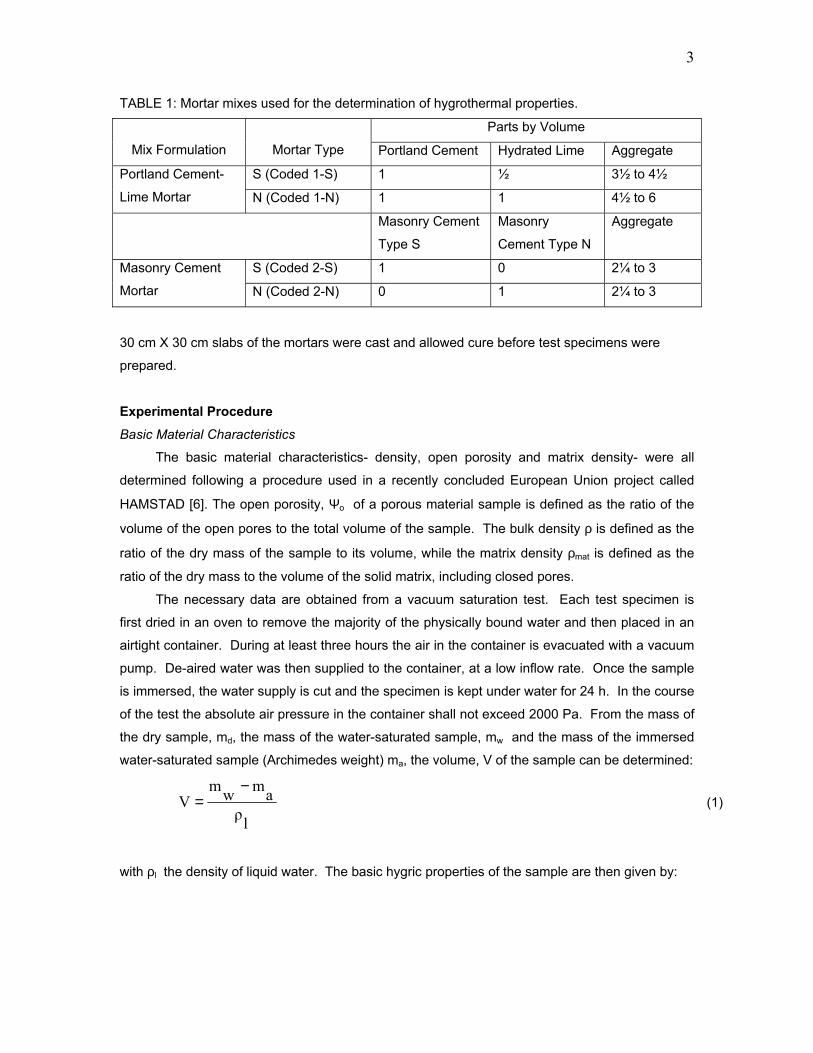
TABLE 1: Mortar mixes used for the determination of hygrothermal properties. Parts by Volume
Mix Formulation
Mortar Type Portland Cement Hydrated Lime Aggregate
S (Coded 1-S) 1 ½ 3½ to 4½ Portland Cement-
Lime Mortar N (Coded 1-N) 1 1 4½ to 6
Masonry Cement
Type S
Masonry
Cement Type N
Aggregate
S (Coded 2-S) 1 0 2¼ to 3 Masonry Cement
Mortar N (Coded 2-N) 0 1 2¼ to 3
30 cm X 30 cm slabs of the mortars were cast and allowed cure before test specimens were
prepared.
Experimental Procedure Basic Material Characteristics
The basic material characteristics- density, open porosity and matrix density- were all
determined following a procedure used in a recently concluded European Union project called
HAMSTAD [6]. The open porosity, Ψo of a porous material sample is defined as the ratio of the
volume of the open pores to the total volume of the sample. The bulk density ρ is defined as the
ratio of the dry mass of the sample to its volume, while the matrix density ρmat is defined as the
ratio of the dry mass to the volume of the solid matrix, including closed pores.
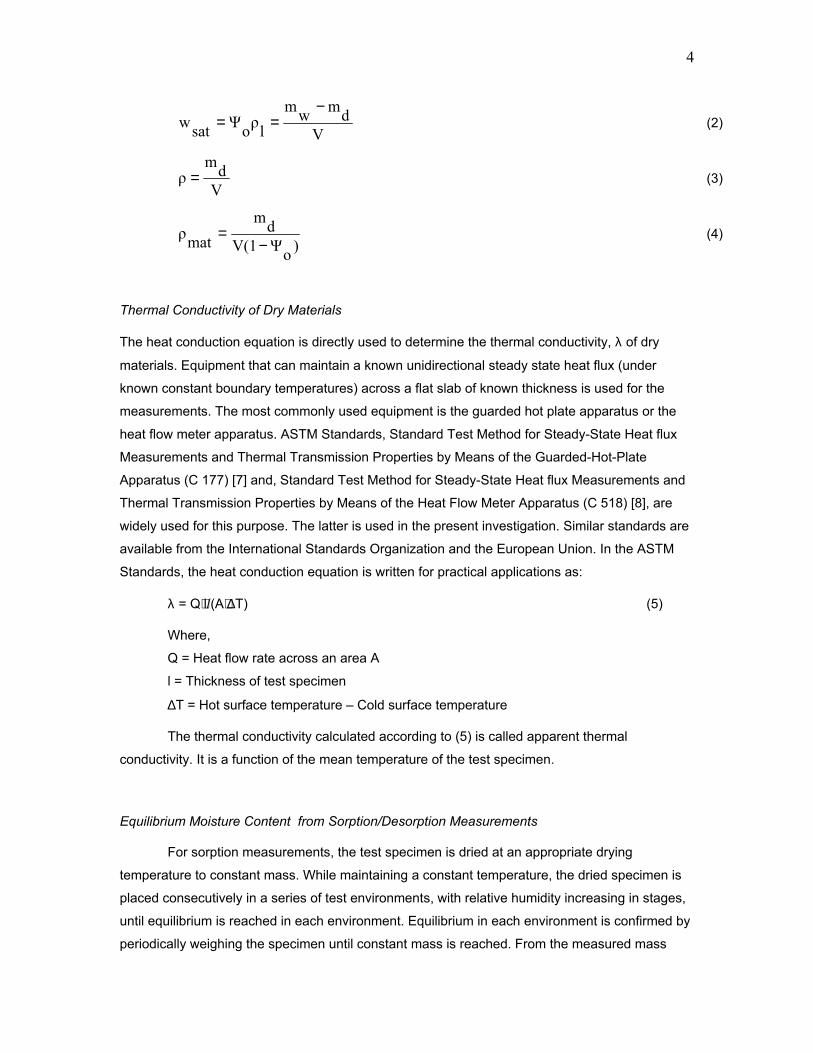
The necessary data are obtained from a vacuum saturation test. Each test specimen is
first dried in an oven to remove the majority of the physically bound water and then placed in an
airtight container. During at least three hours the air in the container is evacuated with a vacuum
pump. De-aired water was then supplied to the container, at a low inflow rate. Once the sample
is immersed, the water supply is cut and the specimen is kept under water for 24 h. In the course
of the test the absolute air pressure in the container shall not exceed 2000 Pa. From the mass of
the dry sample, md, the mass of the water-saturated sample, mw and the mass of the immersed
water-saturated sample (Archimedes weight) ma, the volume, V of the sample can be determined:
lρ
amwmV
−= (1)
with ρl the density of liquid water. The basic hygric properties of the sample are then given by:
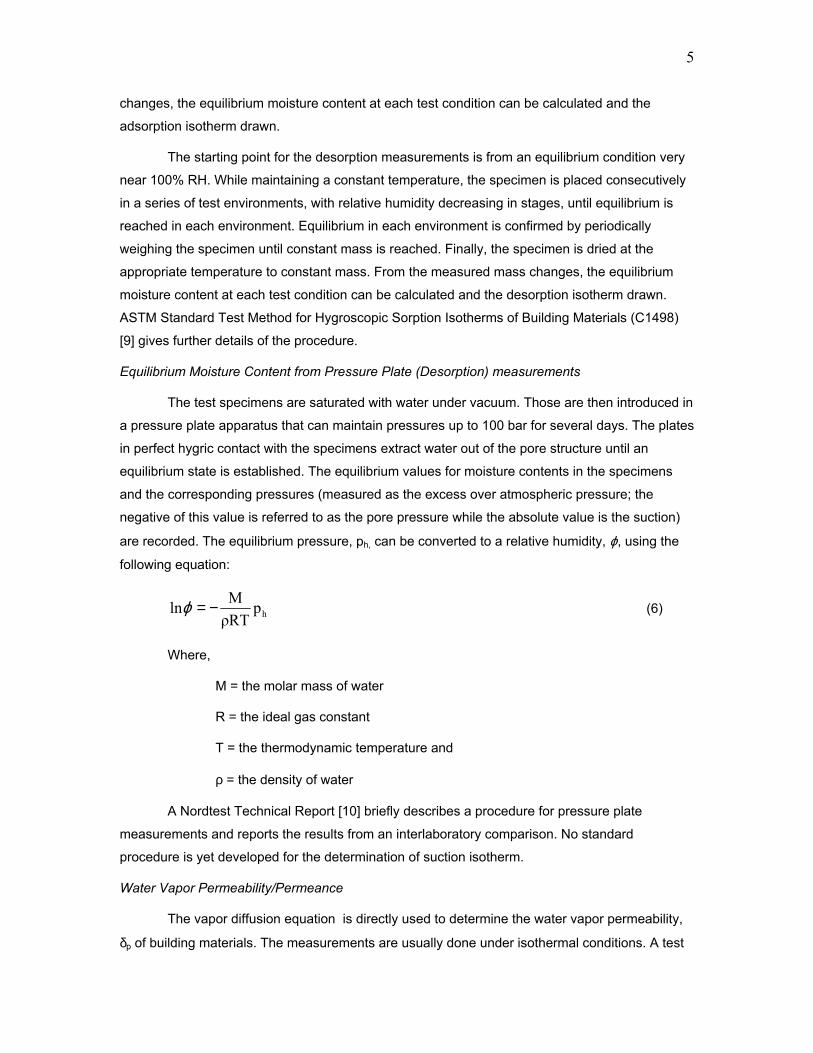
4
V
dmwmlρoΨsatw
−== (2)
Vdm
ρ = (3)
)oΨV(1
dmmatρ
−= (4)
Thermal Conductivity of Dry Materials
The heat conduction equation is directly used to determine the thermal conductivity, λ of dry
materials. Equipment that can maintain a known unidirectional steady state heat flux (under
known constant boundary temperatures) across a flat slab of known thickness is used for the
measurements. The most commonly used equipment is the guarded hot plate apparatus or the
heat flow meter apparatus. ASTM Standards, Standard Test Method for Steady-State Heat flux
Measurements and Thermal Transmission Properties by Means of the Guarded-Hot-Plate
Apparatus (C 177) [7] and, Standard Test Method for Steady-State Heat flux Measurements and
Thermal Transmission Properties by Means of the Heat Flow Meter Apparatus (C 518) [8], are
widely used for this purpose. The latter is used in the present investigation. Similar standards are
available from the International Standards Organization and the European Union. In the ASTM
Standards, the heat conduction equation is written for practical applications as:
λ = Q⋅l/(A⋅∆T) (5)
Where,
Q = Heat flow rate across an area A
l = Thickness of test specimen
∆T = Hot surface temperature – Cold surface temperature
The thermal conductivity calculated according to (5) is called apparent thermal
conductivity. It is a function of the mean temperature of the test specimen.
Equilibrium Moisture Content from Sorption/Desorption Measurements
For sorption measurements, the test specimen is dried at an appropriate drying
temperature to constant mass. While maintaining a constant temperature, the dried specimen is
placed consecutively in a series of test environments, with relative humidity increasing in stages,
until equilibrium is reached in each environment. Equilibrium in each environment is confirmed by
periodically weighing the specimen until constant mass is reached. From the measured mass
5
changes, the equilibrium moisture content at each test condition can be calculated and the
adsorption isotherm drawn.
The starting point for the desorption measurements is from an equilibrium condition very
near 100% RH. While maintaining a constant temperature, the specimen is placed consecutively
in a series of test environments, with relative humidity decreasing in stages, until equilibrium is
reached in each environment. Equilibrium in each environment is confirmed by periodically
weighing the specimen until constant mass is reached. Finally, the specimen is dried at the
appropriate temperature to constant mass. From the measured mass changes, the equilibrium
moisture content at each test condition can be calculated and the desorption isotherm drawn.
ASTM Standard Test Method for Hygroscopic Sorption Isotherms of Building Materials (C1498)
[9] gives further details of the procedure.
Equilibrium Moisture Content from Pressure Plate (Desorption) measurements
The test specimens are saturated with water under vacuum. Those are then introduced in
a pressure plate apparatus that can maintain pressures up to 100 bar for several days. The plates
in perfect hygric contact with the specimens extract water out of the pore structure until an
equilibrium state is established. The equilibrium values for moisture contents in the specimens
and the corresponding pressures (measured as the excess over atmospheric pressure; the
negative of this value is referred to as the pore pressure while the absolute value is the suction)
are recorded. The equilibrium pressure, ph, can be converted to a relative humidity, ϕ, using the
following equation:
hpρRTMln −=ϕ (6)
Where,
M = the molar mass of water
R = the ideal gas constant
T = the thermodynamic temperature and
ρ = the density of water
A Nordtest Technical Report [10] briefly describes a procedure for pressure plate
measurements and reports the results from an interlaboratory comparison. No standard
procedure is yet developed for the determination of suction isotherm.
Water Vapor Permeability/Permeance
The vapor diffusion equation is directly used to determine the water vapor permeability,
δp of building materials. The measurements are usually done under isothermal conditions. A test
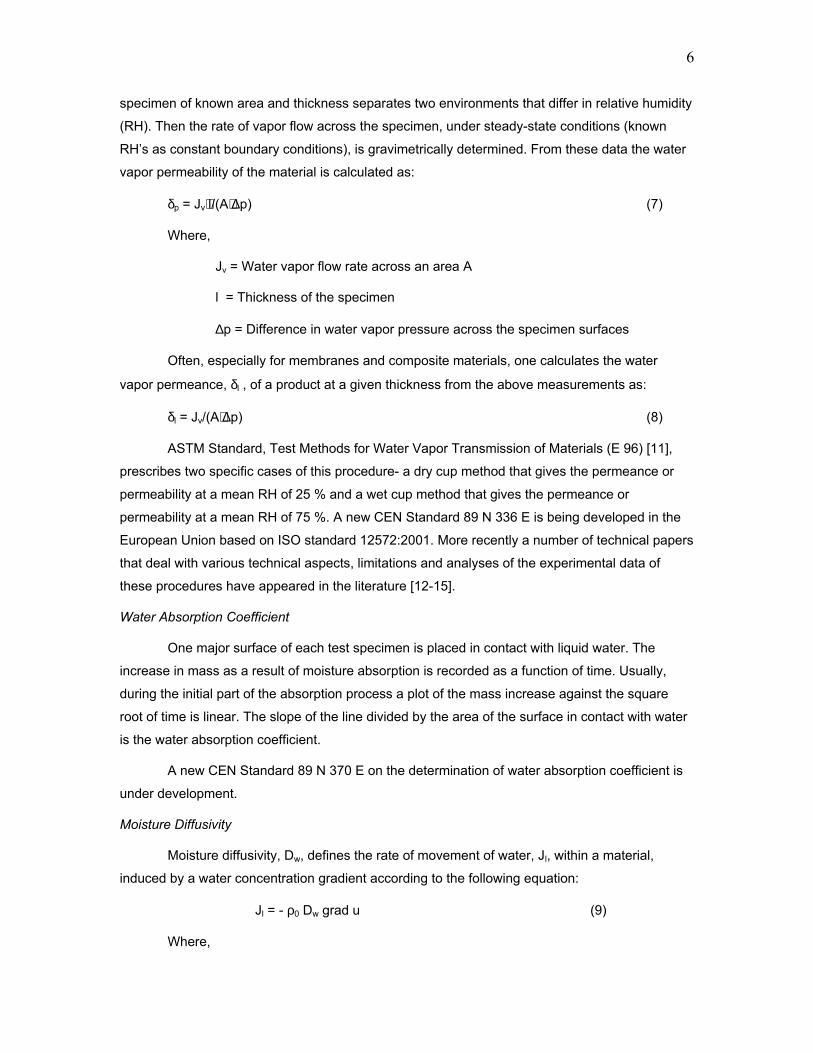
6
specimen of known area and thickness separates two environments that differ in relative humidity
(RH). Then the rate of vapor flow across the specimen, under steady-state conditions (known
RH’s as constant boundary conditions), is gravimetrically determined. From these data the water
vapor permeability of the material is calculated as:
δp = Jv⋅l/(A⋅∆p) (7)
Where,
Jv = Water vapor flow rate across an area A
l = Thickness of the specimen
∆p = Difference in water vapor pressure across the specimen surfaces
Often, especially for membranes and composite materials, one calculates the water
vapor permeance, δl , of a product at a given thickness from the above measurements as:
δl = Jv/(A⋅∆p) (8)
ASTM Standard, Test Methods for Water Vapor Transmission of Materials (E 96) [11],
prescribes two specific cases of this procedure- a dry cup method that gives the permeance or
permeability at a mean RH of 25 % and a wet cup method that gives the permeance or
permeability at a mean RH of 75 %. A new CEN Standard 89 N 336 E is being developed in the
European Union based on ISO standard 12572:2001. More recently a number of technical papers
that deal with various technical aspects, limitations and analyses of the experimental data of
these procedures have appeared in the literature [12-15].
Water Absorption Coefficient
One major surface of each test specimen is placed in contact with liquid water. The
increase in mass as a result of moisture absorption is recorded as a function of time. Usually,
during the initial part of the absorption process a plot of the mass increase against the square
root of time is linear. The slope of the line divided by the area of the surface in contact with water
is the water absorption coefficient.
A new CEN Standard 89 N 370 E on the determination of water absorption coefficient is
under development.
Moisture Diffusivity
Moisture diffusivity, Dw, defines the rate of movement of water, Jl, within a material,
induced by a water concentration gradient according to the following equation:
Jl = - ρ0 Dw grad u (9)
Where,
7
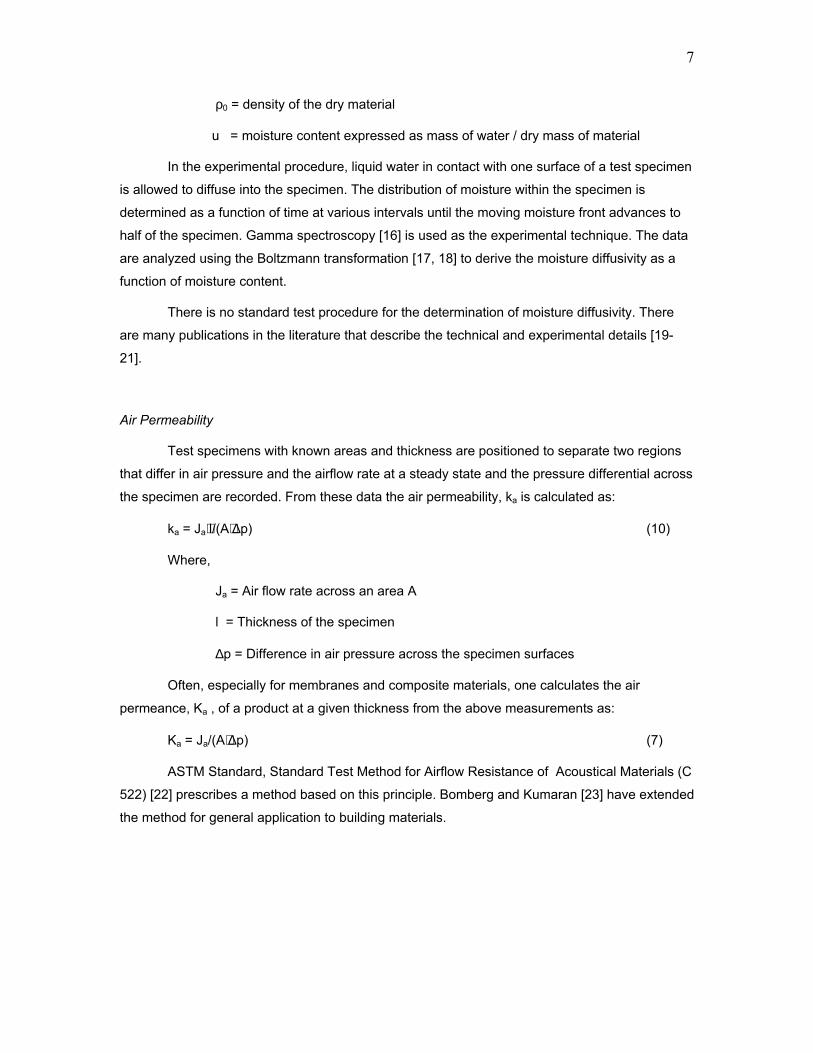
ρ0 = density of the dry material
u = moisture content expressed as mass of water / dry mass of material
In the experimental procedure, liquid water in contact with one surface of a test specimen
is allowed to diffuse into the specimen. The distribution of moisture within the specimen is
determined as a function of time at various intervals until the moving moisture front advances to
half of the specimen. Gamma spectroscopy [16] is used as the experimental technique. The data
are analyzed using the Boltzmann transformation [17, 18] to derive the moisture diffusivity as a
function of moisture content.
There is no standard test procedure for the determination of moisture diffusivity. There
are many publications in the literature that describe the technical and experimental details [19-
21].
Air Permeability
Test specimens with known areas and thickness are positioned to separate two regions
that differ in air pressure and the airflow rate at a steady state and the pressure differential across
the specimen are recorded. From these data the air permeability, ka is calculated as:
ka = Ja⋅l/(A⋅∆p) (10)
Where,
Ja = Air flow rate across an area A
l = Thickness of the specimen
∆p = Difference in air pressure across the specimen surfaces
Often, especially for membranes and composite materials, one calculates the air
permeance, Ka , of a product at a given thickness from the above measurements as:
Ka = Ja/(A⋅∆p) (7)
ASTM Standard, Standard Test Method for Airflow Resistance of Acoustical Materials (C
522) [22] prescribes a method based on this principle. Bomberg and Kumaran [23] have extended
the method for general application to building materials.
8
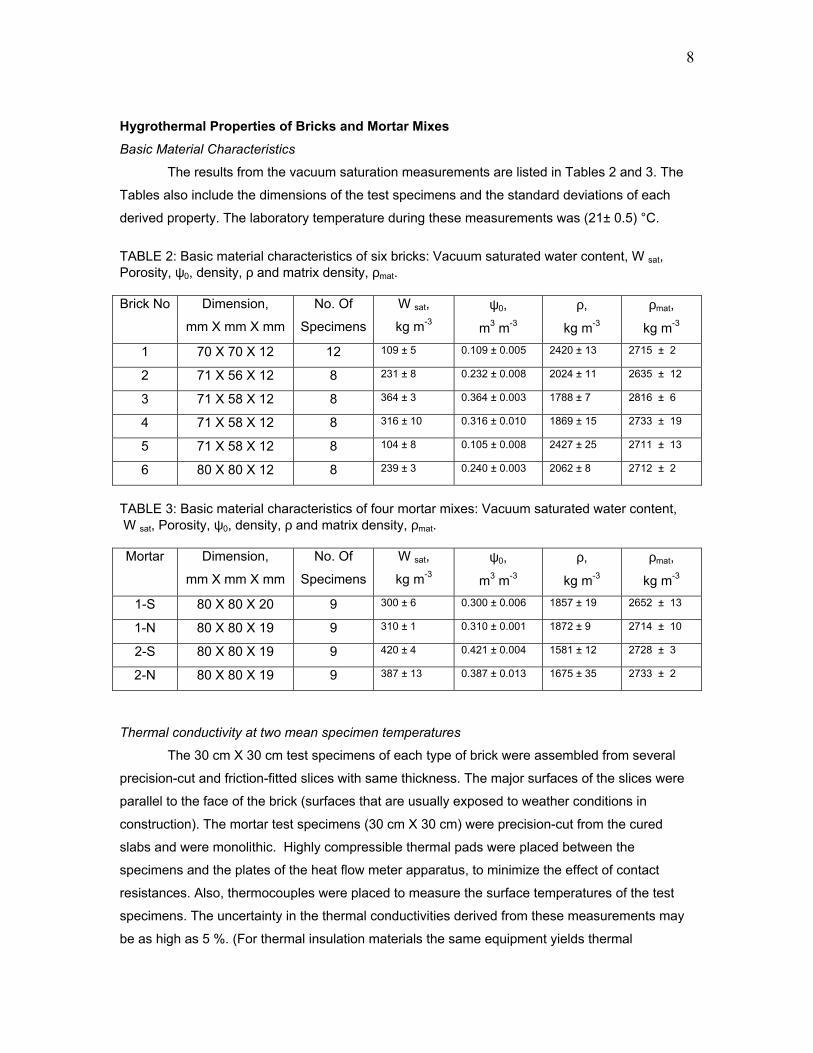
Hygrothermal Properties of Bricks and Mortar Mixes Basic Material Characteristics
The results from the vacuum saturation measurements are listed in Tables 2 and 3. The
Tables also include the dimensions of the test specimens and the standard deviations of each
derived property. The laboratory temperature during these measurements was (21± 0.5) °C.
TABLE 2: Basic material characteristics of six bricks: Vacuum saturated water content, W sat, Porosity, ψ0, density, ρ and matrix density, ρmat.
Brick No Dimension,
mm X mm X mm
No. Of
Specimens
W sat,
kg m-3 ψ0,
m3 m-3
ρ,
kg m-3
ρmat, kg m-3
1 70 X 70 X 12 12 109 ± 5 0.109 ± 0.005 2420 ± 13 2715 ± 2
2 71 X 56 X 12 8 231 ± 8 0.232 ± 0.008 2024 ± 11 2635 ± 12
3 71 X 58 X 12 8 364 ± 3 0.364 ± 0.003 1788 ± 7 2816 ± 6
4 71 X 58 X 12 8 316 ± 10 0.316 ± 0.010 1869 ± 15 2733 ± 19
5 71 X 58 X 12 8 104 ± 8 0.105 ± 0.008 2427 ± 25 2711 ± 13
6 80 X 80 X 12 8 239 ± 3 0.240 ± 0.003 2062 ± 8 2712 ± 2
TABLE 3: Basic material characteristics of four mortar mixes: Vacuum saturated water content, W sat, Porosity, ψ0, density, ρ and matrix density, ρmat.
Mortar Dimension,
mm X mm X mm
No. Of
Specimens
W sat,
kg m-3 ψ0,
m3 m-3
ρ,
kg m-3
ρmat, kg m-3
1-S 80 X 80 X 20 9 300 ± 6 0.300 ± 0.006 1857 ± 19 2652 ± 13
1-N 80 X 80 X 19 9 310 ± 1 0.310 ± 0.001 1872 ± 9 2714 ± 10
2-S 80 X 80 X 19 9 420 ± 4 0.421 ± 0.004 1581 ± 12 2728 ± 3
2-N 80 X 80 X 19 9 387 ± 13 0.387 ± 0.013 1675 ± 35 2733 ± 2
Thermal conductivity at two mean specimen temperatures
The 30 cm X 30 cm test specimens of each type of brick were assembled from several
precision-cut and friction-fitted slices with same thickness. The major surfaces of the slices were
parallel to the face of the brick (surfaces that are usually exposed to weather conditions in
construction). The mortar test specimens (30 cm X 30 cm) were precision-cut from the cured
slabs and were monolithic. Highly compressible thermal pads were placed between the
specimens and the plates of the heat flow meter apparatus, to minimize the effect of contact
resistances. Also, thermocouples were placed to measure the surface temperatures of the test
specimens. The uncertainty in the thermal conductivities derived from these measurements may
be as high as 5 %. (For thermal insulation materials the same equipment yields thermal
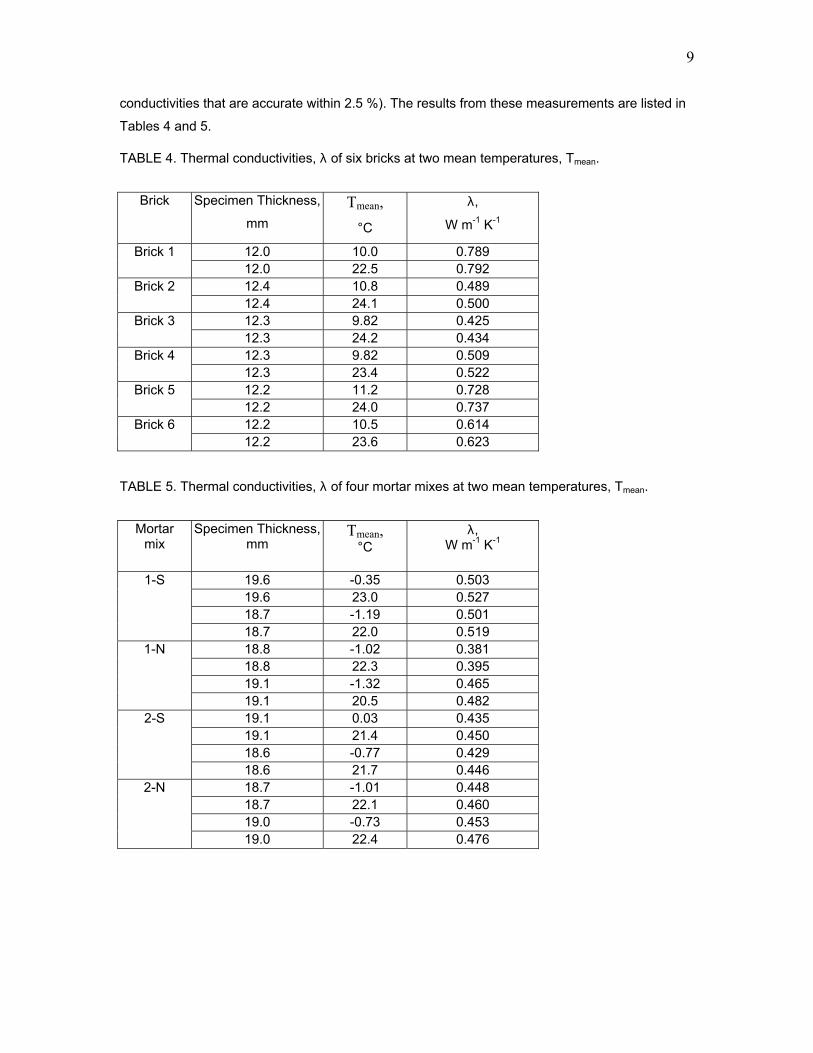
9
conductivities that are accurate within 2.5 %). The results from these measurements are listed in
Tables 4 and 5.
TABLE 4. Thermal conductivities, λ of six bricks at two mean temperatures, Tmean.
Brick Specimen Thickness,
mm Tmean,
°C
λ,
W m-1 K-1
12.0 10.0 0.789 Brick 1 12.0 22.5 0.792 12.4 10.8 0.489 Brick 2 12.4 24.1 0.500 12.3 9.82 0.425 Brick 3 12.3 24.2 0.434 12.3 9.82 0.509 Brick 4 12.3 23.4 0.522 12.2 11.2 0.728 Brick 5 12.2 24.0 0.737 12.2 10.5 0.614 Brick 6 12.2 23.6 0.623
TABLE 5. Thermal conductivities, λ of four mortar mixes at two mean temperatures, Tmean.
Mortar
mix Specimen Thickness,
mm Tmean,
°C λ,
W m-1 K-1
19.6 -0.35 0.503 19.6 23.0 0.527 18.7 -1.19 0.501
1-S
18.7 22.0 0.519 18.8 -1.02 0.381 18.8 22.3 0.395 19.1 -1.32 0.465
1-N
19.1 20.5 0.482 19.1 0.03 0.435 19.1 21.4 0.450 18.6 -0.77 0.429
2-S
18.6 21.7 0.446 18.7 -1.01 0.448 18.7 22.1 0.460 19.0 -0.73 0.453
2-N
19.0 22.4 0.476
10
From the above measured values it is estimated that for both types of products the
temperature coefficient of thermal conductivity is approximately 7 X 10 – 4 W m-1 K-2.
Equilibrium moisture content
50 mm X 50 mm X 6 mm specimens were used in establishing the equilibrium moisture
contents. Three specimens each were used for sorption and desorption measurements and nine
specimens were used in the pressure plate (suction) measurements. A set of constant
temperature (23 ± 0.3 ºC) – constant relative humidity chambers (controlled within 0.5 %) were
used for the former measurements. The latter were performed at laboratory conditions, (21± 0.5)
ºC. The results from these measurements are listed in Tables 6 and 7.
The pressure plate measurements were performed with new materials. The starting point
was vacuum saturation. In the section on basic material characteristics, the vacuum saturation
was repeated after more than two years and with samples that were aged in the laboratory for
that period. It can be seen that there are some differences in the two sets of saturation moisture
contents determined in these two series of measurements. The sorption and desorption
undergone by the bricks in the hygroscopic region is rather small and measured mass changes
are often within the precision range of the balance.
11
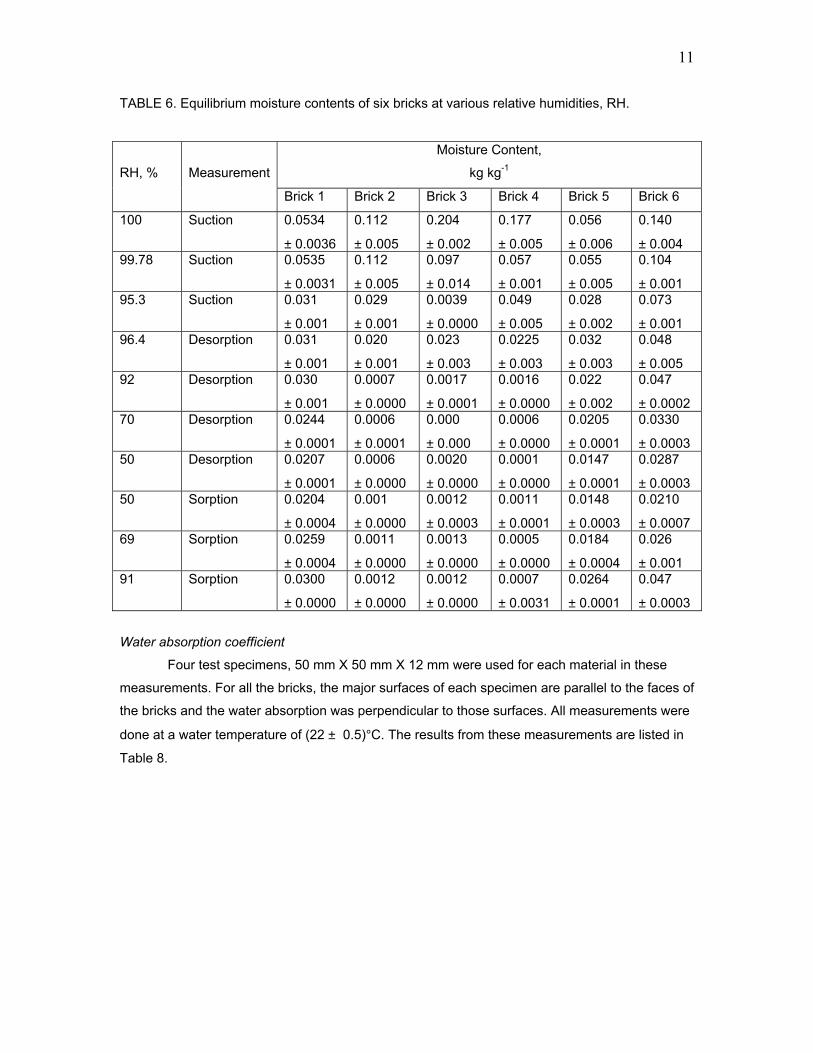
TABLE 6. Equilibrium moisture contents of six bricks at various relative humidities, RH.
Moisture Content,
kg kg-1
RH, %
Measurement
Brick 1 Brick 2 Brick 3 Brick 4 Brick 5 Brick 6
100 Suction 0.0534
± 0.0036
0.112
± 0.005 0.204
± 0.002 0.177
± 0.005 0.056
± 0.006 0.140
± 0.004 99.78 Suction 0.0535
± 0.0031 0.112
± 0.005 0.097
± 0.014 0.057
± 0.001 0.055
± 0.005 0.104
± 0.001 95.3 Suction 0.031
± 0.001 0.029
± 0.001 0.0039
± 0.0000 0.049
± 0.005 0.028
± 0.002 0.073
± 0.001 96.4 Desorption 0.031
± 0.001 0.020
± 0.001 0.023
± 0.003 0.0225
± 0.003 0.032
± 0.003 0.048
± 0.005 92 Desorption 0.030
± 0.001 0.0007
± 0.0000 0.0017
± 0.0001 0.0016
± 0.0000 0.022
± 0.002 0.047
± 0.0002 70 Desorption 0.0244
± 0.0001 0.0006
± 0.0001 0.000
± 0.000 0.0006
± 0.0000 0.0205
± 0.0001 0.0330
± 0.0003 50 Desorption 0.0207
± 0.0001 0.0006
± 0.0000 0.0020
± 0.0000 0.0001
± 0.0000 0.0147
± 0.0001 0.0287
± 0.0003 50 Sorption 0.0204
± 0.0004 0.001
± 0.0000 0.0012
± 0.0003 0.0011
± 0.0001 0.0148
± 0.0003 0.0210
± 0.0007 69 Sorption 0.0259
± 0.0004 0.0011
± 0.0000 0.0013
± 0.0000 0.0005
± 0.0000 0.0184
± 0.0004 0.026
± 0.001 91 Sorption 0.0300
± 0.0000 0.0012
± 0.0000 0.0012
± 0.0000 0.0007
± 0.0031 0.0264
± 0.0001 0.047
± 0.0003
Water absorption coefficient
Four test specimens, 50 mm X 50 mm X 12 mm were used for each material in these
measurements. For all the bricks, the major surfaces of each specimen are parallel to the faces of
the bricks and the water absorption was perpendicular to those surfaces. All measurements were
done at a water temperature of (22 ± 0.5)°C. The results from these measurements are listed in
Table 8.
12
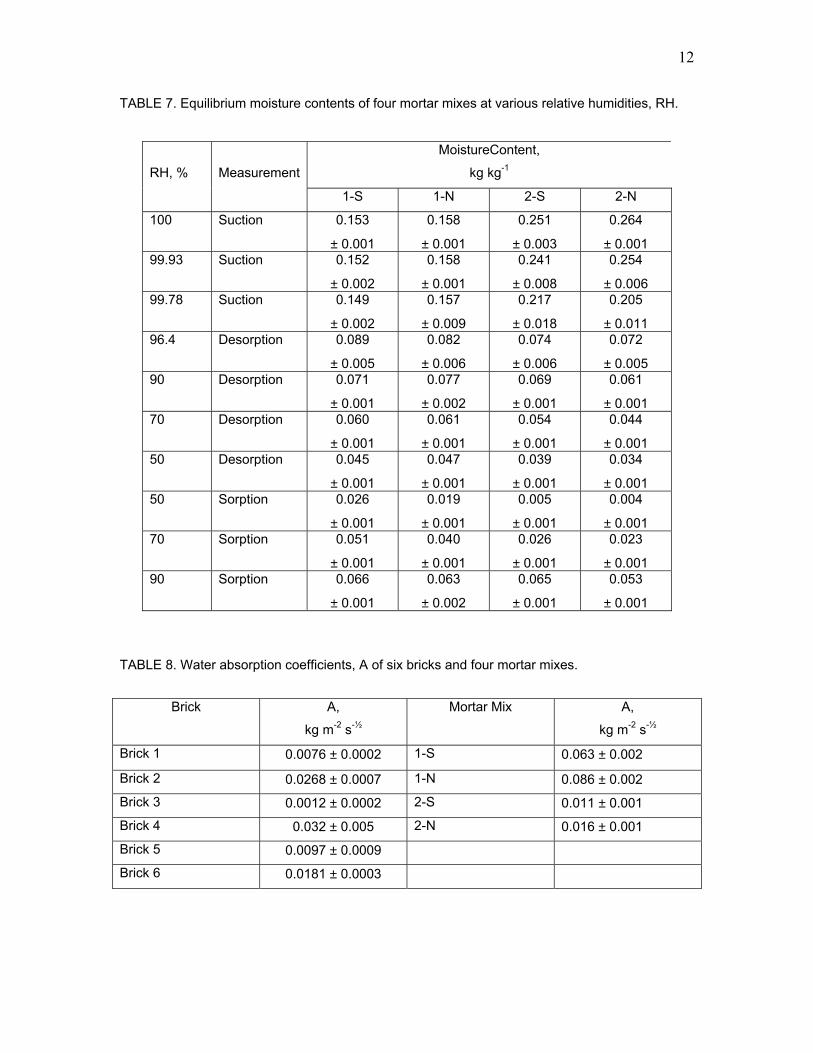
TABLE 7. Equilibrium moisture contents of four mortar mixes at various relative humidities, RH.
MoistureContent,
kg kg-1
RH, %
Measurement
1-S 1-N 2-S 2-N
100 Suction 0.153
± 0.001
0.158
± 0.001 0.251
± 0.003 0.264
± 0.001 99.93 Suction 0.152
± 0.002 0.158
± 0.001 0.241
± 0.008 0.254
± 0.006 99.78 Suction 0.149
± 0.002 0.157
± 0.009 0.217
± 0.018 0.205
± 0.011 96.4 Desorption 0.089
± 0.005 0.082
± 0.006 0.074
± 0.006 0.072
± 0.005 90 Desorption 0.071
± 0.001 0.077
± 0.002 0.069
± 0.001 0.061
± 0.001 70 Desorption 0.060
± 0.001 0.061
± 0.001 0.054
± 0.001 0.044
± 0.001 50 Desorption 0.045
± 0.001 0.047
± 0.001 0.039
± 0.001 0.034
± 0.001 50 Sorption 0.026
± 0.001 0.019
± 0.001 0.005
± 0.001 0.004
± 0.001 70 Sorption 0.051
± 0.001 0.040
± 0.001 0.026
± 0.001 0.023
± 0.001 90 Sorption 0.066
± 0.001 0.063
± 0.002 0.065
± 0.001 0.053
± 0.001
TABLE 8. Water absorption coefficients, A of six bricks and four mortar mixes.
Brick A,
kg m-2 s-½
Mortar Mix A,
kg m-2 s-½
Brick 1 0.0076 ± 0.0002 1-S 0.063 ± 0.002
Brick 2 0.0268 ± 0.0007 1-N 0.086 ± 0.002
Brick 3 0.0012 ± 0.0002 2-S 0.011 ± 0.001
Brick 4 0.032 ± 0.005 2-N 0.016 ± 0.001
Brick 5 0.0097 ± 0.0009
Brick 6 0.0181 ± 0.0003
13
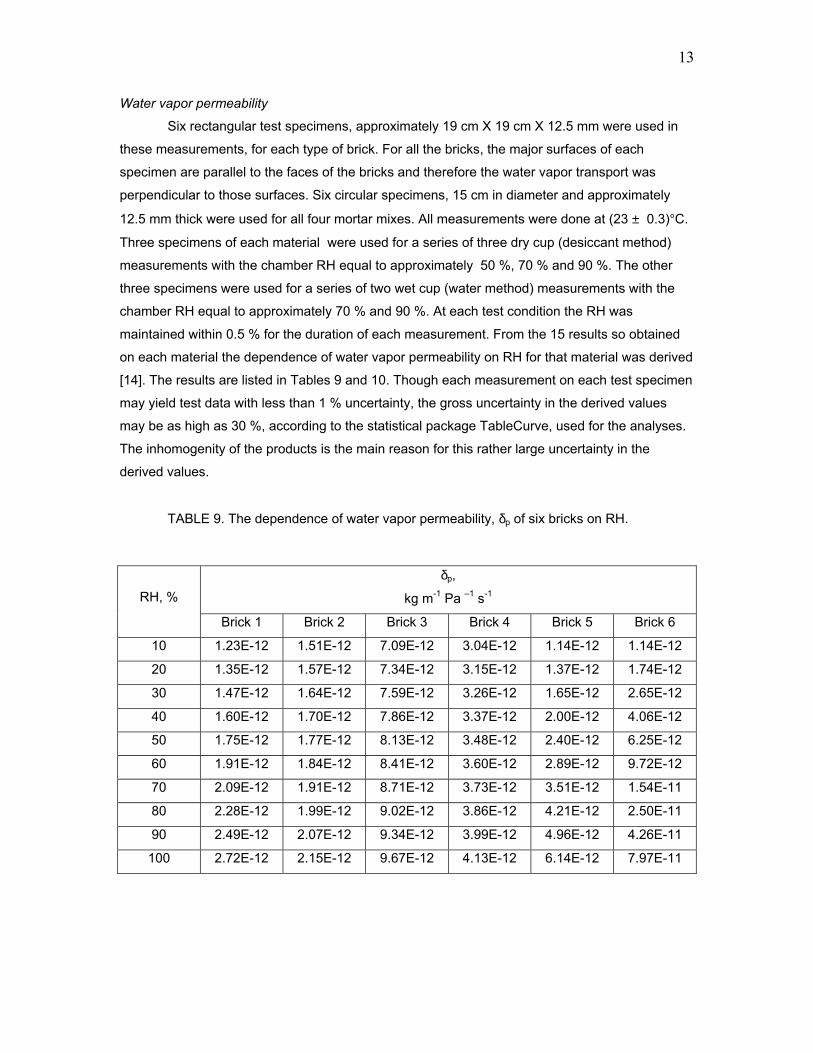
Water vapor permeability
Six rectangular test specimens, approximately 19 cm X 19 cm X 12.5 mm were used in
these measurements, for each type of brick. For all the bricks, the major surfaces of each
specimen are parallel to the faces of the bricks and therefore the water vapor transport was
perpendicular to those surfaces. Six circular specimens, 15 cm in diameter and approximately
12.5 mm thick were used for all four mortar mixes. All measurements were done at (23 ± 0.3)°C.
Three specimens of each material were used for a series of three dry cup (desiccant method)
measurements with the chamber RH equal to approximately 50 %, 70 % and 90 %. The other
three specimens were used for a series of two wet cup (water method) measurements with the
chamber RH equal to approximately 70 % and 90 %. At each test condition the RH was
maintained within 0.5 % for the duration of each measurement. From the 15 results so obtained
on each material the dependence of water vapor permeability on RH for that material was derived
[14]. The results are listed in Tables 9 and 10. Though each measurement on each test specimen
may yield test data with less than 1 % uncertainty, the gross uncertainty in the derived values
may be as high as 30 %, according to the statistical package TableCurve, used for the analyses.
The inhomogenity of the products is the main reason for this rather large uncertainty in the
derived values.
TABLE 9. The dependence of water vapor permeability, δp of six bricks on RH.
δp,
kg m-1 Pa –1 s-1
RH, %
Brick 1 Brick 2 Brick 3 Brick 4 Brick 5 Brick 6
10 1.23E-12 1.51E-12 7.09E-12 3.04E-12 1.14E-12 1.14E-12
20 1.35E-12 1.57E-12 7.34E-12 3.15E-12 1.37E-12 1.74E-12
30 1.47E-12 1.64E-12 7.59E-12 3.26E-12 1.65E-12 2.65E-12
40 1.60E-12 1.70E-12 7.86E-12 3.37E-12 2.00E-12 4.06E-12
50 1.75E-12 1.77E-12 8.13E-12 3.48E-12 2.40E-12 6.25E-12
60 1.91E-12 1.84E-12 8.41E-12 3.60E-12 2.89E-12 9.72E-12
70 2.09E-12 1.91E-12 8.71E-12 3.73E-12 3.51E-12 1.54E-11
80 2.28E-12 1.99E-12 9.02E-12 3.86E-12 4.21E-12 2.50E-11
90 2.49E-12 2.07E-12 9.34E-12 3.99E-12 4.96E-12 4.26E-11
100 2.72E-12 2.15E-12 9.67E-12 4.13E-12 6.14E-12 7.97E-11
14
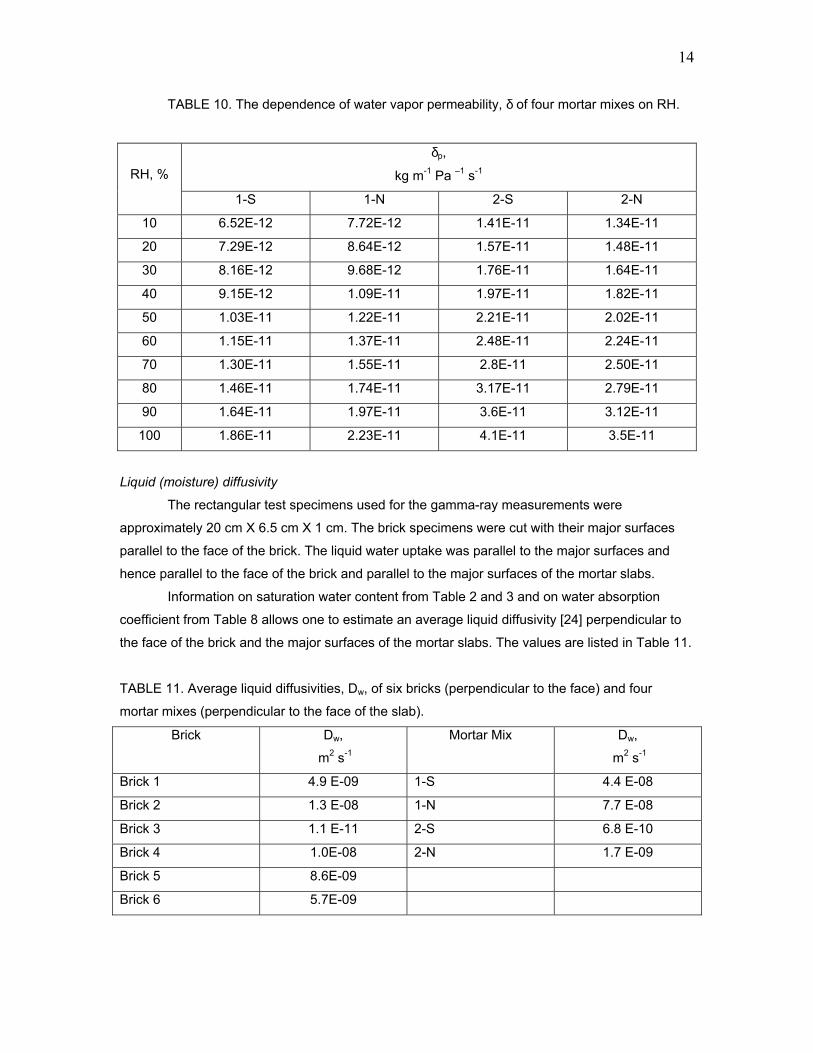
TABLE 10. The dependence of water vapor permeability, δ of four mortar mixes on RH.
δp,
kg m-1 Pa –1 s-1
RH, %
1-S 1-N 2-S 2-N
10 6.52E-12 7.72E-12 1.41E-11 1.34E-11
20 7.29E-12 8.64E-12 1.57E-11 1.48E-11
30 8.16E-12 9.68E-12 1.76E-11 1.64E-11
40 9.15E-12 1.09E-11 1.97E-11 1.82E-11
50 1.03E-11 1.22E-11 2.21E-11 2.02E-11
60 1.15E-11 1.37E-11 2.48E-11 2.24E-11
70 1.30E-11 1.55E-11 2.8E-11 2.50E-11
80 1.46E-11 1.74E-11 3.17E-11 2.79E-11
90 1.64E-11 1.97E-11 3.6E-11 3.12E-11
100 1.86E-11 2.23E-11 4.1E-11 3.5E-11
Liquid (moisture) diffusivity
The rectangular test specimens used for the gamma-ray measurements were
approximately 20 cm X 6.5 cm X 1 cm. The brick specimens were cut with their major surfaces
parallel to the face of the brick. The liquid water uptake was parallel to the major surfaces and
hence parallel to the face of the brick and parallel to the major surfaces of the mortar slabs.
Information on saturation water content from Table 2 and 3 and on water absorption
coefficient from Table 8 allows one to estimate an average liquid diffusivity [24] perpendicular to
the face of the brick and the major surfaces of the mortar slabs. The values are listed in Table 11.
TABLE 11. Average liquid diffusivities, Dw, of six bricks (perpendicular to the face) and four
mortar mixes (perpendicular to the face of the slab).
Brick Dw,
m2 s-1
Mortar Mix Dw,
m2 s-1
Brick 1 4.9 E-09 1-S 4.4 E-08
Brick 2 1.3 E-08 1-N 7.7 E-08
Brick 3 1.1 E-11 2-S 6.8 E-10
Brick 4 1.0E-08 2-N 1.7 E-09
Brick 5 8.6E-09
Brick 6 5.7E-09
15
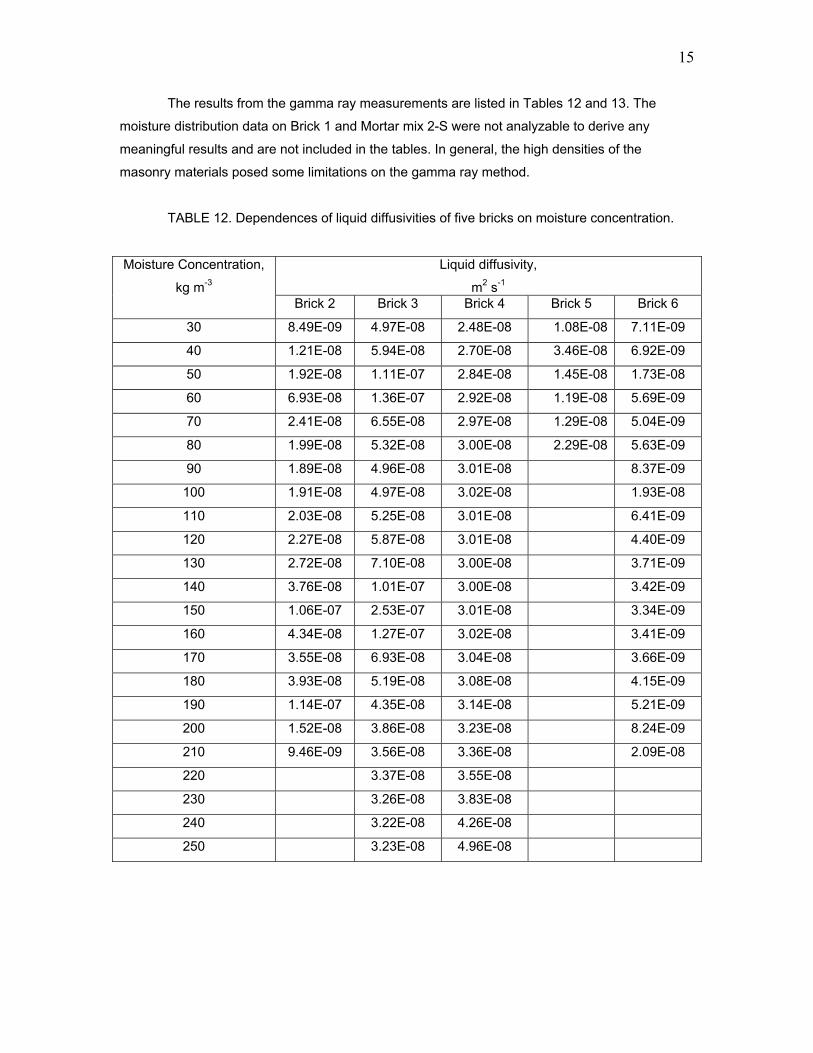
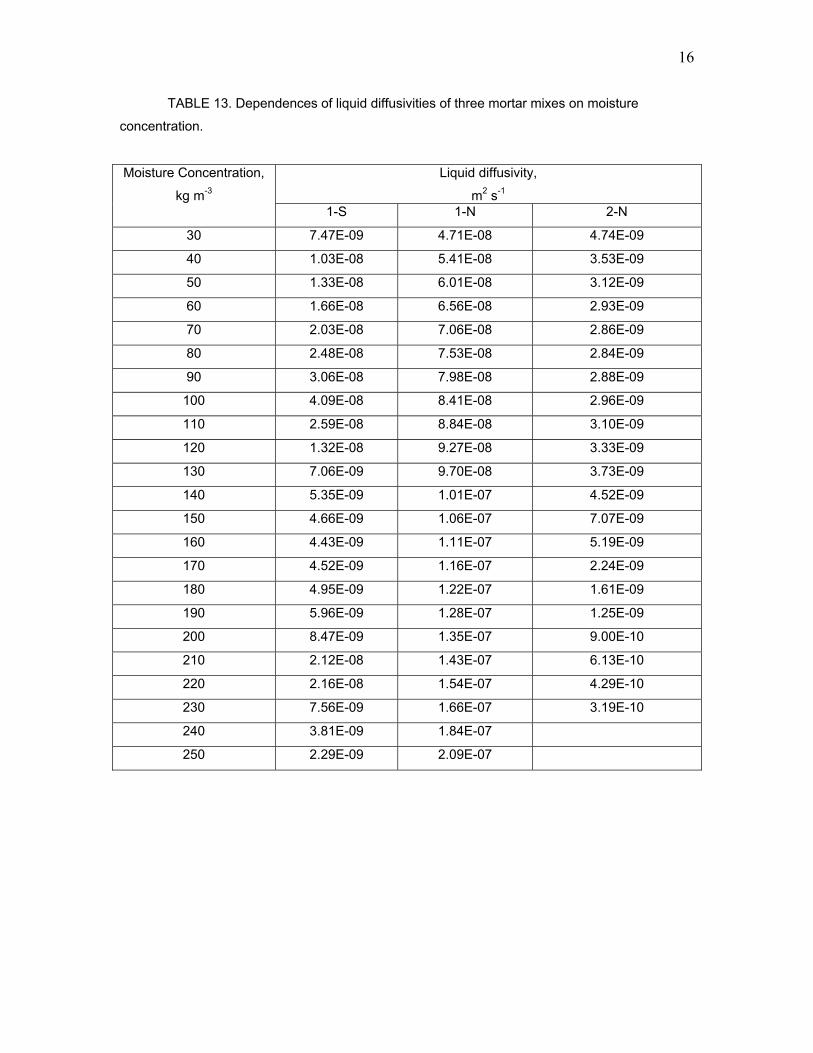
The results from the gamma ray measurements are listed in Tables 12 and 13. The
moisture distribution data on Brick 1 and Mortar mix 2-S were not analyzable to derive any
meaningful results and are not included in the tables. In general, the high densities of the
masonry materials posed some limitations on the gamma ray method.
TABLE 12. Dependences of liquid diffusivities of five bricks on moisture concentration.
Liquid diffusivity,
m2 s-1
Moisture Concentration,
kg m-3 Brick 2 Brick 3 Brick 4 Brick 5 Brick 6
30 8.49E-09 4.97E-08 2.48E-08 1.08E-08 7.11E-09
40 1.21E-08 5.94E-08 2.70E-08 3.46E-08 6.92E-09
50 1.92E-08 1.11E-07 2.84E-08 1.45E-08 1.73E-08
60 6.93E-08 1.36E-07 2.92E-08 1.19E-08 5.69E-09
70 2.41E-08 6.55E-08 2.97E-08 1.29E-08 5.04E-09
80 1.99E-08 5.32E-08 3.00E-08 2.29E-08 5.63E-09
90 1.89E-08 4.96E-08 3.01E-08 8.37E-09
100 1.91E-08 4.97E-08 3.02E-08 1.93E-08
110 2.03E-08 5.25E-08 3.01E-08 6.41E-09
120 2.27E-08 5.87E-08 3.01E-08 4.40E-09
130 2.72E-08 7.10E-08 3.00E-08 3.71E-09
140 3.76E-08 1.01E-07 3.00E-08 3.42E-09
150 1.06E-07 2.53E-07 3.01E-08 3.34E-09
160 4.34E-08 1.27E-07 3.02E-08 3.41E-09
170 3.55E-08 6.93E-08 3.04E-08 3.66E-09
180 3.93E-08 5.19E-08 3.08E-08 4.15E-09
190 1.14E-07 4.35E-08 3.14E-08 5.21E-09
200 1.52E-08 3.86E-08 3.23E-08 8.24E-09
210 9.46E-09 3.56E-08 3.36E-08 2.09E-08
220 3.37E-08 3.55E-08
230 3.26E-08 3.83E-08
240 3.22E-08 4.26E-08
250 3.23E-08 4.96E-08
16
TABLE 13. Dependences of liquid diffusivities of three mortar mixes on moisture
concentration.
Liquid diffusivity,
m2 s-1
Moisture Concentration,
kg m-3 1-S 1-N 2-N
30 7.47E-09 4.71E-08 4.74E-09
40 1.03E-08 5.41E-08 3.53E-09
50 1.33E-08 6.01E-08 3.12E-09
60 1.66E-08 6.56E-08 2.93E-09
70 2.03E-08 7.06E-08 2.86E-09
80 2.48E-08 7.53E-08 2.84E-09
90 3.06E-08 7.98E-08 2.88E-09
100 4.09E-08 8.41E-08 2.96E-09
110 2.59E-08 8.84E-08 3.10E-09
120 1.32E-08 9.27E-08 3.33E-09
130 7.06E-09 9.70E-08 3.73E-09
140 5.35E-09 1.01E-07 4.52E-09
150 4.66E-09 1.06E-07 7.07E-09
160 4.43E-09 1.11E-07 5.19E-09
170 4.52E-09 1.16E-07 2.24E-09
180 4.95E-09 1.22E-07 1.61E-09
190 5.96E-09 1.28E-07 1.25E-09
200 8.47E-09 1.35E-07 9.00E-10
210 2.12E-08 1.43E-07 6.13E-10
220 2.16E-08 1.54E-07 4.29E-10
230 7.56E-09 1.66E-07 3.19E-10
240 3.81E-09 1.84E-07
250 2.29E-09 2.09E-07
17
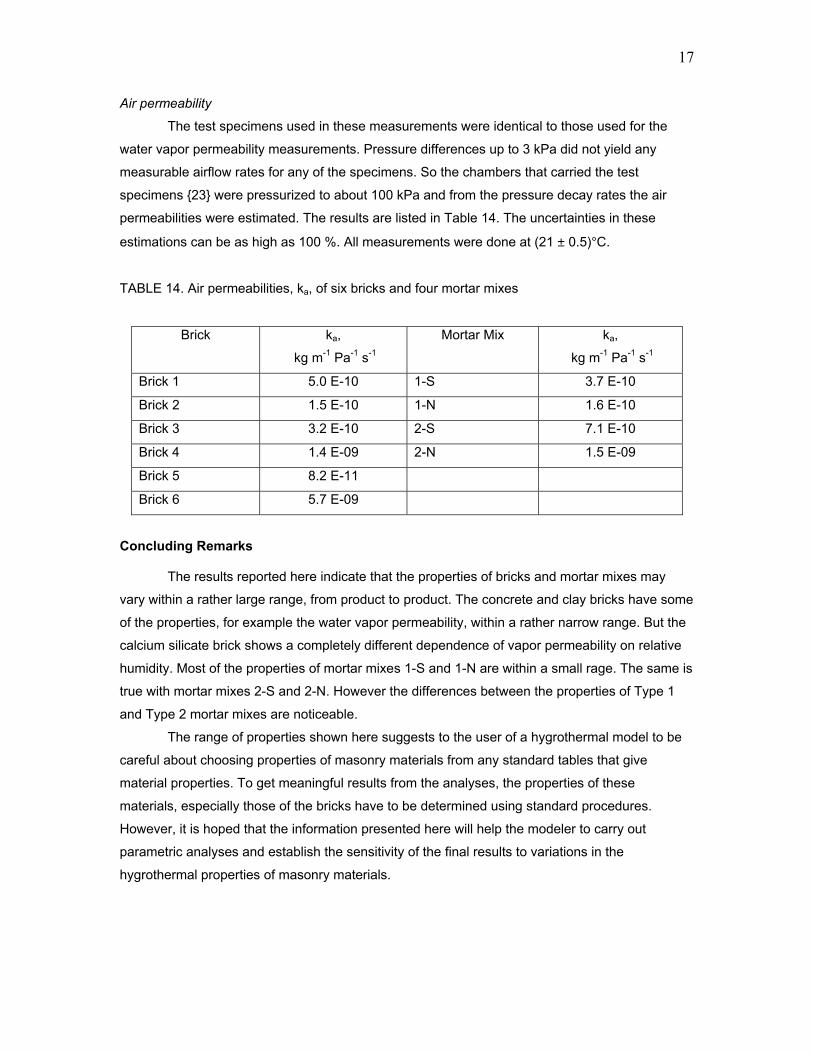
Air permeability
The test specimens used in these measurements were identical to those used for the
water vapor permeability measurements. Pressure differences up to 3 kPa did not yield any
measurable airflow rates for any of the specimens. So the chambers that carried the test
specimens {23} were pressurized to about 100 kPa and from the pressure decay rates the air
permeabilities were estimated. The results are listed in Table 14. The uncertainties in these
estimations can be as high as 100 %. All measurements were done at (21 ± 0.5)°C.
TABLE 14. Air permeabilities, ka, of six bricks and four mortar mixes
Brick ka,
kg m-1 Pa-1 s-1
Mortar Mix ka,
kg m-1 Pa-1 s-1
Brick 1 5.0 E-10 1-S 3.7 E-10
Brick 2 1.5 E-10 1-N 1.6 E-10
Brick 3 3.2 E-10 2-S 7.1 E-10
Brick 4 1.4 E-09 2-N 1.5 E-09
Brick 5 8.2 E-11
Brick 6 5.7 E-09
Concluding Remarks
The results reported here indicate that the properties of bricks and mortar mixes may
vary within a rather large range, from product to product. The concrete and clay bricks have some
of the properties, for example the water vapor permeability, within a rather narrow range. But the
calcium silicate brick shows a completely different dependence of vapor permeability on relative
humidity. Most of the properties of mortar mixes 1-S and 1-N are within a small rage. The same is
true with mortar mixes 2-S and 2-N. However the differences between the properties of Type 1
and Type 2 mortar mixes are noticeable.
The range of properties shown here suggests to the user of a hygrothermal model to be
careful about choosing properties of masonry materials from any standard tables that give
material properties. To get meaningful results from the analyses, the properties of these
materials, especially those of the bricks have to be determined using standard procedures.
However, it is hoped that the information presented here will help the modeler to carry out
parametric analyses and establish the sensitivity of the final results to variations in the
hygrothermal properties of masonry materials.
18
Acknowledgements
The results reported here are from a consortium project called MEWS (Moisture Management for Exterior Wall Systems) that has been recently concluded at the Institute for Research in Construction. The following partners supported the consortium and worked with the researchers from the Institute: Louisiana Pacific Corporation, Fortifiber Corporation, EI DuPont de Nemours & Co, Fibreboard Manufacturers Association of Canada, Canadian Plastics Industry Association, Forintek Canada Corporation, Marriott International Inc., EIFS Industry Members Association, Canadian Wood Council, Masonry Canada and Canada Mortgage and Housing Corporation.
The guidance from Mr. Patrick Kelly, Masonry Canada to identify the types of bricks used in this investigation is gratefully acknowledged.
19
References
1. Hens, H. 1996., “Heat, Air and Moisture Transfer in Insulated Envelope Parts. Final Report, Volume 1, Task 1: Modelling, “ International Energy Agency Annex 24, Laboratorium Bouwfysica, K. U. -Leuven, Belgium, 1996.
2. Trechsel, H. R. (ed), ”Moisture Analysis and Condensation Control in building envelopes, “ ASTM MNL 40, Appendices A to K, 2001, pp.161-184.
3. Kumaran, M. K., “Heat, Air and Moisture Transfer in Insulated Envelope Parts. Final Report, Volume 3, Task 3: Material Properties,” International Energy Agency Annex 24, Laboratorium Bouwfysica, K. U. -Leuven, Belgium. 1996.
4. Kumaran, M. K., Lackey, J. C., Normandin, N., van Reenen, D & Tariku, F. 2002b. A thermal and moisture transport property database for common building and insulating materials. ASHRAE website, Research Project Report 1018-RP, 2002, p. 229.
5. Kumaran, M. K., Lackey, J. C., Normandin, N., van Reenen, D and Tariku, F., “Summary report from Task 3 of MEWS project,” Institute for Research in Construction, NRC Canada (NRCC-45369), p. 68.
6. Roels, S., Carmilet, J. and Hens, H., “HAMSTAD- WP1: Round Robin Experimental Work, 4th Upgrade Version,” 2002, pp. 46
7. ASTM C 177-98, Standard test method for steady-state thermal transmission properties by means of heat flow meter apparatus, 2001.
8. ASTM C 518-98, Standard test method for steady-state thermal transmission properties by means of heat flow meter apparatus, 2001.
9. ASTM C 1498-01, Standard test method for hygroscopic sorption isotherms of building materials. 2001.
10. Hansen, M. H., “Retention Curves Measured Using Pressure Plate and Pressure Membrane,” Nordtest Technical Report 367, Danish Building Research Institute, 1998, p. 63.
11. ASTM E 96-00, Standard test method for water vapor transmission of materials, 2001.
12. Hansen, K. K. and Lund, H. B., “Cup Method for Determination of Water Vapor Transmission Properties of Building Materials. Sources of Uncertainty in the Method,” Proceedings of the 2nd Symposium , Building Physics in the Nordic Countries, Trondheim, 1990, pp. 291-298.
13. Lackey, J. C., Marchand, R. G., and Kumaran, M. K., “A Logical Extension of the ASTM Standard E96 to Determine the Dependence of Water Vapor Transmission on Relative Humidity,” Insulation Materials: Testing And Applications: Third Volume, ASTM STP 1320, R. S. Graves and R. R. Zarr, Eds, American Society for Testing and Materials, West Conshohocken, PA, 1997, pp. 456-470.
14. Kumaran, M. K., “An Alternative Procedure for the Analysis of Data from the Cup Method Measurements for Determination of Water Vapor Transmission Properties”, Journal of Testing and Evaluation, JTVEA, Vol. 26 , 1998, pp. 575-581.
15. Hedenblad, G., “Moisture Permeability of Some Porous Building Materials,” Proceedings of the 4th Symposium, Building Physics in the Nordic Countries, Espoo, Vol. 2, 1996, pp. 747-754.
16. Kumaran, M.K. and Bomberg, M.T., ” A Gamma-spectrometer for determination of density distribution and moisture distribution in building materials,” Moisture and
20
Humidity: Measurement and Control in Science and Industry : Proceedings of International Symposium (Washington, D.C., USA), 1985, pp. 485-90.
17. Bruce, R. R. and Klute, A., “The Measurement of Soil Diffusivity,” Soil Science Society of America Proceedings. Vol. 20, 1956, pp. 251-257.
18. Kumaran, M.K., Mitalas, G.P., Kohonen, R. and Ojanen, T., “Moisture transport coefficient of pine from gamma ray absorption measurements,” Collected Papers in Heat Transfer, 1989 : Winter Annual Meeting of the ASME (San Francisco, CA, USA, 1989) , (ASME Heat Transfer Division vol. 123)., 1989, pp. 179-183
19. Marchand, R.G. and Kumaran, M. K., “Moisture diffusivity of cellulose insulation, Journal of Thermal Insulation and Building Envelopes, Vol. 17, 1994, pp. 362-377.
20. Descamps, F., "Continuum and Discrete Modelling of Isothermal Water and Air Transfer in Porous Media," Ph. D. Thesis, Katholieke Uniersity, Belgium, 1997, pp. 57-107.
21. Pel, L., "Moisture Transport in Porous Building Materials," Ph. D. Thesis, Eindhoven University of Technology, the Netherlands, pp. 47-80, 1995.
22. ASTM C 522 - 87, Standard test method for Airflow Resistance of Acoustic Materials, 1995.
23. Bomberg, M. T. and Kumaran, M.K., “A Test method to determine air flow resistance of exterior membranes and sheathings,” Journal of Thermal Insulation, Vol. 9, 1986, pp. 224-235.
24. Kumaran, M. K., “Moisture Diffusivity of Building Materials from Water Absorption Measurements,” Journal of Thermal Envelope and Building Science, Vol. 22, 1999, pp. 349-355.


![Heat and Moisture Transfer in Wood-Based_[Report]_1995](https://img.pdfslide.us/doc/110x75/577d23a31a28ab4e1e9a5b66/heat-and-moisture-transfer-in-wood-basedreport1995.jpg)