Embed Size (px)
Citation preview
Heartbeat rate measurement using microwave systems: single-antenna, two-
antennas, and modeling a moving person
Sarah El-Samad1,2
, Dany Obeid1, Gheorghe Zaharia
2, Sawsan Sadek
1, Ghais El Zein
2
Abstract: This paper presents a microwave system for
heartbeat rate measurement. This system is based on using a
vector network analyzer and horn antennas. The system
generates a continuous wave signal toward a person’s chest
then the reflected signal is analyzed. The phase difference
between the emitted and the reflected signals contains
information about the chest movement; hence, the heartbeat
rate can be extracted. In this work, several scenarios for
detecting the heart activity are considered. The first scenario
aims to provide a comparative study for using single-antenna
and two-antennas microwave systems. Several radiated
powers are considered in this scenario. Simultaneously with
the microwave system, a wireless electrocardiograph is used
as reference in order to determine the accuracy of the system.
Measurements are performed in both cases when breathing
normally and when holding the breath. The second scenario
aims to test the ability of detecting the heartbeat activity of a
person while moving. Measurements are performed while the
subject walks towards the radar. Modeling is used for this
purpose. The operating frequency used is 20 GHz in both
scenarios. Signals are processed using wavelet transform and
results show the ability to extract the heartbeat rate even with
the presence of body movement.
Sarah Samad
Dany Obeid
Gheorghe Zaharia
Sawsan Sadek
Ghais El Zein
1. Doctoral School of Science and Technology, Lebanese University,
Lebanon 2. Univ Rennes, INSA Rennes, CNRS, IETR (Institut d’Electronique
et de Telecommunications de Rennes) UMR 6164, F 35000
Rennes, France
Keywords: single-antenna microwave system; two-antennas
microwave system; moving person; electrocardiograph;
heartbeat rate; signal processing; wavelet decomposition
1 Introduction
Nowadays, contactless monitoring of vital signs is needed
in medical surveillance applications and in healthcare,
especially for infants at risk, sudden infant syndrome or burn
victims where the use of the traditional electrodes to
measure cardiopulmonary signals is not possible. Due to the
microwave sensitivity toward tiny movements, radar has been
employed as a noninvasive monitoring system of human
cardiopulmonary activity [1]. Several radar technologies are
presented in the literature for the vital signs extraction: the
ultra-wideband (UWB) radars, the frequency modulated
continuous wave (FMCW) radars, and the continuous wave
(CW) Doppler radars. Each of these types has its own
advantages and disadvantages. The advantage of the UWB
radar is its ability to detect the patient – system distance and
the breathing rate for one or more persons [2]. On the other
side, UWB is not feasible in terms of system integration and
low-power operation, especially for short range applications
[3]. In contrast, CW and FMCW systems allow higher level of
system integration and lower power operation. Note that the
CW radar is not able to extract range resolution like UWB and
FMCW radars [4]. Although FMCW radar allows measuring
the distance of the target [5], the CW radar is superior to
FMCW due to its higher measurement accuracy, less complex
hardware architecture, and simpler signal processing
techniques [6]. Therefore, for applications that only require
displacement information regardless of the target range, CW
radar is a better option for non-contact vital sign detection [7].
Therefore, the CW it is utilized in this work. According to
Doppler effect, a constant frequency signal reflected off an
object having a varying displacement has a time-varying phase
[1] which contains the heartbeat and respiration information.
Note that the average peak-to-peak chest motion caused by the
respiration is between 4 and 12 mm, and caused by the
heartbeat alone is between 0.2 and 0.5 mm [8]. At rest, the
respiration frequency of an adult varies between 0.2 and 0.34
Hz which means a respiration rate between 12 and 20 Breathes
per minute (Bpm) [9]. Moreover, the heartbeat frequency of an
adult changes within 1 and 2 Hz, which means a heartbeat rate
between 60 and 120 beats per minute (bpm) [8].
In this work, two scenarios are considered: First, in order
to test the accuracy of the single-antenna system compared to
the two-antenna system, a comparative study is realized for a
person while holding the breath. In fact, using a single antenna
will reduce the number of components of the final
measurement system; hence it will reduce the cost. After that,
the person breathes normally and the heartbeat rate is
extracted using single-antenna microwave system. The
accuracy of the obtained results demonstrates the possibility of
extracting the heartbeat signal using a single-antenna
microwave system for a person while breathing normally.
The second scenario is considered by testing the ability of
detecting heartbeat rate of a moving patient inside a room. The
person is walking toward the radar. This scenario is based on
modeling and wavelet-based techniques are applied for
heartbeat rate extraction in both cases.
The rest of this paper is organized as follows: Section 2
presents the measurement setup of the two systems and the
obtained results for a person holding the breath. Section 3
presents results of a single antenna VNA system for a person
breathing normally. Section 4 presents the modeling of the
received signal for a moving forward person and the
processing technique and the obtained results. Section 5
concludes the work.
2 Comparison between Heartbeat Rates extracted
from single and two-antenna microwave systems for a non-
breathing person
Previous works [10] used the two-antenna microwave
system to demonstrate the possibility of detecting the
heartbeat activity. The first and the second antennas were used
for the emission and the reception respectively. This system
was used to measure the time-varying phase of the S21
parameter for different operating frequencies and different
radiated powers. In addition, a study using a 16 GHz single-
antenna VNA system was realized to measure the S11 phase
variation for a person while holding the breath [11]. In this
case, the same antenna is used for both emission and
reception. In this section, a comparison between Heartbeat
Rates extracted from single and two-antenna microwave
systems for a non-breathing person is done to test the accuracy
of the heartbeat rate of the single-antenna system relatively to
the two-antenna system.
2.1 Measurement setup
The two systems are based on a VNA and one or two horn
antennas. These components make the installation fast and
simple. The used VNA is HP N5230A 4 ports PNA-L. The
VNA is one of the main basic systems used for microwave
measurements and RF applications. In addition, the VNA
allows tuning both frequency and power. It allows the control
of different parameters like sweep time and the number of
sampling points. Furthermore, it measures the phase and
amplitude of S parameters. In particular, a VNA measures the
time variation of the phase of the parameters S21 or S11 which
are used in this study. In the case of two-antenna systems, S21
phase variation is measured. When using a single-antenna
microwave system, S11 phase variation is measured. The
antennas used are LB-42-25-C2-SF with operating frequencies
between 18 and 26.5 GHz. The operating frequency is chosen
to be fo = 20 GHz due to two reasons: the first reason is to
obtain higher phase variation as it is directly proportional to
the frequency. The second reason is due to the equipment’s
limitation (2 – 20 GHz of the VNA). Note that the antenna
gain depends on the frequency. Table 1 shows the antenna
gain for different operating frequencies [10].
Table 1 Antenna gain
Frequency
(GHz)
Gain
(dBi)
18 23.6
19 23.9
20 24
21 24.5
22 24.9
23 24.8
24 24.9
25 25.4
26 25.4
According to this table, the antenna gain at 20 GHz is 24
dB. The IF bandwidth is chosen to be 500 Hz resulting from a
compromise between the signal noise reduction and the sweep
time. As the sweep time was 23 secs, the number of samples
was set at 12801 by the VNA; hence the sampling frequency is
557 Hz. The 23 seconds is selected to avoid too long stopping
breathing when the person is the breath. The measurements
were performed for a healthy 54-years old person. The
distance between the antennas and the person is 1 meter.
Considering the antenna gain (24 dB), the cables losses (2 dB)
and the emitted power at the VNA output (-24, -29, -34 and
-39 dBm), the radiated power Pr is -2, -7, -12 and -17 dBm,
respectively. Measurements with several values of the emitted
power allow determining the minimum power required to
accurately extract the heartbeat rate while limiting the risks of
exposure to the electromagnetic waves for the patient and the
medical staff. The highest radiated power (- 2 dBm), this
corresponds to a surface reception power density of about 5
nW /cm2, which is very low compared to the FCC exposure
level limit (580 W /cm2). In addition, the FCC allows a
Specific Absorption Rate (SAR) limit of 1.6 W/kg, as
averaged over one gram of tissue, hence the measurements
performed are considered as safe. Note that an ECG is used simultaneously with the system
as a reference system. Table 2 presents the measurement setup
characteristics for this experiment and Fig. 1 presents the
measurement system with single antenna vs.
electrocardiograph.
Table 2 Measurement setup
System specifications
Operating frequency fo (GHz) 20
Radiated power Pr (dBm) -2, -7, -12, -17
Number of points 12801
Time window (sec) 23
Sampling frequency (Hz) 557
Antennas number 1 or 2
Subject Information
Gender/ Age (y) M/54
Position/ Side Setting/ Front
Distance (m) 1
Breathing No
Position Setting/ Front
Fig. 1 Measurement system with single antenna vs.
electrocardiograph
2.2 Signal processing and obtained results
In this section, measurements were performed for a
person holding the breath for both single-antenna and two-
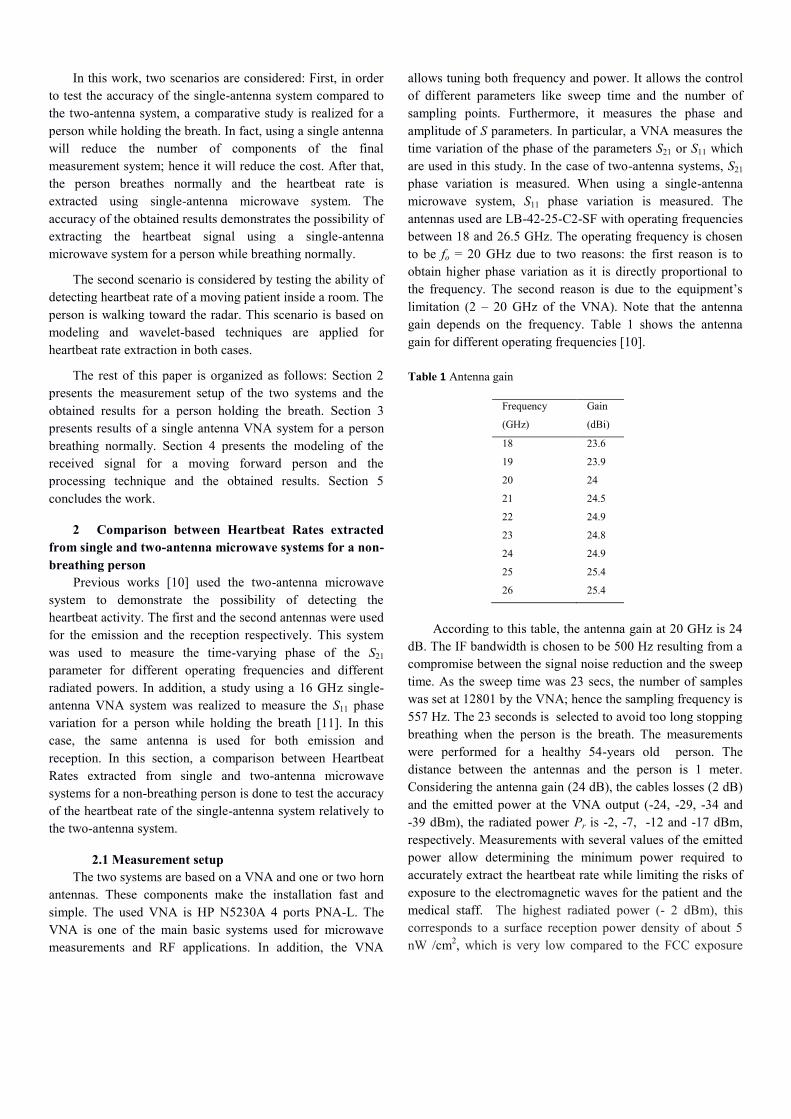
antennas microwave systems. Figs. 2 and 3 present the phase
variation (PV) of S11 and S21 respectively, at radiated powers: -
2, -7, -12 and -17 dBm.
Fig. 2 Phase variation of S11 for a person holding his breath for
different radiated powers using the single-antenna microwave system.
Fig. 3 Phase variation of S21 for a person holding his breath for
different radiated powers using the two-antenna microwave system.
It is observed that the phase variation of S21 is clearer and
larger than the phase variation of S11; hence, the heartbeat
signals are clearer in the case of S21 phase variation. In both
cases, the SNR decreases with the decrease of the radiated
power; thus, a smoothing method is required in order to reduce
0 2 4 6 8 10 12 14 16 18 20-1
0
1
Pr = -2 dBm
Time (s)
S11 P
V (
degre
e)
0 2 4 6 8 10 12 14 16 18 20-1
0
1
Pr = -7 dBm
Time (s)
S11 P
V (
degre
e)
0 2 4 6 8 10 12 14 16 18 20-1
0
1
Pr = -12 dBm
Time (s)
S11 P
V (
degre
e)
0 2 4 6 8 10 12 14 16 18 20-1
0
1
Pr= -17 dBm
Time (s)
S11 P
V (
degre
e)
0 2 4 6 8 10 12 14 16 18 20-50
0
50
Pr = -2 dBm
Time (s)
S21 P
V (
degre
e)
0 2 4 6 8 10 12 14 16 18 20-50
0
50
Pr = -7 dBm
Time (s)
S21 P
V (
degre
e)
0 2 4 6 8 10 12 14 16 18 20-50
0
50
Pr = -12 dBm
Time (s)
S21 P
V (
degre
e)
0 2 4 6 8 10 12 14 16 18 20-100
0
100
Pr= -17 dBm
Time (s)
S21 P
V (
degre
e)
noise and extract the heartbeat signal, especially for lower
radiated powers. This method is based on a sliding window. It
replaces a given point by the average of its surrounding points.
I.e. consider a signal X with N samples, X = [X(0),…, X(N-1)],
the sample XS(i) of the smoothed signal is computed with the
following relation:
𝑋𝑆(𝑖) = 1
𝑛∑ 𝑋(𝑘)𝑖+𝑚
𝑘=𝑖−𝑚 (1)
where n = 2m+1 is the length of the smoothing window. Note
that i should be between m and N-m-1. Otherwise, the length
of the smoothing window is decreased. When n increases, the
variation of the heartbeat signal may reduce. On the other
hand, when n decreases, the heartbeat signal could not be
detected correctly due to the presence of noise; hence, a
compromise should be done in order to reduce the noise
without losing the significant peaks of the recorded phase.
n = 199 was chosen after several trials. After noise reducing
using smoothing technique, peak detection is applied, and then
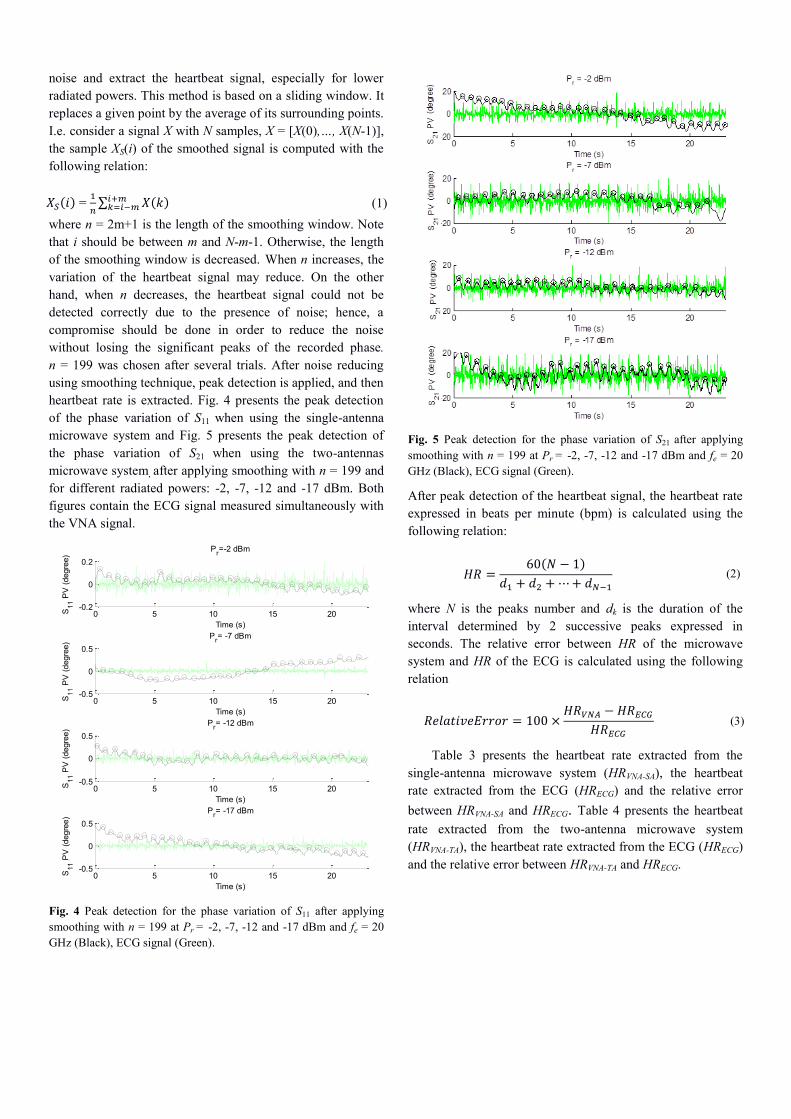
heartbeat rate is extracted. Fig. 4 presents the peak detection
of the phase variation of S11 when using the single-antenna
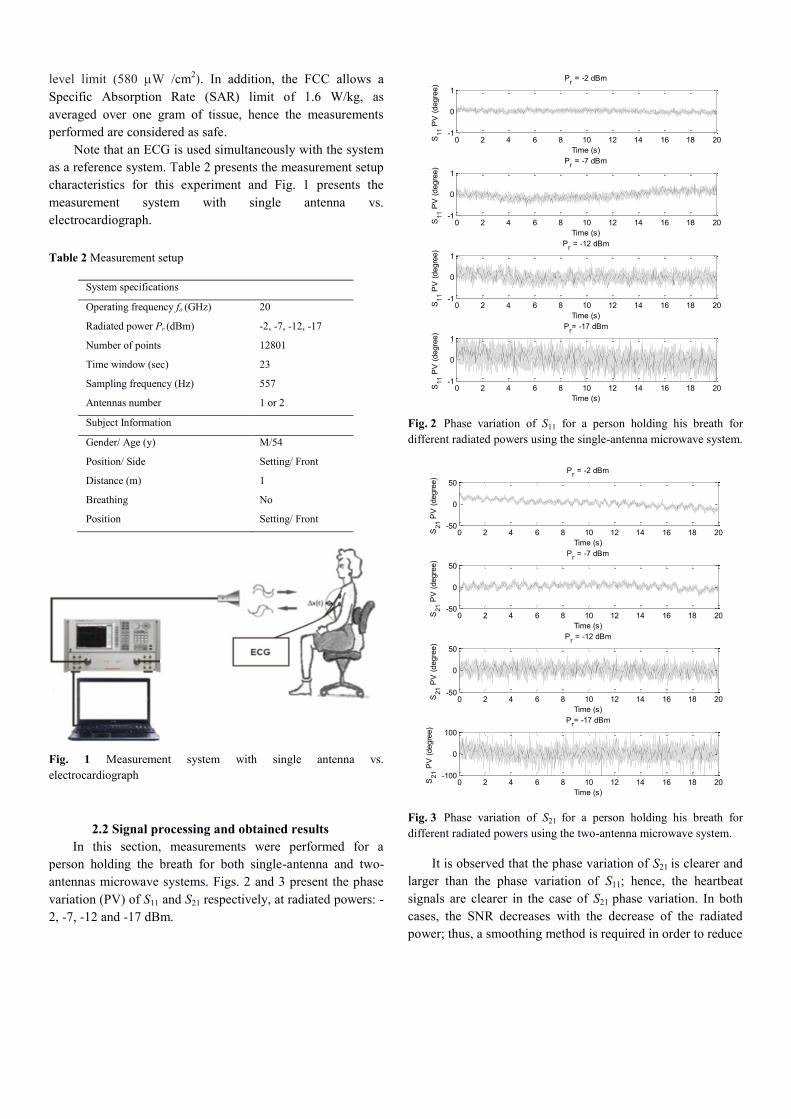
microwave system and Fig. 5 presents the peak detection of
the phase variation of S21 when using the two-antennas
microwave system, after applying smoothing with n = 199 and
for different radiated powers: -2, -7, -12 and -17 dBm. Both
figures contain the ECG signal measured simultaneously with
the VNA signal.
Fig. 4 Peak detection for the phase variation of S11 after applying
smoothing with n = 199 at Pr = -2, -7, -12 and -17 dBm and fe = 20
GHz (Black), ECG signal (Green).
Fig. 5 Peak detection for the phase variation of S21 after applying
smoothing with n = 199 at Pr = -2, -7, -12 and -17 dBm and fe = 20
GHz (Black), ECG signal (Green).
After peak detection of the heartbeat signal, the heartbeat rate
expressed in beats per minute (bpm) is calculated using the
following relation:
𝐻𝑅 =60(𝑁 − 1)
𝑑1 + 𝑑2 + ⋯ + 𝑑𝑁−1
(2)
where N is the peaks number and dk is the duration of the
interval determined by 2 successive peaks expressed in
seconds. The relative error between HR of the microwave
system and HR of the ECG is calculated using the following
relation
𝑅𝑒𝑙𝑎𝑡𝑖𝑣𝑒𝐸𝑟𝑟𝑜𝑟 = 100 ×𝐻𝑅𝑉𝑁𝐴 − 𝐻𝑅𝐸𝐶𝐺
𝐻𝑅𝐸𝐶𝐺
(3)
Table 3 presents the heartbeat rate extracted from the
single-antenna microwave system (HRVNA-SA), the heartbeat
rate extracted from the ECG (HRECG) and the relative error
between HRVNA-SA and HRECG. Table 4 presents the heartbeat
rate extracted from the two-antenna microwave system
(HRVNA-TA), the heartbeat rate extracted from the ECG (HRECG)
and the relative error between HRVNA-TA and HRECG.
0 5 10 15 20-0.2
0
0.2
Pr=-2 dBm
Time (s)
S11 P
V (
degre
e)
0 5 10 15 20-0.5
0
0.5
Pr= -7 dBm
Time (s)
S11 P
V (
degre
e)
0 5 10 15 20-0.5
0
0.5
Pr= -12 dBm
Time (s)
S11 P
V (
degre
e)
0 5 10 15 20-0.5
0
0.5
Pr= -17 dBm
Time (s)
S11 P
V (
degre
e)
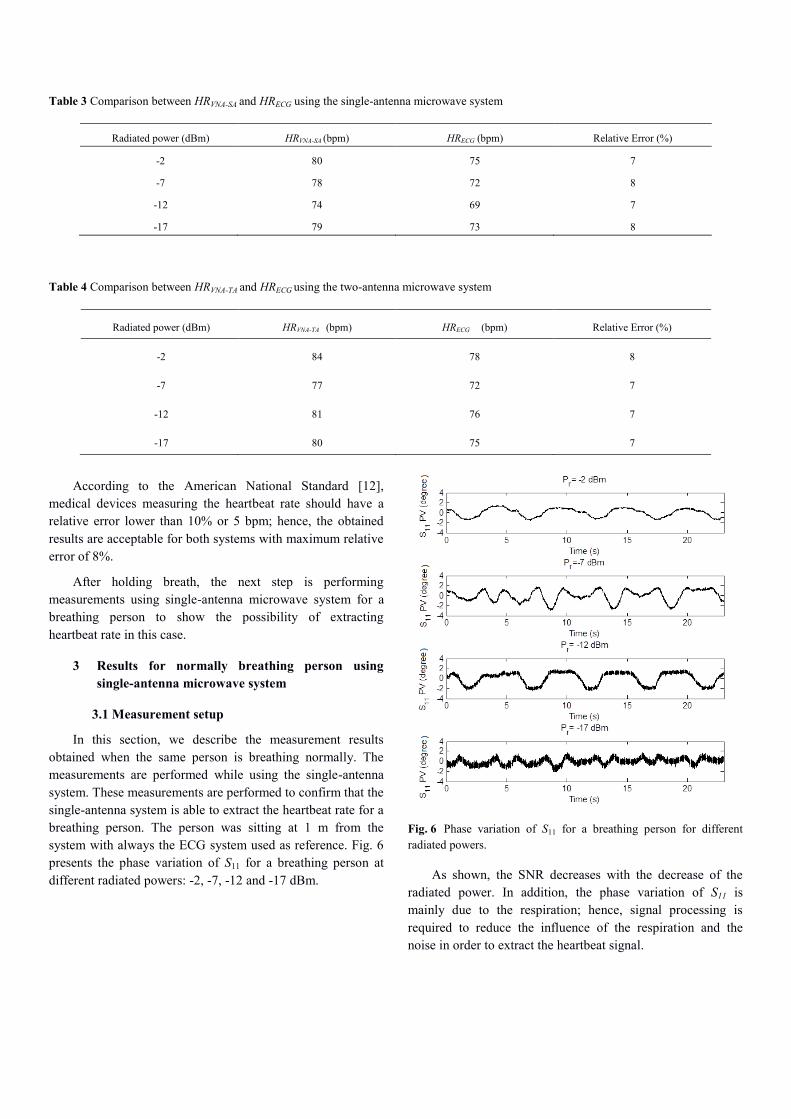
Table 3 Comparison between HRVNA-SA and HRECG using the single-antenna microwave system
Radiated power (dBm) HRVNA-SA (bpm) HRECG (bpm) Relative Error (%)
-2 80 75 7
-7 78 72 8
-12 74 69 7
-17 79 73 8
Table 4 Comparison between HRVNA-TA and HRECG using the two-antenna microwave system
Radiated power (dBm) HRVNA-TA (bpm) HRECG (bpm) Relative Error (%)
-2 84 78 8
-7 77 72 7
-12 81 76 7
-17 80 75 7
According to the American National Standard [12],
medical devices measuring the heartbeat rate should have a
relative error lower than 10% or 5 bpm; hence, the obtained
results are acceptable for both systems with maximum relative
error of 8%.
After holding breath, the next step is performing
measurements using single-antenna microwave system for a
breathing person to show the possibility of extracting
heartbeat rate in this case.
3 Results for normally breathing person using
single-antenna microwave system
3.1 Measurement setup
In this section, we describe the measurement results
obtained when the same person is breathing normally. The
measurements are performed while using the single-antenna
system. These measurements are performed to confirm that the
single-antenna system is able to extract the heartbeat rate for a
breathing person. The person was sitting at 1 m from the
system with always the ECG system used as reference. Fig. 6
presents the phase variation of S11 for a breathing person at
different radiated powers: -2, -7, -12 and -17 dBm.
Fig. 6 Phase variation of S11 for a breathing person for different
radiated powers.
As shown, the SNR decreases with the decrease of the
radiated power. In addition, the phase variation of S11 is
mainly due to the respiration; hence, signal processing is
required to reduce the influence of the respiration and the
noise in order to extract the heartbeat signal.
3.2 Signal processing using wavelet decomposition
As chest motion due to respiration is much bigger
compared to that due to the heartbeat, an advanced signal
processing technique is required in order to reduce the
respiratory signal and then extract the heartbeat signal. In [13]
it was shown that classical filters are able to extract
successfully the heartbeat signal, but due to the distortion of
the filtered signal during the transitive regime, the relative
error of heartbeat can be increased. In addition, Fast Fourier
transform (FFT) converts a signal from time domain to
frequency domain rapidly. Then, the frequency having the
maximum amplitude between 1 and 2 Hz is chosen. FFT gives
accurate results but an extra error may occur because real
frequency may not match the FFT frequency points, the power
spectrum is spreading at the adjacent frequencies. In addition,
the variation of the HR over the time could not be tracked. To
solve this problem, Short-Time Fourier Transform is proposed
(STFT). This technique is based on applying the Fourier
transform over portions of the signal, namely windows. This
allows analyzing the signal in both time and frequency
domains. Short time window results in high resolution in time
and poor resolution in frequency, while large window results
in poor resolution in time, but high resolution in frequency.
The problem of the STFT is solved by using the wavelet
transform [14]. The processing technique used in this study is
the wavelet decomposition. The wavelet technique consists of
splitting the signal into several signals; each of these signals
corresponds to a frequency band. There are two types of
wavelets: continuous wavelets transform (CWT) and discrete
wavelets transform (DWT). DWT is a fast and non-redundant
transform. The DWT is used in order to extract the heartbeat
signal from the cardiopulmonary signal. The DWT (𝑊𝑗,𝑘) of a
signal 𝑓(𝑡) is given by the scalar product of 𝑓(𝑡) with the
scaling function (i.e. the wavelet basis function) ∅(𝑡) which is
scaled and shifted:
𝑊𝑗,𝑘 = 𝑓(𝑡), ∅𝑗,𝑘(𝑡) ≥ ∫ 𝑓(𝑡)+∞
−∞
∅𝑗,𝑘(𝑡)𝑑𝑡 (4)
The basis function is given by:
∅𝑗,𝑘(𝑡) = 2−𝑗 2⁄ ∅(2−𝑗𝑡 − 𝑘𝑇𝑆) (5)
where j is the jth
decomposition level or step and k is the kth
wavelet coefficient at the jth
level [11]. The variables 𝑗 and 𝑘
are integers that scale and dilate ∅ to generate wavelets.
Several families exist in the wavelet decomposition like
Daubechies, Coiflets, Symlets, etc. The difference between
wavelet families makes compromise between how compactly
they are localized in time and how smooth they are. Within
each wavelet family, the number of coefficients and the
iterations used in the wavelets are classified as subclasses
[15]. The suitable wavelet family is chosen depending on data.
The DWT applies a successive low-pass and high-pass
filtering of the discrete time-domain signal and decomposes
the signal into decomposition ‘D’ and approximation ‘A’. ‘A’
represents the low-pass filtered signal and ‘D’ represents the
high-pass filtered signal [15]. The decomposition is repeated
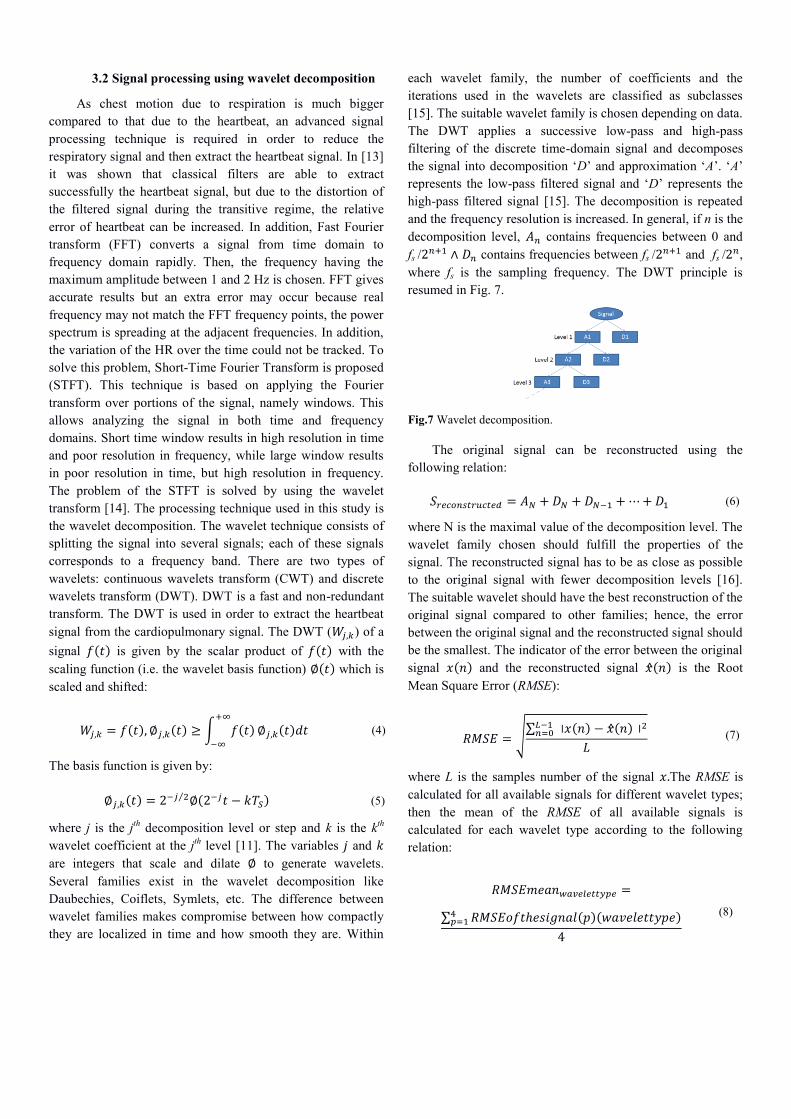
and the frequency resolution is increased. In general, if n is the
decomposition level, 𝐴𝑛 contains frequencies between 0 and
fs /2𝑛+1 ∧ 𝐷𝑛 contains frequencies between fs /2
𝑛+1 and fs /2𝑛,
where fs is the sampling frequency. The DWT principle is
resumed in Fig. 7.
Fig.7 Wavelet decomposition.
The original signal can be reconstructed using the
following relation:
𝑆𝑟𝑒𝑐𝑜𝑛𝑠𝑡𝑟𝑢𝑐𝑡𝑒𝑑 = 𝐴𝑁 + 𝐷𝑁 + 𝐷𝑁−1 + ⋯ + 𝐷1 (6)
where N is the maximal value of the decomposition level. The
wavelet family chosen should fulfill the properties of the
signal. The reconstructed signal has to be as close as possible
to the original signal with fewer decomposition levels [16].
The suitable wavelet should have the best reconstruction of the
original signal compared to other families; hence, the error
between the original signal and the reconstructed signal should
be the smallest. The indicator of the error between the original
signal 𝑥(𝑛) and the reconstructed signal 𝑥(𝑛) is the Root
Mean Square Error (RMSE):
𝑅𝑀𝑆𝐸 = √∑ ⃓𝑥(𝑛) − 𝑥(𝑛)⃓2𝐿−1
𝑛=0
𝐿 (7)
where L is the samples number of the signal 𝑥.The RMSE is
calculated for all available signals for different wavelet types;
then the mean of the RMSE of all available signals is
calculated for each wavelet type according to the following
relation:
𝑅𝑀𝑆𝐸𝑚𝑒𝑎𝑛𝑤𝑎𝑣𝑒𝑙𝑒𝑡𝑡𝑦𝑝𝑒 =
∑ 𝑅𝑀𝑆𝐸𝑜𝑓𝑡ℎ𝑒𝑠𝑖𝑔𝑛𝑎𝑙(𝑝)(𝑤𝑎𝑣𝑒𝑙𝑒𝑡𝑡𝑦𝑝𝑒)4𝑝=1
4
(8)
where p is the power index (p = 1, 2, 3 and 4 for signals
extracted at radiated powers -2, -7, -12 and -17 respectively).
Bior 2.4 is chosen after the mean RMSE calculation for all
wavelet types. Bior 2.4 has the lowest mean RMSE compared
to the others. The heartbeat rate for an adult is between 60 and
120 beats per minute, hence the frequency of the heartbeat is
located between 1 and 2 Hz. A re-sampling method is
necessary in order to obtain the decomposition of the signal in
the appropriate frequency band. Thus, a conversion of the
sampling frequency from 666.7 Hz to 512 Hz is applied in
order to obtain a band of frequencies between 0 and 1 Hz at
the 8th
approximation. Two processes are performed for the re-
sampling implementation: firstly, a linear interpolation of the
given discrete signal to a continuous signal is applied; then
applying sampling to the interpolated signal at the new
coordinate points [17]. Eliminating the 8th
approximation from
the reconstructed signal gives a signal with the frequency band
is between 1 to 256 Hz. As mentioned, the respiratory
amplitude is higher than the heartbeat amplitude; hence, the
role of processing techniques is to significantly reduce the
respiratory signal from the cardio-respiratory signal. In
general, respiratory frequency is between 0.2 and 0.34 Hz.
Hence, the signal 𝐴8 that contains this frequency band is
excluded from 𝑆𝑟𝑒𝑐𝑜𝑛𝑠𝑡𝑟𝑢𝑐𝑡𝑒𝑑. 𝑆𝐷18 is given by: 𝑆𝐷18 =
𝑆𝑟𝑒𝑐𝑜𝑛𝑠𝑡𝑟𝑢𝑐𝑡𝑒𝑑 − 𝐴8 = 𝐷8 + 𝐷7 + 𝐷6 + 𝐷5 + 𝐷4 +
𝐷3 + 𝐷2 + 𝐷1. It is named 𝑆𝐷18 because it contains all
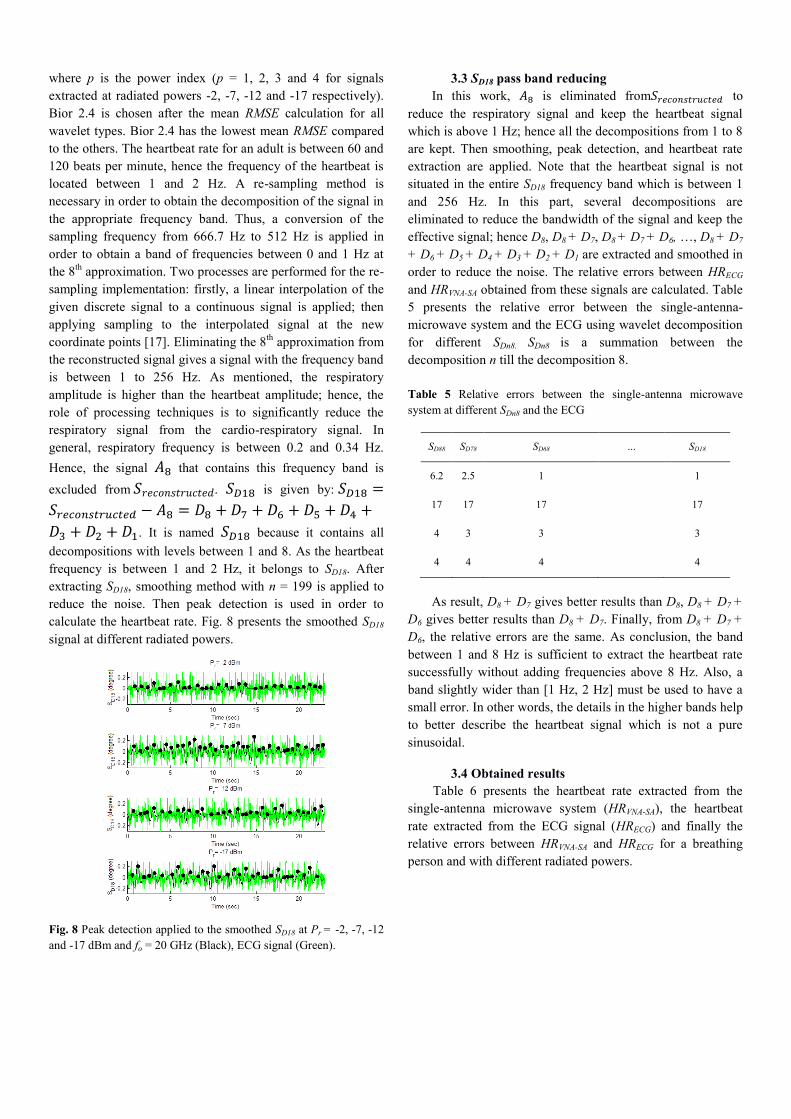
decompositions with levels between 1 and 8. As the heartbeat
frequency is between 1 and 2 Hz, it belongs to SD18. After
extracting SD18, smoothing method with n = 199 is applied to
reduce the noise. Then peak detection is used in order to
calculate the heartbeat rate. Fig. 8 presents the smoothed SD18
signal at different radiated powers.
Fig. 8 Peak detection applied to the smoothed SD18 at Pr = -2, -7, -12
and -17 dBm and fo = 20 GHz (Black), ECG signal (Green).
3.3 SD18 pass band reducing
In this work, 𝐴8 is eliminated from𝑆𝑟𝑒𝑐𝑜𝑛𝑠𝑡𝑟𝑢𝑐𝑡𝑒𝑑 to
reduce the respiratory signal and keep the heartbeat signal
which is above 1 Hz; hence all the decompositions from 1 to 8
are kept. Then smoothing, peak detection, and heartbeat rate
extraction are applied. Note that the heartbeat signal is not
situated in the entire SD18 frequency band which is between 1
and 256 Hz. In this part, several decompositions are
eliminated to reduce the bandwidth of the signal and keep the
effective signal; hence D8, D8 + D7, D8 + D7 + D6, …, D8 + D7
+ D6 + D5 + D4 + D3 + D2 + D1 are extracted and smoothed in
order to reduce the noise. The relative errors between HRECG
and HRVNA-SA obtained from these signals are calculated. Table
5 presents the relative error between the single-antenna-
microwave system and the ECG using wavelet decomposition
for different SDn8. SDn8 is a summation between the
decomposition n till the decomposition 8.
Table 5 Relative errors between the single-antenna microwave
system at different SDn8 and the ECG
SD88 SD78 SD68 … SD18
6.2 2.5 1 1
17 17 17 17
4 3 3 3
4 4 4 4
As result, D8 + D7 gives better results than D8, D8 + D7 +
D6 gives better results than D8 + D7. Finally, from D8 + D7 +
D6, the relative errors are the same. As conclusion, the band
between 1 and 8 Hz is sufficient to extract the heartbeat rate
successfully without adding frequencies above 8 Hz. Also, a
band slightly wider than [1 Hz, 2 Hz] must be used to have a
small error. In other words, the details in the higher bands help
to better describe the heartbeat signal which is not a pure
sinusoidal.
3.4 Obtained results
Table 6 presents the heartbeat rate extracted from the
single-antenna microwave system (HRVNA-SA), the heartbeat
rate extracted from the ECG signal (HRECG) and finally the
relative errors between HRVNA-SA and HRECG for a breathing
person and with different radiated powers.
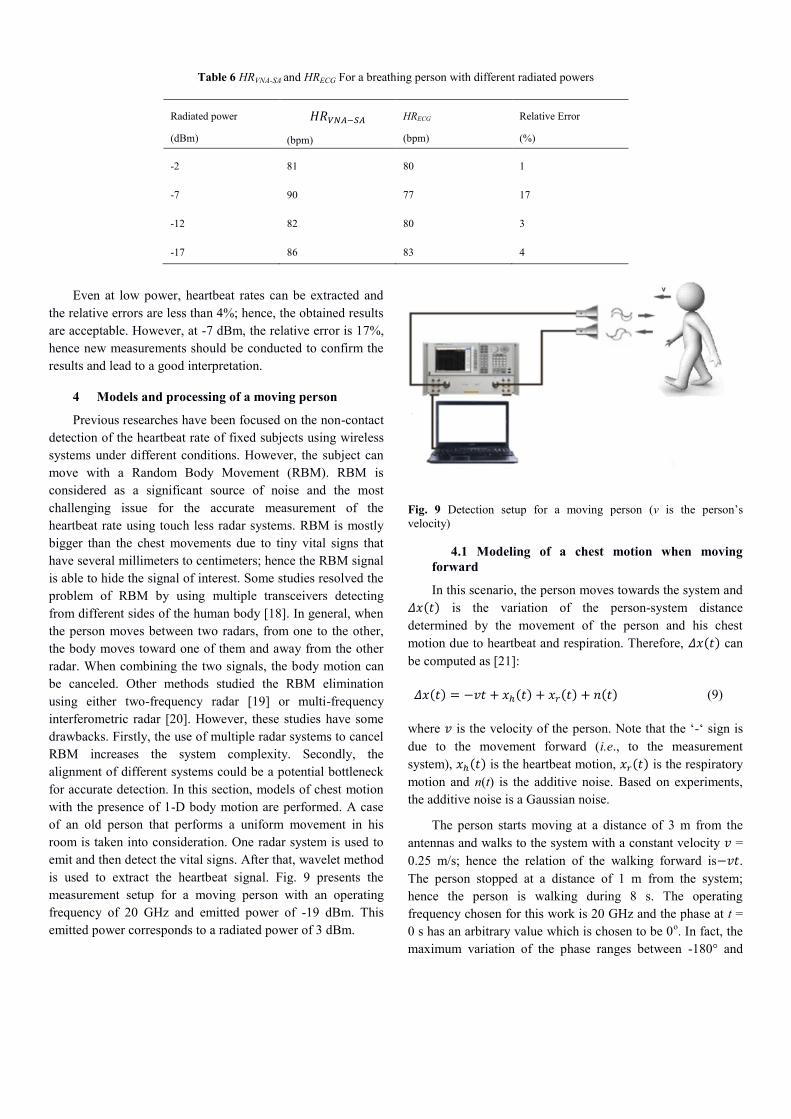
Table 6 HRVNA-SA and HRECG For a breathing person with different radiated powers
Radiated power
(dBm)
𝐻𝑅𝑉𝑁𝐴−𝑆𝐴
(bpm)
HRECG
(bpm)
Relative Error
(%)
-2 81 80 1
-7 90 77 17
-12 82 80 3
-17 86 83 4
Even at low power, heartbeat rates can be extracted and
the relative errors are less than 4%; hence, the obtained results
are acceptable. However, at -7 dBm, the relative error is 17%,
hence new measurements should be conducted to confirm the
results and lead to a good interpretation.
4 Models and processing of a moving person
Previous researches have been focused on the non-contact
detection of the heartbeat rate of fixed subjects using wireless
systems under different conditions. However, the subject can
move with a Random Body Movement (RBM). RBM is
considered as a significant source of noise and the most
challenging issue for the accurate measurement of the
heartbeat rate using touch less radar systems. RBM is mostly
bigger than the chest movements due to tiny vital signs that
have several millimeters to centimeters; hence the RBM signal
is able to hide the signal of interest. Some studies resolved the
problem of RBM by using multiple transceivers detecting
from different sides of the human body [18]. In general, when
the person moves between two radars, from one to the other,
the body moves toward one of them and away from the other
radar. When combining the two signals, the body motion can
be canceled. Other methods studied the RBM elimination
using either two-frequency radar [19] or multi-frequency
interferometric radar [20]. However, these studies have some
drawbacks. Firstly, the use of multiple radar systems to cancel
RBM increases the system complexity. Secondly, the
alignment of different systems could be a potential bottleneck
for accurate detection. In this section, models of chest motion
with the presence of 1-D body motion are performed. A case
of an old person that performs a uniform movement in his
room is taken into consideration. One radar system is used to
emit and then detect the vital signs. After that, wavelet method
is used to extract the heartbeat signal. Fig. 9 presents the
measurement setup for a moving person with an operating
frequency of 20 GHz and emitted power of -19 dBm. This
emitted power corresponds to a radiated power of 3 dBm.
Fig. 9 Detection setup for a moving person (v is the person’s
velocity)
4.1 Modeling of a chest motion when moving
forward
In this scenario, the person moves towards the system and
𝛥𝑥(𝑡) is the variation of the person-system distance
determined by the movement of the person and his chest
motion due to heartbeat and respiration. Therefore, 𝛥𝑥(𝑡) can
be computed as [21]:
𝛥𝑥(𝑡) = −𝑣𝑡 + 𝑥ℎ(𝑡) + 𝑥𝑟(𝑡) + 𝑛(𝑡) (9)
where 𝑣 is the velocity of the person. Note that the ‘-‘ sign is
due to the movement forward (i.e., to the measurement
system), 𝑥ℎ(𝑡) is the heartbeat motion, 𝑥𝑟(𝑡) is the respiratory
motion and n(t) is the additive noise. Based on experiments,
the additive noise is a Gaussian noise.
The person starts moving at a distance of 3 m from the
antennas and walks to the system with a constant velocity 𝑣 =
0.25 m/s; hence the relation of the walking forward is−𝑣𝑡.
The person stopped at a distance of 1 m from the system;
hence the person is walking during 8 s. The operating
frequency chosen for this work is 20 GHz and the phase at t =
0 s has an arbitrary value which is chosen to be 0o. In fact, the
maximum variation of the phase ranges between -180° and
+180°, hence each time the phase reaches the -180°, it will
permute to +180° and vice versa.
The heartbeat signal can be expressed by𝑥ℎ =
𝐴ℎ𝑠𝑖𝑛(2𝜋𝑓ℎ𝑡 + Ø𝑜ℎ), where 𝐴ℎ is the amplitude of chest
movement due to heartbeat, 𝑓ℎ is the heartbeat frequency
andØ𝑜ℎis the heartbeat sine wave phase at t = 0 and chosen to
be 90°. The heartbeat rate considered for this signal is 70.73
beats/min. The displacement of the chest due to heartbeat is
0.5 mm.
The respiration is also modeled as a sine wave;
hence 𝑥𝑟 = 𝐴𝑟𝑠𝑖𝑛(2𝜋𝑓𝑟𝑡 + Ø𝑜), where 𝐴𝑟 is the amplitude of
the chest movement due to respiration, 𝑓𝑟 is the respiratory
frequency and Ø𝑜is the phase at t = 0 s is an arbitrary value
and chosen to be 90o. The displacement of the chest due to
respiration is 𝐴𝑟 = 12 mm and the respiration frequency is 𝑓𝑟 =
0.25 Hz.
4.2 Phase noise model
Eliminating the noise affecting the signal quality is
considered as one of the biggest challenges. Relations (10) and
(11) present the signal power at the input of VNA system and
the signal to noise ratio (SNR) of VNA input respectively:
𝑃𝑆(𝑑𝐵𝑚) = 𝑃𝑒(𝑑𝐵𝑚) + 𝐺𝑒(𝑑𝐵) + 𝐺𝑟(𝑑𝐵) − 𝐴1(𝑑𝐵)
− 𝑅𝑒𝑓𝑙(𝑑𝐵) − 𝐴2(𝑑𝐵)
(10)
𝑆𝑁𝑅𝑉𝑁𝐴𝑖𝑛𝑝𝑢𝑡(𝑑𝐵) = 𝑃𝑆(𝑑𝐵𝑚) − 𝑃𝑛(𝑑𝐵𝑚)
= 𝑃𝑒(𝑑𝐵𝑚) + 𝐺𝑒(𝑑𝐵) + 𝐺𝑟(𝑑𝐵)
− 𝐴1(𝑑𝐵) − 𝑅𝑒𝑓𝑙(𝑑𝐵) − 𝐴2(𝑑𝐵)
− 𝑃𝑛(𝑑𝐵𝑚)
(11)
where 𝑃𝑒 is the emitted power, 𝐺𝑒 is the antenna gain at the
emission, 𝐺𝑟 is the antenna gain at the reception, 𝐴1(𝑑𝐵) +
𝐴2(𝑑𝐵) are the round trip free space losses, 𝑅𝑒𝑓𝑙 is the
reflection loss on the human body and𝑃𝑛 is the noise power at
the VNA input.
Note that global free space losses have the following relation:
𝐴(𝑑𝐵) = 𝐴1(𝑑𝐵) + 𝐴2(𝑑𝐵) = 2𝐴1(𝑑𝐵)
= 40𝑙𝑜𝑔10 (4 𝜋𝑑 𝜆⁄ )
(12)
Because this study presents the case of a person moving
toward the VNA system, the distance ‘d’ between the person
and the VNA system decreases; hence, based on (11), the SNR
of the input signal increases when the person is getting closer
to the Doppler radar. SNR of the phase variation is certainly
related to the signal SNR; but no direct relation between SNR
of the signal and SNR of the phase is presented, nor between
phase noise and distance between the person and the radar.
Measurements are used to find a relation between the signal
noise and the distance. As seen in (10), for each emitted power
𝑃𝑒of a fixed person (distance is fixed), the signal power at the
VNA input is fixed. In addition, for each emitted power used
for the fixed person, the variance of the phase noise is
assumed to be constant. From S21 phase measurements, the
variance of the phase noise is extracted for several values of
the emitted power. Then, a relation between the emitted power
and the variance of the phase noise is found from these
measurements. Hence, a relation between the signal power at
the VNA input and the phase noise variance is found from the
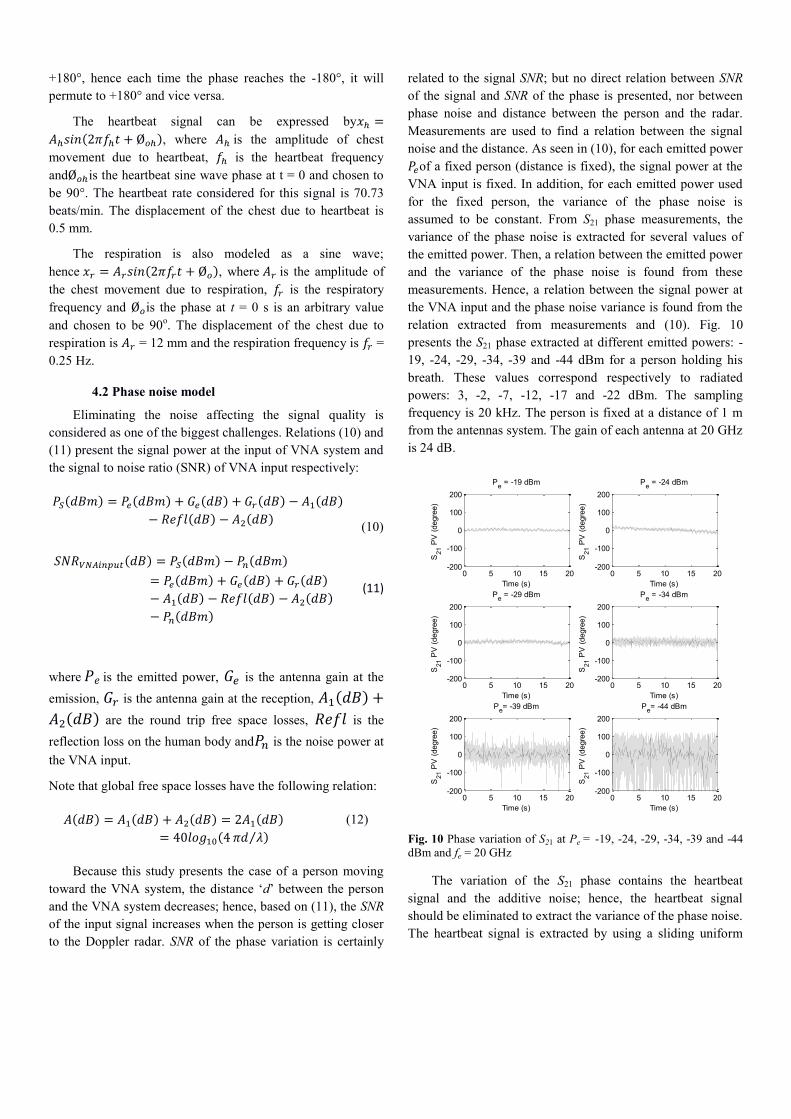
relation extracted from measurements and (10). Fig. 10
presents the S21 phase extracted at different emitted powers: -
19, -24, -29, -34, -39 and -44 dBm for a person holding his
breath. These values correspond respectively to radiated
powers: 3, -2, -7, -12, -17 and -22 dBm. The sampling
frequency is 20 kHz. The person is fixed at a distance of 1 m
from the antennas system. The gain of each antenna at 20 GHz
is 24 dB.
Fig. 10 Phase variation of S21 at Pe = -19, -24, -29, -34, -39 and -44
dBm and fe = 20 GHz
The variation of the S21 phase contains the heartbeat
signal and the additive noise; hence, the heartbeat signal
should be eliminated to extract the variance of the phase noise.
The heartbeat signal is extracted by using a sliding uniform
0 5 10 15 20-200
-100
0
100
200
Pe = -19 dBm
Time (s)
S21 P
V (
degre
e)
0 5 10 15 20-200
-100
0
100
200
Pe = -24 dBm
Time (s)S
21 P
V (
degre
e)
0 5 10 15 20-200
-100
0
100
200
Pe = -29 dBm
Time (s)
S21 P
V (
degre
e)
0 5 10 15 20-200
-100
0
100
200
Pe = -34 dBm
Time (s)
S21 P
V (
degre
e)
0 5 10 15 20-200
-100
0
100
200
Pe= -39 dBm
Time (s)
S21 P
V (
degre
e)
0 5 10 15 20-200
-100
0
100
200
Pe= -44 dBm
Time (s)
S21 P
V (
degre
e)
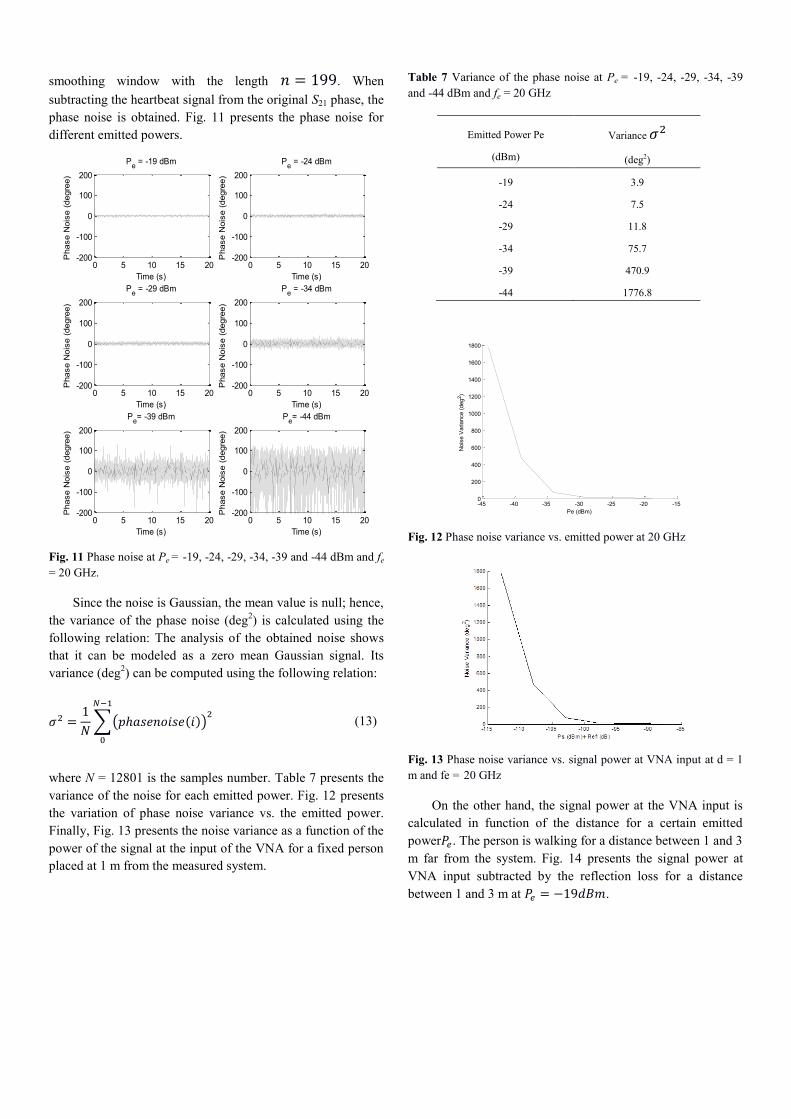
smoothing window with the length 𝑛 = 199. When
subtracting the heartbeat signal from the original S21 phase, the
phase noise is obtained. Fig. 11 presents the phase noise for
different emitted powers.
Fig. 11 Phase noise at Pe = -19, -24, -29, -34, -39 and -44 dBm and fe
= 20 GHz.
Since the noise is Gaussian, the mean value is null; hence,
the variance of the phase noise (deg2) is calculated using the
following relation: The analysis of the obtained noise shows
that it can be modeled as a zero mean Gaussian signal. Its
variance (deg2) can be computed using the following relation:
𝜎2 =1
𝑁∑(𝑝ℎ𝑎𝑠𝑒𝑛𝑜𝑖𝑠𝑒(𝑖))
2𝑁−1
0
(13)
where N = 12801 is the samples number. Table 7 presents the
variance of the noise for each emitted power. Fig. 12 presents
the variation of phase noise variance vs. the emitted power.
Finally, Fig. 13 presents the noise variance as a function of the
power of the signal at the input of the VNA for a fixed person
placed at 1 m from the measured system.
Table 7 Variance of the phase noise at Pe = -19, -24, -29, -34, -39
and -44 dBm and fe = 20 GHz
Emitted Power Pe
(dBm)
Variance 𝜎2
(deg2)
-19 3.9
-24 7.5
-29 11.8
-34 75.7
-39 470.9
-44 1776.8
Fig. 12 Phase noise variance vs. emitted power at 20 GHz
Fig. 13 Phase noise variance vs. signal power at VNA input at d = 1
m and fe = 20 GHz
On the other hand, the signal power at the VNA input is
calculated in function of the distance for a certain emitted
power𝑃𝑒. The person is walking for a distance between 1 and 3
m far from the system. Fig. 14 presents the signal power at
VNA input subtracted by the reflection loss for a distance
between 1 and 3 m at 𝑃𝑒 = −19𝑑𝐵𝑚.
0 5 10 15 20-200
-100
0
100
200
Pe = -19 dBm
Time (s)
Phase N
ois
e (
degre
e)
0 5 10 15 20-200
-100
0
100
200
Pe = -24 dBm
Time (s)
Phase N
ois
e (
degre
e)
0 5 10 15 20-200
-100
0
100
200
Pe = -29 dBm
Time (s)
Phase N
ois
e (
degre
e)
0 5 10 15 20-200
-100
0
100
200
Pe = -34 dBm
Time (s)
Phase N
ois
e (
degre
e)
0 5 10 15 20-200
-100
0
100
200
Pe= -39 dBm
Time (s)
Phase N
ois
e (
degre
e)
0 5 10 15 20-200
-100
0
100
200
Pe= -44 dBm
Time (s)
Phase N
ois
e (
degre
e)
-45 -40 -35 -30 -25 -20 -150
200
400
600
800
1000
1200
1400
1600
1800
Pe (dBm)
Nois
e V
ariance (
deg
2)
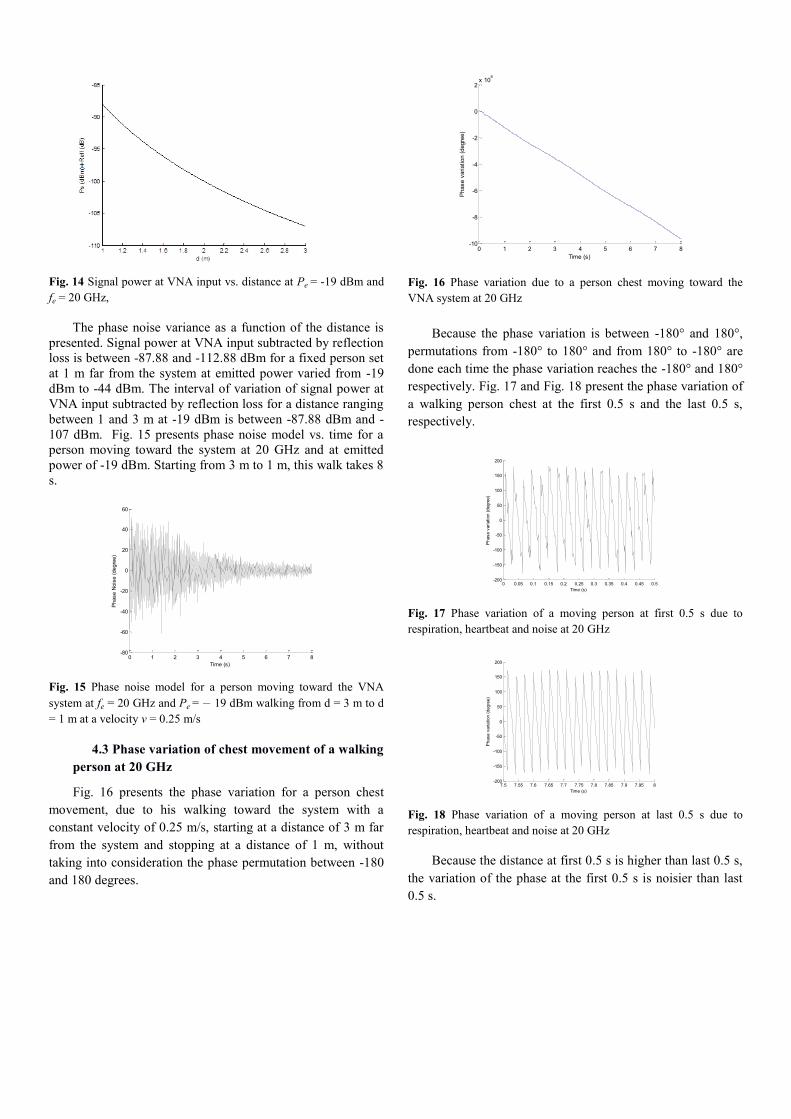
Fig. 14 Signal power at VNA input vs. distance at Pe = -19 dBm and
fe = 20 GHz,
The phase noise variance as a function of the distance is
presented. Signal power at VNA input subtracted by reflection
loss is between -87.88 and -112.88 dBm for a fixed person set
at 1 m far from the system at emitted power varied from -19
dBm to -44 dBm. The interval of variation of signal power at
VNA input subtracted by reflection loss for a distance ranging
between 1 and 3 m at -19 dBm is between -87.88 dBm and -
107 dBm. Fig. 15 presents phase noise model vs. time for a
person moving toward the system at 20 GHz and at emitted
power of -19 dBm. Starting from 3 m to 1 m, this walk takes 8
s.
Fig. 15 Phase noise model for a person moving toward the VNA
system at fe = 20 GHz and Pe = − 19 dBm walking from d = 3 m to d
= 1 m at a velocity v = 0.25 m/s
4.3 Phase variation of chest movement of a walking
person at 20 GHz
Fig. 16 presents the phase variation for a person chest
movement, due to his walking toward the system with a
constant velocity of 0.25 m/s, starting at a distance of 3 m far
from the system and stopping at a distance of 1 m, without
taking into consideration the phase permutation between -180
and 180 degrees.
Fig. 16 Phase variation due to a person chest moving toward the
VNA system at 20 GHz
Because the phase variation is between -180° and 180°,
permutations from -180° to 180° and from 180° to -180° are
done each time the phase variation reaches the -180° and 180°
respectively. Fig. 17 and Fig. 18 present the phase variation of
a walking person chest at the first 0.5 s and the last 0.5 s,
respectively.
Fig. 17 Phase variation of a moving person at first 0.5 s due to
respiration, heartbeat and noise at 20 GHz
Fig. 18 Phase variation of a moving person at last 0.5 s due to
respiration, heartbeat and noise at 20 GHz
Because the distance at first 0.5 s is higher than last 0.5 s,
the variation of the phase at the first 0.5 s is noisier than last
0.5 s.
0 1 2 3 4 5 6 7 8-80
-60
-40
-20
0
20
40
60
Time (s)
Phase N
ois
e (
degre
e)
0 1 2 3 4 5 6 7 8-10
-8
-6
-4
-2
0
2x 10
4
Time (s)
Phase v
ariation (
degre
e)
0 0.05 0.1 0.15 0.2 0.25 0.3 0.35 0.4 0.45 0.5-200
-150
-100
-50
0
50
100
150
200
Time (s)
Phase v
ariation (
degre
e)
7.5 7.55 7.6 7.65 7.7 7.75 7.8 7.85 7.9 7.95 8-200
-150
-100
-50
0
50
100
150
200
Time (s)
Phase v
ariation (
degre
e)
4.4 Signal processing and results
Before applying signal processing, all permutations
between the -180° and 180° are removed, because these
permutations affect the cardiopulmonary signal. Permutations
elimination is done each time the phase difference between the
current sample and the previous sample is equal or slightly
less than 360o. Note that the respiratory and heartbeat signals
are hidden because of the presence of the movement; hence,
signal processing is required to extract the heartbeat signal
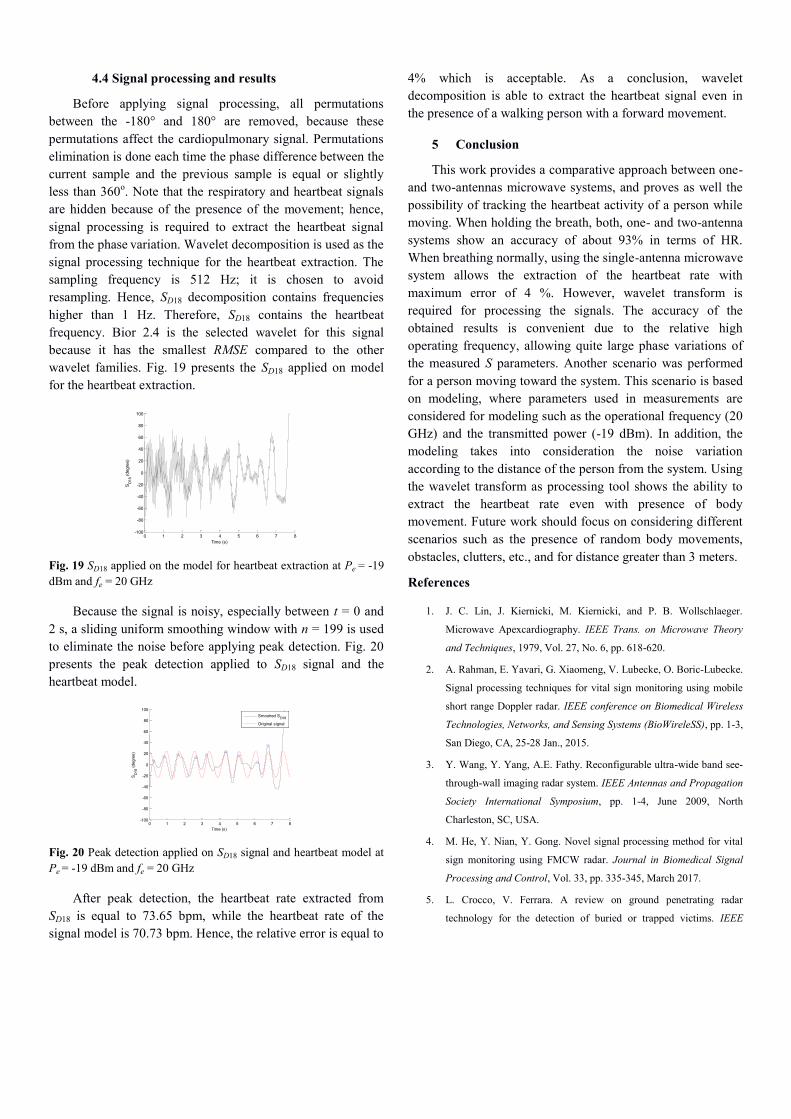
from the phase variation. Wavelet decomposition is used as the
signal processing technique for the heartbeat extraction. The
sampling frequency is 512 Hz; it is chosen to avoid
resampling. Hence, SD18 decomposition contains frequencies
higher than 1 Hz. Therefore, SD18 contains the heartbeat
frequency. Bior 2.4 is the selected wavelet for this signal
because it has the smallest RMSE compared to the other
wavelet families. Fig. 19 presents the SD18 applied on model
for the heartbeat extraction.
Fig. 19 SD18 applied on the model for heartbeat extraction at Pe = -19
dBm and fe = 20 GHz
Because the signal is noisy, especially between t = 0 and
2 s, a sliding uniform smoothing window with n = 199 is used
to eliminate the noise before applying peak detection. Fig. 20
presents the peak detection applied to SD18 signal and the
heartbeat model.
Fig. 20 Peak detection applied on SD18 signal and heartbeat model at
Pe = -19 dBm and fe = 20 GHz
After peak detection, the heartbeat rate extracted from
SD18 is equal to 73.65 bpm, while the heartbeat rate of the
signal model is 70.73 bpm. Hence, the relative error is equal to
4% which is acceptable. As a conclusion, wavelet
decomposition is able to extract the heartbeat signal even in
the presence of a walking person with a forward movement.
5 Conclusion
This work provides a comparative approach between one-
and two-antennas microwave systems, and proves as well the
possibility of tracking the heartbeat activity of a person while
moving. When holding the breath, both, one- and two-antenna
systems show an accuracy of about 93% in terms of HR.
When breathing normally, using the single-antenna microwave
system allows the extraction of the heartbeat rate with
maximum error of 4 %. However, wavelet transform is
required for processing the signals. The accuracy of the
obtained results is convenient due to the relative high
operating frequency, allowing quite large phase variations of
the measured S parameters. Another scenario was performed
for a person moving toward the system. This scenario is based
on modeling, where parameters used in measurements are
considered for modeling such as the operational frequency (20
GHz) and the transmitted power (-19 dBm). In addition, the
modeling takes into consideration the noise variation
according to the distance of the person from the system. Using
the wavelet transform as processing tool shows the ability to
extract the heartbeat rate even with presence of body
movement. Future work should focus on considering different
scenarios such as the presence of random body movements,
obstacles, clutters, etc., and for distance greater than 3 meters.
References
1. J. C. Lin, J. Kiernicki, M. Kiernicki, and P. B. Wollschlaeger.
Microwave Apexcardiography. IEEE Trans. on Microwave Theory
and Techniques, 1979, Vol. 27, No. 6, pp. 618-620.
2. A. Rahman, E. Yavari, G. Xiaomeng, V. Lubecke, O. Boric-Lubecke.
Signal processing techniques for vital sign monitoring using mobile
short range Doppler radar. IEEE conference on Biomedical Wireless
Technologies, Networks, and Sensing Systems (BioWireleSS), pp. 1-3,
San Diego, CA, 25-28 Jan., 2015.
3. Y. Wang, Y. Yang, A.E. Fathy. Reconfigurable ultra-wide band see-
through-wall imaging radar system. IEEE Antennas and Propagation
Society International Symposium, pp. 1-4, June 2009, North
Charleston, SC, USA.
4. M. He, Y. Nian, Y. Gong. Novel signal processing method for vital
sign monitoring using FMCW radar. Journal in Biomedical Signal
Processing and Control, Vol. 33, pp. 335-345, March 2017.
5. L. Crocco, V. Ferrara. A review on ground penetrating radar
technology for the detection of buried or trapped victims. IEEE
0 1 2 3 4 5 6 7 8-100
-80
-60
-40
-20
0
20
40
60
80
100
Time (s)
SD
18 (
degre
e)
0 1 2 3 4 5 6 7 8-100
-80
-60
-40
-20
0
20
40
60
80
100
Time (s)
SD
18 (
degre
e)
Smoohed SD18
Original signal
International conference on Collaboration Technologies and Systems
(CTS), pp. 535–540, May 2014, Minneapolis.
6. L. Lu, C. Li, J.A. Rice. A software-defined multifunctional radar
sensor for linear and reciprocal displacement measurement. In
Wireless Sensors and Sensor Networks (WiSNet). IEEE Topical
Conference, 2011, Phoenix, AZ, USA.
7. C. Gu, R. Li, C. Li, S-B. Jiang, Doppler radar respiration
measurement for gated lung cancer radiotherapy. In Biomedical
Wireless Technologies. Networks, and Sensing Systems
(BioWireleSS), pp. 91-94, January 2011, Phoenix, AZ, USA.
8. O. Boric-Lubecke, A. D. Droitcour, V. M. Lubecke, J. Lin, and G. T.
A. Kovacs. Wireless IC Doppler for Sensing of Heart and Respiration
Activity. IEEE TELSIKS 2003, Serbia and Montenegro, Nis, October
1-3 (2003), 337-344.
9. http://www.webmd.com/lung/counting-respiration-rate
10. D. Obeid, S. Sadek, G. Zaharia, G. El Zein. Noncontact heartbeat
detection at 2.4, 5.8 and 60 GHz: A comparative study. Microwave
and Optical Technology Letter, Vol. 51, No. 3, pp. 666-669, March
2009.
11. D. Obeid, G. Zaharia, S. Sadek, G. El Zein. ECG vs. single-antenna
system for heartbeat activity detection. 4th International Symposium
on Applied Sciences in Biomedical and Communication Technologies
(ISABEL), October 2011, Barcelona, Spain.
12. American National Standard, Cardiac monitors, heart rate meters,
and alarms, ANSI/AAMI EC1.
13. S. El-Samad, D. Obeid, G. Zaharia, S. Sadek, G. El Zein. Contact-
Less measurement system or cardiopulmonary activity. Proc. of 2014
Mediterranean Microwave Symposium (MMS), 2014, December
2014, Marrakech.
14. R. Motard, B.Joseph. Wavelet application in chemical engineering.
Washington University in St. Louis, springer science + business
media.
15. A. Blackburn, J. Garke Ferwerda. Retrieval of chlorophyll
concentration from leaf reflectance spectra using wavelet analysis.
Remote Sensing of Environment, Vol. 112, No. 4, pp. 1614-1632,
April 2008.
16. C. Stolojescu, I. Railean, S. Moga, A. Isar. Comparison of wavelet
families with application to WiMAX traffic forecasting. International
Conference on Optimization of Electrical and Electronic Equipment,
May 2010, Brasov, Romania.
17. P. Hao. Reversible resampling of integer signals. IEEE Transactions
on Signal Processing, Vol. 57, No. 2, pp. 516-525, February 2009.
18. K.-M. Chen, Y. Huang, J. Zhang, and A. Norman. Microwave life-
detection systems for searching human subjects under earthquake
rubble or behind barrier. IEEE Transaction in Biomedical
Engineering, Vol. 27, No. 1, pp. 105–114, January 2000.
19. D. T. Petkie, C. Benton, E. Bryan. Millimeter wave radar for remote
measurement of vital signs. IEEE Radar Conference, pp. 1-3, 2009.
20. I. Nasr, E. Karagozler, I. Poupyrev, S. Trotta. A highly integrated 60-
GHz 6-Channel transceiver chip in 0.35 μm SiGe technology for
smart sensing and short-range communications. IEEE Compound
Semiconductor Integrated Circuit Symposium (CSICS), pp. 1-4,
October 2015, New Orleans, LA, USA.
21. J. Tu, T. Hwang, Member, J. Lin, Fellow. Respiration rate
measurement under 1-D body motion using single continuous-wave
Doppler radar vital sign detection system. IEEE Transactions on
Microwave Theory and Techniques, Vol. 64, No. 6, pp. 1937-1946,
June 2016.
22. P. Singh, V. K. Babbar, A. Razdan, T. C. Goel, S. L. Srivastava.
Magnetic, dielectric and microwave absorption studies of Ba-CoTi
haxaferrite-epoxy composites. Indian Journal of Pure and Applied
Physics, Vol. 42, pp. 221-228, March 2004.
AUTHORS’ INFORMATION
Sarah Samad was born in Senlis, France in 1988.
She received Diploma in electrical and electronics
engineering from Lebanese University, Tripoli,
Lebanon and Master Degree in technologies of
medical and industrial systems. She got her Ph.D.
degree at INSA of Rennes, France and the
Lebanese University, Lebanon. Her research
interests are on cardiopulmonary detection using Doppler radar.
Gheorghe Zaharia received the B.S. degree in
electronics and telecommunications from the
Polytechnic Institute of Iasi, Romania, in 1981
and the D.E.A. and Ph.D. degrees in
telecommunications, signal processing and
electronics from the “Institut National des
Sciences Appliquées » (INSA) of Rennes, France,
in 1991 and 1997, respectively.
From 1983 to 1990 he was a Lecturer at the Technical University of Iasi,
Romania. Between 1983 and 1985 he studied mathematics at the University
“Al. I. Cuza” of Iasi. Since 1997, he is Associate Professor in the Department
“Communications Systems and Networks”, the former “Electronics and
Communications Systems” Department, INSA, Rennes. His teaching and
research interests mainly concern the study of radio waves propagation,
communications systems, information theory, and coding. Gheorghe Zaharia
is Senior Member IEEE and member of the Romanian Society of Medical
Bioengineering. He was member of the Scientific Committee of several
international conferences (EHB 2011, EHB 2013, MMS 2013 …). He has
more than 30 journal papers, about 100 papers presented at international
conferences and 2 patents. He is also co-author of one book and 5 book
chapters.
Sawsan Sadek received the B.S. degree in
physics from Lebanese University in 1989 and
Ph.D. degree in Microwaves from the University
of Sciences and Technologies of Lille, France, in
1996.
Actually, Sawsan is a professor at the Lebanese
University, University Institute of Technology in
Saida, Lebanon, Department of Communications, Computer and Networks.
She chaired the department for 5 years from 2009 to 2014. She organized the
MMS2013 in Saida, Lebanon. She participated to several scientific
committees for international conferences and has more than 7 journal papers,
20 international conferences and one book chapter.
Ghais El Zein received the M.S. degree in Electronics,
the Ph.D. degree in Telecommunications and Signal
Processing, and the H.D.R. “Habilitation à Diriger des
Recherches” degree in Electronics from the University
of Rennes 1 - France, in 1983, 1988 and 1998,
respectively. From 1985 to 1987, he was a Lecturer,
and from 1990 to 1999, an Associate Professor, in the
Department of Electronics and Communications Systems Engineering, of the
“Institut National des Sciences Appliquées de Rennes” (INSA) - France,
where he is currently a Professor.
He has authored or co-authored over 215 technical papers in major
international journals and conferences, 2 books, 13 book chapters and 4
patents in the areas of communications and radio propagation. His teaching
and research interests mainly concern the study of radio wave propagation
phenomena and the evaluation of their effects on communication systems.
Prof. El Zein served as a TPC member and symposium chair of several
international conferences. From 2001 to 2009, he served as deputy director of
the Institute of Electronics and Telecommunications of Rennes (IETR - UMR
CNRS 6164). Since 2009, he is the Head of Radio Propagation Team. He is a
member of URSI-F and member of the Monitoring and Assessment
Committee (CSE) of the “Images et Réseaux” cluster.
Dany Obeid has received his BS degree in Computer
Engineering from University of Balamand, an M.S
degree in Computer and Communications Engineering
from the American University of Science and
Technology, and a PhD degree in Telecommunications
and Signal Processing from INSA of Rennes, in 2003,
2006, and 2010 respectively. Dany worked as a
lecturer and researcher in INSA of Rennes and the Lebanese University, and
as an R&D engineer in Kaptalia Monitoring.