Embed Size (px)
Citation preview
8/4/2019 Heart Sound With Wavelet
http://slidepdf.com/reader/full/heart-sound-with-wavelet 1/13
ORIGINAL PAPER
Software Development for the Analysis of Heartbeat Sounds
with LabVIEW in Diagnosis of Cardiovascular Disease
Taner Topal & Hüseyin Polat & İnan Güler
Received: 31 January 2008 /Accepted: 13 March 2008 /Published online: 15 April 2008# Springer Science + Business Media, LLC 2008
Abstract In this paper, a time-frequency spectral analysis
software (Heart Sound Analyzer) for the computer-aidedanalysis of cardiac sounds has been developed with Lab-
VIEW. Software modules reveal important information for
cardiovascular disorders, it can also assist to general
physicians to come up with more accurate and reliable
diagnosis at early stages. Heart sound analyzer (HSA)
software can overcome the deficiency of expert doctors and
help them in rural as well as urban clinics and hospitals.
HSA has two main blocks: data acquisition and pre-
processing, time – frequency spectral analyses. The heart
sounds are first acquired using a modified stethoscope
which has an electret microphone in it. Then, the signals are
analysed using the time – frequency/scale spectral analysis
techniques such as STFT, Wigner – Ville distribution and
wavelet transforms. HSA modules have been tested with
real heart sounds from 35 volunteers and proved to be quite
efficient and robust while dealing with a large variety of
pathological conditions.
Keywords Phonocardiogram signal . Cardiac sound
analysis . FFT . STFT . Wigner – Ville distribution .
Wavelet transform
Introduction
Auscultation is a technique in which a stethoscope is used
to listen the heart sounds of a body. Classic cardiac
auscultation has been the most marked method used in
diagnosing many cardiovascular diseases since two centu-ries. It is still a fundamental and very important diagnostic
tool in the diagnosis of heart disease, since it is cheap and
noninvasive. The structural abnormalities of the heart are
frequently reflected in the sounds produced by the heart.
Physicians use the stethoscope as a device to listen the
heart sounds and make a proper diagnosis. However, the
auscultation of heart sound signals through either a
conventional acoustic or an electronic stethoscope needs
a long-term practice and experience. Cardiologists are
specifically interested in abnormal sounds, which may
propose the presence of a cardiac pathology and also give
diagnostic information. For instance, a very important type
of abnormal sound is murmur caused by the turbulent
flow of blood in the cardiovascular system. The timing
and pitch of a murmur are of significant importance in the
diagnosis of a heart condition, for example murmur during
diastole are signs of malfunctioning of heart valves but
murmur during systole may correspond to either a
pathological or healthy heart, depending on the acoustic
characteristics of the murmurs [1, 2].
Today, electronic stethoscopes with built-in filters make
auscultation more precise and convenient. Murmurs and
tones are separated easily, but background sound, under the
threshold of audibility, still covers weak murmurs, so that
the human ear is not able to identify them. Often, more than
one valve is insufficient and/or stenotic, which makes the
classification of heart sounds altered by valve diseases very
complex and difficult [1, 2].
A time – frequency distribution (TFD) shows the spectral
composition of a signal at some particular time instant. It is
usually derived from a time – frequency representation (TFR),
such as short time Fourier transform (STFT), Wigner – Ville
distribution (WVD) and Wavelet transform (WT) [3].
J Med Syst (2008) 32:409 – 421
DOI 10.1007/s10916-008-9146-8
T. Topal : H. Polat : İ. Güler (*)
Electronics and Computer Education Department,
Faculty of Technical Education, Gazi University,
Ankara, Teknikokullar 06500, Turkey
e-mail: [email protected]
8/4/2019 Heart Sound With Wavelet
http://slidepdf.com/reader/full/heart-sound-with-wavelet 2/13
Some authors have point out that the wavelet based
scalogram analysis of phonocardiograms is more successful
than the spectrogram or Wigner – Ville distribution due to
the strong non-stationarity of that signal [4]. Time –
frequency/scale methods have been applied to characterize
heart sounds [3, 5, 6]. In the literature, the authors have
discussed the characterization of heart murmurs using time –
frequency methods over a number of cardiac cycles [4 – 9].In this study, the STFT, WVD and WT were applied to
heart sound signals obtained from 35 volunteers and collected
from online clinical training website [10 – 12]. To visualize
the frequency band activities depending on time, signals are
processed with time – frequency-based STFT, WVD and
continuous wavelet transform (CWT) method. The applied
methods were compared in terms of their frequency
resolution and the effects in determining abnormality in
heart sound signals. For this purpose, we developed a
software package using LabVIEW. In order to obtain
clinically interpretable results, frequency band activities of
the signals were mapped onto frequency – time axes usingthe STFT, WVD, and WT. The performance analysis by the
wavelet transform over other techniques in analyzing heart
sounds of the phonocardiogram signals is presented.
Materials and methods
Heart sound auscultation
The heart sounds are primarily generated from blood
turbulence. The blood turbulence occurs due to fast
accelerations and decelerations of the blood in the cham-
bers and arteries caused by the contraction or closure of the
heart valves, which in turn produce mechanical vibrations
that propagate through the body tissues up to the surface of
the chest. Basic heart sounds mostly occur in the frequency
range of 20 – 200 Hz. Some heart murmurs produce the
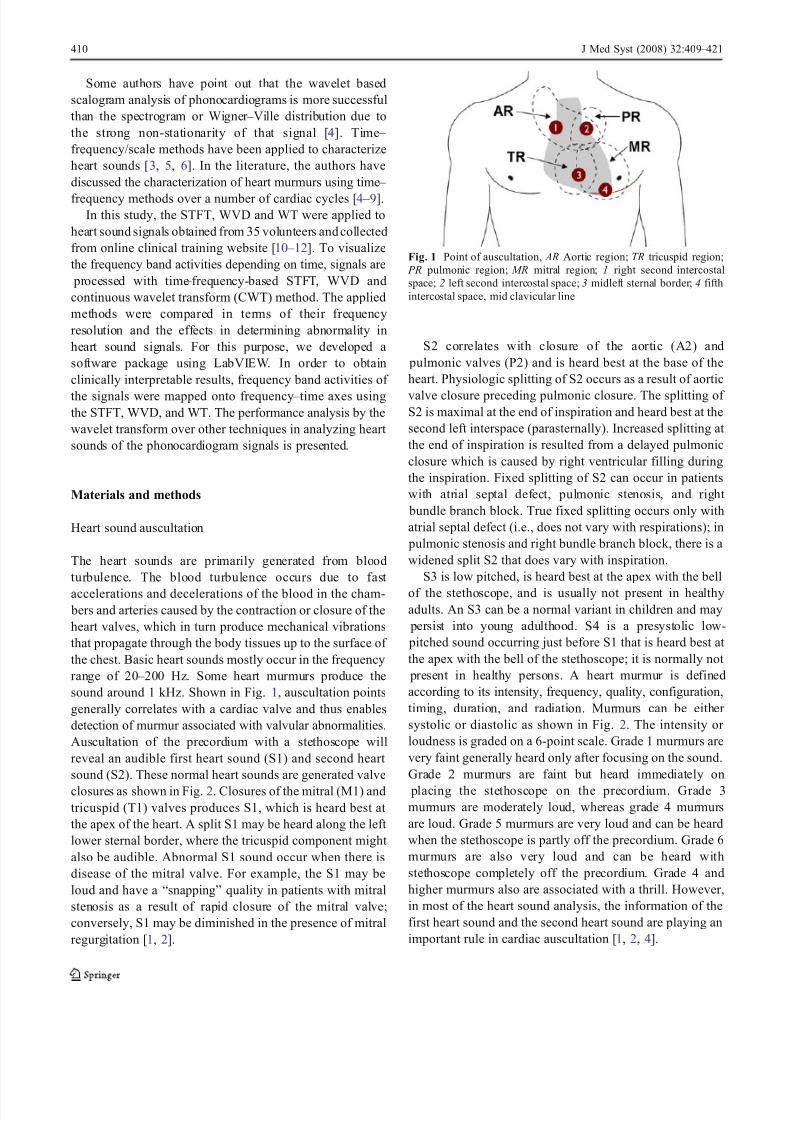
sound around 1 kHz. Shown in Fig. 1, auscultation points
generally correlates with a cardiac valve and thus enables
detection of murmur associated with valvular abnormalities.
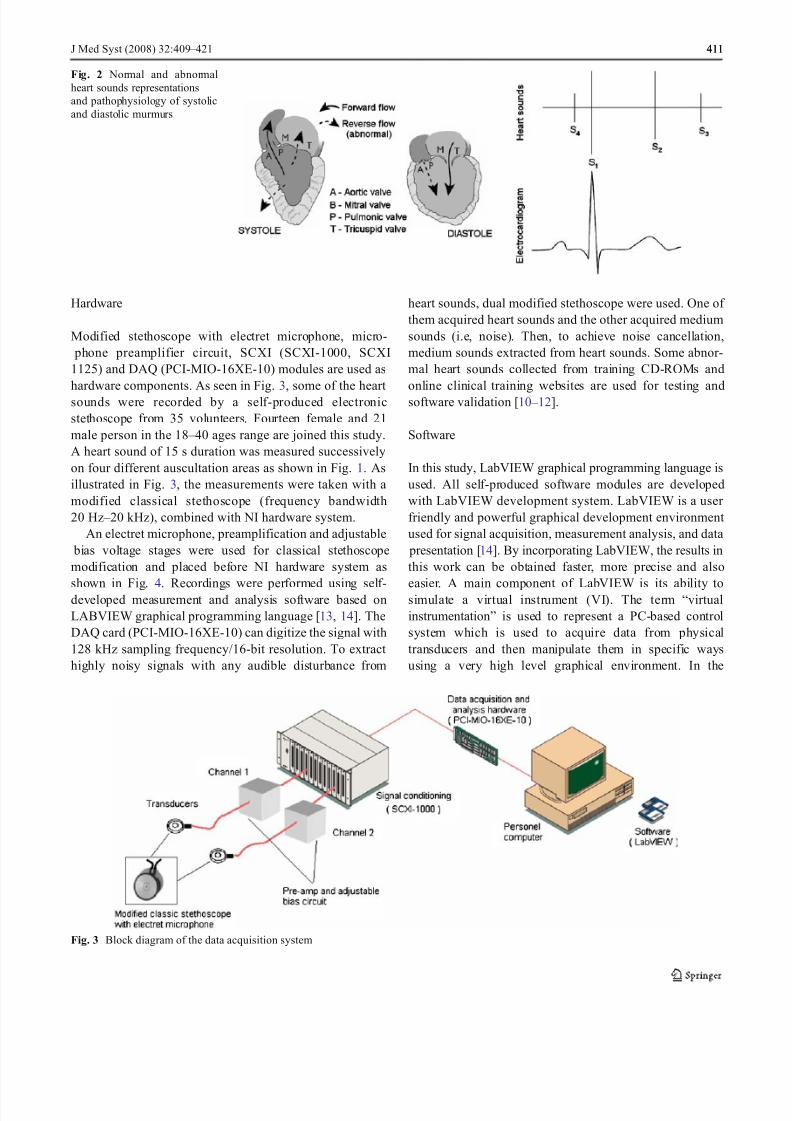
Auscultation of the precordium with a stethoscope will
reveal an audible first heart sound (S1) and second heart
sound (S2). These normal heart sounds are generated valve
closures as shown in Fig. 2. Closures of the mitral (M1) and
tricuspid (T1) valves produces S1, which is heard best at
the apex of the heart. A split S1 may be heard along the left
lower sternal border, where the tricuspid component might
also be audible. Abnormal S1 sound occur when there is
disease of the mitral valve. For example, the S1 may be
loud and have a “snapping” quality in patients with mitral
stenosis as a result of rapid closure of the mitral valve;
conversely, S1 may be diminished in the presence of mitral
regurgitation [1, 2].
S2 correlates with closure of the aortic (A2) and
pulmonic valves (P2) and is heard best at the base of the
heart. Physiologic splitting of S2 occurs as a result of aortic
valve closure preceding pulmonic closure. The splitting of S2 is maximal at the end of inspiration and heard best at the
second left interspace (parasternally). Increased splitting at
the end of inspiration is resulted from a delayed pulmonic
closure which is caused by right ventricular filling during
the inspiration. Fixed splitting of S2 can occur in patients
with atrial septal defect, pulmonic stenosis, and right
bundle branch block. True fixed splitting occurs only with
atrial septal defect (i.e., does not vary with respirations); in
pulmonic stenosis and right bundle branch block, there is a
widened split S2 that does vary with inspiration.
S3 is low pitched, is heard best at the apex with the bell
of the stethoscope, and is usually not present in healthy
adults. An S3 can be a normal variant in children and may
persist into young adulthood. S4 is a presystolic low-
pitched sound occurring just before S1 that is heard best at
the apex with the bell of the stethoscope; it is normally not
present in healthy persons. A heart murmur is defined
according to its intensity, frequency, quality, configuration,
timing, duration, and radiation. Murmurs can be either
systolic or diastolic as shown in Fig. 2. The intensity or
loudness is graded on a 6-point scale. Grade 1 murmurs are
very faint generally heard only after focusing on the sound.
Grade 2 murmurs are faint but heard immediately on
placing the stethoscope on the precordium. Grade 3
murmurs are moderately loud, whereas grade 4 murmurs
are loud. Grade 5 murmurs are very loud and can be heard
when the stethoscope is partly off the precordium. Grade 6
murmurs are also very loud and can be heard with
stethoscope completely off the precordium. Grade 4 and
higher murmurs also are associated with a thrill. However,
in most of the heart sound analysis, the information of the
first heart sound and the second heart sound are playing an
important rule in cardiac auscultation [1, 2, 4].
Fig. 1 Point of auscultation, AR Aortic region; TR tricuspid region;
PR pulmonic region; MR mitral region; 1 right second intercostal
space; 2 left second intercostal space; 3 midleft sternal border; 4 fifth
intercostal space, mid clavicular line
410 J Med Syst (2008) 32:409 – 421
8/4/2019 Heart Sound With Wavelet
http://slidepdf.com/reader/full/heart-sound-with-wavelet 3/13
Hardware
Modified stethoscope with electret microphone, micro-
phone preamplifier circuit, SCXI (SCXI-1000, SCXI
1125) and DAQ (PCI-MIO-16XE-10) modules are used as
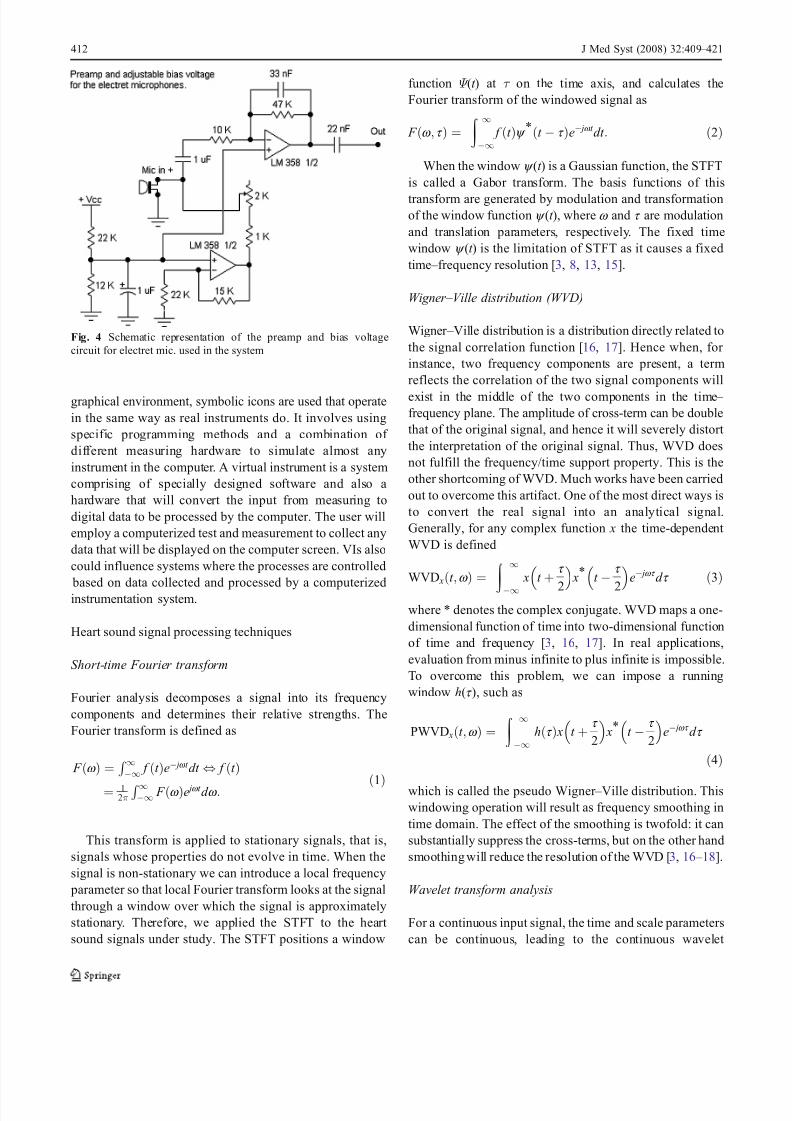
hardware components. As seen in Fig. 3, some of the heart
sounds were recorded by a self-produced electronic
stethoscope from 35 volunteers. Fourteen female and 21
male person in the 18 – 40 ages range are joined this study.
A heart sound of 15 s duration was measured successively
on four different auscultation areas as shown in Fig. 1. As
illustrated in Fig. 3, the measurements were taken with a
modified classical stethoscope (frequency bandwidth
20 Hz – 20 kHz), combined with NI hardware system.
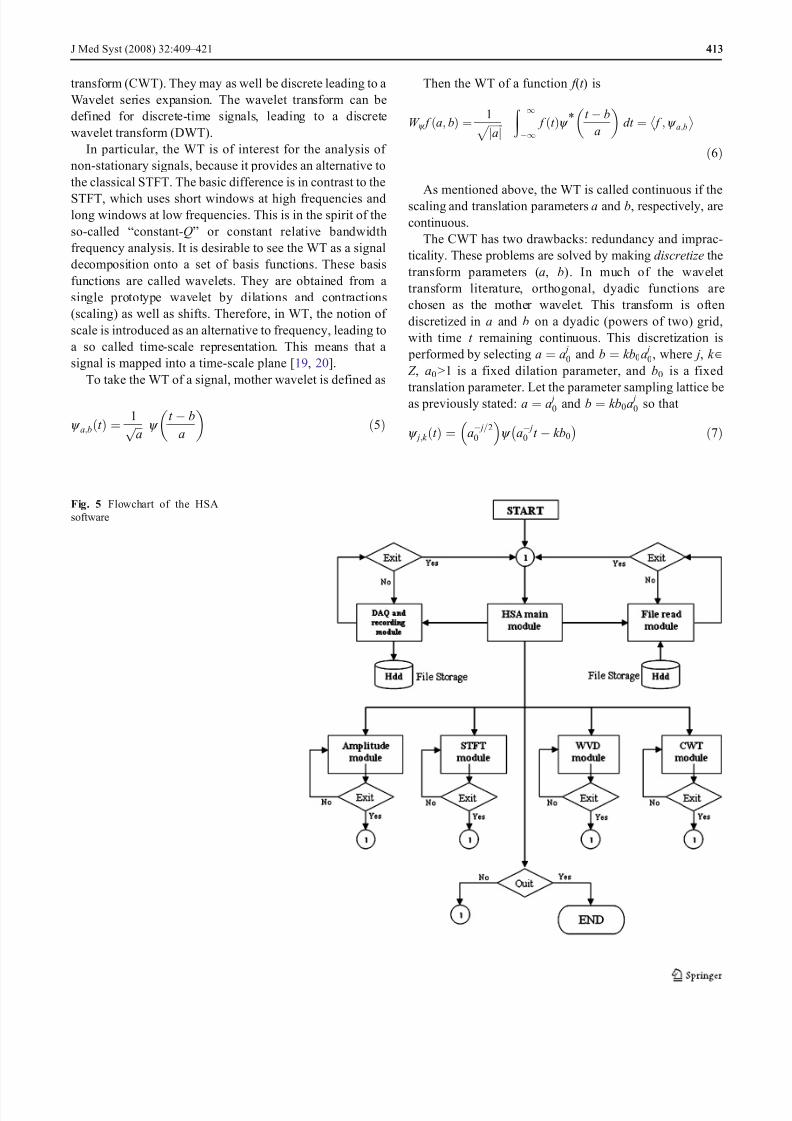
An electret microphone, preamplification and adjustable
bias voltage stages were used for classical stethoscope
modification and placed before NI hardware system as
shown in Fig. 4. Recordings were performed using self-developed measurement and analysis software based on
LABVIEW graphical programming language [13, 14]. The
DAQ card (PCI-MIO-16XE-10) can digitize the signal with
128 kHz sampling frequency/16-bit resolution. To extract
highly noisy signals with any audible disturbance from
heart sounds, dual modified stethoscope were used. One of
them acquired heart sounds and the other acquired medium
sounds (i.e, noise). Then, to achieve noise cancellation,
medium sounds extracted from heart sounds. Some abnor-
mal heart sounds collected from training CD-ROMs and
online clinical training websites are used for testing and
software validation [10 – 12].
Software
In this study, LabVIEW graphical programming language is
used. All self-produced software modules are developed
with LabVIEW development system. LabVIEW is a user
friendly and powerful graphical development environment
used for signal acquisition, measurement analysis, and data
presentation [14]. By incorporating LabVIEW, the results in
this work can be obtained faster, more precise and also
easier. A main component of LabVIEW is its ability tosimulate a virtual instrument (VI). The term “virtual
instrumentation” is used to represent a PC-based control
system which is used to acquire data from physical
transducers and then manipulate them in specific ways
using a very high level graphical environment. In the
Fig. 3 Block diagram of the data acquisition system
Fig. 2 Normal and abnormal
heart sounds representations
and pathophysiology of systolic
and diastolic murmurs
J Med Syst (2008) 32:409 – 421 411411
8/4/2019 Heart Sound With Wavelet
http://slidepdf.com/reader/full/heart-sound-with-wavelet 4/13
graphical environment, symbolic icons are used that operate
in the same way as real instruments do. It involves using
specific programming methods and a combination of
different measuring hardware to simulate almost any
instrument in the computer. A virtual instrument is a system
comprising of specially designed software and also a
hardware that will convert the input from measuring to
digital data to be processed by the computer. The user will
employ a computerized test and measurement to collect any
data that will be displayed on the computer screen. VIs also
could influence systems where the processes are controlled
based on data collected and processed by a computerizedinstrumentation system.
Heart sound signal processing techniques
Short-time Fourier transform
Fourier analysis decomposes a signal into its frequency
components and determines their relative strengths. The
Fourier transform is defined as
F wð Þ ¼ R 1À1 f t ð ÞeÀ j wt dt , f t ð Þ
¼ 12π
R 1À1 F wð Þe j wt d w: ð1Þ
This transform is applied to stationary signals, that is,
signals whose properties do not evolve in time. When the
signal is non-stationary we can introduce a local frequency
parameter so that local Fourier transform looks at the signal
through a window over which the signal is approximately
stationary. Therefore, we applied the STFT to the heart
sound signals under study. The STFT positions a window
function Ψ (t ) at τ on the time axis, and calculates the
Fourier transform of the windowed signal as
F w; t ð Þ ¼Z À1
1 f t ð Þy * t À t ð ÞeÀ j wt dt : ð2Þ
When the window y (t ) is a Gaussian function, the STFT
is called a Gabor transform. The basis functions of this
transform are generated by modulation and transformationof the window function y (t ), where w and t are modulation
and translation parameters, respectively. The fixed time
window y (t ) is the limitation of STFT as it causes a fixed
time – frequency resolution [3, 8, 13, 15].
Wigner – Ville distribution (WVD)
Wigner – Ville distribution is a distribution directly related to
the signal correlation function [16, 17]. Hence when, for
instance, two frequency components are present, a term
reflects the correlation of the two signal components will
exist in the middle of the two components in the time –
frequency plane. The amplitude of cross-term can be double
that of the original signal, and hence it will severely distort
the interpretation of the original signal. Thus, WVD does
not fulfill the frequency/time support property. This is the
other shortcoming of WVD. Much works have been carried
out to overcome this artifact. One of the most direct ways is
to convert the real signal into an analytical signal.
Generally, for any complex function x the time-dependent
WVD is defined
WVD x t ;w
ð Þ ¼ Z 1
À1 x t
þt
2 x* t
Àt
2 eÀ j wt d t
ð3
Þwhere * denotes the complex conjugate. WVD maps a one-
dimensional function of time into two-dimensional function
of time and frequency [3, 16, 17]. In real applications,
evaluation from minus infinite to plus infinite is impossible.
To overcome this problem, we can impose a running
window h(t ), such as
PWVD x t ;wð Þ ¼Z 1
À1h t ð Þ x t þ t
2
x* t À t
2
eÀ j wt d t
ð4Þ
which is called the pseudo Wigner – Ville distribution. This
windowing operation will result as frequency smoothing in
time domain. The effect of the smoothing is twofold: it can
substantially suppress the cross-terms, but on the other hand
smoothing will reduce the resolution of the WVD [3, 16 – 18].
Wavelet transform analysis
For a continuous input signal, the time and scale parameters
can be continuous, leading to the continuous wavelet
Fig. 4 Schematic representation of the preamp and bias voltage
circuit for electret mic. used in the system
412 J Med Syst (2008) 32:409 – 421
8/4/2019 Heart Sound With Wavelet
http://slidepdf.com/reader/full/heart-sound-with-wavelet 5/13
8/4/2019 Heart Sound With Wavelet
http://slidepdf.com/reader/full/heart-sound-with-wavelet 6/13
where j , k ∈Z. Hence we can express any f (t )∈ L2( R) as the
superposition
f t ð Þ ¼X
j
Xk
d j ;k y j ;k t ð Þ ð8Þ
where the wavelet coefficient is defined as
d j ;k ¼ f t ð Þ;y j ;k t ð ÞD E
¼ 1
aÀ j =20
Z f t ð Þy a
À j 0 t À kb0
À Ádt ð9Þ
The following is an analogy: assume that the wavelet
analysis is like a microscope. First, one chooses the
magnification, that is aÀ j 0 . Then one moves to the chosen
location. Now, if one looks at very small details, then the
chosen magnification is large and corresponds to j
negative and large. Then aÀ j 0 b0 corresponds to small steps,
which are used to catch small details. As a result,
particularly in researching cardiovascular abnormalities by
using heart sound signals, WT is very useful in the
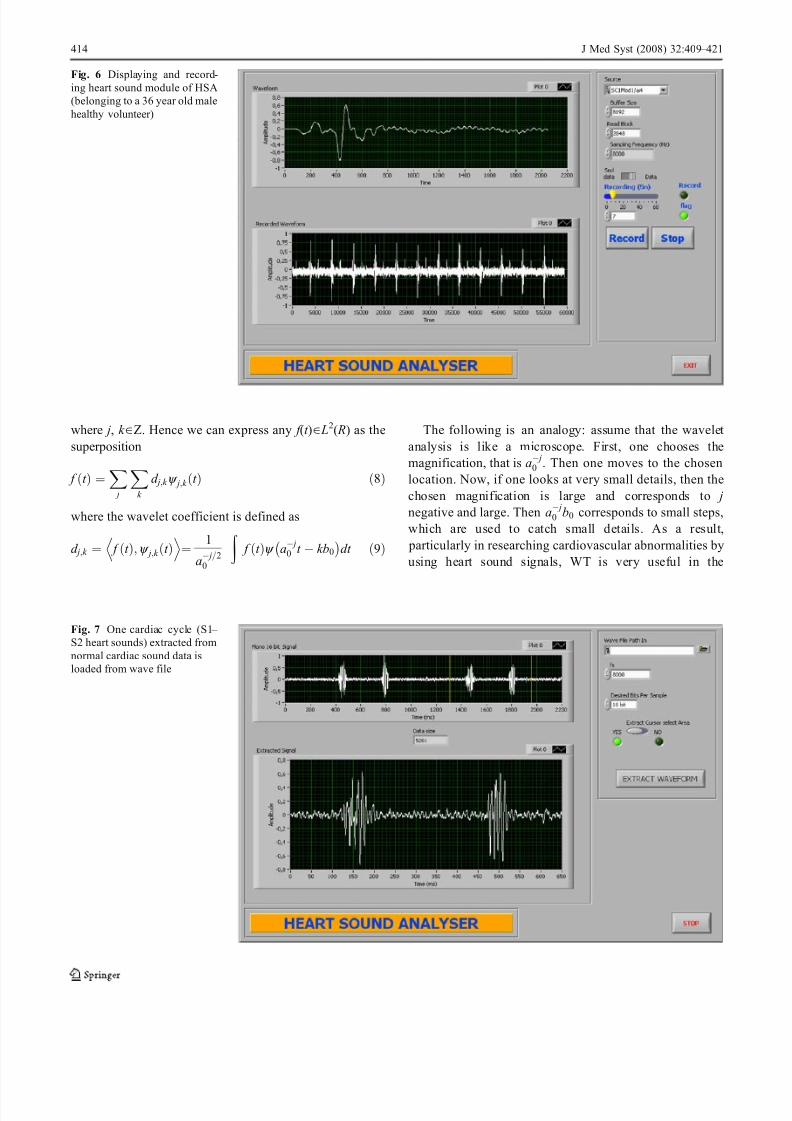
Fig. 6 Displaying and record-
ing heart sound module of HSA
(belonging to a 36 year old male
healthy volunteer)
Fig. 7 One cardiac cycle (S1 –
S2 heart sounds) extracted from
normal cardiac sound data is
loaded from wave file
414 J Med Syst (2008) 32:409 – 421
8/4/2019 Heart Sound With Wavelet
http://slidepdf.com/reader/full/heart-sound-with-wavelet 7/13
expression of discontinuities caused by recording apparatus
[6 – 8, 13, 15, 20].
Description of software and application results
A packet program, Heart Sound Analyzer (HSA), is
designed and developed upon the hardware with LabVIEW
programming language. The sofware is consist of two
sections: acquiring and recording of the displayed heart
sounds, and data analysis of the recorded heart sounds. All
program modules are developed and written in ourselves,
no LabVIEW addons are used. In the application of
program modules, aortic regurgitation (AR), mitral stenosis
(MS), ventricular septal defect (VSD), pulmonic stenosis
(PS) and normal (N) cardiac sounds are used. All defective
heart sound type arbitrarily chosen. Cardiac sounds data
obtained from 18 – 40 ages range volunteers, internet and
cardiac auscultation training CD-ROMs [10 – 12].
Heart sound analyzer software
In Fig. 5, Software running hierarchy is shown as
flowchart. Acquired heart sound data can be recorded to
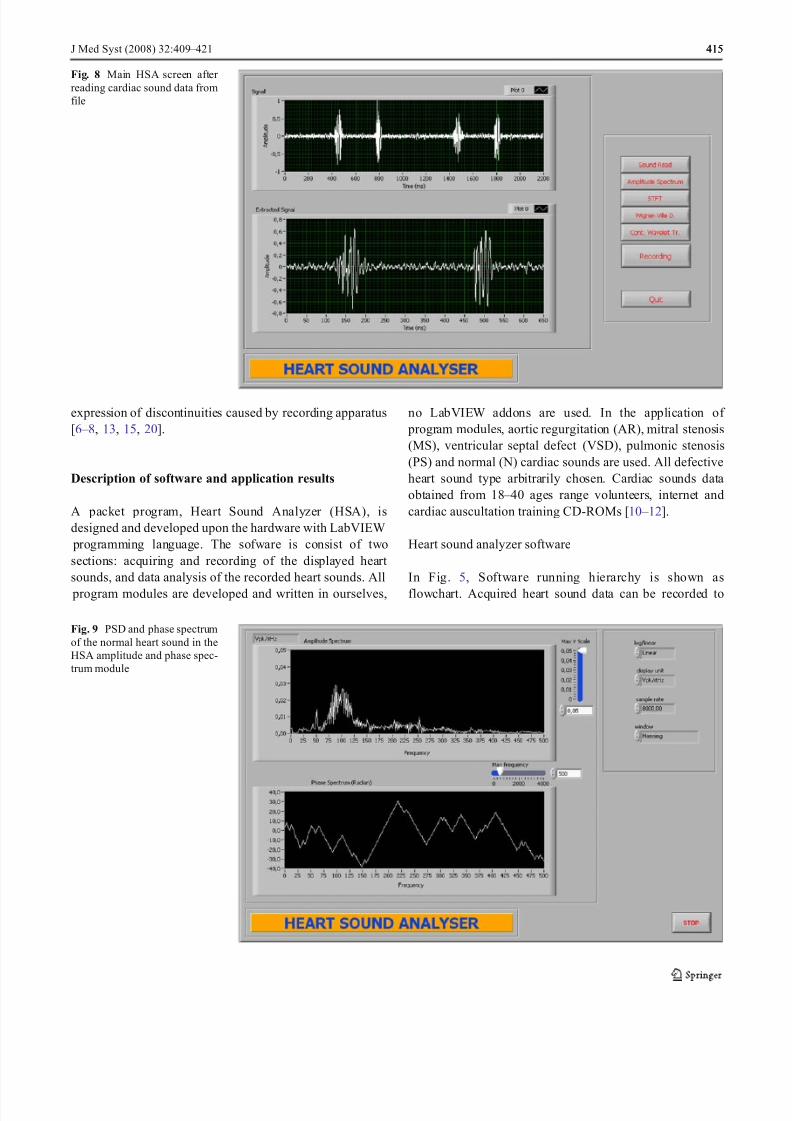
Fig. 8 Main HSA screen after
reading cardiac sound data from
file
Fig. 9 PSD and phase spectrum
of the normal heart sound in the
HSA amplitude and phase spec-
trum module
J Med Syst (2008) 32:409 – 421 415415
8/4/2019 Heart Sound With Wavelet
http://slidepdf.com/reader/full/heart-sound-with-wavelet 8/13
hardisk and loaded from harddisk for data analysis as well
as other heart sound data. All modules are called from HSA
main module and will be explained following sections
Displaying and Recording Heart sounds With modified
stethoscope, acquired heart sounds from healthy and
unhealthy person, as digitized by DAQ card are displayed
and also can be recorded if it is desired. In this work,sampling frequency and recording interval are conveniently
adjustable. Sampling frequency is selected as 8 kHz which
is sufficient to digitize the heart sound data. In the HSA
module, heart sound data can be recorded both in wav and
txt file formats. In Fig. 6, it is seen the heart sound
recording belonging to a 36 year old male healthy
volunteer.
Analysis of the Cardiac Sounds In these HSA modules,PSD, STFT, WVD and CWT analyses are made as offline.
a S1 S2
normal cardiac sound normal cardiac sound
S1 S1
c
A2
P2
A m p l i t u d e
(Hz)
b
M1
T1
A m p l i t u d e
(Hz)
S2 S2
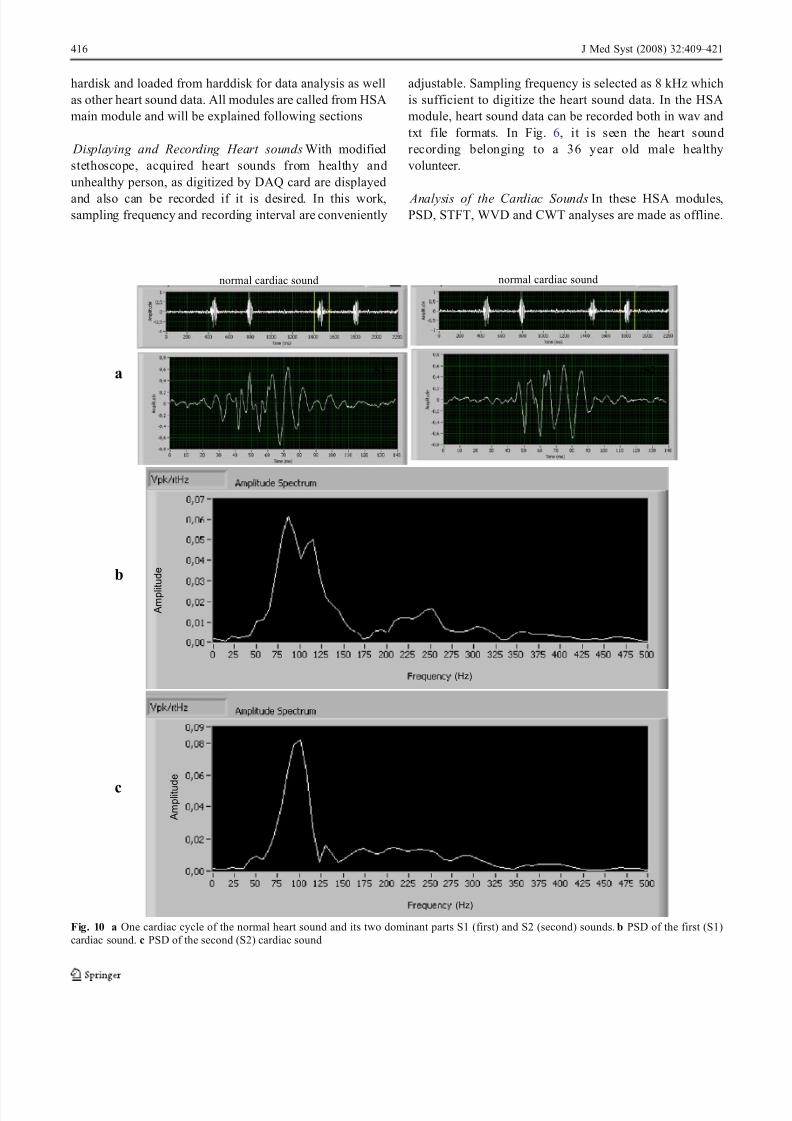
Fig. 10 a One cardiac cycle of the normal heart sound and its two dominant parts S1 (first) and S2 (second) sounds. b PSD of the first (S1)
cardiac sound. c PSD of the second (S2) cardiac sound
416 J Med Syst (2008) 32:409 – 421
8/4/2019 Heart Sound With Wavelet
http://slidepdf.com/reader/full/heart-sound-with-wavelet 9/13
Recorded data are loaded from file and then processed.
Amplitude and phase functions, spectrograms and scalo-
grams of the heart sounds are linearly plotted by HSA.
Read data from file Recorded heart sound data are loaded
as array from wave or text file for time – frequency analysis.
Sound data are divided by the maximum value of the array
thus scaled [−1,1] data range. The reading heart sound data
from file HSA module is shown in Fig. 7. As it is seen, any
portion of data remaining between two cursors can be
extracted from the signal waveform. Both signal waveform
and extracted waveform are transported to main HSA
screen as in Fig. 8. Then, extracted waveform part is used
for analyses.
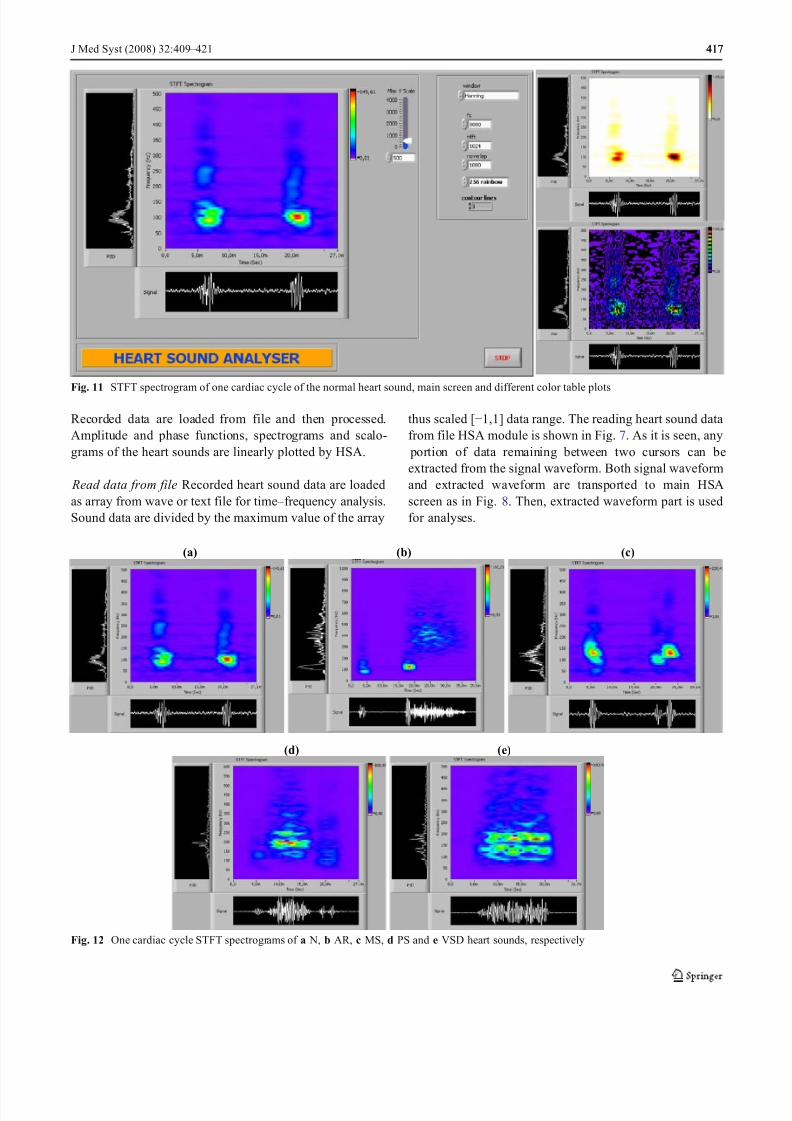
Fig. 11 STFT spectrogram of one cardiac cycle of the normal heart sound, main screen and different color table plots
(a) (b) (c)
(d) (e)
Fig. 12 One cardiac cycle STFT spectrograms of a N, b AR, c MS, d PS and e VSD heart sounds, respectively
J Med Syst (2008) 32:409 – 421 417417
8/4/2019 Heart Sound With Wavelet
http://slidepdf.com/reader/full/heart-sound-with-wavelet 10/13
Amplitude and phase spectrum HSA module application
HSA amplitude and phase spectrum modules are shown in
Fig. 9. Log/linear input specifies linear or log spectrum
output. Display unit selection is the output unit for the
spectrum. Display unit can be set to one of the values listedin the display unit section such as amplitude spectral
density and power spectral density (PSD).
In window section, many well-known window types
such as Hanning, Hamming, Blackman, Blackman – Harris,
Gaussian etc. are listed. Window selection specifies
information about the window and it is used to eliminate
the spectral leakage while computing amplitude and power
spectrum.
The cardiac sound signal is clearly contained two
principal sounds (S1 and S2) as is demonstrated in
Fig. 10a. The FFT can be applied to the normal first and
second sounds to analyse the frequency spectrum as shown
in Fig. 10 b and c. A 1,024 point FFT is applied with
window function. The two internal components for thecardiac sound S1 (M1 and T1) and the two components A2
and P2 of the sound S2 are apparent in Fig. 10 b and c, but
FFT analysis cannot give the time delay between these
internal components. Therefore, the conventional FFT and
PSD are unable to diagnose heart diseases accurately.
Hence, it is necessary to seek a transform which is named
time-varying spectrum. The WVD can give better results
under the same conditions and same sampling rate [8, 18].
Cross-terms
S1 S2 S1 S2
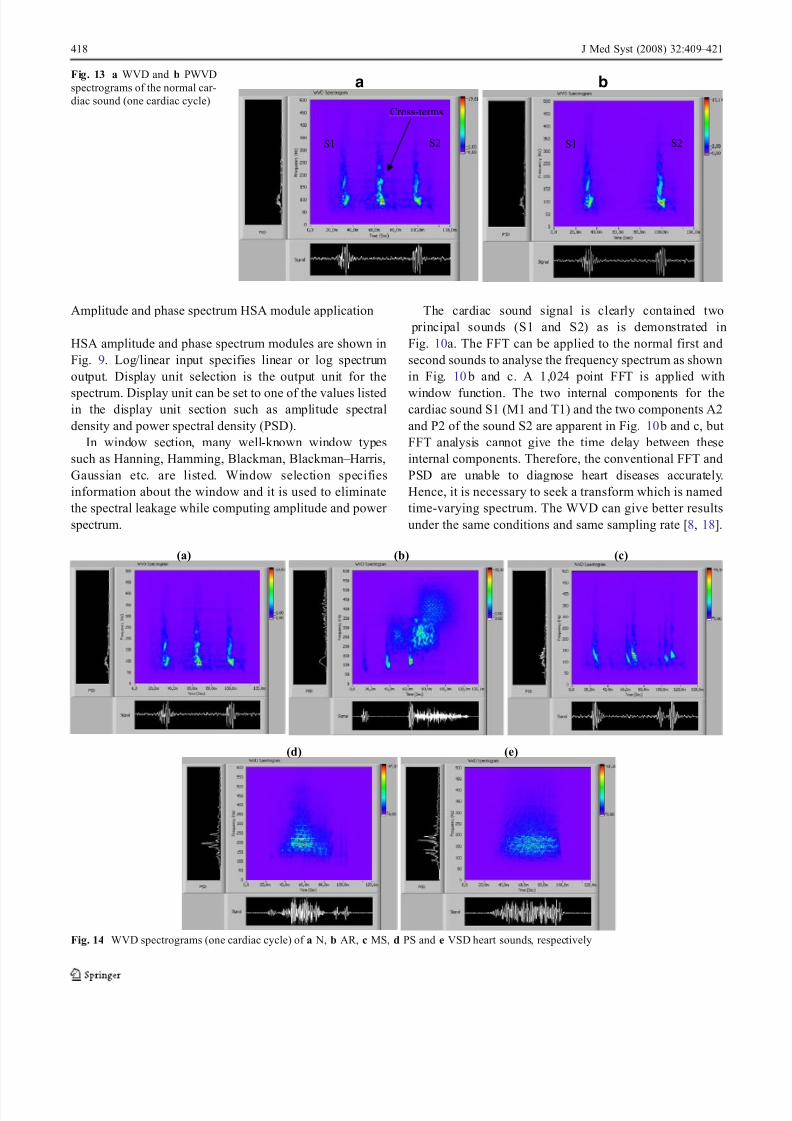
a bFig. 13 a WVD and b PWVD
spectrograms of the normal car-
diac sound (one cardiac cycle)
(a) (b) (c)
(e)(d)
Fig. 14 WVD spectrograms (one cardiac cycle) of a N, b AR, c MS, d PS and e VSD heart sounds, respectively
418 J Med Syst (2008) 32:409 – 421
8/4/2019 Heart Sound With Wavelet
http://slidepdf.com/reader/full/heart-sound-with-wavelet 11/13
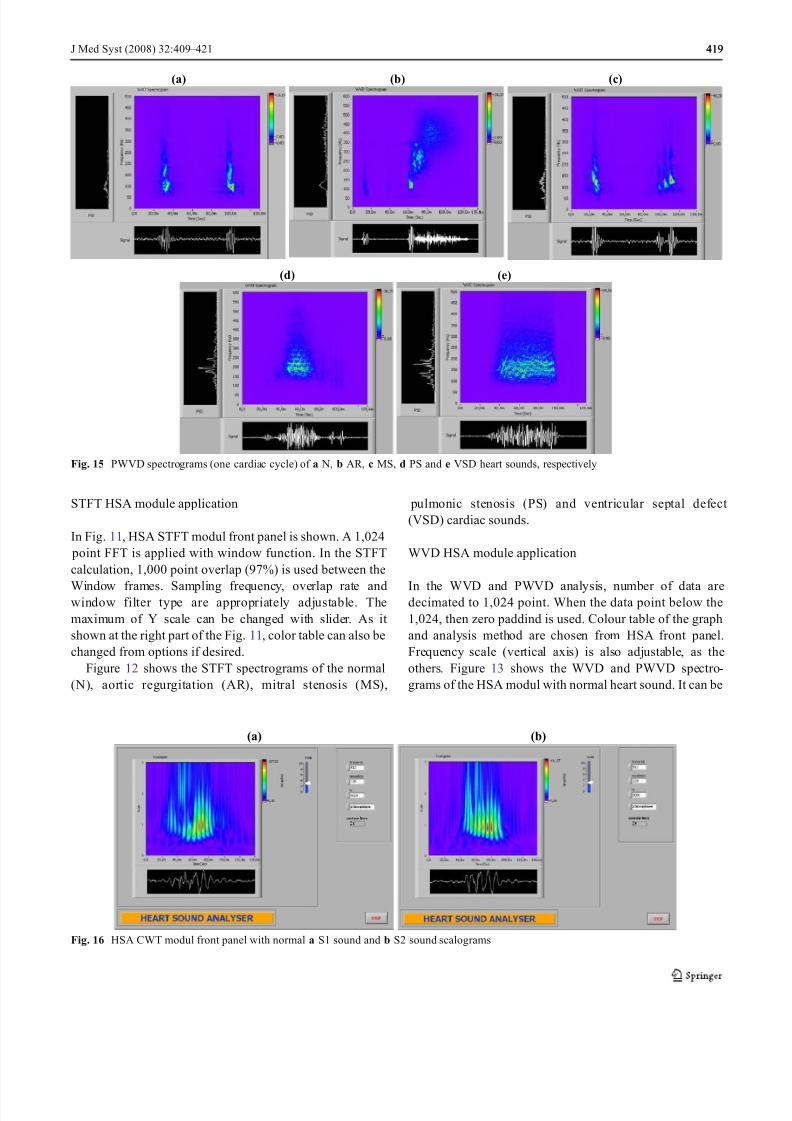
STFT HSA module application
In Fig. 11, HSA STFT modul front panel is shown. A 1,024
point FFT is applied with window function. In the STFT
calculation, 1,000 point overlap (97%) is used between the
Window frames. Sampling frequency, overlap rate andwindow filter type are appropriately adjustable. The
maximum of Y scale can be changed with slider. As it
shown at the right part of the Fig. 11, color table can also be
changed from options if desired.
Figure 12 shows the STFT spectrograms of the normal
(N), aortic regurgitation (AR), mitral stenosis (MS),
pulmonic stenosis (PS) and ventricular septal defect
(VSD) cardiac sounds.
WVD HSA module application
In the WVD and PWVD analysis, number of data aredecimated to 1,024 point. When the data point below the
1,024, then zero paddind is used. Colour table of the graph
and analysis method are chosen from HSA front panel.
Frequency scale (vertical axis) is also adjustable, as the
others. Figure 13 shows the WVD and PWVD spectro-
grams of the HSA modul with normal heart sound. It can be
(a) (b) (c)
(e)(d)
Fig. 15 PWVD spectrograms (one cardiac cycle) of a N, b AR, c MS, d PS and e VSD heart sounds, respectively
(a) (b)
Fig. 16 HSA CWT modul front panel with normal a S1 sound and b S2 sound scalograms
J Med Syst (2008) 32:409 – 421 419419

8/4/2019 Heart Sound With Wavelet
http://slidepdf.com/reader/full/heart-sound-with-wavelet 12/13
noticed that it is difficult to discern the sound S1 and soundS2 as seen in Fig. 13a. because of the cross-terms. With the
Gaussian filtering which can assist to suppress the cross-
terms (PWVD), as it is seen in Fig. 13 b, both main
components S1 and S2 sounds of the cardiac cycle are
appeared clearly. WVD and PWVD methods results may be
improved by increasing the sampling rate of original signal
or using different filtering type, but it may be still possible
to see the cross-term effects because of the nonlinearity of
the WVD. The WVD and PWVD analysis applied to heart
sound signal and they provides high time-and frequency-
resolution in spectral analysis.
In Figs. 14 and 15, applications of the WVD andPWVD methods on the normal (N), aortic regurgitation
(AR), mitral stenosis (MS), pulmonic stenosis (PS) and
ventricular septal defect (VSD) heart sounds are shown
respectively.
CWT HSA module application
HSA CWT module is shown in Fig. 16 with two principal
component S1 and S2 sounds of the normal heart sound. To
achieve CWT, the Morlet function is used as a mother wavelet. This is a smooth, symmetric and having a
compact support properties wave [9, 13, 20]. Five hundred
twelve point data frame has been used in CWT calculations
(W nop N1). One hundred twenty-eight point scale
resolution is applied. Color table of the graph and scale
maximum can be changed conveniently.
As seen in Fig. 16a and b the time delays between M1
and T1 components for the sound S1 and A2 and P2 for the
sound S2 these internals components can be easily
measured by the experts. The wavelet transform permits
us to estimate and determine this time difference easily [8,
9, 13].Figure 17 shows the continuous wavelet transform of the
selected heart sounds ((a) N, (b) AR, (c) MS, (d) PS and (e)
VSD heart sounds, respectively.). In one cardiac cycle of
the normal heart beat sound, the first S1 and the second S2
(Fig. 17a) sounds are clearly observed with CWT method
scale-time representation.
All results were compared, and it was determined that
the STFT was more applicable for real-time processing of
heart sound signals, because of its short process time.
(a) (b) (c)
(d) (e)
Fig. 17 CWT scalograms (one cardiac cycle) of a N, b AR, c MS, d PS and e VSD heart sounds, respectively
420 J Med Syst (2008) 32:409 – 421
8/4/2019 Heart Sound With Wavelet
http://slidepdf.com/reader/full/heart-sound-with-wavelet 13/13
However, the WVD and CWT had good resolution and
performance high enough for use in clinical and research
settings. Especially CWT was the best frequency – time
characteristic over the counterparts.
Conclusion
LabVIEW is a very powerful tool for data acquisition.
LabVIEW has benefit specifications such as flexibility,
future improvement, and fast software development. Data
acquired can be easily manipulated and processed to further
gain a more detailed analysis. It is customizable easily to
include any improvements to the virtual instrument as seen
necessary.
In this paper a time – frequency spectral analysis modules
for the computer-aided analysis of heart sounds has been
developed with LabVIEW. The HSA modules exhibits
important information of cardiovascular disorders and can
assist general physicians to come up with more accurate andreliable diagnosis at early stages. It can overcome the
deficiency of expert doctors and help them in rural as well
as urban clinics and hospitals. The software has two main
blocks: data acquisition and pre-processing part and time –
frequency spectral analysis modules. The heart sounds are first
acquired and recorded using a modified stethoscope which has
an electret microphone in it. Then the signals are analysed
using the time – frequency/scale spectral analysis techniques
such as STFT, Wigner – Ville distribution and wavelet trans-
form. All modules have been tested with real heart sounds
from 35 volunteers, heart sounds data form internet and
training CD-ROMs and has proved to be quite efficient and
robust while dealing with a large variety of pathological
conditions. Examples of the normal (N), aortic regurgitation
(AR), mitral stenosis (MS), pulmonic stenosis (PS) and
ventricular septal defect (VSD) cardiac sounds are presented.
Acknowledgements This study has been supported by the Scientific
and Research Projects Department of Gazi University (BAP, Project
no: 07/2007-07).
References
1. Karnath, B., and Thornton, W., Review of clinical signs:
Auscultation of the heart. Hospital Physician. 38(9):39 – 43,
2002, (September).
2. Tavel, M., Cardiac auscultation: A glorious past — but does it have
a future? Circulation. 93:1250 – 1253, 1996.
3. Akay, M., Time frequency and wavelets in biomedical signal
processing. Series in biomedical engineering . IEEE Press, New
York, pp. 271 – 301, 1997.
4. Obaidat, M. S., Phonocardiogram signal analysis: techniques and
performance comparison. Journal of Medical Engineering &
Technology. 17:221 – 227, 1993.
5. Jandre, F. C., & Souza, M. N., Wavelet Analysis of Phonocardio-
grams: Differences between Normal and Abnormal Heart sounds,Proceedings — 19th International Conference — IEEE/EMBS
4:1642 – 1644, Chicago IL, USA, 1997
6. Novak, P., and Novak, V., Time/frequency mapping of the heart
rate, blood pressure and respiratory signals. Medical & Biological
Engineering & Computing . 31:103 – 110, 1993.
7. Debbal, S. M., and Bereksi-Reguig, F., Automatic measure of the
split in the second cardiac sound by using the wavelet transform
Technique. Computers in Biology and Medicine. 37:269 – 276,
2007.
8. Debbal, S. M., and Bereksi-Reguig, F., Time – frequency analysis
of the first and the second heartbeat sounds. Applied Mathematics
and Computation. 184:1041 – 1052, 2007.
9. Debbal, S. M., and Bereksi-Reguig, F., Analysis of the second
heart sound using continuous wavelet transform. Journal of
Medical Engineering & Technology. 28:151 – 156, 2004.
10. Nakao, K., Online bed side learning: Heart sound auscultation,
http://www.medic.mie-u.ac.jp/student/sinnzou.html.
11. Sawayama, T., Auscultation training by CD: Heart Sound .
Nankodo, Japan, 1994.
12. University of Wales College of Medicine (UWCM)’s Database,
http://mentor.uwcm.ac.uk:11280/aspire/ .
13. K ıymık, M. K., Güler, İ., Dizibüyük, A., and Ak ın, M.,
Comparison of STFT and Wavelet transform methods in deter-
mining epileptic seizure activity in EEG signals for real-time
application. Computers in Biology and Medicine. 35:603 – 616,
2005.
14. Johnson, G. W., LabView graphical programming: practical
applications in instrumentation and control , 2nd edition.
McGraw-Hill, New York, 1997.
15. Bulgrin, J. R., Rubal, B. J., Thompson, C. R., and Moody, J. M.,
Comparison of short-time Fourier, Wavelet and time domain
analyses of intercardiac sounds. Biomedical Sciences Instrumen-
tation. 29:465 – 472, 1993.
16. Hlawatsch, F., and Flandrin, P., The interference structure of
the Wigner distribution and related time – frequency signal repre-
sentations. In: MecklenbraukerW., and HlawatschF. (Eds.), The
Wigner distribution — theory and applications in signal processing
Elsevier, New York, pp. 59 – 133, 1997.
17. Qian, S., and Chen, D. P., Joint time – frequency analysis. IEEE
Signal Processing Magazine. 16(2):52 – 67, 1999, Mar.
18. Kudriavtsev, V., Polyshchuk, V., and Roy, D. L., Heart energy
signature spectrogram for cardiovascular diagnosis. BioMedical
Engineering OnLine. 6:16, 2007, (May).
19. Daubechies, I., Ten lectures on wavelets. Society for Industrial
and Applied Mathematics, Philadelphia, PA, USA, 1992.
20. Olivier, R., and Duhamel, P., Fast algorithms for discrete and
continuous wavelet transforms. IEEE Transactions on Information
Theory. 38(2):569 – 586, 1992.
J Med Syst (2008) 32:409 – 421 421421
![ISSN: 1992-8645 HEART SOUND ANALYSIS USING LABVIEW · 2013-01-05 · Fig.1 Heart sounds [7] 2. METHODOLOGY 2.1 Sample Data Collection Data used in this study are five heart sound](https://img.pdfslide.us/doc/110x75/5f0f045b7e708231d442132e/issn-1992-8645-heart-sound-analysis-using-2013-01-05-fig1-heart-sounds-7-2.jpg)