Embed Size (px)
Citation preview

HEALTH TRANSITION AND ECONOMIC GROWTH IN SRI LANKA
LESSONS OF THE PAST AND EMERGING ISSUES
Dr. Godfrey Gunatilleke, Sri Lanka

How the Presentation is Organized
• An Overview of the Health Transition in Sri Lanka.• The Special Features of the Transition • How the Transition is Achieved -The Links between
Health , Productivity,Poverty Reduction and EconomicGrowth
• The Residual Problems of the Transition.• The Emerging Challenges for Economic Growth and
Health .• The Role and contribution of the NGOs in Managing the
Health Transition

Overview of the Health Transition in Sri Lanka.
A Snap Shot of the Transition.- 1950-2000
Selected Health –related Indicators 1950 - 2000.
Changing Disease Profile 1950 1975 1999

22.33.45•Total Fertility Rate
17.319.929.440.4•Crude Birth Rate
0.230.421.55.6•Maternal Mortality per live birth
15.419.547.582.3•Infant Mortality
737265.655.6•Life Expectancy
2000199019701950
Health Indicators in Sri Lanka
1950-2000

0
10
20
30
40
50
60
70
80
90
1950 1970 1990 2000Year
Figu
res
Life Expectancy
Infant Mortality
Maternal Mortality per live birth
Crude Birth Rate
Total Fertility Rate
Health Indicators
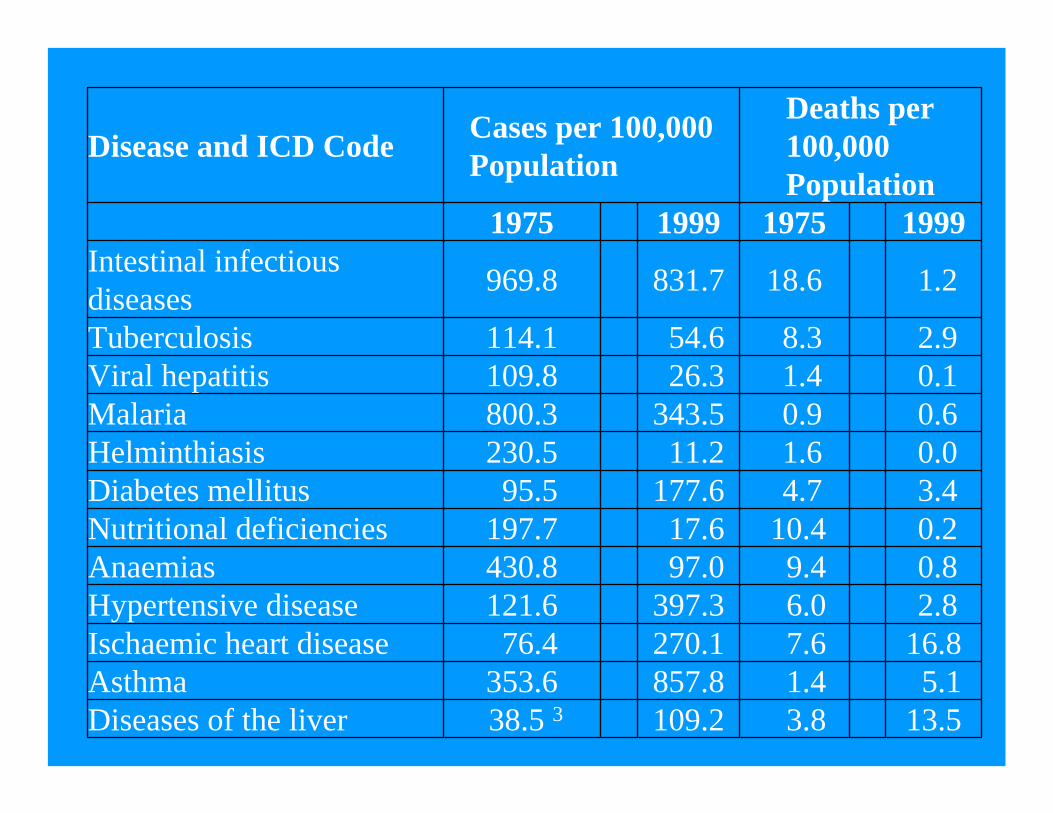
13.53.8109.238.5 3Diseases of the liver 5.11.4857.8353.6Asthma
16.87.6270.176.4Ischaemic heart disease 2.86.0397.3121.6Hypertensive disease 0.89.497.0430.8Anaemias 0.210.417.6197.7Nutritional deficiencies 3.44.7177.695.5Diabetes mellitus 0.01.611.2230.5Helminthiasis 0.60.9343.5800.3Malaria 0.11.426.3 109.8Viral hepatitis 2.98.354.6114.1Tuberculosis
1.218.6831.7969.8Intestinal infectious diseases
1999197519991975
Deaths per 100,000 Population
Cases per 100,000 PopulationDisease and ICD Code

1975 Cases per 100000 Population
27%
3%
3%
23%7%
3%
6%
12%
3%
2%
10% 1%
1999 Cases per 100,000 population
26%
2%
1%
11%
0%
6%
1%
3%
12%
8%
3%
27%
Intestinal infectionsdiseases (A00-A09)
Tuberculosis (A15-A19)
Viral hepatitis (B15-B19)
Malaria (B50-B54)
Helminthiasis (B76,B77,B79,B80)
Diabetes mellitus (E10-E14)
Nutritional deficiencies(E40-E46,E50-E56)
Anaemias (D50-D64)
Hypertensive disease (110-115)
Ischaemic heartdisease (120-125)Asthma (J45)
Diseases of the liver (K70-K76)

1975 Deaths per 100,000 Population
26%
11%
2%
1%
2%
6%
14%
13%
8%
10%
2%
5%
1999 Deaths per 100000 Population
3%
6%
0%
1%
0%
7%
0%
2%
6%
36%
11%
28%
Intestinal infectionsdiseases (A00-A09)Tuberculosis (A15-A19)
Viral hepatitis (B15-B19)Malaria (B50-B54)Helminthiasis (B76,B77,B79,B80) Diabetes mellitus (E10-E14)
Nutritional deficiencies(E40-E46,E50-E56)Anaemias (D50-D64)Hypertensive disease (110-115)Ischaemic heart disease (120-125)
Asthma (J45)Diseases of the liver (K70-K76)
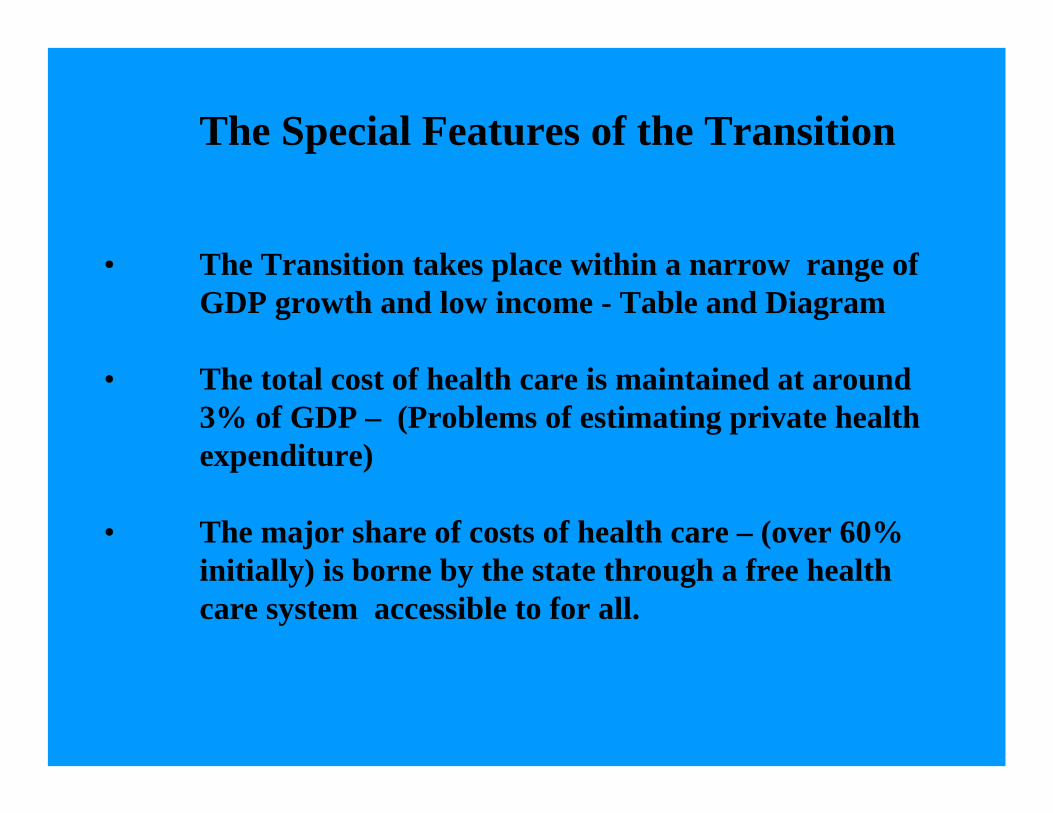
The Special Features of the Transition
• The Transition takes place within a narrow range of GDP growth and low income - Table and Diagram
• The total cost of health care is maintained at around 3% of GDP – (Problems of estimating private health expenditure)
• The major share of costs of health care – (over 60% initially) is borne by the state through a free health care system accessible to for all.

856713245115
• Per Capita in GDP US$ at current exchange rates
64,88536,5451,903550
• Per Capita GDP in current prices Rs.
1,255.00661,90025,6914,224• GDB in current prices Rs.
2000199519751950
Economic Indicators
1950-2000

23.91950-95
45.31990-1995
1.573.11985-1989
4.265.951978-1984
1.062.621971-1977
2.124.511965-1970
02.51956-1964
1.654.251950-1955
GDP Per CapitaGDP
Average Annual Growth RateYear
GDP & GDP Per Capita at 1970 Constant Prices 1950-1995

How did we Achieve the Health transition?The Main Elements of the Strategy that
Produced the Health Transition The state and public health initiatives play the major role Priority is given to -
The control of major parasitic and infectious diseases
Maternal and and child health
The health transition becomes an integral part of
broad social and economic changes.

9385•Households with toilets
•Sanitation
7770•Water Protected sources
Living Conditions
1719•Low Birth Weight
293758•Child Malnutrition under 5 yrs.
7.714.419•Unemployment28303260•Head count
Poverty (rural)91.8-87.265.4•Total89.4-83.253.4• Female
94.3-91.175.9• MaleLiteracy
2000199019751950
Other Socio-Economic Indicators
Free education improves
• Status of Women
• Knowledge of health care
• Reproductive health
• Food Subsidy
• Supports households with nutritional supplement.
• Reduces ill health caused by malnutrition
Agricultural growth is closely linked to poverty reduction through -
Distribution of state land for small scale rice production and housing of the poor.
Settlement of landless poor on newly developed agricultural schemes.
State Research and Extension services for increase of productivity in small scale rice farming.
Promotion of small scale fisheries.
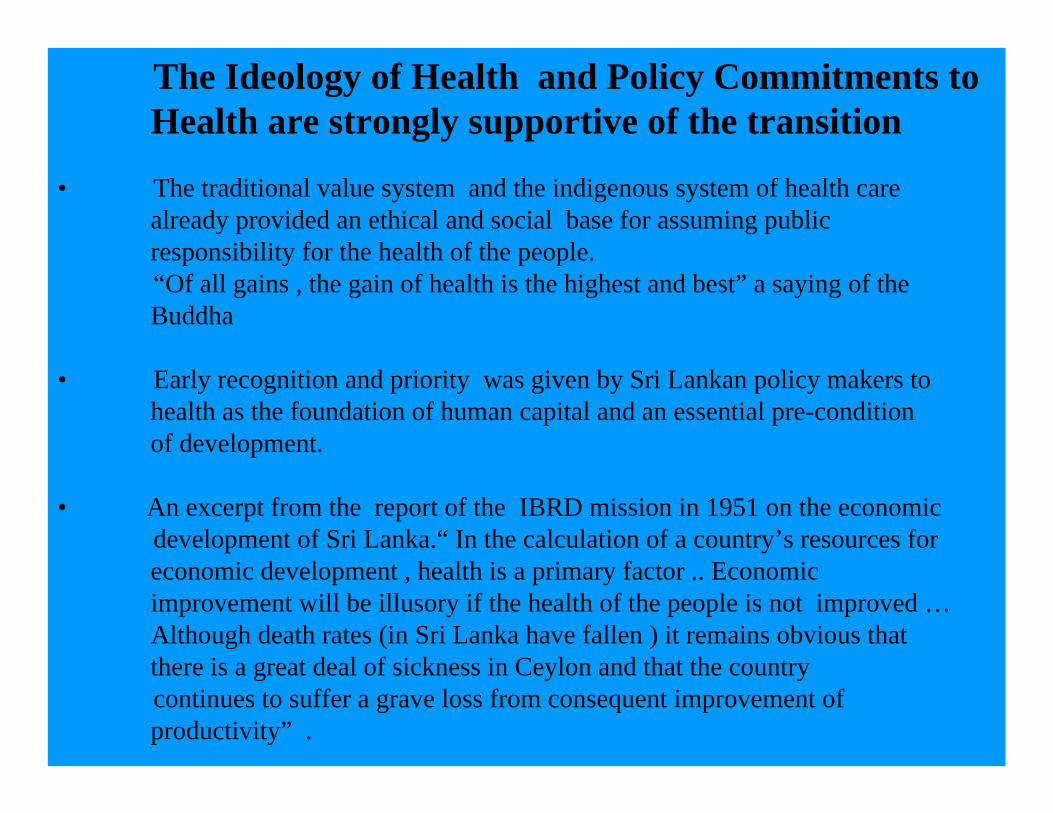
The Ideology of Health and Policy Commitments toHealth are strongly supportive of the transition
• The traditional value system and the indigenous system of health care already provided an ethical and social base for assuming publicresponsibility for the health of the people. “Of all gains , the gain of health is the highest and best” a saying of theBuddha
• Early recognition and priority was given by Sri Lankan policy makers to health as the foundation of human capital and an essential pre-conditionof development.
• An excerpt from the report of the IBRD mission in 1951 on the economic development of Sri Lanka.“ In the calculation of a country’s resources for economic development , health is a primary factor .. Economicimprovement will be illusory if the health of the people is not improved …Although death rates (in Sri Lanka have fallen ) it remains obvious thatthere is a great deal of sickness in Ceylon and that the country continues to suffer a grave loss from consequent improvement ofproductivity” .

Links between Health and Growth
• The early phase of development in Sri Lanka is therefore astriking example of the indivisible link between health –poverty reduction -productivity – and economic growth.
• Productivity and output had to be increased in a sector of theeconomy which was most backward and where poverty,disease and illiteracy was highest.
• The control of disease, protection of health, education and food security became essential for achieving the development goals.
• The control of malaria and the improvement of the health infrastructure and a healthy agricultural workforce was crucial to the success of the agricultural programme.
• Growth was highest in the Poorest Segments of the Economy – peasant agriculture , fisheries. (1950- 1977).
Diagram.
33.937.428.0340.6Highest
15.514.914.9213.29th
11.511.411.6510.18th
9.28.699.918.37th
7.77.378.756.96th
6.46.017.456.45th
5.54.996.515.24th
4.54.095.64.13rd
3.63.134.383.32nd
2.11.932.791.9Lowest
1996/971986/8719731953Decile
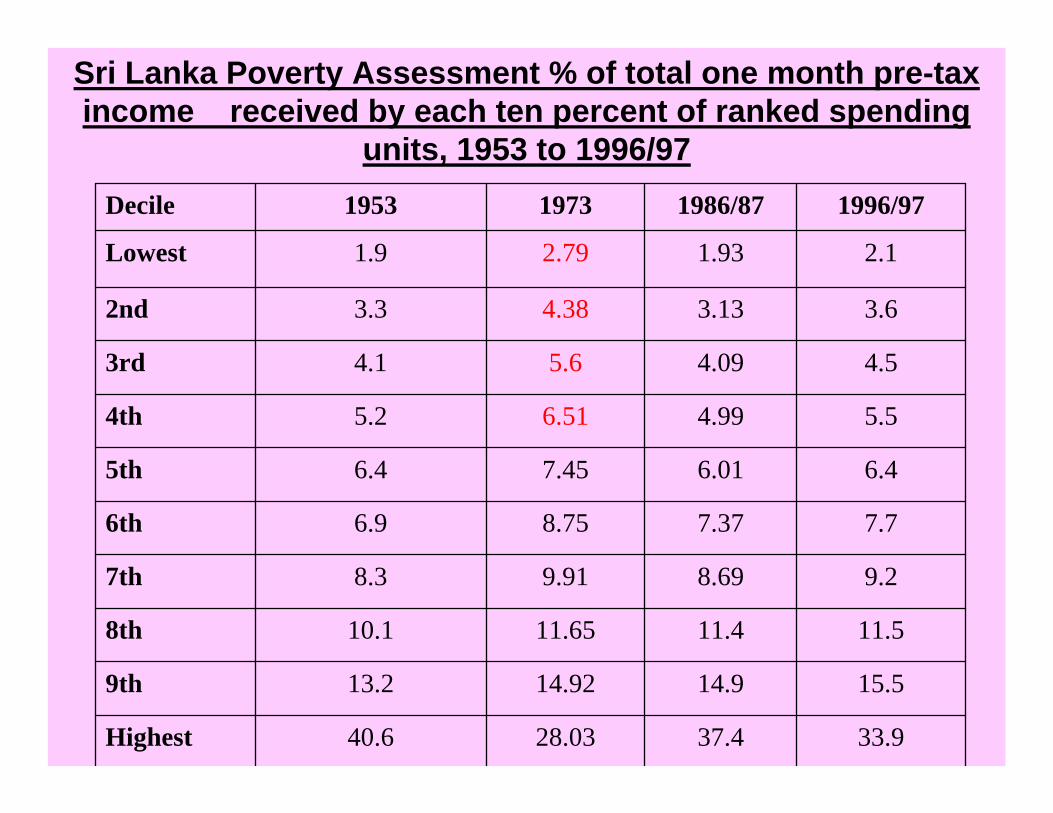
Sri Lanka Poverty Assessment % of total one month pre-tax income received by each ten percent of ranked spending
units, 1953 to 1996/97

1953 1973 1986/87 1996/97
Year
Highest9th8th7th6th5th4th3rd2ndLowest
Dec
iles
Sri Lanka Poverty Assessment % of total one month pre-tax income received by each ten percent of ranked spending
units, (1953-1996/97)

The Residual Problems Accompanying the Health Transition.
• The Persistence of Poverty
Child and Maternal Malnutrition remains high in the context of reduction of mortality and prolongation of life
• Relatively High rate of Neo-natal mortality
• Regional inequality
• High Survival and Life Expectancy without Corresponding Rise in the Quality of life
• Chronic Ill health Coexists with Poverty.
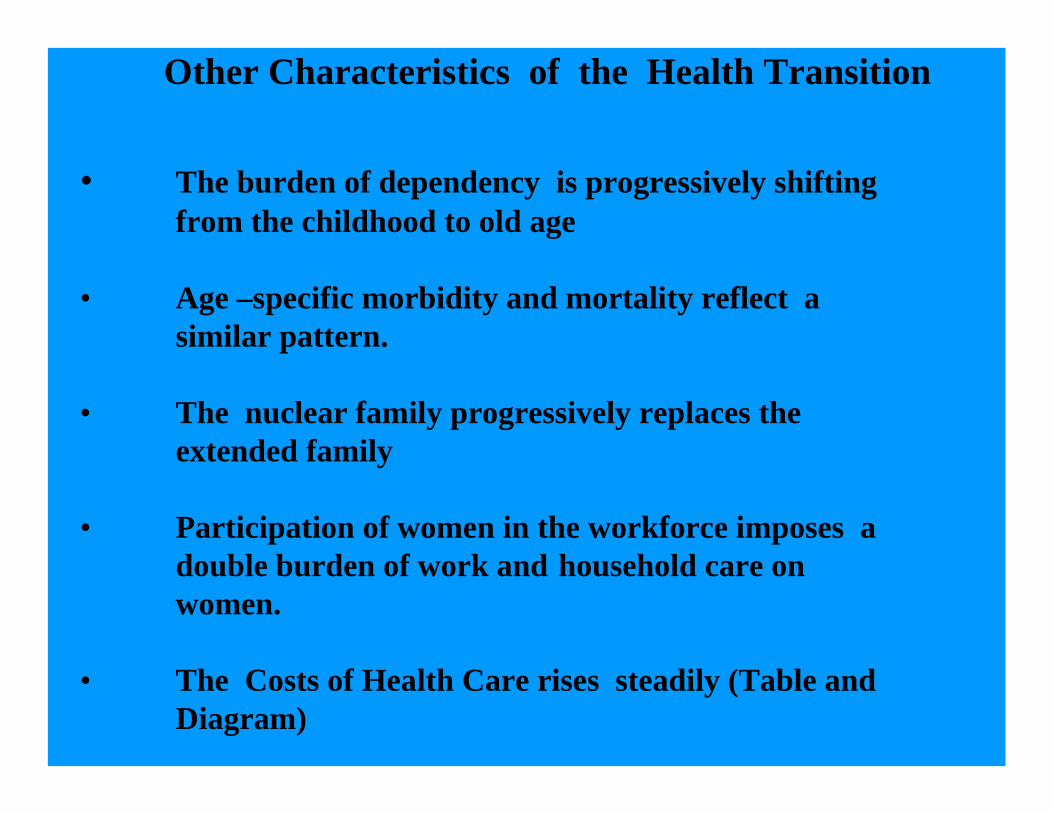
Other Characteristics of the Health Transition
• The burden of dependency is progressively shiftingfrom the childhood to old age
• Age –specific morbidity and mortality reflect a similar pattern.
• The nuclear family progressively replaces the extended family
• Participation of women in the workforce imposes adouble burden of work and household care on women.
• The Costs of Health Care rises steadily (Table andDiagram)

497387122140•Mean household income in US$
1828415393•Exchange rate Rs. per US$ 1
642785808690921•Median household income real
8811195112511771432•Mean household income real
338569106618593077•CCPI (average for the survey period)
6557.664.654.443.8•Food Ratio (percentage)
3680148309575•Personal care and health
8011198252135526016•Food and drink
123220793905652513733•Expenditure (per month per household)
80/8185/8690/9195/962002Description
Survey period
Household Income & Expenditure Survey

327432427511575Real expenditure on personal care and health
2.9223.8483.7904.7354.186Personal care and health(% of Expenditure)
3680148309575Personal care and health( per Month per household Rs)
123220793905652513733Expenditure (per month per household Rs)
80/8185/8690/9195/962002Survey periodDescription

• The Health Care System has been successful in taking the population through the first phase of the transition at a cost which by international standards is unusually low.
• The system during the health transition was essentially designed for the control of infectious and parasitic diseases and child and maternal health.
• It is not fully equipped to deal with the health care needs of the emerging disease pattern across income groups as it was able to do in the past
• The Emerging Disease profile of chronic illnesses requires major adjustments in health care at the national and household level –
The changing Roles of
• Patient and physician - the need for more health knowledge and self care
• Medical institution and home - management of disease at household level
• Medication and health behaviour - the crucial importance of lifestyles, diet, exercise
• Control and cure - the vital role of recognition of early symptoms and early diagnosis
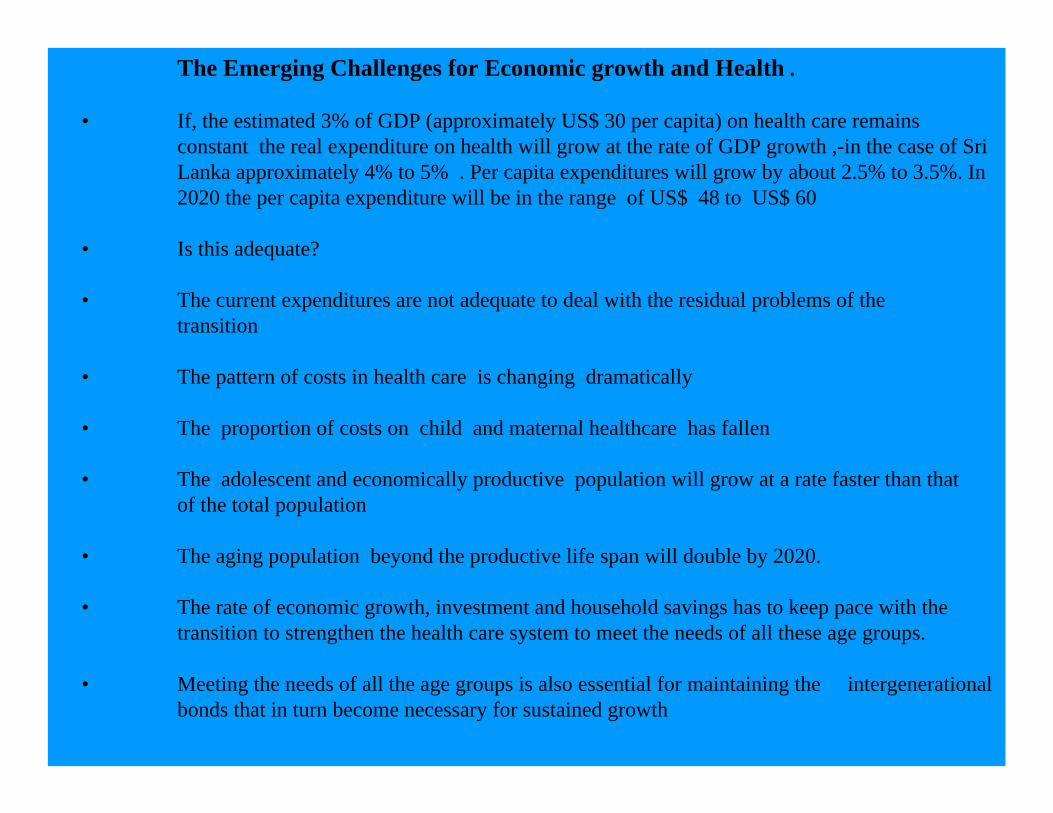
The Emerging Challenges for Economic growth and Health .
• If, the estimated 3% of GDP (approximately US$ 30 per capita) on health care remains constant the real expenditure on health will grow at the rate of GDP growth ,-in the case of Sri Lanka approximately 4% to 5% . Per capita expenditures will grow by about 2.5% to 3.5%. In 2020 the per capita expenditure will be in the range of US$ 48 to US$ 60
• Is this adequate?
• The current expenditures are not adequate to deal with the residual problems of the transition
• The pattern of costs in health care is changing dramatically
• The proportion of costs on child and maternal healthcare has fallen
• The adolescent and economically productive population will grow at a rate faster than that of the total population
• The aging population beyond the productive life span will double by 2020.
• The rate of economic growth, investment and household savings has to keep pace with the transition to strengthen the health care system to meet the needs of all these age groups.
• Meeting the needs of all the age groups is also essential for maintaining the intergenerational bonds that in turn become necessary for sustained growth
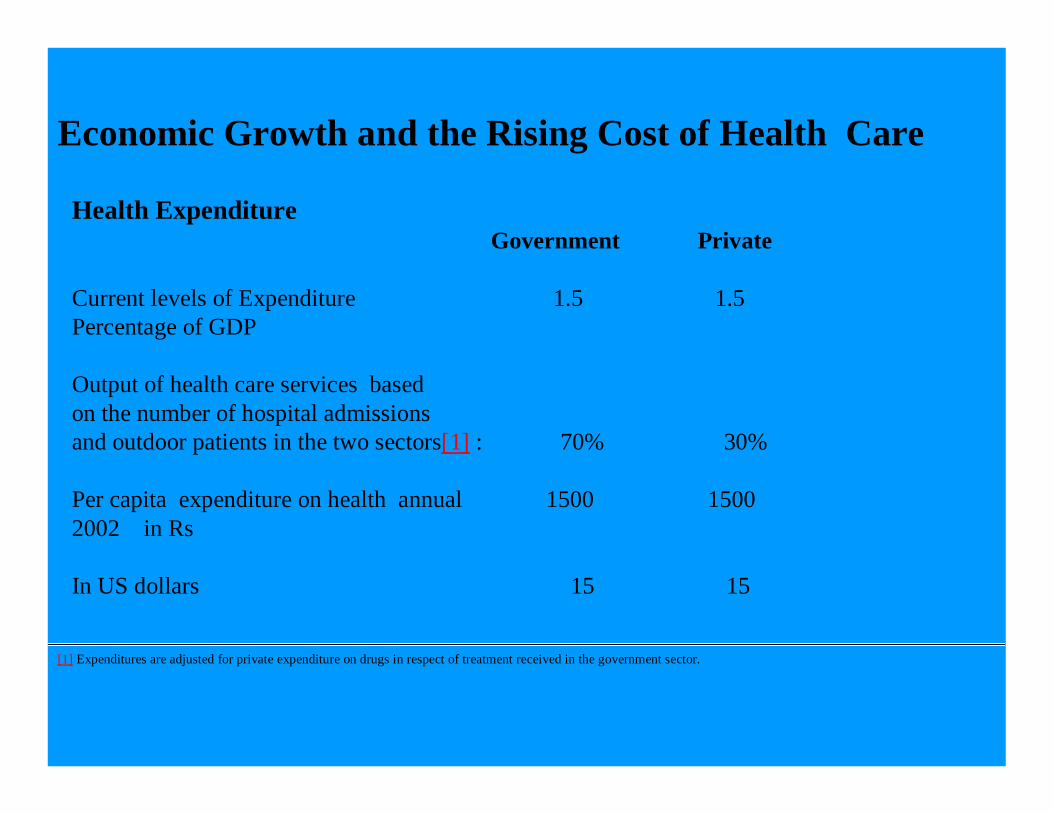
Economic Growth and the Rising Cost of Health Care
Health Expenditure Government Private
Current levels of Expenditure 1.5 1.5 Percentage of GDP
Output of health care services based on the number of hospital admissions and outdoor patients in the two sectors[1] : 70% 30%
Per capita expenditure on health annual 1500 1500 2002 in Rs
In US dollars 15 15
[1] Expenditures are adjusted for private expenditure on drugs in respect of treatment received in the government sector.

Available resources
• Total per capita expenditure in US Dollars 30
• With GDP growth at 4% per capita health expenditurein 2020 in US$ 48
• With GDP growth at 5% per capita health expenditurein US$ in 2020 60
Demand for Heath Care
• Population increase at 1.5% per capita expenditure should be 40
• Unmet current needs of the system 25% 7.5
• The increase in the disease burden of the old population 28
Total 75.5
Either GDP must increase by 1% or the health allocation should increase by at least 1% of GDP.

In the case of Sri Lanka the existing health care system has high potential for containing costs of the next phase of the health transition.
To realize this potential,the best features of the present system, its accessibility, its capacity to service the poor would have to beretained .
The state health care system needs to be restructured and strengthened to satisfy the unmet and new needs arising out of the health transition, particularly of the poor households in the health transition
The private sector in health services should grow in the context of a strengthened national health care system.

The Role of the NGO’s
• The Contribution of the NGOs in the first phase
• Women’s Associations, Sarvodaya, other community based organizations
• Making the delivery of health care more cost effective
• Health Education and Public Awareness,
• Humanitarian Support for Patients of specific Diseases
• Maternal and Child Health
• The contribution in the second phase
• Greater study research and advocacy on the public issues of health care in Sri Lanka-Budgetary allocation for health, the national health care system and privatization;.
• Monitoring equity in health, regional inequality
• Focus on the health of the workforce – issues of productivity and health ; occupational health.
• Disease specific activities and support to improve cost efficiency of health care of the aging population specially in regard to non-communicable diseases – health education, clinics for diagnostic services; household support .

THANK YOU