Embed Size (px)
Citation preview

Health System TrustSouth African Health Review and
District Health Barometer
Monitoring Health & Advising Policy
Fiorenza Monticelli
ANC Health and Education PEC sub-committee meeting
29 April 2010
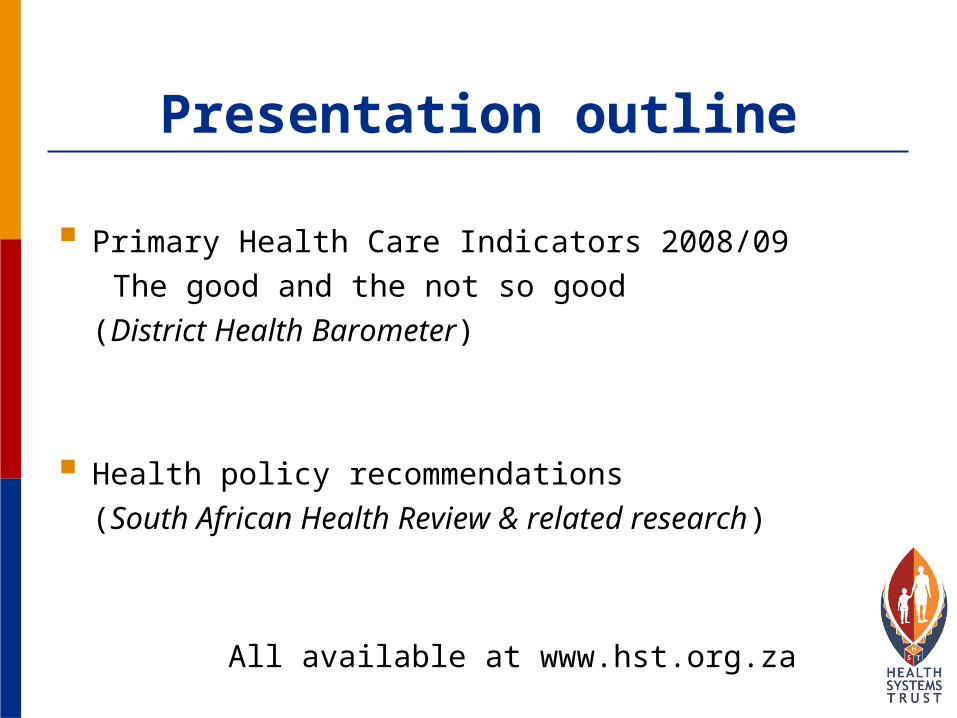
Presentation outline
Primary Health Care Indicators 2008/09 The good and the not so good
(District Health Barometer)
Health policy recommendations (South African Health Review & related research)
All available at www.hst.org.za
South Africa
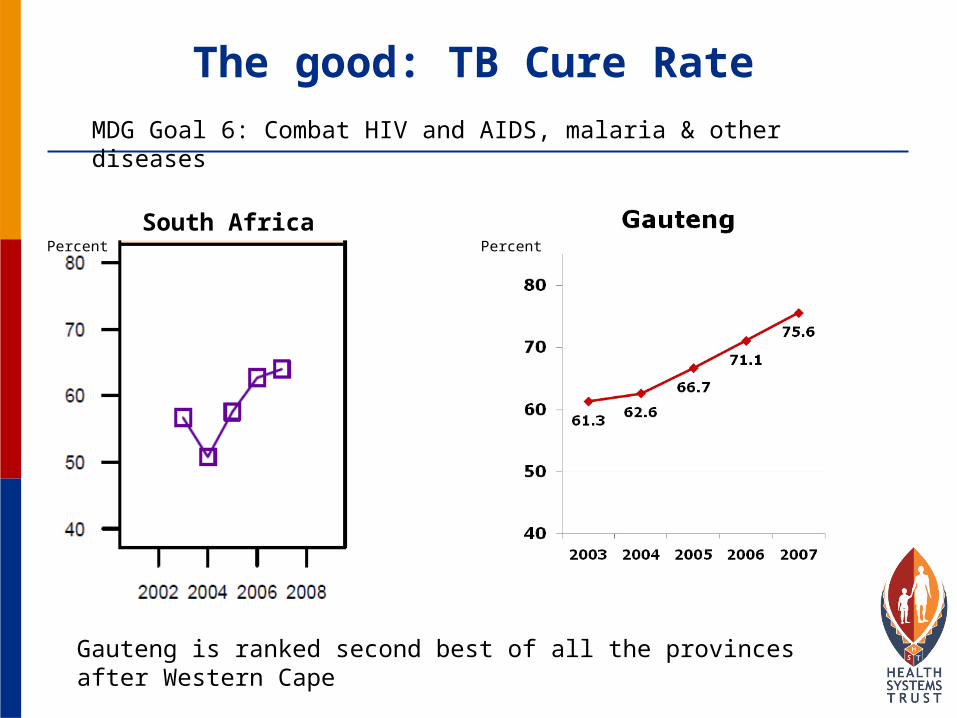
Gauteng is ranked second best of all the provinces after Western Cape
The good: TB Cure Rate MDG Goal 6: Combat HIV and AIDS, malaria & other diseases
PercentPercent

TB cure rate by district, 2007
Ekurhuleni 79.5%
Johannesburg 76.1%
West Rand 72.4%Sedibeng 71.7%Metsweding 71.5%
Tshwane 72.6%

TB cure rate - District trends
City of Johannesburg Ekurhuleni City of Tshwane
Sedibeng Metsweding West Rand
Percentage

The good: Immunisation coverage <1
MDG Goal 4: Reduce child mortality
South Africa
Gauteng is ranked second best of all the provinces after Western Cape
Percent Percent

Immunisation coverage <1 year District trends
City of Johannesburg Ekurhuleni City of Tshwane
Sedibeng Metsweding West Rand
Percentage
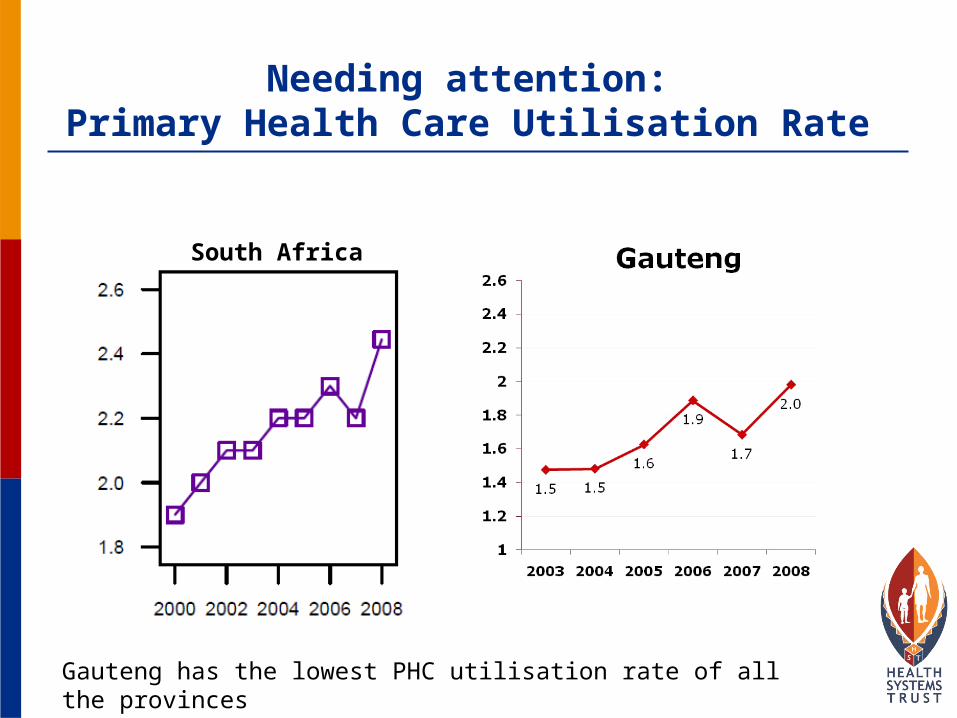
Needing attention: Primary Health Care Utilisation Rate
South Africa
Gauteng has the lowest PHC utilisation rate of all the provinces

PHC utilisation rate by district 2008/09
West Rand 2.2City of Johannesburg 2.1City of Tshwane 2.1Sedibeng 1.9Ekurhuleni 1.7Metsweding 1.6
SA average = 2.4Metro average = 2.3Gauteng average = 2.0

Not so good: HIV testing rate of pregnant women
MDG Goal 4: Reduce child mortality & MDG Goal 5: Improve maternal health
South Africa Trend by Province
Proportion ANC clients tested for HIV
Percentage

Proportion of ANC clients tested for HIV 2008/09
SA average = 86.7%Metro average = 78.5%Gauteng average = 78.4%
Sedibeng 92.3%City of Johannesburg 81.2%City of Tshwane 78.1%West Rand 77.7%Ekurhuleni 72.3%Metsweding 72.2%

Health Policy Recommendations “ Tackle inequitable distribution of resources” “ Efficiency and outcomes need attention...” “ Improve management and governance of clinics
and hospitals….” “ Measure the problem and its solutions through
improving the health information system....as it is essential to be able to monitor progress and inequities”
Bradshaw D. Determinants of Health and Health Trends. In: Barron P, Roma-Reardon J, editors. South African Health Review 2008. Durban: Health Systems Trust; 2008.
Blecher MS, Day C, Dove S, Cairns R. Primary Health Care Financing in the Public Sector. In: Barron P, Roma-Reardon J, editors. South African Health Review 2008. Durban: Health Systems Trust; 2008.
Padarath A, Freedman I. The state of clinic committees in primary level public health sector facilities in South Africa. Durban: Health systems Trust ; 2007.

Tackle inequitable distribution of resourcesProportion of District Health Services Expenditure on District
Hospitals

Tackle inequitable distribution of resources
Proportion of District Health Services Expenditure on District Management
”
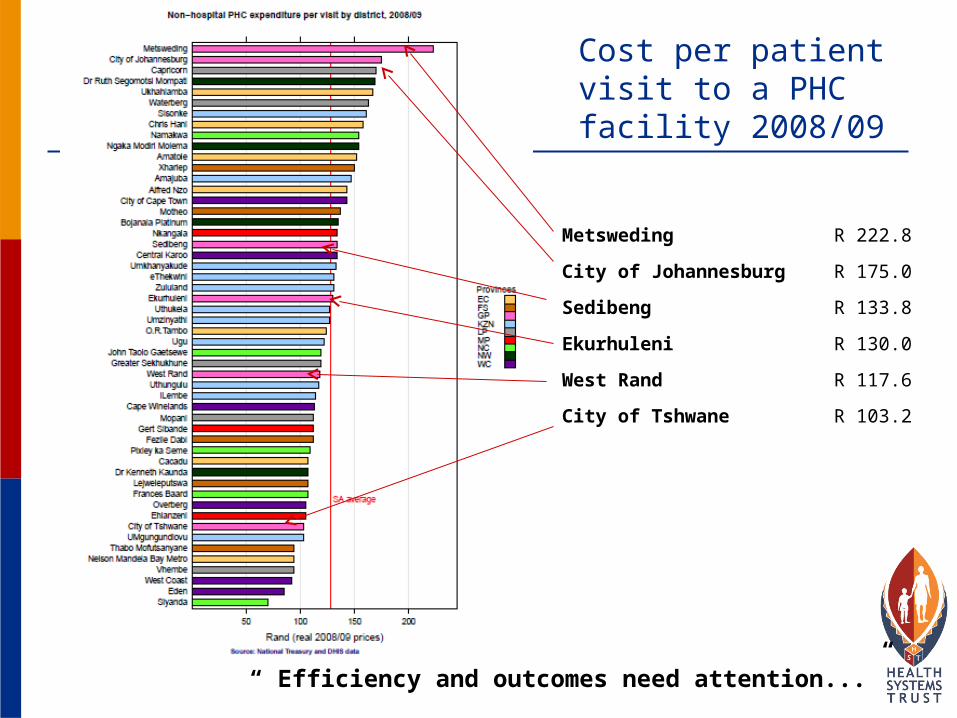
Cost per patient visit to a PHC facility 2008/09
Metsweding R 222.8
City of Johannesburg R 175.0
Sedibeng R 133.8
Ekurhuleni R 130.0
West Rand R 117.6
City of Tshwane R 103.2
“ Efficiency and outcomes need attention...”

Improve management and governance of clinics and hospitals
Research done on the status of clinic committees in primary level public health sector facilities recommends:
1. Develop a comprehensive framework for clinic committees. Guidelines on what governance structures are meant
to do, how they should be constituted & operate
2. Develop & implement capacity development programme for clinic committee members Training programme – roles & responsibilities,
procedural issues related to functioning & community health related issues.

Thank you