Embed Size (px)
Citation preview
HEALTH SERVICES DATABASE IN THE CONTEXT OF
NATIONAL HEALTH ACCOUNTS Ravi Duggal, CEHAT, Mumbai
Overview Historically health services data has been very limited in India. Colonial India put together data in the context of how it affected the cantonments and civil lines. Occasional public health enquiries by Commissioners contributed to some community based data. Institutional data from the public domain like hospitals, public health expenditures and census related data such as medical professionals and employees was reasonably well organised. But data on the private health sector was conspicuous by its absence. The scenario today is not very different! The first efforts at a large scale survey, but not household based, was done by the Bhore Committee – Health Survey and Development Committee- which based on the survey formulated a national health plan for a universal access health care system with a clear message that the responsibility of providing health care to all was that of the State and that the private sector was dispensable. The Bhore Committee also chalked out a framework for a national and regional health information system. The situation in the post-colonial period did not change drastically and this is again largely because the State did not commit itself to assure the people of the country basic health care as a right. The recommendations of the Bhore Committee were not taken as a whole but only selectively and it is this attitude of selective programming that is responsible for the type and the quality of health care system that we have today. The first effort at a general health survey in post-colonial India was undertaken in the late fifties and early sixties by S C Seal of the AIIH&PH (Seal, 1955 -1963). This study of districts selected from all major states was modelled around the British General Health Survey and data from this if compiled systematically can form a baseline for the country. This data includes out of pocket expenditures and perhaps is the first indication of the scale of the private health economy. The only copies of the study volumes that I have seen are in the AIIH&PH library in Calcutta, and afew volumes in the National Medical Library in New Delhi. This is valuable data and efforts must be taken to preserve it, if possible in electronic form. Apart from this the NSSO has in its occasional rounds undertaken morbidity and utilisation studies periodically, including out of pocket expenditures, but it was only in the 42nd and 52nd Rounds in 1986-87 and 1995-96 that a comprehensive survey was undertaken giving population based health data. Taking a cue of the gap in health related information the first National Family Health Survey (NFHS) was conducted in 1992-93 and repeated in 1997-98. These surveys are largely demographic in nature but do have useful though limited health information. The census every ten years gives some demographic data, which has some use for health sector analysis. Similarly the National Sample Survey Organisation and the Registrar General of India’s Sample Registration Scheme data gives regular sets of data, again largely demographic. A point to flag here is the larger emphasis on demographic and family planning data even when surveys are labelled as health surveys - this also explains why the NFHS is not a health survey and much less a family health survey! The State's obsession with fertility reduction is partly responsible for this demographic view of health and this gets reflected in the paucity of health information in the country. The data pertaining to the demographic situation and family planning is much better organised and more widely available whereas data on health care services, utilisation, epidemiological and morbidity patterns, health care availability, health care expenditures,
1
humanpower etc. are most inadequate and not easily available. Outside the state framework the NCAER is the only organisation that has carried out national surveys through which limited population-based health information has been collected – they conducted two surveys in the fist half of the nineties. At the micro level the situation is similar. A large number of micro studies have been carried out but a large majority of them are again demographic or family planning related. This is largely because funding for such studies comes either from the family planning department or international agencies whose primary concern is population control. In a national review of such research done in 1993 by the research team of the Foundation for Research in Community Health it was found that an overwhelming majority of such funded research, a small proportion of it very good, lies unpublished and inaccessible to those who would like to use such research findings (FRCH,1993). Data Availability and Organisation In India data collection, compilation and distribution is almost the sole monopoly of the Central Statistical Organisation (CSO). The NSSO and the RGI's offices provide the CSO with a fair amount of support in its efforts at compiling and publishing a wide array of data. The CSO is also dependant on other bodies to feed it with the necessary data, which is collected through their routine functioning. The CSO publishes a wide range of statistical compendia that provide information on all aspects of the economy and society (CSO, 1989). The users of this information are also a highly differentiated group and are appreciative of the thankless task that the CSO undertakes. However, the CSO encounters many problems in compiling this data. It is evident from their numerous documents that they invariably do not receive complete information for the variables that they publish in their various compilations. This is largely because of the poor organisation and lack of cooperation on the part of bodies which generate the data and are supposed to supply regularly to the CSO - while a large part of the data from public bodies is more or less regularly available it is the private institutions whose compliance is very poor, and this is especially crucial for the health sector in India because of the overwhelming dominance of the private sector. One sees complacency setting in within the CSO as evidenced from the decline and delays in bringing out its crucial publications. The NSSO is one agency that collects primary data on practically every socio-economic issue. Its sample cuts across the entire country and hence its contribution is very vital for any database. Its methodology and credibility (though of recent being questioned) is generally held in high esteem internationally. Unfortunately it has failed to provide data on time - the delay most often being about seven to eight years. Here our concern is with health and related data so we will not comment on other data. Compilation of health services data at the national level is the responsibility of the Central Bureau of Health Intelligence (CBHI). Similar bureaus at the state level lend support as clearing houses for respective states. The CBHI has been regularly bringing out its annual publication "Health Statistics of India", now called "Health Information of India". Though the range of subjects is diverse, it covers mostly the public sector and it is this that is its major shortcoming because health care in India is largely in the private sector. And in recent years, in spite of computerisation the time lag in availability of this document has become 4 - 5 years. The latest data available today is for 1997-98. Once in 5 years they also bring out a Directory of Hospitals which gives details about hospitals, its bed capacity etc.. for each hospital which is registered or files its return
2
to the appropriate authority. In this too it is seen that while all public hospitals are covered, private hospitals are grossly under enumerated because regulation and control of private health care facilities is not taken seriously in most states (Mahapatra and Berman, 1992; Duggal and Nandraj, 1991 and 1996). Incidentally, the last issue of the Hospital Directory was in 1988! The CBHI's Health Information of India, apart from giving basic socio-economic and demographic information, which it draws from either the RGI or the CSO, publishes information, in a number of cases state-wise, on health care infrastructure like hospitals, dispensaries, PHCs and beds (including private sector, which studies now show are underestimates in the CBHI compendium), communicable diseases like leprosy, tuberculosis, malaria, etc.. which is data mainly from public institutions hence grossly underestimated, health humanpower - doctors of various systems, nurses, paramedics in government health programs, rural health care personnel, medical education admissions and outturns etc.., public health expenditures in aggregate form, cause of death statistics, and health insurance (public sector only) statistics. While the data categories appear to have a wide range of coverage basic morbidity data or an epidemiological profile on which all health care planning should be based is not available. Morbidity/epidemiological studies on a national scale have never been done, except for the one on tuberculosis way back in 1957. The quality of the data and its uptodateness is far from what is desired. This inadequacy of even the existing data is largely due to the laxity of data collecting and reporting agencies. The CBHI can only report from what it gets. The blame lies mainly with the state bureaus who do not put serious efforts at assuring that the data from the agencies responsible for supply of the respective data reaches them. For instance, the state Medical Councils are supposed to supply information on registration of allopathic doctors. While some state medical councils have been quite regular and up-to-date many have not been doing their duty of sending updated records to the health information bureaus. Thus, for a number of states we see that data reported on the number of registered doctors is for up to even five years ago. In contrast the Nursing Council and the Dental Council are much more efficient and timely. Now for nearly a decade the CBHI's Health Information is computerised but that has not changed the way it reports data. Neither has it made them up-to-date nor has the presentation improved. Computerisation gives the opportunity for analytical statements but nothing of this kind has been forthcoming. Further CBHI reports some sets of data which are meaningless - reporting targets achieved for treatment of communicable diseases makes little sense, what is needed is to report actual prevalence and/ incidence and then the percent of such cases who have received treatment. For example, the 1988 Health Information reported that there were only 9375 deaths due to tuberculosis in India in 1987 (Table 10.17, pg.178) - this is a ridiculous figure to present for those who don't know that it represents deaths only in public hospitals and that too partially reported. In the same volume in Table 11.3 on page 202 the RGI data on survey of causes of death is reported in which of all surveyed rural deaths 5.29% were due to tuberculosis of the lungs - this gives us an all India figure for 1986 of over 353,000 deaths due to pulmonary tuberculosis in rural areas alone! Other national level efforts have been from the Census (data on professions which gives us estimates of doctors of different systems, nurses, paramedics etc..), in the Economic Census Tables (data on establishments etc..), from the NSS (Expenditure on medical care in selected consumption expenditure rounds, morbidity, 42nd and 52nd round on morbidity and utilisation, disability, nutrition, health care establishments, immunisation, indebtedness due to health care etc..), and Comptroller and Auditor General which gives public health spending by major
3
programs in its Combined Finance and Revenue Accounts - which since 1987 has not been published – of course there are state finance and revenue accounts separately for each state which are available in the NIPFP and RBI libraries. Among the other surveys the NCAER surveys focus on household morbidity, utilisation and expenditure patterns, the NFHS is mostly demographic and family planning related and provides health data pertaining only to immunisation, pregnancy, delivery (MCH related) and of important communicable diseases like malaria, tuberculosis and malaria, and physical disabilities, and ARI and diarrhoea among children. Both NCAER and NFHS data sets are computerised and the latter is available to any serious researcher in electronic form from the IIPS on request. The NFHS has a volume on India and separately for each state. They have also published selected thematic reports and a series of NFHS Research Bulletins. Making a Health Database When I was at FRCH we began the first efforts at evolving a health services database. Public health expenditures was the item selected to begin this process because it was the most organised form of data and easily accessible. From 1951 to 1985 all available data on public health expenditure for each state and union territory was compiled and computerised. Now at the Centre for Enquiry into Health and Allied Themes (CEHAT) we have continued this process. The health finance database has been updated up to 1998-99 and other health services data like health personnel, hospitals, beds, PHCs, mortality and fertility rates, immunisation, ante-natal care etc.. has also been partially compiled. CEHAT is committed to building a complete health care database and as an initial step for making it public we published a core part of it in the Economic and Political Weekly (April 15 and 22, 1995). Subsequently we brought it out in an electronic version as a DOS based database This data is available on a single year basis from 1951 to 1995 for each state and union territory in a set of two floppies along with a user friendly program. Recently we have undertaken the task to update it and make it available in a windows-based version. This new version updated to the most recent year will be available on a CD-ROM before end of 2002 – selected data is already available on the web at www.cehat.org CEHAT is working out a strategy to make this process an ongoing one, add newer categories of data, including those from micro studies and make these updates available periodically, and also place it on the website. To conclude, each set of health data has been discussed below in the context of its sources, availability, quality, access etc. and the work that CEHAT has already done is also highlighted. The larger focus will be on health expenditures and how it can contribute to developing the base for national Health Accounts. HEALTH POLICY AND PLANNING
• Five year plan documents: health program recommendations, allocations, investment expenditures
• Various Committee reports' recommendations: Bhore Committee, Mudaliar Committee, Chopra Committee, Shrivastava Committee, Kartar Singh Committee, ICMR-ICSSR Committee etc..
• Annual Reports of the Ministry of Health and the Report and Recommendations of the Joint Council of Health and Family Welfare.
The Ministry of Health has put in some efforts at compilation of Committee reports; annotations can be compiled into a database. The five year plans, including allocations, investments and expenditures are already on the planning commission website. At CEHAT too we have already
4
collated most of this information and it will be bundled into the database that CEHAT has developed. HEALTH PERSONNEL
• State Councils for allopathic and ISM&H doctors, dentists and nurses which generate information on registered practitioners and the CBHI publishes it in Health Information of India (HII), also data on medical colleges, admissions and outturn
• Information on paramedics and all other health personnel in rural government health care in Rural Health Bulletin and CBHI's HII
• Census Economic Tables for all categories of health personnel for census years • IAMR also publishes health personnel data in its statistical compendium - Manpower
Profile Yearbook The quality of registration data, especially of the State (allopathic) Medical Councils is unsatisfactory and in many states there is a lag of over five years in reporting. Other problems with this data is that it is registration data and does not reflect on the number of active practitioners - often those who have died, migrated to other countries or have stopped practicing continue to be on the list and on the other hand many who are practicing have not registered and hence are not included in the list. CBHI in its HII publishes most of the above data for previous year. The Census economic tables give more accurate data on doctors who are economically active and here we get breakdown by gender, pathy, rural/urban residence, age, educational background etc.. Analysis of Census data, which comes once in ten years, shows that for allopathic doctors, for the same year as the Census, the Medical Councils make an over count by 15-20%. CEHAT has compiled a substantial part of this data for single year since 1951 and the Census data too and computerised it - part of it published in the EPW as mentioned above and up to 1993 it is now available on floppies. The data categories include number of doctors, dentists, nurses registered with the respective Councils, breakdowns of the Census data by gender, pathy, residence. Also included are different categories of paramedics like ANMs, MPWs, pharmacists etc. in government services. HEALTH INFRASTRUCTURE
• HII compiles annual information on hospitals, dispensaries, hospital and dispensary beds, PHCs, Subcentres. The hospital and dispensary data includes private hospitals also.
• CBHI also brings out a Hospital Directory every few years. • PHC and other rural health infrastructure also available in the Rural Health Bulletin of the
Ministry of Health Various micro studies have shown that the private sector data is very much underestimated. CEHAT has compiled all the available data in this category and up to 1993 it is available on floppies. Data categories include hospital and dispensaries and beds by rural/urban location and by private/public ownership. Apart from CBHI another source of information are the Establishment data from the economic census which lists directory/non-directory establishments and own account enterprises in the health sector. UTILISATION AND MORBIDITY
• NSS and NCAER are the only major sources for such data • Number of micro studies provide good information
This is one set of data that is not available on a regular time series basis. The NSS morbidity and utilisation surveys are very few and the only detailed survey was the 42nd and 52nd round in 1987

5
and 1996, respectively. In the eighties a number of micro studies were done which for the first time brought such data on agenda and as a consequence NCAER did two national level studies in 1992 and 1994. Both NSS and NCAER data is computerised but is not as yet available publicly for independent analysis. The NSS data is published in Sarvekshana and NCAER data in book form. Some important micro studies are those done by FRCH in Maharashtra and Madhya Pradesh (Duggal and Amin, 1989; George et.al. 1993;), KSSP in Kerala (Kanan et.al. 1991 and Kunhikannan et.al., 1999), CEHAT in Maharashtra (Nadraj et.al., 1998, Madhiwala et.al. 2000 and Dilip and Duggal, 2002) Morbidity data is also available in a limited way for captive populations like users of public hospitals (published by CSO in Statistical Abstract of India - but since returns are not filed by all hospitals regularly this data has very little value, except perhaps for percent distribution of cause of morbidity), for users of railway, postal, mining, CGHS and ESIS health services. Such data can be used to give useful proxy estimates in the absence of better quality data. This data is available in respective organisation’s annual reports. FAMILY PLANNING
• Family Welfare Yearbook, an annual publication of the Dept. of Family Welfare of the Ministry of Health publishes detailed data on contraceptive methods use, fertility related indices, family planning expenditures, MCH related data, abortion and abortion services etc.
• NFHS also has similar data This data is quite comprehensive but a fair part of it relating to contraception acceptance is suspect. Of course, the data refers only to the public system. The NFHS data is very useful here because it gives an opportunity to compare field level data with service statistics of the Family Planning department. HEALTH INDICES
• RGI's SRS data on mortality and fertility, cause of death data and data on use of medical facility at birth and death,
• Also NSSO and Census data and now NFHS data. Data categories include crude birth and death rates, infant mortality rates, total fertility rates, age-specific fertility rates, pregnancy outcomes, % users of medical facilities at birth and death, causes of death etc.. HEALTH INSURANCE
• ESIS, CGHS, Railways data on expenditure and utilisation from their Annual Reports, HII also publishes some of this data
• Also data on various other insurance programs under Acts covering various miners, maternity benefit, plantation workers, beedi workers, cinema workers etc.
• Data on Mediclaim could be compiled from the various insurance companies; this will provide information on both corporate health insurance from group policies as well as individual insurance cover
PHARMACEUTICAL PRODUCTION
6
• Data on overall and key drugs production and availability from Ministry of Chemicals, and association of pharmaceutical producers like IDMA and OPPI.
• Also from ORG which compiles market intelligence on drugs, but as yet not available publicly
HEALTH EXPENDITURES
• Combined Finance and Revenue Accounts of the Union and State Governments and the State Finance and Revenue Accounts and Civil Budgets for public health expenditures by major health programs and the latter with line items. Such data is available from the year 1891 onwards.
• The Performance Budgets of state governments and zilla parishads in some states give more detailed information and in these budgets one can get integrated information on accounts and health services data in one place. Unfortunately, in the few states that this instrument exists it is being neglected
• Municipal and other local body expenditures available for selected years: Statistical Abstract of India (for Municipal Corporations), Health Statistics of India (until early sixties), NCAER and NIUA studies for some specific years and the Census village and town directories
• Other public health expenditures for selected populations as part of social security for employees - the largest is the Employee State Insurance Scheme providing comprehensive health cover for organised sector employees covered under the Factories Act and related Acts; compensation for injuries and occupational diseases under the Workmen’s Compensation Act; social security benefits, including medical care, for other category of workers like miners under the various Mines Act, for Beedi workers under the Beediworkers welfare Fund; plantation welfare funds; for cinema workers under the Cinema workers welfare Fund; maternity benefits under the Maternity benefits Act for all women workers in the organised sector and those covered by the various social security and welfare fund legislations; the Central Govt. Health Scheme for Central govt. employees; health services for employees of Railways, armed forces and post and telecommunication services and other public sector units. Information on expenditures, services, utilisation etc.. is available from statutory returns and Annual reports of these organisations.
• Health insurance, apart from the social security schemes referred to above, is still in its infancy. The main scheme available is Mediclaim from the public insurance companies. This is for hospitalisation cover and is offered both as individual and group schemes. Today private insurance companies are also offering similar packages, and with TPAs such schemes are becoming more attractive though also more expensive. Insurance companies do not make their data public but one could push IRDA to make it available for national accounts purposes. For clients who give large “other business” to insurance companies the latter provide even comprehensive healthcare cover for their employees with reasonable premiums.
• For private expenditures national level data from NSSO's morbidity and utilisation surveys and consumption expenditure rounds as also CSO's estimates of private final consumption. Recent years NCAER survey data also available. Estimates also from various micro studies.
While the public expenditure data is easily available from the CFRA, State FRA and Civil Budgets, and the CBHI publishes atleast aggregate data for the previous year in its annual Health Information compendium, that of the private sector is not available - the NSS and CSO estimates
7
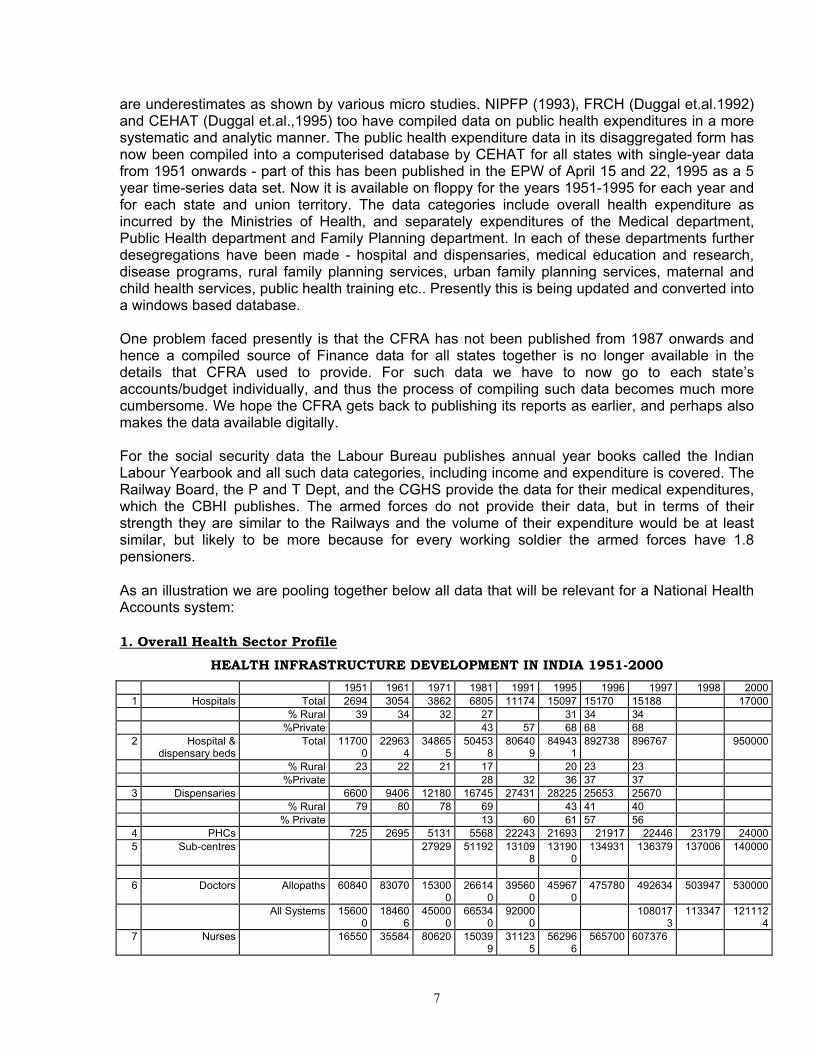
are underestimates as shown by various micro studies. NIPFP (1993), FRCH (Duggal et.al.1992) and CEHAT (Duggal et.al.,1995) too have compiled data on public health expenditures in a more systematic and analytic manner. The public health expenditure data in its disaggregated form has now been compiled into a computerised database by CEHAT for all states with single-year data from 1951 onwards - part of this has been published in the EPW of April 15 and 22, 1995 as a 5 year time-series data set. Now it is available on floppy for the years 1951-1995 for each year and for each state and union territory. The data categories include overall health expenditure as incurred by the Ministries of Health, and separately expenditures of the Medical department, Public Health department and Family Planning department. In each of these departments further desegregations have been made - hospital and dispensaries, medical education and research, disease programs, rural family planning services, urban family planning services, maternal and child health services, public health training etc.. Presently this is being updated and converted into a windows based database. One problem faced presently is that the CFRA has not been published from 1987 onwards and hence a compiled source of Finance data for all states together is no longer available in the details that CFRA used to provide. For such data we have to now go to each state’s accounts/budget individually, and thus the process of compiling such data becomes much more cumbersome. We hope the CFRA gets back to publishing its reports as earlier, and perhaps also makes the data available digitally. For the social security data the Labour Bureau publishes annual year books called the Indian Labour Yearbook and all such data categories, including income and expenditure is covered. The Railway Board, the P and T Dept, and the CGHS provide the data for their medical expenditures, which the CBHI publishes. The armed forces do not provide their data, but in terms of their strength they are similar to the Railways and the volume of their expenditure would be at least similar, but likely to be more because for every working soldier the armed forces have 1.8 pensioners. As an illustration we are pooling together below all data that will be relevant for a National Health Accounts system: 1. Overall Health Sector Profile
HEALTH INFRASTRUCTURE DEVELOPMENT IN INDIA 1951-2000 1951 1961 1971 1981 1991 1995 1996 1997 1998 2000
1 Hospitals Total 2694 3054 3862 6805 11174 15097 15170 15188 17000 % Rural 39 34 32 27 31 34 34 %Private 43 57 68 68 68
2 Hospital & dispensary beds
Total 117000
229634
348655
504538
806409
849431
892738 896767 950000
% Rural 23 22 21 17 20 23 23 %Private 28 32 36 37 37
3 Dispensaries 6600 9406 12180 16745 27431 28225 25653 25670 % Rural 79 80 78 69 43 41 40 % Private 13 60 61 57 56
4 PHCs 725 2695 5131 5568 22243 21693 21917 22446 23179 240005 Sub-centres 27929 51192 13109
813190
0 134931 136379 137006 140000
6 Doctors Allopaths 60840 83070 15300
026614
039560
045967
0 475780 492634 503947 530000
All Systems 156000
184606
450000
665340
920000
1080173
113347 1211124
7 Nurses 16550 35584 80620 150399
311235
562966
565700 607376

8
8 Medical
colleges Allopathy 30 60 98 111 128 165 165 165
9 Out turn Grads 1600 3400 10400 12170 13934 * * * * P. Grads 397 1396 3833 3139 3656
10 Pharmaceutical production
Rs. in billion 0.2 0.8 3 14.3 38.4 79.4 91.3 104.9 120.7 165.0
11 Health outcomes IMR/000 134 146 138 110 80 74/69 72 71 72 70
CBR/000 41.7 41.2 37.2 33.9 29.5 29 27 27 27 26 CDR/000 22.8 19 15 12.5 9.8 10 9 8.9 9 8.7 Life Expectancy years 32.08 41.22 45.55 54.4 59.4 62 62.4 63.5 64 65 Births attended by
trained practitioners
Percent 18.5 21.9 28.5 42.3
12 Health Expenditure Rs. Billion
Public Private@
CSO estimate of private spending
0.221.05
1.083.042.05
3.358.156.18
12.8643.8229.70
50.78173.60
82.61
82.17 233.47 279.00
101.65
329.00
113.13399.84373.00
126.27
459.00
178.00
833.00
@ Data from - 1951:NSS 1st Round 1949-50; 1961: SC Seals All India District Surveys,1958; 1971: NSS 28th Round 1973-74; 1981: NSS 42nd Round 1987; 1991 and 1995: NCAER – 1990; 1995: NSS 52nd Round 1995-96; 1997: CEHAT 1996-97 Madhiwala,2000 *Data available is grossly under-reported, hence not included Notes: The data on hospitals, dispensaries and beds are underestimates, especially for the private sector because of under-reporting. Rounded figures for year 2000 are rough estimates. Source : 1. Health Statistics / Information of India, CBHI, GOI, various years 2. Census of India Economic Tables, 1961, 1971, 1981, GOI 3. OPPI Bulletins and Annual reports of Min. of Chemicals and Fertilisers for data on Pharmaceutical Production 4. Finance Accounts of Central and State Governments, various years 5. National Accounts Statistics, CSO, GOI, various years 6. Statistical Abstract of India, GOI, various years 7. Sample Registration System - Statistical Reports, various years 8. NFHS - 2, India Report, IIPS, 2000

2. Central and State government’s Health Expenditures
MINISTRY OF HEALTH AND FAMILY WELFARE EXPENDITURES 1991-2000 CATEGORY 1990-91 1991-92 1992-93 1993-94 1994-95 1995-96 1996-97 1997-98 1998-99 RE 1999-00 BE
Total 5078 5639 6464 7518 8217 10165 11313 12627 16303 17854
Central 493 558 705 744 1068 1210 1346 1354 1907 2309
All India Health expd. at current Rs. In crores
State 4585 5081 5759 6774 7149 8955 9967 11273 14396 15545
Health expd. at 1981-82 Rs. In crores
2775 2711 2822 3031 2988 3434 3591 3826 4631 4891
Real Growth Rate of health Expenditure %
-2.3 4.1 7.4 -1.4 14.9 4.6 6.5 21 5.6
Share of state govt. in total Health expd. %
90.3 90.1 89.1 90.1 87.0 88.1 88.1 89.3 88.3 87.1
Grant in Aid component from Centre in state Health expd. %
17.0 16.2 18.9 20.7 18.8 14.8 14.1 15.6 16.1
Health expd. to total govt expd. in percent
2.88 3.11 2.88 2.91 2.13 2.98 2.94 2.7 2.9 3.0
Health expd. as % of GDP
0.94 0.91 0.91 0.93 0.85 0.91 0.88 0.81 0.86 0.87
Percapita total health expd. in Rs./yr.
60.02 65.34 73.45 83.90 89.9 109.07 119.08 130.3 165.0 177.3
Source: Finance and Revenue Accounts of Central and Stage Governments, various years for health expenditures. Ratios and percentages computed using CSO data from National Accounts Statistics
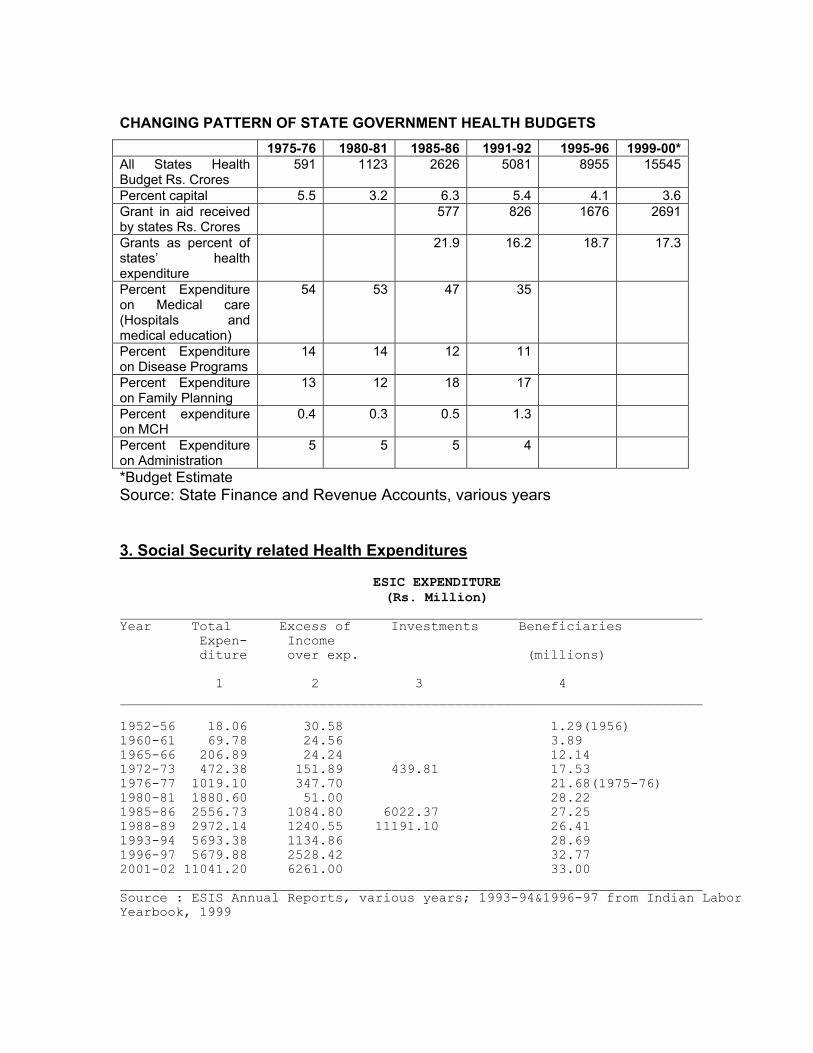
CHANGING PATTERN OF STATE GOVERNMENT HEALTH BUDGETS 1975-76 1980-81 1985-86 1991-92 1995-96 1999-00*All States Health Budget Rs. Crores
591 1123 2626 5081 8955 15545
Percent capital 5.5 3.2 6.3 5.4 4.1 3.6Grant in aid received by states Rs. Crores
577 826 1676 2691
Grants as percent of states’ health expenditure
21.9 16.2 18.7 17.3
Percent Expenditure on Medical care (Hospitals and medical education)
54 53 47 35
Percent Expenditure on Disease Programs
14 14 12 11
Percent Expenditure on Family Planning
13 12 18 17
Percent expenditure on MCH
0.4 0.3 0.5 1.3
Percent Expenditure on Administration
5 5 5 4
*Budget Estimate Source: State Finance and Revenue Accounts, various years 3. Social Security related Health Expenditures
ESIC EXPENDITURE (Rs. Million)
_________________________________________________________________________ Year Total Excess of Investments Beneficiaries Expen- Income diture over exp. (millions) 1 2 3 4 _________________________________________________________________________ 1952-56 18.06 30.58 1.29(1956) 1960-61 69.78 24.56 3.89 1965-66 206.89 24.24 12.14 1972-73 472.38 151.89 439.81 17.53 1976-77 1019.10 347.70 21.68(1975-76) 1980-81 1880.60 51.00 28.22 1985-86 2556.73 1084.80 6022.37 27.25 1988-89 2972.14 1240.55 11191.10 26.41 1993-94 5693.38 1134.86 28.69 1996-97 5679.88 2528.42 32.77 2001-02 11041.20 6261.00 33.00 _________________________________________________________________________ Source : ESIS Annual Reports, various years; 1993-94&1996-97 from Indian Labor Yearbook, 1999

1
Compensations paid Under Workmen’s Compensation Act 1971 1976 1981 1993 1996 Compensated Injuries 57346 43088 33031 3738 3846 Compensation Paid Rs. Mill. 15.92 13.43 38.80 30.83 134.60 Amount per employee Rupees 277 312 1175 8248 34997 Source : Indian Labour Yearbook, various years Maternity Benefits for Factory, Plantation and Mine workers 1982 1987 1992 1994 1996 Claims Paid 42502 26832 21124 6311 20474 Amount Paid Rs. millions 32.61 40.60 45.43 19.72 48.23 Amount per woman Rupees 767 1513 2151 3125 2356 Source: Indian Labour Yearbook, various years Post and Telecom Dept. 1984-85 1989-90 1990-91 1994-95 1999-00 Medical Expenditures Rs. Million 51.20 243.40 (?) 126.50 248.00 662.00 Source: Health Information India, various years Labour Welfare Funds: Medical expenditure on Workers of Mines (Mica, Iron, Manganese, chrome, limestone and Dolomite), Beedi industry and Cinema industry (Rs. Million) 1986 1989 1995 1998 Mines 46.8 42.99 54.63 71.15 Beedi 15.59 84.23 130.25 Cinema 0.09 0.46 Source: Indian Labour Yearbook, various years Others
1. Railways in 1987-88 spent Rs. 1272 million on 8.6 million beneficiaries or Rs. 148 per beneficiary per year (Health Information India)
2. Plantation Welfare Funds spent Rs. 27.46 miilion on 592,280 beneficiaries in 1982 or Rs. 46 per beneficiary per year (Indian Labour Yearbook)
3. CGHS expenditures are included in the general health budgets of Ministry of Health and Family Welfare
4. Group Insurance under the New India Insurance Company in 1986 for 57,521 employees of 250 companies was premium of Rs. 10.3 million and reimbursement of Rs. 9.2 million, that is Rs. 160 payout per insured employee per annum (IIM, 1987)
5. Employer reimbursements from 132 companies to 453,725 employees for medical expenses amounted to Rs755.50 million or Rs. 1665 per employee per annum in 1989-1990 (Duggal, 1993)
6. Armed forces are another major category spending on healthcare of their employees but data is not made available
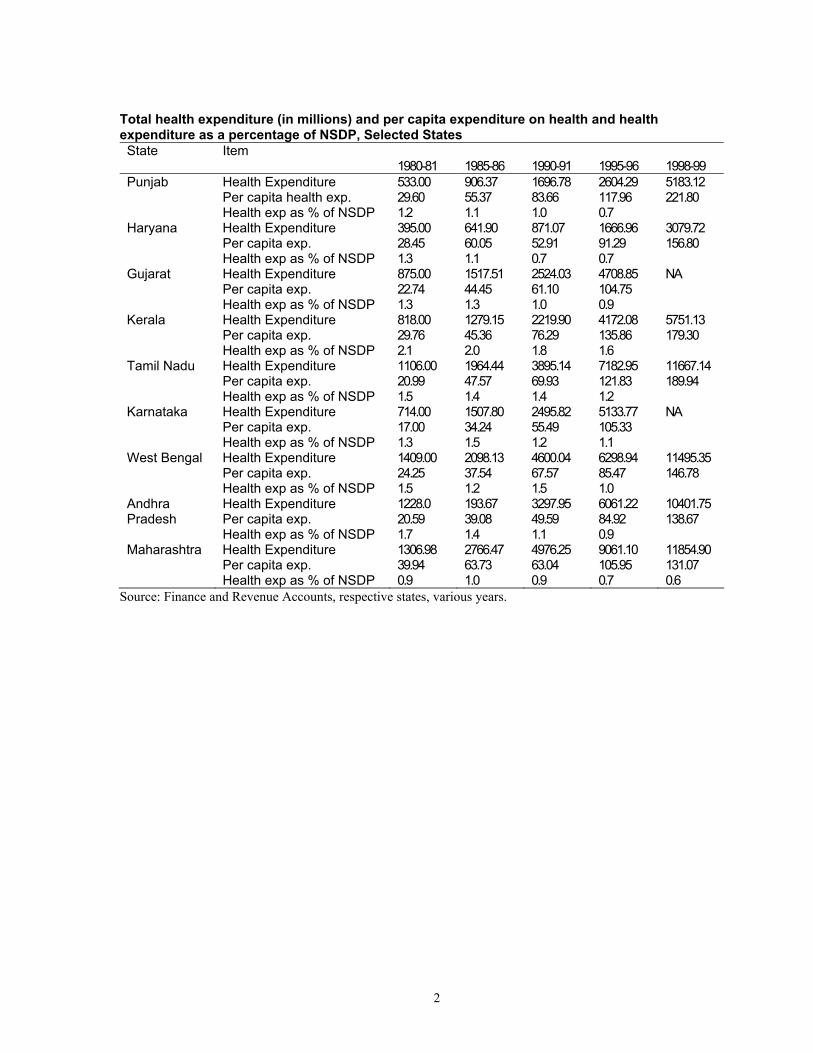
4. State level Health Expenditure Desegregations
2
Total health expenditure (in millions) and per capita expenditure on health and health expenditure as a percentage of NSDP, Selected States State Item
1980-81 1985-86
1990-91
1995-96
1998-99
Punjab Health Expenditure Per capita health exp. Health exp as % of NSDP
533.00 29.60 1.2
906.37 55.37 1.1
1696.78 83.66 1.0
2604.29 117.96 0.7
5183.12 221.80
Haryana Health Expenditure Per capita exp. Health exp as % of NSDP
395.00 28.45 1.3
641.90 60.05 1.1
871.07 52.91 0.7
1666.96 91.29 0.7
3079.72 156.80
Gujarat Health Expenditure Per capita exp. Health exp as % of NSDP
875.00 22.74 1.3
1517.51 44.45 1.3
2524.03 61.10 1.0
4708.85 104.75 0.9
NA
Kerala Health Expenditure Per capita exp. Health exp as % of NSDP
818.00 29.76 2.1
1279.15 45.36 2.0
2219.90 76.29 1.8
4172.08 135.86 1.6
5751.13 179.30
Tamil Nadu Health Expenditure Per capita exp. Health exp as % of NSDP
1106.00 20.99 1.5
1964.44 47.57 1.4
3895.14 69.93 1.4
7182.95 121.83 1.2
11667.14 189.94
Karnataka Health Expenditure Per capita exp. Health exp as % of NSDP
714.00 17.00 1.3
1507.80 34.24 1.5
2495.82 55.49 1.2
5133.77 105.33 1.1
NA
West Bengal Health Expenditure Per capita exp. Health exp as % of NSDP
1409.00 24.25 1.5
2098.13 37.54 1.2
4600.04 67.57 1.5
6298.94 85.47 1.0
11495.35 146.78
Andhra Pradesh
Health Expenditure Per capita exp. Health exp as % of NSDP
1228.0 20.59 1.7
193.67 39.08 1.4
3297.95 49.59 1.1
6061.22 84.92 0.9
10401.75 138.67
Maharashtra Health Expenditure Per capita exp. Health exp as % of NSDP
1306.98 39.94 0.9
2766.47 63.73 1.0
4976.25 63.04 0.9
9061.10 105.95 0.7
11854.90 131.07 0.6
Source: Finance and Revenue Accounts, respective states, various years.
3
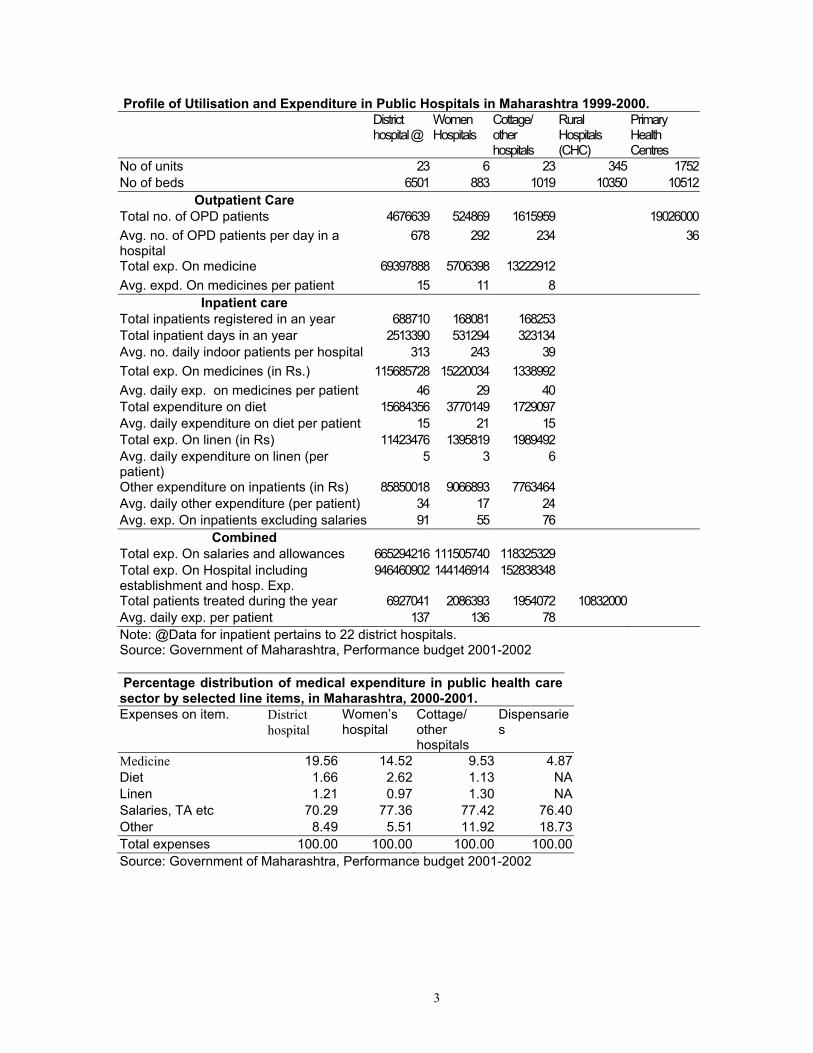
Profile of Utilisation and Expenditure in Public Hospitals in Maharashtra 1999-2000. District hospital @
Women Hospitals
Cottage/ other hospitals
Rural Hospitals (CHC)
Primary Health Centres
No of units 23 6 23 345 1752No of beds 6501 883 1019 10350 10512
Outpatient Care Total no. of OPD patients 4676639 524869 1615959 19026000Avg. no. of OPD patients per day in a hospital
678 292 234 36
Total exp. On medicine 69397888 5706398 13222912 Avg. expd. On medicines per patient 15 11 8
Inpatient care Total inpatients registered in an year 688710 168081 168253 Total inpatient days in an year 2513390 531294 323134 Avg. no. daily indoor patients per hospital 313 243 39 Total exp. On medicines (in Rs.) 115685728 15220034 1338992 Avg. daily exp. on medicines per patient 46 29 40 Total expenditure on diet 15684356 3770149 1729097 Avg. daily expenditure on diet per patient 15 21 15 Total exp. On linen (in Rs) 11423476 1395819 1989492 Avg. daily expenditure on linen (per patient)
5 3 6
Other expenditure on inpatients (in Rs) 85850018 9066893 7763464 Avg. daily other expenditure (per patient) 34 17 24 Avg. exp. On inpatients excluding salaries 91 55 76
Combined Total exp. On salaries and allowances 665294216 111505740 118325329 Total exp. On Hospital including establishment and hosp. Exp.
946460902 144146914 152838348
Total patients treated during the year 6927041 2086393 1954072 10832000 Avg. daily exp. per patient 137 136 78 Note: @Data for inpatient pertains to 22 district hospitals. Source: Government of Maharashtra, Performance budget 2001-2002 Percentage distribution of medical expenditure in public health care sector by selected line items, in Maharashtra, 2000-2001. Expenses on item. District
hospital Women’s hospital
Cottage/ other hospitals
Dispensaries
Medicine 19.56 14.52 9.53 4.87 Diet 1.66 2.62 1.13 NA Linen 1.21 0.97 1.30 NA Salaries, TA etc 70.29 77.36 77.42 76.40 Other 8.49 5.51 11.92 18.73 Total expenses 100.00 100.00 100.00 100.00 Source: Government of Maharashtra, Performance budget 2001-2002
4
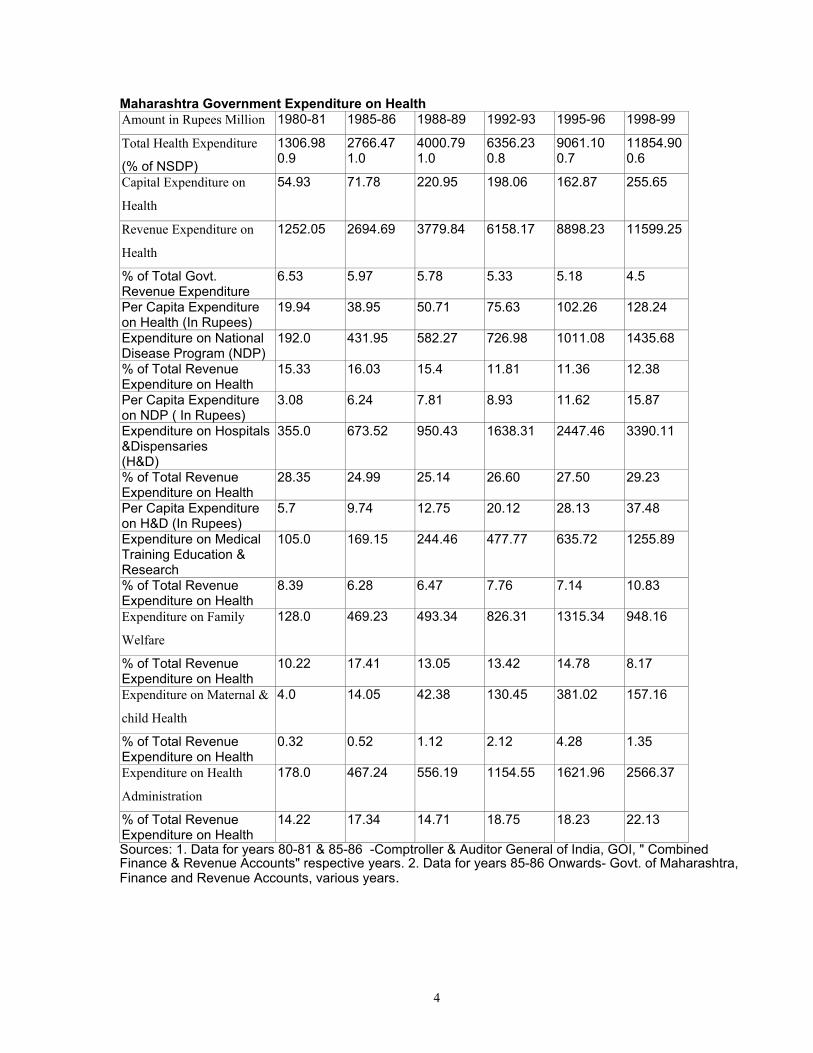
Maharashtra Government Expenditure on Health Amount in Rupees Million 1980-81 1985-86 1988-89 1992-93 1995-96 1998-99
Total Health Expenditure
(% of NSDP)
1306.98 0.9
2766.47 1.0
4000.79 1.0
6356.23 0.8
9061.10 0.7
11854.900.6
Capital Expenditure on
Health
54.93 71.78 220.95 198.06 162.87 255.65
Revenue Expenditure on
Health
1252.05 2694.69 3779.84 6158.17 8898.23 11599.25
% of Total Govt. Revenue Expenditure
6.53 5.97 5.78 5.33 5.18 4.5
Per Capita Expenditure on Health (In Rupees)
19.94 38.95 50.71 75.63 102.26 128.24
Expenditure on National Disease Program (NDP)
192.0 431.95 582.27 726.98 1011.08 1435.68
% of Total Revenue Expenditure on Health
15.33 16.03 15.4 11.81 11.36 12.38
Per Capita Expenditure on NDP ( In Rupees)
3.08 6.24 7.81 8.93 11.62 15.87
Expenditure on Hospitals &Dispensaries (H&D)
355.0 673.52 950.43 1638.31 2447.46 3390.11
% of Total Revenue Expenditure on Health
28.35 24.99 25.14 26.60 27.50 29.23
Per Capita Expenditure on H&D (In Rupees)
5.7 9.74 12.75 20.12 28.13 37.48
Expenditure on Medical Training Education & Research
105.0 169.15 244.46 477.77 635.72 1255.89
% of Total Revenue Expenditure on Health
8.39 6.28 6.47 7.76 7.14 10.83
Expenditure on Family
Welfare
128.0 469.23 493.34 826.31 1315.34 948.16
% of Total Revenue Expenditure on Health
10.22 17.41 13.05 13.42 14.78 8.17
Expenditure on Maternal &
child Health
4.0 14.05 42.38 130.45 381.02 157.16
% of Total Revenue Expenditure on Health
0.32 0.52 1.12 2.12 4.28 1.35
Expenditure on Health
Administration
178.0 467.24 556.19 1154.55 1621.96 2566.37
% of Total Revenue Expenditure on Health
14.22 17.34 14.71 18.75 18.23 22.13
Sources: 1. Data for years 80-81 & 85-86 -Comptroller & Auditor General of India, GOI, " Combined Finance & Revenue Accounts" respective years. 2. Data for years 85-86 Onwards- Govt. of Maharashtra, Finance and Revenue Accounts, various years.
5
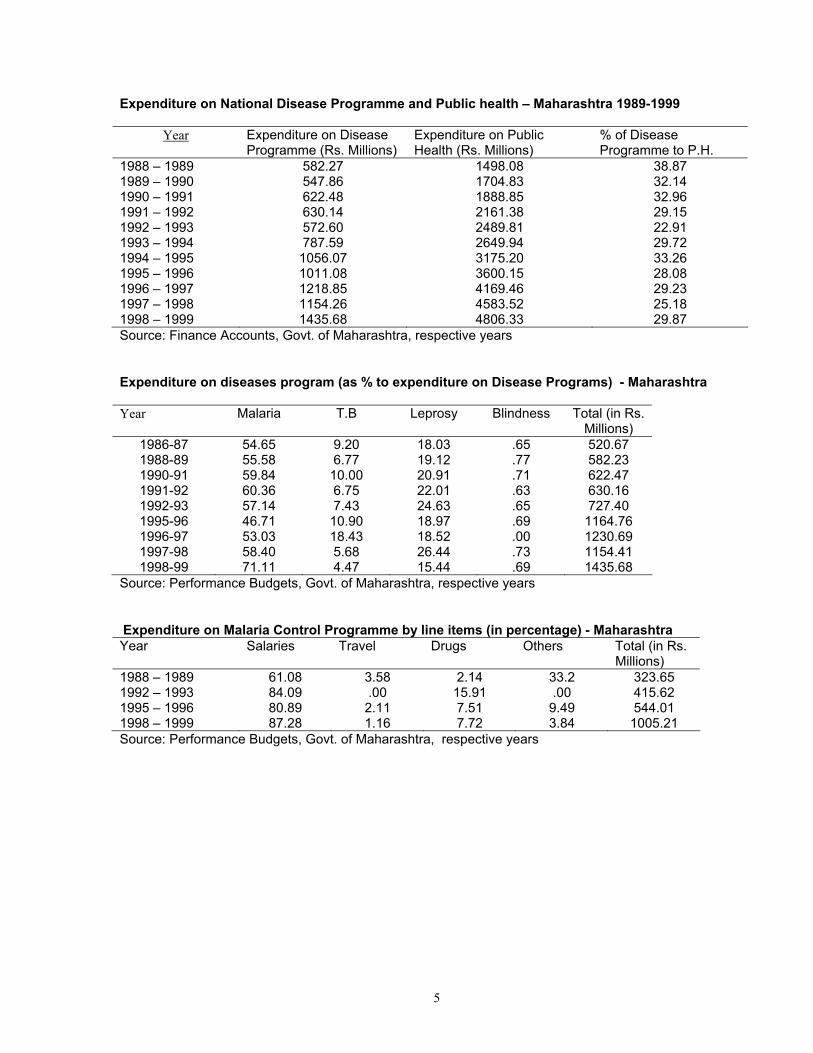
Expenditure on National Disease Programme and Public health – Maharashtra 1989-1999
Year Expenditure on Disease Programme (Rs. Millions)
Expenditure on Public Health (Rs. Millions)
% of Disease Programme to P.H.
1988 – 1989 582.27 1498.08 38.87 1989 – 1990 547.86 1704.83 32.14 1990 – 1991 622.48 1888.85 32.96 1991 – 1992 630.14 2161.38 29.15 1992 – 1993 572.60 2489.81 22.91 1993 – 1994 787.59 2649.94 29.72 1994 – 1995 1056.07 3175.20 33.26 1995 – 1996 1011.08 3600.15 28.08 1996 – 1997 1218.85 4169.46 29.23 1997 – 1998 1154.26 4583.52 25.18 1998 – 1999 1435.68 4806.33 29.87 Source: Finance Accounts, Govt. of Maharashtra, respective years Expenditure on diseases program (as % to expenditure on Disease Programs) - Maharashtra
Year Malaria T.B Leprosy Blindness Total (in Rs.
Millions) 1986-87 54.65 9.20 18.03 .65 520.67 1988-89 55.58 6.77 19.12 .77 582.23 1990-91 59.84 10.00 20.91 .71 622.47 1991-92 60.36 6.75 22.01 .63 630.16 1992-93 57.14 7.43 24.63 .65 727.40 1995-96 46.71 10.90 18.97 .69 1164.76 1996-97 53.03 18.43 18.52 .00 1230.69 1997-98 58.40 5.68 26.44 .73 1154.41 1998-99 71.11 4.47 15.44 .69 1435.68
Source: Performance Budgets, Govt. of Maharashtra, respective years Expenditure on Malaria Control Programme by line items (in percentage) - Maharashtra Year Salaries Travel Drugs Others Total (in Rs.
Millions) 1988 – 1989 61.08 3.58 2.14 33.2 323.65 1992 – 1993 84.09 .00 15.91 .00 415.62 1995 – 1996 80.89 2.11 7.51 9.49 544.01 1998 – 1999 87.28 1.16 7.72 3.84 1005.21 Source: Performance Budgets, Govt. of Maharashtra, respective years
6
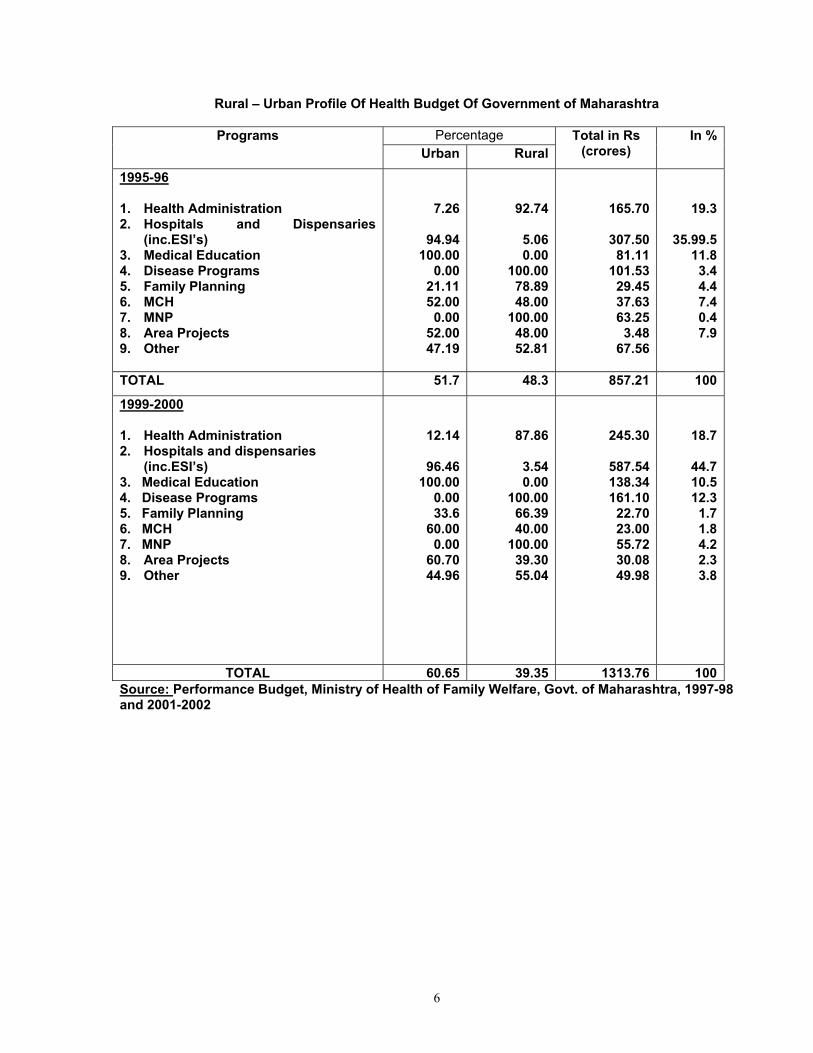
Rural – Urban Profile Of Health Budget Of Government of Maharashtra Percentage Programs
Urban RuralTotal in Rs
(crores) In %
1995-96 1. Health Administration 2. Hospitals and Dispensaries
(inc.ESI’s) 3. Medical Education 4. Disease Programs 5. Family Planning 6. MCH 7. MNP 8. Area Projects 9. Other
7.26
94.94100.00
0.0021.1152.00
0.0052.0047.19
92.74
5.060.00
100.0078.8948.00
100.0048.0052.81
165.70
307.50 81.11
101.53 29.45 37.63 63.25
3.48 67.56
19.3
35.99.511.8
3.44.47.40.47.9
TOTAL 51.7 48.3 857.21 100
1999-2000 1. Health Administration 2. Hospitals and dispensaries
(inc.ESI’s) 3. Medical Education 4. Disease Programs 5. Family Planning 6. MCH 7. MNP 8. Area Projects 9. Other
12.14
96.46100.00
0.0033.6
60.000.00
60.7044.96
87.86
3.540.00
100.0066.3940.00
100.0039.3055.04
245.30
587.54 138.34 161.10
22.70 23.00 55.72 30.08 49.98
18.7
44.710.512.3
1.71.84.22.33.8
TOTAL 60.65 39.35 1313.76 100Source: Performance Budget, Ministry of Health of Family Welfare, Govt. of Maharashtra, 1997-98 and 2001-2002

7
7. Private sector or out-of-pocket Expenditures on Healthcare
Summary of information on studies on utilization of health care services and medical expenditure in India. Source of treatment ( in percentage) * Avg. out-of-pocket medical expenditure per ailment/episode
Rural Urban Rural Urban
Public Private Total Public Private Total Public Private Total Public Private Total
NSSO –1995-96 (1998)
Inpatient care 45 55 100 43 57 100 2080 4300 3202 2195 5344 3921
Outpatient care 19 64 83 20 72 92 110 168 157 146 185 178
NSSO 1986-87 (1992)
Inpatient care 60 40 100 60 40 100 320 733 597 385 1206 933
Outpatient care 26 74 100 27 73 100 73 78 76 74 81 79
NCAER (1993)
Inpatient care 62 38 100 60 40 100 535 1877 1044 453 2319 1197
Outpatient care 42 52 94 34 59 93 49 131 90 63 152 114
NCAER (1990) 38 58 96 39 56 95 169 147 152 126 164 143
Small Scale Studies
1. Madhiwala (et al.) 2000 22.60 63.50 86.10 10.30 71.70 82.00
Inpatient care 16.00 118.00 97.00 12.00 128.00 98.00
Outpatient care 332.00 2188.00 1938.00 2188.00 --
2. Nandraj (et al. 1998) -- -- -- 10.00 84.00 -- -- -- 179.89 134.46 134.00
3. Kunhikannan et al. 1997 30 63 93 -- -- -- -- -- 165.20
4. George et al. (1994) 16.74 70.52 87.26 13.67 71.6 85.27 137.67 128.86
5. Kannan et al. (1991) 23 66 89 - - - NA NA 16.56 - - -
6. Duggal and Amin (1989) 10.43 79.82 90.35 15.99 73.95 89.94 103.56 100.44
7. FRCH 1984 (Jesani et al. 1996)
33.1 58.4 91.5 -- -- -- 28.0 87.08 56.99 -- -- --
* Percentage may not add up to hundred in some cases since some have not sought treatment or might have gone for self treatment
8
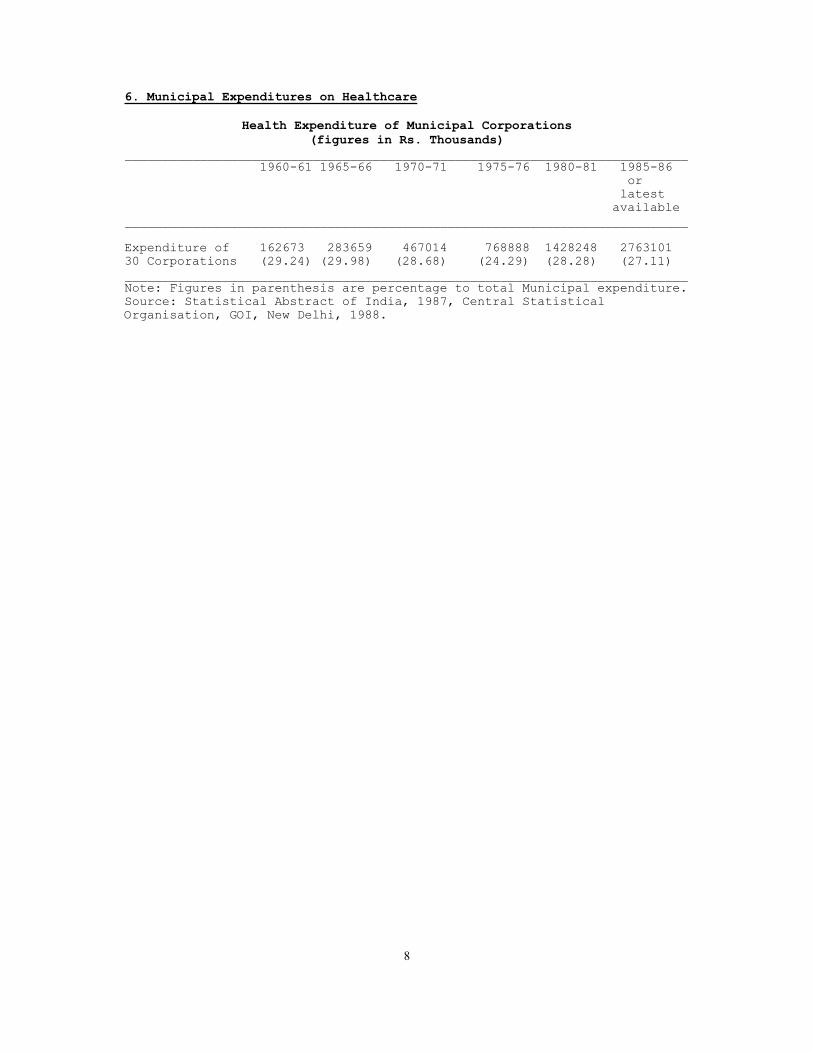
6. Municipal Expenditures on Healthcare
Health Expenditure of Municipal Corporations (figures in Rs. Thousands)
___________________________________________________________________________ 1960-61 1965-66 1970-71 1975-76 1980-81 1985-86
or latest
available ___________________________________________________________________________ Expenditure of 162673 283659 467014 768888 1428248 2763101 30 Corporations (29.24) (29.98) (28.68) (24.29) (28.28) (27.11) ___________________________________________________________________________ Note: Figures in parenthesis are percentage to total Municipal expenditure. Source: Statistical Abstract of India, 1987, Central Statistical Organisation, GOI, New Delhi, 1988.

9
MUNICIPAL HEALTH FINANCE (Medical+Public Health+Water Supply & Sanitation) ___________________________________________________________________________ Year Rs. million Rs. million Source Remarks Municipal Bodies District Boards ___________________________________________________________________________ 1951-52 121.52 (30% of Income) 21.45(6.3% of GOI, Health Incomplete
Income) Stats. India information, population
not known. 1952-53 161.74 (31.8% " ) 13.79 (4.0% ) " " 1953-54 89.00 (30.5% " ) 11.00 (4.9% ) " " 1954-55 146.71 (32.7% " ) 11.31 (2.0% ) " " 1955-56 156.02 (29.4% " ) 4.09 (2.6% ) " " 1956-57 111.93 (32.0% " ) NA " " 1957-58 93.35 (32.7% " ) NA " " 1959-60 355.23 (50.9% " ) 16.24 (6.63% ) " " 1960-61 263.71 (53.64% " ) 9.20 (6.11% ) " " 1970-71 530.97 (35.0% of NA NCAER Rs.24.68 per
total expnd. ) capita(sample 21.5 million population
in 12 Municipal corporations and 27 Municipalities
1974-75 2155.89 (40.2% " " ) NA NIUA-1983 Rs.26.71 per capita (sample
1533 municipal bodies covering 80.7
million population) 1976-77 1294.33 (37.8% " " ) NA NCAER Rs.48.08 per
capita (sample 26.9 million population in
12 Municipal Corporations and 27 Muncipalities)
1979-80 3791.84 (37.83% " " ) NA NIUA-1983 Rs.33.47 per capita (Sample 1533 Municipal bodies with
113.27 million population) 1986-87 2270.00 (38% " " ) NA NIUA-1989 Rs.55 per
capita (sample 41.2 million population of 157 Class I
municipal bodies)
___________________________________________________________________________ Sources: 1. GOI, Health Statistics of India, Various years DGHS, MOHFW, Delhi. 2. NCAER, A Study of Resource of Municipal Bodies, 1980, New Delhi. 3. NIUA, 1983 - A Study of Financial Resources of Urban Local Bodies in India and the Level of Services Provided, New Delhi. 4. NIUA, 1989 - Upgrading Municipal Services : Norms and Financial Implications, NIUA Research Studies Series Number 38, New Delhi.

10
Growth of Mumbai Municipal Corporation (BMC) Health Services 1974-1998
1974 1979 1985 1989 1994 1998 Teaching Hospitals
Expd.Rs. Lakhs 3 3 3 3
4172 3 7792
3 17500
General Hospitals Beds Inpatients Per bed inptnts. OPDs (lakhs) Expnd.Rs.lakhs Exp. Per bed Rs
7 1328 523169 394 167 12575
11 2362 963129 408 56 651 27561
13 2851 945990 332 34 1362 47773
13 3294 790579 240 50 2094 63570
15
15 4000 1000000 250 35 6470 161750
Special Hospitals 5 5 5 5 5 5 Maternity Homes 27 25 28 25 25 27 Dispensaries
Cases (lakhs) Cases per disp. Expnd.Rs.lakhs Exp.Per case Rs
107 123.32 115252
148 158.88 107351
148 40.94 27662 294.73 7.20
150 39.73 26487 338.09 8.51
159 185 40.00 21622 1350.00 33.75
Health Posts 176 176 Source: Annual Reports of Executive Health Officer upto 1989; Know Your Wards, respective years; BMC Budget A, Part II, various years.
Health Care Expenditure of BMC Services Across Levels 1992-98 (Rs. Millions actuals upto 95-96, RE 96-97, BE 97-98)
________________________________________________________________________ 1991-92 92-93 93-94 94-95 95-96 96-97 97-98 Avg. annual growth 92-98 percent ------------------------------------------------------------------------ 1. Total Health 1554 1999 2224 2637 2959 3436 3808 16
(100) (100) (100) (100) (100) (100) (100) Secondary / Tertiary Level 2. Hospitals 906 1193 1286 1528 1700 1984 2157 16 (58) (60) (58) (58) (57) (58) (57) 3. Mat.Homes 56 72 75 89 103 121 14 (4) (4) (3) (3) (3) (4) Primary Care Level 4. Dispensaries 49 63 67 78 92 101 135 19 (3) (3) (3) (3) (3) (3) (4) 5. IPP-V 55 72 121 148 164 147 148 20 (4) (4) (5) (6) (6) (4) (4) -of which HPs 32 48 54 73 80 (2) (2) (2) (3) (3) -of which PPCs 9 10 38 40 39
(..) (..) (2) (2) (1) ----------------------------------------------------------------------- Note: Total Health includes others not included in table like medical education, public health, pollution control etc.. Figures in parentheses are column %s. Also note that the HP data excludes the HPs under ORS dept., thus upto 1993 the expenditure is for 70 HPs and after that for 120 HPs
11
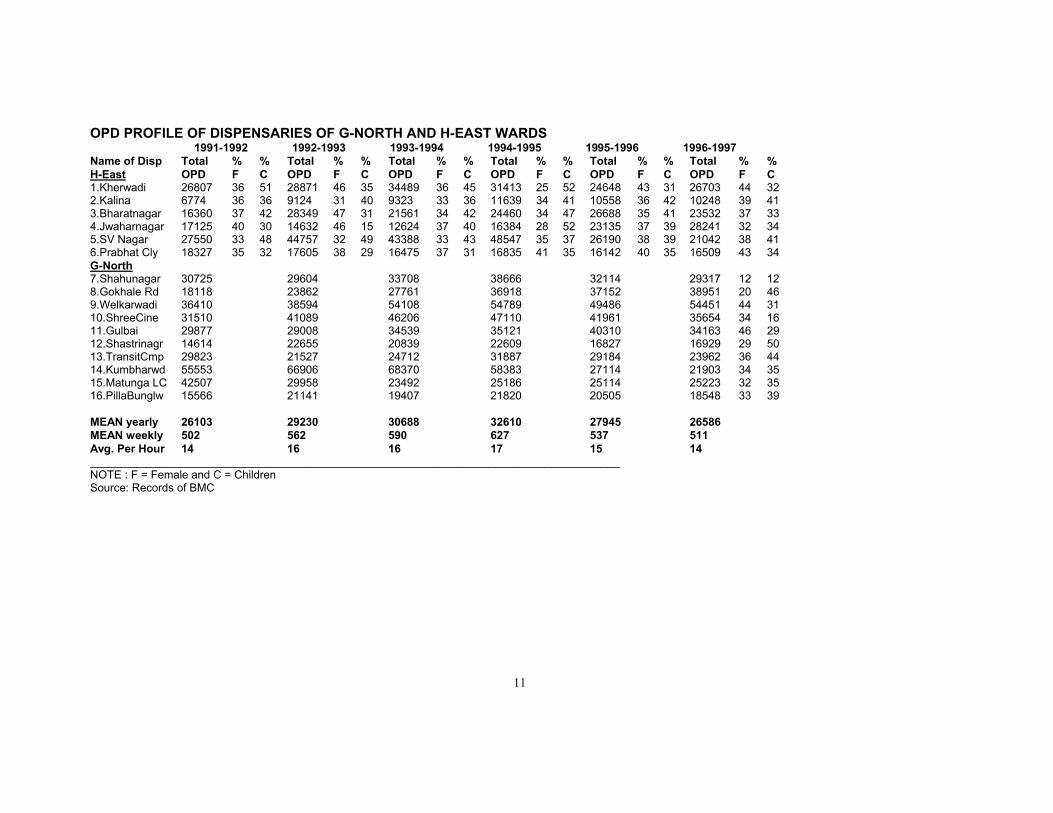
OPD PROFILE OF DISPENSARIES OF G-NORTH AND H-EAST WARDS 1991-1992 1992-1993 1993-1994 1994-1995 1995-1996 1996-1997 Name of Disp H-East
Total OPD
%F
%C
Total OPD
%F
%C
Total OPD
%F
%C
Total OPD
%F
%C
Total OPD
%F
%C
Total OPD
%F
%C
1.Kherwadi 26807 36 51 28871 46 35 34489 36 45 31413 25 52 24648 43 31 26703 44 32 2.Kalina 6774 36 36 9124 31 40 9323 33 36 11639 34 41 10558 36 42 10248 39 41 3.Bharatnagar 16360 37 42 28349 47 31 21561 34 42 24460 34 47 26688 35 41 23532 37 33 4.Jwaharnagar 17125 40 30 14632 46 15 12624 37 40 16384 28 52 23135 37 39 28241 32 34 5.SV Nagar 27550 33 48 44757 32 49 43388 33 43 48547 35 37 26190 38 39 21042 38 41 6.Prabhat Cly 18327 35 32 17605 38 29 16475 37 31 16835 41 35 16142 40 35 16509 43 34 G-North 7.Shahunagar 30725 29604 33708 38666 32114 29317 12 12 8.Gokhale Rd 18118 23862 27761 36918 37152 38951 20 46 9.Welkarwadi 36410 38594 54108 54789 49486 54451 44 31 10.ShreeCine 31510 41089 46206 47110 41961 35654 34 16 11.Gulbai 29877 29008 34539 35121 40310 34163 46 29 12.Shastrinagr 14614 22655 20839 22609 16827 16929 29 50 13.TransitCmp 29823 21527 24712 31887 29184 23962 36 44 14.Kumbharwd 55553 66906 68370 58383 27114 21903 34 35 15.Matunga LC 42507 29958 23492 25186 25114 25223 32 35 16.PillaBunglw 15566 21141 19407 21820 20505 18548 33 39 MEAN yearly 26103 29230 30688 32610 27945 26586 MEAN weekly 502 562 590 627 537 511 Avg. Per Hour 14 16 16 17 15 14 _____________________________________________________________________________________ NOTE : F = Female and C = Children Source: Records of BMC
12
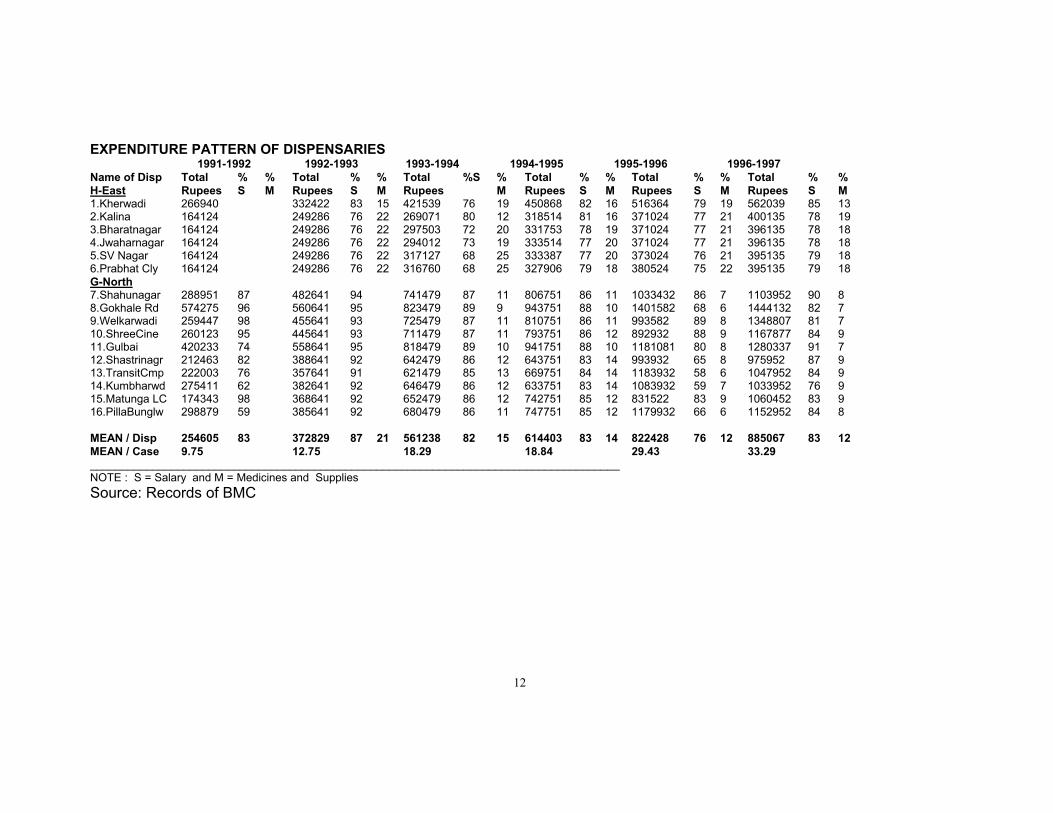
EXPENDITURE PATTERN OF DISPENSARIES 1991-1992 1992-1993 1993-1994 1994-1995 1995-1996 1996-1997 Name of Disp H-East
Total Rupees
%S
%M
Total Rupees
%S
%M
Total Rupees
%S %M
Total Rupees
%S
%M
Total Rupees
%S
%M
Total Rupees
%S
%M
1.Kherwadi 266940 332422 83 15 421539 76 19 450868 82 16 516364 79 19 562039 85 13 2.Kalina 164124 249286 76 22 269071 80 12 318514 81 16 371024 77 21 400135 78 19 3.Bharatnagar 164124 249286 76 22 297503 72 20 331753 78 19 371024 77 21 396135 78 18 4.Jwaharnagar 164124 249286 76 22 294012 73 19 333514 77 20 371024 77 21 396135 78 18 5.SV Nagar 164124 249286 76 22 317127 68 25 333387 77 20 373024 76 21 395135 79 18 6.Prabhat Cly 164124 249286 76 22 316760 68 25 327906 79 18 380524 75 22 395135 79 18 G-North 7.Shahunagar 288951 87 482641 94 741479 87 11 806751 86 11 1033432 86 7 1103952 90 8 8.Gokhale Rd 574275 96 560641 95 823479 89 9 943751 88 10 1401582 68 6 1444132 82 7 9.Welkarwadi 259447 98 455641 93 725479 87 11 810751 86 11 993582 89 8 1348807 81 7 10.ShreeCine 260123 95 445641 93 711479 87 11 793751 86 12 892932 88 9 1167877 84 9 11.Gulbai 420233 74 558641 95 818479 89 10 941751 88 10 1181081 80 8 1280337 91 7 12.Shastrinagr 212463 82 388641 92 642479 86 12 643751 83 14 993932 65 8 975952 87 9 13.TransitCmp 222003 76 357641 91 621479 85 13 669751 84 14 1183932 58 6 1047952 84 9 14.Kumbharwd 275411 62 382641 92 646479 86 12 633751 83 14 1083932 59 7 1033952 76 9 15.Matunga LC 174343 98 368641 92 652479 86 12 742751 85 12 831522 83 9 1060452 83 9 16.PillaBunglw 298879 59 385641 92 680479 86 11 747751 85 12 1179932 66 6 1152952 84 8 MEAN / Disp 254605 83 372829 87 21 561238 82 15 614403 83 14 822428 76 12 885067 83 12 MEAN / Case 9.75 12.75 18.29 18.84 29.43 33.29 _____________________________________________________________________________________ NOTE : S = Salary and M = Medicines and Supplies Source: Records of BMC
13
Concluding Remarks The above data sets indicate the range of information available to establish a National Health Accounts framework. The data sets do have various kinds of problems as referred to earlier but they are not insurmountable if there is a will to set up an organised system of National Health Accounts. From the above data sets it is evident that the Performance Budgets come the closest to any decent system of National Health accounting. Given the latest information apart from the Central Government only ten states (including in some Zilla parishads) and afew Municipal corporations do performance budgeting. According to accounting norms for public expenditures almost all states should have established performance budgeting by the eighties but what we witness is that the few who have set it up are not doing it very seriously and allowing it to collapse. Some recent developments show that the Comptroller and Auditor General of India is seriously considering improving the quality of presentation of data on the accounts of the nation which should make the public health expenditure data available in more useful categories. But financial data is not the only data needed in National Health Accounts; one also needs utilisation and services data to make the accounts system analytic and meaningful so that resources can be used more effectively. Many government departments are now making special efforts at improving the quality of their reports, statistical compendiums etc.. and to do this they have now made a large number of their non-priced publications as priced ones. The Ministry of Health too has adopted pricing but the quality of its data or timely availability is still far from being what it should be. It must be remembered that HII is the only compiled source on a wide array of health information and the users of health data are at its mercy. Hence a lot of pressure on the Ministry of Health will have to be put to make it meet the demands for quality and timely availability of health and health care data. And the ministry in turn will have to exert similar pressure on its constituents from whom it gets the data it compiles, both public agencies and institutions as well as private ones. The latter would require organised regulatory initiatives to make them accountable. That apart the need to regularise the NSS and NFHS kinds of surveys (ofcourse improved ones) for generating population based information is also vital. To conclude an illustration of the Canadian system is given below: In 2000-2001, total health expenditures in Canada were $97.6 billion, up 7.2% from its expenditures of $91 billion in 1999-2000. Total health expenditures in 2000-2001 amounted to $3,174 per capita. The text in the table below gives a profile of the NHEX database used in Canada.
14
Definitions
Health expenditure — includes any type of expenditure for which the primary objective is to improve or prevent the deterioration of health status. This definition allows economic activities to be measured according to primary purpose and secondary effects. Activities that are undertaken with the direct purpose of improving or maintaining health are included. Other activities are not included, even though they may impact health. For example, housing and income support policies have social welfare goals as their primary purpose and are not considered to be health expenditures, yet they are recognized as powerful factors in determining population health.
Source of Finance (Sectors)
National health expenditures are reported based on the principle of responsibility for payment rather than on the source of the funds. It is for this reason, for example, that federal health transfers to the provinces are included in the provincial government sector since it is the responsibility of provincial governments to expend federal transfers on health services. The exception to this principle is that provincial government health transfers to municipal governments are included in the provincial government sector.
Public Sector—includes health care spending by governments and government agencies. It is sub-divided into four levels, as described below:
1. The Provincial Government Sector includes health spending from provincial/territorial government funds, federal health transfers to the provinces/territories, and provincial government health transfers to municipal governments.
2. The Federal Direct Sector refers to direct health care spending by the federal government in relation to health care services for special groups such as Aboriginals, the Armed Forces and veterans, as well as expenditures for health research, health promotion and health protection. Federal Direct health expenditure does not include federal health transfers to the provinces.
3. The Municipal Government Sector expenditure includes health care spending by municipal governments for institutional services; public health; capital construction and equipment; and, dental services provided by municipalities in the provinces of Nova Scotia, Manitoba and British Columbia. Designated funds transferred by provincial governments for health purposes are not included in the municipal sector, but are included with provincial government expenditure.
4. Social Security Funds are social insurance programs that are imposed and controlled by a government authority. They generally involve compulsory contributions by employees, employers or both, and the government authority determines the terms on which benefits are paid to recipients. Social security funds are distinguished from other social insurance programs, the terms of which are determined by mutual agreement between individual employers and their employees. In Canada, social security funds include the health care spending by workers' compensation boards and the drug insurance fund component of the Quebec Ministry of Health and Social Services drug subsidy program.
Health spending by Workers' Compensation Boards (WCB) includes what is commonly referred to by the provincial boards as medical aid. Non-health related items often reported by the Workers’ Compensation Boards as medical aid expenditure such as funeral expenses, travel, clothing etc., are removed.
On January 1, 1997 the government of Quebec introduced a drug program that covered residents of the province, who were not otherwise covered by the provincial program or by private health insurance generally offered through employment. Drug claims for these participants of the new plan are paid from the Drug Insurance Fund. This component of the Quebec drug program is self-funded (i.e. it is funded through the compulsory payment of premiums and not by the provincial government of Quebec).
Private Sector —includes out-of-pocket expenditures made by individuals for health care goods and services; the health insurance claims paid by commercial and not-for-profit insurance firms, as well as the cost of administering those claims; non-patient revenues received by health care institutions such as donations and investment income; private spending on health-related capital construction and equipment; and, health research funded by private sources.
Data Quality—most private sector expenditures are estimated from survey data. Prior to 1996, the Family
15
Expenditure Survey by Statistics Canada, an important source of private sector data, was not carried out annually; therefore, trend data have been imputed for years between surveys. Private sector data were revised following a methodology review in the early 1990s. The revised private sector data incorporated information estimated directly from new sources for 1988 and subsequent years. Prior years were estimated using trend data. As a result, readers should use caution when using the private sector expenditure data for small provinces and for years prior to 1988.
Use of Funds (Categories)
Hospitals— are institutions where patients are accommodated on the basis of medical need and are provided with continuing medical care and supporting diagnostic and therapeutic services. Hospitals are licensed or approved as hospitals by a provincial/territorial government, or are operated by the Government of Canada and include those providing acute care, extended and chronic care, rehabilitation and convalescent care, psychiatric care, as well as nursing stations or outpost hospitals.
Other Institutions —include residential care types of facilities (for the chronically ill or disabled, who reside at the institution more or less permanently) and which are approved, funded or licensed by provincial or territorial departments of health and/or social services. Residential care facilities include homes for the aged (including nursing homes), facilities for persons with physical disabilities, developmental delays, psychiatric disabilities, alcohol and drug problems, and facilities for emotionally disturbed children. Facilities solely of a custodial or domiciliary nature and facilities for transients or delinquents are excluded.
Physicians— expenditures include primarily professional fees paid by provincial/territorial medical care insurance plans to physicians in private practice. Fees for services rendered in hospitals are included when paid directly to physicians by the plans. Also included are other forms of professional incomes (salaries, sessional, capitation).
The physician expenditure category does not include the remuneration of physicians on the payrolls of hospitals or public sector health agencies; these are included in the appropriate category, e.g. hospitals or other health spending.
Other Professionals —services, at the aggregate level represent expenditures for the services of privately practicing dentists, denturists, chiropractors, massage therapists, orthoptists, osteopaths, physiotherapists, podiatrists, psychologists, private duty nurses, and naturopaths. Discrete identification of many of the professions included under other professional services is often possible only when they are reported by provincial medical care insurance plans.
This category has been disaggregated at the Canada level in the Data Tables to provide information on the following sub-categories:
Dental Services—expenditures for professional fees of dentists (includes dental assistants and hygienists) and denturists, as well as the cost of dental prostheses, including false teeth and laboratory charges for crowns and other dental appliances.
Vision Care Services— expenditures for the professional services of optometrists and dispensing opticians, as well as expenditures for eyeglasses and contact lenses.
Other—expenditures for chiropractors, massage therapists, orthoptists, osteopaths, physiotherapists, podiatrists, psychologists, private duty nurses, and naturopaths.
Drugs—at the aggregate level, include expenditures on prescribed drugs and non-prescribed products purchased in retail stores. This category has been disaggregated at the Canada level in the Data Tables to provide information on the following sub-categories:
Prescribed Drugs—substances sold under the Food and Drug Act which require a prescription.
Non-prescribed Drugs—include two sub-components; Over-the-Counter drugs; and, Personal Health Supplies.
• Over-the-Counter Drugs— therapeutic drug products not requiring a prescription.
16
• Personal Health Supplies— include items used primarily to promote or maintain health, e.g. oral hygiene products, diagnostic items such as diabetic test strips and medical items such as incontinence products.
The drug category does not include drugs dispensed in hospitals and generally in other institutions. These are included with the category of hospitals or other institutions.
Capital— includes expenditures on construction, machinery and equipment of hospitals, clinics, first-aid stations, and residential care facilities. (See also Technical Notes.)
Public Health and Administration —expenditures for items such as measures to prevent the spread of communicable disease, food and drug safety, health inspections, health promotion activities, community mental health programs, public health nursing and all costs for the infrastructure to operate health departments.
Other Health Spending —at the aggregate level includes expenditures on home care, medical transportation (ambulances), hearing aids, other appliances and prostheses, prepayment administration, health research and miscellaneous health care. This category has been disaggregated at the Canada level in the Data Tables to provide information on the following sub-categories:
Prepayment Administration— expenditures related to the cost of providing health insurance programs by either government or private health insurance firms.
Health Research—expenditures for research activities designed to further knowledge of the determinants of health, health status or methods of providing health care, evaluation of health care delivery or of public health programs. The category does not include research carried out by hospitals or drug companies in the course of product development. These amounts would be included with the hospital or drug categories respectively.
Other—expenditures for items such as home care, medical transportation (ambulances), hearing aids, other appliances, training of health workers, voluntary health associations, and occupational health to promote and enhance health and safety at the workplace.
The definition of home care that is currently in use in the National Health Expenditure Database is based on the definition used by the OECD, under which only the health professional component of home care is intended to be included. The portion that is commonly referred to as home support is considered to be a social service expenditure rather than a health expenditure and is excluded when it can be identified. A project is underway at CIHI to investigate the feasibility of developing a set of estimates that identify both the health professional and the home support components of home care
Source: http://secure.cihi.ca/cihiweb/dispPage.jsp?cw_page=statistics_nhex_definitions_e References : CAG, various years : Combined Finance and Revenue Accounts of the Union and State Governments, Comptroller and Auditor General, GOI, New Delhi CBHI, various years : Health Information of India, CBHI, Ministry of Health, New Delhi Census - 1981 and Others : Economic Tables - B Series, Census Commissioner, New Delhi CSO, 1989 and various years : Basic Statistics Relating to the Indian Economy, GOI, New Delhi Dilip TR and Ravi Duggal, 2002: Demand for Public Health services in Mumbai (draft report), CEHAT, Mumbai Duggal Ravi, 1993: Employee Medical Benefits in the Corporate Sector, FRCH, Bombay Duggal Ravi and Sucheta Amin, 1989 : Cost of Health Care, FRCH, Bombay Duggal Ravi and Sunil Nandraj, 1991 : Regulating the Private Health Sector, mfc Bulletin No.173-174 Duggal Ravi, Sunil Nandraj and Sahana Shetty, 1992 : State Sector Health Expenditures, FRCH, Bombay Duggal Ravi, Sunil Nandraj and Asha Vadair, 1995 : Health Expenditure Across States - Part I and II, Economic and Political Weekly, April 15 and 22 FRCH, 1993 : Health Research Studies in India, FRCH, Bombay George Alex, Ila Shah and Sunil Nandraj, 1993 : Household Health Expenditures in Madhya Pradesh, FRCH, Bombay GOI, 1946 : Report of the Health Survey and Development Committee by Joseph Bhore - 4 Vols., GOI, New Delhi IAMR, 1997 : Manpower Profile of India, Yearbook 1997, 5th Edition, IAMR, New Delhi IIM, 1987: Stuudy of Health Care Financing in India, IIM, Ahmedabad Kanan KP, Thankappan, Kutty and Aravindan, 1991 : Health and Development in Rural Kerala, KSSP, Thiruvanathapuram
17
Kunhikannan et al. 1999: Changes in the Health Status of Kerala 1987-1997, KSSP, Thiruvananthapuram Labour Bureau, various Years: Indian Labour Yearbook, Labour Bureau, Shimla Madhiwala, Neha et.al., 2000: Health, Households and Women’s Lives, CEHAT, Mumbai Mahapatra P and P Berman, 1992 : Evaluating Public Hospital Performance - Secondary Hospitals in Andhra Pradesh, APVPP, Hyderabad Nandraj, Sunil et.al., 1998: Women and Healthcare in Mumbai, CEHAT, Mumbai Nandraj Sunil and Ravi Duggal, 1996 : Physical Standards in the Private Health Sector, Radical Journal of Health (New Series), Vol II : 2/3 NCAER – 1990- all India: NCAER – Household survey of Medical Care, NCAER, New Delhi, 1992 NCAER 1995: Household Survey of Health Care Utilisation and Expenditure Working paper No. 53, New Delhi NFHS - 1992 : National Family and Health Survey, All India and respective States, IIPS, Bombay NFHS 2, 2000: National Family Health Survey - 1998-99, Ministry of Health, New Delhi NIPFP, 1993 : Structural Adjustment Program - Its Impact on the Health Sector, NIPFP, New Delhi NSSO -1987 : Morbidity and Utilisation of Medical Services, 42nd Round, Report No. 384, National Sample Survey Organisation, New Delhi, 1990 NSSO -1996 : Report No. 441 – 52nd Round, NSSO, New Delhi ,1998 RGI, various years : Sample Registration System - Annual Bulletin, Registrar General Office, New Delhi Seal SC, et.al. 1955...1963 : Reports of the Short General Health Survey, various states, AIIH&PH, Calcutta This paper is a revised and updated version of the paper titled ‘Making a Health Services Database’ published in CP Chandrasekhar and Jandhyala BG Tilak (eds.) India’s Socio-Economic Database- Surveys of Selected areas, Tulika, New Delhi Ravi Duggal Centre for Enquiry into Health and Allied Themes (CEHAT) Sai Ashray, Aaram Society Road, Vakola, Santacruz East, Mumbai 400055 Web: www.cehat.org Email : [email protected] or [email protected]