Embed Size (px)
Citation preview

Report
REPORT
HEALTH RISK ASSESSMENT RASP MINE BROKEN HILL
Broken Hill Operations Pty Ltd
Job No: 08844
2 April 2015

i | P a g e
PROJECT TITLE: Health Risk Assessment Rasp Mine Broken Hill
JOB NUMBER: 08844
PREPARED FOR: Broken Hill Operations Pty Ltd
PREPARED BY: Lyn Denison
APPROVED FOR RELEASE BY: Damon Roddis
DISCLAIMER & COPYRIGHT: This report is subject to the copyright statement located at www.pacific-environment.com Pacific Environment Operations Pty Ltd ABN 86 127 101 642 (trading as Toxikos).
DOCUMENT CONTROL
VERSION DATE PREPARED BY REVIEWED BY
V1 19/11/2014 L. Denison and J. Mifsud D. Roddis
Final V3 31/3/15 L. Denison D. Roddis
Revision 4 2/4/15 L. Denison D. Roddis
BRISBANE: Level 1, 59A Melbourne Street South Brisbane Qld 4101 PO Box 3306 South Brisbane Qld 4101 Ph: +61 7 3004 6400 Fax: +61 7 3844 5858
Unit 1, 22 Varley Street Yeerongpilly, Qld 4105 Ph: +61 7 3004 6460
ADELAIDE: 35 Edward St, Norwood SA, 5067 PO Box 3187, Norwood SA, 5067 Ph: +61 8 8391 4032
SYDNEY: Suite 1, Level 1 146 Arthur Street North Sydney NSW 2060 Ph: +61 2 9870 0900 Fax: +61 2 9870 0999
MELBOURNE: Level 10, 224 Queen Street Melbourne VIC 3000 Ph: +61 3 9036 2637 Fax: +61 9642 1203
PERTH: Level 1/Unit 3, 34 Queen Street Perth WA 6000 Ph: +61 8 9481 4961

ii | P a g e
CONTENTS
1 EXECUTIVE SUMMARY 3 2 INTRODUCTION 4 3 BACKGROUND 4 4 METHODOLOGY 5
4.1 Lead 5 4.2 Monitoring Data inputs to the Health Risk Assessment Process 6
5 RESULTS 9 5.1 Population Profile of Broken Hill 9 5.2 Baseline Health Status of the Broken Hill Population 9 5.3 Lead Health Risk Assessment 10
5.3.1 Hazard Assessment 11 5.3.2 IEUBK Blood Lead Assessment 12 5.3.3 Summary of Lead Risk Assessment 19
6 CONCLUSIONS 21 7 REFERENCES 22

3 | P a g e
1 EXECUTIVE SUMMARY
A health risk assessment (HRA) for lead (Pb) has been conducted for the Rasp Mine in Broken Hill. The driver for completion of this project relates to Condition 14 of Consolidated Approval 07_0018. This condition requires that within one year of the commencement of operation of the project (and every five years thereafter) the Proponent will update the human health risk assessment prepared for the project and presented in the project’s Environmental Assessment. Importantly, the updated risk assessment must take into account monitoring data collected under the approval. The current scope of work explicitly addresses the requirements of the above Condition 14.
The HRA has used Pb data that has been monitored at two locations in close proximity to the boundary of the mine. This data is considered to be representative of the most potentially exposed segments of the Broken Hill population and therefore provides an estimate of the worst case community exposures.
The two monitoring locations referenced represent exposures at sensitive receptor locations previously classified as receptors R8 and R27. In the original HRA it established that receptor R8 was likely the most potentially affected receptor and receptor R27 was not assessed. Changes to the configuration at the site (relocation of the processing plant closer to R27) means that this location is the receptor where greatest potential for air quality / Pb impacts may occur. As such, evaluation of impacts at these two (effectively fenceline) receptor locations provides a conservatively high estimation of impacts within the Broken Hill community. It may be reasonably assumed that any potential impacts associated with mine activities will be lesser at other locations, given that they will be further removed from the mine’s operations.
An HRA was conducted as part of the approvals process for the current Rasp Mine operations in 2010. Using the same assumptions adopted in the original HRA, the current assessment based on monitoring data as opposed to atmospheric dispersion modelling predictions, shows that the incremental increase in blood Pb levels arising from the current mine operations is lower than that predicted in the original HRA.
This is since the monitored dust deposition levels which are used to estimate soil concentrations are significantly lower than those used in the original assessment. The soil component is used in the calculation of blood Pb from ingestion which is the most significant exposure pathway. The results of the study also indicates that the emissions from the processing plant are not making a significant contribution to ambient Pb levels in the local community.
Calculations to assess the impact of airborne Pb via inhalation on blood Pb levels was also conducted. The results of these calculations show that the incremental increase in blood Pb due to air alone is very low with incremental increases between 0 and 0.1 µg/dL which is 100 times less than the NHMRC guideline for blood Pb levels.
Overall the health risk assessment concludes that current emissions from the mine are not significantly impacting on the blood Pb levels in children in Broken Hill. This assessment is based on the worst case exposures and the impact on the majority of the population will be significantly less than that presented in this assessment.

4 | P a g e
2 INTRODUCTION
Broken Hill Operations Pty Ltd, part of CBH Resources – Rasp Mine, has retained Pacific Environment - Toxikos to undertake a health risk assessment (HRA) for lead (Pb) for their Rasp Mine in Broken Hill. The HRA is required as part of the approval obtained for the operation of the underground mine in 2011.
An HRA was conducted as part of the approvals process and assessed the impact of Pb emissions on blood Pb levels in children in Broken Hill (Toxikos, 2010).
The current HRA uses the same methodology as used in the original HRA to estimate incremental blood Pb level increases in children. This assessment used the USEPA Integrated Exposure Uptake and Biokinetic (IEUBK) Model.
The Pb risk assessment is based on ambient air quality monitoring data collected in the vicinity of the Rasp Mine during 2013-14.
3 BACKGROUND
The Rasp Mine is located centrally within the city of Broken Hill and the leases occupy the central region of the historic Broken Hill Line of Lode ore body incorporating the original mine areas that commenced operations in the 1880s. In January 2011, development approval from the (then) NSW Department of Planning was obtained for underground operations at the site.
Commissioning of the mine has now been completed and commercial rates of production are being achieved. Annual production is planned to average 34,000 tonnes of zinc (Zn) metal in concentrate, 28,000 tonnes of Pb metal in concentrate, and 1.1 million ounces of silver (Ag) in the Pb concentrate.
Soil Pb levels and human uptake, particularly in children, is recognised as an historical and on-going issue in the Broken Hill area. The human health risk assessment undertaken as part of the approvals process showed that across all age groups, background Pb levels account for at least 96% of cumulative Pb intakes (including background Pb and contributions from the project).
Notwithstanding, the worst-case impact predicted by the original HRA equated to 60% tolerable daily intake for infants aged 0.5 to three years. The estimated Pb contribution from the project was found to contribute 4% of this intake (Toxikos, 2010).
The increase in blood Pb levels in children due to the Rasp Mine project was predicted to be no more than 0.75 µg/dL (one to two years old at the most-affected receiver location), which is less than 10% of the maximum blood Pb concentration recommended by the National Health and Medical Research Council (10 µg/dL).
As part of open and transparent communication of Pb risks, and to verify predicted impacts from the project, the NSW Department of Planning and Environment, in issuing the approvals for the Rasp Mine, required that the Proponent update the human health risk assessment for the project on a 5-yearly basis. The first update would be required within 12 months of the commencement of operation, and would be based on monitoring data collected in accordance with the requirements of the conditions of approval. Specifically, Condition 14 of Consolidated Approval 07_0018 states:
Within one year of the commencement of operation of the project, and every five years thereafter, unless otherwise agreed by the Director-General, the Proponent shall update the

5 | P a g e
human health risk assessment prepared for the project and presented in the EA to the satisfaction of the Director-General. The updated risk assessment shall:
(a) be prepared by a suitably-qualified expert whose appointment has been endorsed by the Director-General;
(b) take into account monitoring data collected under this approval, and such other information as may be relevant to the assessment; and
(c) be submitted to the Director-General, OEH and the Western Area Health Service within one month of its completion.
The current scope of work explicitly addresses the requirements of the above Condition 14.
4 METHODOLOGY
The current HRA was undertaken according to the national risk assessment guidelines published by enHealth (2012). The risk assessment process comprises five components: issues identification, hazard (or toxicity) assessment, exposure assessment, risk characterisation and uncertainty assessment. These are detailed in the document “Environmental Health Risk Assessment: Guidelines for assessing human health risks from environmental hazards” (enHealth, 2012).
Some of the key factors and questions that are taken into consideration at each of these stages include the following.
1. Issue Identification – Identifies issues that can be assessed through a risk assessment and assists in establishing a context for the risk assessment.
2. Hazard Assessment – Identifies hazards and health endpoints associated with exposure to hazardous agents and provides a review of the current understanding of the toxicity and risk relationship of the exposure of humans to the hazards.
3. Exposure Assessment – This task identifies the groups of people who may be exposed to hazardous agents and quantifies the exposure concentrations.
4. Risk Characterisation – This task provides the qualitative evaluation of potential risks to human health. The characterisation of risk is based on the review of exposure response relationship and the assessment of the magnitude of exposure.
5. Uncertainty Assessment – identifies potential sources of uncertainty and qualitative discussion of the magnitude of uncertainty and expected effects on risk estimates.
The approach used in this risk assessment is also consistent with the approaches recommended by NHMRC (2006) and NEPC (2011) for air pollution risk assessments.
4.1 Lead
The approach that has been taken to evaluating the health risk from Pb is consistent with that used in 2010 during the approvals stage for the current operations at the Rasp Mine. Blood Pb levels in children arising from exposure to Pb has been assessed using the USEPA IEUBK Pb model. All calculations have used the ambient air quality monitoring data collected by the Rasp Mine in the vicinity of the mine site during current operations.
The age groups assessed are the same as those used in the original HRA. The monitoring data used is consistent with the receptors identified to be the most exposed in the original HRA. These relate to Receptor 8 (referred to as R8) and Receptor 27 (referred to as R27), which thus provide an estimate of the worst case health risk for the wider population of Broken Hill.

6 | P a g e
4.2 Monitoring Data inputs to the Health Risk Assessment Process
The two monitoring locations referenced in this assessment represent exposures at sensitive receptor locations previously classified as receptors R8 and R27 (see Figure 2 for locations of these receptors). In the original HRA it established that receptor R8 was likely the most potentially affected receptor and receptor R27 was not assessed. Changes to the configuration at the site (relocation of the processing plant closer to R27) means that this location is the receptor where greatest potential for air quality / Pb impacts may occur. As such, evaluation of impacts at these two (effectively fenceline) receptor locations provides a conservatively high estimation of impacts within the Broken Hill community. It may be reasonably assumed that any potential impacts associated with mine activities will be lesser at other off site receptors, given that they will be further removed from the mine’s operations.
For the purposes of the HRA process, daily time series of Pb concentration have been developed from the available air quality monitoring data at the locations shown in Figure 1. These time series are designed to be representative of exposures likely to occur in the vicinity of receptors R27 and R8..
The daily time series of Pb representative of receptor R27 has been computed based on the TEOM2 PM10 data multiplied by the ratio of FY14 Pb/PM10 recorded at HVAS2 (this monitor is co-located monitor with TEOM2). This time series therefore includes the HVAS2 data (recorded at 6 day intervals) and the scaled TEOM data to fill in the gaps.
The daily time series of Pb representative of receptor R8 has been computed based on the TEOM2 PM10 data multiplied by the ratio of the Pb deposition recorded at deposition gauges DG6 and DG1. Deposition gauge DG6 is co-located with HVAS2/TEOM2 while DG1 is located near receptor R8. The ratio of Pb deposition at DG6 and DG1 for the FY14 period was calculated. These monthly ratios were then applied as a scaling factor to the full PM10 data set from TEOM2.
The daily time series of Pb representative of receptor R8 has been computed in a similar manner to the above. In this case, the Pb data derived for receptor R8 has been multiplied by the ratio of the Pb deposition recorded at gauges DG6 and DG1.
It is noted that there is some missing days of data at the end of the period. It is suggested that these values may be filled with the average PM10/Pb value across the whole data set. Similarly, on days where high PM10 concentrations are observed that are likely due to dust storm / bushfire events, it is inappropriate to do a direct scaling of PM10 data to derive an equivalent Pb value (this results in unrealistically high values of Pb). On such occasions, it is suggested that the average Pb values across the data set could be substituted.
Overall, the annual average Pb concentrations are predicted to be ~0.3 µg/m3 at receptor R27 and ~0.4 µg/m3 at receptor R8. This is compared to the EPA annual average criterion of 0.5 µg/m3.
It is acknowledged that these values are greater than those predicted during the Environmental Assessment for the project. The difference is largely attributed to assumptions made as to the ability of the project to control baseline Pb levels (an 80% control was assumed to be achievable on existing ‘free areas’). This is supported by the Pb data at the two sites, since Pb concentrations are anticipated to be higher at R8 than at R27. Receptor R8 is closer to locations identified as being existing free areas, yet further away from mine activities relative to receptor R27.

7 | P a g e
FIGURE 1: Rasp Mine Ambient Air Quality Monitoring Locations

8 | P a g e
FIGURE 2: Map Showing Sensitive Receptor Locations, including Receptors R8 and R27

9 | P a g e
5 RESULTS
5.1 Population Profile of Broken Hill
Population statistics have been obtained for Broken Hill from the Australian Bureau of Statistics (ABS). The current population in Broken Hill based on the 2011 census is 18,430 people. Of this 5.8% are less than five years of age and 19.8% are 65 years or older. Indigenous Australians comprise 7.5% of the population. The median age of the population is 43 years which is higher than the NSW and Australian median ages of 38 and 37 years respectively..
As noted in Section 5.4.3, people who are of low socioeconomic status (SES) have been identified as a vulnerable group for the effects of air pollution. There are several indices of social deprivation used to assess SES in Australia. One commonly used is the SEIFA index. The SEIFA index is a measure of relative social disadvantage and takes into account 20 variables to assess relative social disadvantage. The lower the SEIFA index the greater the level of disadvantage.
ABS data on the SEIFA indices for regions in Australia has shown that the SEIFA index for the Broken Hill Local Government Area are significantly lower than the rest of NSW. The SEIFA index falls within the second lowest decile in NSW. This indicates that this community is socially disadvantaged compared to the rest of the State.
5.2 Baseline Health Status of the Broken Hill Population
Health statistics for NSW are available on the NSW Health website (www.healthstats.nsw.gov.au). Data for health outcomes that may be impacted by air pollution are shown in Table 2. The data for Far Western NSW (which includes Broken Hill) is compared to other local health districts and is shown as the number of cases per 100,000 people to enable comparison across the different areas. From the information shown in Table 2 it is clear that the underlying health status for conditions that may be impacted by air pollution are generally higher than that experienced in Sydney and better compared to some other local health districts.

10 | P a g e
Table 2: Health Outcomes by Local Health District (number of cases per 100,000 people)
Sydney Far West NSW Western NSW Illawarra Shoalhaven
Hunter
Cardiovascular Disease Hospitalisations
1,582 1,886 2,516 2,255 1,893
Chronic Obstructive Pulminary Disease (COPD) Hospitalisations 65+ years
1,194 2,344 2,174 1,721 1,489
Asthma Hospitalisations 136 191 211 216 143
Influenza and Bronchitis Hospitalisations 65+ years
982 596 1706 1185 1070
Cardiovascular Disease deaths
157 210 228 175 198
COPD Deaths
19 36 27 20 24
Given Broken Hill’s history of mining Pb, blood Pb levels in children have been routinely monitored for many years. Elevated blood Pb levels became a notifiable condition in NSW in 1997. Most notifications in children are from known contaminated areas or associated with home renovations. A NSW Health report has shown that there has been a steady decline in blood Pb levels among preschool children living in Broken Hill over recent years. The percentage of children aged 1 to 4 years with blood Pb levels in the permissible range has increased from 13.6% in 1991 to 87.0% in 2010 (NSW Health: Blood Pb Levels in Broken Hill Children, accessed NSW Health Statistics website, accessed 21 October 2014). The acceptable level for blood Pb established by the NHMRC is 10 µg/dL. This value is currently under review.
The NSW Health Report also showed that blood Pb levels in Aboriginal children in Broken Hill has been decreasing at an even more rapid rate: from 29% in the permissible range in 1998 to 75% in 2008. Nevertheless, in 2010, 60% of Aboriginal children had blood Pb levels within the permissible levels and 3% had levels above 29 µg/dL while none of non-Aboriginal children had levels that high (Lesjak 2011). The variability in the proportion of Aboriginal children with permissible levels of blood Pb levels is most likely due to the low number of Aboriginal children in the 1-4 years age group in Broken Hill and low attendance to screening (NSW Health Statistics Website, accessed 21 October 2014).
A recent study published by researchers at Macquarie University (Taylor et al, 2014) reports a higher proportion of preschool children with blood Pb levels above the permissible range. Pb levels in preschool children. The study reports that as of 2012 the percentage of children between one and four years with blood Pb levels above the permissible range as being 21%.
5.3 Lead Health Risk Assessment
The HRA for Pb is presented in the following sections. The hazard assessment provides a summary of the latest evidence for the health effects of Pb and the levels at which they may be observed.

11 | P a g e
Section 5.3.2 presents a summary of the exposure data used in the modelling of the blood Pb levels in children attributable to emissions from the mine, the results of which are presented in Section 5.3.2.
5.3.1 Hazard Assessment
The health effects of Pb have been well studied over several decades. Lead is associated with a wide range of adverse health effects including effects on the blood, central nervous system, cardiovascular system, immune system and the kidneys. A significant proportion of Pb that is inhaled can accumulate in the body. Children are the group most susceptible to the adverse health effects of Pb, due to both higher likelihood of exposure via the ingestion pathway and because of their developing bodies. In the past 40 years, recommendations for limiting exposure to Pb in the community have been largely driven by the need to protect children from the effects of Pb on the developing brain.
Lead is both persistent in the environment and has multiple exposure pathways, these being mainly air, water and soil. Blood Pb levels are the key biomarker of current and recent Pb exposure, and may also be a reasonably good indicator of Pb body burden. Children are the group most susceptible to adverse health effects of Pb. Evidence has emerged for neurological health effects at blood Pb levels less than 10µg/dL, with some studies reporting adverse effects as low as 2µg/dL. Effects measured include lowering of IQ and delinquency. Evidence has also increased for adverse neurological health effects in adults.
Strong evidence exists for a causal relationship between Pb and increased blood pressure or hypertension in adults at blood Pb levels less than 10µg/dL. Some evidence exists for an association between Pb and cardiovascular morbidity and mortality, but results are inconclusive at this stage. Renal function impairment in adults, measured as elevated serum creatinine and glomerular filtration rate (GFR) has been reported at blood Pb levels between 2 and 10µg/dL in studies with adults in Europe and America.
The most recent international review of Pb was conducted by the USEPA and completed in 2013. The review built on the findings of earlier reviews and identified a number of new epidemiological and toxicological studies that have been conducted since the previous reviews. The NHMRC also conducted a review on the health effects of Pb completed in 2013.
The findings of the 2013 USEPA review (USEPA, 2013) confirmed the findings of the 2006 review with stronger evidence for causal relationships between blood Pb and some adverse health outcomes in both adults and children. Children remain the most sensitive groups to the effects of exposure to Pb.
The results of multiple epidemiological studies conducted in diverse populations of children consistently show adverse effects of Pb exposures on cognitive function (measured by decreases in IQ, decreased academic performance and poorer performance on tests of executive function). Blood Pb associated effects on cognitive function were found in populations of children (ages 4-10) with mean blood Pb levels in the range 2-8 µg/dL (USEPA, 2013). Evidence suggests that some of these Pb-related cognitive effects may be irreversible and that the neurodevelopmental effects of Pb exposure may persist into adulthood. There is no evidence for a threshold below which there are no harmful effects on cognitive function from Pb exposure. Epidemiological studies also show that Pb exposure is associated with decreased attention and increased impulsivity and hyperactivity in children (externalising behaviours). This finding is supported by findings in animal studies demonstrating both analogous effects and biological plausibility at relevant exposure levels. Lead exposure can also have adverse effects on blood cells and blood producing organs and is likely to cause an incremental risk of symptoms of depression and anxiety and withdrawn behaviour

12 | P a g e
(internalising behaviours), decreases in auditory and motor function, asthma and allergy, as well as conduct disorders in children and young adults.
A large body of evidence from both epidemiological studies of adults and toxicological studies in animals demonstrates the effects of long-term exposure to Pb on increased blood pressure and hypertension. In addition to effects on blood pressure, Pb exposure can also lead to coronary heart disease and death from cardiovascular causes. Exposure to Pb is also associated with decreases in cognitive function, symptoms of depression and anxiety and immune effects in adults. The extent to which the effects of Pb on the cardiovascular system are reversible is not well characterised. In addition, the frequency, timing, level and duration of Pb exposure causing the observed effects in adults is not well known and higher past exposures may contribute to the effects observed later in life. However it is clear that Pb exposure can result in adverse effects on the cardiovascular system in adults and may also affect a broad array of organ systems (USEPA, 2013).
5.3.2 IEUBK Blood Lead Assessment
To assess the impact of Pb emissions associated with the Rasp Mine, the monitored Pb data (concentration and deposition) collected since the current operations commenced has been used in the IEUBK model to assess any incremental increase in blood Pb in children that may be attributable to emissions from the mine. The modelling has assessed the same age groups as those assessed in the original HRA conducted in 2010. The methodology used in the original HRA has been applied as well as a sensitivity analysis using the more conservative default assumptions in the IEUBK model. The data used in the model was processed by Pacific Environment, referencing the raw data set provided by the Rasp Mine. Data representative of both receptors R27 and R8 has been used as these are the receptors that were shown in the original HRA to be the potentially most affected by activities at the mine.
5.3.2.1 Introduction The Integrated Exposure Uptake and Biokinetic Model for Pb in children (IEUBK) was developed by the U.S. Environmental Protection Agency, Technical Review Workgroup for Metals and Asbestos. The model consists of four integrated modules to estimate the level of Pb in children exposed to Pb contamination. The four modules are exposure, uptake, bio-kinetic and probability distribution. For a detailed description of the model the reader is directed to the User’s Guide Invalid source specified..
There are five input data windows in IEUBK for each of the common sources of Pb exposure. An additional window is available for consideration of alternative Pb sources and a window to specify bioavailability for each of these sources.
The model has default values that may be changed to reflect site-specific conditions. The original Toxikos assumptions (Toxikos, 2010) were used with the additional input of depositional dust and PM10 Pb concentrations monitored at the site. In addition the model was run, using the IUBEK default values and using the local values used in the original HRA with IEUBK default bioavailabilities.
The model runs were designed to focus only on the incremental component attributable to mining activities as in the original HRA study. Dietary intake and drinking water modules were excluded from the model as these were not considered to be attributable to mining activities.
5.3.2.2 Exposure Assessment Daily Pb within the PM10 size fraction (PM10 Pb) for the period 1 July 2013 to 30 June 2014 was used to generate the annual average outdoor Pb concentrations. The annual average Pb concentration for R8 was 0.39 µg Pb/m³ and at R27 was 0.30 µg Pb/m³. These air Pb concentrations were around three

13 | P a g e
times higher than the original data used by Toxikos (2010) of 0.12 µg Pb/m³ at R8. It is important to acknowledge that the data used in the original HRA was based on atmospheric dispersion modelling, not directly monitored data as in the current assessment. Blood Pb levels were not determined for R27 in the original HRA. Only data for R8 is available for comparison between the original HRA based on the results of air dispersion modelling and the current HRA which is based on monitoring results from locations adjacent to R8 and R27.
The monitoring data used in the current HRA reflects the present operations at the mine as well as the relocation of the processing plant, including the mill, closer to R27 than assumed in the original air dispersion modelling. Although revised air modelling was done for the reconfigured site, the HRA was not revised in light of this new information at the time of the original HRA in 2010.
The original HRA calculated blood lead concentrations for a range of receptors using the outputs from the air dispersion modelling. Not all these locations can be assessed in the current HRA as it is based on monitoring data alone, which has been conducted at two locations directly applicable to the HRA process. Although extrapolation to the other receptors could be done for this current HRA, the assumptions required in such an exercise would create significant uncertainty in the outputs which would subsequently carry over to the HRA outputs. The use of the monitoring data provides a more robust assessment and reflects the worst case exposures from the current mine operations.
Monthly depositional Pb data was used to provide an annual Pb deposition total of 0.044 g Pb/m2/annum at R8 and 0.038 g Pb/m2/annum at R27 in the current HRA. These dust deposition rates are approximately 25 and 10 times respectively lower than those used in the original HRA modelling (1.1 and 0.4 g Pb/m2/annum at R8 and R27 respectively). Once again, it is noted that the data used in the original HRA was based on atmospheric dispersion modelling, not directly monitored data as in the current assessment. It was also assumed that all PM10 concentrations contributed to the dust deposition and subsequent soil concentrations. This is a highly conservative assumption and will overestimate the soil concentrations used in the original HRA as PM10 typically remains suspended in air for a significant period of time. The dust deposition data in the original HRA was referenced as being indicative of the contribution to the soil exposure pathway.
In the original HRA (Toxikos 2010) three scenarios were used to factor in different sources of Pb;
• Scenario 1 represented the background Pb in dust arising from exposed contaminated soils, called ‘free’ areas in the original HRA report.
o 1a assumed no control of dust generation. o 1b assumed 80% control of dust generation.
• Scenario 2 comprised dust generated by the proposed mining activities. • Scenario 3 comprised a combination of Scenario 1b and 2.
Each receptor location was allocated a percentage of dust coming from exposed areas and from mine activities. Location R8 was estimated to receive 36% of dust from mining activities and 64% from exposed areas, and location R27 had 98% of dust coming from exposed areas and 2% from mining activities. In running the IEUBK model for the current HRA, it was assumed that these proportions of dust from exposed areas and mining activities have not changed since the original HRA. This data provides an estimate of the background concentrations in the soil. The exposure from the current operations is represented by the monitored data.
In rerunning the model, the assumption that the exposed areas had 80% control of dust generation, was not required because actual Pb monitoring data was used. Therefore only one scenario was evaluated consisting of the combined dust generated from exposed areas and mining activities.

14 | P a g e
Biological accessibility (bioaccessibility or BAc) of Pb from dust was determined in the original HRA by testing metals from surface soil samples from the mine site and ore, using a physiologically based extraction test (PBET). The average bioaccessibility of Pb from site dust was 7.3% and from mine ore was 1.4%.
Bioavailability of Pb from soil dust was derived by assuming that 50% of bioaccessible Pb is dissolved in water. The site specific bioavailability for airborne dust was assumed to be 100% absorbed therefore the bioavailability input for the IEUBK model was the same as the bioaccessibility of Pb from the site specific dust source.
The IEUBK model was setup using the same assumptions as the original HRA but using the actual depositional Pb and PM10 Pb data for the period of 1 July 2013 to 30 June 2014 and recalculating the 15 year soil concentration using the same equation as the original HRA; that is, by multiplying the annual deposited dust (g Pb/m2/annum), the number of years (assuming the same concentrations of Pb deposition and inhalable/air Pb for 15 years), the density of soil (1.5 g/cm3), the depth of incorporation (2 cm) and a correction factor of 0.01 for the units used. The assumptions in regard to physiological factors used in the IEUBK model, for example ventilation rates and ingestion of soil for children of particular age groups, is constant and does not change in relation to mine activities. Therefore, the relocation of the processing plant closer to R27 does not affect these assumptions. The impact of emissions from the relocation of the processing plant is reflected in the monitoring data which has been used in the IEUBK modelling in place of the original air dispersion modelling results.
In addition, two other model runs were made, the first using the more conservative IUEBK default values, and a second using the localised values for time outdoors, ventilation rate, and the percentage of outdoor dust to calculate indoor dust but retaining the more conservative IEUBK bioavailability values.
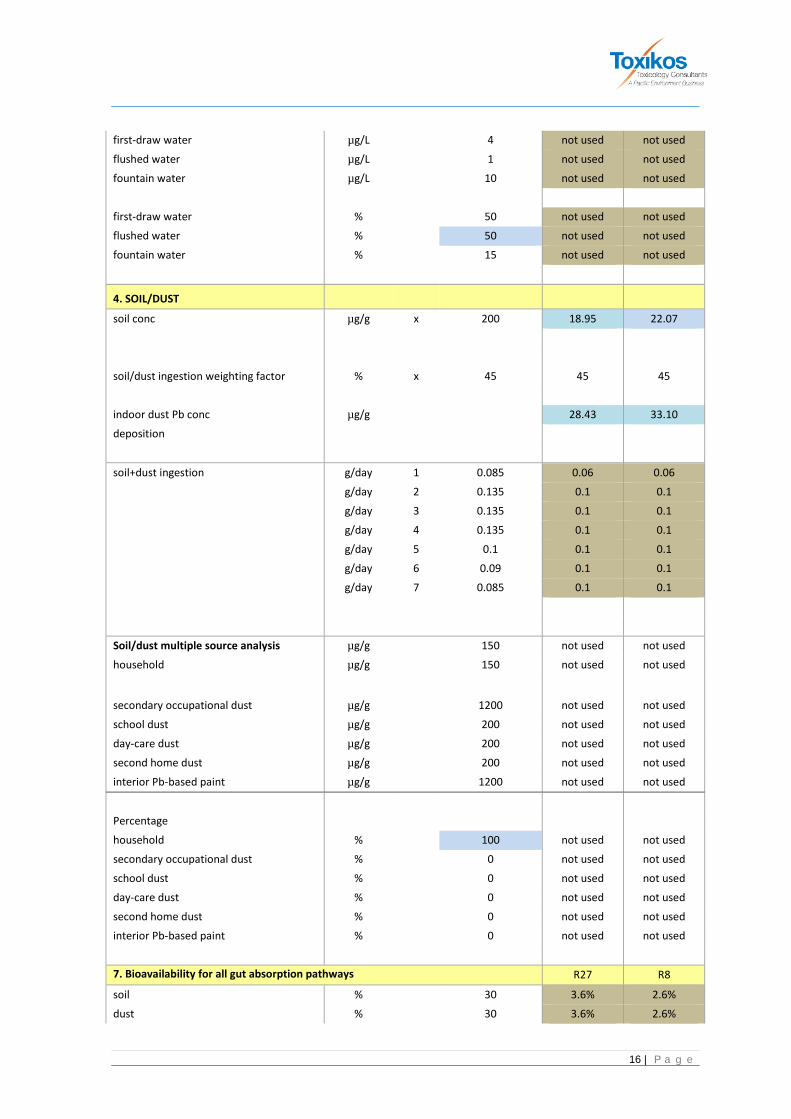
5.3.2.3 Risk Characterisation Table 3 shows the input data used in the IEUBK model for the current HRA. The values highlighted in blue were calculated from the current monitoring data; values highlighted in grey were carried over from the original HRA (Toxikos 2010). The IEUBK model default values were used for the second and third runs of the model.
Note that for determining the incremental Pb levels in blood due to mining activities the values for water Pb and dietary Pb were entered as zero since these are not related to mining activities, and it was assumed that no fruit and vegetables are grown for eating in the study area.
The bioaccessibility for Pb dust from exposed areas and mining activities were determined in the original HRA. The same values and methods described by Toxikos were used in one of the model runs (Run 3). It should be noted that the bioavailability values used in the original HRA were significantly lower than the default IEUBK values that have been used in the second and third model runs conducted in this HRA.

15 | P a g e
TABLE 3: INPUT DATA FOR IEUBK BLOOD LEAD MODELLING
Parameter Units age < IEUBK R27 R8 1. AIR DATA
Indoor air Pb Conc % all 30 30
air concentration (PM10 annual average) µg/m³ all 0.1 0.2980 0.3938
time out h/day 1 1 0.5 0.5
h/day 2 2 1.4 1.4
h/day 3 3 2 2
h/day 4 4 2 2
h/day 5 4 2 2
h/day 6 4 2 2
h/day 7 4 2 2
ventilation rate m3/day 1 2 5.4 5.4
m3/day 2 3 8 8
m3/day 3 5 9.5 9.5
m3/day 4 5 10.9 10.9
m3/day 5 5 10.9 10.9
m3/day 6 7 10.9 10.9
m3/day 7 7 12.4 12.4
Lung Absorption % all 32% 7.18% 5.18%
2. DIET Dietary Pb intake µg Pb/g 1 2.26 0 0
µg Pb/g 2 1.96 0 0
µg Pb/g 3 2.13 0 0
µg Pb/g 4 2.04 0 0
µg Pb/g 5 1.95 0 0
µg Pb/g 6 2.05 0 0
µg Pb/g 7 2.22 0 0
3. DRINKING WATER mean Pb water conc µg/L all 4 0 0
water intake L/day 1 0.2 0.47 0.47
L/day 2 0.5 0.31 0.31
L/day 3 0.52 0.36 0.36
L/day 4 0.53 0.42 0.42
L/day 5 0.55 0.42 0.42
L/day 6 0.58 0.42 0.42
L/day 7 0.59 0.48 0.48
Alternate water source
16 | P a g e
first-draw water µg/L
4 not used not used flushed water µg/L
1 not used not used
fountain water µg/L
10 not used not used
first-draw water %
50 not used not used flushed water %
50 not used not used
fountain water %
15 not used not used
4. SOIL/DUST soil conc µg/g x 200 18.95 22.07
soil/dust ingestion weighting factor % x 45 45 45
indoor dust Pb conc µg/g
28.43 33.10 deposition
soil+dust ingestion g/day 1 0.085 0.06 0.06
g/day 2 0.135 0.1 0.1
g/day 3 0.135 0.1 0.1
g/day 4 0.135 0.1 0.1
g/day 5 0.1 0.1 0.1
g/day 6 0.09 0.1 0.1
g/day 7 0.085 0.1 0.1
Soil/dust multiple source analysis µg/g
150 not used not used
household µg/g
150 not used not used secondary occupational dust µg/g
1200 not used not used
school dust µg/g
200 not used not used day-care dust µg/g
200 not used not used
second home dust µg/g
200 not used not used interior Pb-based paint µg/g
1200 not used not used
Percentage household %
100 not used not used
secondary occupational dust %
0 not used not used school dust %
0 not used not used
day-care dust %
0 not used not used second home dust %
0 not used not used
interior Pb-based paint %
0 not used not used
7. Bioavailability for all gut absorption pathways R27 R8 soil %
30 3.6% 2.6%
dust %
30 3.6% 2.6%

17 | P a g e
diet %
50 not used not used drinking water %
50 not used not used
alternate source %
0 not used not used
Fraction of total net absorption at low intake rate that is attributable to passive process x x 0.2
6. Alternate source data by year
total Pb intake µg/day 1 0 not used not used
µg/day 2 0 not used not used
µg/day 3 0 not used not used
µg/day 4 0 not used not used
µg/day 5 0 not used not used
µg/day 6 0 not used not used
µg/day 7 0 not used not used
5. Maternal Data mothers blood Pb concentration at
childbirth µg/dL
1 1.36 1.36
The model outputs showing the incremental blood Pb levels attributable to emissions from the mine for each age cohort are shown Table 4.
TABLE 4: RESULTS OF IEUBK MODELLING FOR BLOOD LEAD IN CHILDREN (Blood Pb concentrations µg/dL)
BLOOD PB CONCENTRATIONS µg/dL Age Group
(years) 0.5-1 1-2 2-3 3-4 4-5 5-6 6-7 Mean Receptor 8
Run 1 0.6 0.7 0.7 0.7 0.5 0.5 0.4 0.602 Run 2 0.5 0.6 0.6 0.6 0.5 0.4 0.4 0.525 Run 3 0.1 0.1 0.1 0.1 0.1 0 0 0.08 Run 4 0.1 0.1 0.1 0.1 0.1 0.1 0.1 0.112
Receptor 27 Run 1 0.5 0.6 0.6 0.5 0.4 0.4 0.3 0.478 Run 2 0.4 0.5 0.5 0.5 0.4 0.3 0.3 0.440 Run 3 0.1 0.1 0.1 0.1 0.1 0.1 0.1 0.086 Run 4 0 0 0.1 0.1 0.1 0.1 0.1 0.092
• Run 1 using default IEUBK inputs for air and soil and default to calculate indoor dust Pb. • Run 2 using default IEUBK inputs for bioavailability with all other local derived values. • Run 3 using all original default inputs for locally derived values and bioavailability. • Run 4 using default IEUBK inputs for air dust only to calculate indoor dust Pb.

18 | P a g e
Using the assumptions used in the original HRA (Run 3) the modelling showed that the incremental blood Pb levels based on the monitored data was 0.0-0.1 µg/dL at R8 and 0.1 µg/dL at R27. These values are lower than those predicted in the original HRA (0.75 µg/dL at R8). A comparison of the results of the original HRA and the current assessment using the same assumptions but with monitored lead data is shown in Table 5:
Table 5: Comparison of Results from Original HRA and Current Assessment
Blood Lead Concentrations µg/dL Mean
Age Group in Years
0.5-1 1-2 2-3 3-4 4-5 5-6 6-7
Receptor 8
Original HRA
1Current assessment
0.61
0.1
0.75
0.1
0.69
0.1
0.65
0.1
0.61
0.1
0.57
0
0.53
0
0.63
0.08
Receptor 27
1Current assessment
0.1
0.1
0.1
0.1
0.1
0.1
0.1
0.09
1Current assessment uses monitored data collected during the current operations at the site.
NB: Receptor 27 was not assessed in the original HRA.
As can be seen from Table 5 the blood lead levels calculated using the monitored Pb data, all other inputs to the IEUBK model consistent with the original HRA, are considerably lower than those predicted in the original HRA. For the most affected age group the current assessment indicates values 7.5 times lower than originally predicted. The mean levels are approximately 8 times lower than those predicted in the original HRA. In the original HRA it was assumed that Receptor 8 was the most affected receptor and receptor 27 was not assessed. With changes to the configuration at the site with the processing plant now closer to Receptor 27 the calculated blood lead levels using lead data monitored at this location are still nearly 8 times lower than the levels predicted at Receptor 8 in the original HRA.
The main difference between the monitored data used within the current assessment and the modelled data used in the original HRA is in the dust deposition data which is used to calculate the soil content of Pb due to the mine operations. The soil component is used to calculate the contribution to blood Pb from the ingestion pathway which is the major exposure pathway for children. The monitored dust deposition data is significantly lower than that used in the original HRA resulting in lower exposure from the ingestion pathway and therefore overall lower blood Pb levels.
Given that the results are significantly lower than the original HRA which was done with the processing plant closer to R8, and that there is no difference in the predicted blood lead levels between R8 and R27 indicates that the processing plant is not having a significant impact on the ambient lead levels in the local area. This is consistent with the emissions inventory that was used in

19 | P a g e
the Air Quality Assessment for the approvals for the mine which also indicated that the processing plant was not a significant contributor of lead emissions to air. This is reflected in the ambient monitoring data which has been used in the current HRA.
Using the more conservative default parameters in the IEUBK model results (Run 1) results in slightly higher predicted blood Pb levels ranging from 0.4-0.7 µg/dL at R8 and 0.3-0.6 µg/dL at R27 but these values are still well below the NHMRC guidelines for blood lead of 10 µg/dL. The results from Run 2 were similar to Run 1.
Run 4 estimates the blood Pb levels attributable to the air component only (i.e. all other exposure pathways were set to zero in the model). The results of this modelling show that the contribution from air alone is very small (0.1 µg/dL at R8 and 0-0.1 µg/dL at R27). These values are approximately 100 times less than the current NHMRC guideline for blood Pb of 10 µg/dL.
For the current modelling the lower blood Pb levels reported in Run 3 (original HRA inputs) are attributed to low bioavailability values being used in the original model that were based on in vitro bioaccessibility values. In vitro bioaccessibility values are not deemed to represent sufficient evidence for quantitative adjustment of bioavailability Invalid source specified.. It is considered that the runs using the default IEUBK assumptions with local data (Run 2) provide a more accurate estimate of the incremental increase from all exposure pathways.
The model was run again to determine the influence of airborne Pb using the conservative IEUBK inputs values, and found that the contribution of airborne Pb was around 0.1 µg/dL for all age groups at both sites, except for the under two year olds at site R27, where no incremental blood Pb was attributable to airborne dust.
The use of R8 and R27 exposures in these calculations represent the worst case exposures and highest potential impact on the Broken Hill population. Both R8 and R27 are located at the edge of the mine site and represent the most exposed parts of the population. All other parts of Broken Hill will be exposed to lower levels of Pb from the mine operations and the resultant blood levels will be lower than those calculated in this assessment. The use of monitoring data collected at sites close to these receptors provides exposure data that reflects the current operations on the site.
5.3.3 Summary of Lead Risk Assessment
The IEUBK model was run using site-specific Pb in air and Pb deposition data for the monitoring period between 1 July 2013 and 30 June 2014 to calculate the incremental blood Pb levels in children. When the local values from the original HRA where substituted for the default IEUBK values (Run 3) the incremental blood Pb levels at all sites ranged between 0 and 0.1 µg/dL. These blood Pb levels were lower than the original HRA, and are attributed to the lower Pb deposition rates observed within the monitoring data compared with that reported in the original HRA (based on dispersion modelling outputs).
Using more conservative IEUBK input values the incremental blood Pb levels ranged from 0.3 and 0.7 µg/dL. Most of this increase is attributed to the low bioavailability values used in the original HRA. An assessment of the contribution of inhalation of Pb dust alone has shown that this exposure pathway does not significantly contribute to predicted blood Pb levels, with the maximum incremental blood Pb level from this pathway predicted as 0.1 µg/dL .
The current HRA has used monitoring data collected to represent the most exposed parts of the Broken Hill population. This represents worst case exposures and the maximum impact on blood Pb

20 | P a g e
levels in the population. For the majority of the population the incremental increase will be much lower than that calculated in this HRA.
The worst case predicted increases in blood Pb are low. For all exposure pathways the maximum incremental increase is more than 10 times lower than the NHMRC guideline. For the air component alone (i.e. that potentially attributable to mining activities) the incremental increase is more than 100 times less than the NHMRC guideline of 10 µg/dL.
The results of the HRA, which shows similar results for R8 and R27, indicates that the processing plant is not having a significant impact on ambient lead levels as the results are similar at both locations. In the current operations the processing plant is closer to R27 than R8.

21 | P a g e
6 CONCLUSIONS
The HRA has estimated the increase in blood Pb levels in children due to current operations at the Rasp Mine based on monitoring data collected since current operations commenced.
The results of the IEUBK modelling of blood Pb levels has shown that using the same assumptions used in the original HRA conducted in 2010, that the blood Pb levels based on current monitoring are lower than those predicted in the original assessment. This is due to the fact that the monitored Pb deposition rates are significantly lower than the values adopted in the original HRA (derived through dispersion modelling). The Pb deposition rates are used to calculate soil concentrations and then in the estimate of risk from the ingestion pathway. The ingestion pathway is the dominant exposure pathway. Calculations of the contribution to blood Pb from air emissions only show that the contribution to blood Pb through the inhalation pathway is low with the maximum incremental increase predicted to be 0.1 µg/dL.

22 | P a g e
7 REFERENCES
Environ Australia (2010) Rasp Mine Broken Hill Air Quality Assessment.
NHMRC (July 2014) NHMRC Draft information paper: evidence on the effects of lead on human health, available at www.nhmrc.gov.au
NSW Health (2014), Blood Lead Levels in Broken Hill Children, Centre for Epidemiology and Evidence. Health Statistics New South Wales. Sydney: NSW Ministry of Health. Available at: www.healthstats.nsw.gov.au.
Taylor M, Mould, S, Kristensen, L, and Rouillon, M, (2014) Environmental arsenic, cadmium and lead dust emissions from metal mine operations: Implications for environmental management, monitoring and human health, Environmental Research 135 (2014) 296 – 303.
Toxikos (2010), Health Risk Assessment for Rasp Mine Proposal, Broken Hill, Document TR200510-RF.
USEPA (2007) Users Guide for IEUBK model Windows, Office of Superfund Remediation and Technology Innovation, EPA 9285.7-42
USEPA (2013), Integrated Science Assessment for Lead, EPA/600/R-10/075F


![filehost_GRILA RASP[1].CONTROL FINANCIAR FISCAL](https://img.pdfslide.us/doc/110x75/577d2c711a28ab4e1eac3808/filehostgrila-rasp1control-financiar-fiscal.jpg)
![RISK ASSESSMENT [ASSESSMENT]](https://img.pdfslide.us/doc/110x75/6212412fca52115ed803cf10/risk-assessment-assessment.jpg)