Embed Size (px)
Citation preview
Appendix E Health Risk Assessment


DRAFT Health Risk Assessment
300 Airport Boulevard Project Burlingame, California
Prepared for:
Maureen Brooks Planning Manager City of Burlingame
Community Development Department Planning Division
501 Primrose Road Burlingame, CA 94010
650.558.7253
Prepared by:
Atkins 650 E. Hospitality Lane, Suite 450
San Bernardino, CA 92408 (909) 980-5951
November 2, 2011
HEALTH RISK ASSESSMENT
300 Airport Boulevard November 2011 ES-1 \\SFOFS01\Projects\Projects - All Employees\10001+\8889 300 Airport Blvd\04. Screencheck Draft EIR\Appendices\Appendix E Health Risk Assessment\1. 300_HRA_11-02-2011 revised.doc
EXECUTIVE SUMMARY
This Health Risk Assessment (HRA) was prepared in accordance with the requirements of the Bay Area
Air Quality Management District (BAAQMD) and the California Environmental Quality Act (CEQA) to
determine if significant health risks are likely to occur in conjunction with the development of the 300
Airport Boulevard (Project) in Burlingame, California.
The Project is located at 300 Airport Boulevard, Burlingame, CA on 18.12 acres and would construct
730,000 square feet of new office or life science uses, 37,000‐square‐foot amenities building, and above
and below grade structured parking and surface parking. Analysis of the potential development of office
space on the 8.58‐acre 350 Airport Boulevard Site is also evaluated on a programmatic level. However,
at the time of development of the 350 Airport Boulevard Site, a project‐level analysis would be required
with respect to health risk if land uses other than office space are developed. There are both stationary
and mobile emissions sources within 1,000 feet of the Project. In addition, the Project will be
implementing four diesel generators which represent additional sources with respect to health risk for
the onsite daycare center and the offsite residential properties south of US 101.
The analysis contained in this report was prepared in accordance with the methodologies provided in
BAAQMD’s 2011 California Environmental Quality Act Air Quality Guidelines (Guidelines), and their
Recommended Methods for Screening and Modeling Local Risks and Hazards documents. The risks were
assessed using BAAQMD screening tools, US Environmental Protection Agency (EPA) CAL3QHCR
dispersion model, and EMFAC 2007. The HRA analyzes the potential impact to the Project site from the
high volume roadway and existing stationary sources as well as impacts to nearby receptors from
construction activities, and impacts to onsite and nearby receptors from the implementation of the
diesel generators.
The nearest offsite sensitive receptors are greater than 200 meters from the nearest construction
source and therefore construction activities can be screened out from being potentially significant with
respect to cancer risk, non‐cancer risk, and PM2.5 concentrations.
A screening level analysis was conducted to determine the impacts to the Project from nearby stationary
and mobile sources. The results of the screening analysis showed that the maximum potential non‐
cancer risk is 0.040 and the maximum PM2.5 concentration 0.262 g/m3. Because the screening level
analysis shows individual and cumulative impacts with respect to non‐cancer risk and PM2.5
concentrations to be less than significant, no refined analysis was conducted. The screening analysis
showed that offsite stationary sources were below the 10 in a million cancer risk threshold however US

HEALTH RISK ASSESSMENT
300 Airport Boulevard November 2011 ES-2 \\SFOFS01\Projects\Projects - All Employees\10001+\8889 300 Airport Blvd\04. Screencheck Draft EIR\Appendices\Appendix E Health Risk Assessment\1. 300_HRA_11-02-2011 revised.doc
101 results in a 29.868 per million cancer rate from the screening level. Refined modeling was
conducted with respect to US 101 resulting in a refined cancer risk of 4.05 per million for children at the
daycare center.
The diesel generators to be constructed onsite are greater than 1,000 feet from the nearest offsite
receptor and therefore are not considered to be a potential risk for cancer, non‐cancer, or PM2.5
concentrations. Because the onsite generators will not be operated during the time the daycare center
is occupied by children, they are not considered sources of health risk for the onsite receptor and were
not modeled with respect to the daycare center.
In summary, the proximity of the Project to roadway and permitted stationary sources would not result
in localized significant health risk impacts for any of the onsite sensitive receptors, nor would the
construction activities pose a significant health risk to offsite sensitive receptors. Therefore, the
implementation of the Project would be less than significant for impacts from air toxics and PM2.5.

HEALTH RISK ASSESSMENT
300 Airport Boulevard November 2011 i \\SFOFS01\Projects\Projects - All Employees\10001+\8889 300 Airport Blvd\04. Screencheck Draft EIR\Appendices\Appendix E Health Risk Assessment\1. 300_HRA_11-02-2011 revised.doc
TABLE OF CONTENTS Section Page
EXECUTIVE SUMMARY .............................................................................................................................. 1
SECTION 1.0 – INTRODUCTION ............................................................................................................. 1-1
1.1 HEALTH RISK ASSESSMENTS OVERVIEW........................................................................... 1-1
1.2 CLIMATE/METEOROLOGY ...................................................................................................... 1-2
SECTION 2.0 – TOXIC AIR CONTAMINANTS ......................................................................................... 2-1
2.1 INTRODUCTION ....................................................................................................................... 2-1
2.2 TRENDS IN BACKGROUND TAC LEVELS .............................................................................. 2-1
2.3 HEALTH CONCERNS ............................................................................................................... 2-2
2.3.1 Diesel Particulate Matter ............................................................................................... 2-3 2.3.2 Fine Particulate Matter .................................................................................................. 2-4
2.4 SENSITIVE RECEPTORS......................................................................................................... 2-4
SECTION 3.0 – METHODOLOGY ............................................................................................................ 3-1
3.1 THRESHOLDS OF SIGNIFICANCE ......................................................................................... 3-1
3.2 ANALYSIS APPROACH ............................................................................................................ 3-1
3.2.1 Construction Analysis ................................................................................................. 3-1 3.2.2 Operational Analysis .................................................................................................... 3-3
3.3 CANCER RISK CALCULATIONS ............................................................................................. 3-6
3.4 NON-CANCER HEALTH RISK .................................................................................................. 3-7
3.5 PM2.5 CONCENTRATION .......................................................................................................... 3-8
SECTION 4.0 – ENVIRONMENTAL IMPACTS AND MITIGATION MEASURES .................................... 4-1
4.1 CONSTRUCTION RISK CHARACTERIZATION....................................................................... 4-1
4.1.1 Screening Level Analysis .............................................................................................. 4-1 4.1.2 Cancer Risk ................................................................................................................... 4-3 4.1.3 Non-Cancer Risk ........................................................................................................... 4-4 4.1.4 PM2.5 Exposure ............................................................................................................. 4-5 4.1.5 Mitigation Measures ...................................................................................................... 4-6
4.2 OPERATIONAL RISK CHARACTERIZATION .......................................................................... 4-7
4.2.1 Screening Level Analysis .............................................................................................. 4-7 4.2.2 Cancer Risk ................................................................................................................. 4-10 4.2.3 Mitigation Measures .................................................................................................... 4-12
4.3 CONCLUSION ......................................................................................................................... 4-12
SECTION 5.0 – REFERENCES ................................................................................................................ 5-1

HEALTH RISK ASSESSMENT
300 Airport Boulevard November 2011 ii \\SFOFS01\Projects\Projects - All Employees\10001+\8889 300 Airport Blvd\04. Screencheck Draft EIR\Appendices\Appendix E Health Risk Assessment\1. 300_HRA_11-02-2011 revised.doc
LIST OF APPENDICES APPENDIX A Modeling Assumptions APPENDIX B Risk Calculations APPENDIX C ISTSC3 Modeling Output APPENDIX D CAL3QHCR Modeling Output
LIST OF TABLES Table Page
TABLE 1 – EMISSION FACTORS (GR/VMT) ........................................................................................... 3-5
TABLE 2 – CAL3QHCR PARAMETERS .................................................................................................. 3-6
TABLE 3 – CONSTRUCTION CANCER RISK ......................................................................................... 4-4
TABLE 4 – CONSTRUCTION NON-CANCER RISK ................................................................................ 4-5
TABLE 5 – CONSTRUCTION PM2.5 CONCENTRATIONS ...................................................................... 4-6
TABLE 6: SCREENING LEVEL ANALYSIS – ROADWAY SOURCES................................................... 4-8
TABLE 7: SCREENING LEVEL ANALYSIS – STATIONARY SOURCES .............................................. 4-9
TABLE 8: SCREENING LEVEL ANALYSIS – CUMULATIVE ................................................................. 4-9
TABLE 9: REVISED ANALYSIS ............................................................................................................. 4-11
TABLE 10: REFINED CUMULATIVE ..................................................................................................... 4-11
LIST OF EXHIBITS EXHIBITS Page Exhibit 1 Site Map ........................................................................................................................... 1-3 Exhibit 2 Operational Receptor Map ............................................................................................... 2-6 Exhibit 3 Construction Receptor Map ............................................................................................. 2-1 Exhibit 4 Source Map ...................................................................................................................... 4-2

HEALTH RISK ASSESSMENT
300 Airport Boulevard November 2011 iii \\SFOFS01\Projects\Projects - All Employees\10001+\8889 300 Airport Blvd\04. Screencheck Draft EIR\Appendices\Appendix E Health Risk Assessment\1. 300_HRA_11-02-2011 revised.doc
List of Acronyms
10-6 Micrograms to milligram conversion and liters to cubic meters conversion.
g/m3 Microgram per cubic meter
A Inhalation absorption factor
AT Averaging time period over which exposure is averaged (days)
BAAQMD Bay Area Air Quality Management District
Basin San Francisco Bay Area Air Basin
C Annual average concentration in g/m3
CAL3QHCR EPA dispersion Model
CARB California Air Resources Control Board
CEQA California Environmental Quality Act
DBR Daily Breathing Rate (L/kg bodyweight – day)
Dose Dose through inhalation (mg/kg/day)
DPM Diesel Particulate Matter
ED Exposure duration (years)
EF Exposure frequency (days/year)
EPA US Environmental Protection Agency
HI Hazard Index
HQ Hazard Quotient
HRA Health Risk Assessment
ISCST3 EPA dispersion model
OEHHA Office of Environmental Health Hazard Assessment
PM2.5 Particulate Matter of 2.5 micrograms or less in size
REL Reference exposure level
TAC Toxic Air Contaminant
Yr year
HEALTH RISK ASSESSMENT
300 Airport Boulevard November 2011 1-1 \\SFOFS01\Projects\Projects - All Employees\10001+\8889 300 Airport Blvd\04. Screencheck Draft EIR\Appendices\Appendix E Health Risk Assessment\1. 300_HRA_11-02-2011 revised.doc
SECTION 1.0 – INTRODUCTION
This Health Risk Assessment (HRA) was prepared in accordance with the requirements of the Bay Area
Air Quality Management District (BAAQMD) and California Environmental Quality Act (CEQA) to
determine if significant health risks are likely to occur with the constructing the 300 Airport Boulevard
Project (Project) and locating an onsite daycare center within 1,000 feet of US 101 and existing
stationary sources.
The Project is located at 300 Airport Boulevard, Burlingame, CA on 18.12 acres and would construct
730,000 square feet of new office or life science uses with small accessory ground floor retail space;
37,000‐square‐foot amenities building, which would house a childcare facility, exercise facility, a café
and small retail spaces; and above and below grade structured parking and surface parking. Analysis of
the potential development of office space on the 8.58 acre 350 Airport Boulevard Site is also evaluated
on a programmatic level. However, at the time of development of the 350 Airport Boulevard Site, a
project‐level analysis would be required for the site with respect to health risk if land uses other than
office buildings or if stationary sources, including back‐up generators are proposed with its operation.
The 300 Airport Boulevard Site is to the north of US 101, immediately adjacent to 350 Airport Boulevard
to the north, San Francisco Bay (Bay) to the east, Sanchez Channel to the west, and
commercial/industrial land uses directly south. Residential land uses occur to the south of US 101 and
are approximately 850 feet from the southern property boundary. The 350 Airport Boulevard Site is
bounded by the Bay to the north, Fisherman’s Park to the east, 300 Airport Boulevard to the south, and
the outlet of Sanchez Channel to the west (Exhibit 1).
The Project is located within 1,000 feet of an existing roadway with more than 10,000 vehicles per day
(the US 101) and three permitted stationary sources. Both of the permitted stationary sources are diesel
generators. One back‐up generator is operated by Virgin America and located at 555 Airport Boulevard.
A second undefined source, also located at 555 Airport Boulevard is owned by CA‐Bay Park Plaza LP. The
third is a diesel generator operated by the City of Burlingame at a pump station located at 399 Rollins
Road.
1.1 Health Risk Assessments Overview
An HRA is the quantification of the potential risk posed to individuals that may be affected by exposure
to a pollutant. The HRA translates a given rate of emissions from a particular source to a dose to which
an individual is exposed. The dose, depending on level and pollutant, has the potential to cause adverse
health effects in the exposed individual. For toxic air contaminants (TACs), the pathway having the

HEALTH RISK ASSESSMENT
300 Airport Boulevard November 2011 1-2 \\SFOFS01\Projects\Projects - All Employees\10001+\8889 300 Airport Blvd\04. Screencheck Draft EIR\Appendices\Appendix E Health Risk Assessment\1. 300_HRA_11-02-2011 revised.doc
greatest significance is atmospheric dispersion which leads to exposure through inhalation. Therefore
this assessment is focused on health risks from diesel particulate matter (DPM) and fine particulate
matter (PM2.5) through inhalation.
Adverse health risks are discussed in terms of non‐cancer and cancer risks. Non‐cancer health risks can
be measured quantitatively with the risk designated as a hazard quotient. The hazard quotient is the
ratio of the calculated concentration to a threshold which has been identified as having some level of
adverse health effect.
Cancer risks have no set thresholds as carcinogens are considered to be non‐threshold pollutants. This
means that for any non‐zero concentration of a carcinogen, there is an increased risk of developing
cancer. Therefore, significance of exposure to a carcinogen is evaluated based on the increase in risk.
The increased risk is determined by multiplying a calculated dose with the cancer potency factor of the
pollutant and then by one million to express risk in the common term of the risk per million people. The
most common cancer risk evaluated in an HRA is the increased cancer risk from the continuous
exposure to a pollutant over a lifetime.
1.2 Climate/Meteorology
The Project area lies in the San Francisco Bay Area Air Basin (Basin). Covering an area of approximately
5,500 square miles, the Basin is composed of all of Alameda, Contra Costa, Marine, Napa, San Francisco,
San Mateo, and Santa Clara counties along with the southeast portion of Sonoma County and the
southwest portion of Solano County.
The Mediterranean climate of the Basin is characterized by warm dry summers and cool rainy winters.
Yearly temperatures range from the low 30s to above 90 degrees Fahrenheit with summers averaging in
the 60s and winters in the high 40s. Snowfall is rare with annual average precipitation of about 20
inches. The climate is dominated by a strong, semi‐permanent, subtropical high‐pressure cell over the
northeastern Pacific Ocean.

Prepared by:: .
Exhibit 1 Site Map
Health Risk Assessment 300 Airport Boulevard Project
Burlingame, CA
Source: Google Earth 2011.
Not to scale.
350 Airport Boulevard
Project Site
300 Airport Boulevard
Amenities
West Campus
East Campus
HEALTH RISK ASSESSMENT
300 Airport Boulevard November 2011 2-1 \\SFOFS01\Projects\Projects - All Employees\10001+\8889 300 Airport Blvd\04. Screencheck Draft EIR\Appendices\Appendix E Health Risk Assessment\1. 300_HRA_11-02-2011 revised.doc
SECTION 2.0 – TOXIC AIR CONTAMINANTS
2.1 Introduction
Toxic Air Contaminants (TACs) are a set of airborne pollutants that may pose a present or potential
hazard to human health that are emitted from a range of sources from industrial plants to motor
vehicles and diesel generators. The public's exposure to TACs is a significant environmental health issue
in California. In 1983, the California Legislature enacted a program to identify the health effects of TACs
and to reduce exposure to these contaminants to protect the public health.
The Health and Safety Code defines a TAC as “an air pollutant which may cause or contribute to an
increase in mortality or in serious illness, or which may pose a present or potential hazard to human
health.” A substance that is listed as a hazardous air pollutant pursuant to subsection (b) of Section 112
of the Federal Act (42 USC Sec. 7412[b]) is a toxic air contaminant. Under State law, the California
Environmental Protection Agency, acting through the California Air Resources Board (CARB), is
authorized to identify a substance as a TAC if it determines the substance is an air pollutant which may
cause or contribute to an increase in mortality or an increase in serious illness, or which may pose a
present or potential hazard to human health.
California regulates TACs primarily through AB 1807 (Tanner Air Toxics Act) and AB 2588 (Air Toxics “Hot
Spot” Information and Assessment Act of 1987). The Tanner Air Toxics Act sets forth a formal procedure
for CARB to designate substances as TACs. Once a TAC is identified, CARB adopts an “airborne toxics
control measure” for sources that emit designated TACs. If there is a safe threshold for a substance at
which there is no toxic effect, the control measure must reduce exposure to below that threshold. If
there is no safe threshold, the measure must incorporate toxics best available control technology (T‐
BACT) to minimize emissions.
To date CARB has designated nearly 200 compounds as TACs. Additionally, CARB has implemented
control measures for a number of compounds that pose high risks and show potential for effective
control. The majority of the estimated health risks from TACs can be attributed to a relatively small
number of compounds, the most important being particulate matter from diesel‐fueled engines.
2.2 Trends in Background TAC Levels
Trends in background concentrations of various TACs are published annually by CARB in the California
Almanac of Emissions and Air Quality (Almanac). The Almanac summarizes available data for the ten
TACs that pose the greatest known health risk in California. These include acetaldehyde, benzene, 1,3‐

HEALTH RISK ASSESSMENT
300 Airport Boulevard November 2011 2-2 \\SFOFS01\Projects\Projects - All Employees\10001+\8889 300 Airport Blvd\04. Screencheck Draft EIR\Appendices\Appendix E Health Risk Assessment\1. 300_HRA_11-02-2011 revised.doc
butadine, carbon tetrachloride, hexavalent chromium, para‐dichlorobenzene, formaldehyde, methylene
chloride, perchloroethylene, and DPM. At present, the estimated risk from DPM is greater than the risk
of all other TACs combined and poses the most significant risk to California’s population. CARB estimates
that, of the known cancer risk in California, 79% of the top 10 outdoor air toxics are attributable to DPM.
1
Land uses within California are being developed with an increased emphasis on reductions in vehicle
miles traveled along with energy and water consumption. Especially with the passage of Assembly Bill 32
and its associated greenhouse gas reduction goal of meeting 1990 levels by 2020, the implementation of
these principals are increasingly important with respect to land use planning. This type of planning
reduces regional criteria air pollutant and greenhouse gas emissions effectively due to design; however,
it also results in receptors being placed in closer proximity to localized sources of pollution. Therefore,
the TAC reductions discussed above will be important in addressing this issue.
The Diesel Risk Reduction Plan, which recommends various control measures to reduce risk associated
with DPM, was adopted by CARB in September of 2000. The recommended control measures were
developed to achieve a reduction in PM of 85% by 2020. The Plan elements include retrofitting existing
engines with emission control devices to adopt more stringent standards for new engines, further
lowering of the sulfur content of fuel, and implementing advanced technology emission control devices
on diesel engines. Without implementing the Plan, it is estimated that PM emissions from diesel use will
only drop from 2000 levels by 17% in 2010 and 33% in 2020.2
Average statewide DPM concentration for 1990 was estimated at 3.0 micrograms per cubic meter
(g/m3) and is associated with a cancer risk of 900 cases per million people exposed over a 70‐year
lifetime. 2000 estimates showed a 40% drop from 1990 with a concentration of 1.8 g/m3 and a risk of
540 cases per million. Without implementation of the Diesel Risk Reduction Plan, ambient
concentrations for 2020 are estimated at 1.2 g/m3, while with the incorporation of the Diesel
Reduction Plan ambient concentrations are reduced to 0.27g/m3.3
2.3 Health Concerns
Due to the diverse nature of individual TACs, health effects associated with them can include both long‐
term impacts, including cancer, birth defects, neurological damage, asthma, bronchitis, or genetic
1 CARB California Almanac of Emissions and Air Quality, 2009, page 5‐5 and 4‐44. 2 CARB California Almanac of Emissions and Air Quality, 2009, page 5‐44. 3 CARB California Almanac of Emissions and Air Quality, 2009, page 5‐44.

HEALTH RISK ASSESSMENT
300 Airport Boulevard November 2011 2-3 \\SFOFS01\Projects\Projects - All Employees\10001+\8889 300 Airport Blvd\04. Screencheck Draft EIR\Appendices\Appendix E Health Risk Assessment\1. 300_HRA_11-02-2011 revised.doc
damage; and short‐term effects such as eye watering, persistent cough, running nose, throat pain, and
headaches.
To address the added risk from community exposure to air toxics BAAQMD implemented the
Community Air Risk Evaluation (CARE) Program, in 2004. Through this program, BAAQMD has identified
a number of urban and industrialized communities where exposure to TACs is comparatively high. These
areas include Western Alameda County, Concord, eastern San Francisco, Redwood City/East Palo Alto,
Richmond/San Pedro, and San Jose.4 The Project is not located in one of the six areas identified by
BAAQMD as an impacted community and is not anticipated to have higher ambient levels of air toxics
therefore it will not result in higher levels of health concerns for residents.
2.3.1 Diesel Particulate Matter
Diesel Particulate Matter (DPM) is a mixture of many exhaust particles and gases that are produced
when an engine burns diesel fuel. Many compounds found in diesel exhaust are carcinogenic or are
classified as possibly carcinogenic by the International Agency for Research on Cancer. DPM includes the
particle‐phase constituents in diesel exhaust. Some short‐term effects of diesel exhaust include eye,
nose, throat, and lung irritation. Exposure can cause coughs, headaches, light‐headedness, and nausea.
Diesel exhaust is a major source of ambient particulate matter pollution as well, and numerous studies
have linked elevated particle levels in the air to increased hospital admission, emergency room visits,
asthma attacks, and premature deaths among those suffering from respiratory problems.5 DPM in the
Basin poses the greatest cancer risk of all the toxic air pollutants.
CARB monitored outdoor TAC concentrations in the San Francisco Bay Area Air Basin from 1990 through
the present. Emissions of DPM from the Basin are primarily from mobile sources and represent
approximately 12% of the statewide DPM emissions, and account for 90% of all DPM emissions within
the Basin. Between 1990 and 1995, overall cancer risk within the Basin (including DPM) dropped from
1,153 cases million to 884 cases in a million, and dropped again between 1995 and 2000 to 659 per one
million people exposed.6
4 BAAQMD Recommended Methods for Screening and Modeling Local Risks and Hazards May 2011, page 4. 5 Office of Environmental Health Hazard Assessment. 2003. Air Toxics Hot Spots Program Risk Assessment Guidelines, The Air Toxics Hot Spots Program Guidance Manual for Preparation of Health Assessments.
6 CARB California Almanac of Emissions and Air Quality, 2009, page 5‐61.

HEALTH RISK ASSESSMENT
300 Airport Boulevard November 2011 2-4 \\SFOFS01\Projects\Projects - All Employees\10001+\8889 300 Airport Blvd\04. Screencheck Draft EIR\Appendices\Appendix E Health Risk Assessment\1. 300_HRA_11-02-2011 revised.doc
2.3.2 Fine Particulate Matter
Although not specifically identified as a TAC fine particulate matter (particulate matter of 2.5 microns or
less [PM2.5]) has been linked with respiratory illness and premature deaths.7,8 PM2.5 consists of extremely
small, suspended particles or droplets 2.5 microns or smaller in diameter. Some sources of particulate
matter, like pollen and dust generated during windstorms, are naturally occurring. However, in
populated areas, most particulate matter is caused by road dust, diesel soot, combustion product,
abrasion of tires and brakes, and construction activities.
There is a consistent correlation between elevated ambient concentrations of PM2.5 and an increase in
mortality rates, respiratory infections, number and severity of asthma attacks, and the number of
hospital admissions observed in different parts of the United States and around the world. In recent
years, some studies have reported an association between long‐term exposure to air pollution
dominated by fine particles and increased mortality, reduction in life‐span, and an increased mortality
from lung cancer.
The elderly, people with pre‐existing respiratory or cardiovascular disease, and children appear to be
more susceptible to the effects of high levels of PM2.5. Daily fluctuations in PM2.5 concentration levels
have also been related to hospital admissions for acute respiratory conditions in children, school and
kindergarten absences, a decrease in respiratory lung volumes in normal children, and increased
medication use in children and adults with asthma. Recent studies show lung function growth in children
is reduced with long‐term exposure to particulate matter.
2.4 Sensitive Receptors
Some land uses are considered more sensitive to air pollution than others due to the types of population
groups or activities involved. Sensitive population groups include children, the elderly, the acutely ill,
and the chronically ill, especially those with cardio‐respiratory diseases. Residential areas are considered
to be sensitive to air pollution because residents (including children and the elderly) tend to be at home
for extended periods of time, resulting in sustained exposure to any pollutants present. Schools are also
considered sensitive as children are present for extended durations and engage in regular outdoor
activities. Recreational land uses are considered moderately sensitive to air pollution because exercise
places a high demand on respiratory functions, which can be impaired by air pollution.
7 BAAQMD CEQA Guidelines May 2011, page 5‐1. 8 BAAQMD Recommended Methods for Screening and Modeling Local Risks and Hazards May 2011, page 4.
HEALTH RISK ASSESSMENT
300 Airport Boulevard November 2011 2-5 \\SFOFS01\Projects\Projects - All Employees\10001+\8889 300 Airport Blvd\04. Screencheck Draft EIR\Appendices\Appendix E Health Risk Assessment\1. 300_HRA_11-02-2011 revised.doc
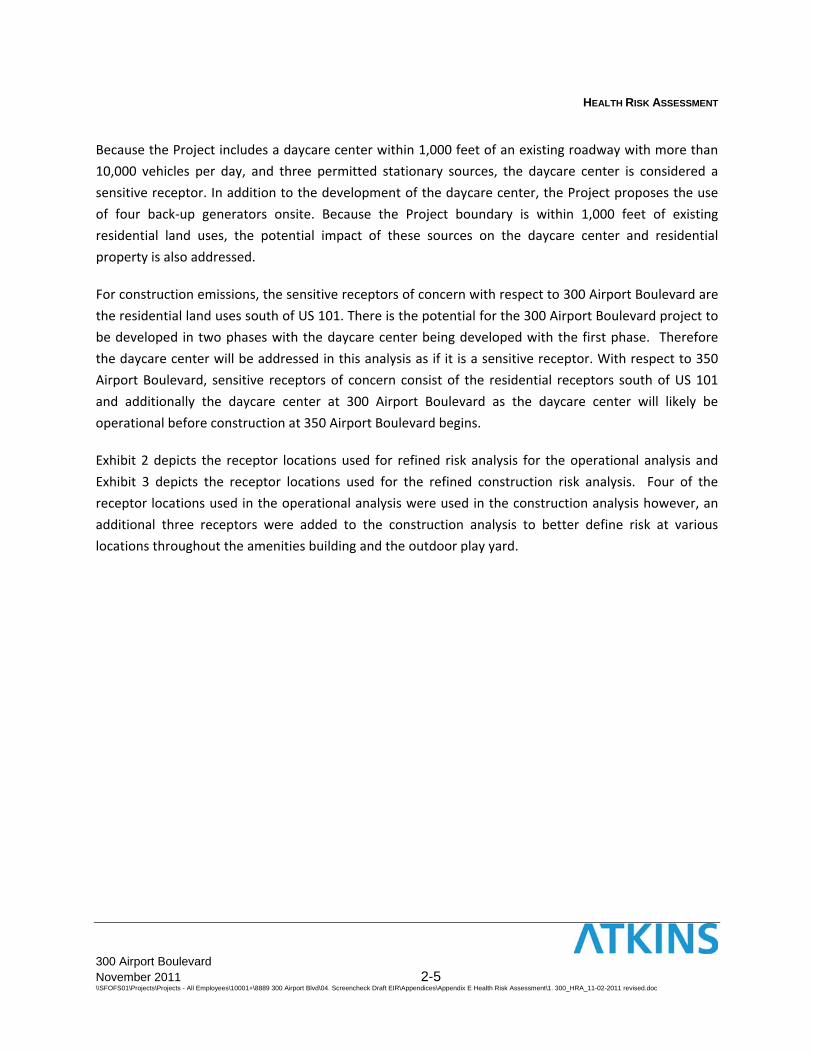
Because the Project includes a daycare center within 1,000 feet of an existing roadway with more than
10,000 vehicles per day, and three permitted stationary sources, the daycare center is considered a
sensitive receptor. In addition to the development of the daycare center, the Project proposes the use
of four back‐up generators onsite. Because the Project boundary is within 1,000 feet of existing
residential land uses, the potential impact of these sources on the daycare center and residential
property is also addressed.
For construction emissions, the sensitive receptors of concern with respect to 300 Airport Boulevard are
the residential land uses south of US 101. There is the potential for the 300 Airport Boulevard project to
be developed in two phases with the daycare center being developed with the first phase. Therefore
the daycare center will be addressed in this analysis as if it is a sensitive receptor. With respect to 350
Airport Boulevard, sensitive receptors of concern consist of the residential receptors south of US 101
and additionally the daycare center at 300 Airport Boulevard as the daycare center will likely be
operational before construction at 350 Airport Boulevard begins.
Exhibit 2 depicts the receptor locations used for refined risk analysis for the operational analysis and
Exhibit 3 depicts the receptor locations used for the refined construction risk analysis. Four of the
receptor locations used in the operational analysis were used in the construction analysis however, an
additional three receptors were added to the construction analysis to better define risk at various
locations throughout the amenities building and the outdoor play yard.

1 4 2 3 5
6
7
8
13 14 15 16 17
(0,0)
(100,1236)
(100,810)
(100,750)
(-50,875)
(300,1236) (-50,1236) (-500,1236) (-250,1236)
(-500,993)
(-500,750) (-250,750)
(-50,750)
(300,750)
Prepared by:: .
Exhibit 2
Receptor Locations—Operational
Health Risk Assessment 300 Airport Boulevard Project
Burlingame, CA
Source: Google Earth 2011.
Not to scale.
9 10 11 12 (100,993) (-250,993) (-50,993) (300,993)
Project Site Receptor Location Roadway Origin

4 3
6
7
18
19
20
Prepared by:: .
Exhibit 3
Receptor Locations—Construction
Health Risk Assessment 300 Airport Boulevard Project
Burlingame, CA
Source: Google Earth 2011.
Not to scale.
Project Site Receptor Location
HEALTH RISK ASSESSMENT
300 Airport Boulevard November 2011 3-1 \\SFOFS01\Projects\Projects - All Employees\10001+\8889 300 Airport Blvd\04. Screencheck Draft EIR\Appendices\Appendix E Health Risk Assessment\1. 300_HRA_11-02-2011 revised.doc
SECTION 3.0 – METHODOLOGY
This HRA was prepared in accordance with the requirements of BAAQMD and CEQA to determine if
significant health risks to onsite sensitive receptors are likely to occur in conjunction with the
construction and operation of the 300 Airport Boulevard Project (Project).
3.1 Thresholds of Significance
In order to determine whether or not construction activities or existing TAC and PM2.5 sources would
result in a significant environmental effect for an identified receptor, the impact from these sources on
the receptor must be determined through the examination of the types and levels of air toxics emissions
that are generated and their impacts on factors that affect air quality within the project vicinity. While,
the final determination of significance thresholds is within the purview of the lead agency pursuant to
the State CEQA Guidelines, BAAQMD recommends that for evaluation of construction emission impacts
or when siting a new sensitive receptor within 1,000 feet of existing mobile or stationary TAC sources,
the following thresholds9 be observed:
Compliance with a qualified Community Risk Reduction Plan; or
A single source with an excess cancer risk level of less than 10 in one million, or a non‐cancer
risk less than 1.0 hazard index (HI);
An incremental increase of less than 0.3 g/m3 annual average PM2.5 from a single source;
Cumulative sources with an excess cancer risk level of less than 100 in one million, or a non‐
cancer risk less than 10.0 HI;
An incremental increase of less than 0.8 g/m3 annual average PM2.5 from multiple sources.
3.2 Analysis Approach
3.2.1 Construction Analysis
Construction activities could result in the generation of TAC emissions, specifically DPM, from on‐road
haul trucks, and off‐road equipment exhaust emissions. Because of the variability in construction
scenarios, the generation of TACs from construction activities would be temporary, especially
considering the short amount of time the equipment is operating and the nature of risk as resulting from
an extended period of exposure (9 to 70 years depending on the nature of the receptor). BAAQMD
Guidelines recommend that impacts associated with construction be addressed on a case‐by‐case basis
9 BAAQMD CEQA Guidelines May 2011, page 5‐3.
HEALTH RISK ASSESSMENT
300 Airport Boulevard November 2011 3-2 \\SFOFS01\Projects\Projects - All Employees\10001+\8889 300 Airport Blvd\04. Screencheck Draft EIR\Appendices\Appendix E Health Risk Assessment\1. 300_HRA_11-02-2011 revised.doc
taking into consideration the specific construction related characteristics of each project and proximity
to offsite receptors. Specifically the analysis should take into account the following information:
Types of offsite receptors and their proximity to construction activity within approximately 1,000 feet;
Duration of construction period;
Quantity and types of diesel‐powered equipment;
Number of hours equipment would be operated each day;
Location(s) of equipment use, distance to nearest offsite sensitive receptors, and orientation with respect to the predominant wind direction;
Location of equipment staging area; and
Amount of onsite diesel‐generated PM2.5 exhaust (assuming that all onsite diesel PM2.5 exhaust is diesel PM) if mass emission levels from construction activity are estimated.
Because there are offsite residential receptors south of US 101, the proposed development at 300
Airport Boulevard has the potential to expose these residences to health risks from construction activity.
Along with the residential receptors south of US 101, construction at 350 Airport Boulevard would have
the potential to expose the daycare center at 300 Airport Boulevard to risk from construction
equipment emissions. The potential for significant construction related risk to both the onsite and
offsite receptors is analyzed herein.
Project Screening
BAAQMD’s Screening Tables for Air Toxics Evaluation During Construction were used to evaluate the
minimum distance required between the fence line of a construction site and nearby sensitive receptors
to ensure that cancer and non‐cancer risks associated with the Project are less than significant.
Receptors that fall within the radius determined by the screening tables have the potential to be
significantly impacted and refined modeling must be considered. According to the screening tables, for
an 18.12 and 8.58 acre site, the minimum distances are 225 and 200 meters10 respectively.
Refined Analysis
The Project at 300 Airport Boulevard may be constructed in two phases with the construction of the east
campus and the amenities building, along with the realignment of Airport Boulevard being constructed
as Phase 1. Phase 2 would consist of buildings 3 and 4 as well as the parking structure and is considered
the West Campus (see Exhibit 1). While the amenities building is located on the West Campus it may be
10 BAAQMD 2010. Screening Tables for Air Toxics Evaluation During Construction version 1.0 May 2010. Pg 9.

HEALTH RISK ASSESSMENT
300 Airport Boulevard November 2011 3-3 \\SFOFS01\Projects\Projects - All Employees\10001+\8889 300 Airport Blvd\04. Screencheck Draft EIR\Appendices\Appendix E Health Risk Assessment\1. 300_HRA_11-02-2011 revised.doc
constructed in conjunction with the East Campus and therefore has the potential to be operating during
construction of Phase 2. For analysis purposes it is assumed that the daycare center would be in the
portion of the building directly adjacent to the play yard and therefore furthest from the construction
activities. This location corresponds to receptor number 20, indoors, and receptors 4 and 7 outdoors, on
Exhibit 3.
Concentrations of DPM and PM2.5 with respect to West Campus Construction impacts on the daycare
center were analyzed using the US Environmental Protection Agency’s (EPA) ISCST3 Dispersion Model, in
accordance with guidance from BAAQMD11. Risks for DPM were determined using the BAAQMD’s 2011
Guidelines. Concentrations were obtained from the modeling using an emission factor of 1. The
modeled concentrations were then multiplied by an emission factor (3.31e‐07) to provide a
concentration expected at that specific receptor. These converted concentrations were compared
against the BAAQMD threshold for PM2.5 and used to determine cancer and non‐cancer risk. Detailed
determination of emission factors are included in Appendix A.
3.2.2 Operational Analysis
When a new sensitive receptor, such as the daycare center at the Project, is being sited within the
jurisdiction of BAAQMD, BAAQMD recommends that all TAC and PM2.5 sources within a 1,000 foot
radius of the project site be identified. Sources that should be identified include permitted stationary
sources as well as freeways and major roadways (roadways with 10,000 annual average daily vehicles or
more).
The BAAQMD Guidelines provide a phased approach for estimating Risk and Hazards with respect to
siting new sources or receptors. During the first phase, all of the sources within 1,000 feet of the project
border are identified. If there are no sources, then no further analysis is required. If there are sources
within the zone of influence then a screening level analysis or air dispersion modeling should be
conducted.
With respect to operational activities, the Project at 300 Airport Boulevard includes the development of
a daycare center which is a sensitive receptor. In addition to this onsite receptor, the inclusion of four
back‐up generators makes the Project a potential source with respect to both the daycare center as well
as the residences south of US 101. For 350 Airport Boulevard, the development is not anticipated to
include sensitive land uses, however it may include onsite generators, therefore at an operational level,
would be considered a potential source with respect to the daycare center at 300 Airport Boulevard..
11 BAAQMD 2010. Personal Communication James Cordova BAAQMD, September 16, 2011.
HEALTH RISK ASSESSMENT
300 Airport Boulevard November 2011 3-4 \\SFOFS01\Projects\Projects - All Employees\10001+\8889 300 Airport Blvd\04. Screencheck Draft EIR\Appendices\Appendix E Health Risk Assessment\1. 300_HRA_11-02-2011 revised.doc
However, because of its distance from the residential receptors south of the 101 Freeway, it would not
be a potential source with respect to offsite receptors
The Guidelines recommend that all TAC and PM2.5 sources within 1,000 feet of the Project boundaries be
identified and their individual and cumulative impacts on a proposed receptor development
determined. TAC and PM2.5 sources are defined as major roadways (with more than 10,000 daily vehicle
trips), and all stationary sources, including back‐up generators. According to BAAQMD screening tools
three stationary and one roadway sources were identified within the 1,000 foot zone of influence for
the Project and are required to be analyzed within the HRA.
Project Screening
The screening tools provided by BAAQMD12,13,14 estimate PM2.5 concentrations, cancer risk, chronic
hazard risk, and acute hazard risk. These are conservative estimates of risks and are not based on actual
project specific health risk screening assessments. The screening tools are designed such that if a project
results in levels below thresholds with the initial screening, then no additional review is required.
The following steps were followed for the screening level analysis. First an initial conservative screening
was conducted. Permitted sources were identified in Google Earth using the Stationary Source Screening
Analysis Tool. Where estimations for PM2.5, cancer risk, and hazard values were provided, they were
identified and used. Screening level PM2.5 concentrations and risk levels for those stationary sources that
were not provided by the Screening Tool were obtained directly from BAAQMD. Estimated
concentrations and cancer risks for highways were obtained from the BAAQMD’s Highway Screening
Analysis Tool. No major roadways (those non‐freeway roadways where average annual daily trips
(AADT) are greater than 10,000 vehicles) were identified within the Project zone of influence.
Refined Modeling
The Project proposes to include four backup generators within the development. These back‐up
generators have the potential to impact both the onsite daycare center as well as offsite receptors south
of US 101. Further, the Project is located within 1,000 feet of three stationary sources and US 101. While
the stationary sources are screened out based on the BAAQMD screening tools, US 101 remains a
potentially significant impact after evaluation using the screening tools. Therefore, a refined analysis for
impacts to the proposed daycare center with respect to US 101 was conducted.
12 BAAQMD Screening Analysis Flow Chart, May 2011.
13 BAAQMD Stationary Source Screening Analysis Tool, San Francisco, May 2011.
14 BAAQMD Roadway Screening Analysis Tables, April 2011.

HEALTH RISK ASSESSMENT
300 Airport Boulevard November 2011 3-5 \\SFOFS01\Projects\Projects - All Employees\10001+\8889 300 Airport Blvd\04. Screencheck Draft EIR\Appendices\Appendix E Health Risk Assessment\1. 300_HRA_11-02-2011 revised.doc
As necessary, concentrations of DPM and PM2.5 with respect to onsite stationary source impacts on the
daycare center and offsite receptors would be analyzed using the US Environmental Protection Agency’s
(EPA) ISCST3 Dispersion Model, in accordance with guidance from BAAQMD15. Cancer and non‐cancer
risks for DPM would be determined using the BAAQMD’s 2011 Guidelines. Because the incorporation of
operational standards for the onsite generators and the generator distance from offsite receptors, the
onsite stationary sources result in less‐than‐significant impacts to the onsite and offsite sensitive
receptors and no refined analysis was required with respect to stationary sources.
Emissions from US 101 were evaluated based on BAAQMD Guidelines using the Cal3QHCR dispersion
model. Average hourly emission factors were determined through EMFAC and weighted with respect to
the sensitivity factors appropriate for daycare‐aged children. It was assumed that children would be
present onsite between birth and kindergarten, or a maximum of six years and could, conservatively, be
onsite for up to twelve hours per day. Emission factors (Table 1) and other project specific data (Table 2)
related to siting the daycare center within 1,000 feet of US 101 were entered into the Cal3QHCR model
to determine emissions estimated for 2008. Concentrations obtained from the model were then
multiplied by a conversion factor to provide a concentration expected over a 70 year average (Table 2).
These converted concentrations were then used to determine cancer risk. Detailed determination of
emission factors as well as Cal3QHCR inputs and 70 year average conversion factors are included in
Appendix A.
Table 1 – Emission Factors (gr/VMT)
Hour PM2.5 TOC
exhaust TOC
Running
Hour PM2.5 TOC
exhaust TOC
Running 24 0.16 0.22 0.09 12 0.20 0.21 0.14
1 0.10 0.26 0.10 13 0.22 0.20 0.12
2 0.13 0.28 0.08 14 0.22 0.19 0.12
3 0.27 0.41 0.07 15 0.21 0.19 0.13
4 0.25 0.26 0.08 16 0.22 0.19 0.12
5 0.24 0.25 0.09 17 0.15 0.19 0.12
6 0.26 0.20 0.08 18 0.19 0.19 0.12
7 0.27 0.21 0.11 19 0.17 0.20 0.12
8 0.20 0.22 0.11 20 0.18 0.21 0.11
9 0.22 0.26 0.13 21 0.16 0.19 0.10
10 0.24 0.24 0.13 22 0.11 0.19 0.09
11 0.22 0.22 0.13 23 0.16 0.21 0.10
Source: Atkins 2011
15 BAAQMD 2010. Personal Communication James Cordova BAAQMD, September 16, 2011.

HEALTH RISK ASSESSMENT
300 Airport Boulevard November 2011 3-6 \\SFOFS01\Projects\Projects - All Employees\10001+\8889 300 Airport Blvd\04. Screencheck Draft EIR\Appendices\Appendix E Health Risk Assessment\1. 300_HRA_11-02-2011 revised.doc
Table 2 – CAL3QHCR Parameters
Parameter Value
Calculation averaging time (minute) 60
Surface Roughness – Office 170
Settling velocity (cm/s) 0
Deposition velocity (cm/s) 0
Site setting U
Form of traffic volume, emissions rate data (one week of hourly data) 2
Pollutant (P to give results in g/m3) P
Hourly ambient background concentration (g/m3) 0
Roadway height indicator (at grade) AG
Roadway height (ft) 0
70 year conversion factor (TOC exhaust) 0.908
70 year conversion factor (TOC running) 1.114
70 year conversion factor (DPM) 0.924
Source: Atkins 2011
3.3 Cancer Risk Calculations
DPM exposure through inhalation is calculated from the annual average DPM concentrations as derived
from the dispersion modeling methodology of BAAQMD.16 The following equation was used to
determine the associated cancer risk:
Cancer Risk = Dose * CRAF * Cancer Potency
Where:
Dose = Dose through inhalation (mg/kg/day).
CRAF = 10 for construction because the daycare is assumed to have children between birth and kindergarten age. Between birth and 2 years old a CRAF of 10 is used to signify the increased risk to this age group. Because the construction will take up to 20 months, the worst case scenario would be for a child to be exposed from birth to 20
16 BAAQMD Recommended Methods for Screening and Modeling Local Risks and Hazards. May 2011.
HEALTH RISK ASSESSMENT
300 Airport Boulevard November 2011 3-7 \\SFOFS01\Projects\Projects - All Employees\10001+\8889 300 Airport Blvd\04. Screencheck Draft EIR\Appendices\Appendix E Health Risk Assessment\1. 300_HRA_11-02-2011 revised.doc
months, therefore always at the elevated risk. 1.0 was used for operational because the cancer risk adjustment factor was accounted for in the determination of the age adjusted emission factor used in the modeling.
Cancer Potency Factor = toxicity factor, for DPM is 1.1 kg‐day/mg.
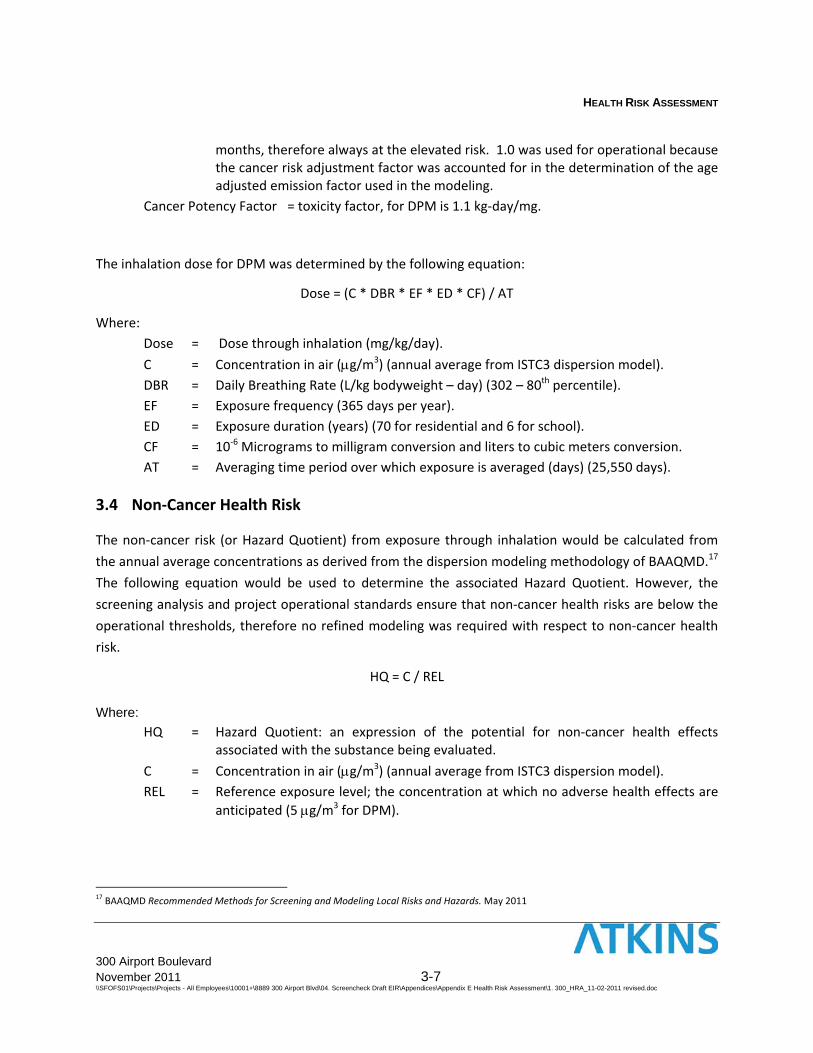
The inhalation dose for DPM was determined by the following equation:
Dose = (C * DBR * EF * ED * CF) / AT
Where:
Dose = Dose through inhalation (mg/kg/day).
C = Concentration in air (g/m3) (annual average from ISTC3 dispersion model).
DBR = Daily Breathing Rate (L/kg bodyweight – day) (302 – 80th percentile).
EF = Exposure frequency (365 days per year).
ED = Exposure duration (years) (70 for residential and 6 for school).
CF = 10‐6 Micrograms to milligram conversion and liters to cubic meters conversion.
AT = Averaging time period over which exposure is averaged (days) (25,550 days).
3.4 Non‐Cancer Health Risk
The non‐cancer risk (or Hazard Quotient) from exposure through inhalation would be calculated from
the annual average concentrations as derived from the dispersion modeling methodology of BAAQMD.17
The following equation would be used to determine the associated Hazard Quotient. However, the
screening analysis and project operational standards ensure that non‐cancer health risks are below the
operational thresholds, therefore no refined modeling was required with respect to non‐cancer health
risk.
HQ = C / REL
Where:
HQ = Hazard Quotient: an expression of the potential for non‐cancer health effects associated with the substance being evaluated.
C = Concentration in air (g/m3) (annual average from ISTC3 dispersion model).
REL = Reference exposure level; the concentration at which no adverse health effects are
anticipated (5 g/m3 for DPM).
17 BAAQMD Recommended Methods for Screening and Modeling Local Risks and Hazards. May 2011

HEALTH RISK ASSESSMENT
300 Airport Boulevard November 2011 3-8 \\SFOFS01\Projects\Projects - All Employees\10001+\8889 300 Airport Blvd\04. Screencheck Draft EIR\Appendices\Appendix E Health Risk Assessment\1. 300_HRA_11-02-2011 revised.doc
3.5 PM2.5 Concentration
The concentration of PM2.5 anticipated at each of the receptors would be derived directly from the ISTC3
or Cal3QHCR model. However, the screening level analysis and operational standards incorporated into
the project ensure that the concentration PM2.5 is below the thresholds, therefore refined modeling was
not conducted with respect to PM2.5 emission concentrations.

HEALTH RISK ASSESSMENT
300 Airport Boulevard November 2011 4-1 \\SFOFS01\Projects\Projects - All Employees\10001+\8889 300 Airport Blvd\04. Screencheck Draft EIR\Appendices\Appendix E Health Risk Assessment\1. 300_HRA_11-02-2011 revised.doc
SECTION 4.0 – ENVIRONMENTAL IMPACTS AND MITIGATION MEASURES
TACs are associated with cancer and non‐cancer health effects which vary with the individual (some
people are more susceptible than others); with the dose (the concentration of the pollutant in the air);
and with the amount of time exposed. PM2.5 exposure is also anticipated to cause adverse health effects
for those exposed to increased levels. This analysis discusses both the cancer and non‐cancer health
effects from construction activities, vehicle traffic and DPM associated with stationary sources as well as
exposure to PM2.5. Exhibit 4 shows the location of the mobile and permitted stationary sources with
respect to the Project site.
4.1 Construction Risk Characterization
4.1.1 Screening Level Analysis
BAAQMD’s Screening Tables for Air Toxics Evaluation During Construction were used to evaluate the
minimum distance required between the fence line of a construction site and nearby sensitive receptors
to ensure that PM2.5 concentrations and cancer and non‐cancer risks associated with the project are less
than significant. According to the screening tables for an 18.12 acre site such as 300 Airport Boulevard
and a 8.58 acre site such as 350 Airport Boulevard, the minimum distances are 225 and 200 meters
respectively18. The nearest offsite receptors with respect to 300 Airport Boulevard are located south of
US 101 at a distance of equal or greater than 255 meters. While there is a 0.39 acre portion that extends
to approximately 215 meters of the residential receptors, the confines of the site limit the amount of
construction activities that can occur on this portion at any given time. The screening distance
associated with a 0.39 acre site is approximately 100 meters, meaning construction can be significantly
closer to this small area than to the main portion of the site. Therefore, the distance with respect to
screening the 300 Airport Boulevard construction activities was set at the boundary of the main
construction area.
It is unknown if the 300 Airport Boulevard site would be developed in one phase or two. If developed in
two phases, there is the potential for the daycare center to be constructed and occupied during the
construction of the second phase of development. The amenities center, which houses the daycare, is
located in what is called the west campus, the area west of the realigned Airport Boulevard. With the
exception of the amenities building, the West Campus area would be constructed as part of Phase 2 and
18 BAAQMD 2010. Screening Tables for Air Toxics Evaluation During Construction version 1.0 May 2010. Pg 9.
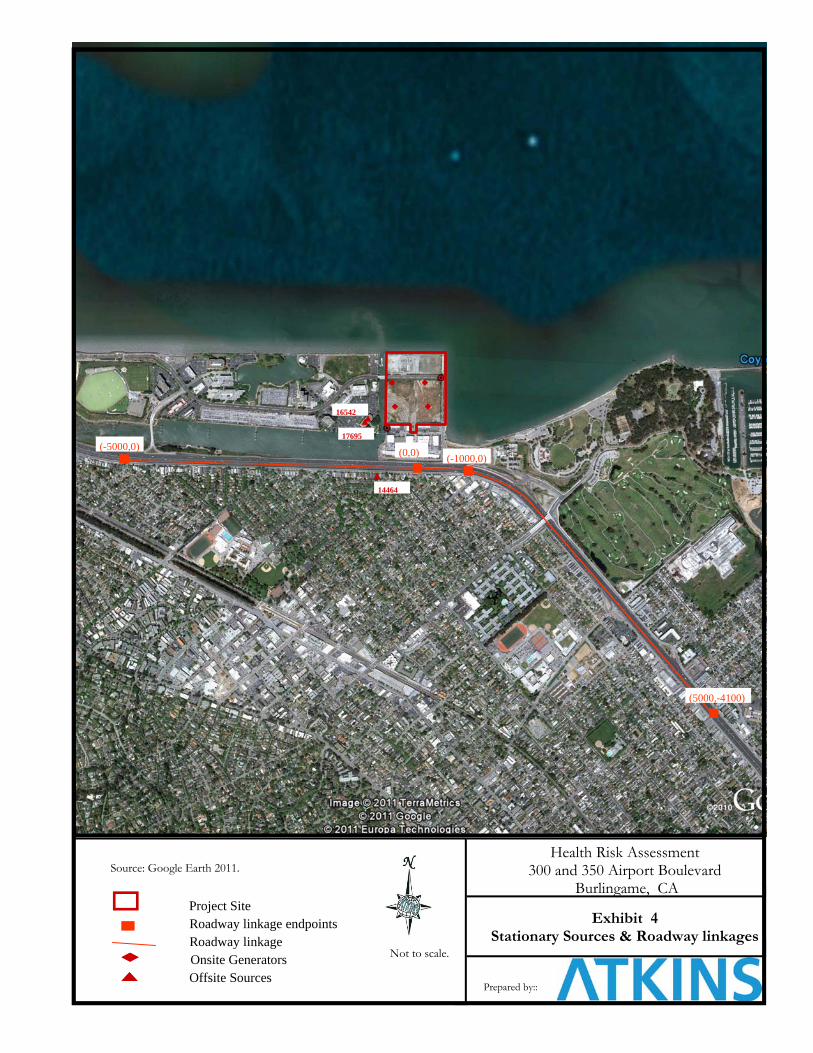
Prepared by:: .
Exhibit 4
Stationary Sources & Roadway linkages
Health Risk Assessment 300 and 350 Airport Boulevard
Burlingame, CA
Source: Google Earth 2011.
Not to scale.
(-5000,0)
(5000,-4100)
(-1000,0) (0,0)
Project Site Roadway linkage endpoints Roadway linkage Onsite Generators Offsite Sources
17695
14464
16542
HEALTH RISK ASSESSMENT
300 Airport Boulevard November 2011 4-3 \\SFOFS01\Projects\Projects - All Employees\10001+\8889 300 Airport Blvd\04. Screencheck Draft EIR\Appendices\Appendix E Health Risk Assessment\1. 300_HRA_11-02-2011 revised.doc
therefore would result in potential health risk impacts to the students of the daycare center. The West
Campus is just over 7 acres in size, however because the amenities building would be adjacent to the
construction area, it would be well with the 200 meter offset distance and therefore requires a refined
analysis to determine the potential risk.
The nearest offsite receptor with respect to 350 Airport Boulevard is the proposed daycare center to be
located at the southern border of 300 Airport Boulevard. The 350 Airport Boulevard site is 203 meters to
the building and 213 meters to the outside play area. Because the receptors are located at distance
greater than the minimum required screening distance for both 300 Airport Boulevard and 350 Airport
Boulevard, construction activities are not anticipated to result in cancer risk, non‐cancer risk, or PM2.5
concentrations above the regulatory thresholds.
Therefore, with respect to construction activities, both the development at 300 Airport Boulevard and
the future development at 350 Airport Boulevard are anticipated to be less than significant with respect
to offsite receptors. Construction at 350 Airport Boulevard is anticipated to be less than significant with
respect to onsite receptors as well, therefore requiring no further analysis. However, should
construction at 300 Airport Boulevard be constructed in phases where the daycare center is operational
during the second phase of construction, there is the potential for excessive risk and therefore further
modeling was required.
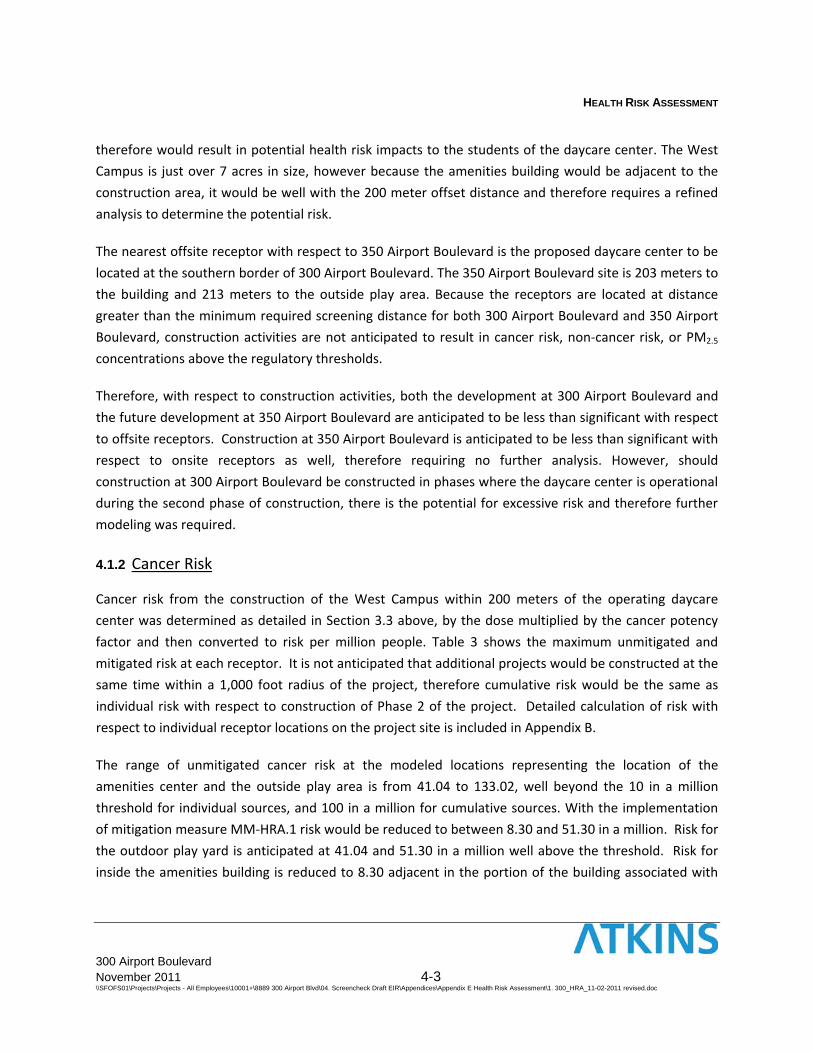
4.1.2 Cancer Risk
Cancer risk from the construction of the West Campus within 200 meters of the operating daycare
center was determined as detailed in Section 3.3 above, by the dose multiplied by the cancer potency
factor and then converted to risk per million people. Table 3 shows the maximum unmitigated and
mitigated risk at each receptor. It is not anticipated that additional projects would be constructed at the
same time within a 1,000 foot radius of the project, therefore cumulative risk would be the same as
individual risk with respect to construction of Phase 2 of the project. Detailed calculation of risk with
respect to individual receptor locations on the project site is included in Appendix B.
The range of unmitigated cancer risk at the modeled locations representing the location of the
amenities center and the outside play area is from 41.04 to 133.02, well beyond the 10 in a million
threshold for individual sources, and 100 in a million for cumulative sources. With the implementation
of mitigation measure MM‐HRA.1 risk would be reduced to between 8.30 and 51.30 in a million. Risk for
the outdoor play yard is anticipated at 41.04 and 51.30 in a million well above the threshold. Risk for
inside the amenities building is reduced to 8.30 adjacent in the portion of the building associated with

HEALTH RISK ASSESSMENT
300 Airport Boulevard November 2011 4-4 \\SFOFS01\Projects\Projects - All Employees\10001+\8889 300 Airport Blvd\04. Screencheck Draft EIR\Appendices\Appendix E Health Risk Assessment\1. 300_HRA_11-02-2011 revised.doc
the daycare center’s location. Therefore with the implementation of MM‐HRA.1, potential risk at the
daycare center would be reduced to less than significant for both individual and cumulative risk.
Table 3 – Construction Cancer Risk
Receptor #
Receptor type Unmitigated Significant?
Mitigation HRA‐1 Significant?
Cancer Risk (threshold >10 per million)
3 child 56.31 YES 8.45 No
4 child 41.04 YES 41.04 YES
6 child 102.53 YES 15.38 YES
7 child 51.30 YES 51.30 YES
18 child 78.66 YES 11.80 YES
19 child 133.02 YES 19.95 YES
20 child 55.31 YES 8.30 No
Source: Atkins 2011
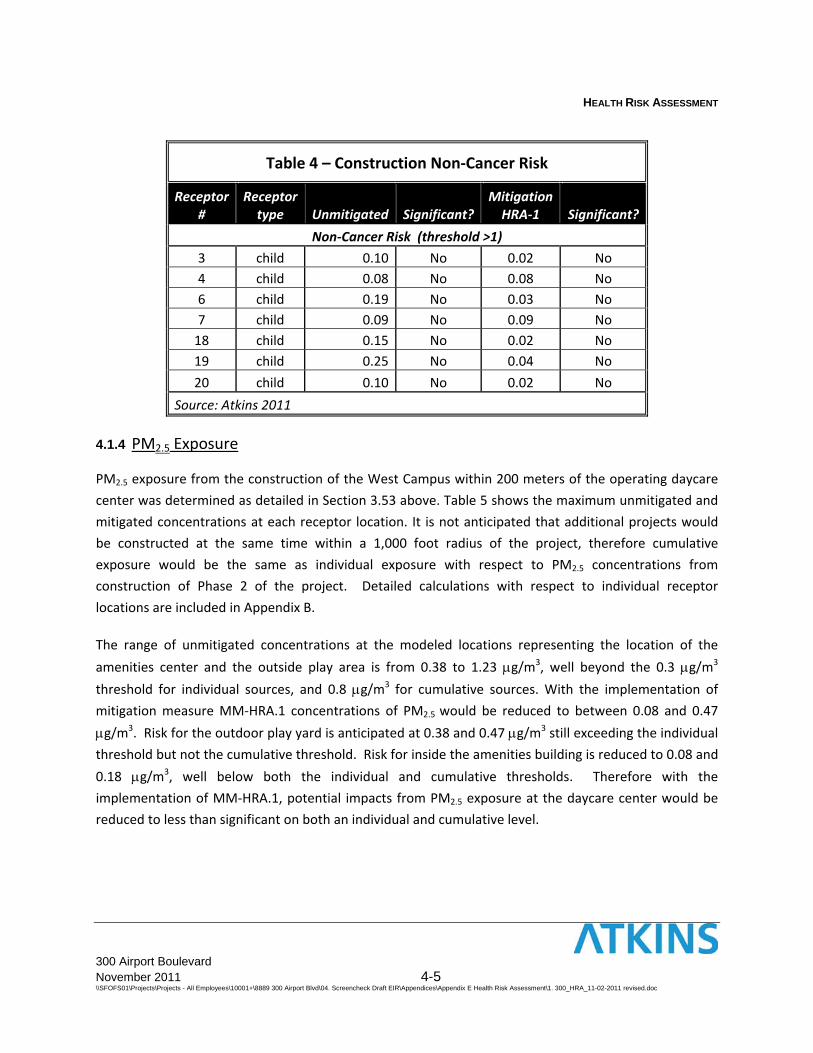
4.1.3 Non‐Cancer Risk
Non‐Cancer risk from the construction of the West Campus within 200 meters of the operating daycare
center was determined as detailed in Section 3.4 above. Table 4 shows the maximum unmitigated and
mitigated risk at each receptor. It is not anticipated that additional projects would be constructed at the
same time within a 1,000 foot radius of the project, therefore cumulative risk would be the same as
individual risk with respect to construction of Phase 2 of the project. Detailed calculation of risk with
respect to individual receptor locations on the project site is included in Appendix B.
The range of unmitigated non‐cancer risk at the modeled locations is from 0.08 to 0.25, well below the
regulatory threshold of 1 for individual sources and 10 for cumulative. With the implementation of
mitigation measure MM‐HRA.1 risk would be further reduced to between 0.02 and 0.09. Even without
implementation of Mitigation measure MM‐HRA.1 non‐cancer risk would be less than significant with
respect to construction activities in the vicinity of the daycare center.
HEALTH RISK ASSESSMENT
300 Airport Boulevard November 2011 4-5 \\SFOFS01\Projects\Projects - All Employees\10001+\8889 300 Airport Blvd\04. Screencheck Draft EIR\Appendices\Appendix E Health Risk Assessment\1. 300_HRA_11-02-2011 revised.doc
Table 4 – Construction Non‐Cancer Risk
Receptor #
Receptor type Unmitigated Significant?
Mitigation HRA‐1 Significant?
Non‐Cancer Risk (threshold >1)
3 child 0.10 No 0.02 No
4 child 0.08 No 0.08 No
6 child 0.19 No 0.03 No
7 child 0.09 No 0.09 No
18 child 0.15 No 0.02 No
19 child 0.25 No 0.04 No
20 child 0.10 No 0.02 No
Source: Atkins 2011
4.1.4 PM2.5 Exposure
PM2.5 exposure from the construction of the West Campus within 200 meters of the operating daycare
center was determined as detailed in Section 3.53 above. Table 5 shows the maximum unmitigated and
mitigated concentrations at each receptor location. It is not anticipated that additional projects would
be constructed at the same time within a 1,000 foot radius of the project, therefore cumulative
exposure would be the same as individual exposure with respect to PM2.5 concentrations from
construction of Phase 2 of the project. Detailed calculations with respect to individual receptor
locations are included in Appendix B.
The range of unmitigated concentrations at the modeled locations representing the location of the
amenities center and the outside play area is from 0.38 to 1.23 g/m3, well beyond the 0.3 g/m3
threshold for individual sources, and 0.8 g/m3 for cumulative sources. With the implementation of
mitigation measure MM‐HRA.1 concentrations of PM2.5 would be reduced to between 0.08 and 0.47
g/m3. Risk for the outdoor play yard is anticipated at 0.38 and 0.47 g/m3 still exceeding the individual
threshold but not the cumulative threshold. Risk for inside the amenities building is reduced to 0.08 and
0.18 g/m3, well below both the individual and cumulative thresholds. Therefore with the
implementation of MM‐HRA.1, potential impacts from PM2.5 exposure at the daycare center would be
reduced to less than significant on both an individual and cumulative level.

HEALTH RISK ASSESSMENT
300 Airport Boulevard November 2011 4-6 \\SFOFS01\Projects\Projects - All Employees\10001+\8889 300 Airport Blvd\04. Screencheck Draft EIR\Appendices\Appendix E Health Risk Assessment\1. 300_HRA_11-02-2011 revised.doc
Table 5 – Construction PM2.5 Concentrations
Receptor #
Receptor type Unmitigated Significant?
Mitigation HRA‐1 Significant?
Cancer Risk (threshold >0.3 g/m3)
3 child 0.52 Yes 0.08 No
4 child 0.38 Yes 0.38 Yes
6 child 0.95 Yes 0.14 No
7 child 0.47 Yes 0.47 Yes
18 child 0.73 Yes 0.11 No
19 child 1.23 Yes 0.18 No
20 child 0.51 Yes 0.08 No
Source: Atkins 2011
4.1.5 Mitigation Measures
Construction of the proposed project will result in unmitigated cancer risk and PM2.5 exposure above the
recommended regulatory thresholds at both the individual and cumulative levels. Implementation of
the following mitigation measure would reduce impacts to less than significant during the construction
of Phase 2 of the development at 300 Airport Boulevard. The analysis provided in Tables 3 through 5
above show the anticipated results for inside the building provided the air intake for the building is
located at that receptor location. Therefore, although the tables may show increased levels, risk and
PM2.5 concentrations throughout the building would be reduced to the same levels as receptor 20 with
the implementation of the following mitigation measure.
MM‐HRA.1 As part of the conditions of daycare operation during the construction of Phase 2 of the
proposed project, the following will be implemented:
a. The building would be designed such that the air intake would be located at the far eastern edge of the building with the air intake facing east.
b. A MERV 15 or higher rated filter would be installed and operated for at least the duration of construction activities. The MERV 15 or higher rated filters have the potential to remove up to 85% of particles of 2.5 microns or greater thereby reducing interior levels of pollutants.
c. All outdoor activities would be suspended while construction activities are occurring.

HEALTH RISK ASSESSMENT
300 Airport Boulevard November 2011 4-7 \\SFOFS01\Projects\Projects - All Employees\10001+\8889 300 Airport Blvd\04. Screencheck Draft EIR\Appendices\Appendix E Health Risk Assessment\1. 300_HRA_11-02-2011 revised.doc
4.2 Operational Risk Characterization
4.2.1 Screening Level Analysis
BAAQMD Guidelines recommend that all TAC and PM2.5 sources within 1,000 feet of the Project
boundaries be identified and their individual and cumulative impacts on a proposed receptor
development determined. TAC and PM2.5 sources are defined as major roadways (with more than
10,000 daily vehicle trips), and all stationary sources, including back‐up generators. For the purposes of
this analysis four onsite stationary sources, three offsite stationary sources and one mobile source were
identified within the 1,000 foot zone of influence for the Project for 300 Airport Boulevard. The
following are the four sources analyzed with respect to individual and cumulative risk within the HRA:
Source ID# 17695: A back‐up generator operated by Virgin America and located at 555 Airport
Boulevard, approximately 300 feet west the Project site.
Source ID# 16542: Is operated by CA‐Bay Park Plaza, LP and is also located at 555 Airport
Boulevard, approximately 300 feet west of the Project site.
Source ID#:14464: A diesel generator operated by the City of Burlingame at a pump station
located at 399 Rollins Road, approximately 900 feet south of the Project site.
US 101: Located approximately 680 feet from the daycare center, south of the project site.
Onsite Sources: Four onsite diesel operated back‐up generators located at or below ground
adjacent to the four new onsite office buildings. The closest of these sources are located
approximately 200 feet from the outside play are of the daycare center and over 1,100 feet
from the nearest sensitive receptors south of US 101.
The development at 350 Airport Boulevard is not anticipated to include any sensitive receptors. 350
Airport Boulevard may construct a back‐up generator associated with onsite operations, however it is
assumed for the purposes of this analysis, that the generator would operate under the same restrictions
as those identified for 300 Airport Boulevard. Therefore, operational health risk with respect to this site
is considered on a qualitative level in this analysis. At the time full project definition and development
specifications for 350 Airport Boulevard are known a full health risk evaluation with respect to the new
development design shall need to be undertaken if the development includes a sensitive receptor or the

HEALTH RISK ASSESSMENT
300 Airport Boulevard November 2011 4-8 \\SFOFS01\Projects\Projects - All Employees\10001+\8889 300 Airport Blvd\04. Screencheck Draft EIR\Appendices\Appendix E Health Risk Assessment\1. 300_HRA_11-02-2011 revised.doc
back‐up generator will not observe the same operating conditions as identified for the 300 Airport
Boulevard development.
The screening level analysis for the permitted sources and roadways was conducted as detailed in
Section 3 above. Tables 6 and 7 show the results of the screening level analysis for roadways and
permitted sources respectively on an individual impact level. Table 8 shows the results of the combined
impact screening level analysis. As shown, the Project would not be exposed to either individual or
cumulative emissions above the thresholds for Cancer Risk (10 and 100 per million), from offsite
stationary sources or non‐cancer hazard (1 and 10), or PM2.5 concentrations (0.3 and 0.8 g/m3) from
either offsite stationary sources or US 101. However, the onsite stationary source may represent a
significant impact to onsite receptors, and US 101 exceeds the regulatory thresholds for cancer risk
based on the screening analysis.
Table 6: Screening Level Analysis – Roadway Sources
Street Distance
(ft)
PM2.5 (>0.3
g/m3)1
Hazard Quotient (> 1)
Risk (> 10 per mil.)2
101 Freeway 500 0.268 0.041 30.56
685 0.262 0.040 29.868
750 0.260 0.04 29.625
Significant ‐ No No Yes Sources: Distance: Google Earth Pro 2011. Risk and Concentration: BAAQMD Highway Screening Tool, April 29, 2011.. Distance: Of 500 & 700 feet are the closest distances represented in the screening tool. Distance: Of 685 feet is the actual distance to the site. Values at the site distance are extrapolated from the
screening tool values based on BAAQMD methodology. Notes: All maximum acute and chronic hazard index for the distances shown in the screening tables will be below 0.02
g/m3.

HEALTH RISK ASSESSMENT
300 Airport Boulevard November 2011 4-9 \\SFOFS01\Projects\Projects - All Employees\10001+\8889 300 Airport Blvd\04. Screencheck Draft EIR\Appendices\Appendix E Health Risk Assessment\1. 300_HRA_11-02-2011 revised.doc
Table 7: Screening Level Analysis – Stationary Sources
Source # Source ID
PM2.5
(>0.3 g/m3) Hazard
Index (>1) Risk
(> 10 per mil)
1 17695 0.009 0.006 2.992
2 14464 0.029 0.005 9.350
3 16542 0.002 0.003 7.600
4 350 Airport Boulevarda 0.000 0.000 0.000
4 Onsiteb 0.000 0.000 0.000
Significant No No No Sources: BAAQMD Stationary Source Screening Analysis Tool, San Francisco, May 2011. Source inquiry form included in Appendix B. a The onsite generators assumed to be constructed at 350 Airport Boulevard are anticipated to operated under the same conditions as the generators at 300 Airport Boulevard. b Onsite sources represent the 4 potential emergency back‐up generators. They are more than 1,000 feet from the existing offsite residential and are therefore negligible risk. Because they will only be operated when the onsite daycare center is not operating, they are considered to have no impact on the daycare center with respect to health risk.
Table 8: Screening Level Analysis – Cumulative
Source # Source ID
PM2.5
(>0.8 g/m3) Hazard
Index (>10)Risk
(> 100 per mil)
1 17695 0.009 0.006 2.992
2 14464 0.029 0.005 9.350
3 16542 0.002 0.003 7.600
4 350 Airport Boulevarda 0.000 0.000 0.000
5 Onsitea 0.000 0.000 0.000
6 101 Freeway 0.262 0.040 29.868
Total Cumulative 0.303 0.055 49.810
Significant No No No Source: Atkins 2011 a The onsite generators assumed to be constructed at 350 Airport Boulevard are anticipated to operated under the same conditions as the generators at 300 Airport Boulevard. b Onsite sources represent the 4 potential emergency back‐up generators. They are more than 1,000 feet from the existing offsite residential and are therefore negligible risk. Because they will only be operated when the onsite daycare center is not operating, they are considered to have no impact on the daycare center with respect to health risk.

HEALTH RISK ASSESSMENT
300 Airport Boulevard November 2011 4-10 \\SFOFS01\Projects\Projects - All Employees\10001+\8889 300 Airport Blvd\04. Screencheck Draft EIR\Appendices\Appendix E Health Risk Assessment\1. 300_HRA_11-02-2011 revised.doc
The Project operations will, as outlined in Section 4.2.2, operate the generator outside of the normal
business hours for the daycare facility. Therefore, based on these operating restrictions, the existence of
onsite back‐up generators is not anticipated to result in significant risk for the daycare center and is not
analyzed further. However, the screening levels anticipated from US 101 exceed the individual risk
thresholds for the daycare center for cancer risk. Therefore, refined analysis with respect to cancer risk
from proximity to US 101 was conducted.
Because the onsite generators are located over 1,000 feet from the nearest offsite receptor, they are
not anticipated to result in significant impacts and are therefore excluded from further analysis with
respect to offsite receptors.
4.2.2 Cancer Risk
Cancer risk from locating the daycare center within 1,000 feet of US 101 was determined as detailed in
Section 3.3 above, by the dose multiplied by the cancer potency factor and then converted to risk per
million people. Table 9 shows the maximum risk of the refined analysis at each receptor, and Table 10
shows the refined maximum cumulative risk. Detailed calculation of risk with respect to individual
receptor locations on the project site is included in Appendix B.
As shown, the maximum potential cancer risks to any modeled onsite location is 3.00 per million, which
is below the 10 in a million individual source threshold. The modeled locations representing the
anticipated location of the amenities center and the outside play area result in a cancer risk of between
2.70 and the maximum 3.00 per million. The combination of risk from all individual sources within the
vicinity would determine the cumulative risk at each site. While the unrefined cumulative cancer risk
was below the regulatory threshold, the incorporation of the refined modeling for the amenities center
results in a further decrease in the cumulative cancer risk. Both the individual and cumulative cancer risk
determinations are below the respective thresholds (10 per million for individual and 100 per million for
cumulative). Therefore, cancer risk for occupant of the daycare center would be less than significant on
an individual as well as cumulative level with respect to onsite as well as offsite emissions.

HEALTH RISK ASSESSMENT
300 Airport Boulevard November 2011 4-11 \\SFOFS01\Projects\Projects - All Employees\10001+\8889 300 Airport Blvd\04. Screencheck Draft EIR\Appendices\Appendix E Health Risk Assessment\1. 300_HRA_11-02-2011 revised.doc
Table 9: Revised Analysis
Receptor # TOC Exhaust
TOC Evaporative Loss Diesel
Unmitigated Risk
>10 per million
1 3.863E‐05 4.827E‐06 3.00 3.00 No
2 3.832E‐05 4.827E‐06 3.00 3.00 No
3 3.768E‐05 4.791E‐06 3.00 3.00 No
4 3.705E‐05 4.791E‐06 3.00 3.00 No
5 3.610E‐05 4.721E‐06 3.00 3.00 No
6 3.198E‐05 4.122E‐06 2.70 2.70 No
7 3.420E‐05 4.439E‐06 2.70 2.70 No
8 2.882E‐05 3.664E‐06 2.40 2.40 No
9 2.818E‐05 3.664E‐06 2.40 2.40 No
10 2.755E‐05 3.629E‐06 2.10 2.10 No
11 2.723E‐05 3.594E‐06 2.10 2.10 No
12 2.628E‐05 3.523E‐06 2.10 2.10 No
13 2.248E‐05 2.924E‐06 1.80 1.80 No
14 2.185E‐05 2.924E‐06 1.80 1.80 No
15 2.153E‐05 2.889E‐06 1.80 1.80 No
16 2.090E‐05 2.854E‐06 1.80 1.80 No
17 2.027E‐05 2.819E‐06 1.80 1.80 No
Source: Atkins 2011
Table 10: Refined Cumulative
Source # Source ID
PM2.5
(>0.8 g/m3) Hazard
Index (>10)Risk
(> 100 per mil)
1 Stationary Total 0.041 0.015 19.942
4 101 Freeway 0.262 0.040 3.00
Total Cumulative 0.303 0.055 22.947
Significant No No No Source: Atkins 2011 a: Onsite sources represent the 4 potential emergency back‐up generators. They are more than 1,000 feet from the existing offsite residential and are therefore negligible risk. Because they will only be operated when the onsite daycare center is not operating, they are considered to have no impact on the daycare center with respect to health risk.

HEALTH RISK ASSESSMENT
300 Airport Boulevard November 2011 4-12 \\SFOFS01\Projects\Projects - All Employees\10001+\8889 300 Airport Blvd\04. Screencheck Draft EIR\Appendices\Appendix E Health Risk Assessment\1. 300_HRA_11-02-2011 revised.doc
4.2.3 Mitigation Measures
The Project Applicant has indicated that, as part of the operating conditions of the back‐up generators,
all testing and maintenance operations of the generators will be conducted when the daycare center is
not in operation. This will eliminate the potential for these onsite sources to represent an increased
health risk for the students of the daycare center. The following mitigation measure is included to
ensure implementation of these operating conditions.
MM‐HRA.2 As part of the conditions of operation for the onsite back‐up generators, all diesel
emissions associated with the maintenance and testing of the generators will be
conducted at such times as the daycare center is not in operation.
While it is not necessary based on the refined modeling described below, the project applicant may wish
to consider implementing MERV 15 or higher rated filters for the amenities building. This would further
reduce exposure of daycare students to emissions from US 101. The MERV 15 or higher rated filters
have the potential to remove up to 85% of particles of 2.5 microns or greater and would further reduce
risk while students were inside the building.
For the purposes of this analysis it was assumed that the generators anticipated at 350 Airport
Boulevard would operate under the same conditions as those identified for Airport Boulevard and listed
under MM‐HRA.2 above. Should these conditions not be applied, additional sources that are not back‐
up generators be included in the project, or sensitive receptors be sited as part of the refined project,
then a full health risk assessment will be required prior to the development of 350 Airport boulevard.
4.3 Conclusion
The Project will be required to implement BAAQMD’s Basic Construction Mitigation Measures during
construction. Construction activities are not anticipated to impact off‐site receptors due to distance and
construction of 350 Airport Boulevard is likely not anticipated to impact the daycare center after it is
operational. However, should the 300 Airport Boulevard site be constructed in two phases as
anticipated, and the amenities center be completely operational during the second phase of
construction, there is the potential for significant cancer and non‐cancer risk and PM2.5 exposure. The
refined analysis shows that, unmitigated, cancer risk is anticipated to exceed 41.04 in a million and
PM2.5 exposure would exceed 0.38 g/m3, both of which exceed the regulatory thresholds. Non‐cancer
risk would be less than 0.25 which is well below the regulatory threshold of 1. With the implementation
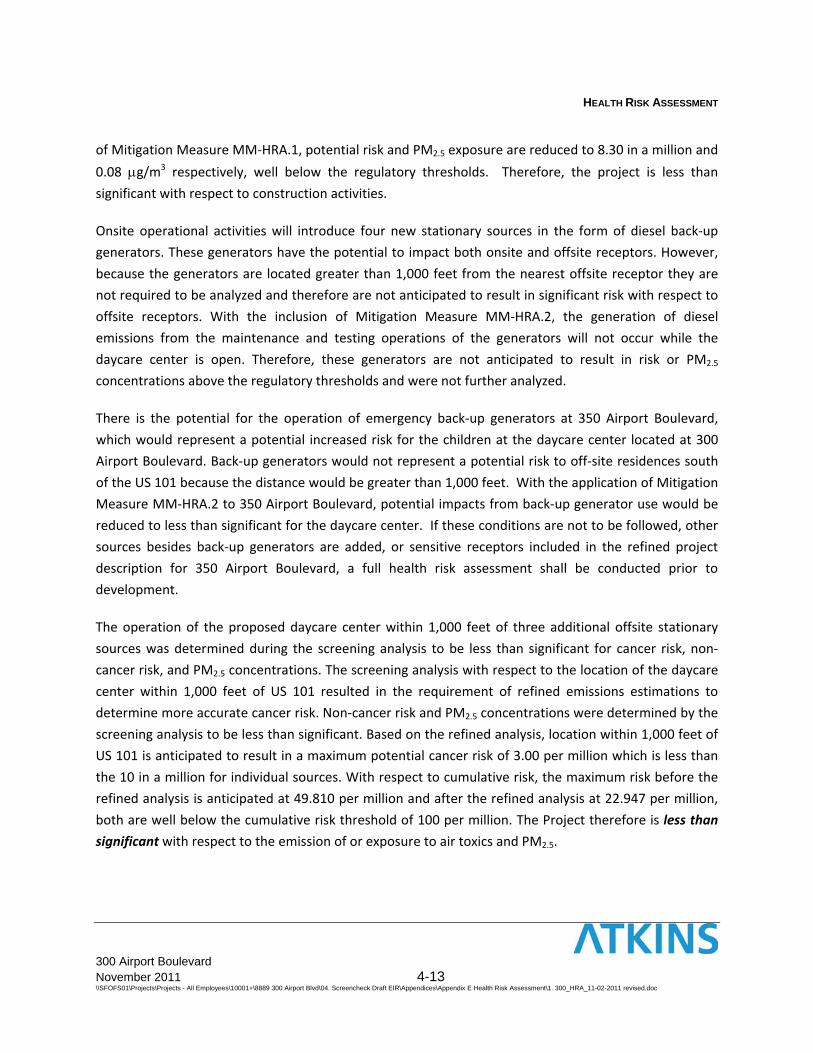
HEALTH RISK ASSESSMENT
300 Airport Boulevard November 2011 4-13 \\SFOFS01\Projects\Projects - All Employees\10001+\8889 300 Airport Blvd\04. Screencheck Draft EIR\Appendices\Appendix E Health Risk Assessment\1. 300_HRA_11-02-2011 revised.doc
of Mitigation Measure MM‐HRA.1, potential risk and PM2.5 exposure are reduced to 8.30 in a million and
0.08 g/m3 respectively, well below the regulatory thresholds. Therefore, the project is less than
significant with respect to construction activities.
Onsite operational activities will introduce four new stationary sources in the form of diesel back‐up
generators. These generators have the potential to impact both onsite and offsite receptors. However,
because the generators are located greater than 1,000 feet from the nearest offsite receptor they are
not required to be analyzed and therefore are not anticipated to result in significant risk with respect to
offsite receptors. With the inclusion of Mitigation Measure MM‐HRA.2, the generation of diesel
emissions from the maintenance and testing operations of the generators will not occur while the
daycare center is open. Therefore, these generators are not anticipated to result in risk or PM2.5
concentrations above the regulatory thresholds and were not further analyzed.
There is the potential for the operation of emergency back‐up generators at 350 Airport Boulevard,
which would represent a potential increased risk for the children at the daycare center located at 300
Airport Boulevard. Back‐up generators would not represent a potential risk to off‐site residences south
of the US 101 because the distance would be greater than 1,000 feet. With the application of Mitigation
Measure MM‐HRA.2 to 350 Airport Boulevard, potential impacts from back‐up generator use would be
reduced to less than significant for the daycare center. If these conditions are not to be followed, other
sources besides back‐up generators are added, or sensitive receptors included in the refined project
description for 350 Airport Boulevard, a full health risk assessment shall be conducted prior to
development.
The operation of the proposed daycare center within 1,000 feet of three additional offsite stationary
sources was determined during the screening analysis to be less than significant for cancer risk, non‐
cancer risk, and PM2.5 concentrations. The screening analysis with respect to the location of the daycare
center within 1,000 feet of US 101 resulted in the requirement of refined emissions estimations to
determine more accurate cancer risk. Non‐cancer risk and PM2.5 concentrations were determined by the
screening analysis to be less than significant. Based on the refined analysis, location within 1,000 feet of
US 101 is anticipated to result in a maximum potential cancer risk of 3.00 per million which is less than
the 10 in a million for individual sources. With respect to cumulative risk, the maximum risk before the
refined analysis is anticipated at 49.810 per million and after the refined analysis at 22.947 per million,
both are well below the cumulative risk threshold of 100 per million. The Project therefore is less than
significant with respect to the emission of or exposure to air toxics and PM2.5.

HEALTH RISK ASSESSMENT
300 Airport Boulevard November 2011 5-1 \\SFOFS01\Projects\Projects - All Employees\10001+\8889 300 Airport Blvd\04. Screencheck Draft EIR\Appendices\Appendix E Health Risk Assessment\1. 300_HRA_11-02-2011 revised.doc
SECTION 5.0 – REFERENCES
Bay Area Air Quality Management District (BAAQMD) Screening Tables for Air Toxics Evaluation During Construction version 1.0 May 2010.
BAAQMD Roadway Screening Analysis Tables, April 2011.
BAAQMD Highway Screening Tool, April 29, 2011
BAAQMD California Environmental Quality Act Air Quality Guidelines, Updated May 2011.
BAAQMD Recommended Methods for Screening and Modeling Local Risks and Hazards, May 2011.
BAAQMD Stationary Source Screening Analysis Tool, San Francisco, May 2011.
BAAQMD Screening Analysis Flow Chart, May 2011.
BAAQMD. Personal Communication James Cordova BAAQMD, September 16, 2011.
California Air Resources Board (CARB). Emfac 2007 Computer Model, Version 2.3, November 1, 2006.
CARB California Almanac of Emissions and Air Quality, 2009.
California Environmental Health Tracking Program (CEHTP) Traffic Linkage Service Demonstration Program, accessed from http://www.ehib.org/traffic_tool.jsp. July 26, 2011.
Office of Environmental Health Hazard Assessment. Air Toxics Hot Spots Program Risk Assessment Guidelines, The Air Toxics Hot Spots Program Guidance Manual for Preparation of Health Risk Assessments. October 2003.
U.S. Environmental Protection Agency, CAL3QHCR air dispersion Model. September 1995.

Appendix A
Modeling Assumptions

300 Airport Blvd.
Operational year 2015
AADT 238,000
Peak Hour Traffic 17,200
AADT (Trucks)1 9,068
% Trucks 3.81%
Peak Hour Trucks 655
Conversion from tons to grams 907,184.74 grams/ton
Miles per trip 1.4
Assumes operation from 7 am to 7 pm only
Assumes construction of Phase 2 occurs during hours of operations of the daycare.
Assumes construction of Phase 2 is 20 months and daycare is open the entire time.
Assumes worst case that children between birth and 2 years are onsite at time of construction.
1
300/350 Airport Boulevard
Assumptions
Truck traffic for 2010 was estimated based on the total vehicle counts and
truck traffic provided for 2009.

2015
Total VMT Hourly
Hour VMT/1000 Normalization Traffic tons/hr gr/hr g/VMT
24 275000 0.550 361 0.05 45,359 0.16
1 188000 0.376 247 0.02 18,144 0.10
2 207000 0.414 272 0.03 27,216 0.13
3 232000 0.464 305 0.07 63,503 0.27
4 148000 0.296 194 0.04 36,287 0.25
5 227000 0.454 298 0.06 54,431 0.24
6 378000 0.756 496 0.11 99,790 0.26
7 269000 0.538 353 0.08 72,575 0.27
8 404000 0.808 530 0.09 81,647 0.20
9 500000 1.000 656 0.12 108,862 0.22
10 424000 0.848 556 0.11 99,790 0.24
11 463000 0.926 607 0.11 99,790 0.22
Emissions
Diesel PM2.5
300 Airport Boulevard
2015 Hourly Emission Rates
11 463000 0.926 607 0.11 99,790 0.22
12 410000 0.820 538 0.09 81,647 0.20
13 405000 0.810 531 0.1 90,718 0.22
14 332000 0.664 436 0.08 72,575 0.22
15 216000 0.432 284 0.05 45,359 0.21
16 335000 0.670 440 0.08 72,575 0.22
17 176000 0.352 231 0.03 27,216 0.15
18 145000 0.290 191 0.03 27,216 0.19
19 53000 0.106 70 0.01 9,072 0.17
20 202000 0.404 265 0.04 36,287 0.18
21 276000 0.552 362 0.05 45,359 0.16
22 170000 0.340 223 0.02 18,144 0.11
23 58000 0.116 77 0.01 9,072 0.16
Max 500,000

Total VMT Hourly
VMT/1000 Normalization Traffic tons/hr gr/hr g/VMT tons/hr gr/hr g/VMT
2,137,000 0.143 2,461 0.520 471,736 0.22 0.21 190,509 0.09
797,000 0.053 918 0.230 208,652 0.26 0.09 81,647 0.10
797,000 0.053 918 0.250 226,796 0.28 0.07 63,503 0.08
510,000 0.034 588 0.230 208,652 0.41 0.04 36,287 0.07
931,000 0.062 1,072 0.270 244,940 0.26 0.08 72,575 0.08
1,689,000 0.113 1,945 0.460 417,305 0.25 0.17 154,221 0.09
6,957,000 0.466 8,010 1.570 1,424,280 0.20 0.64 580,598 0.08
14,166,000 0.948 16,311 3.210 2,912,063 0.21 1.69 1,533,142 0.11
13,051,000 0.874 15,027 3.190 2,893,919 0.22 1.60 1,451,496 0.11
8,096,000 0.542 9,322 2.330 2,113,740 0.26 1.18 1,070,478 0.13
8,578,000 0.574 9,877 2.230 2,023,022 0.24 1.24 1,124,909 0.13
10,811,000 0.724 12,448 2.670 2,422,183 0.22 1.59 1,442,424 0.13
Emissions ‐ Total Exhaust Emissions ‐ Running
TOG
300 Airport Boulevard
2015 Hourly Emission Rates
10,811,000 0.724 12,448 2.670 2,422,183 0.22 1.59 1,442,424 0.13
11,269,000 0.754 12,975 2.580 2,340,537 0.21 1.74 1,578,501 0.14
11,068,000 0.741 12,744 2.420 2,195,387 0.20 1.52 1,378,921 0.12
12,824,000 0.858 14,765 2.680 2,431,255 0.19 1.73 1,569,430 0.12
13,054,000 0.874 15,030 2.720 2,467,542 0.19 1.80 1,632,933 0.13
13,552,000 0.907 15,604 2.850 2,585,477 0.19 1.83 1,660,148 0.12
14,939,000 1.000 17,200 3.080 2,794,129 0.19 1.92 1,741,795 0.12
10,396,000 0.696 11,970 2.200 1,995,806 0.19 1.37 1,242,843 0.12
7,792,000 0.522 8,972 1.750 1,587,573 0.20 1.03 934,400 0.12
5,955,000 0.399 6,857 1.360 1,233,771 0.21 0.71 644,101 0.11
6,045,000 0.405 6,960 1.250 1,133,981 0.19 0.64 580,598 0.10
4,507,000 0.302 5,190 0.950 861,826 0.19 0.47 426,377 0.09
3,413,000 0.228 3,930 0.790 716,676 0.21 0.39 353,802 0.10
14,939,000
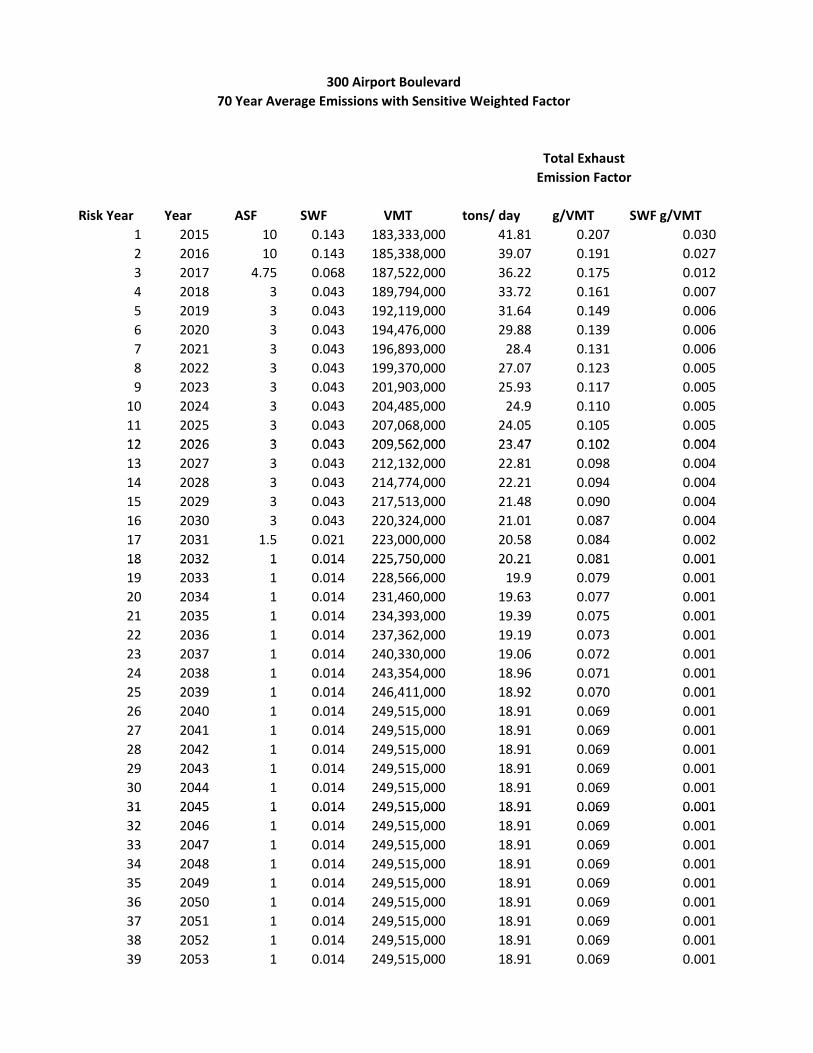
300 Airport Boulevard
70 Year Average Emissions with Sensitive Weighted Factor
Emission Factor
Total Exhaust
1 2015 10 0.143 183,333,000 41.81 0.207 0.030
2 2016 10 0.143 185,338,000 39.07 0.191 0.027
3 2017 4.75 0.068 187,522,000 36.22 0.175 0.012
4 2018 3 0.043 189,794,000 33.72 0.161 0.007
5 2019 3 0.043 192,119,000 31.64 0.149 0.006
VMTSWFASFYear g/VMTtons/ dayRisk Year SWF g/VMT
, ,
6 2020 3 0.043 194,476,000 29.88 0.139 0.006
7 2021 3 0.043 196,893,000 28.4 0.131 0.006
8 2022 3 0.043 199,370,000 27.07 0.123 0.005
9 2023 3 0.043 201,903,000 25.93 0.117 0.005
10 2024 3 0.043 204,485,000 24.9 0.110 0.005
11 2025 3 0.043 207,068,000 24.05 0.105 0.005
12 2026 3 0 043 209 562 000 23 47 0 102 0 00412 2026 3 0.043 209,562,000 23.47 0.102 0.004
13 2027 3 0.043 212,132,000 22.81 0.098 0.004
14 2028 3 0.043 214,774,000 22.21 0.094 0.004
15 2029 3 0.043 217,513,000 21.48 0.090 0.004
16 2030 3 0.043 220,324,000 21.01 0.087 0.004
17 2031 1.5 0.021 223,000,000 20.58 0.084 0.002
18 2032 1 0.014 225,750,000 20.21 0.081 0.00118 2032 1 0.014 225,750,000 20.21 0.081 0.001
19 2033 1 0.014 228,566,000 19.9 0.079 0.001
20 2034 1 0.014 231,460,000 19.63 0.077 0.001
21 2035 1 0.014 234,393,000 19.39 0.075 0.001
22 2036 1 0.014 237,362,000 19.19 0.073 0.001
23 2037 1 0.014 240,330,000 19.06 0.072 0.001
24 2038 1 0.014 243,354,000 18.96 0.071 0.001
25 2039 1 0 014 246 411 000 18 92 0 070 0 00125 2039 1 0.014 246,411,000 18.92 0.070 0.001
26 2040 1 0.014 249,515,000 18.91 0.069 0.001
27 2041 1 0.014 249,515,000 18.91 0.069 0.001
28 2042 1 0.014 249,515,000 18.91 0.069 0.001
29 2043 1 0.014 249,515,000 18.91 0.069 0.001
30 2044 1 0.014 249,515,000 18.91 0.069 0.001
31 2045 1 0.014 249,515,000 18.91 0.069 0.00131 2045 1 0.014 249,515,000 18.91 0.069 0.001
32 2046 1 0.014 249,515,000 18.91 0.069 0.001
33 2047 1 0.014 249,515,000 18.91 0.069 0.001
34 2048 1 0.014 249,515,000 18.91 0.069 0.001
35 2049 1 0.014 249,515,000 18.91 0.069 0.001
36 2050 1 0.014 249,515,000 18.91 0.069 0.001
37 2051 1 0.014 249,515,000 18.91 0.069 0.001
38 2052 1 0.014 249,515,000 18.91 0.069 0.001
39 2053 1 0.014 249,515,000 18.91 0.069 0.001
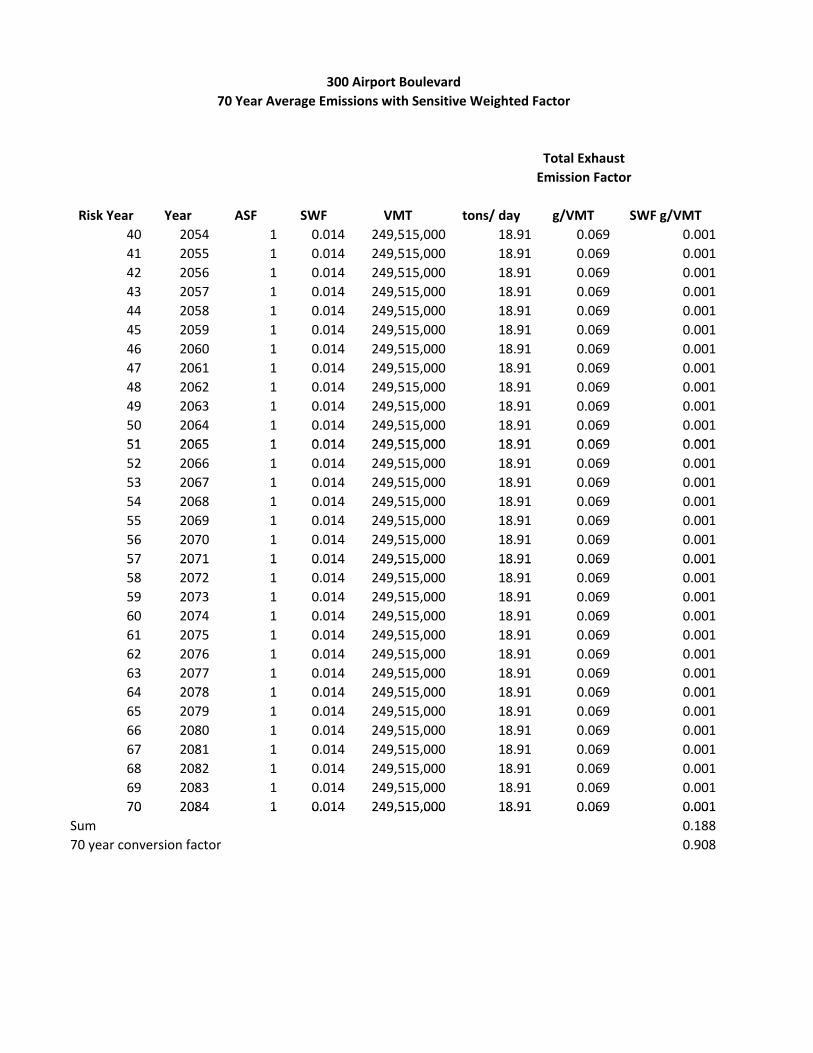
300 Airport Boulevard
70 Year Average Emissions with Sensitive Weighted Factor
Emission Factor
Total Exhaust
VMTSWFASFYear g/VMTtons/ dayRisk Year SWF g/VMT
40 2054 1 0.014 249,515,000 18.91 0.069 0.001
41 2055 1 0.014 249,515,000 18.91 0.069 0.001
42 2056 1 0.014 249,515,000 18.91 0.069 0.001
43 2057 1 0.014 249,515,000 18.91 0.069 0.001
44 2058 1 0.014 249,515,000 18.91 0.069 0.001, ,
45 2059 1 0.014 249,515,000 18.91 0.069 0.001
46 2060 1 0.014 249,515,000 18.91 0.069 0.001
47 2061 1 0.014 249,515,000 18.91 0.069 0.001
48 2062 1 0.014 249,515,000 18.91 0.069 0.001
49 2063 1 0.014 249,515,000 18.91 0.069 0.001
50 2064 1 0.014 249,515,000 18.91 0.069 0.001
51 2065 1 0 014 249 515 000 18 91 0 069 0 00151 2065 1 0.014 249,515,000 18.91 0.069 0.001
52 2066 1 0.014 249,515,000 18.91 0.069 0.001
53 2067 1 0.014 249,515,000 18.91 0.069 0.001
54 2068 1 0.014 249,515,000 18.91 0.069 0.001
55 2069 1 0.014 249,515,000 18.91 0.069 0.001
56 2070 1 0.014 249,515,000 18.91 0.069 0.001
57 2071 1 0.014 249,515,000 18.91 0.069 0.00157 2071 1 0.014 249,515,000 18.91 0.069 0.001
58 2072 1 0.014 249,515,000 18.91 0.069 0.001
59 2073 1 0.014 249,515,000 18.91 0.069 0.001
60 2074 1 0.014 249,515,000 18.91 0.069 0.001
61 2075 1 0.014 249,515,000 18.91 0.069 0.001
62 2076 1 0.014 249,515,000 18.91 0.069 0.001
63 2077 1 0.014 249,515,000 18.91 0.069 0.001
64 2078 1 0 014 249 515 000 18 91 0 069 0 00164 2078 1 0.014 249,515,000 18.91 0.069 0.001
65 2079 1 0.014 249,515,000 18.91 0.069 0.001
66 2080 1 0.014 249,515,000 18.91 0.069 0.001
67 2081 1 0.014 249,515,000 18.91 0.069 0.001
68 2082 1 0.014 249,515,000 18.91 0.069 0.001
69 2083 1 0.014 249,515,000 18.91 0.069 0.001
70 2084 1 0.014 249,515,000 18.91 0.069 0.00170 2084 1 0.014 249,515,000 18.91 0.069 0.001
Sum 0.188
70 year conversion factor 0.908

300 Airport Boulevard
70 Year Average Emissions with Sensitive Weighted Factor
Emission Factor
DieselEvaporative Loss
Emission Factor
1 23.75 0.118 0.017 6,501,000 1.52 0.212 0.030
2 23.02 0.113 0.016 6,565,000 1.40 0.193 0.028
3 22.32 0.108 0.007 6,630,000 1.29 0.177 0.012
4 21.66 0.104 0.004 6,693,000 1.18 0.160 0.007
5 21.12 0.100 0.004 6,756,000 1.10 0.148 0.006
VMT tons/ day g/VMT SWF g/VMTRisk Year tons/day g/VMT SWF g/VMT
, ,
6 20.61 0.096 0.004 6,815,000 1.03 0.137 0.006
7 20.14 0.093 0.004 6,867,000 0.97 0.128 0.005
8 19.69 0.090 0.004 6,911,000 0.91 0.119 0.005
9 19.26 0.087 0.004 6,957,000 0.87 0.113 0.005
10 18.83 0.084 0.004 7,004,000 0.83 0.108 0.005
11 18.45 0.081 0.003 7,046,000 0.80 0.103 0.004
12 18 11 0 078 0 003 7 093 000 0 76 0 097 0 00412 18.11 0.078 0.003 7,093,000 0.76 0.097 0.004
13 17.79 0.076 0.003 7,136,000 0.75 0.095 0.004
14 17.5 0.074 0.003 7,184,000 0.72 0.091 0.004
15 17.21 0.072 0.003 7,241,000 0.71 0.089 0.004
16 16.92 0.070 0.003 7,306,000 0.70 0.087 0.004
17 16.56 0.067 0.001 7,373,000 0.69 0.085 0.002
18 16.24 0.065 0.001 7,444,000 0.70 0.085 0.00118 16.24 0.065 0.001 7,444,000 0.70 0.085 0.001
19 15.94 0.063 0.001 7,517,000 0.69 0.083 0.001
20 15.71 0.062 0.001 7,591,000 0.69 0.082 0.001
21 15.5 0.060 0.001 7,666,000 0.69 0.082 0.001
22 15.37 0.059 0.001 7,737,000 0.70 0.082 0.001
23 15.28 0.058 0.001 7,806,000 0.70 0.081 0.001
24 15.18 0.057 0.001 7,877,000 0.71 0.082 0.001
25 15 1 0 056 0 001 7 948 000 0 71 0 081 0 00125 15.1 0.056 0.001 7,948,000 0.71 0.081 0.001
26 15.04 0.055 0.001 8,022,000 0.71 0.080 0.001
27 15.04 0.055 0.001 8,022,000 0.71 0.080 0.001
28 15.04 0.055 0.001 8,022,000 0.71 0.080 0.001
29 15.04 0.055 0.001 8,022,000 0.71 0.080 0.001
30 15.04 0.055 0.001 8,022,000 0.71 0.080 0.001
31 15.04 0.055 0.001 8,022,000 0.71 0.080 0.00131 15.04 0.055 0.001 8,022,000 0.71 0.080 0.001
32 15.04 0.055 0.001 8,022,000 0.71 0.080 0.001
33 15.04 0.055 0.001 8,022,000 0.71 0.080 0.001
34 15.04 0.055 0.001 8,022,000 0.71 0.080 0.001
35 15.04 0.055 0.001 8,022,000 0.71 0.080 0.001
36 15.04 0.055 0.001 8,022,000 0.71 0.080 0.001
37 15.04 0.055 0.001 8,022,000 0.71 0.080 0.001
38 15.04 0.055 0.001 8,022,000 0.71 0.080 0.001
39 15.04 0.055 0.001 8,022,000 0.71 0.080 0.001

300 Airport Boulevard
70 Year Average Emissions with Sensitive Weighted Factor
Emission Factor
DieselEvaporative Loss
Emission Factor
VMT tons/ day g/VMT SWF g/VMTRisk Year tons/day g/VMT SWF g/VMT
40 15.04 0.055 0.001 8,022,000 0.71 0.080 0.001
41 15.04 0.055 0.001 8,022,000 0.71 0.080 0.001
42 15.04 0.055 0.001 8,022,000 0.71 0.080 0.001
43 15.04 0.055 0.001 8,022,000 0.71 0.080 0.001
44 15.04 0.055 0.001 8,022,000 0.71 0.080 0.001, ,
45 15.04 0.055 0.001 8,022,000 0.71 0.080 0.001
46 15.04 0.055 0.001 8,022,000 0.71 0.080 0.001
47 15.04 0.055 0.001 8,022,000 0.71 0.080 0.001
48 15.04 0.055 0.001 8,022,000 0.71 0.080 0.001
49 15.04 0.055 0.001 8,022,000 0.71 0.080 0.001
50 15.04 0.055 0.001 8,022,000 0.71 0.080 0.001
51 15 04 0 055 0 001 8 022 000 0 71 0 080 0 00151 15.04 0.055 0.001 8,022,000 0.71 0.080 0.001
52 15.04 0.055 0.001 8,022,000 0.71 0.080 0.001
53 15.04 0.055 0.001 8,022,000 0.71 0.080 0.001
54 15.04 0.055 0.001 8,022,000 0.71 0.080 0.001
55 15.04 0.055 0.001 8,022,000 0.71 0.080 0.001
56 15.04 0.055 0.001 8,022,000 0.71 0.080 0.001
57 15.04 0.055 0.001 8,022,000 0.71 0.080 0.00157 15.04 0.055 0.001 8,022,000 0.71 0.080 0.001
58 15.04 0.055 0.001 8,022,000 0.71 0.080 0.001
59 15.04 0.055 0.001 8,022,000 0.71 0.080 0.001
60 15.04 0.055 0.001 8,022,000 0.71 0.080 0.001
61 15.04 0.055 0.001 8,022,000 0.71 0.080 0.001
62 15.04 0.055 0.001 8,022,000 0.71 0.080 0.001
63 15.04 0.055 0.001 8,022,000 0.71 0.080 0.001
64 15 04 0 055 0 001 8 022 000 0 71 0 080 0 00164 15.04 0.055 0.001 8,022,000 0.71 0.080 0.001
65 15.04 0.055 0.001 8,022,000 0.71 0.080 0.001
66 15.04 0.055 0.001 8,022,000 0.71 0.080 0.001
67 15.04 0.055 0.001 8,022,000 0.71 0.080 0.001
68 15.04 0.055 0.001 8,022,000 0.71 0.080 0.001
69 15.04 0.055 0.001 8,022,000 0.71 0.080 0.001
70 15.04 0.055 0.001 8,022,000 0.71 0.080 0.00170 15.04 0.055 0.001 8,022,000 0.71 0.080 0.001
Sum 0.131 0.196
70 year conversion factor 1.114 0.924
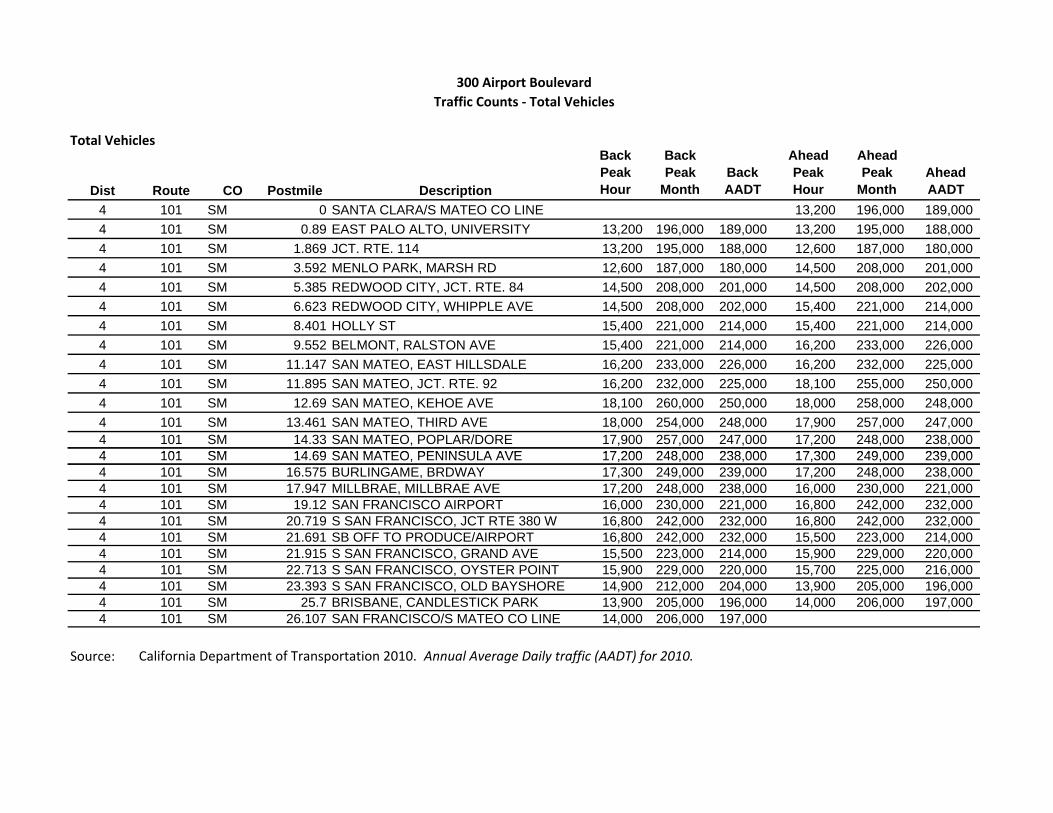
Total Vehicles
Dist Route CO Postmile Description
BackPeakHour
BackPeak
MonthBackAADT
AheadPeakHour
Ahead Peak
MonthAhead AADT
4 101 SM 0 SANTA CLARA/S MATEO CO LINE 13,200 196,000 189,000
4 101 SM 0.89 EAST PALO ALTO, UNIVERSITY 13,200 196,000 189,000 13,200 195,000 188,000
4 101 SM 1.869 JCT. RTE. 114 13,200 195,000 188,000 12,600 187,000 180,000
4 101 SM 3.592 MENLO PARK, MARSH RD 12,600 187,000 180,000 14,500 208,000 201,000
4 101 SM 5.385 REDWOOD CITY, JCT. RTE. 84 14,500 208,000 201,000 14,500 208,000 202,000
4 101 SM 6.623 REDWOOD CITY, WHIPPLE AVE 14,500 208,000 202,000 15,400 221,000 214,000
4 101 SM 8.401 HOLLY ST 15,400 221,000 214,000 15,400 221,000 214,000
4 101 SM 9.552 BELMONT, RALSTON AVE 15,400 221,000 214,000 16,200 233,000 226,000
4 101 SM 11.147 SAN MATEO, EAST HILLSDALE 16,200 233,000 226,000 16,200 232,000 225,000
4 101 SM 11.895 SAN MATEO, JCT. RTE. 92 16,200 232,000 225,000 18,100 255,000 250,000
4 101 SM 12.69 SAN MATEO, KEHOE AVE 18,100 260,000 250,000 18,000 258,000 248,000
4 101 SM 13.461 SAN MATEO, THIRD AVE 18,000 254,000 248,000 17,900 257,000 247,0004 101 SM 14.33 SAN MATEO, POPLAR/DORE 17,900 257,000 247,000 17,200 248,000 238,0004 101 SM 14 69 SAN MATEO PENINSULA AVE 17 200 248 000 238 000 17 300 249 000 239 000
300 Airport Boulevard
Traffic Counts ‐ Total Vehicles
4 101 SM 14.69 SAN MATEO, PENINSULA AVE 17,200 248,000 238,000 17,300 249,000 239,0004 101 SM 16.575 BURLINGAME, BRDWAY 17,300 249,000 239,000 17,200 248,000 238,0004 101 SM 17.947 MILLBRAE, MILLBRAE AVE 17,200 248,000 238,000 16,000 230,000 221,0004 101 SM 19.12 SAN FRANCISCO AIRPORT 16,000 230,000 221,000 16,800 242,000 232,0004 101 SM 20.719 S SAN FRANCISCO, JCT RTE 380 W 16,800 242,000 232,000 16,800 242,000 232,0004 101 SM 21.691 SB OFF TO PRODUCE/AIRPORT 16,800 242,000 232,000 15,500 223,000 214,0004 101 SM 21.915 S SAN FRANCISCO, GRAND AVE 15,500 223,000 214,000 15,900 229,000 220,0004 101 SM 22.713 S SAN FRANCISCO, OYSTER POINT 15,900 229,000 220,000 15,700 225,000 216,0004 101 SM 23.393 S SAN FRANCISCO, OLD BAYSHORE 14,900 212,000 204,000 13,900 205,000 196,0004 101 SM 25.7 BRISBANE, CANDLESTICK PARK 13,900 205,000 196,000 14,000 206,000 197,0004 101 SM 26.107 SAN FRANCISCO/S MATEO CO LINE 14,000 206,000 197,000
Source: California Department of Transportation 2010. Annual Average Daily traffic (AADT) for 2010.

Trucks
Route District County Postmile LegAADT Total
Total Trucks
Total Trucks
%2 Axle
Volume2 Axle
Percent3 Axle
Volume3 Axle
Percent4 Axle
Volume4 Axle
Percent5 Axle
Volume5 Axle
Percent
101 4 SM 1.869 B 191000 8079 4.23 4917 60.86 657 8.13 368 4.56 2137 26.45
101 4 SM 5.385 B 193000 8685 4.5 5029 57.9 888 10.23 276 3.18 2491 28.68
101 4 SM 5.385 A 189000 8505 4.5 5105 60.02 1276 15 263 3.09 1861 21.88
101 4 SM 6.623 A 195000 9536 4.89 5839 61.23 1131 11.86 451 4.73 2115 22.18
101 4 SM 11.895 B 218000 7041 3.23 4139 58.78 687 9.76 270 3.84 1945 27.62
101 4 SM 11.895 A 237000 8271 3.49 4750 57.43 908 10.98 168 2.03 2445 29.56
101 4 SM 13.461 A 232000 10254 4.42 6069 59.19 957 9.33 549 5.35 2678 26.12
101 4 SM 13.461 B 236000 8992 3.81 5536 61.57 787 8.75 441 4.9 2228 24.78
101 4 SM 17.947 B 226000 9944 4.4 6011 60.45 770 7.74 394 3.96 2769 27.85
101 4 SF 0.774 A 196000 9055 4.62 4771 52.69 1490 16.45 236 2.61 2558 28.25
Source: California Department of Transportation 2010. Annual Average Daily Truck Traffic for 2009.
300 Airport Boulevard
Traffic Counts ‐ Total Trucks

File Name: '300APpm' '300APtoc' '300APrun'
Averaging Time (min) 60
Surface Roughmeess, cm/s 170
Setting 0
Deposition Velocity 0
Number of Receptors 17
Conversion from meters to ft 0.3048
Output unit flag: 1
Start Date of project 1 1 15
End Date of project 12 31 15
met surace station number 6801
met surface year 05
met upper station number 6801
met upper year 05
link contribution 1
table of concentrations 1
site setting U
Receptor Table:
Receptor Label
X Y Z
1 Rec01 500 750 6
300 Airport Boulevard
CAL3QHCR Input
Receptor Coordinants
1 Rec01 ‐500 750 6
2 Rec02 ‐250 750 6
3 Rec03 ‐50 750 6
4 Rec04 100 750 6
5 Rec05 300 750 6
6 Rec06 ‐50 875 6
7 Rec07 100 810 6
8 Rec08 ‐500 993 6
9 Rec09 ‐250 993 6
10 Rec10 ‐50 993 6
11 Rec11 100 993 6
12 Rec12 300 993 6
13 Rec13 ‐500 1236 6
14 Rec14 ‐250 1236 6
15 Rec15 ‐50 1236 6
16 Rec16 100 1236 6
17 Rec17 300 1236 6
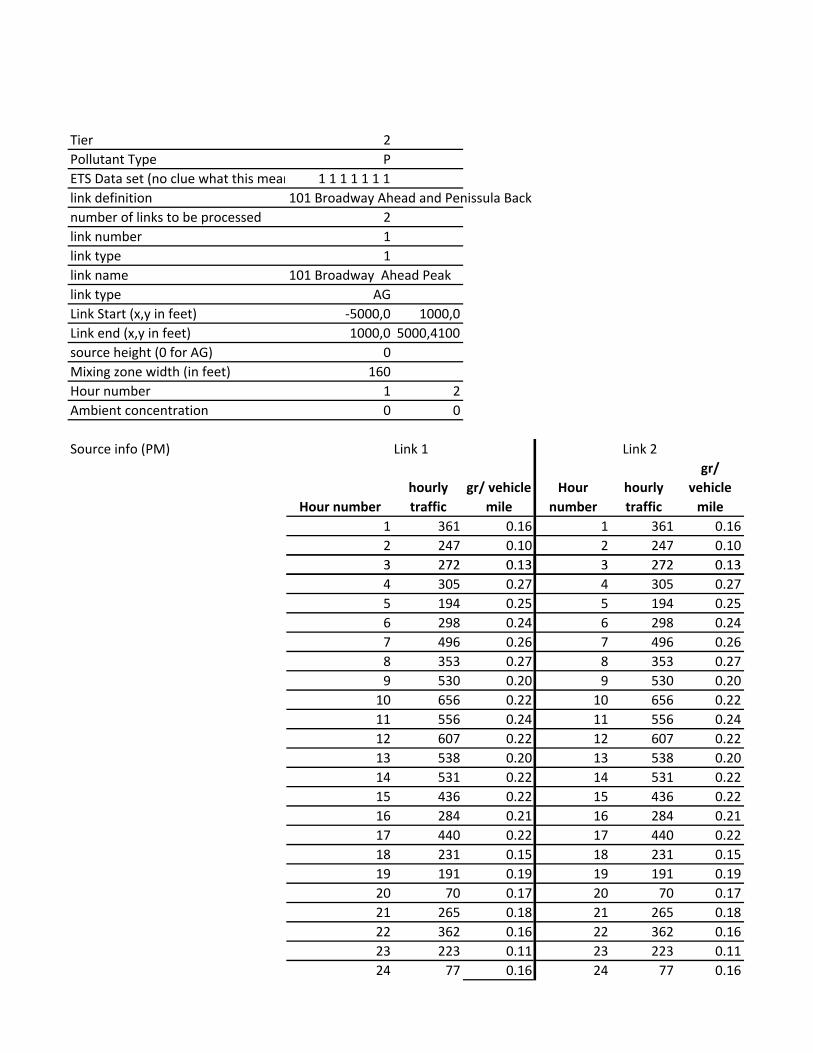
Tier 2
Pollutant Type P
ETS Data set (no clue what this mean 1 1 1 1 1 1 1
link definition 101 Broadway Ahead and Penissula Back
number of links to be processed 2
link number 1
link type 1
link name 101 Broadway Ahead Peak
link type AG
Link Start (x,y in feet) ‐5000,0 1000,0
Link end (x,y in feet) 1000,0 5000,4100
source height (0 for AG) 0
Mixing zone width (in feet) 160
Hour number 1 2
Ambient concentration 0 0
Source info (PM)
Hour number
hourly
traffic
gr/ vehicle
mile
Hour
number
hourly
traffic
gr/
vehicle
mile
1 361 0.16 1 361 0.16
2 247 0.10 2 247 0.10
3 272 0 13 3 272 0 13
Link 1 Link 2
3 272 0.13 3 272 0.13
4 305 0.27 4 305 0.27
5 194 0.25 5 194 0.25
6 298 0.24 6 298 0.24
7 496 0.26 7 496 0.26
8 353 0.27 8 353 0.27
9 530 0.20 9 530 0.20
10 656 0.22 10 656 0.22
11 556 0.24 11 556 0.24
12 607 0.22 12 607 0.22
13 538 0.20 13 538 0.20
14 531 0.22 14 531 0.22
15 436 0.22 15 436 0.22
16 284 0.21 16 284 0.21
17 440 0.22 17 440 0.22
18 231 0.15 18 231 0.15
19 191 0.19 19 191 0.19
20 70 0.17 20 70 0.17
21 265 0.18 21 265 0.18
22 362 0.16 22 362 0.16
23 223 0.11 23 223 0.11
24 77 0.16 24 77 0.16

Source info (TOC exhaust)
Hour number
hourly
traffic
gr/ vehicle
mile
Hour
number
hourly
traffic
gr/
vehicle
mile
1 2,461 0.22 1 2461 0.22
2 918 0.26 2 918 0.26
3 918 0.28 3 918 0.28
4 588 0.41 4 588 0.41
5 1,072 0.26 5 1072 0.26
6 1,945 0.25 6 1945 0.25
7 8,010 0.20 7 8010 0.20
8 16,311 0.21 8 16311 0.21
9 15,027 0.22 9 15027 0.22
10 9,322 0.26 10 9322 0.26
11 9,877 0.24 11 9877 0.24
12 12,448 0.22 12 12448 0.22
13 12,975 0.21 13 12975 0.21
14 12,744 0.20 14 12744 0.20
15 14,765 0.19 15 14765 0.19
16 15,030 0.19 16 15030 0.19
17 15,604 0.19 17 15604 0.19
18 17 200 0 19 18 17200 0 19
Link 1 Link 2
18 17,200 0.19 18 17200 0.19
19 11,970 0.19 19 11970 0.19
20 8,972 0.20 20 8972 0.20
21 6,857 0.21 21 6857 0.21
22 6,960 0.19 22 6960 0.19
23 5,190 0.19 23 5190 0.19
24 3,930 0.21 24 3930 0.21
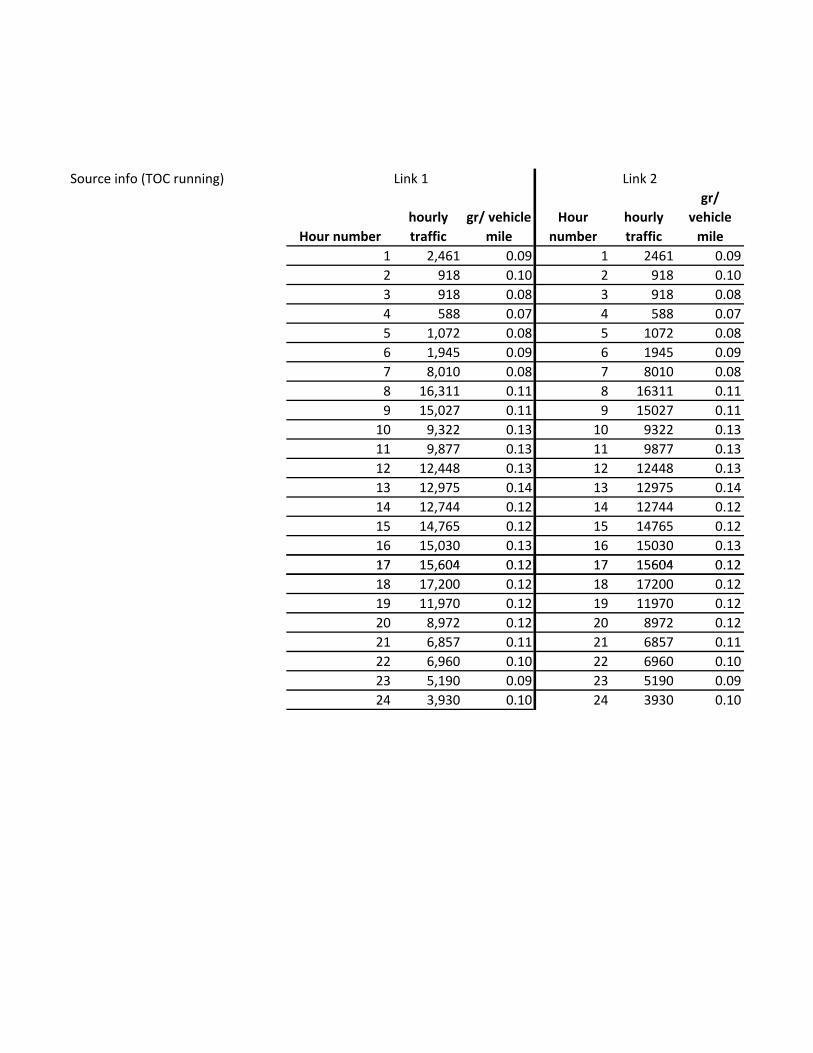
Source info (TOC running)
Hour number
hourly
traffic
gr/ vehicle
mile
Hour
number
hourly
traffic
gr/
vehicle
mile
1 2,461 0.09 1 2461 0.09
2 918 0.10 2 918 0.10
3 918 0.08 3 918 0.08
4 588 0.07 4 588 0.07
5 1,072 0.08 5 1072 0.08
6 1,945 0.09 6 1945 0.09
7 8,010 0.08 7 8010 0.08
8 16,311 0.11 8 16311 0.11
9 15,027 0.11 9 15027 0.11
10 9,322 0.13 10 9322 0.13
11 9,877 0.13 11 9877 0.13
12 12,448 0.13 12 12448 0.13
13 12,975 0.14 13 12975 0.14
14 12,744 0.12 14 12744 0.12
15 14,765 0.12 15 14765 0.12
16 15,030 0.13 16 15030 0.13
17 15 604 0 12 17 15604 0 12
Link 1 Link 2
17 15,604 0.12 17 15604 0.12
18 17,200 0.12 18 17200 0.12
19 11,970 0.12 19 11970 0.12
20 8,972 0.12 20 8972 0.12
21 6,857 0.11 21 6857 0.11
22 6,960 0.10 22 6960 0.10
23 5,190 0.09 23 5190 0.09
24 3,930 0.10 24 3930 0.10
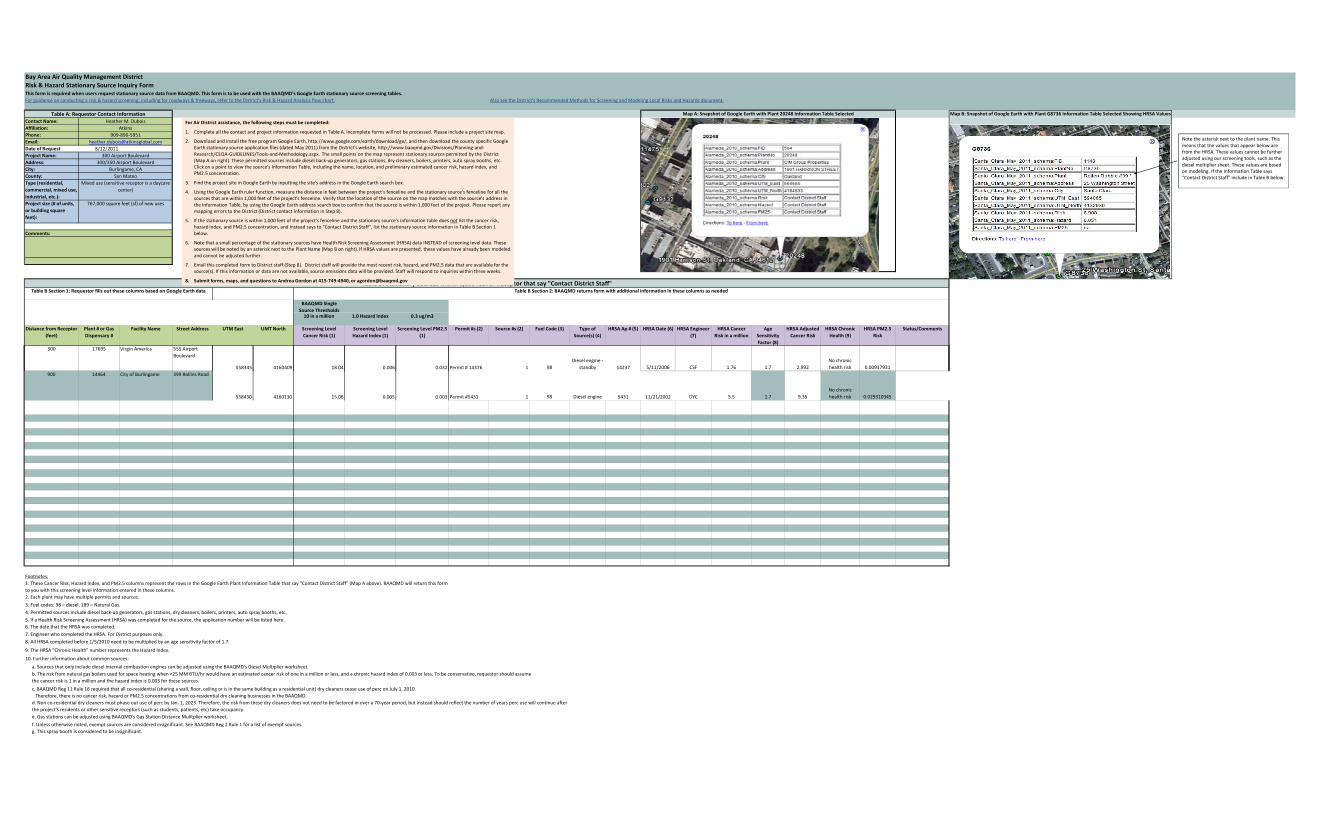
For guidance on conducting a risk & hazard screening, including for roadways & freeways, refer to the District's Risk & Hazard Analysis flow chart. Also see the District's Recommended Methods for Screening and Modeling Local Risks and Hazards document.
Contact Name:
Affiliation:
Phone:
Email:
Date of Request 8/12/2011
Project Name:
Address:
City:
County:
Type (residential,
commercial, mixed use,
industrial, etc.):
Project size (# of units,
or building square
feet):
BAAQMD Single
Source Thresholds10 in a million 1.0 Hazard Index 0.3 ug/m3
Distance from Receptor
(feet)
Plant # or Gas
Dispensary #
Facility Name Street Address UTM East UMT North Screening Level
Cancer Risk (1)
Screening Level
Hazard Index (1)
Screening Level PM2.5
(1)
Permit #s (2) Source #s (2) Fuel Code (3) Type of
Source(s) (4)
HRSA Ap # (5) HRSA Date (6) HRSA Engineer
(7)
HRSA Cancer
Risk in a million
Age
Sensitivity
Factor (8)
HRSA Adjusted
Cancer Risk
HRSA Chronic
Health (9)
HRSA PM2.5
Risk
Status/Comments
300 17695 Virgin America 555 Airport
Boulevard
558345 4160409 18.04 0.006 0.032 Permit # 14376 1 98
Diesel engine ‐
standby 14237 5/11/2006 CSF 1.76 1.7 2.992
No chronic
health risk 0.00937931
Map A: Snapshot of Google Earth with Plant 20248 Information Table Selected
Table B: Stationary Sources within 1,000 feet of Receptor that say "Contact District Staff"
767,000 square feet (sf) of new uses
Comments:
300 Airport Boulevard
300/350 Airport Boulevard
Burlingame, CA
Table B Section 1: Requestor fills out these columns based on Google Earth data Table B Section 2: BAAQMD returns form with additional information in these columns as needed
Bay Area Air Quality Management District
Heather M. Dubois
Atkins
909‐890‐5951
Risk & Hazard Stationary Source Inquiry Form
Table A: Requestor Contact Information
San Mateo
Mixed use (sensitive receptor is a daycare
center)
This form is required when users request stationary source data from BAAQMD. This form is to be used with the BAAQMD's Google Earth stationary source screening tables.
Map B: Snapshot of Google Earth with Plant G8736 Information Table Selected Showing HRSA Values
For Air District assistance, the following steps must be completed:
1. Complete all the contact and project information requested in Table A. Incomplete forms will not be processed. Please include a project site map.
2. Download and install the free program Google Earth, http://www.google.com/earth/download/ge/, and then download the county specific Google Earth stationary source application files (dated May 2011) from the District's website, http://www.baaqmd.gov/Divisions/Planning‐and‐Research/CEQA‐GUIDELINES/Tools‐and‐Methodology.aspx. The small points on the map represent stationary sources permitted by the District (Map A on right). These permitted sources include diesel back‐up generators, gas stations, dry cleaners, boilers, printers, auto spray booths, etc. Click on a point to view the source's Information Table, including the name, location, and preliminary estimated cancer risk, hazard index, and PM2.5 concentration.
3. Find the project site in Google Earth by inputting the site's address in the Google Earth search box.
4. Using the Google Earth ruler function, measure the distance in feet between the project's fenceline and the stationary source's fenceline for all the sources that are within 1,000 feet of the project's fenceline. Verify that the location of the source on the map matches with the source's address in the Information Table, by using the Google Earth address search box to confirm that the source is within 1,000 feet of the project. Please report any mapping errors to the District (District contact information in Step 8).
5. If the stationary source is within 1,000 feet of the project's fenceline and the stationary source's information table does not list the cancer risk, hazard index, and PM2.5 concentration, and instead says to "Contact District Staff", list the stationary source information in Table B Section 1 below.
6. Note that a small percentage of the stationary sources have Health Risk Screening Assessment (HRSA) data INSTEAD of screening level data. These sources will be noted by an asterisk next to the Plant Name (Map B on right). If HRSA values are presented, these values have already been modeled and cannot be adjusted further.
7. Email this completed form to District staff (Step 8). District staff will provide the most recent risk, hazard, and PM2.5 data that are available for the source(s). If this information or data are not available, source emissions data will be provided. Staff will respond to inquiries within three weeks.
8. Submit forms, maps, and questions to Andrea Gordon at 415‐749‐4940, or [email protected]
Note the asterisk next to the plant name. This means that the values that appear below are from the HRSA. These values cannot be further adjusted using our screening tools, such as the diesel multiplier sheet. These values are based on modeling. If the Information Table says "Contact District Staff" include in Table B below.
900 14464 City of Burlingame 399 Rollins Road
558430 4160130 15.06 0.005 0.003 Permit #5431 1 98 Diesel engine 5431 11/21/2002 DYC 5.5 1.7 9.35
No chronic
health risk 0.029310345
Footnotes:
2. Each plant may have multiple permits and sources.
1. These Cancer Risk, Hazard Index, and PM2.5 columns represent the rows in the Google Earth Plant Information Table that say "Contact District Staff" (Map A above). BAAQMD will return this form
to you with this screening level information entered in these columns.
3. Fuel codes: 98 = diesel, 189 = Natural Gas.
5. If a Health Risk Screening Assessment (HRSA) was completed for the source, the application number will be listed here.
4. Permitted sources include diesel back‐up generators, gas stations, dry cleaners, boilers, printers, auto spray booths, etc.
6. The date that the HRSA was completed.
7. Engineer who completed the HRSA. For District purposes only.
9. The HRSA "Chronic Health" number represents the Hazard Index.
8. All HRSA completed before 1/5/2010 need to be multiplied by an age sensitivity factor of 1.7.
10. Further information about common sources:
a. Sources that only include diesel internal combustion engines can be adjusted using the BAAQMD's Diesel Multiplier worksheet.
c. BAAQMD Reg 11 Rule 16 required that all co‐residential (sharing a wall, floor, ceiling or is in the same building as a residential unit) dry cleaners cease use of perc on July 1, 2010.
f. Unless otherwise noted, exempt sources are considered insignificant. See BAAQMD Reg 2 Rule 1 for a list of exempt sources.
e. Gas stations can be adjusted using BAAQMD's Gas Station Distance Mulitplier worksheet.
g. This spray booth is considered to be insignificant.
d. Non co‐residential dry cleaners must phase out use of perc by Jan. 1, 2023. Therefore, the risk from these dry cleaners does not need to be factored in over a 70‐year period, but instead should reflect the number of years perc use will continue after
the project's residents or other sensitive receptors (such as students, patients, etc) take occupancy.
b. The risk from natural gas boilers used for space heating when <25 MM BTU/hr would have an estimated cancer risk of one in a million or less, and a chronic hazard index of 0.003 or less. To be conservative, requestor should assume
the cancer risk is 1 in a million and the hazard index is 0.003 for these sources.
Therefore, there is no cancer risk, hazard or PM2.5 concentrations from co‐residential dry cleaning businesses in the BAAQMD.
y g j g Q p

Appendix B
Risk and Concentrations
Screening Results

Project Information
Type Commercial
units N/A
acerage 18.13
Nearest Sensitive Receptor (meters) 255
225
No
PM2.5
5 1.7 95 7 75 95
10 3.3 100 7 75 100
25 8.3 125 16 100 125
50 16.7 150 18 125 150
100 33.3 175 20 150 175
250 83.3 300 25 250 300
500 166.7 400 35 300 400
1 000 333 3 500 40 600 600
Offset
Required for
Combined
Risk
Potentially Significant?
Minimum offsite distance (meters) required from porject fence line to ensure that a
sensitive receptor would have a less than significant impact from table:
Annual
Average
Conc. (g/m3)
DPM
Project
Site
(acres)Units/sqftType
Cancer
Risk
Chronic
Hazard
Index
Residential
Construction Impact to Offsite Receptors
300 Airport Boulevard
1,000 333.3 500 40 600 600
2,000 666.7 700 45 900 900
5,000 1666.7 1000 40 800 1000
5,000 0.2 100 8 75 100
10,000 0.5 100 8 75 100
30,000 1.4 100 8 80 100
60,000 2.8 100 9 85 100
100,000 4.6 150 19 125 150
300,000 13.8 200 25 150 200
500,000 23.0 225 19 175 225
1,000,000 45.9 300 25 200 300
3,000,000 137.7 500 35 400 500
7,000,000 321.4 600 35 400 600
5,000 0.2 100 10 85 100
10,000 0.5 100 10 85 100
30,000 1.4 100 10 90 100
60,000 2.8 100 11 95 100
100,000 4.6 175 20 125 175
300,000 13.8 200 25 175 200
500,000 23.0 250 20 175 250
1,000,000 45.9 300 25 200 300
3,000,000 137.7 500 35 400 500
6,000,000 275.5 600 35 400 600Source: BAAQMD Screening Tabes for Air Toxics Evaluation During Construction, May 2011.
Industrial
Commercial
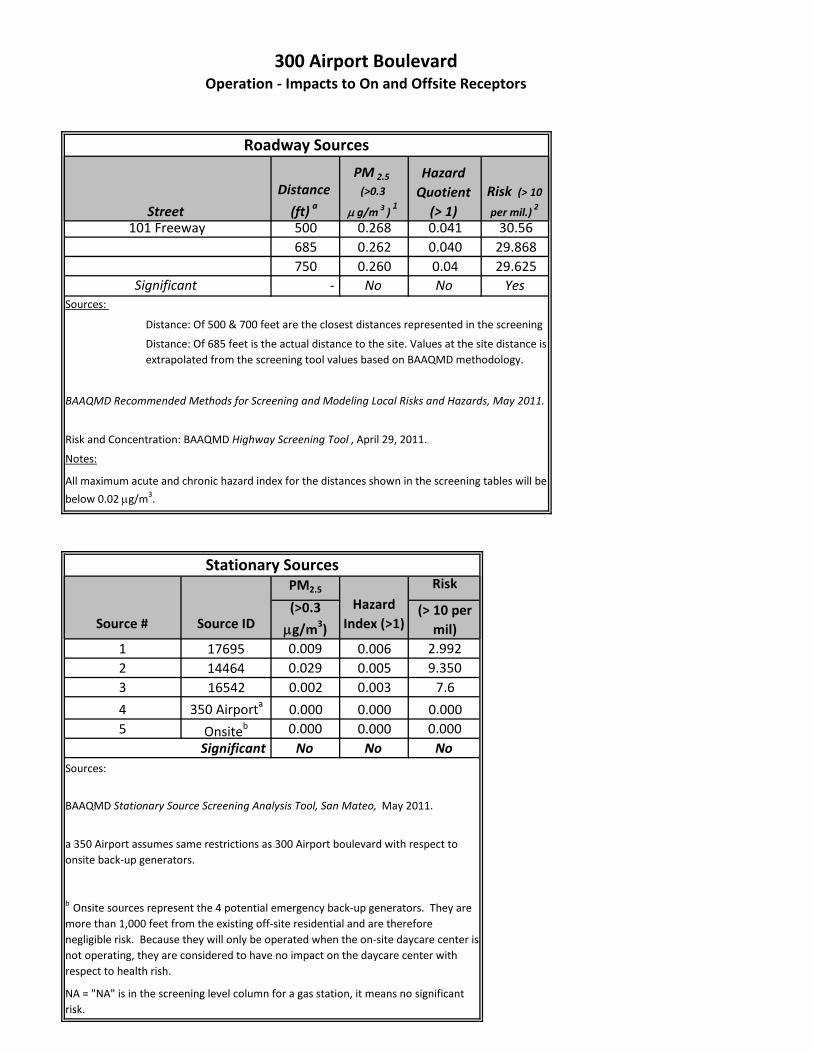
500 0.268 0.041 30.56
685 0.262 0.040 29.868
750 0.260 0.04 29.625
‐ No No Yes
Risk and Concentration: BAAQMD Highway Screening Tool , April 29, 2011.
Hazard
Quotient
(> 1)
Distance: Of 500 & 700 feet are the closest distances represented in the screening
Notes:
Distance: Of 685 feet is the actual distance to the site. Values at the site distance is
extrapolated from the screening tool values based on BAAQMD methodology.
All maximum acute and chronic hazard index for the distances shown in the screening tables will be
below 0.02 g/m3.
300 Airport BoulevardOperation ‐ Impacts to On and Offsite Receptors
Sources:
Roadway Sources
BAAQMD Recommended Methods for Screening and Modeling Local Risks and Hazards, May 2011.
Risk (> 10
per mil.)2Street
101 Freeway
Significant
PM 2.5
(>0.3
g/m 3 )1
Distance
(ft) a
PM2.5 Risk
1 17695 0.009 0.006 2.992
2 14464 0.029 0.005 9.350
3 16542 0.002 0.003 7.6
4 350 Airporta
0.000 0.000 0.000
5 Onsiteb 0.000 0.000 0.000
No No No
a 350 Airport assumes same restrictions as 300 Airport boulevard with respect to
onsite back‐up generators.
Stationary Sources
Hazard
Index (>1)
NA = "NA" is in the screening level column for a gas station, it means no significant
risk.
Significant
BAAQMD Stationary Source Screening Analysis Tool, San Mateo, May 2011.
b Onsite sources represent the 4 potential emergency back‐up generators. They are
more than 1,000 feet from the existing off‐site residential and are therefore
negligible risk. Because they will only be operated when the on‐site daycare center is
not operating, they are considered to have no impact on the daycare center with
respect to health rish.
Source # Source ID(>0.3
g/m3)
Sources:
(> 10 per
mil)

300 Airport BoulevardOperation ‐ Impacts to On and Offsite Receptors
PM2.5 Risk
g/m3) mil)
1 0.009 0.006 2.992
2 0.029 0.005 9.350
3 0.002 0.003 7.6
4 0.000 0.000 0.000
5 0.000 0.000 0.000
0.041 0.015 19.942
0.262 0.040 29.868
0.303 0.055 49.810No No No
350 airporta
Subtotal
a 350 Airport assumes same restrictions as 300 Airport boulevard with respect to onsite back‐up generators.
Index
(>10)
Onsiteb
Significant
101 Freeway
Total Cumulative
Source #
Source: Atkins 2011
Cumulative
Source ID
17695
14464
16542
0.041 0.015 19.942
22.947
b Onsite sources represent the 4 potential emergency back‐up generators. They are more than 1,000 feet from
the existing off‐site residential and are therefore negligible risk. Because they will only be operated when the
on‐site daycare center is not operating, they are considered to have no impact on the daycare center with
respect to health risk.

Project Information
Type Commercialunits N/A
acerage 9.3
Nearest Sensitive Receptor (meters) 203
200
No
PM2.5
5 1.7 95 7 75 95
10 3.3 100 7 75 100
25 8.3 125 16 100 125
50 16.7 150 18 125 150
100 33.3 175 20 150 175
250 83.3 300 25 250 300
500 166.7 400 35 300 400
1,000 333.3 500 40 600 600
2,000 666.7 700 45 900 900
5,000 1666.7 1000 40 800 1000
5,000 0.2 100 8 75 100
10,000 0.5 100 8 75 100
30,000 1.4 100 8 80 100
60,000 2.8 100 9 85 100
100,000 4.6 150 19 125 150
300,000 13.8 200 25 150 200
500,000 23.0 225 19 175 225
1,000,000 45.9 300 25 200 300
3,000,000 137.7 500 35 400 500
7,000,000 321.4 600 35 400 600
5,000 0.2 100 10 85 100
10,000 0.5 100 10 85 100
30,000 1.4 100 10 90 100
60,000 2.8 100 11 95 100
100,000 4.6 175 20 125 175
300,000 13.8 200 25 175 200
500,000 23.0 250 20 175 250
1,000,000 45.9 300 25 200 300
3,000,000 137.7 500 35 400 500
6,000,000 275.5 600 35 400 600Source: BAAQMD Screening Tabes for Air Toxics Evaluation During Construction, May 2011.
Commercial
Industrial
Residen
tial
350 Airport BoulevardConstruction Impact to Offsite Receptors
Minimum offsite distance (meters) required from porject fence line to ensure that a
sensitive receptor would have a less than significant impact from table:
Potentially Significant?
Offset
Required for
Combined
Risk
Cancer
Risk
Chronic
Hazard
Index
Annual
Average
Conc. (g/m3)Type Units/sqft
Project
Site
(acres)
DPM

There are no onsite receptors that will be impacted by existing offsite sources.
There is the potential for onsite generators to be present. However these back‐up generators will be assumed to
operate with the same restrictions as 300 Airport Boulevard and are included in the screening analysis for 300
Airport boulevard.
350 Airport BoulevardOperation ‐ Impacts to On and Offsite Receptors

Refined Modeling Results
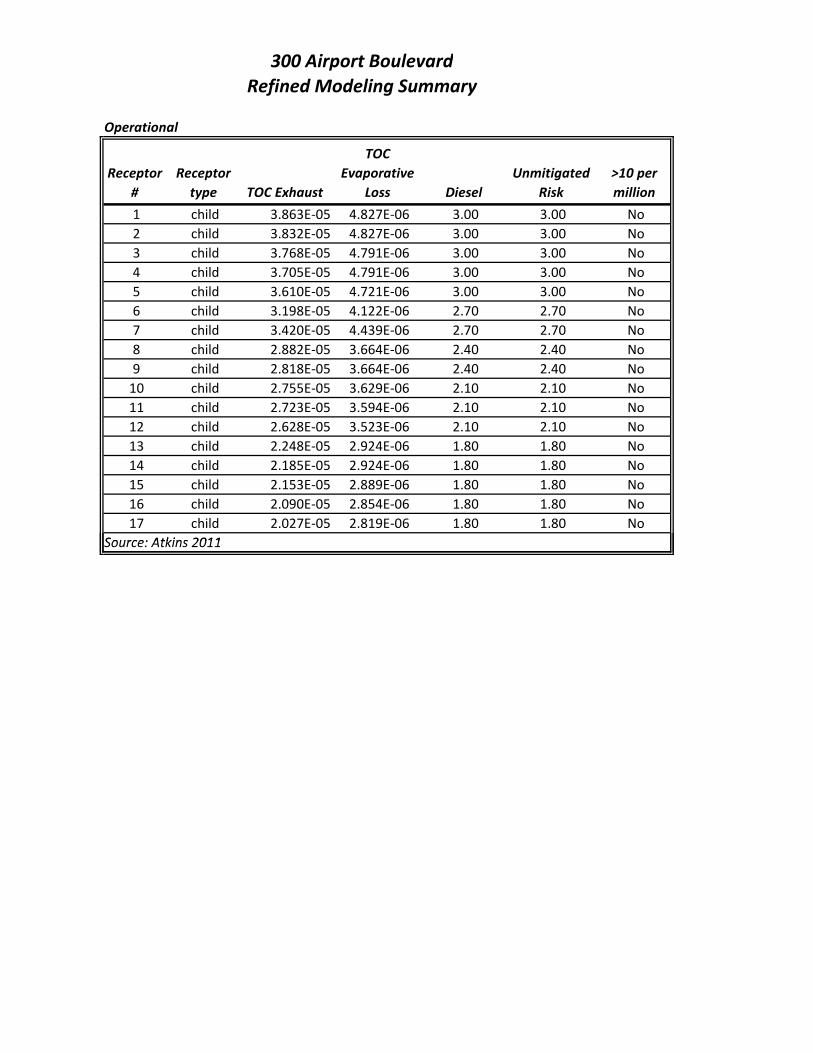
Operational
Receptor
#
Receptor
type TOC Exhaust
TOC
Evaporative
Loss Diesel
Unmitigated
Risk
>10 per
million
1 child 3.863E‐05 4.827E‐06 3.00 3.00 No
2 child 3.832E‐05 4.827E‐06 3.00 3.00 No
3 child 3.768E‐05 4.791E‐06 3.00 3.00 No
4 child 3.705E‐05 4.791E‐06 3.00 3.00 No
5 child 3.610E‐05 4.721E‐06 3.00 3.00 No
6 child 3.198E‐05 4.122E‐06 2.70 2.70 No
7 child 3.420E‐05 4.439E‐06 2.70 2.70 No
8 child 2.882E‐05 3.664E‐06 2.40 2.40 No
9 child 2.818E‐05 3.664E‐06 2.40 2.40 No
10 child 2.755E‐05 3.629E‐06 2.10 2.10 No
11 child 2.723E‐05 3.594E‐06 2.10 2.10 No
12 child 2.628E‐05 3.523E‐06 2.10 2.10 No
13 child 2.248E‐05 2.924E‐06 1.80 1.80 No
14 child 2.185E‐05 2.924E‐06 1.80 1.80 No
15 child 2.153E‐05 2.889E‐06 1.80 1.80 No
16 child 2.090E‐05 2.854E‐06 1.80 1.80 No
17 child 2.027E‐05 2.819E‐06 1.80 1.80 No
Source: Atkins 2011
300 Airport Boulevard
Refined Modeling Summary
Source: Atkins 2011
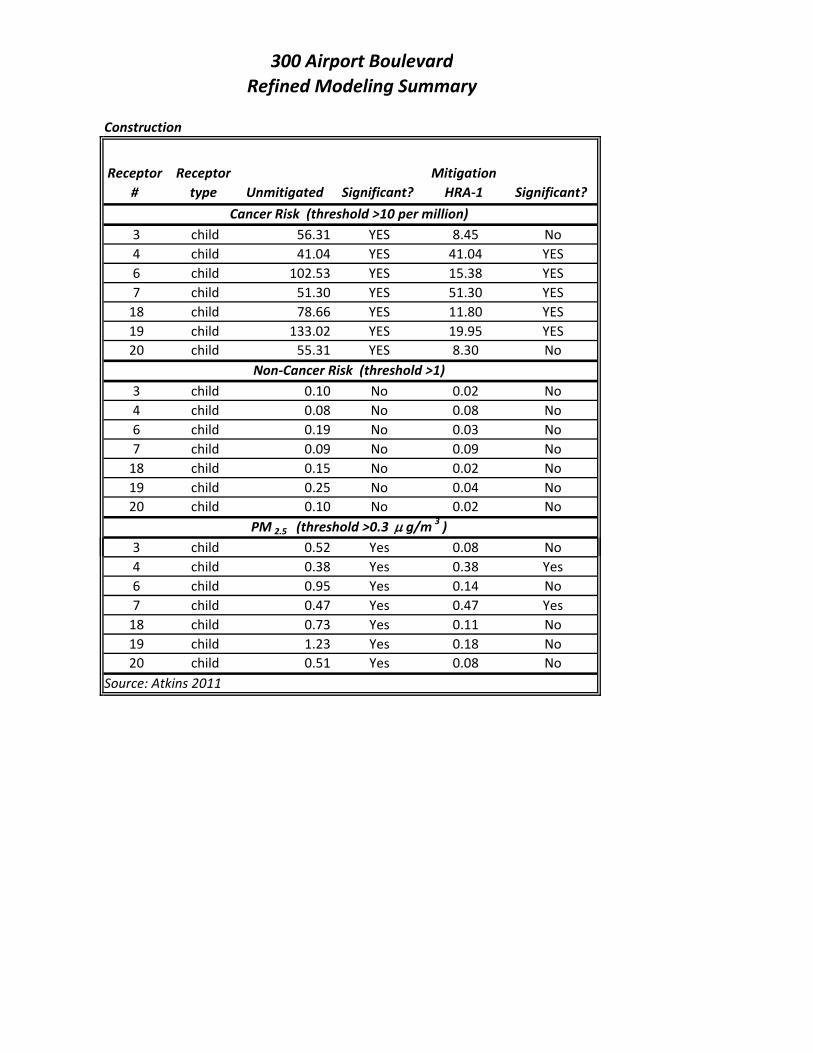
300 Airport Boulevard
Refined Modeling Summary
Construction
Receptor
#
Receptor
type Unmitigated Significant?
Mitigation
HRA‐1 Significant?
3 child 56.31 YES 8.45 No
4 child 41.04 YES 41.04 YES
6 child 102.53 YES 15.38 YES
7 child 51.30 YES 51.30 YES
18 child 78.66 YES 11.80 YES
19 child 133.02 YES 19.95 YES
20 child 55.31 YES 8.30 No
3 child 0.10 No 0.02 No
4 child 0.08 No 0.08 No
6 child 0.19 No 0.03 No
7 child 0.09 No 0.09 No
18 child 0.15 No 0.02 No
19 child 0.25 No 0.04 No
20 child 0.10 No 0.02 No
Cancer Risk (threshold >10 per million)
Non‐Cancer Risk (threshold >1)
PM 2.5 (threshold >0.3 g/m 3 )
3 child 0.52 Yes 0.08 No
4 child 0.38 Yes 0.38 Yes
6 child 0.95 Yes 0.14 No
7 child 0.47 Yes 0.47 Yes
18 child 0.73 Yes 0.11 No
19 child 1.23 Yes 0.18 No
20 child 0.51 Yes 0.08 No
Source: Atkins 2011

Risk Calculations
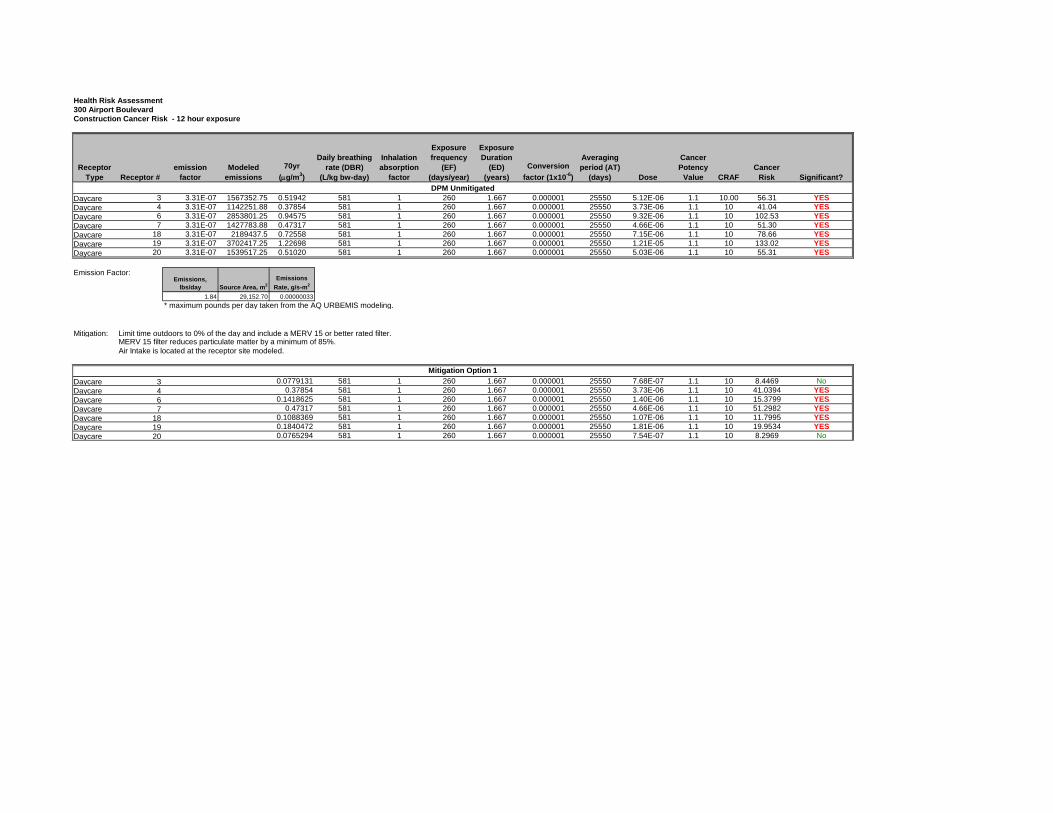
Health Risk Assessment300 Airport BoulevardConstruction Cancer Risk - 12 hour exposureSource DPM 10
Receptor Type Receptor #
emission factor
Modeled emissions
70yr
(g/m3)
Daily breathing rate (DBR)
(L/kg bw-day)
Inhalation absorption
factor
Exposure frequency
(EF) (days/year)
Exposure Duration
(ED) (years)
Conversion
factor (1x10⁻⁶)
Averaging period (AT)
(days) Dose
Cancer Potency
Value CRAFCancer
Risk Significant?
Daycare 3 3.31E-07 1567352.75 0.51942 581 1 260 1.667 0.000001 25550 5.12E-06 1.1 10.00 56.31 YESDaycare 4 3.31E-07 1142251.88 0.37854 581 1 260 1.667 0.000001 25550 3.73E-06 1.1 10 41.04 YESDaycare 6 3.31E-07 2853801.25 0.94575 581 1 260 1.667 0.000001 25550 9.32E-06 1.1 10 102.53 YESDaycare 7 3.31E-07 1427783.88 0.47317 581 1 260 1.667 0.000001 25550 4.66E-06 1.1 10 51.30 YESDaycare 18 3.31E-07 2189437.5 0.72558 581 1 260 1.667 0.000001 25550 7.15E-06 1.1 10 78.66 YESDaycare 19 3.31E-07 3702417.25 1.22698 581 1 260 1.667 0.000001 25550 1.21E-05 1.1 10 133.02 YESDaycare 20 3.31E-07 1539517.25 0.51020 581 1 260 1.667 0.000001 25550 5.03E-06 1.1 10 55.31 YES
Emission Factor:Emissions,
lbs/day Source Area, m2
Emissions
Rate, g/s-m2
1.84 29,152.70 0.00000033
* maximum pounds per day taken from the AQ URBEMIS modeling.
Mitigation: Limit time outdoors to 0% of the day and include a MERV 15 or better rated filter. 1MERV 15 filter reduces particulate matter by a minimum of 85%. 0.85 0.85Air Intake is located at the receptor site modeled.
Daycare 3 0.0779131 581 1 260 1.667 0.000001 25550 7.68E-07 1.1 10 8.4469 NoDaycare 4 0.37854 581 1 260 1.667 0.000001 25550 3.73E-06 1.1 10 41.0394 YESDaycare 6 0.1418625 581 1 260 1.667 0.000001 25550 1.40E-06 1.1 10 15.3799 YESDaycare 7 0.47317 581 1 260 1.667 0.000001 25550 4.66E-06 1.1 10 51.2982 YESDaycare 18 0.1088369 581 1 260 1.667 0.000001 25550 1.07E-06 1.1 10 11.7995 YESDaycare 19 0.1840472 581 1 260 1.667 0.000001 25550 1.81E-06 1.1 10 19.9534 YESDaycare 20 0.0765294 581 1 260 1.667 0.000001 25550 7.54E-07 1.1 10 8.2969 No
Receptor
DPM Unmitigated
Mitigation Option 1

Health Risk Assessment300 Airport BoulevardConstruction Non-Cancer Risk
1
Receptor #Annual DPM
(mg/m3)Reference
Level
Non-Cancer
Risk Significant?
3 0.51942 5 0.103884 No4 0.37854 5 0.075708 No6 0.94575 5 0.189150 No7 0.47317 5 0.094634 No
18 0.72558 5 0.145116 No19 1.22698 5 0.245396 No20 0.51020 5 0.102039 No
3 0.07791 5 0.015583 No4 0.37854 5 0.075708 No6 0.14186 5 0.028372 No7 0.47317 5 0.094634 No
18 0.10884 5 0.021767 No19 0.18405 5 0.036809 No20 0.07653 5 0.015306 No
Unmitigated
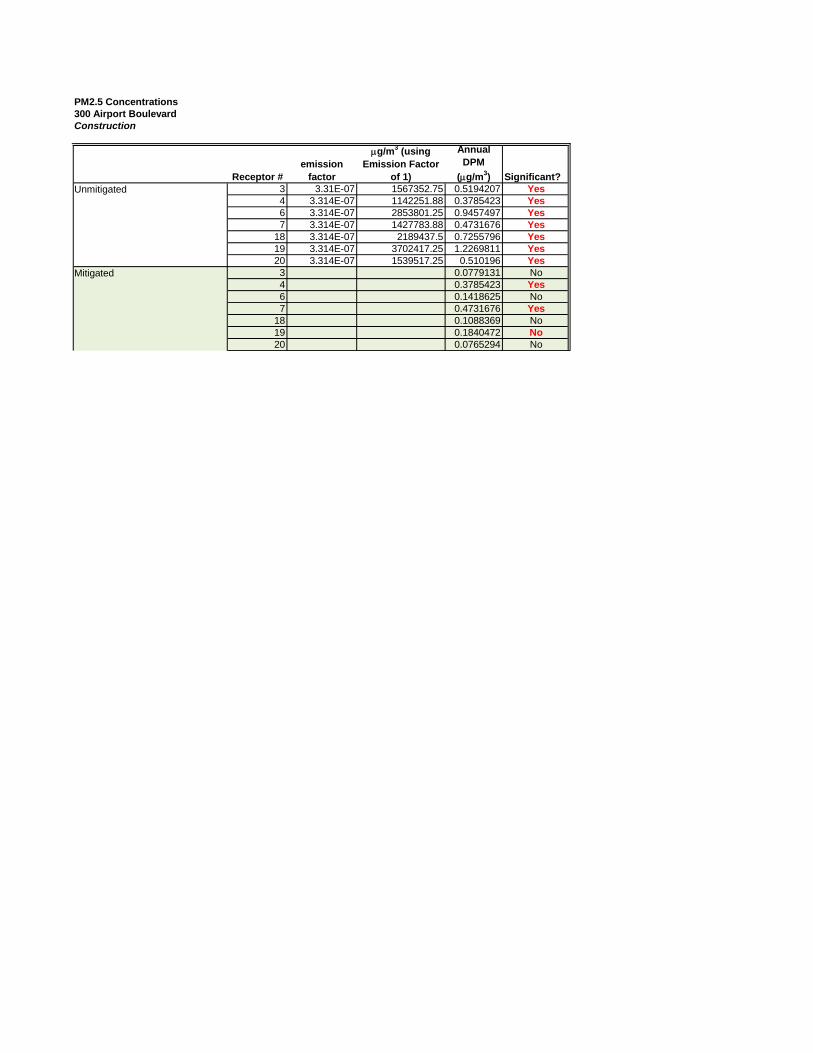
PM2.5 Concentrations300 Airport BoulevardConstruction
Receptor #emission
factor
g/m3 (using Emission Factor
of 1)
Annual DPM
(g/m3) Significant?3 3.31E-07 1567352.75 0.5194207 Yes4 3.314E-07 1142251.88 0.3785423 Yes6 3.314E-07 2853801.25 0.9457497 Yes7 3.314E-07 1427783.88 0.4731676 Yes
18 3.314E-07 2189437.5 0.7255796 Yes19 3.314E-07 3702417.25 1.2269811 Yes20 3.314E-07 1539517.25 0.510196 Yes3 0.0779131 No4 0.3785423 Yes6 0.1418625 No7 0.4731676 Yes
18 0.1088369 No19 0.1840472 No20 0.0765294 No
Unmitigated
Mitigated
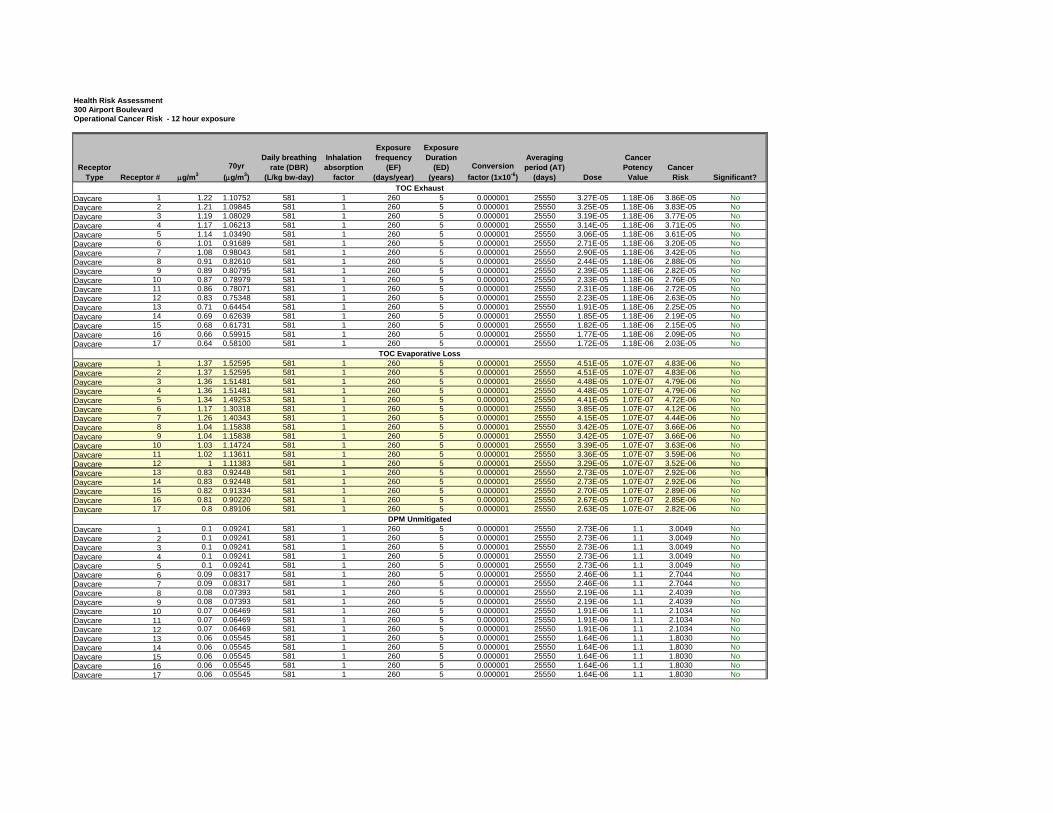
Health Risk Assessment300 Airport BoulevardOperational Cancer Risk - 12 hour exposureSource DPM 10
Receptor Type Receptor # g/m3
70yr
(g/m3)
Daily breathing rate (DBR)
(L/kg bw-day)
Inhalation absorption
factor
Exposure frequency
(EF) (days/year)
Exposure Duration
(ED) (years)
Conversion
factor (1x10⁻⁶)
Averaging period (AT)
(days) Dose
Cancer Potency
ValueCancer
Risk Significant?
Daycare 1 1.22 1.10752 581 1 260 5 0.000001 25550 3.27E-05 1.18E-06 3.86E-05 NoDaycare 2 1.21 1.09845 581 1 260 5 0.000001 25550 3.25E-05 1.18E-06 3.83E-05 NoDaycare 3 1.19 1.08029 581 1 260 5 0.000001 25550 3.19E-05 1.18E-06 3.77E-05 NoDaycare 4 1.17 1.06213 581 1 260 5 0.000001 25550 3.14E-05 1.18E-06 3.71E-05 NoDaycare 5 1.14 1.03490 581 1 260 5 0.000001 25550 3.06E-05 1.18E-06 3.61E-05 NoDaycare 6 1.01 0.91689 581 1 260 5 0.000001 25550 2.71E-05 1.18E-06 3.20E-05 NoDaycare 7 1.08 0.98043 581 1 260 5 0.000001 25550 2.90E-05 1.18E-06 3.42E-05 NoDaycare 8 0.91 0.82610 581 1 260 5 0.000001 25550 2.44E-05 1.18E-06 2.88E-05 NoDaycare 9 0.89 0.80795 581 1 260 5 0.000001 25550 2.39E-05 1.18E-06 2.82E-05 NoDaycare 10 0.87 0.78979 581 1 260 5 0.000001 25550 2.33E-05 1.18E-06 2.76E-05 NoDaycare 11 0.86 0.78071 581 1 260 5 0.000001 25550 2.31E-05 1.18E-06 2.72E-05 NoDaycare 12 0.83 0.75348 581 1 260 5 0.000001 25550 2.23E-05 1.18E-06 2.63E-05 NoDaycare 13 0.71 0.64454 581 1 260 5 0.000001 25550 1.91E-05 1.18E-06 2.25E-05 NoDaycare 14 0.69 0.62639 581 1 260 5 0.000001 25550 1.85E-05 1.18E-06 2.19E-05 NoDaycare 15 0.68 0.61731 581 1 260 5 0.000001 25550 1.82E-05 1.18E-06 2.15E-05 NoDaycare 16 0.66 0.59915 581 1 260 5 0.000001 25550 1.77E-05 1.18E-06 2.09E-05 NoDaycare 17 0.64 0.58100 581 1 260 5 0.000001 25550 1.72E-05 1.18E-06 2.03E-05 No
Daycare 1 1.37 1.52595 581 1 260 5 0.000001 25550 4.51E-05 1.07E-07 4.83E-06 NoDaycare 2 1.37 1.52595 581 1 260 5 0.000001 25550 4.51E-05 1.07E-07 4.83E-06 NoDaycare 3 1.36 1.51481 581 1 260 5 0.000001 25550 4.48E-05 1.07E-07 4.79E-06 NoDaycare 4 1.36 1.51481 581 1 260 5 0.000001 25550 4.48E-05 1.07E-07 4.79E-06 NoDaycare 5 1.34 1.49253 581 1 260 5 0.000001 25550 4.41E-05 1.07E-07 4.72E-06 NoDaycare 6 1.17 1.30318 581 1 260 5 0.000001 25550 3.85E-05 1.07E-07 4.12E-06 NoDaycare 7 1.26 1.40343 581 1 260 5 0.000001 25550 4.15E-05 1.07E-07 4.44E-06 NoDaycare 8 1.04 1.15838 581 1 260 5 0.000001 25550 3.42E-05 1.07E-07 3.66E-06 NoDaycare 9 1.04 1.15838 581 1 260 5 0.000001 25550 3.42E-05 1.07E-07 3.66E-06 NoDaycare 10 1.03 1.14724 581 1 260 5 0.000001 25550 3.39E-05 1.07E-07 3.63E-06 NoDaycare 11 1.02 1.13611 581 1 260 5 0.000001 25550 3.36E-05 1.07E-07 3.59E-06 NoDaycare 12 1 1.11383 581 1 260 5 0.000001 25550 3.29E-05 1.07E-07 3.52E-06 NoDaycare 13 0.83 0.92448 581 1 260 5 0.000001 25550 2.73E-05 1.07E-07 2.92E-06 No
Receptor
TOC Exhaust
TOC Evaporative Loss
DaycareDaycare 14 0.83 0.92448 581 1 260 5 0.000001 25550 2.73E-05 1.07E-07 2.92E-06 NoDaycare 15 0.82 0.91334 581 1 260 5 0.000001 25550 2.70E-05 1.07E-07 2.89E-06 NoDaycare 16 0.81 0.90220 581 1 260 5 0.000001 25550 2.67E-05 1.07E-07 2.85E-06 NoDaycare 17 0.8 0.89106 581 1 260 5 0.000001 25550 2.63E-05 1.07E-07 2.82E-06 No
Daycare 1 0.1 0.09241 581 1 260 5 0.000001 25550 2.73E-06 1.1 3.0049 NoDaycare 2 0.1 0.09241 581 1 260 5 0.000001 25550 2.73E-06 1.1 3.0049 NoDaycare 3 0.1 0.09241 581 1 260 5 0.000001 25550 2.73E-06 1.1 3.0049 NoDaycare 4 0.1 0.09241 581 1 260 5 0.000001 25550 2.73E-06 1.1 3.0049 NoDaycare 5 0.1 0.09241 581 1 260 5 0.000001 25550 2.73E-06 1.1 3.0049 NoDaycare 6 0.09 0.08317 581 1 260 5 0.000001 25550 2.46E-06 1.1 2.7044 NoDaycare 7 0.09 0.08317 581 1 260 5 0.000001 25550 2.46E-06 1.1 2.7044 NoDaycare 8 0.08 0.07393 581 1 260 5 0.000001 25550 2.19E-06 1.1 2.4039 NoDaycare 9 0.08 0.07393 581 1 260 5 0.000001 25550 2.19E-06 1.1 2.4039 NoDaycare 10 0.07 0.06469 581 1 260 5 0.000001 25550 1.91E-06 1.1 2.1034 NoDaycare 11 0.07 0.06469 581 1 260 5 0.000001 25550 1.91E-06 1.1 2.1034 NoDaycare 12 0.07 0.06469 581 1 260 5 0.000001 25550 1.91E-06 1.1 2.1034 NoDaycare 13 0.06 0.05545 581 1 260 5 0.000001 25550 1.64E-06 1.1 1.8030 NoDaycare 14 0.06 0.05545 581 1 260 5 0.000001 25550 1.64E-06 1.1 1.8030 NoDaycare 15 0.06 0.05545 581 1 260 5 0.000001 25550 1.64E-06 1.1 1.8030 NoDaycare 16 0.06 0.05545 581 1 260 5 0.000001 25550 1.64E-06 1.1 1.8030 NoDaycare 17 0.06 0.05545 581 1 260 5 0.000001 25550 1.64E-06 1.1 1.8030 No
DPM Unmitigated

Appendix C
ISTSC3 Output
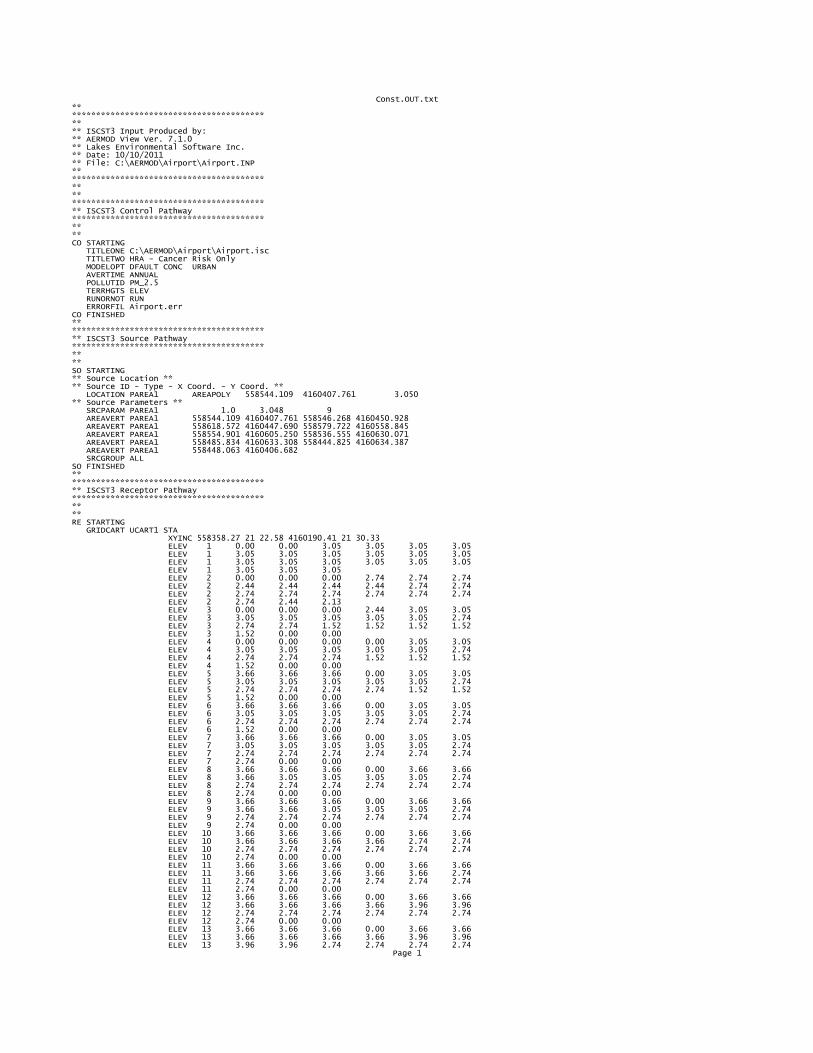
Const.OUT.txt** **************************************** ** ** ISCST3 Input Produced by: ** AERMOD View Ver. 7.1.0 ** Lakes Environmental Software Inc. ** Date: 10/10/2011 ** File: C:\AERMOD\Airport\Airport.INP ** **************************************** ** ** **************************************** ** ISCST3 Control Pathway **************************************** ** ** CO STARTING TITLEONE C:\AERMOD\Airport\Airport.isc TITLETWO HRA - Cancer Risk Only MODELOPT DFAULT CONC URBAN AVERTIME ANNUAL POLLUTID PM_2.5 TERRHGTS ELEV RUNORNOT RUN ERRORFIL Airport.err CO FINISHED ** **************************************** ** ISCST3 Source Pathway **************************************** ** ** SO STARTING ** Source Location ** ** Source ID - Type - X Coord. - Y Coord. ** LOCATION PAREA1 AREAPOLY 558544.109 4160407.761 3.050 ** Source Parameters ** SRCPARAM PAREA1 1.0 3.048 9 AREAVERT PAREA1 558544.109 4160407.761 558546.268 4160450.928 AREAVERT PAREA1 558618.572 4160447.690 558579.722 4160558.845 AREAVERT PAREA1 558554.901 4160605.250 558536.555 4160630.071 AREAVERT PAREA1 558485.834 4160633.308 558444.825 4160634.387 AREAVERT PAREA1 558448.063 4160406.682 SRCGROUP ALL SO FINISHED ** **************************************** ** ISCST3 Receptor Pathway **************************************** ** ** RE STARTING GRIDCART UCART1 STA XYINC 558358.27 21 22.58 4160190.41 21 30.33 ELEV 1 0.00 0.00 3.05 3.05 3.05 3.05 ELEV 1 3.05 3.05 3.05 3.05 3.05 3.05 ELEV 1 3.05 3.05 3.05 3.05 3.05 3.05 ELEV 1 3.05 3.05 3.05 ELEV 2 0.00 0.00 0.00 2.74 2.74 2.74 ELEV 2 2.44 2.44 2.44 2.44 2.74 2.74 ELEV 2 2.74 2.74 2.74 2.74 2.74 2.74 ELEV 2 2.74 2.44 2.13 ELEV 3 0.00 0.00 0.00 2.44 3.05 3.05 ELEV 3 3.05 3.05 3.05 3.05 3.05 2.74 ELEV 3 2.74 2.74 1.52 1.52 1.52 1.52 ELEV 3 1.52 0.00 0.00 ELEV 4 0.00 0.00 0.00 0.00 3.05 3.05 ELEV 4 3.05 3.05 3.05 3.05 3.05 2.74 ELEV 4 2.74 2.74 2.74 1.52 1.52 1.52 ELEV 4 1.52 0.00 0.00 ELEV 5 3.66 3.66 3.66 0.00 3.05 3.05 ELEV 5 3.05 3.05 3.05 3.05 3.05 2.74 ELEV 5 2.74 2.74 2.74 2.74 1.52 1.52 ELEV 5 1.52 0.00 0.00 ELEV 6 3.66 3.66 3.66 0.00 3.05 3.05 ELEV 6 3.05 3.05 3.05 3.05 3.05 2.74 ELEV 6 2.74 2.74 2.74 2.74 2.74 2.74 ELEV 6 1.52 0.00 0.00 ELEV 7 3.66 3.66 3.66 0.00 3.05 3.05 ELEV 7 3.05 3.05 3.05 3.05 3.05 2.74 ELEV 7 2.74 2.74 2.74 2.74 2.74 2.74 ELEV 7 2.74 0.00 0.00 ELEV 8 3.66 3.66 3.66 0.00 3.66 3.66 ELEV 8 3.66 3.05 3.05 3.05 3.05 2.74 ELEV 8 2.74 2.74 2.74 2.74 2.74 2.74 ELEV 8 2.74 0.00 0.00 ELEV 9 3.66 3.66 3.66 0.00 3.66 3.66 ELEV 9 3.66 3.66 3.05 3.05 3.05 2.74 ELEV 9 2.74 2.74 2.74 2.74 2.74 2.74 ELEV 9 2.74 0.00 0.00 ELEV 10 3.66 3.66 3.66 0.00 3.66 3.66 ELEV 10 3.66 3.66 3.66 3.66 2.74 2.74 ELEV 10 2.74 2.74 2.74 2.74 2.74 2.74 ELEV 10 2.74 0.00 0.00 ELEV 11 3.66 3.66 3.66 0.00 3.66 3.66 ELEV 11 3.66 3.66 3.66 3.66 3.66 2.74 ELEV 11 2.74 2.74 2.74 2.74 2.74 2.74 ELEV 11 2.74 0.00 0.00 ELEV 12 3.66 3.66 3.66 0.00 3.66 3.66 ELEV 12 3.66 3.66 3.66 3.66 3.96 3.96 ELEV 12 2.74 2.74 2.74 2.74 2.74 2.74 ELEV 12 2.74 0.00 0.00 ELEV 13 3.66 3.66 3.66 0.00 3.66 3.66 ELEV 13 3.66 3.66 3.66 3.66 3.96 3.96 ELEV 13 3.96 3.96 2.74 2.74 2.74 2.74
Page 1
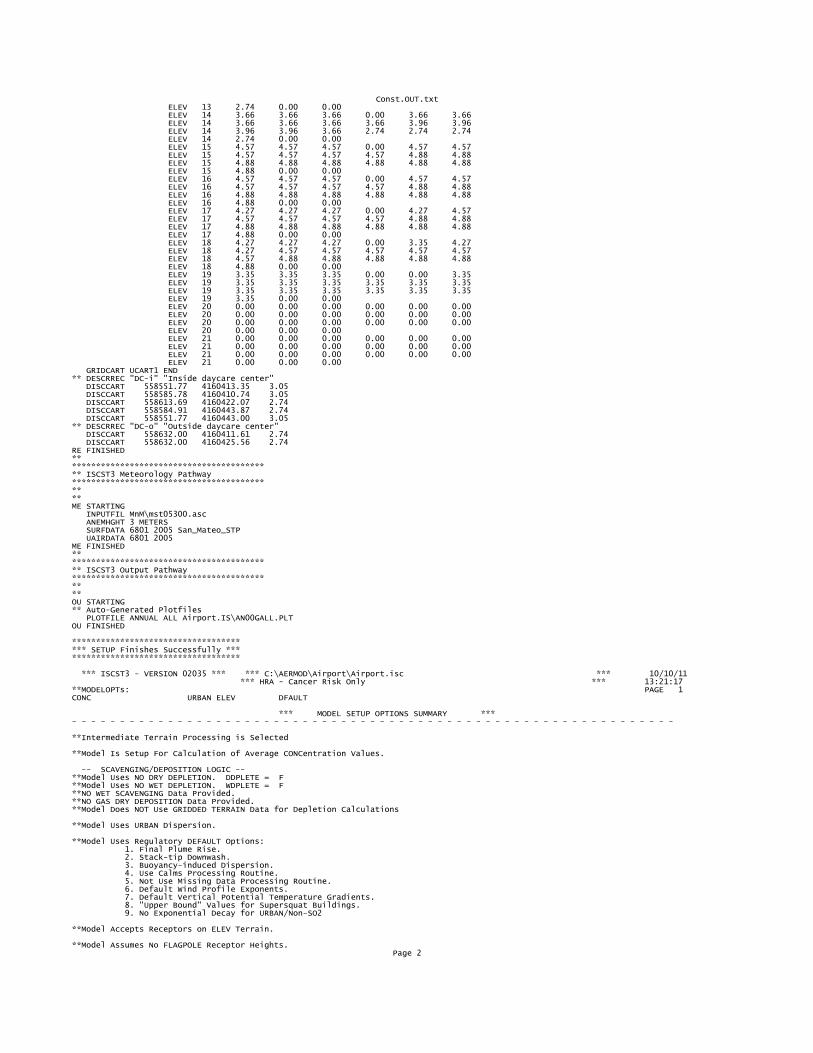
Const.OUT.txt ELEV 13 2.74 0.00 0.00 ELEV 14 3.66 3.66 3.66 0.00 3.66 3.66 ELEV 14 3.66 3.66 3.66 3.66 3.96 3.96 ELEV 14 3.96 3.96 3.66 2.74 2.74 2.74 ELEV 14 2.74 0.00 0.00 ELEV 15 4.57 4.57 4.57 0.00 4.57 4.57 ELEV 15 4.57 4.57 4.57 4.57 4.88 4.88 ELEV 15 4.88 4.88 4.88 4.88 4.88 4.88 ELEV 15 4.88 0.00 0.00 ELEV 16 4.57 4.57 4.57 0.00 4.57 4.57 ELEV 16 4.57 4.57 4.57 4.57 4.88 4.88 ELEV 16 4.88 4.88 4.88 4.88 4.88 4.88 ELEV 16 4.88 0.00 0.00 ELEV 17 4.27 4.27 4.27 0.00 4.27 4.57 ELEV 17 4.57 4.57 4.57 4.57 4.88 4.88 ELEV 17 4.88 4.88 4.88 4.88 4.88 4.88 ELEV 17 4.88 0.00 0.00 ELEV 18 4.27 4.27 4.27 0.00 3.35 4.27 ELEV 18 4.27 4.57 4.57 4.57 4.57 4.57 ELEV 18 4.57 4.88 4.88 4.88 4.88 4.88 ELEV 18 4.88 0.00 0.00 ELEV 19 3.35 3.35 3.35 0.00 0.00 3.35 ELEV 19 3.35 3.35 3.35 3.35 3.35 3.35 ELEV 19 3.35 3.35 3.35 3.35 3.35 3.35 ELEV 19 3.35 0.00 0.00 ELEV 20 0.00 0.00 0.00 0.00 0.00 0.00 ELEV 20 0.00 0.00 0.00 0.00 0.00 0.00 ELEV 20 0.00 0.00 0.00 0.00 0.00 0.00 ELEV 20 0.00 0.00 0.00 ELEV 21 0.00 0.00 0.00 0.00 0.00 0.00 ELEV 21 0.00 0.00 0.00 0.00 0.00 0.00 ELEV 21 0.00 0.00 0.00 0.00 0.00 0.00 ELEV 21 0.00 0.00 0.00 GRIDCART UCART1 END ** DESCRREC "DC-i" "Inside daycare center" DISCCART 558551.77 4160413.35 3.05 DISCCART 558585.78 4160410.74 3.05 DISCCART 558613.69 4160422.07 2.74 DISCCART 558584.91 4160443.87 2.74 DISCCART 558551.77 4160443.00 3.05 ** DESCRREC "DC-o" "Outside daycare center" DISCCART 558632.00 4160411.61 2.74 DISCCART 558632.00 4160425.56 2.74 RE FINISHED ** **************************************** ** ISCST3 Meteorology Pathway **************************************** ** ** ME STARTING INPUTFIL MnM\mst05300.asc ANEMHGHT 3 METERS SURFDATA 6801 2005 San_Mateo_STP UAIRDATA 6801 2005 ME FINISHED ** **************************************** ** ISCST3 Output Pathway **************************************** ** ** OU STARTING ** Auto-Generated Plotfiles PLOTFILE ANNUAL ALL Airport.IS\AN00GALL.PLT OU FINISHED
************************************** SETUP Finishes Successfully **************************************
� *** ISCST3 - VERSION 02035 *** *** C:\AERMOD\Airport\Airport.isc *** 10/10/11 *** HRA - Cancer Risk Only *** 13:21:17**MODELOPTs: PAGE 1CONC URBAN ELEV DFAULT
*** MODEL SETUP OPTIONS SUMMARY ***- - - - - - - - - - - - - - - - - - - - - - - - - - - - - - - - - - - - - - - - - - - - - - - - - - - - - - - - - - - - - - -
**Intermediate Terrain Processing is Selected **Model Is Setup For Calculation of Average CONCentration Values. -- SCAVENGING/DEPOSITION LOGIC --**Model Uses NO DRY DEPLETION. DDPLETE = F**Model Uses NO WET DEPLETION. WDPLETE = F**NO WET SCAVENGING Data Provided. **NO GAS DRY DEPOSITION Data Provided. **Model Does NOT Use GRIDDED TERRAIN Data for Depletion Calculations **Model Uses URBAN Dispersion. **Model Uses Regulatory DEFAULT Options: 1. Final Plume Rise. 2. Stack-tip Downwash. 3. Buoyancy-induced Dispersion. 4. Use Calms Processing Routine. 5. Not Use Missing Data Processing Routine. 6. Default Wind Profile Exponents. 7. Default Vertical Potential Temperature Gradients. 8. "Upper Bound" Values for Supersquat Buildings. 9. No Exponential Decay for URBAN/Non-SO2 **Model Accepts Receptors on ELEV Terrain. **Model Assumes No FLAGPOLE Receptor Heights.
Page 2

Const.OUT.txt **Model Calculates ANNUAL Averages Only **This Run Includes: 1 Source(s); 1 Source Group(s); and 448 Receptor(s) **The Model Assumes A Pollutant Type of: PM_2.5 **Model Set To Continue RUNning After the Setup Testing. **Output Options Selected: Model Outputs Tables of ANNUAL Averages by Receptor Model Outputs External File(s) of High Values for Plotting (PLOTFILE Keyword) **NOTE: The Following Flags May Appear Following CONC Values: c for Calm Hours m for Missing Hours b for Both Calm and Missing Hours **Misc. Inputs: Anem. Hgt. (m) = 3.00 ; Decay Coef. = 0.000 ; Rot. Angle = 0.0 Emission Units = GRAMS/SEC ; Emission Rate Unit Factor = 0.10000E+07 Output Units = MICROGRAMS/M**3 **Approximate Storage Requirements of Model = 1.2 MB of RAM. **Input Runstream File: Airport.INP **Output Print File: Airport.OUT **Detailed Error/Message File: Airport.err � *** ISCST3 - VERSION 02035 *** *** C:\AERMOD\Airport\Airport.isc *** 10/10/11 *** HRA - Cancer Risk Only *** 13:21:17**MODELOPTs: PAGE 2CONC URBAN ELEV DFAULT
*** AREAPOLY SOURCE DATA ***
NUMBER EMISSION RATE LOCATION OF AREA BASE RELEASE NUMBER INIT. EMISSION RATE SOURCE PART. (GRAMS/SEC X Y ELEV. HEIGHT OF VERTS. SZ SCALAR VARY ID CATS. /METER**2) (METERS) (METERS) (METERS) (METERS) (METERS) BY- - - - - - - - - - - - - - - - - - - - - - - - - - - - - - - - - - - - - - - - - - - - - - - - - - - - - - - - - - - - - - -
PAREA1 0 0.10000E+01 558544.1 4160407.8 3.0 3.05 9 0.00 � *** ISCST3 - VERSION 02035 *** *** C:\AERMOD\Airport\Airport.isc *** 10/10/11 *** HRA - Cancer Risk Only *** 13:21:17**MODELOPTs: PAGE 3CONC URBAN ELEV DFAULT
*** SOURCE IDs DEFINING SOURCE GROUPS ***
GROUP ID SOURCE IDs
ALL PAREA1 ,� *** ISCST3 - VERSION 02035 *** *** C:\AERMOD\Airport\Airport.isc *** 10/10/11 *** HRA - Cancer Risk Only *** 13:21:17**MODELOPTs: PAGE 4CONC URBAN ELEV DFAULT
*** GRIDDED RECEPTOR NETWORK SUMMARY ***
*** NETWORK ID: UCART1 ; NETWORK TYPE: GRIDCART ***
*** X-COORDINATES OF GRID *** (METERS)
558358.2, 558380.8, 558403.4, 558426.0, 558448.6, 558471.1, 558493.8, 558516.3, 558538.9, 558561.5, 558584.1, 558606.6, 558629.2, 558651.8, 558674.4, 558696.9, 558719.5, 558742.1, 558764.7, 558787.2, 558809.9,
*** Y-COORDINATES OF GRID *** (METERS)
4160190.5, 4160220.8, 4160251.2, 4160281.5, 4160311.8, 4160342.2, 4160372.5, 4160402.8, 4160433.2, 4160463.5, 4160493.8, 4160524.2, 4160554.5, 4160584.8, 4160615.0, 4160645.5, 4160675.8, 4160706.0, 4160736.5, 4160766.8, 4160797.0,� *** ISCST3 - VERSION 02035 *** *** C:\AERMOD\Airport\Airport.isc *** 10/10/11 *** HRA - Cancer Risk Only *** 13:21:17**MODELOPTs: PAGE 5CONC URBAN ELEV DFAULT
*** NETWORK ID: UCART1 ; NETWORK TYPE: GRIDCART ***
* ELEVATION HEIGHTS IN METERS *
Y-COORD | X-COORD (METERS) (METERS) | 558358.25 558380.81 558403.44 558426.00 558448.56 558471.12 558493.75 558516.31 558538.88- - - - - - - - - - - - - - - - - - - - - - - - - - - - - - - - - - - - - - - - - - - - - - - - - - - - - - - - - - - - - - - - - -
4160797.00 | 0.00 0.00 0.00 0.00 0.00 0.00 0.00 0.00 0.00 4160766.75 | 0.00 0.00 0.00 0.00 0.00 0.00 0.00 0.00 0.00 4160736.50 | 3.35 3.35 3.35 0.00 0.00 3.35 3.35 3.35 3.35 4160706.00 | 4.27 4.27 4.27 0.00 3.35 4.27 4.27 4.57 4.57 4160675.75 | 4.27 4.27 4.27 0.00 4.27 4.57 4.57 4.57 4.57 4160645.50 | 4.57 4.57 4.57 0.00 4.57 4.57 4.57 4.57 4.57 4160615.00 | 4.57 4.57 4.57 0.00 4.57 4.57 4.57 4.57 4.57 4160584.75 | 3.66 3.66 3.66 0.00 3.66 3.66 3.66 3.66 3.66 4160554.50 | 3.66 3.66 3.66 0.00 3.66 3.66 3.66 3.66 3.66 4160524.25 | 3.66 3.66 3.66 0.00 3.66 3.66 3.66 3.66 3.66 4160493.75 | 3.66 3.66 3.66 0.00 3.66 3.66 3.66 3.66 3.66 4160463.50 | 3.66 3.66 3.66 0.00 3.66 3.66 3.66 3.66 3.66 4160433.25 | 3.66 3.66 3.66 0.00 3.66 3.66 3.66 3.66 3.05 4160402.75 | 3.66 3.66 3.66 0.00 3.66 3.66 3.66 3.05 3.05
Page 3
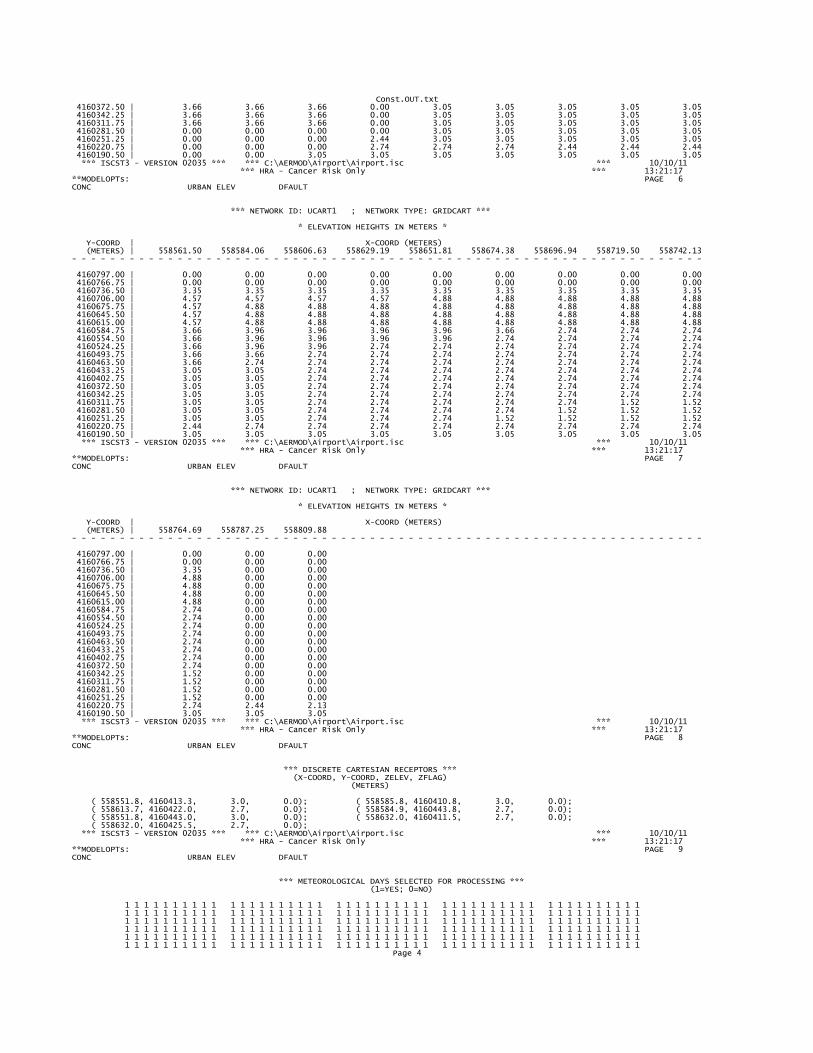
Const.OUT.txt 4160372.50 | 3.66 3.66 3.66 0.00 3.05 3.05 3.05 3.05 3.05 4160342.25 | 3.66 3.66 3.66 0.00 3.05 3.05 3.05 3.05 3.05 4160311.75 | 3.66 3.66 3.66 0.00 3.05 3.05 3.05 3.05 3.05 4160281.50 | 0.00 0.00 0.00 0.00 3.05 3.05 3.05 3.05 3.05 4160251.25 | 0.00 0.00 0.00 2.44 3.05 3.05 3.05 3.05 3.05 4160220.75 | 0.00 0.00 0.00 2.74 2.74 2.74 2.44 2.44 2.44 4160190.50 | 0.00 0.00 3.05 3.05 3.05 3.05 3.05 3.05 3.05� *** ISCST3 - VERSION 02035 *** *** C:\AERMOD\Airport\Airport.isc *** 10/10/11 *** HRA - Cancer Risk Only *** 13:21:17**MODELOPTs: PAGE 6CONC URBAN ELEV DFAULT
*** NETWORK ID: UCART1 ; NETWORK TYPE: GRIDCART ***
* ELEVATION HEIGHTS IN METERS *
Y-COORD | X-COORD (METERS) (METERS) | 558561.50 558584.06 558606.63 558629.19 558651.81 558674.38 558696.94 558719.50 558742.13- - - - - - - - - - - - - - - - - - - - - - - - - - - - - - - - - - - - - - - - - - - - - - - - - - - - - - - - - - - - - - - - - -
4160797.00 | 0.00 0.00 0.00 0.00 0.00 0.00 0.00 0.00 0.00 4160766.75 | 0.00 0.00 0.00 0.00 0.00 0.00 0.00 0.00 0.00 4160736.50 | 3.35 3.35 3.35 3.35 3.35 3.35 3.35 3.35 3.35 4160706.00 | 4.57 4.57 4.57 4.57 4.88 4.88 4.88 4.88 4.88 4160675.75 | 4.57 4.88 4.88 4.88 4.88 4.88 4.88 4.88 4.88 4160645.50 | 4.57 4.88 4.88 4.88 4.88 4.88 4.88 4.88 4.88 4160615.00 | 4.57 4.88 4.88 4.88 4.88 4.88 4.88 4.88 4.88 4160584.75 | 3.66 3.96 3.96 3.96 3.96 3.66 2.74 2.74 2.74 4160554.50 | 3.66 3.96 3.96 3.96 3.96 2.74 2.74 2.74 2.74 4160524.25 | 3.66 3.96 3.96 2.74 2.74 2.74 2.74 2.74 2.74 4160493.75 | 3.66 3.66 2.74 2.74 2.74 2.74 2.74 2.74 2.74 4160463.50 | 3.66 2.74 2.74 2.74 2.74 2.74 2.74 2.74 2.74 4160433.25 | 3.05 3.05 2.74 2.74 2.74 2.74 2.74 2.74 2.74 4160402.75 | 3.05 3.05 2.74 2.74 2.74 2.74 2.74 2.74 2.74 4160372.50 | 3.05 3.05 2.74 2.74 2.74 2.74 2.74 2.74 2.74 4160342.25 | 3.05 3.05 2.74 2.74 2.74 2.74 2.74 2.74 2.74 4160311.75 | 3.05 3.05 2.74 2.74 2.74 2.74 2.74 1.52 1.52 4160281.50 | 3.05 3.05 2.74 2.74 2.74 2.74 1.52 1.52 1.52 4160251.25 | 3.05 3.05 2.74 2.74 2.74 1.52 1.52 1.52 1.52 4160220.75 | 2.44 2.74 2.74 2.74 2.74 2.74 2.74 2.74 2.74 4160190.50 | 3.05 3.05 3.05 3.05 3.05 3.05 3.05 3.05 3.05� *** ISCST3 - VERSION 02035 *** *** C:\AERMOD\Airport\Airport.isc *** 10/10/11 *** HRA - Cancer Risk Only *** 13:21:17**MODELOPTs: PAGE 7CONC URBAN ELEV DFAULT
*** NETWORK ID: UCART1 ; NETWORK TYPE: GRIDCART ***
* ELEVATION HEIGHTS IN METERS *
Y-COORD | X-COORD (METERS) (METERS) | 558764.69 558787.25 558809.88- - - - - - - - - - - - - - - - - - - - - - - - - - - - - - - - - - - - - - - - - - - - - - - - - - - - - - - - - - - - - - - - - -
4160797.00 | 0.00 0.00 0.00 4160766.75 | 0.00 0.00 0.00 4160736.50 | 3.35 0.00 0.00 4160706.00 | 4.88 0.00 0.00 4160675.75 | 4.88 0.00 0.00 4160645.50 | 4.88 0.00 0.00 4160615.00 | 4.88 0.00 0.00 4160584.75 | 2.74 0.00 0.00 4160554.50 | 2.74 0.00 0.00 4160524.25 | 2.74 0.00 0.00 4160493.75 | 2.74 0.00 0.00 4160463.50 | 2.74 0.00 0.00 4160433.25 | 2.74 0.00 0.00 4160402.75 | 2.74 0.00 0.00 4160372.50 | 2.74 0.00 0.00 4160342.25 | 1.52 0.00 0.00 4160311.75 | 1.52 0.00 0.00 4160281.50 | 1.52 0.00 0.00 4160251.25 | 1.52 0.00 0.00 4160220.75 | 2.74 2.44 2.13 4160190.50 | 3.05 3.05 3.05� *** ISCST3 - VERSION 02035 *** *** C:\AERMOD\Airport\Airport.isc *** 10/10/11 *** HRA - Cancer Risk Only *** 13:21:17**MODELOPTs: PAGE 8CONC URBAN ELEV DFAULT
*** DISCRETE CARTESIAN RECEPTORS *** (X-COORD, Y-COORD, ZELEV, ZFLAG) (METERS)
( 558551.8, 4160413.3, 3.0, 0.0); ( 558585.8, 4160410.8, 3.0, 0.0); ( 558613.7, 4160422.0, 2.7, 0.0); ( 558584.9, 4160443.8, 2.7, 0.0); ( 558551.8, 4160443.0, 3.0, 0.0); ( 558632.0, 4160411.5, 2.7, 0.0); ( 558632.0, 4160425.5, 2.7, 0.0); � *** ISCST3 - VERSION 02035 *** *** C:\AERMOD\Airport\Airport.isc *** 10/10/11 *** HRA - Cancer Risk Only *** 13:21:17**MODELOPTs: PAGE 9CONC URBAN ELEV DFAULT
*** METEOROLOGICAL DAYS SELECTED FOR PROCESSING *** (1=YES; 0=NO)
1 1 1 1 1 1 1 1 1 1 1 1 1 1 1 1 1 1 1 1 1 1 1 1 1 1 1 1 1 1 1 1 1 1 1 1 1 1 1 1 1 1 1 1 1 1 1 1 1 1 1 1 1 1 1 1 1 1 1 1 1 1 1 1 1 1 1 1 1 1 1 1 1 1 1 1 1 1 1 1 1 1 1 1 1 1 1 1 1 1 1 1 1 1 1 1 1 1 1 1 1 1 1 1 1 1 1 1 1 1 1 1 1 1 1 1 1 1 1 1 1 1 1 1 1 1 1 1 1 1 1 1 1 1 1 1 1 1 1 1 1 1 1 1 1 1 1 1 1 1 1 1 1 1 1 1 1 1 1 1 1 1 1 1 1 1 1 1 1 1 1 1 1 1 1 1 1 1 1 1 1 1 1 1 1 1 1 1 1 1 1 1 1 1 1 1 1 1 1 1 1 1 1 1 1 1 1 1 1 1 1 1 1 1 1 1 1 1 1 1 1 1 1 1 1 1 1 1 1 1 1 1 1 1 1 1 1 1 1 1 1 1 1 1 1 1 1 1 1 1 1 1 1 1 1 1 1 1 1 1 1 1 1 1 1 1 1 1 1 1 1 1 1 1 1 1 1 1 1 1 1 1 1 1 1 1 1 1 1 1 1 1 1 1 1 1 1 1 1 1
Page 4

Const.OUT.txt 1 1 1 1 1 1 1 1 1 1 1 1 1 1 1 1 1 1 1 1 1 1 1 1 1 1 1 1 1 1 1 1 1 1 1 1 1 1 1 1 1 1 1 1 1 1 1 1 1 1 1 1 1 1 1 1 1 1 1 1 1 1 1 1 1 1
NOTE: METEOROLOGICAL DATA ACTUALLY PROCESSED WILL ALSO DEPEND ON WHAT IS INCLUDED IN THE DATA FILE.
*** UPPER BOUND OF FIRST THROUGH FIFTH WIND SPEED CATEGORIES *** (METERS/SEC)
1.54, 3.09, 5.14, 8.23, 10.80,
*** WIND PROFILE EXPONENTS ***
STABILITY WIND SPEED CATEGORY CATEGORY 1 2 3 4 5 6 A .15000E+00 .15000E+00 .15000E+00 .15000E+00 .15000E+00 .15000E+00 B .15000E+00 .15000E+00 .15000E+00 .15000E+00 .15000E+00 .15000E+00 C .20000E+00 .20000E+00 .20000E+00 .20000E+00 .20000E+00 .20000E+00 D .25000E+00 .25000E+00 .25000E+00 .25000E+00 .25000E+00 .25000E+00 E .30000E+00 .30000E+00 .30000E+00 .30000E+00 .30000E+00 .30000E+00 F .30000E+00 .30000E+00 .30000E+00 .30000E+00 .30000E+00 .30000E+00
*** VERTICAL POTENTIAL TEMPERATURE GRADIENTS *** (DEGREES KELVIN PER METER)
STABILITY WIND SPEED CATEGORY CATEGORY 1 2 3 4 5 6 A .00000E+00 .00000E+00 .00000E+00 .00000E+00 .00000E+00 .00000E+00 B .00000E+00 .00000E+00 .00000E+00 .00000E+00 .00000E+00 .00000E+00 C .00000E+00 .00000E+00 .00000E+00 .00000E+00 .00000E+00 .00000E+00 D .00000E+00 .00000E+00 .00000E+00 .00000E+00 .00000E+00 .00000E+00 E .20000E-01 .20000E-01 .20000E-01 .20000E-01 .20000E-01 .20000E-01 F .35000E-01 .35000E-01 .35000E-01 .35000E-01 .35000E-01 .35000E-01� *** ISCST3 - VERSION 02035 *** *** C:\AERMOD\Airport\Airport.isc *** 10/10/11 *** HRA - Cancer Risk Only *** 13:21:17**MODELOPTs: PAGE 10CONC URBAN ELEV DFAULT
*** THE FIRST 24 HOURS OF METEOROLOGICAL DATA ***
FILE: MnM\mst05300.asc FORMAT: (4I2,2F9.4,F6.1,I2,2F7.1,f9.4,f10.1,f8.4,i4,f7.2) SURFACE STATION NO.: 6801 UPPER AIR STATION NO.: 6801 NAME: SAN_MATEO_STP NAME: UNKNOWN YEAR: 2005 YEAR: 2005
FLOW SPEED TEMP STAB MIXING HEIGHT (M) USTAR M-O LENGTH Z-0 IPCODE PRATEYR MN DY HR VECTOR (M/S) (K) CLASS RURAL URBAN (M/S) (M) (M) (mm/HR)- - - - - - - - - - - - - - - - - - - - - - - - - - - - - - - - - - - - - - - - - - - - - - - - - - - - - - - - - - - - - - - - - -
05 01 01 01 61.0 2.10 282.0 4 300.0 300.0 0.0000 0.0 0.0000 0 0.0005 01 01 02 39.9 2.68 282.0 4 300.0 300.0 0.0000 0.0 0.0000 0 0.0005 01 01 03 41.5 1.12 281.7 5 300.0 300.0 0.0000 0.0 0.0000 0 0.0005 01 01 04 305.2 1.00 281.7 6 300.0 300.0 0.0000 0.0 0.0000 0 0.0005 01 01 05 17.1 1.00 281.0 6 300.0 300.0 0.0000 0.0 0.0000 0 0.0005 01 01 06 305.4 1.00 280.5 6 300.0 300.0 0.0000 0.0 0.0000 0 0.0005 01 01 07 340.8 1.52 280.0 6 300.0 300.0 0.0000 0.0 0.0000 0 0.0005 01 01 08 328.1 1.48 280.2 6 300.0 300.0 0.0000 0.0 0.0000 0 0.0005 01 01 09 330.3 1.03 281.7 5 300.0 300.0 0.0000 0.0 0.0000 0 0.0005 01 01 10 332.2 1.83 283.2 4 300.0 300.0 0.0000 0.0 0.0000 0 0.0005 01 01 11 330.8 1.88 284.4 3 300.0 300.0 0.0000 0.0 0.0000 0 0.0005 01 01 12 8.7 3.98 285.2 3 300.0 300.0 0.0000 0.0 0.0000 0 0.0005 01 01 13 20.8 3.98 285.1 2 300.0 300.0 0.0000 0.0 0.0000 0 0.0005 01 01 14 29.9 4.96 285.6 3 300.0 300.0 0.0000 0.0 0.0000 0 0.0005 01 01 15 26.0 4.11 285.0 3 300.0 300.0 0.0000 0.0 0.0000 0 0.0005 01 01 16 46.0 2.64 284.5 3 300.0 300.0 0.0000 0.0 0.0000 0 0.0005 01 01 17 19.8 1.88 283.7 4 300.0 300.0 0.0000 0.0 0.0000 0 0.0005 01 01 18 18.9 2.50 282.7 4 300.0 300.0 0.0000 0.0 0.0000 0 0.0005 01 01 19 15.4 1.56 282.4 5 300.0 300.0 0.0000 0.0 0.0000 0 0.0005 01 01 20 22.4 1.00 282.2 6 300.0 300.0 0.0000 0.0 0.0000 0 0.0005 01 01 21 27.4 1.52 282.0 5 300.0 300.0 0.0000 0.0 0.0000 0 0.0005 01 01 22 334.9 1.43 281.9 5 300.0 300.0 0.0000 0.0 0.0000 0 0.0005 01 01 23 325.9 1.97 282.0 5 300.0 300.0 0.0000 0.0 0.0000 0 0.0005 01 01 24 346.8 2.86 282.2 4 300.0 300.0 0.0000 0.0 0.0000 0 0.00
*** NOTES: STABILITY CLASS 1=A, 2=B, 3=C, 4=D, 5=E AND 6=F. FLOW VECTOR IS DIRECTION TOWARD WHICH WIND IS BLOWING.� *** ISCST3 - VERSION 02035 *** *** C:\AERMOD\Airport\Airport.isc *** 10/10/11 *** HRA - Cancer Risk Only *** 13:21:17**MODELOPTs: PAGE 11CONC URBAN ELEV DFAULT
*** THE ANNUAL ( 1 YRS) AVERAGE CONCENTRATION VALUES FOR SOURCE GROUP: ALL *** INCLUDING SOURCE(S): PAREA1 ,
*** NETWORK ID: UCART1 ; NETWORK TYPE: GRIDCART ***
** CONC OF PM_2.5 IN MICROGRAMS/M**3 **
Y-COORD | X-COORD (METERS) (METERS) | 558358.25 558380.81 558403.44 558426.00 558448.56 558471.12 558493.75 558516.31 558538.88- - - - - - - - - - - - - - - - - - - - - - - - - - - - - - - - - - - - - - - - - - - - - - - - - - - - - - - - - - - - - - - - - -
4160797.00 | 199616.85900 215778.21900 230951.18800 245926.15600 262612.84400 285766.90600 317065.21900 352398.09400 388895.09400 4160766.75 | 231145.53100 256921.79700 281283.53100 306019.09400 332688.68800 366160.00000 409931.56200 460683.93800 514413.28100 4160736.50 | 265450.81200 306654.15600 347641.31200 388945.71900 435611.53100 492704.78100 559582.87500 638416.43800 720503.18800 4160706.00 | 298217.87500 361570.40600 434440.59400 509767.50000 596500.56200 709701.81200 836556.93800 969819.188001087974.38000 4160675.75 | 318570.37500 408649.12500 529759.68800 682768.68800 866136.875001130175.250001432311.250001654005.130001781146.25000
Page 5
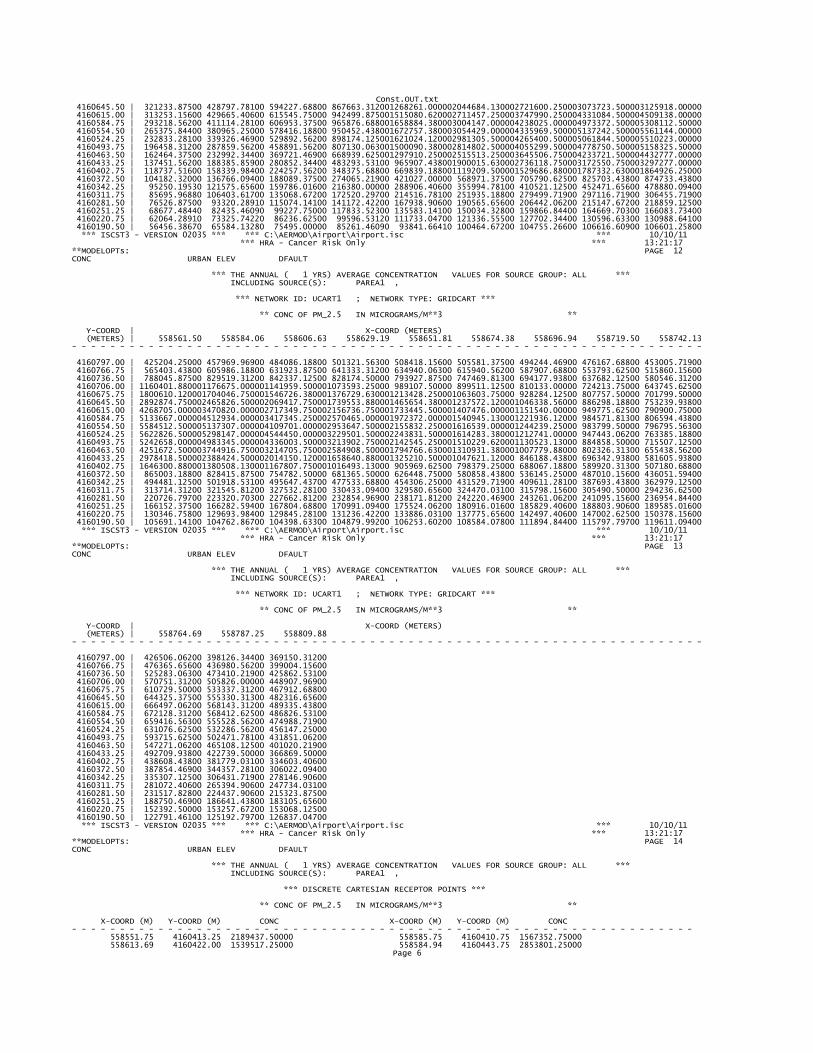
Const.OUT.txt 4160645.50 | 321233.87500 428797.78100 594227.68800 867663.312001268261.000002044684.130002721600.250003073723.500003125918.00000 4160615.00 | 313253.15600 429665.40600 615545.75000 942499.875001515080.620002711457.250003747990.250004331084.500004509138.00000 4160584.75 | 293218.56200 411114.28100 606953.37500 965876.688001658884.380003004147.000004238025.000004973372.500005308112.50000 4160554.50 | 265375.84400 380965.25000 578416.18800 950452.438001672757.380003054429.000004335969.500005137242.500005561144.00000 4160524.25 | 232833.28100 339326.46900 529892.56200 898174.125001621024.120002981305.500004265400.500005061844.500005510223.00000 4160493.75 | 196458.31200 287859.56200 458891.56200 807130.063001500090.380002814802.500004055299.500004778750.500005158325.50000 4160463.50 | 162464.37500 232992.34400 369721.46900 668939.625001297910.250002515513.250003645506.750004233721.500004432777.00000 4160433.25 | 137451.56200 188385.85900 280852.34400 483293.53100 965907.438001900015.630002736118.750003172550.750003297277.00000 4160402.75 | 118737.51600 158339.98400 224257.56200 348375.68800 669839.188001119209.500001529686.880001787332.630001864926.25000 4160372.50 | 104182.32000 136766.09400 188089.37500 274065.21900 421027.00000 568971.37500 705790.62500 825703.43800 874733.43800 4160342.25 | 95250.19530 121575.65600 159786.01600 216380.00000 288906.40600 355994.78100 410521.12500 452471.65600 478880.09400 4160311.75 | 85695.96880 106403.61700 135068.67200 172520.29700 214516.78100 251935.18800 279499.71900 297116.71900 306455.71900 4160281.50 | 76526.87500 93320.28910 115074.14100 141172.42200 167938.90600 190565.65600 206442.06200 215147.67200 218859.12500 4160251.25 | 68677.48440 82435.46090 99227.75000 117833.52300 135583.14100 150034.32800 159866.84400 164669.70300 166083.73400 4160220.75 | 62064.28910 73325.74220 86236.62500 99596.53120 111733.04700 121336.55500 127702.34400 130596.63300 130988.64100 4160190.50 | 56456.38670 65584.13280 75495.00000 85261.46090 93841.66410 100464.67200 104755.26600 106616.60900 106601.25800� *** ISCST3 - VERSION 02035 *** *** C:\AERMOD\Airport\Airport.isc *** 10/10/11 *** HRA - Cancer Risk Only *** 13:21:17**MODELOPTs: PAGE 12CONC URBAN ELEV DFAULT
*** THE ANNUAL ( 1 YRS) AVERAGE CONCENTRATION VALUES FOR SOURCE GROUP: ALL *** INCLUDING SOURCE(S): PAREA1 ,
*** NETWORK ID: UCART1 ; NETWORK TYPE: GRIDCART ***
** CONC OF PM_2.5 IN MICROGRAMS/M**3 **
Y-COORD | X-COORD (METERS) (METERS) | 558561.50 558584.06 558606.63 558629.19 558651.81 558674.38 558696.94 558719.50 558742.13- - - - - - - - - - - - - - - - - - - - - - - - - - - - - - - - - - - - - - - - - - - - - - - - - - - - - - - - - - - - - - - - - -
4160797.00 | 425204.25000 457969.96900 484086.18800 501321.56300 508418.15600 505581.37500 494244.46900 476167.68800 453005.71900 4160766.75 | 565403.43800 605986.18800 631923.87500 641333.31200 634940.06300 615940.56200 587907.68800 553793.62500 515860.15600 4160736.50 | 788045.87500 829519.31200 842337.12500 828174.50000 793927.87500 747469.81300 694177.93800 637682.12500 580546.31200 4160706.00 | 1160401.880001176675.000001141959.500001073593.25000 989107.50000 899511.12500 810133.00000 724213.75000 643745.62500 4160675.75 | 1800610.120001704046.750001546726.380001376729.630001213428.250001063603.75000 928284.12500 807757.50000 701799.50000 4160645.50 | 2892874.750002465826.500002069417.750001739553.880001465654.380001237572.120001046338.56000 886298.18800 753239.93800 4160615.00 | 4268705.000003470820.000002717349.750002156736.750001733445.500001407476.000001151540.00000 949775.62500 790900.75000 4160584.75 | 5133667.000004512934.000003417345.250002570465.000001972372.000001540945.130001221936.12000 984571.81300 806594.43800 4160554.50 | 5584512.500005137307.000004109701.000002953647.500002155832.250001616539.000001244239.25000 983799.50000 796795.56300 4160524.25 | 5622826.500005298147.000004544450.000003229501.500002243831.500001614283.380001212741.00000 947443.06200 763385.18800 4160493.75 | 5242658.000004983345.000004336003.500003213902.750002142545.250001510229.620001130523.13000 884858.50000 715507.12500 4160463.50 | 4251672.500003744916.750003214705.750002584908.500001794766.630001310931.380001007779.88000 802326.31300 655438.56200 4160433.25 | 2978418.500002388424.500002014150.120001658640.880001325210.500001047621.12000 846188.43800 696342.93800 581605.93800 4160402.75 | 1646300.880001380508.130001167807.750001016493.13000 905969.62500 798379.25000 688067.18800 589920.31300 507180.68800 4160372.50 | 865003.18800 828415.87500 754782.50000 681365.50000 626448.75000 580858.43800 536145.25000 487010.15600 436051.59400 4160342.25 | 494481.12500 501918.53100 495647.43700 477533.68800 454306.25000 431529.71900 409611.28100 387693.43800 362979.12500 4160311.75 | 313714.31200 321545.81200 327532.28100 330433.09400 329580.65600 324470.03100 315798.15600 305490.50000 294236.62500 4160281.50 | 220726.79700 223320.70300 227662.81200 232854.96900 238171.81200 242220.46900 243261.06200 241095.15600 236954.84400 4160251.25 | 166152.37500 166282.59400 167804.68800 170991.09400 175524.06200 180916.01600 185829.40600 188803.90600 189585.01600 4160220.75 | 130346.75800 129693.98400 129845.28100 131236.42200 133886.03100 137775.65600 142497.40600 147002.62500 150378.15600 4160190.50 | 105691.14100 104762.86700 104398.63300 104879.99200 106253.60200 108584.07800 111894.84400 115797.79700 119611.09400� *** ISCST3 - VERSION 02035 *** *** C:\AERMOD\Airport\Airport.isc *** 10/10/11 *** HRA - Cancer Risk Only *** 13:21:17**MODELOPTs: PAGE 13CONC URBAN ELEV DFAULT
*** THE ANNUAL ( 1 YRS) AVERAGE CONCENTRATION VALUES FOR SOURCE GROUP: ALL *** INCLUDING SOURCE(S): PAREA1 ,
*** NETWORK ID: UCART1 ; NETWORK TYPE: GRIDCART ***
** CONC OF PM_2.5 IN MICROGRAMS/M**3 **
Y-COORD | X-COORD (METERS) (METERS) | 558764.69 558787.25 558809.88- - - - - - - - - - - - - - - - - - - - - - - - - - - - - - - - - - - - - - - - - - - - - - - - - - - - - - - - - - - - - - - - - -
4160797.00 | 426506.06200 398126.34400 369150.31200 4160766.75 | 476365.65600 436980.56200 399004.15600 4160736.50 | 525283.06300 473410.21900 425862.53100 4160706.00 | 570751.31200 505826.00000 448907.96900 4160675.75 | 610729.50000 533337.31200 467912.68800 4160645.50 | 644325.37500 555330.31300 482316.65600 4160615.00 | 666497.06200 568143.31200 489335.43800 4160584.75 | 672128.31200 568412.62500 486826.53100 4160554.50 | 659416.56300 555528.56200 474988.71900 4160524.25 | 631076.62500 532286.56200 456147.25000 4160493.75 | 593715.62500 502471.78100 431851.06200 4160463.50 | 547271.06200 465108.12500 401020.21900 4160433.25 | 492709.93800 422739.50000 366869.50000 4160402.75 | 438608.43800 381779.03100 334603.40600 4160372.50 | 387854.46900 344357.28100 306022.09400 4160342.25 | 335307.12500 306431.71900 278146.90600 4160311.75 | 281072.40600 265394.90600 247734.03100 4160281.50 | 231517.82800 224437.90600 215323.87500 4160251.25 | 188750.46900 186641.43800 183105.65600 4160220.75 | 152392.50000 153257.67200 153068.12500 4160190.50 | 122791.46100 125192.79700 126837.04700� *** ISCST3 - VERSION 02035 *** *** C:\AERMOD\Airport\Airport.isc *** 10/10/11 *** HRA - Cancer Risk Only *** 13:21:17**MODELOPTs: PAGE 14CONC URBAN ELEV DFAULT
*** THE ANNUAL ( 1 YRS) AVERAGE CONCENTRATION VALUES FOR SOURCE GROUP: ALL *** INCLUDING SOURCE(S): PAREA1 ,
*** DISCRETE CARTESIAN RECEPTOR POINTS ***
** CONC OF PM_2.5 IN MICROGRAMS/M**3 **
X-COORD (M) Y-COORD (M) CONC X-COORD (M) Y-COORD (M) CONC- - - - - - - - - - - - - - - - - - - - - - - - - - - - - - - - - - - - - - - - - - - - - - - - - - - - - - - - - - - - - - - - - 558551.75 4160413.25 2189437.50000 558585.75 4160410.75 1567352.75000 558613.69 4160422.00 1539517.25000 558584.94 4160443.75 2853801.25000
Page 6

Const.OUT.txt 558551.75 4160443.00 3702417.25000 558632.00 4160411.50 1142251.88000 558632.00 4160425.50 1427783.88000 � *** ISCST3 - VERSION 02035 *** *** C:\AERMOD\Airport\Airport.isc *** 10/10/11 *** HRA - Cancer Risk Only *** 13:21:17**MODELOPTs: PAGE 15CONC URBAN ELEV DFAULT
*** THE SUMMARY OF MAXIMUM ANNUAL ( 1 YRS) RESULTS ***
** CONC OF PM_2.5 IN MICROGRAMS/M**3 **
NETWORKGROUP ID AVERAGE CONC RECEPTOR (XR, YR, ZELEV, ZFLAG) OF TYPE GRID-ID- - - - - - - - - - - - - - - - - - - - - - - - - - - - - - - - - - - - - - - - - - - - - - - - - - - - - - - - - - - -
ALL 1ST HIGHEST VALUE IS 5622826.50000 AT ( 558561.50, 4160524.25, 3.66, 0.00) GC UCART1 2ND HIGHEST VALUE IS 5584512.50000 AT ( 558561.50, 4160554.50, 3.66, 0.00) GC UCART1 3RD HIGHEST VALUE IS 5561144.00000 AT ( 558538.88, 4160554.50, 3.66, 0.00) GC UCART1 4TH HIGHEST VALUE IS 5510223.00000 AT ( 558538.88, 4160524.25, 3.66, 0.00) GC UCART1 5TH HIGHEST VALUE IS 5308112.50000 AT ( 558538.88, 4160584.75, 3.66, 0.00) GC UCART1 6TH HIGHEST VALUE IS 5298147.00000 AT ( 558584.06, 4160524.25, 3.96, 0.00) GC UCART1 7TH HIGHEST VALUE IS 5242658.00000 AT ( 558561.50, 4160493.75, 3.66, 0.00) GC UCART1 8TH HIGHEST VALUE IS 5158325.50000 AT ( 558538.88, 4160493.75, 3.66, 0.00) GC UCART1 9TH HIGHEST VALUE IS 5137307.00000 AT ( 558584.06, 4160554.50, 3.96, 0.00) GC UCART1 10TH HIGHEST VALUE IS 5137242.50000 AT ( 558516.31, 4160554.50, 3.66, 0.00) GC UCART1
*** RECEPTOR TYPES: GC = GRIDCART GP = GRIDPOLR DC = DISCCART DP = DISCPOLR BD = BOUNDARY� *** ISCST3 - VERSION 02035 *** *** C:\AERMOD\Airport\Airport.isc *** 10/10/11 *** HRA - Cancer Risk Only *** 13:21:17**MODELOPTs: PAGE 16CONC URBAN ELEV DFAULT
*** Message Summary : ISCST3 Model Execution ***
--------- Summary of Total Messages -------- A Total of 0 Fatal Error Message(s)A Total of 0 Warning Message(s)A Total of 18 Informational Message(s)
A Total of 18 Calm Hours Identified ******** FATAL ERROR MESSAGES ******** *** NONE *** ******** WARNING MESSAGES ******** *** NONE ***
************************************ *** ISCST3 Finishes Successfully *** ************************************
Page 7
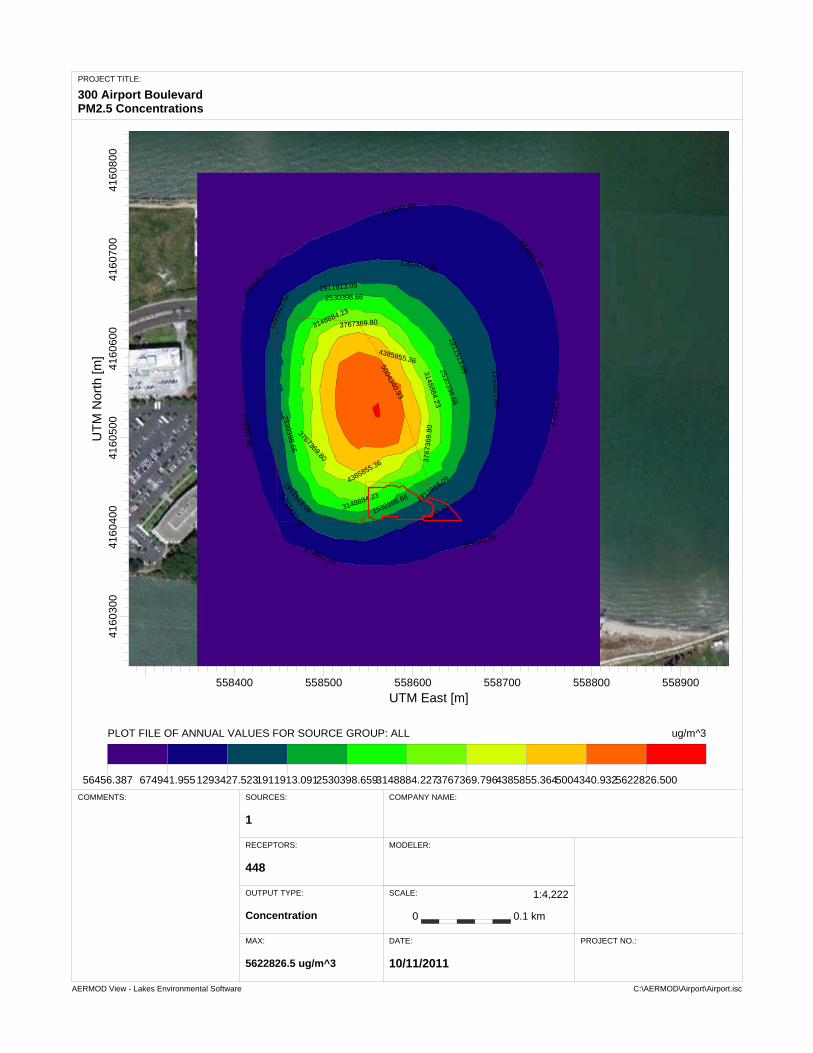
AERMOD View - Lakes Environmental Software C:\AERMOD\Airport\Airport.isc
ug/m^3PLOT FILE OF ANNUAL VALUES FOR SOURCE GROUP: ALL
56456.387 674941.9551293427.5231911913.0912530398.6593148884.2273767369.7964385855.3645004340.9325622826.500
674941.95
674941.95
6749
41.9
5
674941.95
674941.95674941.95
6749
41.9
512
9342
7.52
1293427.52
129342
7. 52
1293427.52
1293427.52
1911913.09
1911913.09
1911913.091911913.09
2530398.66
2530398.66
2530398.66
2530398.66
3148884.23
3148884.23
3148884.23
3767369.80
3767369.80
3767
369.
80
4385855.36
4385855.36
5004340.93
558400 558500 558600 558700 558800 558900
UTM East [m]
416
030
041
604
004
1605
00
4160
600
416
070
041
6080
0U
TM
Nor
th [m
]
SCALE:
0 0.1 km
1:4,222
PROJECT TITLE:
300 Airport BoulevardPM2.5 Concentrations
COMMENTS: COMPANY NAME:
MODELER:
DATE:
10/11/2011
PROJECT NO.:
SOURCES:
1
RECEPTORS:
448
OUTPUT TYPE:
Concentration
MAX:
5622826.5 ug/m^3

Appendix D
CAL3QHCR Output
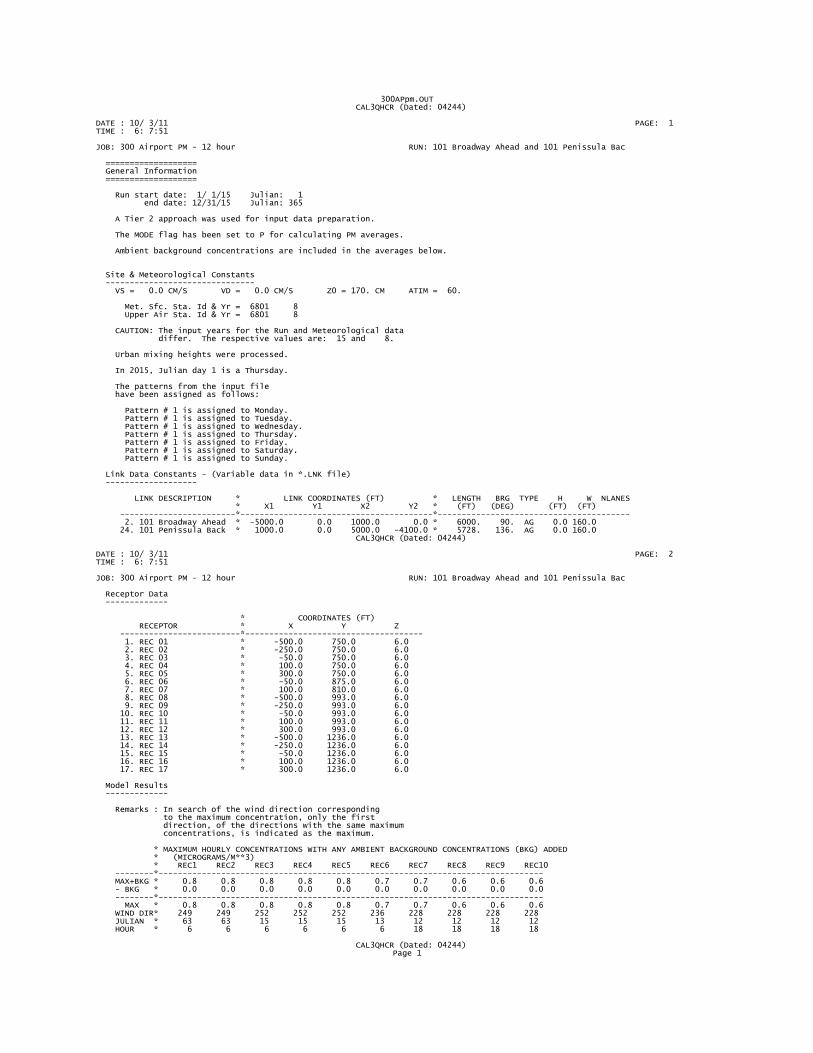
300APpm.OUT CAL3QHCR (Dated: 04244)
DATE : 10/ 3/11 PAGE: 1 TIME : 6: 7:51
JOB: 300 Airport PM - 12 hour RUN: 101 Broadway Ahead and 101 Penissula Bac
=================== General Information ===================
Run start date: 1/ 1/15 Julian: 1 end date: 12/31/15 Julian: 365
A Tier 2 approach was used for input data preparation.
The MODE flag has been set to P for calculating PM averages.
Ambient background concentrations are included in the averages below.
Site & Meteorological Constants ------------------------------- VS = 0.0 CM/S VD = 0.0 CM/S Z0 = 170. CM ATIM = 60.
Met. Sfc. Sta. Id & Yr = 6801 8 Upper Air Sta. Id & Yr = 6801 8
CAUTION: The input years for the Run and Meteorological data differ. The respective values are: 15 and 8.
Urban mixing heights were processed.
In 2015, Julian day 1 is a Thursday.
The patterns from the input file have been assigned as follows:
Pattern # 1 is assigned to Monday. Pattern # 1 is assigned to Tuesday. Pattern # 1 is assigned to Wednesday. Pattern # 1 is assigned to Thursday. Pattern # 1 is assigned to Friday. Pattern # 1 is assigned to Saturday. Pattern # 1 is assigned to Sunday.
Link Data Constants - (Variable data in *.LNK file) -------------------
LINK DESCRIPTION * LINK COORDINATES (FT) * LENGTH BRG TYPE H W NLANES * X1 Y1 X2 Y2 * (FT) (DEG) (FT) (FT) ------------------------*----------------------------------------*---------------------------------------- 2. 101 Broadway Ahead * -5000.0 0.0 1000.0 0.0 * 6000. 90. AG 0.0 160.0 24. 101 Penissula Back * 1000.0 0.0 5000.0 -4100.0 * 5728. 136. AG 0.0 160.0� CAL3QHCR (Dated: 04244)
DATE : 10/ 3/11 PAGE: 2 TIME : 6: 7:51
JOB: 300 Airport PM - 12 hour RUN: 101 Broadway Ahead and 101 Penissula Bac
Receptor Data -------------
* COORDINATES (FT) RECEPTOR * X Y Z -------------------------*------------------------------------- 1. REC 01 * -500.0 750.0 6.0 2. REC 02 * -250.0 750.0 6.0 3. REC 03 * -50.0 750.0 6.0 4. REC 04 * 100.0 750.0 6.0 5. REC 05 * 300.0 750.0 6.0 6. REC 06 * -50.0 875.0 6.0 7. REC 07 * 100.0 810.0 6.0 8. REC 08 * -500.0 993.0 6.0 9. REC 09 * -250.0 993.0 6.0 10. REC 10 * -50.0 993.0 6.0 11. REC 11 * 100.0 993.0 6.0 12. REC 12 * 300.0 993.0 6.0 13. REC 13 * -500.0 1236.0 6.0 14. REC 14 * -250.0 1236.0 6.0 15. REC 15 * -50.0 1236.0 6.0 16. REC 16 * 100.0 1236.0 6.0 17. REC 17 * 300.0 1236.0 6.0
Model Results -------------
Remarks : In search of the wind direction corresponding to the maximum concentration, only the first direction, of the directions with the same maximum concentrations, is indicated as the maximum.
* MAXIMUM HOURLY CONCENTRATIONS WITH ANY AMBIENT BACKGROUND CONCENTRATIONS (BKG) ADDED * (MICROGRAMS/M**3) * REC1 REC2 REC3 REC4 REC5 REC6 REC7 REC8 REC9 REC10 --------*-------------------------------------------------------------------------------- MAX+BKG * 0.8 0.8 0.8 0.8 0.8 0.7 0.7 0.6 0.6 0.6 - BKG * 0.0 0.0 0.0 0.0 0.0 0.0 0.0 0.0 0.0 0.0 --------*-------------------------------------------------------------------------------- MAX * 0.8 0.8 0.8 0.8 0.8 0.7 0.7 0.6 0.6 0.6 WIND DIR* 249 249 252 252 252 236 228 228 228 228 JULIAN * 63 63 15 15 15 13 12 12 12 12 HOUR * 6 6 6 6 6 6 18 18 18 18
� CAL3QHCR (Dated: 04244)Page 1
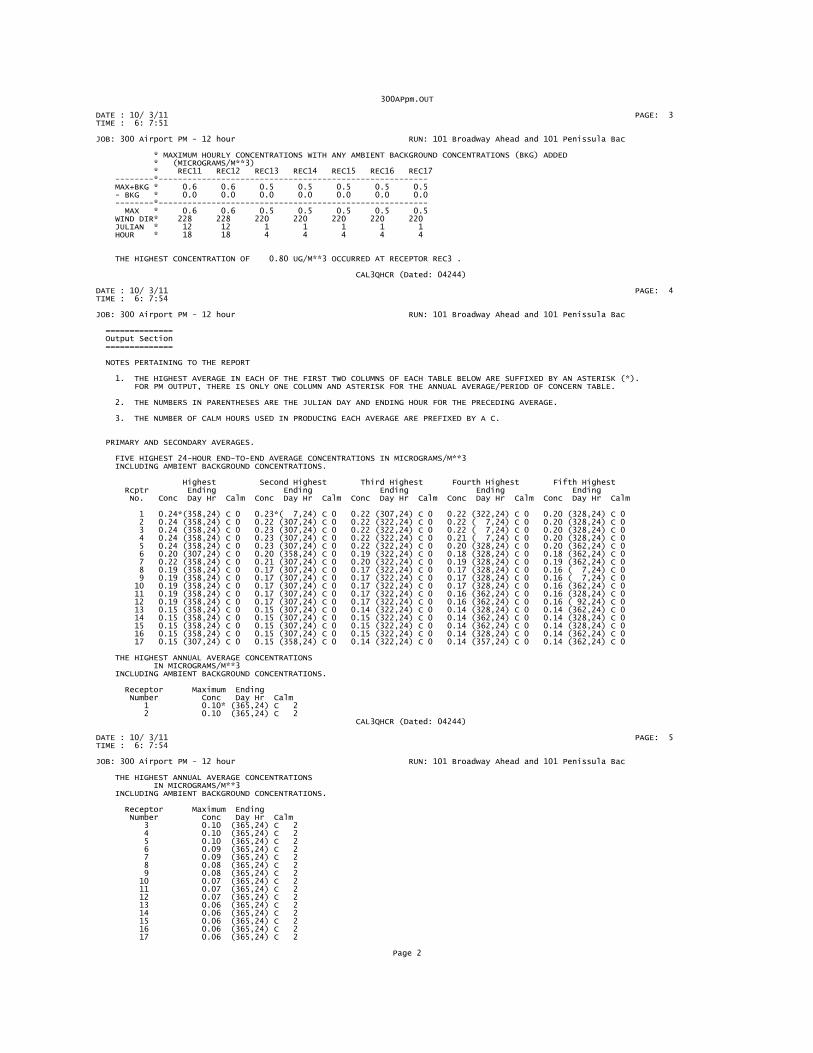
300APpm.OUT
DATE : 10/ 3/11 PAGE: 3 TIME : 6: 7:51
JOB: 300 Airport PM - 12 hour RUN: 101 Broadway Ahead and 101 Penissula Bac
* MAXIMUM HOURLY CONCENTRATIONS WITH ANY AMBIENT BACKGROUND CONCENTRATIONS (BKG) ADDED * (MICROGRAMS/M**3) * REC11 REC12 REC13 REC14 REC15 REC16 REC17 --------*-------------------------------------------------------- MAX+BKG * 0.6 0.6 0.5 0.5 0.5 0.5 0.5 - BKG * 0.0 0.0 0.0 0.0 0.0 0.0 0.0 --------*-------------------------------------------------------- MAX * 0.6 0.6 0.5 0.5 0.5 0.5 0.5 WIND DIR* 228 228 220 220 220 220 220 JULIAN * 12 12 1 1 1 1 1 HOUR * 18 18 4 4 4 4 4
THE HIGHEST CONCENTRATION OF 0.80 UG/M**3 OCCURRED AT RECEPTOR REC3 .
� CAL3QHCR (Dated: 04244)
DATE : 10/ 3/11 PAGE: 4 TIME : 6: 7:54
JOB: 300 Airport PM - 12 hour RUN: 101 Broadway Ahead and 101 Penissula Bac
============== Output Section ==============
NOTES PERTAINING TO THE REPORT
1. THE HIGHEST AVERAGE IN EACH OF THE FIRST TWO COLUMNS OF EACH TABLE BELOW ARE SUFFIXED BY AN ASTERISK (*). FOR PM OUTPUT, THERE IS ONLY ONE COLUMN AND ASTERISK FOR THE ANNUAL AVERAGE/PERIOD OF CONCERN TABLE.
2. THE NUMBERS IN PARENTHESES ARE THE JULIAN DAY AND ENDING HOUR FOR THE PRECEDING AVERAGE.
3. THE NUMBER OF CALM HOURS USED IN PRODUCING EACH AVERAGE ARE PREFIXED BY A C.
PRIMARY AND SECONDARY AVERAGES.
FIVE HIGHEST 24-HOUR END-TO-END AVERAGE CONCENTRATIONS IN MICROGRAMS/M**3 INCLUDING AMBIENT BACKGROUND CONCENTRATIONS.
Highest Second Highest Third Highest Fourth Highest Fifth Highest Rcptr Ending Ending Ending Ending Ending No. Conc Day Hr Calm Conc Day Hr Calm Conc Day Hr Calm Conc Day Hr Calm Conc Day Hr Calm
1 0.24*(358,24) C 0 0.23*( 7,24) C 0 0.22 (307,24) C 0 0.22 (322,24) C 0 0.20 (328,24) C 0 2 0.24 (358,24) C 0 0.22 (307,24) C 0 0.22 (322,24) C 0 0.22 ( 7,24) C 0 0.20 (328,24) C 0 3 0.24 (358,24) C 0 0.23 (307,24) C 0 0.22 (322,24) C 0 0.22 ( 7,24) C 0 0.20 (328,24) C 0 4 0.24 (358,24) C 0 0.23 (307,24) C 0 0.22 (322,24) C 0 0.21 ( 7,24) C 0 0.20 (328,24) C 0 5 0.24 (358,24) C 0 0.23 (307,24) C 0 0.22 (322,24) C 0 0.20 (328,24) C 0 0.20 (362,24) C 0 6 0.20 (307,24) C 0 0.20 (358,24) C 0 0.19 (322,24) C 0 0.18 (328,24) C 0 0.18 (362,24) C 0 7 0.22 (358,24) C 0 0.21 (307,24) C 0 0.20 (322,24) C 0 0.19 (328,24) C 0 0.19 (362,24) C 0 8 0.19 (358,24) C 0 0.17 (307,24) C 0 0.17 (322,24) C 0 0.17 (328,24) C 0 0.16 ( 7,24) C 0 9 0.19 (358,24) C 0 0.17 (307,24) C 0 0.17 (322,24) C 0 0.17 (328,24) C 0 0.16 ( 7,24) C 0 10 0.19 (358,24) C 0 0.17 (307,24) C 0 0.17 (322,24) C 0 0.17 (328,24) C 0 0.16 (362,24) C 0 11 0.19 (358,24) C 0 0.17 (307,24) C 0 0.17 (322,24) C 0 0.16 (362,24) C 0 0.16 (328,24) C 0 12 0.19 (358,24) C 0 0.17 (307,24) C 0 0.17 (322,24) C 0 0.16 (362,24) C 0 0.16 ( 92,24) C 0 13 0.15 (358,24) C 0 0.15 (307,24) C 0 0.14 (322,24) C 0 0.14 (328,24) C 0 0.14 (362,24) C 0 14 0.15 (358,24) C 0 0.15 (307,24) C 0 0.15 (322,24) C 0 0.14 (362,24) C 0 0.14 (328,24) C 0 15 0.15 (358,24) C 0 0.15 (307,24) C 0 0.15 (322,24) C 0 0.14 (362,24) C 0 0.14 (328,24) C 0 16 0.15 (358,24) C 0 0.15 (307,24) C 0 0.15 (322,24) C 0 0.14 (328,24) C 0 0.14 (362,24) C 0 17 0.15 (307,24) C 0 0.15 (358,24) C 0 0.14 (322,24) C 0 0.14 (357,24) C 0 0.14 (362,24) C 0
THE HIGHEST ANNUAL AVERAGE CONCENTRATIONS IN MICROGRAMS/M**3 INCLUDING AMBIENT BACKGROUND CONCENTRATIONS.
Receptor Maximum Ending Number Conc Day Hr Calm 1 0.10* (365,24) C 2 2 0.10 (365,24) C 2� CAL3QHCR (Dated: 04244)
DATE : 10/ 3/11 PAGE: 5 TIME : 6: 7:54
JOB: 300 Airport PM - 12 hour RUN: 101 Broadway Ahead and 101 Penissula Bac
THE HIGHEST ANNUAL AVERAGE CONCENTRATIONS IN MICROGRAMS/M**3 INCLUDING AMBIENT BACKGROUND CONCENTRATIONS.
Receptor Maximum Ending Number Conc Day Hr Calm 3 0.10 (365,24) C 2 4 0.10 (365,24) C 2 5 0.10 (365,24) C 2 6 0.09 (365,24) C 2 7 0.09 (365,24) C 2 8 0.08 (365,24) C 2 9 0.08 (365,24) C 2 10 0.07 (365,24) C 2 11 0.07 (365,24) C 2 12 0.07 (365,24) C 2 13 0.06 (365,24) C 2 14 0.06 (365,24) C 2 15 0.06 (365,24) C 2 16 0.06 (365,24) C 2 17 0.06 (365,24) C 2
Page 2
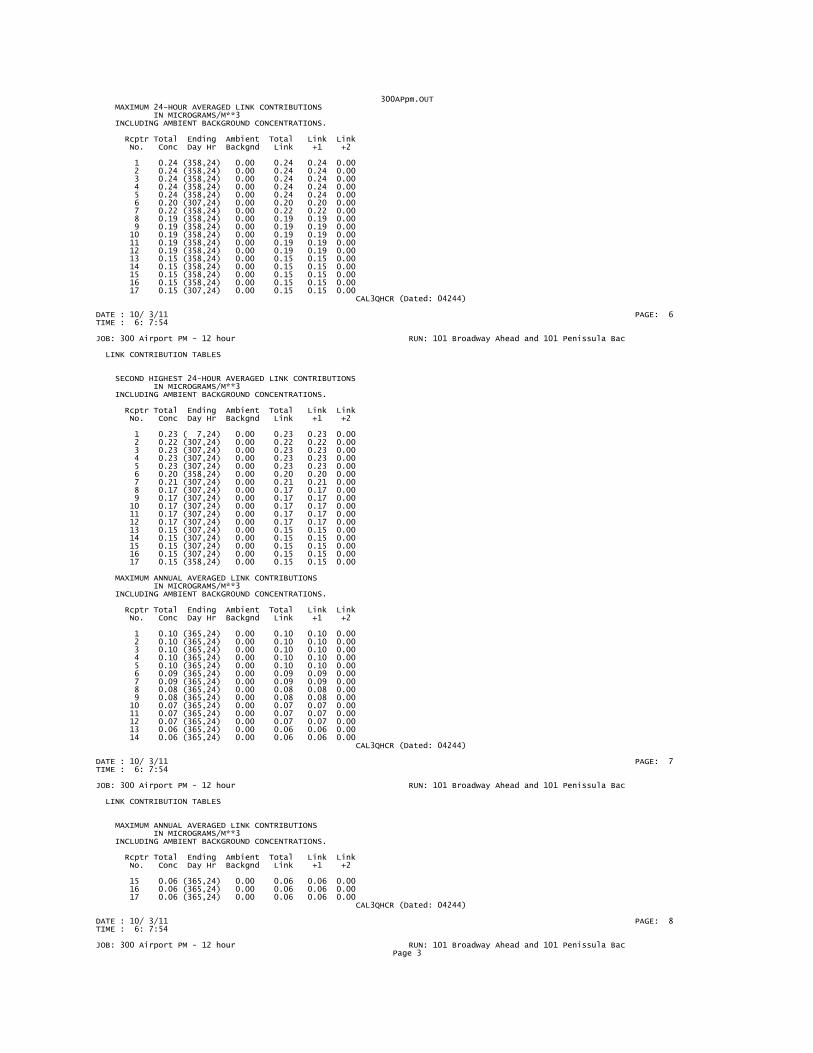
300APpm.OUT MAXIMUM 24-HOUR AVERAGED LINK CONTRIBUTIONS IN MICROGRAMS/M**3 INCLUDING AMBIENT BACKGROUND CONCENTRATIONS.
Rcptr Total Ending Ambient Total Link Link No. Conc Day Hr Backgnd Link +1 +2 1 0.24 (358,24) 0.00 0.24 0.24 0.00 2 0.24 (358,24) 0.00 0.24 0.24 0.00 3 0.24 (358,24) 0.00 0.24 0.24 0.00 4 0.24 (358,24) 0.00 0.24 0.24 0.00 5 0.24 (358,24) 0.00 0.24 0.24 0.00 6 0.20 (307,24) 0.00 0.20 0.20 0.00 7 0.22 (358,24) 0.00 0.22 0.22 0.00 8 0.19 (358,24) 0.00 0.19 0.19 0.00 9 0.19 (358,24) 0.00 0.19 0.19 0.00 10 0.19 (358,24) 0.00 0.19 0.19 0.00 11 0.19 (358,24) 0.00 0.19 0.19 0.00 12 0.19 (358,24) 0.00 0.19 0.19 0.00 13 0.15 (358,24) 0.00 0.15 0.15 0.00 14 0.15 (358,24) 0.00 0.15 0.15 0.00 15 0.15 (358,24) 0.00 0.15 0.15 0.00 16 0.15 (358,24) 0.00 0.15 0.15 0.00 17 0.15 (307,24) 0.00 0.15 0.15 0.00� CAL3QHCR (Dated: 04244)
DATE : 10/ 3/11 PAGE: 6 TIME : 6: 7:54
JOB: 300 Airport PM - 12 hour RUN: 101 Broadway Ahead and 101 Penissula Bac
LINK CONTRIBUTION TABLES
SECOND HIGHEST 24-HOUR AVERAGED LINK CONTRIBUTIONS IN MICROGRAMS/M**3 INCLUDING AMBIENT BACKGROUND CONCENTRATIONS.
Rcptr Total Ending Ambient Total Link Link No. Conc Day Hr Backgnd Link +1 +2 1 0.23 ( 7,24) 0.00 0.23 0.23 0.00 2 0.22 (307,24) 0.00 0.22 0.22 0.00 3 0.23 (307,24) 0.00 0.23 0.23 0.00 4 0.23 (307,24) 0.00 0.23 0.23 0.00 5 0.23 (307,24) 0.00 0.23 0.23 0.00 6 0.20 (358,24) 0.00 0.20 0.20 0.00 7 0.21 (307,24) 0.00 0.21 0.21 0.00 8 0.17 (307,24) 0.00 0.17 0.17 0.00 9 0.17 (307,24) 0.00 0.17 0.17 0.00 10 0.17 (307,24) 0.00 0.17 0.17 0.00 11 0.17 (307,24) 0.00 0.17 0.17 0.00 12 0.17 (307,24) 0.00 0.17 0.17 0.00 13 0.15 (307,24) 0.00 0.15 0.15 0.00 14 0.15 (307,24) 0.00 0.15 0.15 0.00 15 0.15 (307,24) 0.00 0.15 0.15 0.00 16 0.15 (307,24) 0.00 0.15 0.15 0.00 17 0.15 (358,24) 0.00 0.15 0.15 0.00
MAXIMUM ANNUAL AVERAGED LINK CONTRIBUTIONS IN MICROGRAMS/M**3 INCLUDING AMBIENT BACKGROUND CONCENTRATIONS.
Rcptr Total Ending Ambient Total Link Link No. Conc Day Hr Backgnd Link +1 +2 1 0.10 (365,24) 0.00 0.10 0.10 0.00 2 0.10 (365,24) 0.00 0.10 0.10 0.00 3 0.10 (365,24) 0.00 0.10 0.10 0.00 4 0.10 (365,24) 0.00 0.10 0.10 0.00 5 0.10 (365,24) 0.00 0.10 0.10 0.00 6 0.09 (365,24) 0.00 0.09 0.09 0.00 7 0.09 (365,24) 0.00 0.09 0.09 0.00 8 0.08 (365,24) 0.00 0.08 0.08 0.00 9 0.08 (365,24) 0.00 0.08 0.08 0.00 10 0.07 (365,24) 0.00 0.07 0.07 0.00 11 0.07 (365,24) 0.00 0.07 0.07 0.00 12 0.07 (365,24) 0.00 0.07 0.07 0.00 13 0.06 (365,24) 0.00 0.06 0.06 0.00 14 0.06 (365,24) 0.00 0.06 0.06 0.00� CAL3QHCR (Dated: 04244)
DATE : 10/ 3/11 PAGE: 7 TIME : 6: 7:54
JOB: 300 Airport PM - 12 hour RUN: 101 Broadway Ahead and 101 Penissula Bac
LINK CONTRIBUTION TABLES
MAXIMUM ANNUAL AVERAGED LINK CONTRIBUTIONS IN MICROGRAMS/M**3 INCLUDING AMBIENT BACKGROUND CONCENTRATIONS.
Rcptr Total Ending Ambient Total Link Link No. Conc Day Hr Backgnd Link +1 +2 15 0.06 (365,24) 0.00 0.06 0.06 0.00 16 0.06 (365,24) 0.00 0.06 0.06 0.00 17 0.06 (365,24) 0.00 0.06 0.06 0.00� CAL3QHCR (Dated: 04244)
DATE : 10/ 3/11 PAGE: 8 TIME : 6: 7:54
JOB: 300 Airport PM - 12 hour RUN: 101 Broadway Ahead and 101 Penissula BacPage 3

300APpm.OUT
CALM DURATION FREQUENCY
Hours of Frequency Consecutive of Calm Winds Occurrence (Julian day/hour ending) of Significant Occurrences
1 2 (164, 8)(345, 9) Program terminated normally
Page 4

300APtoc.OUT CAL3QHCR (Dated: 04244)
DATE : 10/ 3/11 PAGE: 1 TIME : 6: 9:52
JOB: 300 Airport TOC EX - 12 hour RUN: 101 Broadway Ahead
=================== General Information ===================
Run start date: 1/ 1/15 Julian: 1 end date: 12/31/15 Julian: 365
A Tier 2 approach was used for input data preparation.
The MODE flag has been set to P for calculating PM averages.
Ambient background concentrations are included in the averages below.
Site & Meteorological Constants ------------------------------- VS = 0.0 CM/S VD = 0.0 CM/S Z0 = 170. CM ATIM = 60.
Met. Sfc. Sta. Id & Yr = 6801 8 Upper Air Sta. Id & Yr = 6801 8
CAUTION: The input years for the Run and Meteorological data differ. The respective values are: 15 and 8.
Urban mixing heights were processed.
In 2015, Julian day 1 is a Thursday.
The patterns from the input file have been assigned as follows:
Pattern # 1 is assigned to Monday. Pattern # 1 is assigned to Tuesday. Pattern # 1 is assigned to Wednesday. Pattern # 1 is assigned to Thursday. Pattern # 1 is assigned to Friday. Pattern # 1 is assigned to Saturday. Pattern # 1 is assigned to Sunday.
Link Data Constants - (Variable data in *.LNK file) -------------------
LINK DESCRIPTION * LINK COORDINATES (FT) * LENGTH BRG TYPE H W NLANES * X1 Y1 X2 Y2 * (FT) (DEG) (FT) (FT) ------------------------*----------------------------------------*---------------------------------------- 1. 101 Broadway Ahead * -5000.0 0.0 1000.0 0.0 * 6000. 90. AG 0.0 160.0� CAL3QHCR (Dated: 04244)
DATE : 10/ 3/11 PAGE: 2 TIME : 6: 9:52
JOB: 300 Airport TOC EX - 12 hour RUN: 101 Broadway Ahead
Receptor Data -------------
* COORDINATES (FT) RECEPTOR * X Y Z -------------------------*------------------------------------- 1. REC 01 * -500.0 750.0 6.0 2. REC 02 * -250.0 750.0 6.0 3. REC 03 * -50.0 750.0 6.0 4. REC 04 * 100.0 750.0 6.0 5. REC 05 * 300.0 750.0 6.0 6. REC 06 * -50.0 875.0 6.0 7. REC 07 * 100.0 810.0 6.0 8. REC 08 * -500.0 993.0 6.0 9. REC 09 * -250.0 993.0 6.0 10. REC 10 * -50.0 993.0 6.0 11. REC 11 * 100.0 993.0 6.0 12. REC 12 * 300.0 993.0 6.0 13. REC 13 * -500.0 1236.0 6.0 14. REC 14 * -250.0 1236.0 6.0 15. REC 15 * -50.0 1236.0 6.0 16. REC 16 * 100.0 1236.0 6.0 17. REC 17 * 300.0 1236.0 6.0
Model Results -------------
Remarks : In search of the wind direction corresponding to the maximum concentration, only the first direction, of the directions with the same maximum concentrations, is indicated as the maximum.
* MAXIMUM HOURLY CONCENTRATIONS WITH ANY AMBIENT BACKGROUND CONCENTRATIONS (BKG) ADDED * (MICROGRAMS/M**3) * REC1 REC2 REC3 REC4 REC5 REC6 REC7 REC8 REC9 REC10 --------*-------------------------------------------------------------------------------- MAX+BKG * 19.8 19.9 20.0 20.0 20.1 17.6 18.8 15.7 15.7 15.8 - BKG * 0.0 0.0 0.0 0.0 0.0 0.0 0.0 0.0 0.0 0.0 --------*-------------------------------------------------------------------------------- MAX * 19.8 19.9 20.0 20.0 20.1 17.6 18.8 15.7 15.7 15.8 WIND DIR* 244 244 244 244 244 244 244 240 240 240 JULIAN * 57 57 57 57 57 57 57 35 35 35 HOUR * 8 8 8 8 8 8 8 8 8 8
� CAL3QHCR (Dated: 04244)
Page 1

300APtoc.OUT DATE : 10/ 3/11 PAGE: 3 TIME : 6: 9:52
JOB: 300 Airport TOC EX - 12 hour RUN: 101 Broadway Ahead
* MAXIMUM HOURLY CONCENTRATIONS WITH ANY AMBIENT BACKGROUND CONCENTRATIONS (BKG) ADDED * (MICROGRAMS/M**3) * REC11 REC12 REC13 REC14 REC15 REC16 REC17 --------*-------------------------------------------------------- MAX+BKG * 15.9 15.9 13.0 13.1 13.1 13.2 13.2 - BKG * 0.0 0.0 0.0 0.0 0.0 0.0 0.0 --------*-------------------------------------------------------- MAX * 15.9 15.9 13.0 13.1 13.1 13.2 13.2 WIND DIR* 244 244 240 240 240 240 240 JULIAN * 57 57 35 35 35 35 35 HOUR * 8 8 8 8 8 8 8
THE HIGHEST CONCENTRATION OF 20.10 UG/M**3 OCCURRED AT RECEPTOR REC5 .
� CAL3QHCR (Dated: 04244)
DATE : 10/ 3/11 PAGE: 4 TIME : 6: 9:55
JOB: 300 Airport TOC EX - 12 hour RUN: 101 Broadway Ahead
============== Output Section ==============
NOTES PERTAINING TO THE REPORT
1. THE HIGHEST AVERAGE IN EACH OF THE FIRST TWO COLUMNS OF EACH TABLE BELOW ARE SUFFIXED BY AN ASTERISK (*). FOR PM OUTPUT, THERE IS ONLY ONE COLUMN AND ASTERISK FOR THE ANNUAL AVERAGE/PERIOD OF CONCERN TABLE.
2. THE NUMBERS IN PARENTHESES ARE THE JULIAN DAY AND ENDING HOUR FOR THE PRECEDING AVERAGE.
3. THE NUMBER OF CALM HOURS USED IN PRODUCING EACH AVERAGE ARE PREFIXED BY A C.
PRIMARY AND SECONDARY AVERAGES.
FIVE HIGHEST 24-HOUR END-TO-END AVERAGE CONCENTRATIONS IN MICROGRAMS/M**3 INCLUDING AMBIENT BACKGROUND CONCENTRATIONS.
Highest Second Highest Third Highest Fourth Highest Fifth Highest Rcptr Ending Ending Ending Ending Ending No. Conc Day Hr Calm Conc Day Hr Calm Conc Day Hr Calm Conc Day Hr Calm Conc Day Hr Calm
1 3.94*( 29,24) C 0 3.87*(359,24) C 0 3.66 (356,24) C 0 3.59 (358,24) C 0 3.53 (307,24) C 0 2 3.88 ( 29,24) C 0 3.79 (359,24) C 0 3.58 (358,24) C 0 3.54 (307,24) C 0 3.42 (356,24) C 0 3 3.78 ( 29,24) C 0 3.69 (359,24) C 0 3.57 (358,24) C 0 3.54 (307,24) C 0 3.37 (350,24) C 0 4 3.65 ( 29,24) C 0 3.58 (359,24) C 0 3.54 (307,24) C 0 3.54 (358,24) C 0 3.37 (350,24) C 0 5 3.55 (307,24) C 0 3.47 (358,24) C 0 3.35 (350,24) C 0 3.34 (359,24) C 0 3.30 ( 29,24) C 0 6 3.15 ( 29,24) C 0 3.14 (359,24) C 0 3.12 (358,24) C 0 3.09 (307,24) C 0 2.94 (350,24) C 0 7 3.31 ( 29,24) C 0 3.31 (358,24) C 0 3.30 (307,24) C 0 3.30 (359,24) C 0 3.15 (350,24) C 0 8 2.99 ( 29,24) C 0 2.96 (359,24) C 0 2.85 (358,24) C 0 2.75 (307,24) C 0 2.65 (356,24) C 0 9 2.86 ( 29,24) C 0 2.86 (359,24) C 0 2.83 (358,24) C 0 2.76 (307,24) C 0 2.61 (350,24) C 0 10 2.80 (358,24) C 0 2.77 (307,24) C 0 2.74 (359,24) C 0 2.68 ( 29,24) C 0 2.61 (350,24) C 0 11 2.77 (307,24) C 0 2.76 (358,24) C 0 2.63 (359,24) C 0 2.60 (350,24) C 0 2.54 (357,24) C 0 12 2.78 (307,24) C 0 2.71 (358,24) C 0 2.58 (350,24) C 0 2.49 (357,24) C 0 2.40 ( 48,24) C 0 13 2.41 (359,24) C 0 2.36 (358,24) C 0 2.33 ( 29,24) C 0 2.25 (307,24) C 0 2.11 (350,24) C 0 14 2.33 (358,24) C 0 2.29 (359,24) C 0 2.26 (307,24) C 0 2.15 ( 29,24) C 0 2.12 (350,24) C 0 15 2.30 (358,24) C 0 2.28 (307,24) C 0 2.15 (359,24) C 0 2.11 (350,24) C 0 2.06 (357,24) C 0 16 2.28 (307,24) C 0 2.27 (358,24) C 0 2.10 (350,24) C 0 2.04 (357,24) C 0 2.01 ( 48,24) C 0 17 2.28 (307,24) C 0 2.24 (358,24) C 0 2.08 (350,24) C 0 2.03 (357,24) C 0 2.01 ( 48,24) C 0
THE HIGHEST ANNUAL AVERAGE CONCENTRATIONS IN MICROGRAMS/M**3 INCLUDING AMBIENT BACKGROUND CONCENTRATIONS.
Receptor Maximum Ending Number Conc Day Hr Calm 1 1.22* (365,24) C 2 2 1.21 (365,24) C 2� CAL3QHCR (Dated: 04244)
DATE : 10/ 3/11 PAGE: 5 TIME : 6: 9:55
JOB: 300 Airport TOC EX - 12 hour RUN: 101 Broadway Ahead
THE HIGHEST ANNUAL AVERAGE CONCENTRATIONS IN MICROGRAMS/M**3 INCLUDING AMBIENT BACKGROUND CONCENTRATIONS.
Receptor Maximum Ending Number Conc Day Hr Calm 3 1.19 (365,24) C 2 4 1.17 (365,24) C 2 5 1.14 (365,24) C 2 6 1.01 (365,24) C 2 7 1.08 (365,24) C 2 8 0.91 (365,24) C 2 9 0.89 (365,24) C 2 10 0.87 (365,24) C 2 11 0.86 (365,24) C 2 12 0.83 (365,24) C 2 13 0.71 (365,24) C 2 14 0.69 (365,24) C 2 15 0.68 (365,24) C 2 16 0.66 (365,24) C 2 17 0.64 (365,24) C 2
MAXIMUM 24-HOUR AVERAGED LINK CONTRIBUTIONSPage 2

300APtoc.OUT IN MICROGRAMS/M**3 INCLUDING AMBIENT BACKGROUND CONCENTRATIONS.
Rcptr Total Ending Ambient Total Link No. Conc Day Hr Backgnd Link +1 1 3.94 ( 29,24) 0.00 3.94 3.94 2 3.88 ( 29,24) 0.00 3.88 3.88 3 3.78 ( 29,24) 0.00 3.78 3.78 4 3.65 ( 29,24) 0.00 3.65 3.65 5 3.55 (307,24) 0.00 3.55 3.55 6 3.15 ( 29,24) 0.00 3.15 3.15 7 3.31 ( 29,24) 0.00 3.31 3.31 8 2.99 ( 29,24) 0.00 2.99 2.99 9 2.86 ( 29,24) 0.00 2.86 2.86 10 2.80 (358,24) 0.00 2.80 2.80 11 2.77 (307,24) 0.00 2.77 2.77 12 2.78 (307,24) 0.00 2.78 2.78 13 2.41 (359,24) 0.00 2.41 2.41 14 2.33 (358,24) 0.00 2.33 2.33 15 2.30 (358,24) 0.00 2.30 2.30 16 2.28 (307,24) 0.00 2.28 2.28 17 2.28 (307,24) 0.00 2.28 2.28� CAL3QHCR (Dated: 04244)
DATE : 10/ 3/11 PAGE: 6 TIME : 6: 9:55
JOB: 300 Airport TOC EX - 12 hour RUN: 101 Broadway Ahead
LINK CONTRIBUTION TABLES
SECOND HIGHEST 24-HOUR AVERAGED LINK CONTRIBUTIONS IN MICROGRAMS/M**3 INCLUDING AMBIENT BACKGROUND CONCENTRATIONS.
Rcptr Total Ending Ambient Total Link No. Conc Day Hr Backgnd Link +1 1 3.87 (359,24) 0.00 3.87 3.87 2 3.79 (359,24) 0.00 3.79 3.79 3 3.69 (359,24) 0.00 3.69 3.69 4 3.58 (359,24) 0.00 3.58 3.58 5 3.47 (358,24) 0.00 3.47 3.47 6 3.14 (359,24) 0.00 3.14 3.14 7 3.31 (358,24) 0.00 3.31 3.31 8 2.96 (359,24) 0.00 2.96 2.96 9 2.86 (359,24) 0.00 2.86 2.86 10 2.77 (307,24) 0.00 2.77 2.77 11 2.76 (358,24) 0.00 2.76 2.76 12 2.71 (358,24) 0.00 2.71 2.71 13 2.36 (358,24) 0.00 2.36 2.36 14 2.29 (359,24) 0.00 2.29 2.29 15 2.28 (307,24) 0.00 2.28 2.28 16 2.27 (358,24) 0.00 2.27 2.27 17 2.24 (358,24) 0.00 2.24 2.24
MAXIMUM ANNUAL AVERAGED LINK CONTRIBUTIONS IN MICROGRAMS/M**3 INCLUDING AMBIENT BACKGROUND CONCENTRATIONS.
Rcptr Total Ending Ambient Total Link No. Conc Day Hr Backgnd Link +1 1 1.22 (365,24) 0.00 1.22 1.22 2 1.21 (365,24) 0.00 1.21 1.21 3 1.19 (365,24) 0.00 1.19 1.19 4 1.17 (365,24) 0.00 1.17 1.17 5 1.14 (365,24) 0.00 1.14 1.14 6 1.01 (365,24) 0.00 1.01 1.01 7 1.08 (365,24) 0.00 1.08 1.08 8 0.91 (365,24) 0.00 0.91 0.91 9 0.89 (365,24) 0.00 0.89 0.89 10 0.87 (365,24) 0.00 0.87 0.87 11 0.86 (365,24) 0.00 0.86 0.86 12 0.83 (365,24) 0.00 0.83 0.83 13 0.71 (365,24) 0.00 0.71 0.71 14 0.69 (365,24) 0.00 0.69 0.69� CAL3QHCR (Dated: 04244)
DATE : 10/ 3/11 PAGE: 7 TIME : 6: 9:55
JOB: 300 Airport TOC EX - 12 hour RUN: 101 Broadway Ahead
LINK CONTRIBUTION TABLES
MAXIMUM ANNUAL AVERAGED LINK CONTRIBUTIONS IN MICROGRAMS/M**3 INCLUDING AMBIENT BACKGROUND CONCENTRATIONS.
Rcptr Total Ending Ambient Total Link No. Conc Day Hr Backgnd Link +1 15 0.68 (365,24) 0.00 0.68 0.68 16 0.66 (365,24) 0.00 0.66 0.66 17 0.64 (365,24) 0.00 0.64 0.64� CAL3QHCR (Dated: 04244)
DATE : 10/ 3/11 PAGE: 8 TIME : 6: 9:55
JOB: 300 Airport TOC EX - 12 hour RUN: 101 Broadway Ahead
Page 3

300APtoc.OUT
CALM DURATION FREQUENCY
Hours of Frequency Consecutive of Calm Winds Occurrence (Julian day/hour ending) of Significant Occurrences
1 2 (164, 8)(345, 9) Program terminated normally
Page 4

300APrun.OUT CAL3QHCR (Dated: 04244)
DATE : 10/ 3/11 PAGE: 1 TIME : 6:15:15
JOB: 300 Airport TOC Run -12 hour RUN: 101 Broadway Ahead and 101 Penissula Bac
=================== General Information ===================
Run start date: 1/ 1/15 Julian: 1 end date: 12/31/15 Julian: 365
A Tier 2 approach was used for input data preparation.
The MODE flag has been set to P for calculating PM averages.
Ambient background concentrations are included in the averages below.
Site & Meteorological Constants ------------------------------- VS = 0.0 CM/S VD = 0.0 CM/S Z0 = 170. CM ATIM = 60.
Met. Sfc. Sta. Id & Yr = 6801 8 Upper Air Sta. Id & Yr = 6801 8
CAUTION: The input years for the Run and Meteorological data differ. The respective values are: 15 and 8.
Urban mixing heights were processed.
In 2015, Julian day 1 is a Thursday.
The patterns from the input file have been assigned as follows:
Pattern # 1 is assigned to Monday. Pattern # 1 is assigned to Tuesday. Pattern # 1 is assigned to Wednesday. Pattern # 1 is assigned to Thursday. Pattern # 1 is assigned to Friday. Pattern # 1 is assigned to Saturday. Pattern # 1 is assigned to Sunday.
Link Data Constants - (Variable data in *.LNK file) -------------------
LINK DESCRIPTION * LINK COORDINATES (FT) * LENGTH BRG TYPE H W NLANES * X1 Y1 X2 Y2 * (FT) (DEG) (FT) (FT) ------------------------*----------------------------------------*---------------------------------------- 2. 101 Broadway Ahead * -5000.0 0.0 1000.0 0.0 * 6000. 90. AG 0.0 160.0 24. 101 Penissula Back * 1000.0 0.0 5000.0 -4100.0 * 5728. 136. AG 0.0 160.0� CAL3QHCR (Dated: 04244)
DATE : 10/ 3/11 PAGE: 2 TIME : 6:15:15
JOB: 300 Airport TOC Run -12 hour RUN: 101 Broadway Ahead and 101 Penissula Bac
Receptor Data -------------
* COORDINATES (FT) RECEPTOR * X Y Z -------------------------*------------------------------------- 1. REC 01 * -500.0 750.0 6.0 2. REC 02 * -250.0 750.0 6.0 3. REC 03 * -50.0 750.0 6.0 4. REC 04 * 100.0 750.0 6.0 5. REC 05 * 300.0 750.0 6.0 6. REC 06 * -50.0 875.0 6.0 7. REC 07 * 100.0 810.0 6.0 8. REC 08 * -500.0 993.0 6.0 9. REC 09 * -250.0 993.0 6.0 10. REC 10 * -50.0 993.0 6.0 11. REC 11 * 100.0 993.0 6.0 12. REC 12 * 300.0 993.0 6.0 13. REC 13 * -500.0 1236.0 6.0 14. REC 14 * -250.0 1236.0 6.0 15. REC 15 * -50.0 1236.0 6.0 16. REC 16 * 100.0 1236.0 6.0 17. REC 17 * 300.0 1236.0 6.0
Model Results -------------
Remarks : In search of the wind direction corresponding to the maximum concentration, only the first direction, of the directions with the same maximum concentrations, is indicated as the maximum.
* MAXIMUM HOURLY CONCENTRATIONS WITH ANY AMBIENT BACKGROUND CONCENTRATIONS (BKG) ADDED * (MICROGRAMS/M**3) * REC1 REC2 REC3 REC4 REC5 REC6 REC7 REC8 REC9 REC10 --------*-------------------------------------------------------------------------------- MAX+BKG * 10.9 10.9 11.0 11.0 11.0 9.6 10.3 8.6 8.6 8.7 - BKG * 0.0 0.0 0.0 0.0 0.0 0.0 0.0 0.0 0.0 0.0 --------*-------------------------------------------------------------------------------- MAX * 10.9 10.9 11.0 11.0 11.0 9.6 10.3 8.6 8.6 8.7 WIND DIR* 244 244 245 244 244 244 244 243 244 243 JULIAN * 7 7 322 7 7 7 7 11 7 11 HOUR * 9 9 21 9 9 9 9 9 9 9
� CAL3QHCR (Dated: 04244)Page 1

300APrun.OUT
DATE : 10/ 3/11 PAGE: 3 TIME : 6:15:15
JOB: 300 Airport TOC Run -12 hour RUN: 101 Broadway Ahead and 101 Penissula Bac
* MAXIMUM HOURLY CONCENTRATIONS WITH ANY AMBIENT BACKGROUND CONCENTRATIONS (BKG) ADDED * (MICROGRAMS/M**3) * REC11 REC12 REC13 REC14 REC15 REC16 REC17 --------*-------------------------------------------------------- MAX+BKG * 8.7 8.7 7.1 7.2 7.2 7.2 7.2 - BKG * 0.0 0.0 0.0 0.0 0.0 0.0 0.0 --------*-------------------------------------------------------- MAX * 8.7 8.7 7.1 7.2 7.2 7.2 7.2 WIND DIR* 244 244 237 239 237 243 243 JULIAN * 7 7 310 335 310 11 11 HOUR * 9 9 21 21 21 9 9
THE HIGHEST CONCENTRATION OF 11.00 UG/M**3 OCCURRED AT RECEPTOR REC4 .
� CAL3QHCR (Dated: 04244)
DATE : 10/ 3/11 PAGE: 4 TIME : 6:15:18
JOB: 300 Airport TOC Run -12 hour RUN: 101 Broadway Ahead and 101 Penissula Bac
============== Output Section ==============
NOTES PERTAINING TO THE REPORT
1. THE HIGHEST AVERAGE IN EACH OF THE FIRST TWO COLUMNS OF EACH TABLE BELOW ARE SUFFIXED BY AN ASTERISK (*). FOR PM OUTPUT, THERE IS ONLY ONE COLUMN AND ASTERISK FOR THE ANNUAL AVERAGE/PERIOD OF CONCERN TABLE.
2. THE NUMBERS IN PARENTHESES ARE THE JULIAN DAY AND ENDING HOUR FOR THE PRECEDING AVERAGE.
3. THE NUMBER OF CALM HOURS USED IN PRODUCING EACH AVERAGE ARE PREFIXED BY A C.
PRIMARY AND SECONDARY AVERAGES.
FIVE HIGHEST 24-HOUR END-TO-END AVERAGE CONCENTRATIONS IN MICROGRAMS/M**3 INCLUDING AMBIENT BACKGROUND CONCENTRATIONS.
Highest Second Highest Third Highest Fourth Highest Fifth Highest Rcptr Ending Ending Ending Ending Ending No. Conc Day Hr Calm Conc Day Hr Calm Conc Day Hr Calm Conc Day Hr Calm Conc Day Hr Calm
1 3.42*(358,24) C 0 3.21*( 7,24) C 0 3.09 (322,24) C 0 3.03 (364,24) C 0 3.02 (362,24) C 0 2 3.42 (358,24) C 0 3.17 ( 7,24) C 0 3.09 (322,24) C 0 3.05 (364,24) C 0 3.02 (362,24) C 0 3 3.42 (358,24) C 0 3.12 ( 7,24) C 0 3.10 (322,24) C 0 3.05 (364,24) C 0 3.02 (362,24) C 0 4 3.42 (358,24) C 0 3.10 (322,24) C 0 3.05 (364,24) C 0 3.04 ( 7,24) C 0 3.02 (362,24) C 0 5 3.40 (358,24) C 0 3.10 (322,24) C 0 3.02 (307,24) C 0 3.02 (357,24) C 0 3.01 (362,24) C 0 6 3.02 (358,24) C 0 2.73 (322,24) C 0 2.69 (307,24) C 0 2.68 ( 7,24) C 0 2.68 (362,24) C 0 7 3.21 (358,24) C 0 2.91 (322,24) C 0 2.85 (362,24) C 0 2.85 (364,24) C 0 2.84 (307,24) C 0 8 2.73 (358,24) C 0 2.54 ( 7,24) C 0 2.47 (322,24) C 0 2.43 (362,24) C 0 2.43 (307,24) C 0 9 2.73 (358,24) C 0 2.47 (322,24) C 0 2.46 ( 7,24) C 0 2.44 (362,24) C 0 2.43 (307,24) C 0 10 2.73 (358,24) C 0 2.48 (322,24) C 0 2.44 (307,24) C 0 2.43 (362,24) C 0 2.40 (357,24) C 0 11 2.73 (358,24) C 0 2.48 (322,24) C 0 2.44 (307,24) C 0 2.43 (362,24) C 0 2.41 (357,24) C 0 12 2.68 (358,24) C 0 2.48 (322,24) C 0 2.44 (307,24) C 0 2.41 (357,24) C 0 2.39 (362,24) C 0 13 2.30 (358,24) C 0 2.06 (322,24) C 0 2.05 (362,24) C 0 2.05 (307,24) C 0 2.04 ( 7,24) C 0 14 2.30 (358,24) C 0 2.07 (322,24) C 0 2.06 (362,24) C 0 2.05 (307,24) C 0 2.00 (357,24) C 0 15 2.29 (358,24) C 0 2.08 (322,24) C 0 2.05 (307,24) C 0 2.05 (362,24) C 0 2.01 (357,24) C 0 16 2.26 (358,24) C 0 2.08 (322,24) C 0 2.05 (307,24) C 0 2.02 (362,24) C 0 2.01 (357,24) C 0 17 2.19 (358,24) C 0 2.08 (322,24) C 0 2.06 (307,24) C 0 1.99 (357,24) C 0 1.96 (335,24) C 0
THE HIGHEST ANNUAL AVERAGE CONCENTRATIONS IN MICROGRAMS/M**3 INCLUDING AMBIENT BACKGROUND CONCENTRATIONS.
Receptor Maximum Ending Number Conc Day Hr Calm 1 1.37* (365,24) C 2 2 1.37 (365,24) C 2� CAL3QHCR (Dated: 04244)
DATE : 10/ 3/11 PAGE: 5 TIME : 6:15:18
JOB: 300 Airport TOC Run -12 hour RUN: 101 Broadway Ahead and 101 Penissula Bac
THE HIGHEST ANNUAL AVERAGE CONCENTRATIONS IN MICROGRAMS/M**3 INCLUDING AMBIENT BACKGROUND CONCENTRATIONS.
Receptor Maximum Ending Number Conc Day Hr Calm 3 1.36 (365,24) C 2 4 1.36 (365,24) C 2 5 1.34 (365,24) C 2 6 1.17 (365,24) C 2 7 1.26 (365,24) C 2 8 1.04 (365,24) C 2 9 1.04 (365,24) C 2 10 1.03 (365,24) C 2 11 1.02 (365,24) C 2 12 1.00 (365,24) C 2 13 0.83 (365,24) C 2 14 0.83 (365,24) C 2 15 0.82 (365,24) C 2 16 0.81 (365,24) C 2 17 0.80 (365,24) C 2
Page 2

300APrun.OUT MAXIMUM 24-HOUR AVERAGED LINK CONTRIBUTIONS IN MICROGRAMS/M**3 INCLUDING AMBIENT BACKGROUND CONCENTRATIONS.
Rcptr Total Ending Ambient Total Link Link No. Conc Day Hr Backgnd Link +1 +2 1 3.42 (358,24) 0.00 3.42 3.42 0.00 2 3.42 (358,24) 0.00 3.42 3.42 0.00 3 3.42 (358,24) 0.00 3.42 3.42 0.00 4 3.42 (358,24) 0.00 3.42 3.42 0.00 5 3.40 (358,24) 0.00 3.40 3.40 0.00 6 3.02 (358,24) 0.00 3.02 3.02 0.00 7 3.21 (358,24) 0.00 3.21 3.21 0.00 8 2.73 (358,24) 0.00 2.73 2.73 0.00 9 2.73 (358,24) 0.00 2.73 2.73 0.00 10 2.73 (358,24) 0.00 2.73 2.73 0.00 11 2.73 (358,24) 0.00 2.73 2.73 0.00 12 2.68 (358,24) 0.00 2.68 2.68 0.00 13 2.30 (358,24) 0.00 2.30 2.30 0.00 14 2.30 (358,24) 0.00 2.30 2.30 0.00 15 2.29 (358,24) 0.00 2.29 2.29 0.00 16 2.26 (358,24) 0.00 2.26 2.26 0.00 17 2.19 (358,24) 0.00 2.19 2.19 0.00� CAL3QHCR (Dated: 04244)
DATE : 10/ 3/11 PAGE: 6 TIME : 6:15:18
JOB: 300 Airport TOC Run -12 hour RUN: 101 Broadway Ahead and 101 Penissula Bac
LINK CONTRIBUTION TABLES
SECOND HIGHEST 24-HOUR AVERAGED LINK CONTRIBUTIONS IN MICROGRAMS/M**3 INCLUDING AMBIENT BACKGROUND CONCENTRATIONS.
Rcptr Total Ending Ambient Total Link Link No. Conc Day Hr Backgnd Link +1 +2 1 3.21 ( 7,24) 0.00 3.21 3.21 0.00 2 3.17 ( 7,24) 0.00 3.17 3.17 0.00 3 3.12 ( 7,24) 0.00 3.12 3.12 0.00 4 3.10 (322,24) 0.00 3.10 3.10 0.00 5 3.10 (322,24) 0.00 3.10 3.10 0.00 6 2.73 (322,24) 0.00 2.73 2.73 0.00 7 2.91 (322,24) 0.00 2.91 2.91 0.00 8 2.54 ( 7,24) 0.00 2.54 2.54 0.00 9 2.47 (322,24) 0.00 2.47 2.47 0.00 10 2.48 (322,24) 0.00 2.48 2.48 0.00 11 2.48 (322,24) 0.00 2.48 2.48 0.00 12 2.48 (322,24) 0.00 2.48 2.48 0.00 13 2.06 (322,24) 0.00 2.06 2.06 0.00 14 2.07 (322,24) 0.00 2.07 2.07 0.00 15 2.08 (322,24) 0.00 2.08 2.08 0.00 16 2.08 (322,24) 0.00 2.08 2.08 0.00 17 2.08 (322,24) 0.00 2.08 2.08 0.00
MAXIMUM ANNUAL AVERAGED LINK CONTRIBUTIONS IN MICROGRAMS/M**3 INCLUDING AMBIENT BACKGROUND CONCENTRATIONS.
Rcptr Total Ending Ambient Total Link Link No. Conc Day Hr Backgnd Link +1 +2 1 1.37 (365,24) 0.00 1.37 1.37 0.00 2 1.37 (365,24) 0.00 1.37 1.37 0.00 3 1.36 (365,24) 0.00 1.36 1.36 0.00 4 1.36 (365,24) 0.00 1.36 1.36 0.00 5 1.34 (365,24) 0.00 1.34 1.34 0.00 6 1.17 (365,24) 0.00 1.17 1.17 0.00 7 1.26 (365,24) 0.00 1.26 1.26 0.00 8 1.04 (365,24) 0.00 1.04 1.04 0.00 9 1.04 (365,24) 0.00 1.04 1.04 0.00 10 1.03 (365,24) 0.00 1.03 1.03 0.00 11 1.02 (365,24) 0.00 1.02 1.02 0.00 12 1.00 (365,24) 0.00 1.00 1.00 0.00 13 0.83 (365,24) 0.00 0.83 0.83 0.00 14 0.83 (365,24) 0.00 0.83 0.83 0.00� CAL3QHCR (Dated: 04244)
DATE : 10/ 3/11 PAGE: 7 TIME : 6:15:18
JOB: 300 Airport TOC Run -12 hour RUN: 101 Broadway Ahead and 101 Penissula Bac
LINK CONTRIBUTION TABLES
MAXIMUM ANNUAL AVERAGED LINK CONTRIBUTIONS IN MICROGRAMS/M**3 INCLUDING AMBIENT BACKGROUND CONCENTRATIONS.
Rcptr Total Ending Ambient Total Link Link No. Conc Day Hr Backgnd Link +1 +2 15 0.82 (365,24) 0.00 0.82 0.82 0.00 16 0.81 (365,24) 0.00 0.81 0.81 0.00 17 0.80 (365,24) 0.00 0.80 0.80 0.00� CAL3QHCR (Dated: 04244)
DATE : 10/ 3/11 PAGE: 8 TIME : 6:15:18
JOB: 300 Airport TOC Run -12 hour RUN: 101 Broadway Ahead and 101 Penissula BacPage 3

300APrun.OUT
CALM DURATION FREQUENCY
Hours of Frequency Consecutive of Calm Winds Occurrence (Julian day/hour ending) of Significant Occurrences
1 2 (164, 8)(345, 9) Program terminated normally
Page 4


![[COMPENDIUM OF HIT 300 DESIGN & INNOVATION … 300 Compedium 2016.pdfdesign & innovation projects abstracts 2015-2016] ... therefore this report ... design of a spinning pack for the](https://img.pdfslide.us/doc/110x75/5b0839d17f8b9a93738c0571/compendium-of-hit-300-design-innovation-300-compedium-2016pdfdesign-innovation.jpg)