Embed Size (px)
Citation preview
HEALTH RISK ASSESSMENT FOR THE LAND APPLICATION OF BIOSOLIDS IN ANKARA, TURKEY
A THESIS SUBMITTED TO THE GRADUATE SCHOOL OF NATURAL APPLIED SCIENCES
OF MIDDLE EAST TECHNICAL UNIVERSITY
BY
ECE KENDIR
IN PARTIAL FULFILLMENT OF THE REQUIREMENTS FOR
THE DEGREE OF MASTER OF SCIENCE IN
ENVIRONMENTAL ENGINEERING
JANUARY 2013

iii
Approval of the thesis:
HEALTH RISK ASSESSMENT FOR THE LAND APPLICATION OF BIOLSOLIDS IN ANKARA TURKEY: INGESTION PATHWAY
submitted by ECE KENDİR in partial fulfillment of the requirements for the degree of Master of Science in Environmental Engineering Department, Middle East Technical University by, Prof. Dr. Canan Özgen _____________________ Dean, Graduate School of Natural and Applied Sciences Prof. Dr. F. Dilek Sanin _____________________ Head of Department, Environmental Engineering Prof. Dr. F. Dilek Sanin _____________________ Supervisor, Environmental Engineering Dept., METU Assoc. Prof. Dr. Elçin Kentel _____________________ Co-Supervisor, Civil Engineering Dept., METU Examining Committee Members: Assoc. Prof. Dr. Ayşegül Aksoy _____________________ Environmental Engineering Dept., METU Prof.Dr. F. Dilek Sanin _____________________ Environmental Engineering Dept., METU Assoc. Prof. Dr. Elçin Kentel _____________________ Civil Engineering Dept., METU Prof.Dr. Ayten Namlı _____________________ Faculty of Agriculture, Ankara University Assist.Prof.Dr. Emre Alp _____________________ Environmental Engineering Dept., METU Date: 24.01. 2013
iv
I hereby declare that all information in this document has been obtained and presented in accordance with academic rules and ethical conduct. I also declare that, as required by these rules and conduct, I have fully cited and referenced all material and results that are not original to this work.
Name, Last Name: Ece Kendir Signature:
v
ABSTRACT
HEALTH RISK ASSESSMENT FOR THE LAND APPLICATION OF BIOSOLIDS IN ANKARA, TURKEY: INGESTION PATHWAY
Kendir, Ece M.Sc., Department of Environmental Engineering
Supervisor: Prof. Dr. F. Dilek Sanin Co-Supervisor: Assoc. Prof. Dr. Elçin Kentel
January, 2013, 75 pages
Biosolids are valuable products which can be beneficially used in land application. However, the possibility of serious health effects on humans due to several pollutants in biosolids creates a big concern. To address this issue, risk-based methodologies are commonly used to evaluate health effects associated with the land application of biosolids. This study aims to investigate the health risks associated with ingestion of biosolids or soil mixed with biosolids by a child. This study is the first health risk assessment study in Turkey for land application of biosolids. Monthly sludge samples taken from Ankara Central Wastewater Treatment Plant (ACWWTP) in 2012 were analyzed for seven heavy metals (Cd, Cr, Cu, Hg, Ni, Pb, and Zn), and two organic contaminants (PCB and NPE) concentrations. To calculate health risks, methodologies developed by U.S. Environmental Protection Agency (U.S. EPA) and French National Institute for Industrial Environment and Risks (INERIS) were used. With both methods, cancer and non-cancer risks for the ingestion by a child pathway were determined and found to be below the acceptable cancer and non-cancer risk levels suggested by U.S. EPA and INERIS. Additionally, same health risk calculations were conducted for sludge and soil limit values provided in Turkish Regulation for the Use of Sewage Sludge in Agriculture (2010) to determine what the maximum health risk would be for the worst case scenario in Turkey. According to the results, even if the concentrations are at the maximum possible regulatory levels, the health risks are still low. Keywords: Biosolids, Land Application, Health Risk, Ingestion Pathway
vi
ÖZ
ANKARA’DA (TÜRK İYE) BİYOKATILARIN TARIM UYGULAMALARI IÇIN SA ĞLIK RİSKİ DEĞERLENDİRMESİ: YUTMA YOLU
Kendir, Ece Yüksek Lisans, Çevre Mühendisliği Bölümü
Tez Yöneticisi: Prof. Dr. F. Dilek Sanin Ortak Tez Yöneticisi: Doç. Dr. Elçin Kentel
Ocak, 2013, 75 sayfa
Biyokatılar tarım alanlarında yararlı bir şekilde kullanılabilen değerli ürünlerdir. Ancak, birtakım kirleticilerin biyokatılarda bulunma olasılığı nedeniyle, bu kirleticilerin insan sağlığına ciddi etkileri büyük bir endişe teşkil etmektedir. Bu sorunu ele almak amacıyla, biyokatıların tarımsal kullanımıyla ili şkili sağlık etkilerini değerlendirmek için risk bazlı yöntemler yaygın bir şekilde kullanılmaktadır. Bu çalışma biyokatıların ya da biyokatılarla karıştırılan toprağın çocuk tarafından yutulmasıyla ilişkili sağlık risklerini incelemeyi amaçlamaktadır. Bu çalışma, Türkiye’de biyokatıların tarım alanlarında kullanılması için yapılan ilk sağlık riski değerlendirmesi çalışmasıdır. Biyokatı örnekleri Ankara Merkez Atıksu Arıtma Tesisi’nden 2012 yılında aylık olarak alınmıştır ve yedi ağır metal (Cd, Cr, Cu, Hg, Ni, Pb ve Zn), ve iki organik kirletici (PCBs ve NPEs) konsantrasyonları analiz edilmiştir. Sağlık risklerini değerlendirmek için ABD Çevre Koruma Ajansı (U.S. EPA) ve Fransız Ulusal Enstitüsü Endüstriyel Çevre ve Riskler Birimi (INERIS) tarafından geliştirilen yöntemler kullanılmıştır. İki yöntem ile de çocuk tarafından yutulması maruz kalma yolu için kanser ve kanser olmayan riskler, U.S. EPA ve INERIS’in önerdiği kabul edilebilir kanser ya da kanser olmayan risk seviyelerine göre düşük olarak bulunmuştur. Ek olarak, Türkiye’de en kötü koşulda, en fazla sağlık riskinin ne olacağının belirlenmesi için, Evsel ve Kentsel Arıtma Çamurların Toprakta Kullanılmasına Dair Yönetmelik (2010) kapsamında sağlanan arıtma çamuru ve toprak sınır değerleri için aynı sağlık riski hesaplamaları yapılmıştır. Elde edilen sonuçlara göre, konsantrasyonlar muhtemel en fazla yönetmelik seviyelerinde olsa bile, sağlık risklerinin hala düşük olduğu belirlenmiştir. Anahtar Kelimeler: Biyokatılar, Sağlık Riski, Tarımsal Uygulama, Yutma Yolu
vii
ACKNOWLEDGEMENTS
First of all, I would like to express my appreciation to my supervisors Prof. Dr. F. Dilek Sanin and Assoc. Prof. Dr. Elçin Kentel for their valuable guidance, encouragement, contributions and efforts throughout my study. It was a pleasure for me to study with them. I would like to thank to my examination committee members Prof. Dr. Ayten Namlı, Assoc. Prof. Dr. Ayşegül Aksoy and Assist. Prof. Dr. Emre Alp for their valuable recommendations and contributions.
I would like to express my appreciation to Filiz Karakaş for conducting the analysis of PCBs which constitutes one of the valuable parts of my studies. I would like also thank to her for her fellowship, encouragement and support during my study. I am thankful to Fadime Kara Murdoch for conducting the analysis of NPEs which is also one of the valuable parts of my study. I would also like to thank to Mehmet Dumanoğulları and Mehmet Hamgül for their support during my laboratory studies.
I would like to thank my roommates; Hale Demirtepe, Devrim Kaya and M.Sara Tunç for their help, encouragement and patience throughout my studies. I also would like to thank my dear friends; Nevzat, Elif, Gamze and Dost for their fellowship and support throughout my study.
Lastly, I would like to express my greatest appreciation to my family for their powerful support, endless love and great patience since the first day of my life.
viii
TABLE OF CONTENTS
ABSTRACT……………………………………………………………………………… v ÖZ ...................................................................................................................................... vi ACKNOWLEDGMENTS .................................................................................... ………. vii TABLE OF CONTENTS.................................................................................................... viii LIST OF TABLES ............................................................................................................. x LIST OF FIGURES ............................................................................................................ xii CHAPTERS 1. INTRODUCTION……………………..………………………………………………. 1 2. LITERATURE REVIEW ………………………………….………………………….. 3
2.1. Definitions of Sewage Sludge and Biosolids………………………………. 3 2.2. Components of Sludge……………………………………………………... 3
2.3. Quantities of Sludge………………………………………………………... 3 2.4. Management of Sludge……………………………………………………… 4 2.4.1. Treatment of Sludge…………………………………………….. 4 2.4.2. Disposal and Beneficial Use of Sludge…………………………. 5 2.4.2.1. Land Application of Sludge……………...................... 6
2.4.2.2. Regulations on Land Application of Sludge…………………………………………………….. 6
2.5. Health Effects of Pollutants Present in Sludge on Humans………………... 9 2.5.1. Health Effects of Heavy Metals on Humans……........................ 9
2.5.2. Health Effects of Organic Pollutants on Humans........................ 11 2.6. Health Risk Assessment Methodology………………………..................... 12 2.6.1. Health Risk Assessment for Land Application
of Biosolids in Different Countries……………………….................... 13 2.6.1.1. U.S. EPA Health Risk Assessment Procedure for Land Application of Biosolids………………... 14 2.6.1.2. INERIS Public Health Risk Assessment Study of Sludge Land Spreading………………….................. 20 2.6.1.3. Comparison of U.S. EPA and INERIS’s Methods.................................................................................... 24
3. MATERIALS AND METHODS……………………………………………………… 25 3.1. Analytical Work……………………………………………………………. 25
3.1.1. Area of the Study ………………………………………………. 25 3.1.2. Sampling of Sludge…………………………………………….. 26
3.1.3 Pretreatment and Analysis of Sludge……………........................ 26 3.1.3.1. Total Solids Determination………………………….. 26 3.1.3.2. Acid Digestion and Atomic Absorption Analysis Procedure…………………………………………... 26 3.1.3.3. PCB Extraction and Analysis Procedure……………. 29 3.1.3.4. NPE Extraction and Analysis Procedure……………. 29 3.2. Health Risk Assessment Methodologies Followed
in This Study…………………………………………………………………… 29 3.2.1. Applications of U.S. EPA’s Health Risk Assessment
Methodology for Sludge Samples of ACWWTP…………………….. 29 3.2.1.1. Hazard Identification……………............................... 29
3.2.1.2. Exposure Assessment………………………………. 30 3.2.1.3. Dose-Response Evaluation…………………………. 31 3.2.1.4. Risk Characterization…………………..................... 31
3.2.2. Applications of INERIS’s Health Risk Assessment Methodology for Sludge Samples of ACWWTP ……………………. 32
3.2.2.1. Substance Selection…………………………………. 32 3.2.2.2. Toxicity Evaluation…………………………………. 33
ix
3.2.2.3. Exposure Evaluation………………………... 33 3.2.2.4. Risk Calculation……………………………. 34 4. RESULTS AND DISCUSSION……………………………………………... 35 4.1. Pollutant Concentrations in Sludge Samples……………………... 35 4.1.1. Heavy Metal Concentrations in Sludge Samples……... 35 4.1.2. PCB Concentrations in Sludge Samples……………… 38
4.1.3. NPE Concentrations in Sludge Samples……………… 38 4.2. Results of Health Risk Calculations………………………………. 39 4.2.1. Health Risk Calculations with U.S. EPA’s Method……. 39 4.2.1.1. Health Risk Calculations for Non-Cancer
Effects………………………………………………. 39 4.2.1.2. Health Risk Calculations for Cancer
Effects……………………………………………….. 40 4.2.1.3. Health Risk Calculations for Limit Values
Given in Turkish Regulation for the Use of Sewage Sludge in Agriculture with U.S. EPA’s Method……………………………………………... 40
4.2.2. Health Risk Calculations with INERIS’s Method……. 41 4.2.2.1. Health Risk Calculations for Threshold
(Non-Cancer) Effects……………………………….. 44 4.2.2.2. Health Risk Calculations for Non-Threshold
(Cancer) Effects ……………………………………. 45 4.2.2.3. Health Risk Calculations for Limit Values in Turkish Regulation for the Use of Sewage Sludge
in Agriculture with INERIS’s Method……………………… 46 4.4. Comparison of the Results of U.S. EPA and INERIS’s Methods…………………………………………………………………. 47
4.5. Discussion of Health Risk Assessment Results……………………. 48 5. SUMMARY & CONCLUSION……………………………………………… 49 6. FUTURE WORK……………………………………………………………… 53 REFERENCES…………………………………………………………………… 55 APPENDICES A: CARCINOGENICITY OF POLLUTANTS………………………………….. 61 B: HEALTH RISK CALCULATIONS WITH U.S. EPA’S METHOD………… 63 C: HEALTH RISK CALCULATIONS WITH INERIS’S METHOD………….. 69
x
LIST OF TABLES
TABLES Table 2.1: Sludge Disposal Alternatives in the World (%)……………………………….. 5 Table 2.2: Heavy Metal Limit Values for Land Application of Biosolids in the World………………………………………………………………......................... 7 Table 2.3: Organic Pollutants Limit Values for Land Application of Biosolids in the World………………................................................................................................. 8 Table 2.4: Limit Values for Heavy Metals in Soil for Land Application of Biosolids in the World……………………………………………………………………. 8 Table 2.5: Chosen Pollutants by U.S. EPA for Land Application after Hazard Characterization ……………………………………………………………. 14 Table 2.6: Summary of Exposure Pathways and Receptors Selected by U.S. EPA………………………………………………………………..…………….. 15 Table 2.7: Risk Assessment Results for All Pollutants and Pathways…………………… 17 Table 2.8: Pollutant Limits and Limiting Pathways for Biosolids Identified in Land Application………………………………………………………………………. 18 Table 2.9: The Part 503 Rule Concentration Limits ……………………………………. 19 Table 2.10: Pollutants Evaluated by INERIS …………………………………………… 21 Table 2.11: The Selected Pathways and Receptors by INERIS ………………………… 21 Table 3.1: Total Solids (%) of Dried Sludge Samples…………………………………… 26 Table 3.2: Pollutants Chosen in Hazard Identification…………………..……………… 30 Table 3.3: ��� and ��
∗ Values of Heavy Metals and Organic Pollutants ……………………………………………………………………………….. 31 Table 3.4: TRVs for Threshold Effects and TRVs for Non-Threshold Effects of Selected Heavy Metals and Organic Pollutants …………………………….. 33 Table 3.5 Background Soil Concentrations near ACWWTP…………………................. 34 Table 4.1: Minimum, Average and Maximum Concentrations of Heavy Metals for 12-monthly Samples…………………………………………………………. 37 Table 4.2: Average Substance Concentrations for Heavy Metals in Soil Mixed with Sludge Samples of ACWWTP …………………………………………….. 42 Table 4.3: Average Substance Concentrations for Organic Pollutants in Soil Mixed with Sludge Samples of ACWWTP…………………………………………….. 42 Table 4.4: ��� Values for Heavy Metals and Organic Pollutants in Soil Mixed with Sludge Samples of ACWWTP……………………………………………... 43 Table 4.5: Calculated Parameters for Limit Concentrations in Turkish Regulation for the Use of Sewage Sludge in Agriculture……………………………….. 46 Table A1. Weight of Evidence Characterization of Pollutants for Carcinogenicity…… 59 Table B1: Non-Cancer Risk Calculations with U.S. EPA’s Method for Cd (Sludge Samples of ACWWTP)…………………………………………………………. 63 Table B2: Non-Cancer Risk Calculations with U.S. EPA’s Method for Cr (Sludge Samples of ACWWTP)………………………………………………………….. 64 Table B3: Non-Cancer Risk Calculations with U.S. EPA’s Method for Cu (Sludge Samples of ACWWTP)…………………………………………………………. 64 Table B4: Non-Cancer Risk Calculations with U.S. EPA’s Method for Hg (Sludge Samples of ACWWTP)………………………………………………………… 65 Table B5: Non-Cancer Risk Calculations with U.S. EPA’s Method for Ni (Sludge Samples of ACWWTP)…………………………………………………………. 65 Table B6: Non-Cancer Risk Calculations with U.S. EPA’s Method for Zn (Sludge Samples of ACWWTP)…………………………………………………………. 66 Table B7: Cancer Risk Calculations with U.S. EPA’s Method for PCB (Sludge Samples of ACWWTP)………………………………………………………… 66 Table B8: Non-Cancer Risk Calculations with U.S. EPA’s Method (Pollutant Limit Values in Turkish Regulation for the Use of Sewage Sludge in Agriculture, 2010)…………………………………………………. 67 Table B9: Cancer Risk Calculations with U.S. EPA’s Method
xi
(Pollutant Limit Values in Turkish Regulation for the Use of Sewage Sludge in Agriculture, 2010)……………………………………. 67 Table C1: Threshold (Non-Cancer) Risk Calculations with INERIS’s Method for Cd (Sludge Samples of ACWWTP)……………………………. 69 Table C2: Threshold (Non-Cancer) Risk Calculations with INERIS’s Method for Cr (Sludge Samples of ACWWTP)…………………………….. 70 Table C3: Threshold (Non-Cancer) Risk Calculations with INERIS’s Method for Cu (Sludge Samples of ACWWTP)……………………………. 70 Table C4: Threshold (Non-Cancer) Risk Calculations with INERIS’s Method for Hg (Sludge Samples of ACWWTP)…………………………… 71 Table C5: Threshold (Non-Cancer) Risk Calculations with INERIS’s Method for Ni (Sludge Samples of ACWWTP)……………………………. 71 Table C6: Threshold (Non-Cancer) Risk Calculations with INERIS’s Method for Pb (Sludge Samples of ACWWTP)……………………………. 72 Table C7: Threshold (Non-Cancer) Risk Calculations with INERIS’s Method for Zn (Sludge Samples of ACWWTP)…………………………… 72 Table C8: Threshold (Non-Cancer) Risk Calculations with INERIS’s Method for PCB (Sludge Samples of ACWWTP)…………………………. 73 Table C9: Threshold (Non-Cancer) Risk Calculations with INERIS’s Method for NPE (Sludge Samples of ACWWTP)…………………………. 73 Table C10: Non-Threshold (Cancer) Risk Calculations with INERIS’s Method (Sludge Samples of ACWWTP)………………………………….. 74 Table C11: Threshold (Non-Cancer) Risk Calculations with INERIS’s Method (Pollutant Limit Values in Turkish Regulation for the Use of Sewage Sludge in Agriculture, 2010)…………………………………… 74 Table C12: Non-Threshold (Cancer) Risk Calculations with INERIS’s Method (Pollutant Limit Values in Turkish Regulation for the Use of Sewage Sludge in Agriculture, 2010)………………………………….. 75
xii
LIST OF FIGURES
FIGURES Figure 2.1: Total Sludge Production in Turkey ………………………………………….. 4 Figure 2.2: Elements of Part 503 Rule …………………………………………………... 6 Figure 2.3: Steps of Health Risk Assessment ……………………………........................ 13 Figure 3.1: Flowchart of ACWWTP…………………………………………………….. 25 Figure 3.2: Flowchart for Nitric Acid - Perchloric Acid Digestion Procedure………….. 27 Figure 3.3: Schematic view of AAS …………………………………………………….. 28 Figure 3.4: Conceptual Scheme of the Exposure Assessment for Land Application of Biosolids Originating from ACWWTP with U.S. EPA’s Method……… 30 Figure 3.5: Conceptual Scheme of the Exposure Assessment for Land Application of Biosolids Originating from ACWWTP with INERIS’s Method ……….. 33 Figure 4.1: Graphical Demonstrations of Heavy Metal Concentrations in Sludge Samples……………………………………………………………………….. 36 Figure 4.2: Graphical Demonstration of PCB Concentrations in Sludge Samples…........................................................................................................... 38 Figure 4.3: Graphical Demonstrations of NPE Concentrations in Sludge Samples ………………………………………………………………………. 38 Figure 4.4: ∑HI Values and Contributions of Heavy Metals to ∑HI…………………… 39 Figure 4.5: Risk Values for Sludge Samples of ACWWTP……………………………. 40 Figure 4.6: ∑HI Value for Limit Values in Turkish Regulation for the Use of Sewage Sludge in Agriculture………………………………………………………… 41 Figure 4.7: ∑�� Values and Contributions of the Pollutants to ∑��…………………… 44 Figure 4.8: Contributions of Background Soil Concentrations (Ankara) and Sludge Concentrations of ACWWTP to ∑��…………………………………………………… 45 Figure 4.9: Graphical Demonstration of ER for PCB……………………………………. 45 Figure 4.10: Contributions of Background Soil and Sludge Concentrations to ∑HI……. 47
1
CHAPTER 1
INTRODUCTION
Sewage sludge is the solid, semisolid, or liquid residue generated during treatment of sewage (U.S. EPA, 2002). As the amount of treated wastewater has increased in the world, the amount of sewage sludge production has also increased and different disposal routes have come into effect. Thirty years ago, ocean disposal was considered as the common method for sludge disposal. However, after ocean disposal of sewage sludge was banned worldwide, other alternatives such as landfilling, incineration and land application were taken into consideration. Along with the development of beneficial use alternatives, new terminology for sewage sludge was also introduced to fix the bad image and to promote the beneficial use of sewage sludge. The sewage sludge that has gone through proper stabilization processes and which has high quality can be beneficially recycled. For this type of sludge the term ‘biosolids’ was started to be used in wastewater industry and adapted by U.S. EPA. Due to this reason in addition to the term ‘sludge’, the term ‘biosolids’ can also be seen in books and other references. According to the economic status, available infrastructure, and quality of sludge, countries apply different disposal alternatives for sludge. Land application is one of the most commonly used disposal routes. Sludge can be used beneficially on land due to its organic matter and nutrient content. Agricultural lands, grazing land and forests are some of the application areas for sludge. Land application of sludge has many advantages on the quality of soil and crop. In addition, it is an economical alternative since it can be used instead of expensive chemical fertilizers. Even though sludge has many benefits; it may contain several inorganic, organic and biological pollutants. As a result, use of sludge on land may lead to potential risks for human health and the environment. In order to prevent adverse effects of land application of sludge, some countries established regulations for the use on land. Turkey also has a regulation named ‘Regulation for the Use of Sewage Sludge in Agriculture’ which has been in application since 2010. The main aim of these regulations is to set limit values and provide management standards for pollutants in sludge in order to protect public and environmental health. To set limit values for land application of sludge or to determine potential adverse effects before application, risk assessment studies are commonly applied throughout the world. U.S. EPA conducted an extensive study to determine risk-based pollutant limits for heavy metals and established 40 CFR Part 503 Rule. This regulation has heavy metal pollutant limits, pathogen limits and operational standards, and management practices for land application of biosolids. French National Institute for Industrial Environment and Risks (INERIS) and the Norwegian Scientific Committee for Food Safety (VKM) also assessed extensive studies associated with possible risks for public health due to land application of sludge. In Turkey, land application of sludge is not a very common disposal route and it should be evaluated in terms of its benefits on soil and crop quality and economical value. However, in order to provide safe use of sludge on land and provide valuable information for decision makers, health risks originating from the application of biosolids need to be known. In Turkey, health risks due to land application of sludge are not well-known and health risk assessment studies related to land application have not been conducted yet. The aim of this study is to investigate possible health risks associated with land application of sludge samples from Ankara Central Wastewater Treatment Plant (ACWWTP) through ingestion pathway. This study is the first example of health risk assessment study associated with land application of sludge in Turkey. The findings from this study will provide valuable information in terms of possibility of land application of sludge samples from ACWWTP and will serve as a model for future

2
health risk assessment studies related to land application in Turkey. In this study, seven heavy metals (Cd, Cr, Cu, Hg, Ni, Pb, and Zn), and two organic chemicals (PCB, and NPE) were analyzed in monthly sludge samples collected from ACWWTP. The results were compared with pollutant limit values provided in Turkish Regulation for the Use of Sewage Sludge in agriculture, in terms of possibility of the use of this sludge in land application. After that, the pollutant concentrations measured in sludge samples were used in health risk calculations associated with land application of biosolids through ingestion pathway. For health risk calculations, methodologies developed by U.S. EPA and INERIS were used. With the available data and assumptions, health risk calculations were done and the results were discussed in terms of possible adverse health effects.
3
CHAPTER 2
LITERATURE REVIEW
2.1. Definitions of Sewage Sludge and Biosolids Sewage sludge is one of the constituents produced during wastewater treatment plant processes. It is defined by U.S. EPA as ‘the solid, semi-solid, or liquid by-product generated during the treatment of wastewater at sewage treatment plants’ (U.S. EPA, 2002). In order to distinguish raw sludge from processed sludge which can be used in land application, the term ‘biosolids’ was first used in wastewater treatment industry. After then, the term was adopted by U.S. EPA for high quality sewage sludge which is not raw and do not contain large amount of pollutants (Jacobs and McCreary, 2001) and defined as ‘the primarily organic solid product yielded by municipal wastewater treatment processes that can be beneficially recycled’ (National Research Council, 2002). 2.2. Components of Sludge Type of wastewater treatment and the quality of wastewater are the main factors affecting the quality and quantity of sludge (Sanin et al., 2011). Generally, sludge contains 40-80% organic matter in dry weight and loading is mostly due to human fecal matter (Schowanek et al., 2004). In addition to organic matter, it also includes plant nutrients (nitrogen and phosphorus), macronutrients (calcium, potassium, and sulphur) and micronutrients (copper and zinc) (European Commission, 2008). Sludge may also include pollutants from mixture of organic, inorganic and biological contaminants from domestic, commercial, and industrial wastewater and formed compounds during the wastewater treatment processes. Metals and trace elements, PCB’s, dioxins, steroids, pharmaceuticals are among the contaminants found in sewage sludge (National Research Council, 2002). Furthermore, PAHs, solvents, flame retardants, plasticizers, detergents, pesticides, and personal care products are the other contaminants that can be detected in sewage sludge (European Commission, 2008;Singh and Agrawal, 2007).Apart from inorganic and organic pollutants, disease causing organisms, which are called pathogens and vectors are also present in sewage sludge as well (U.S. EPA, 1994a). 2.3. Quantities of Sludge In the past 30 years, the main aim for wastewater treatment has been centered upon the enhancement of the effluent quality of wastewater with the advanced treatment methods. Use of advanced wastewater treatment technologies has increased the production of solids and biosolids (Tchobanoglous et. al., 2003). Around the world, the amount of sludge production has been observed in huge amounts. In U.S., 6.2 million tons of sludge was produced in 2004 (UN-HABITAT, 2008). According to European Commission (2008), approximately 10 million tons of sludge in dry matter was produced between 2003 and 2006 in EU. The production of sludge has been increased over the last 20 years in some EU member states due to implementation of Urban Wastewater Treatment Directive. On the other hand, in some state members such as Germany and Denmark, the amount of sludge production has been stabilized or decreased due to decrease in water consumption and use of advance technologies in sludge treatment.
4
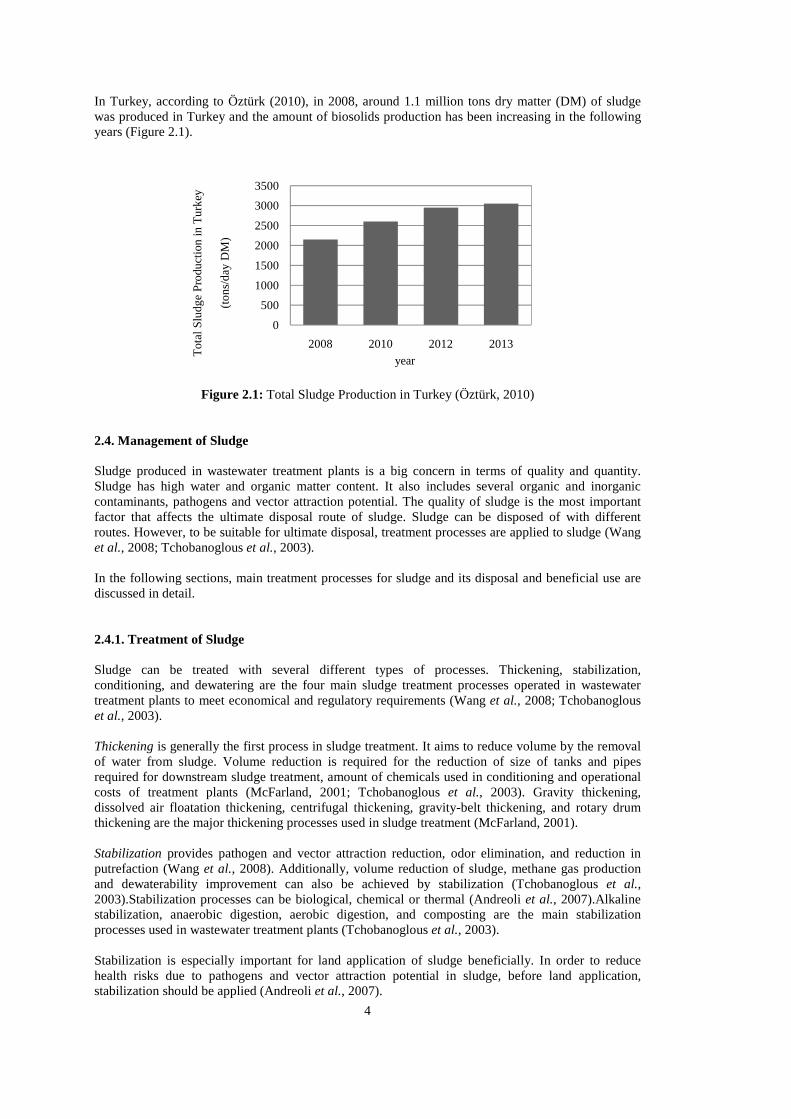
In Turkey, according to Öztürk (2010), in 2008, around 1.1 million tons dry matter (DM) of sludge was produced in Turkey and the amount of biosolids production has been increasing in the following years (Figure 2.1).
Figure 2.1: Total Sludge Production in Turkey (Öztürk, 2010) 2.4. Management of Sludge Sludge produced in wastewater treatment plants is a big concern in terms of quality and quantity. Sludge has high water and organic matter content. It also includes several organic and inorganic contaminants, pathogens and vector attraction potential. The quality of sludge is the most important factor that affects the ultimate disposal route of sludge. Sludge can be disposed of with different routes. However, to be suitable for ultimate disposal, treatment processes are applied to sludge (Wang et al., 2008; Tchobanoglous et al., 2003). In the following sections, main treatment processes for sludge and its disposal and beneficial use are discussed in detail. 2.4.1. Treatment of Sludge Sludge can be treated with several different types of processes. Thickening, stabilization, conditioning, and dewatering are the four main sludge treatment processes operated in wastewater treatment plants to meet economical and regulatory requirements (Wang et al., 2008; Tchobanoglous et al., 2003). Thickening is generally the first process in sludge treatment. It aims to reduce volume by the removal of water from sludge. Volume reduction is required for the reduction of size of tanks and pipes required for downstream sludge treatment, amount of chemicals used in conditioning and operational costs of treatment plants (McFarland, 2001; Tchobanoglous et al., 2003). Gravity thickening, dissolved air floatation thickening, centrifugal thickening, gravity-belt thickening, and rotary drum thickening are the major thickening processes used in sludge treatment (McFarland, 2001). Stabilization provides pathogen and vector attraction reduction, odor elimination, and reduction in putrefaction (Wang et al., 2008). Additionally, volume reduction of sludge, methane gas production and dewaterability improvement can also be achieved by stabilization (Tchobanoglous et al., 2003).Stabilization processes can be biological, chemical or thermal (Andreoli et al., 2007).Alkaline stabilization, anaerobic digestion, aerobic digestion, and composting are the main stabilization processes used in wastewater treatment plants (Tchobanoglous et al., 2003). Stabilization is especially important for land application of sludge beneficially. In order to reduce health risks due to pathogens and vector attraction potential in sludge, before land application, stabilization should be applied (Andreoli et al., 2007).
0
500
1000
1500
2000
2500
3000
3500
2008 2010 2012 2013
year
To
tal S
ludg
e P
rodu
ctio
n in
Tu
rkey
(to
ns/
day
DM
)
5
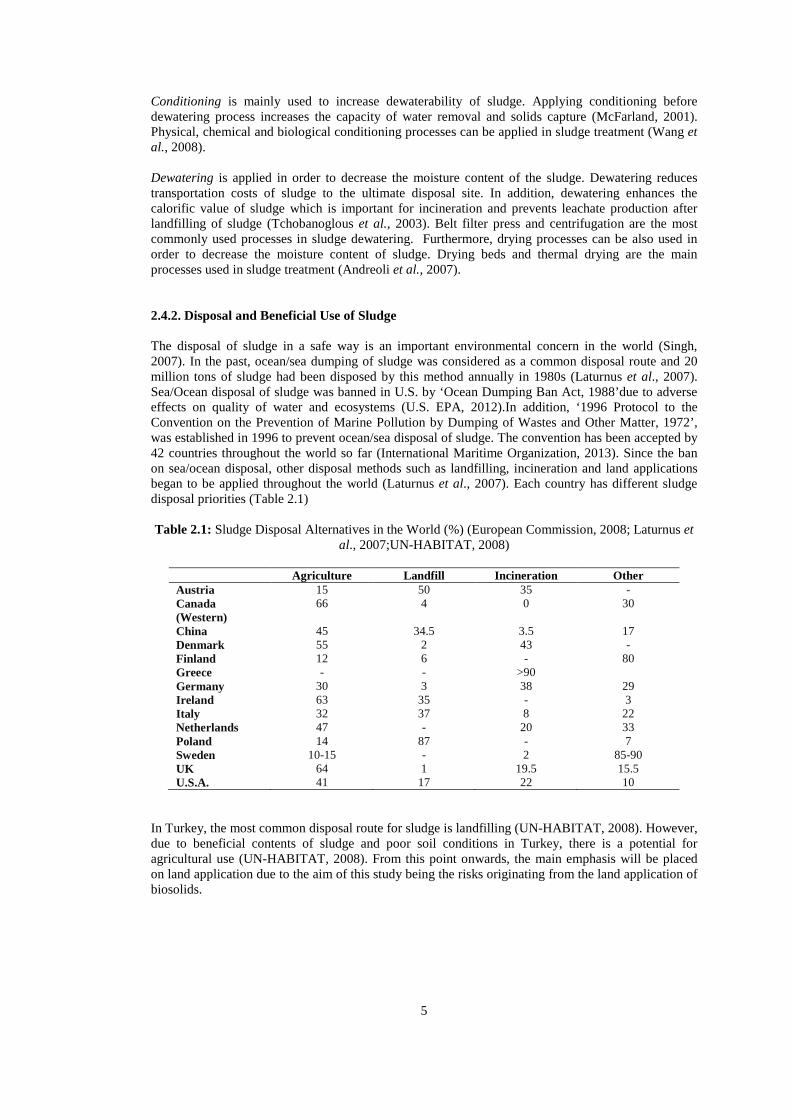
Conditioning is mainly used to increase dewaterability of sludge. Applying conditioning before dewatering process increases the capacity of water removal and solids capture (McFarland, 2001). Physical, chemical and biological conditioning processes can be applied in sludge treatment (Wang et al., 2008). Dewatering is applied in order to decrease the moisture content of the sludge. Dewatering reduces transportation costs of sludge to the ultimate disposal site. In addition, dewatering enhances the calorific value of sludge which is important for incineration and prevents leachate production after landfilling of sludge (Tchobanoglous et al., 2003). Belt filter press and centrifugation are the most commonly used processes in sludge dewatering. Furthermore, drying processes can be also used in order to decrease the moisture content of sludge. Drying beds and thermal drying are the main processes used in sludge treatment (Andreoli et al., 2007). 2.4.2. Disposal and Beneficial Use of Sludge The disposal of sludge in a safe way is an important environmental concern in the world (Singh, 2007). In the past, ocean/sea dumping of sludge was considered as a common disposal route and 20 million tons of sludge had been disposed by this method annually in 1980s (Laturnus et al., 2007). Sea/Ocean disposal of sludge was banned in U.S. by ‘Ocean Dumping Ban Act, 1988’due to adverse effects on quality of water and ecosystems (U.S. EPA, 2012).In addition, ‘1996 Protocol to the Convention on the Prevention of Marine Pollution by Dumping of Wastes and Other Matter, 1972’, was established in 1996 to prevent ocean/sea disposal of sludge. The convention has been accepted by 42 countries throughout the world so far (International Maritime Organization, 2013). Since the ban on sea/ocean disposal, other disposal methods such as landfilling, incineration and land applications began to be applied throughout the world (Laturnus et al., 2007). Each country has different sludge disposal priorities (Table 2.1) Table 2.1: Sludge Disposal Alternatives in the World (%) (European Commission, 2008; Laturnus et
al., 2007;UN-HABITAT, 2008)
Agriculture Landfill Incineration Other Austria 15 50 35 - Canada (Western)
66 4 0 30
China 45 34.5 3.5 17 Denmark 55 2 43 - Finland 12 6 - 80 Greece - - >90 Germany 30 3 38 29 Ireland 63 35 - 3 Italy 32 37 8 22 Netherlands 47 - 20 33 Poland 14 87 - 7 Sweden 10-15 - 2 85-90 UK 64 1 19.5 15.5 U.S.A. 41 17 22 10
In Turkey, the most common disposal route for sludge is landfilling (UN-HABITAT, 2008). However, due to beneficial contents of sludge and poor soil conditions in Turkey, there is a potential for agricultural use (UN-HABITAT, 2008). From this point onwards, the main emphasis will be placed on land application due to the aim of this study being the risks originating from the land application of biosolids.
6
2.4.2.1. Land Application of Sludge Land application is defined by U.S. EPA (1994b) as “the spreading, spraying, injection, or incorporation of sewage sludge, including materials derived from sewage sludge (e.g., compost and pelletized sewage sludge), onto or below the surface of the land to take advantage of the soil enhancing qualities of the sewage sludge”. Biosolids can be used in agricultural land, forests, and rangelands or on disturbed land in need of reclamation (U.S. EPA, 2000). Land application of sludge provides many benefits for soil and crop. It is a source for nitrogen and phosphorus which increases crop production. Organic matter in sludge enhances water infiltration, water holding capacity of soil, and soil granulation (Jacobs and McCreary, 2001). Additionally, land application of sludge decreases soil compaction and erosion of soil. It also has benefits for living organisms in soil and plants such as being a source for energy and nutrients (Jacobs and McCreary, 2001). Furthermore, as an economical point of view, it can be substituted for expensive chemical fertilizers (Wang et al., 2009). Although sludge has several benefits for soil quality and crop production, it can pose potential health risks to human and ecological receptors such as animals, plants, and organisms since it contains metals and trace elements, PCB’s, dioxins, steroids, pharmaceuticals, pathogens, bacteria, viruses, and disease vectors (National Research Council, 2002). The pollutants may result in contamination of the environment and this lead to consideration of potential health and safety implications in order to prevent adverse effects (World Health Organization, 2004). 2.4.2.2. Regulations on Land Application of Sludge Many countries have different regulations associated with land application of sludge. In U.S.A, EPA established 40 CRF Part 503 Rule on February, 19, 1993 under the Clean Water Act (CWA). The rule is composed of five subparts:
• Subpart A: General provisions, Applicability and Purpose etc. • Subpart B: Requirements for Land Application • Subpart C: Requirements for Surface Disposal • Subpart D: Requirements for Pathogen and Vector Attraction Reduction • Subpart E: Requirements for Incineration
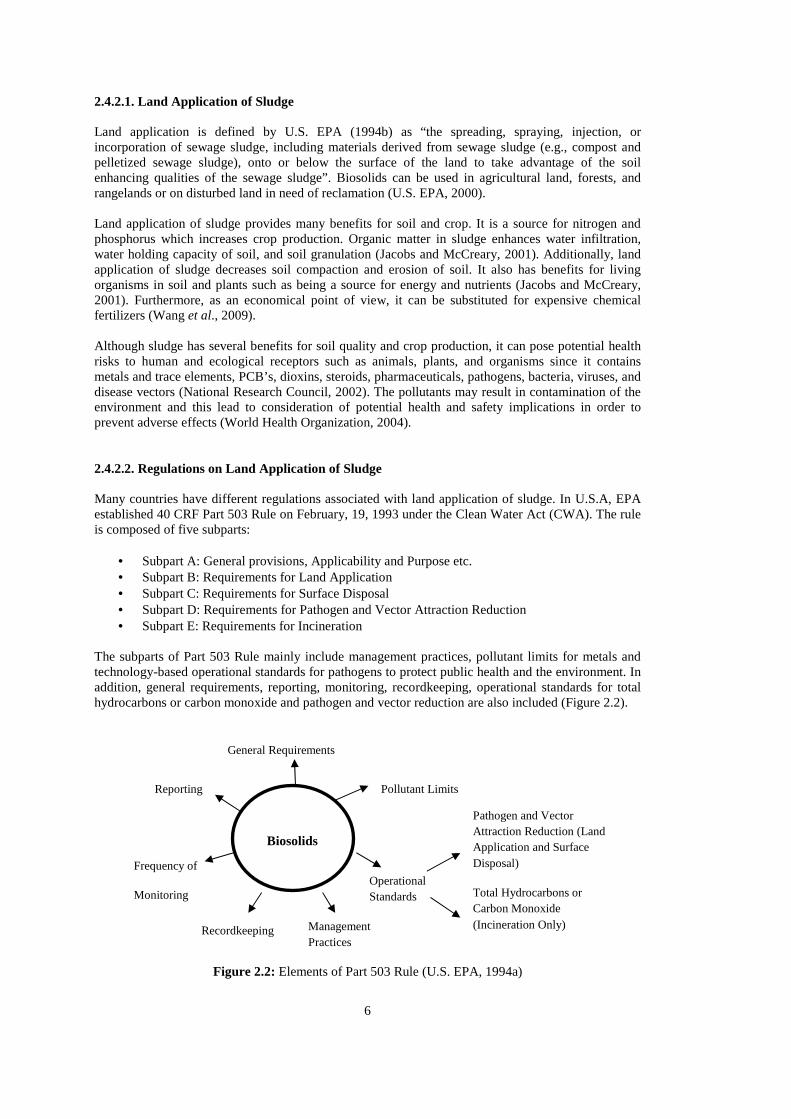
The subparts of Part 503 Rule mainly include management practices, pollutant limits for metals and technology-based operational standards for pathogens to protect public health and the environment. In addition, general requirements, reporting, monitoring, recordkeeping, operational standards for total hydrocarbons or carbon monoxide and pathogen and vector reduction are also included (Figure 2.2).
Figure 2.2: Elements of Part 503 Rule (U.S. EPA, 1994a)
Biosolids
General Requirements
Pollutant Limits
Operational Standards
Management Practices
Frequency of
Monitoring
Recordkeeping
Total Hydrocarbons or Carbon Monoxide (Incineration Only)
Pathogen and Vector Attraction Reduction (Land Application and Surface Disposal)
Reporting
7
In the Part 503 rule, risk assessment for biosolids is conducted for three disposal methods: land application, surface disposal and incineration to determine risk-based pollutant limits. In land application, heavy metals found in biosolids applied to the land must meet risk-based pollutant limits whereas operational standards are applied for pathogens and vectors (U.S. EPA, 1995). However, for trace organic pollutants such as PCBs, PAH etc., there are no limit values in Part 503 Rule. These chemicals were evaluated in risk assessment; however, they were eliminated due to the following three findings: ban on use of these chemicals in U.S.A, their low percentages in sewage sludge, and lack of available data (Harrison et al., 2006). In EU, the Sewage Sludge Directive (86/278/EEC) was established in 1986 to increase the use of sewage sludge in agriculture and to avoid detrimental effects on environment and human health. The Directive was prepared using available data in 1980s and COST 68 program for determination of risks. It includes limit values for heavy metals in sludge and soil to be treated with sludge. After establishment, EU countries adopted this directive; and some countries implemented stricter limit values for heavy metals and included organic pollutants which are not included in the directive (EU, 2008). After 86/278/EEC, a draft document (Working Document on Sludge, 3rd Draft) was prepared in 2000 for the use of sludge for agricultural purposes. It includes additional organic pollutant limit concentrations for sludge to be applied to land different from 86/278/EEC and new proposed heavy metal limit concentrations (European Commission, 2000). However, this draft document has not been accepted as the new directive yet. In Turkey, Regulation for the Use of Sewage Sludge in Agriculture was put into force on August, 3, 2010.It aims to take necessary precautions for the use of sewage sludge in soil in a manner to determine compliance with the objectives of sustainable development. It covers technical and administrative procedures for controlled use of sewage sludge in soil without any harmful effects on humans, animals, and plants (Regulation for the Use of Sewage Sludge in Agriculture, 2010).
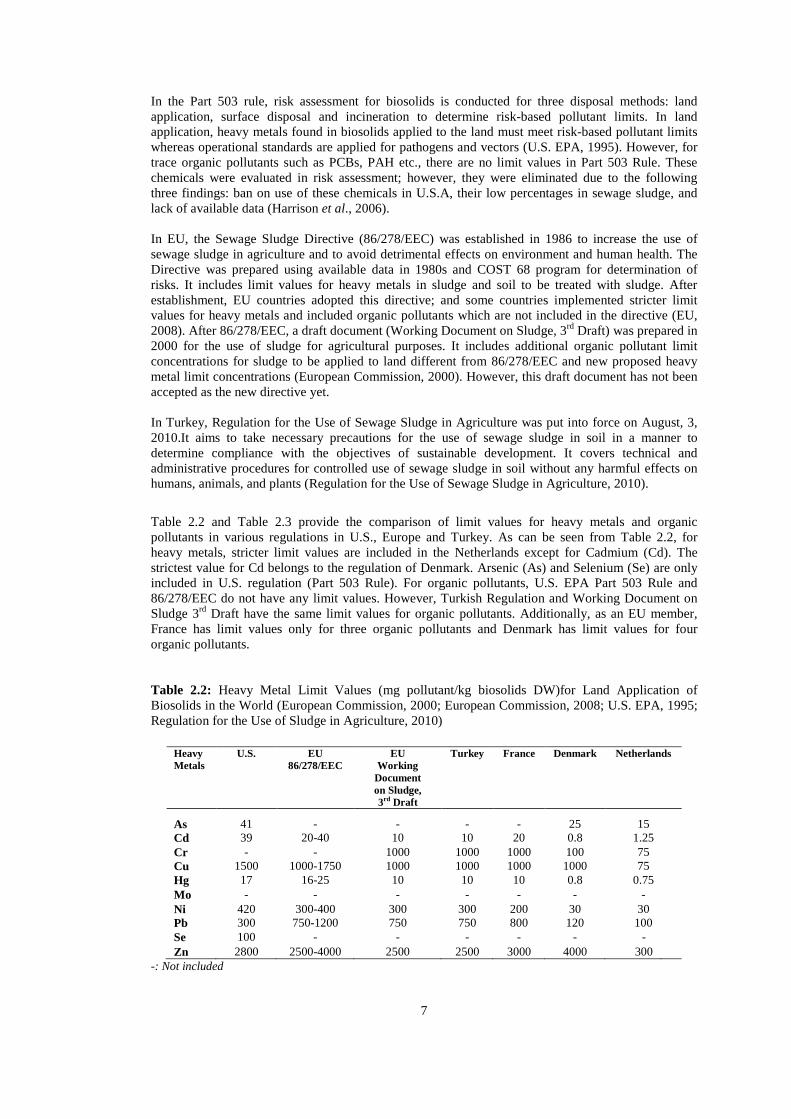
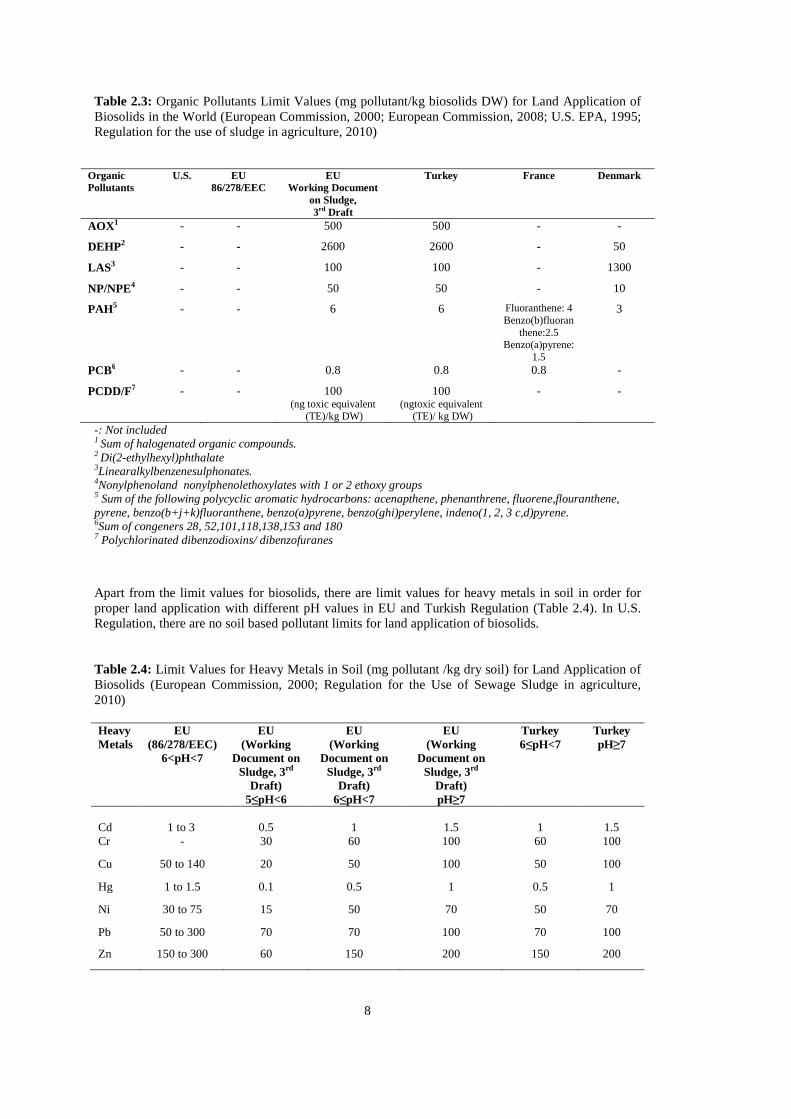
Table 2.2 and Table 2.3 provide the comparison of limit values for heavy metals and organic pollutants in various regulations in U.S., Europe and Turkey. As can be seen from Table 2.2, for heavy metals, stricter limit values are included in the Netherlands except for Cadmium (Cd). The strictest value for Cd belongs to the regulation of Denmark. Arsenic (As) and Selenium (Se) are only included in U.S. regulation (Part 503 Rule). For organic pollutants, U.S. EPA Part 503 Rule and 86/278/EEC do not have any limit values. However, Turkish Regulation and Working Document on Sludge 3rd Draft have the same limit values for organic pollutants. Additionally, as an EU member, France has limit values only for three organic pollutants and Denmark has limit values for four organic pollutants. Table 2.2: Heavy Metal Limit Values (mg pollutant/kg biosolids DW)for Land Application of Biosolids in the World (European Commission, 2000; European Commission, 2008; U.S. EPA, 1995; Regulation for the Use of Sludge in Agriculture, 2010)
Heavy Metals
U.S. EU 86/278/EEC
EU Working Document on Sludge, 3rd Draft
Turkey France Denmark Netherlands
As 41 - - - - 25 15 Cd 39 20-40 10 10 20 0.8 1.25 Cr - - 1000 1000 1000 100 75 Cu 1500 1000-1750 1000 1000 1000 1000 75 Hg 17 16-25 10 10 10 0.8 0.75 Mo - - - - - - - Ni 420 300-400 300 300 200 30 30 Pb 300 750-1200 750 750 800 120 100 Se 100 - - - - - - Zn 2800 2500-4000 2500 2500 3000 4000 300
-: Not included
8
Table 2.3: Organic Pollutants Limit Values (mg pollutant/kg biosolids DW) for Land Application of Biosolids in the World (European Commission, 2000; European Commission, 2008; U.S. EPA, 1995; Regulation for the use of sludge in agriculture, 2010)
Organic Pollutants
U.S. EU 86/278/EEC
EU Working Document
on Sludge, 3rd Draft
Turkey France Denmark
AOX1 - - 500 500 - -
DEHP2 - - 2600 2600 - 50
LAS3 - - 100 100 - 1300
NP/NPE4 - - 50 50 - 10
PAH5 - - 6 6 Fluoranthene: 4 Benzo(b)fluoran
thene:2.5 Benzo(a)pyrene:
1.5
3
PCB6 - - 0.8 0.8 0.8 -
PCDD/F7 - - 100 (ng toxic equivalent
(TE)/kg DW)
100 (ngtoxic equivalent
(TE)/ kg DW)
- -
-: Not included 1 Sum of halogenated organic compounds. 2 Di(2-ethylhexyl)phthalate 3Linearalkylbenzenesulphonates. 4Nonylphenoland nonylphenolethoxylates with 1 or 2 ethoxy groups 5 Sum of the following polycyclic aromatic hydrocarbons: acenapthene, phenanthrene, fluorene,flouranthene, pyrene, benzo(b+j+k)fluoranthene, benzo(a)pyrene, benzo(ghi)perylene, indeno(1, 2, 3 c,d)pyrene. 6Sum of congeners 28, 52,101,118,138,153 and 180 7 Polychlorinated dibenzodioxins/ dibenzofuranes
Apart from the limit values for biosolids, there are limit values for heavy metals in soil in order for proper land application with different pH values in EU and Turkish Regulation (Table 2.4). In U.S. Regulation, there are no soil based pollutant limits for land application of biosolids. Table 2.4: Limit Values for Heavy Metals in Soil (mg pollutant /kg dry soil) for Land Application of Biosolids (European Commission, 2000; Regulation for the Use of Sewage Sludge in agriculture, 2010) Heavy Metals
EU (86/278/EEC)
6<pH<7
EU (Working
Document on Sludge, 3rd
Draft) 5≤pH<6
EU (Working
Document on Sludge, 3rd
Draft) 6≤pH<7
EU (Working
Document on Sludge, 3rd
Draft) pH≥7
Turkey 6≤pH<7
Turkey pH≥7
Cd
1 to 3
0.5
1
1.5
1
1.5
Cr - 30 60 100 60 100
Cu 50 to 140 20 50 100 50 100
Hg 1 to 1.5 0.1 0.5 1 0.5 1
Ni 30 to 75 15 50 70 50 70
Pb 50 to 300 70 70 100 70 100
Zn 150 to 300 60 150 200 150 200
9
2.5. Health Effects of Pollutants Present in Sludge on Humans Possible health effects (carcinogenic and non-carcinogenic) of the specified pollutants in biosolids should be known before land application. Within the scope of this study, health risk assessment for seven heavy metals (cadmium, chromium, copper, lead, mercury, nickel, and zinc) and two organic pollutants (PCBs and selected NPEs) are conducted and provided in Section 3.2. Thus, in this section, health effects of these selected pollutants are discussed in detail. 2.5.1. Health Effects of Heavy Metals on Humans Heavy metals enter wastewater treatment systems by domestic, industrial, commercial, and urban runoff sources. The majority of heavy metals are retained in sewage sludge during wastewater treatment processes (EU Commission, 2001). When sewage sludge is applied to land as a disposal method, heavy metal content in sewage sludge may pose adverse health effects on humans. Each heavy metal has different acute, chronic or carcinogenic health effects in different doses of exposure.
Cadmium (Cd): Cadmium is not an essential element for humans and may have toxic effects. Domestic sources such as rechargeable batteries, paints, food products, detergents, body care products, and photography are the main sources for cadmium contamination in sewage sludge. In addition, launderettes, small electroplating, coating shops, and plastic manufacturing are the commercial sources of cadmium (EU Commission, 2001). Some acute and chronic health effects can be seen after cadmium exposure. Acute health effects may be seen as cough, shortness of breath, digestive tract irritation, colitis, vomiting, and pulmanory edema followed by bronchopneumonia. For chronic health effects, kidney, liver and testicle damage, hypertension, respiratory effects, carbohydrate metabolism, teratogenesis, anaemia, softening of the bones, osteoporosis, and “itai-itai” or “ouch-ouch” disease resulting in bone pains are the possible effects after exposure to cadmium (Epstein, 2003; European Commission, 2001; World Health Organization, 2010). For carcinogenic effects, cadmium is classified as Group B1 (See Appendix A) by U.S. EPA. There is limited data for human carcinogenicity for inhalation. Lung cancer was observed in some studies for cadmium smelter workers (U.S. EPA Integrated Risk Information System (IRIS), 2012). In addition, prostate cancer is observed due to exposure to cadmium in some studies. However, the evidence is weak (U.S. EPA, 1985). Except for inhalation exposure, the data is inadequate for oral exposure (U.S. EPA IRIS, 2012). Chromium (Cr): In biosolids, the chromium is found as Cr (III). It is essential for humans and animals for lipid, protein, and fat metabolism. Moreover, it is important for insulin action in peripheral tissue (U.S. EPA IRIS, 2012). The sources of chromium in sewage sludge are diffuse sources such as preservatives, dying and tanning in leather processing (European Commission, 2001). The data is limited on non-carcinogenic effects of Cr (III) in humans. There are no studies for reproductive and developmental effects in humans (U.S. EPA, 1998) and very limited data indicate respiratory tract and renal effects of Cr (III) (U.S. EPA, 1998). As data on non-carcinogenic effects, the animal and human data is inadequate for the carcinogenicity of Cr (III). There are studies performed for inhalation exposure; however, data is inadequate for determination of carcinogenicity of Cr (III) on humans. In addition, the animal data obtained from studies for oral and inhalation exposure routes does not provide a sufficient determination of carcinogenicity of Cr (III). So, Cr (III) is classified as in Group D (See Appendix A) (U.S. EPA IRIS, 2012). Copper (Cu): Copper is also an essential micronutrient for humans. However, some adverse effects can be seen when excess or deficient amounts of copper are in human body. Copper contamination is mainly due to corrosion and leaching of plumbing, paints, fungicides and wood preservatives. In
10
addition, electronic, plastics, plating, paper, textile, printing industry are also main sources (EU Commission, 2001). After single oral exposure of copper, metallic taste, epigastric pain, headache, nausea, dizziness, vomiting, haematuria, massive gastrointestinal bleeding, liver and kidney damage, and death have been reported (International Programme on Chemical Safety, 1998). Kidney and liver damage can also be seen due to long term (chronic) exposure. In addition, in high levels of exposure, anemia can be seen (New Hampshire Department of Environmental Services, 2005). For carcinogenic effects, no human data is available and animal data is inadequate to determine carcinogenicity of copper (U.S. EPA IRIS, 2012). U.S. EPA classifies carcinogenicity of copper in Group D (See Appendix A) (New Hampshire Department of Environmental Services, 2005). Lead (Pb): Lead may enter wastewater treatment processes by old piping systems, old paints, batteries, solder, cable covering and PVC piping (EU Commission, 2001).Lead has adverse effects such as neurotoxicity, developmental delays, impaired hearing acuity, impaired hemoglobin synthesis, increase in blood pressure, decrements in glomerular filtration rate, colic (abdominal pain, cramps, nausea, vomiting etc.), male reproductive impairment, effect on kidney functions and mortality due to cerebrovascular disease in long term exposure (on lead workers) (U.S. EPA IRIS, 2012; U.S. EPA, 2007a). In addition, some neurodevelopmental effects, musculosketal effects, hepatic effects, and renal effects may also be seen. Lead mostly affects children due to their hand-to-mouth behavior. The exposure risk is very high for children (U.S. EPA, 2007a). Neurological effects such as dizziness, malaise, forgetfulness, and headache are seen in children. In addition, lead exposure may change hematological system. It may results in skeletal maturation, occurrence of dental caries and periodontal bone loss on children (U.S. EPA, 2007a). Lead is classified in Group B2 (See Appendix A) since there is sufficient animal evidence. Increase in renal tumors was observed in studies on rats. However, human evidences are not adequate. All related studies on humans do not have exposure information and dose-response relationships (U.S. EPA IRIS, 2012). Mercury (Hg): Mercury is a toxic and nonessential element for humans. In biosolids, mercury is assumed to be in the form of mercuric chloride (HgCl2) (National Research Council, 2002). Mercury can be included in thermometers, dental practices, old paints and pesticides, caustic soda solutions, wood preservatives, electrical equipment production and finally transferred to sewage sludge (EU Commission, 2001). Mercury has non-cancer effects on humans. As acute effects, skin irritation, dermatitis, corrosion of mucous membranes and digestive tract, gastrointestinal tract, kidney damage, and death may be seen in humans due to exposure to this compound (U.S. EPA, 1994c).As chronic effects, kidney damage, increased salivation, inflammation in gums, black lines on the teeth, renal damage, and pink disease in children are the possible diseases (U.S. EPA, 1994).In addition, in terms of its carcinogenic health effects, mercury is classified in Group C (See Appendix A). There is lack of data on human and limited data on animals (rats and mice). In animals, tumors and adenomas in thyroid follicular cell, papillary hyperplasia and squamos cell papillomas, renal adenomas, and tumor have been observed but the studies are inadequate (U.S. EPA IRIS, 2012). Nickel (Ni): Nickel is a micronutrient which is essential for human body in small amounts. Nickel in sewage sludge is due to food processing, sanitary installations, rechargeable batteries, protective coating, corrosion of equipment of launderettes, jewellery shops, and electroplating shops (EU Commission, 2001). As other micronutrients, Nickel has adverse effects on human health when exposed at large amounts. Among non-carcinogenic effects, decrease in organ and body weights, neonatal mortality, chronic dermatological (nickel dermatitis, hand eczema), respiratory (asthma, nasal septal perforations, chronic rhinitis and sinusitis, chronic respiratory tract infections), endocrine (hyperglycemia), and cardiovascular effects can be seen due to high level of exposure to nickel. In addition, acute effects are
11
seen due to the most toxic nickel containing compound nickel carbonyl Ni (CO) 4.The effects are chest pain, dry coughing, hyperpnoea, cyanosis, gastrointestinal symptoms, sweating, visual disturbances, and weakness (US EPA, 1986). For carcinogenic effects, soluble salts of nickel have not been analyzed. Only three compounds, nickel refinery dust, nickel carbonyl and nickel subsulfide are classified as carcinogens. Nickel refinery dust and nickel subsulfide are classified as Group A and nickel carbonyl is classified as Group B2 (See Appendix A) (U.S. EPA IRIS, 2012; U.S. EPA, 1986). Zinc (Zn): Zinc is an essential trace element for humans. It is an important constituent for enzymes and proteins (Hambridgeet al., 1987 cited in Epstein, 2003). In addition, it takes part in DNA and RNA synthesis and cell proliferation (U.S. EPA IRIS, 2012). Zinc and its compounds are detected in sewage sludge due to domestic sources such as corrosion and leaching of plumbing, water-proofing products, anti-pest products, wood preservatives, cosmetics and pharmaceuticals and commercial sources such as galvanization processes, alloy production, battery production, building materials, plastics, rubber, fungicides, paper, textiles, and dentistry (EU Commission, 2001). Insufficient or excessive intake of zinc may result in adverse effects on humans. According to the studies, excessive oral intake of zinc may result in decrease in erythrocyte Cu-Zn-superoxide dismutase (ESOD) activity, copper deficiency, abdominal cramps, vomiting, nausea, and low HDL level (U.S. EPA IRIS, 2012). For inhalation exposure, metal fume fever symptom followed by flu-like symptoms, chills, fever, profuse sweating, headache, and weakness may be seen as acute effects (U.S. EPA, 2005b). For carcinogenicity of zinc exposure, adequate human studies are not available (U.S. EPA 2005b). 2.5.2. Health Effects of Organic Pollutants on Humans From among the seven trace organic contaminants, the most commonly found and currently analyzable in the laboratory of METU Environmental Engineering Department are also included in the health risk calculations during this study. These chemicals are PCBs and Nonylphenols. Below, a brief discussion of health effects of these chemicals are included. PCBs: Polychlorinated biphenyl is a group of synthetic organic chemicals. PCBs do not have a natural source in the environment. They were used mainly in transformers, capacitors and electrical equipment due to their good insulation properties in the past. They have many carcinogenic and non-carcinogenic health effects on humans and other living organisms (ATDSR, 2000). According to studies conducted on humans and animals to determine non-cancer effects of PCBs, it is found that they have toxic effects on the immune system (infection with the Epstein-Barr virus), reproductive system (decrease in birth weight and gestational age), nervous system (learning deficits and changes in activity), and endocrine system (effecting thyroid hormone levels in infants) of humans. In addition, dermal and ocular effects, increase in blood pressure and increase in serum triglyceride and serum cholesterol levels due to increasing levels of PCBs in serum are also seen in humans (U.S. EPA, 2011). PCBs are classified in Group B2 by U.S. EPA (See Appendix A) due to their carcinogenic effects. Human carcinogenicity data is inadequate but suggestive for carcinogenicity of PCBs. There are studies conducted on workers to determine the carcinogenicity of PCBs. Gastrointestinal tract cancer, hematologic cancer, liver cancer, and gall bladder cancer have been observed in humans during studies. In addition, due to transformation of PCBs into chlorinated dibenzofurans, a highly carcinogenic chemical, cancer incidents can be traced back to PCBs. In Japan and Taiwan, due to consumption of rice oil containing PCBs, liver cancer has been observed since heating up of rice oil results in formation of chlorinated dibenzofurans (U.S. EPA IRIS). Tumor promoting activity is also observed in PCB mixtures and congeners (U.S. EPA, 1996). Although human data is considered as inadequate, animal data is sufficient for carcinogenicity of PCBs. There are studies on rats showing the incidence of cancer risk. Increasing in incidence of
12
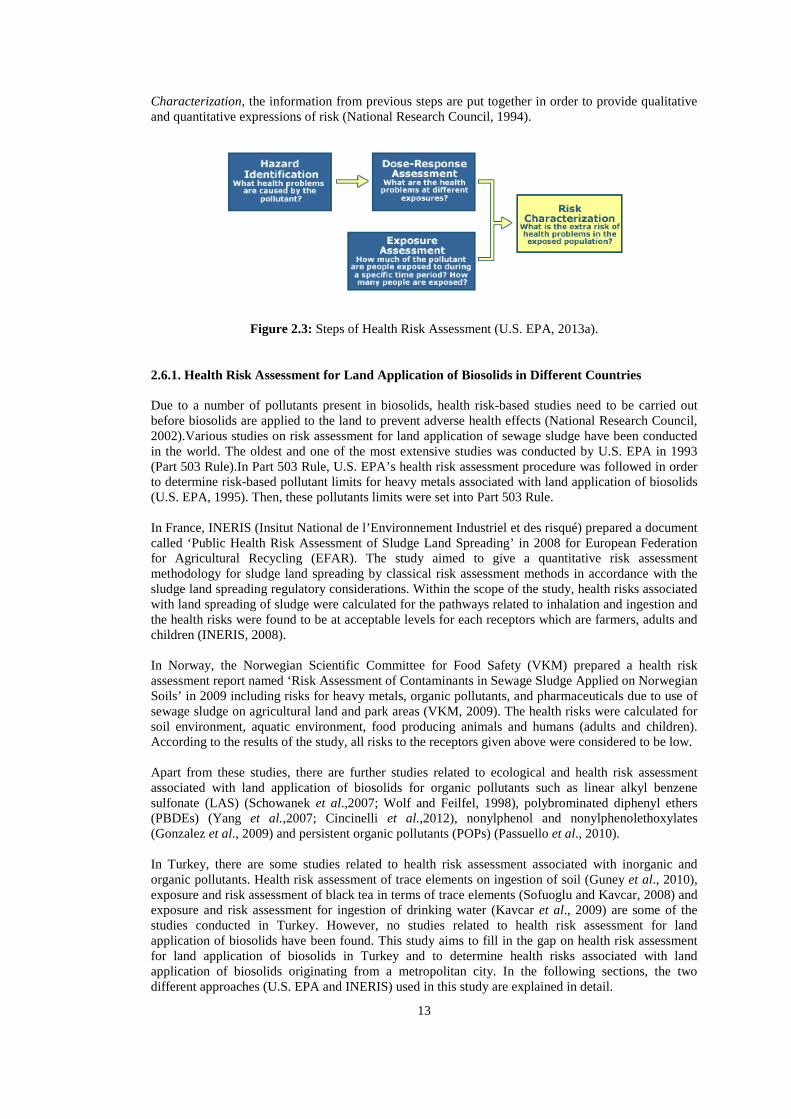
adenomas and tumors in livers and thyroids has been observed during studies on rats (U.S. EPA IRIS, 2012). NPEs: NPE is the summation of nonylphenol (NP) and nonylphenolethoxylates with 1 and 2 ethoxy groups. Nonylphenolpolyethoxylates (NPEOs) are one of the two sub-classes of alkylphenolpolyethoxylates (APEs). NPEOs are known to degrade rapidly in nature, which proceeds by the removal of one ethoxy group from the molecule. The final products of degradation are nonlyphenols (NPs). NPEOs are used in many industries such as textile processing, pulp and paper processing, paints, resins, protective coatings, oil and gas recovery, steel manufacturing and power generation. In addition, NPEOs are also used in households as cleaning products, cosmetics and paints. Due to their widespread use they are released into the environment by wastewater treatment plant effluents. They have some health effects on humans and other living organisms (Canada Environmental Protection Act, 2001). Data on non-carcinogenic effects for humans are very limited. Acute toxicity due to oral and dermal exposure is low. NPs may cause irritation and corrosion (irreversible damage) to skins and eyes on humans but they do not have a high potential for skin sensitization that lead to an allergic response after exposure (U.S. EPA, 2010 & UNECE, 2004). For reproductive and developmental effects, human data are very limited. There is a study on exposed children showing puberty at an early age due to NP exposure (California Environmental Protection Agency, 2009). For NPEOs, some non-carcinogenic effect data are available for humans. Nonylphenol-4-polyetoxylate exposure may cause erythema. Nonylphenol-9-polyetoxylate may cause congenital malformations; however, the weight of evidence is very limited. In addition, other nonylphenolpolyethoxylates (NP6EO, NP10E0 and NP12EO) may cause contact dermatitis and contact photosensitivity (CEPA, 2001). Apart from acute effects, NP and NPEOs cause estrogenic responses in aquatic organisms and may have reproductive effects (CEPA, 2001). They interfere with estrogenic hormones such as oestradiol, which is an important hormone for female sex characteristics and sex organs (Warhurst, 1995). In addition, alkylphenolethoxylates containing nonylphenols and octylphenols may mimic natural hormones by interaction with the estrogen receptor (Ying et al., 2002). Since the non-carcinogenic data is very limited for humans, the animal data become more important. The effects of NP on animals are more evident. NP is acutely toxic to fish, invertebrates and algae (CEPA, 2001). Excessive salvation, diarrhea, lethargy, erosion of stomach mucosa, skin and eye irritation and irritation of respiratory tract have been observed in laboratory animals (European Chemicals Bureau (2002). As reproductive and developmental effects, decrease in male sex hormone testosterone and increase in uterine weight and hyperactivity may be observed (California Environmental Protection Agency, 2009). In addition, exposure to NP of laboratory animals may cause changes in estrous cycle length, timing of vaginal opening, ovarian weight and sperm count (US EPA, 2010). There is some evidence showing NP have immune effects in animals. In addition, NP may cause nervous system effect such as neurodegeneration (California Environmental Protection Agency, 2009). The carcinogenic effects of NP on humans are not available. In very low concentrations of NP (as 200 µg/l), human breast cancer cell growth is affected (Warhurst, 1995). On the other hand, genotoxic or non-genotoxicmechanisms causing cancer are considered as low due to NP being unlikely to be mutagenic (European Chemicals Bureau, 2002). The data are limited, so there is no clear evidence whether NP is carcinogenic or not. 2.6. Health Risk Assessment Methodology Health risk assessment can be defined as the methodology which estimates the impact of environmental pollution on the health of exposed population (World Health Organization, 2004). It includes four main steps (Figure 2.3) (National Research Council, 1983). In Hazard Identification, contaminants that pose a health hazard to humans and their possible health problems are identified (U.S. EPA, 2005a). In Dose-Response Assessment potential risks to humans at different exposure levels of interest are evaluated (U.S. EPA, 2005a). In Exposure Assessment, magnitude, frequency, duration and route of exposure are identified (U.S. EPA, 1988). Finally, in Risk
13
Characterization, the information from previous steps are put together in order to provide qualitative and quantitative expressions of risk (National Research Council, 1994).
Figure 2.3: Steps of Health Risk Assessment (U.S. EPA, 2013a). 2.6.1. Health Risk Assessment for Land Application of Biosolids in Different Countries Due to a number of pollutants present in biosolids, health risk-based studies need to be carried out before biosolids are applied to the land to prevent adverse health effects (National Research Council, 2002).Various studies on risk assessment for land application of sewage sludge have been conducted in the world. The oldest and one of the most extensive studies was conducted by U.S. EPA in 1993 (Part 503 Rule).In Part 503 Rule, U.S. EPA’s health risk assessment procedure was followed in order to determine risk-based pollutant limits for heavy metals associated with land application of biosolids (U.S. EPA, 1995). Then, these pollutants limits were set into Part 503 Rule. In France, INERIS (Insitut National de l’Environnement Industriel et des risqué) prepared a document called ‘Public Health Risk Assessment of Sludge Land Spreading’ in 2008 for European Federation for Agricultural Recycling (EFAR). The study aimed to give a quantitative risk assessment methodology for sludge land spreading by classical risk assessment methods in accordance with the sludge land spreading regulatory considerations. Within the scope of the study, health risks associated with land spreading of sludge were calculated for the pathways related to inhalation and ingestion and the health risks were found to be at acceptable levels for each receptors which are farmers, adults and children (INERIS, 2008). In Norway, the Norwegian Scientific Committee for Food Safety (VKM) prepared a health risk assessment report named ‘Risk Assessment of Contaminants in Sewage Sludge Applied on Norwegian Soils’ in 2009 including risks for heavy metals, organic pollutants, and pharmaceuticals due to use of sewage sludge on agricultural land and park areas (VKM, 2009). The health risks were calculated for soil environment, aquatic environment, food producing animals and humans (adults and children). According to the results of the study, all risks to the receptors given above were considered to be low. Apart from these studies, there are further studies related to ecological and health risk assessment associated with land application of biosolids for organic pollutants such as linear alkyl benzene sulfonate (LAS) (Schowanek et al.,2007; Wolf and Feilfel, 1998), polybrominated diphenyl ethers (PBDEs) (Yang et al.,2007; Cincinelli et al.,2012), nonylphenol and nonylphenolethoxylates (Gonzalez et al., 2009) and persistent organic pollutants (POPs) (Passuello et al., 2010). In Turkey, there are some studies related to health risk assessment associated with inorganic and organic pollutants. Health risk assessment of trace elements on ingestion of soil (Guney et al., 2010), exposure and risk assessment of black tea in terms of trace elements (Sofuoglu and Kavcar, 2008) and exposure and risk assessment for ingestion of drinking water (Kavcar et al., 2009) are some of the studies conducted in Turkey. However, no studies related to health risk assessment for land application of biosolids have been found. This study aims to fill in the gap on health risk assessment for land application of biosolids in Turkey and to determine health risks associated with land application of biosolids originating from a metropolitan city. In the following sections, the two different approaches (U.S. EPA and INERIS) used in this study are explained in detail.
14
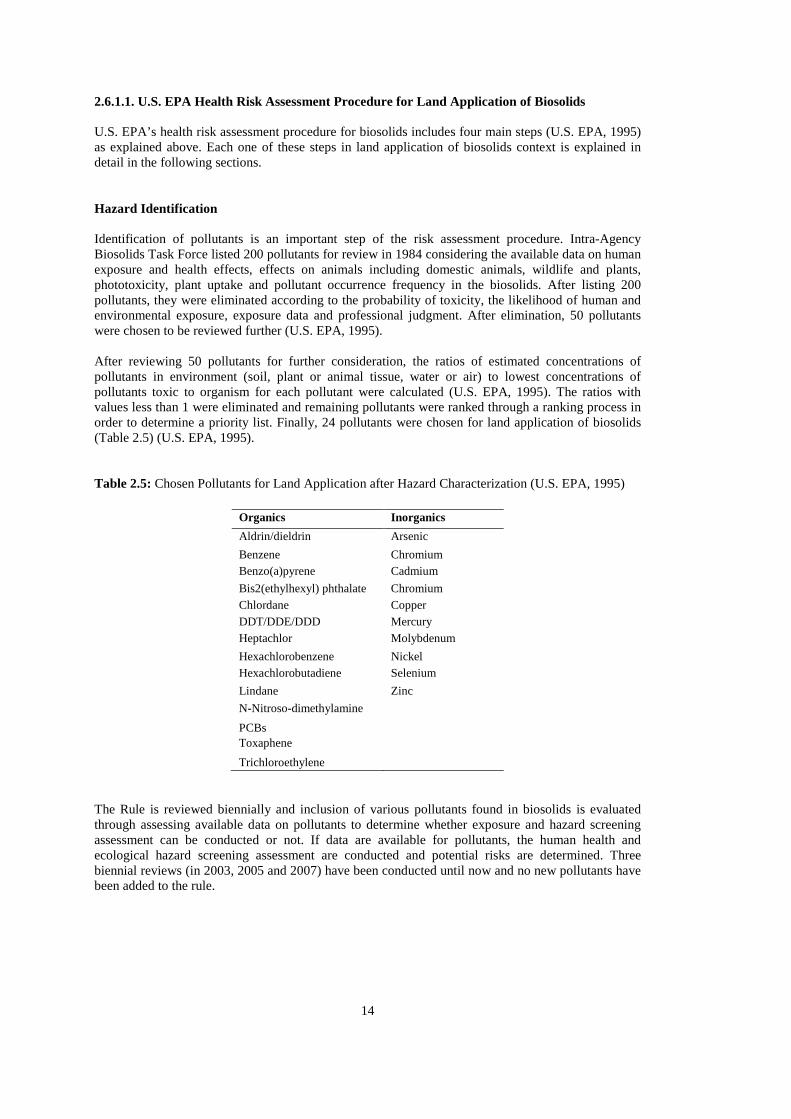
2.6.1.1. U.S. EPA Health Risk Assessment Procedure for Land Application of Biosolids U.S. EPA’s health risk assessment procedure for biosolids includes four main steps (U.S. EPA, 1995) as explained above. Each one of these steps in land application of biosolids context is explained in detail in the following sections. Hazard Identification Identification of pollutants is an important step of the risk assessment procedure. Intra-Agency Biosolids Task Force listed 200 pollutants for review in 1984 considering the available data on human exposure and health effects, effects on animals including domestic animals, wildlife and plants, phototoxicity, plant uptake and pollutant occurrence frequency in the biosolids. After listing 200 pollutants, they were eliminated according to the probability of toxicity, the likelihood of human and environmental exposure, exposure data and professional judgment. After elimination, 50 pollutants were chosen to be reviewed further (U.S. EPA, 1995). After reviewing 50 pollutants for further consideration, the ratios of estimated concentrations of pollutants in environment (soil, plant or animal tissue, water or air) to lowest concentrations of pollutants toxic to organism for each pollutant were calculated (U.S. EPA, 1995). The ratios with values less than 1 were eliminated and remaining pollutants were ranked through a ranking process in order to determine a priority list. Finally, 24 pollutants were chosen for land application of biosolids (Table 2.5) (U.S. EPA, 1995). Table 2.5: Chosen Pollutants for Land Application after Hazard Characterization (U.S. EPA, 1995)
Organics Inorganics
Aldrin/dieldrin Arsenic
Benzene Chromium Benzo(a)pyrene Cadmium
Bis2(ethylhexyl) phthalate Chromium Chlordane Copper DDT/DDE/DDD Mercury Heptachlor Molybdenum
Hexachlorobenzene Nickel Hexachlorobutadiene Selenium
Lindane Zinc
N-Nitroso-dimethylamine
PCBs Toxaphene
Trichloroethylene
The Rule is reviewed biennially and inclusion of various pollutants found in biosolids is evaluated through assessing available data on pollutants to determine whether exposure and hazard screening assessment can be conducted or not. If data are available for pollutants, the human health and ecological hazard screening assessment are conducted and potential risks are determined. Three biennial reviews (in 2003, 2005 and 2007) have been conducted until now and no new pollutants have been added to the rule.
15
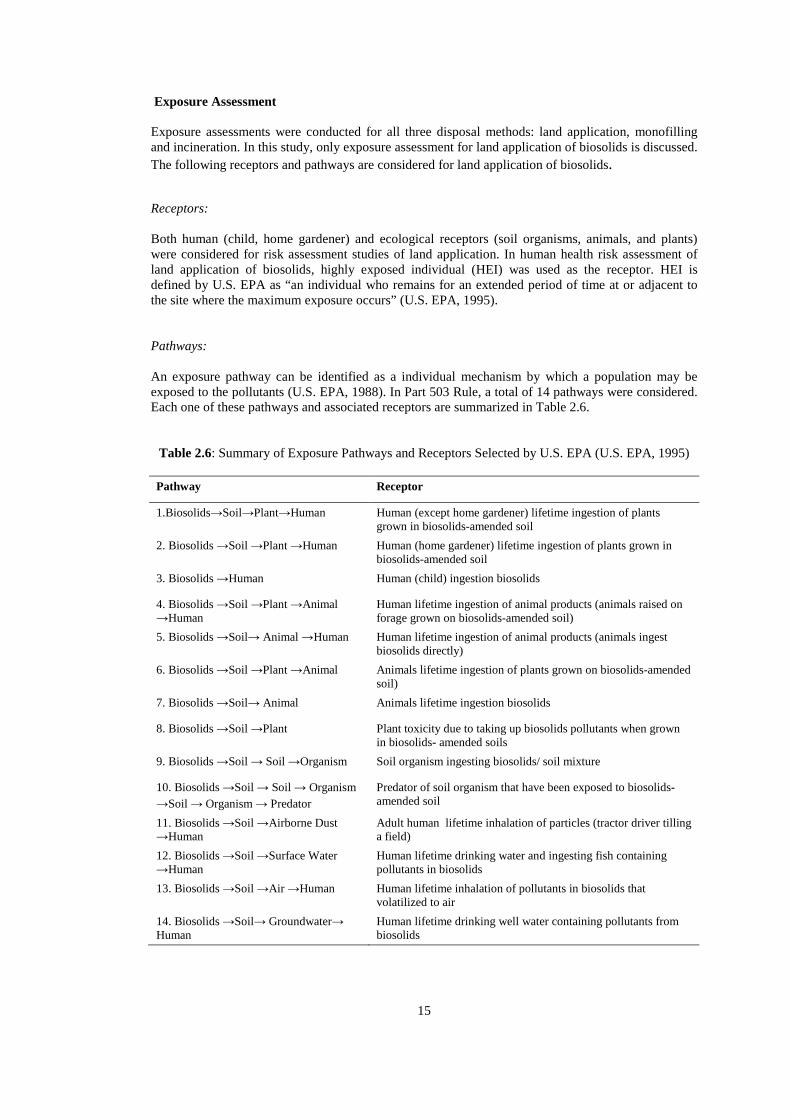
Exposure Assessment Exposure assessments were conducted for all three disposal methods: land application, monofilling and incineration. In this study, only exposure assessment for land application of biosolids is discussed. The following receptors and pathways are considered for land application of biosolids.
Receptors: Both human (child, home gardener) and ecological receptors (soil organisms, animals, and plants) were considered for risk assessment studies of land application. In human health risk assessment of land application of biosolids, highly exposed individual (HEI) was used as the receptor. HEI is defined by U.S. EPA as “an individual who remains for an extended period of time at or adjacent to the site where the maximum exposure occurs” (U.S. EPA, 1995). Pathways: An exposure pathway can be identified as a individual mechanism by which a population may be exposed to the pollutants (U.S. EPA, 1988). In Part 503 Rule, a total of 14 pathways were considered. Each one of these pathways and associated receptors are summarized in Table 2.6.
Table 2.6: Summary of Exposure Pathways and Receptors Selected by U.S. EPA (U.S. EPA, 1995)
Pathway Receptor
1.Biosolids→Soil→Plant→Human Human (except home gardener) lifetime ingestion of plants grown in biosolids-amended soil
2. Biosolids →Soil →Plant →Human Human (home gardener) lifetime ingestion of plants grown in biosolids-amended soil
3. Biosolids →Human Human (child) ingestion biosolids
4. Biosolids →Soil →Plant →Animal →Human
Human lifetime ingestion of animal products (animals raised on forage grown on biosolids-amended soil)
5. Biosolids →Soil→ Animal →Human Human lifetime ingestion of animal products (animals ingest biosolids directly)
6. Biosolids →Soil →Plant →Animal Animals lifetime ingestion of plants grown on biosolids-amended soil)
7. Biosolids →Soil→ Animal Animals lifetime ingestion biosolids
8. Biosolids →Soil →Plant Plant toxicity due to taking up biosolids pollutants when grown in biosolids- amended soils
9. Biosolids →Soil → Soil →Organism Soil organism ingesting biosolids/ soil mixture
10. Biosolids →Soil → Soil → Organism →Soil → Organism → Predator
Predator of soil organism that have been exposed to biosolids-amended soil
11. Biosolids →Soil →Airborne Dust →Human
Adult human lifetime inhalation of particles (tractor driver tilling a field)
12. Biosolids →Soil →Surface Water →Human
Human lifetime drinking water and ingesting fish containing pollutants in biosolids
13. Biosolids →Soil →Air →Human Human lifetime inhalation of pollutants in biosolids that volatilized to air
14. Biosolids →Soil→ Groundwater→ Human
Human lifetime drinking well water containing pollutants from biosolids
16
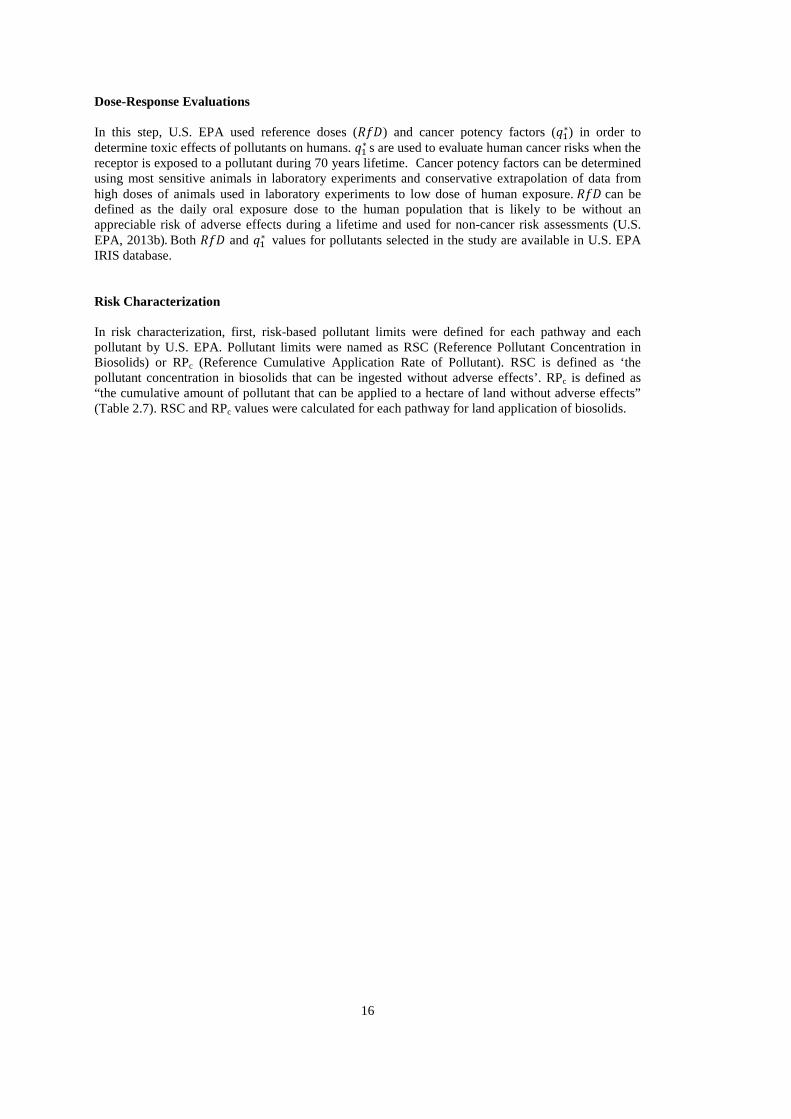
Dose-Response Evaluations In this step, U.S. EPA used reference doses (���) and cancer potency factors (��∗) in order to determine toxic effects of pollutants on humans. ��∗ s are used to evaluate human cancer risks when the receptor is exposed to a pollutant during 70 years lifetime. Cancer potency factors can be determined using most sensitive animals in laboratory experiments and conservative extrapolation of data from high doses of animals used in laboratory experiments to low dose of human exposure. ��� can be defined as the daily oral exposure dose to the human population that is likely to be without an appreciable risk of adverse effects during a lifetime and used for non-cancer risk assessments (U.S. EPA, 2013b). Both ��� and ��∗ values for pollutants selected in the study are available in U.S. EPA IRIS database. Risk Characterization In risk characterization, first, risk-based pollutant limits were defined for each pathway and each pollutant by U.S. EPA. Pollutant limits were named as RSC (Reference Pollutant Concentration in Biosolids) or RPc (Reference Cumulative Application Rate of Pollutant). RSC is defined as ‘the pollutant concentration in biosolids that can be ingested without adverse effects’. RPc is defined as “the cumulative amount of pollutant that can be applied to a hectare of land without adverse effects” (Table 2.7). RSC and RPc values were calculated for each pathway for land application of biosolids.
17
T
able
2.7
: Ris
k A
sse
ssm
en
t Re
sults
for
All
Po
lluta
nts
and
Pa
th
wa
ys (
U.S
. E
PA
, 1
99
5)
P
ath
wa
y N
o
1 2
3 4
5 6
7 8
9 1
0 1
1 1
2 1
3 1
4
Po
lluta
nt
R
Pc
RP
c R
SC
R
P c
RS
C
RP c
R
SC
R
P c
RP
c R
Pc
RP
c R
Pc
RP
c R
Pc
Ars
enic
67
00
93
0 4
1 -
- 1
600
3
100
-
- -
- 6
600
0 -
12
00
Cad
miu
m
6
10
12
0 3
9 1
600
6
800
0 1
40
65
0 -
- 5
3 -
63
00
0 -
un
limite
d
Ch
rom
ium
- -
79
000
- -
- 1
900
00 3
000
-
- -
un
limite
d -
12
000
Co
pp
er
-
- 1
000
0 -
- 3
700
2
000
1
500
2
900
-
- u
nlim
ited
- u
nlim
ited
Lead
- -
30
0 -
- 1
100
0 1
200
-
- 5
000
-
un
limite
d -
u
nlim
ited
Mer
cury
18
0 3
70
17
15
00
24
000
- -
- -
- -
11
00
- u
nlim
ited
Mo
lyb
den
um
- -
40
0 -
- 1
8 5
30
- -
- -
- -
-
Nic
kel
6
300
0 1
000
0 8
20
- -
18
00
54
00
42
0 -
- -
un
lim
ited
- 1
300
0
Sel
eniu
m
1
400
0 1
200
1
00
15
000
13
000
79
0 1
30
- -
- -
- -
-
Zin
c
16
000
36
00
16
000
15
0000
2
200
00
12
000
36
000
28
00
- -
- -
- -
RP c: R
efe
ren
ce c
um
ula
tive a
pplic
atio
n ra
te o
f po
lluta
nt
for
ino
rga
nic
po
lluta
nts
and
non
-deg
rad
ed
org
an
ic p
ollu
tant
s (k
g-p
ollu
tant
/hect
are
)
R
SC
: R
efe
ren
ce p
ollu
tan
t co
nce
ntr
atio
n in
bio
solid
s (µ
g-p
ollu
tan
t/g-b
ioso
lids
DW
)
-: N
ot
calc
ula
ted
(exc
lud
ed
du
rin
g th
e h
aza
rd a
ssess
men
t o
r la
ck o
f dat
a)
Un
limite
d:
No
ap
plic
atio
n r
ate
resu
lted
in a
dve
rse e
ffect
s
17
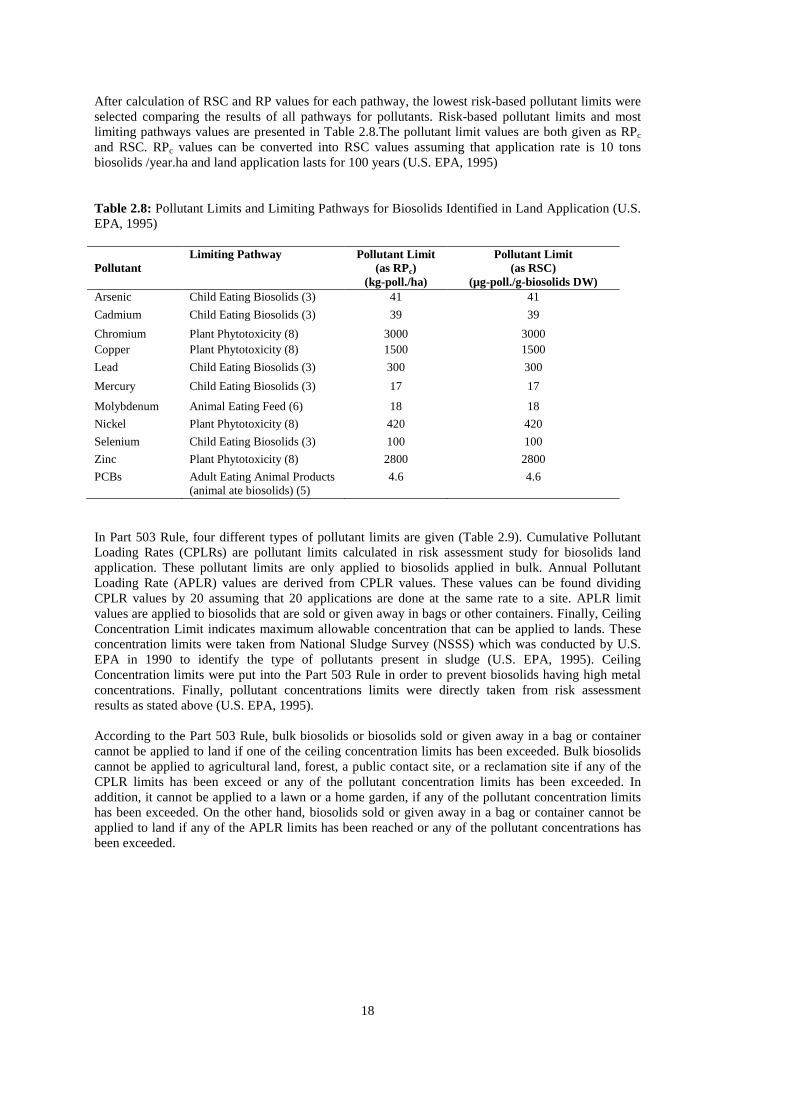
18
After calculation of RSC and RP values for each pathway, the lowest risk-based pollutant limits were selected comparing the results of all pathways for pollutants. Risk-based pollutant limits and most limiting pathways values are presented in Table 2.8.The pollutant limit values are both given as RPc and RSC. RPc values can be converted into RSC values assuming that application rate is 10 tons biosolids /year.ha and land application lasts for 100 years (U.S. EPA, 1995) Table 2.8: Pollutant Limits and Limiting Pathways for Biosolids Identified in Land Application (U.S. EPA, 1995) Pollutant
Limiting Pathway Pollutant Limit (as RPc)
(kg-poll./ha)
Pollutant Limit (as RSC)
(µg-poll./g-biosolids DW) Arsenic Child Eating Biosolids (3) 41 41
Cadmium Child Eating Biosolids (3) 39 39
Chromium Plant Phytotoxicity (8) 3000 3000 Copper Plant Phytotoxicity (8) 1500 1500
Lead Child Eating Biosolids (3) 300 300
Mercury Child Eating Biosolids (3) 17 17
Molybdenum Animal Eating Feed (6) 18 18
Nickel Plant Phytotoxicity (8) 420 420
Selenium Child Eating Biosolids (3) 100 100
Zinc Plant Phytotoxicity (8) 2800 2800
PCBs Adult Eating Animal Products (animal ate biosolids) (5)
4.6 4.6
In Part 503 Rule, four different types of pollutant limits are given (Table 2.9). Cumulative Pollutant Loading Rates (CPLRs) are pollutant limits calculated in risk assessment study for biosolids land application. These pollutant limits are only applied to biosolids applied in bulk. Annual Pollutant Loading Rate (APLR) values are derived from CPLR values. These values can be found dividing CPLR values by 20 assuming that 20 applications are done at the same rate to a site. APLR limit values are applied to biosolids that are sold or given away in bags or other containers. Finally, Ceiling Concentration Limit indicates maximum allowable concentration that can be applied to lands. These concentration limits were taken from National Sludge Survey (NSSS) which was conducted by U.S. EPA in 1990 to identify the type of pollutants present in sludge (U.S. EPA, 1995). Ceiling Concentration limits were put into the Part 503 Rule in order to prevent biosolids having high metal concentrations. Finally, pollutant concentrations limits were directly taken from risk assessment results as stated above (U.S. EPA, 1995). According to the Part 503 Rule, bulk biosolids or biosolids sold or given away in a bag or container cannot be applied to land if one of the ceiling concentration limits has been exceeded. Bulk biosolids cannot be applied to agricultural land, forest, a public contact site, or a reclamation site if any of the CPLR limits has been exceed or any of the pollutant concentration limits has been exceeded. In addition, it cannot be applied to a lawn or a home garden, if any of the pollutant concentration limits has been exceeded. On the other hand, biosolids sold or given away in a bag or container cannot be applied to land if any of the APLR limits has been reached or any of the pollutant concentrations has been exceeded.
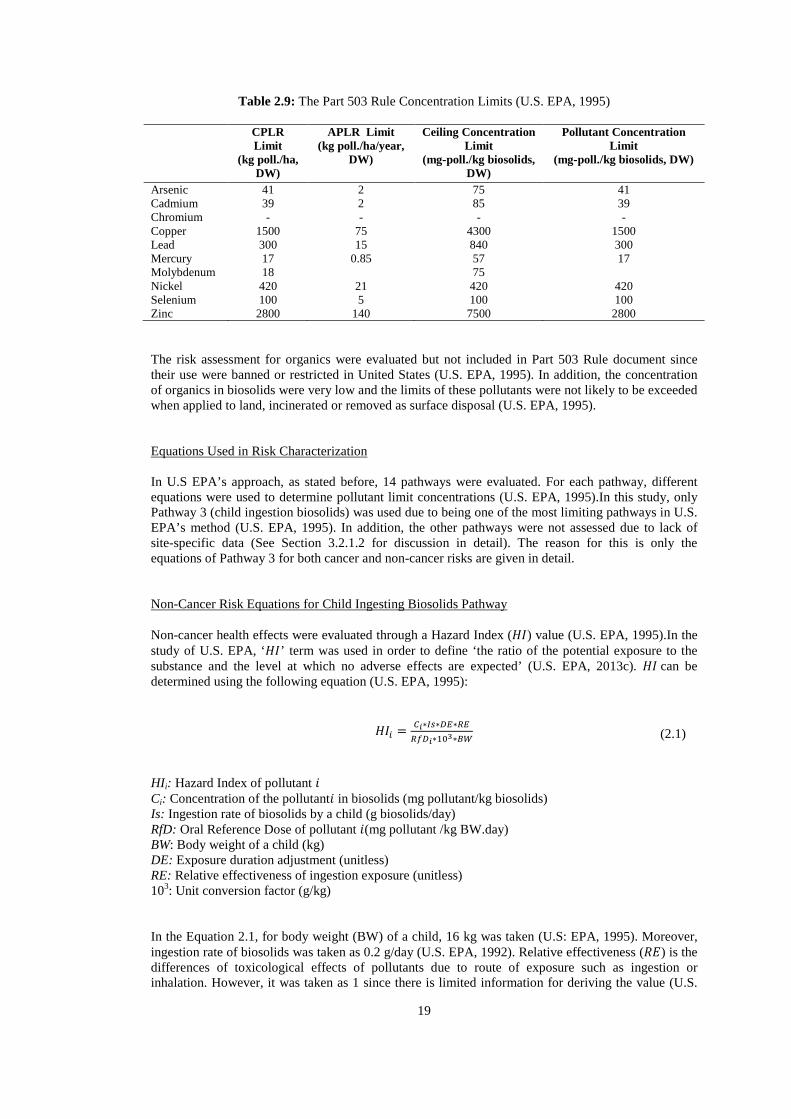
19
Table 2.9: The Part 503 Rule Concentration Limits (U.S. EPA, 1995)
CPLR Limit
(kg poll./ha, DW)
APLR Limit (kg poll./ha/year,
DW)
Ceiling Concentration Limit
(mg-poll./kg biosolids, DW)
Pollutant Concentration Limit
(mg-poll./kg biosolids, DW)
Arsenic 41 2 75 41 Cadmium 39 2 85 39 Chromium - - - - Copper 1500 75 4300 1500 Lead 300 15 840 300 Mercury 17 0.85 57 17 Molybdenum 18 75 Nickel 420 21 420 420 Selenium 100 5 100 100 Zinc 2800 140 7500 2800 The risk assessment for organics were evaluated but not included in Part 503 Rule document since their use were banned or restricted in United States (U.S. EPA, 1995). In addition, the concentration of organics in biosolids were very low and the limits of these pollutants were not likely to be exceeded when applied to land, incinerated or removed as surface disposal (U.S. EPA, 1995). Equations Used in Risk Characterization In U.S EPA’s approach, as stated before, 14 pathways were evaluated. For each pathway, different equations were used to determine pollutant limit concentrations (U.S. EPA, 1995).In this study, only Pathway 3 (child ingestion biosolids) was used due to being one of the most limiting pathways in U.S. EPA’s method (U.S. EPA, 1995). In addition, the other pathways were not assessed due to lack of site-specific data (See Section 3.2.1.2 for discussion in detail). The reason for this is only the equations of Pathway 3 for both cancer and non-cancer risks are given in detail. Non-Cancer Risk Equations for Child Ingesting Biosolids Pathway Non-cancer health effects were evaluated through a Hazard Index () value (U.S. EPA, 1995).In the study of U.S. EPA, ‘’ term was used in order to define ‘the ratio of the potential exposure to the substance and the level at which no adverse effects are expected’ (U.S. EPA, 2013c). can be determined using the following equation (U.S. EPA, 1995):
� = �∗��∗��∗������∗���∗��
HI i: Hazard Index of pollutant � Ci: Concentration of the pollutant� in biosolids (mg pollutant/kg biosolids) Is: Ingestion rate of biosolids by a child (g biosolids/day) RfD: Oral Reference Dose of pollutant �(mg pollutant /kg BW.day) BW: Body weight of a child (kg) DE: Exposure duration adjustment (unitless) RE: Relative effectiveness of ingestion exposure (unitless) 103: Unit conversion factor (g/kg) In the Equation 2.1, for body weight (BW) of a child, 16 kg was taken (U.S: EPA, 1995). Moreover, ingestion rate of biosolids was taken as 0.2 g/day (U.S. EPA, 1992). Relative effectiveness (��) is the differences of toxicological effects of pollutants due to route of exposure such as ingestion or inhalation. However, it was taken as 1 since there is limited information for deriving the value (U.S.
(2.1)
20
EPA, 1992). In addition, for Exposure Duration Adjustment(��), there was no EPA-approved method to adjust exposure duration with respect to ���s (based on lifetime exposure). So, it was set to 1 in EPA Part 503 Rule (U.S. EPA, 1992). Cancer Risk Equations for Child Ingesting Biosolids Pathway Cancer health effects were evaluated through a ���� value and calculated by the following equation (U.S. EPA, 1995):
����� = �� ∗ � ∗ �� ∗ �� ∗ ���∗
! ∗ 10$
Riski: Cancer Risk of pollutant � Ci: Concentration of the pollutant � in biosolids (mg pollutant/kg biosolids) Is: Ingestion rate of biosolids by a child (g biosolids/day) q1
*: Cancer potency factor of pollutant � (mg pollutant /kg BW.day)-1 DE: Exposure duration adjustment (unitless) RE: Relative effectiveness of ingestion exposure (unitless) BW: Body weight of child (kg) 103: Unit conversion factor (g/kg) In the formula for cancer risk calculation, for body weight (BW) of a child, 16 kg was taken and ingestion rate of biosolids was taken as 0.2 g/kg.day (U.S. EPA, 1992). RE value was set to 1 due to the same reason with formula. For ��, 5 years of exposure in life-time span (70 years) was taken and set as 0.0714 (5 years/70 years). Risk levels are suggested by U.S. EPA between 10-4 and 10-6 in establishing various regulations (National Research Council, 2002). For land application of biosolids, risk level was suggested by U.S. EPA as 10-4 (U.S. EPA, 1995). It means that there is a 1 in 1000 chance of highly exposed individual getting cancer (U.S. EPA, 1995). 2.6.1.2. INERIS Public Health Risk Assessment Study of Sludge Land Spreading INERIS conducted a public health risk assessment study in 2008 aiming to evaluate health risks for sludge land spreading according to regulatory aspects. In the study, pollutants and suggested limit values for sludge provided in Proposal for a Directive of the European Parliament of the Council on Spreading Sludge on Land (CEC, 2003) were taken into consideration for the assessment. By this way, pollutants and suggested limit values were evaluated in terms of their relevance with health concerns due to sludge land spreading (INERIS, 2008) In the study, public health risk assessment was evaluated for both threshold (non-cancer) and non-threshold (cancer) effects. Threshold effects were defined by INERIS as ‘the effects for which a threshold of action exists and for which it is possible to find a range of dose without effect’. It corresponds to the non-cancer effects in U.S. EPA’s method. On the other hand, non-threshold effects were defined by INERIS as ‘the effects for which none threshold of action exists and for each dose, probability of risk exists’. It corresponds to cancer effects in U.S. EPA’s method. During health risk assessment, four steps (i.e., substance selection, toxicity evaluation, exposure evaluation and risk assessment) were followed by INERIS in conducting risk calculations (INERIS, 2008). These steps are analyzed in detail in the following sections. Substance Selection In substance selection, the pollutants were chosen from CEC (2003) as stated above. The selected pollutants are given in Table 2.10 (INERIS, 2008).
(2.2)
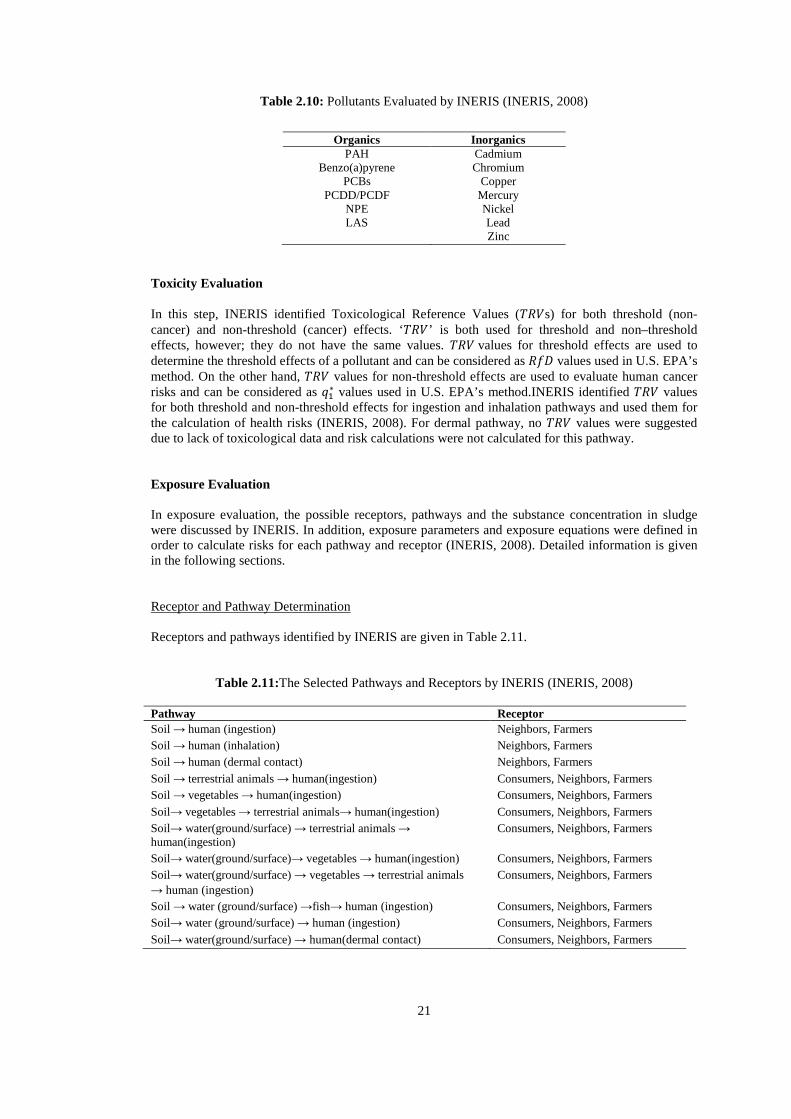
21
Table 2.10: Pollutants Evaluated by INERIS (INERIS, 2008)
Organics Inorganics PAH Cadmium
Benzo(a)pyrene Chromium PCBs Copper
PCDD/PCDF Mercury NPE Nickel LAS Lead
Zinc
Toxicity Evaluation In this step, INERIS identified Toxicological Reference Values (%�&s) for both threshold (non-cancer) and non-threshold (cancer) effects. ‘%�&’ is both used for threshold and non–threshold effects, however; they do not have the same values. %�& values for threshold effects are used to determine the threshold effects of a pollutant and can be considered as ��� values used in U.S. EPA’s method. On the other hand, %�& values for non-threshold effects are used to evaluate human cancer risks and can be considered as ��∗ values used in U.S. EPA’s method.INERIS identified %�& values for both threshold and non-threshold effects for ingestion and inhalation pathways and used them for the calculation of health risks (INERIS, 2008). For dermal pathway, no %�& values were suggested due to lack of toxicological data and risk calculations were not calculated for this pathway. Exposure Evaluation In exposure evaluation, the possible receptors, pathways and the substance concentration in sludge were discussed by INERIS. In addition, exposure parameters and exposure equations were defined in order to calculate risks for each pathway and receptor (INERIS, 2008). Detailed information is given in the following sections. Receptor and Pathway Determination Receptors and pathways identified by INERIS are given in Table 2.11.
Table 2.11:The Selected Pathways and Receptors by INERIS (INERIS, 2008)
Pathway Receptor Soil → human (ingestion) Neighbors, Farmers Soil → human (inhalation) Neighbors, Farmers Soil → human (dermal contact) Neighbors, Farmers
Soil → terrestrial animals → human(ingestion) Consumers, Neighbors, Farmers Soil → vegetables → human(ingestion) Consumers, Neighbors, Farmers
Soil→ vegetables → terrestrial animals→ human(ingestion) Consumers, Neighbors, Farmers Soil→ water(ground/surface) → terrestrial animals → human(ingestion)
Consumers, Neighbors, Farmers
Soil→ water(ground/surface)→ vegetables → human(ingestion) Consumers, Neighbors, Farmers Soil→ water(ground/surface) → vegetables → terrestrial animals → human (ingestion)
Consumers, Neighbors, Farmers
Soil → water (ground/surface) →fish→ human (ingestion) Consumers, Neighbors, Farmers Soil→ water (ground/surface) → human (ingestion) Consumers, Neighbors, Farmers
Soil→ water(ground/surface) → human(dermal contact) Consumers, Neighbors, Farmers
22
Substance Concentrations Substance concentration is defined as the concentration of pollutant in soil which is mixed with sludge after consecutive applications of sludge on land. Substance concentrations were used by INERIS in order to calculate associated health risks due to land spreading of sludge. To determine substance concentrations, both background soil concentrations of pollutants and pollutant concentrations in sludge were taken into account. As pollutant concentrations in sludge, the suggested limit values were taken from CEC (2003). Furthermore, background soil concentrations were taken from database of European Federation for Agricultural Recycling (EFAR) and literature. Both soil and sludge concentrations were assumed to be constant over time (INERIS, 2008). According to INERIS, during land spreading of sludge, sludge is mixed with soil with a dilution factor (�'). �' depends on the application rate of sludge, depth of the soil, and bulk density of the soil (INERIS, 2008). It can be calculated by the equation below (INERIS, 2008):
�' = ())*�+,-�./ �,-01.�* �0)-ℎ ∗ 1.�* 3*� �0/��-4
An application rate of 3 tons/ ha.yr, a soil depth of 25 cm, and a soil bulk density of 1.3 tons/m3 were assumed by INERIS (INERIS, 2008). Using �', diluted pollutant concentrations in sludge were determined after 1 year of application. For cumulative applications, the diluted pollutant concentrations were multiplied by total years of application to determine cumulative inputs due to sludge land spreading. In the study of INERIS, 70 years of application was assumed to occur and the concentrations reach the maximum level after 70 years of application (INERIS, 2008). For some organic compounds such as NPEs, degradation rates were taken into consideration as well (INERIS, 2008). Substance concentration in year / due to degradation can be calculated by the following formula:
5/ = 5� ∗ 0(7 89(:)∗(97�) ;<8=78>=?)⁄ 5A: Substance concentration in year / (mg/kg) 5�: Substance concentration in 1st year (mg/kg) For NPE, half-life was assumed to be 0.41 years. For PCBs and heavy metals, it was assumed that degradation did not take place (INERIS, 2008). After calculation of cumulative pollutant concentrations in sludge applied to soil considered �' and degradation, substance concentration were calculated by the equation below:
13B�-,/+0 �./+. = �3C3*,-�D0 �./+. .� 1*3EF0 + ,+�FH.3/E 1.�* �./+. Exposure Equation for Child Ingesting Soil Pathway For each pathway, different exposure equations were used and Daily Exposure Dose (���) values were determined. ���can be defined as the daily dose of a pollutant which is exposed by a receptor. Within the scope of this study, the exposure equation for only ingestion of soil by a child pathway was considered (See Section 3.2.1.2). ���for the selected pathway can be calculated by the following equation (INERIS, 2008):
��� = I�JKLMNLOMP�Q∗ �∗R��
(2.3)
(2.6)
(2.4)
(2.5)
23
���: Daily exposure dose (mg/kg.day) S�T�U �AVW�XWY: Mass of soil ingestion (mg/day) ��: Concentration of substance � (mg substance/kg soil) ': Exposure frequency !: Body weight of child (kg) In this equation, mass of soil ingestion was taken as 150 mg/day for child (INERIS, 2008). Substance concentration (��) were determined using cumulative sludge concentrations and background soil concentrations as stated above. Exposure frequency (') was determined as 0.021 (INERIS, 2008). This value was derived from an assumption stating that daily time exposure outside as 2 hours /day and exposure day per year outside as 92 day/year for child. Risk Assessment Risk calculations were carried out by INERIS for both threshold effects and non-threshold effects using %�&s and ��� values. In the following sections, equations used in risk calculations by INERIS are given in detail. Risk Calculation for Threshold Effects Threshold effects were calculated through a hazard index () value by the equation below (INERIS, 2008):
= �,�*4 �Z).�3H0 �.�0 (���)%�&�T[ X\[W�\TUY W��W]X�
After calculating for each pollutant, they were classified according to their target organs and effects of pollutants and summed up according to classification to determine cumulative (∑) for each receptor.Then, ∑ was compared with ‘1’In this study, there was no available information to conclude the target organs or effects of pollutants. Therefore, all values were summed up due to lack of information and compared with ‘1’. Summing up all values resulted in a conservative approach which was accepted within the scope of the study. If ∑ is less than one, it means adverse effects are not considered to be significant, however, if it is more than one, it is likely that the pollutant affects receptor adversely (INERIS, 2008). Risk Calculation for Non-Threshold Effects Risk calculation for non-threshold effects was based on excess of risk (��). It was calculated using the following equation (INERIS, 2008):
�� = �,�*4 �Z).�3H0 �.�0 (���) ∗ %�& �T[ ATA7X\[W�\TUY W��W]X� To determine cumulative �� value (∑��), �� values of each pollutant which have non-threshold effects were summed up and ∑�� for each receptor was found (INERIS, 2008).For non-threshold effects the acceptable risk levelwas taken as 10-5 (INERIS, 2008) which is smaller than the value used in U.S. EPA approach (10-4) (U.S. EPA, 1992). The results of the INERIS’s study stated that the main contribution to the risk was coming from ingestion of plants and animal products. In addition, background pollutant concentrations in soil and food have more contribution when compared to pollutant concentrations in sludge limit values (from
(2.7)
(2.8)
24
CEC, 2003). However, the risks due to threshold and non-threshold effects were considered as acceptable for each receptor (INERIS, 2008). 2.6.1.3. Comparison of U.S EPA and INERIS’s Methods U.S. EPA and INERIS conducted health risk calculations for different purposes. U.S. EPA aimed to determine risk-based pollutant limits to be put in Part 503 Rule. Health risks of pollutants were calculated for each pathway and each pollutant and the lowest pollutant limits for each pollutant were selected as the risk-based pollutant limits. On the other hand, INERIS aimed to calculate health risks for the suggested limit values provided in CEC (2003) and to evaluated these limit values in terms of relevance with health concerns due to sludge land spreading. For Threshold (non-cancer) risks were summed up for each receptor (in terms of chemicals and pathways) and a cumulative threshold risk was determined. In addition, same calculations were also conducted for non-threshold (cancer) risks. Apart from differences in the purposes and methods of the studies, health risk calculations for exposure pathways have also some differences. Health risk calculations for ingestion by a child pathway which is the concern of this study differ for both methods. In U.S. EPA’s method, biosolids which is undiluted is ingested by a child and pollutant concentrations in biosolids were taken into account for health risk calculations. Conversely, in INERIS’s method, soil which is mixed with sludge is ingested by a child. For the calculation of health risks, substance concentrations which are the summation of background soil concentration of pollutant and cumulative pollutant concentrations in sludge were considered. For the calculation of cumulative sludge concentrations, dilution factor of sludge, degradation of pollutants and total years of application were taken into account. In addition, as another difference, for the calculation of health risks, in INERIS’s method, an exposure frequency was assumed. Such an assumption was not included in the U.S. EPA’s method and �� was set to 1.
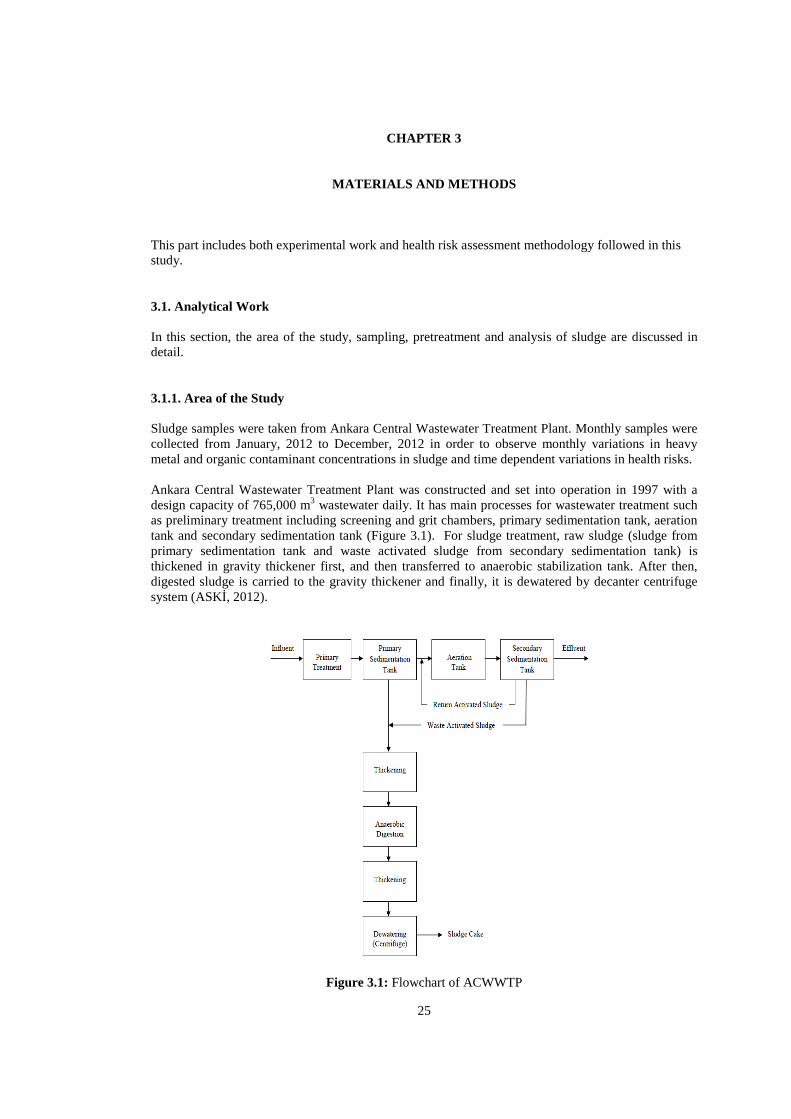
25
CHAPTER 3
MATERIALS AND METHODS This part includes both experimental work and health risk assessment methodology followed in this study. 3.1. Analytical Work In this section, the area of the study, sampling, pretreatment and analysis of sludge are discussed in detail. 3.1.1. Area of the Study Sludge samples were taken from Ankara Central Wastewater Treatment Plant. Monthly samples were collected from January, 2012 to December, 2012 in order to observe monthly variations in heavy metal and organic contaminant concentrations in sludge and time dependent variations in health risks. Ankara Central Wastewater Treatment Plant was constructed and set into operation in 1997 with a design capacity of 765,000 m3 wastewater daily. It has main processes for wastewater treatment such as preliminary treatment including screening and grit chambers, primary sedimentation tank, aeration tank and secondary sedimentation tank (Figure 3.1). For sludge treatment, raw sludge (sludge from primary sedimentation tank and waste activated sludge from secondary sedimentation tank) is thickened in gravity thickener first, and then transferred to anaerobic stabilization tank. After then, digested sludge is carried to the gravity thickener and finally, it is dewatered by decanter centrifuge system (ASKİ, 2012).
Figure 3.1: Flowchart of ACWWTP
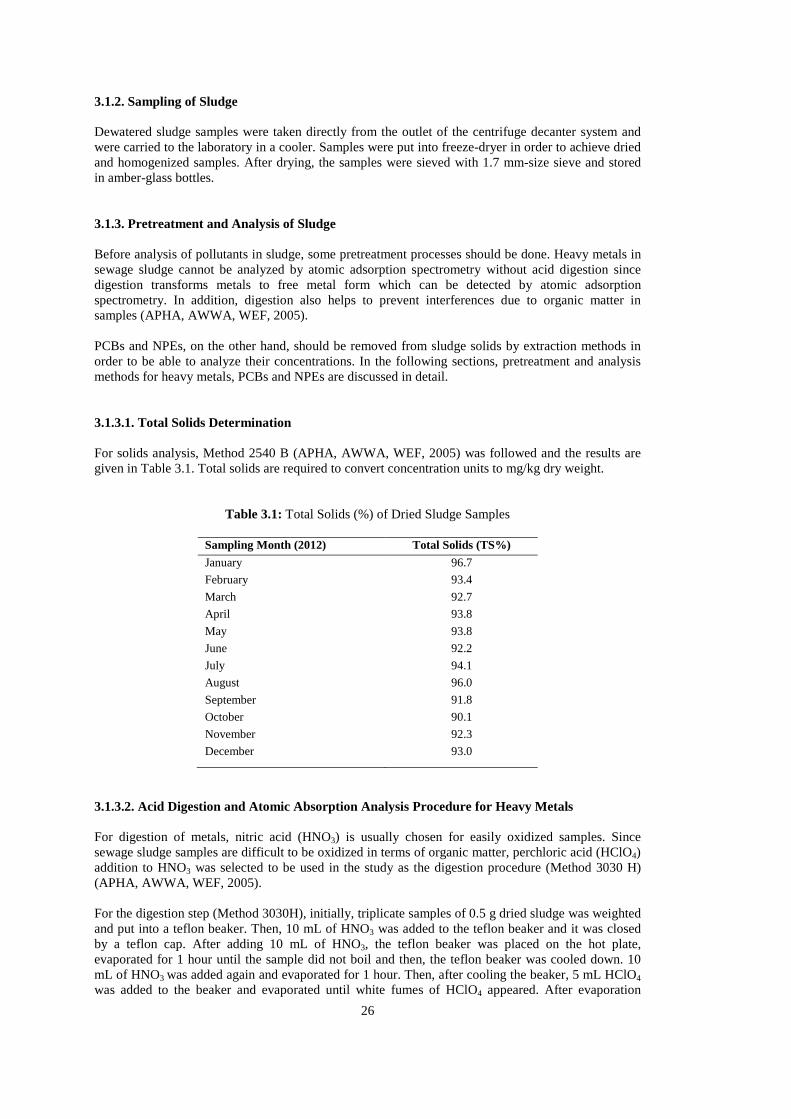
26
3.1.2. Sampling of Sludge Dewatered sludge samples were taken directly from the outlet of the centrifuge decanter system and were carried to the laboratory in a cooler. Samples were put into freeze-dryer in order to achieve dried and homogenized samples. After drying, the samples were sieved with 1.7 mm-size sieve and stored in amber-glass bottles. 3.1.3. Pretreatment and Analysis of Sludge Before analysis of pollutants in sludge, some pretreatment processes should be done. Heavy metals in sewage sludge cannot be analyzed by atomic adsorption spectrometry without acid digestion since digestion transforms metals to free metal form which can be detected by atomic adsorption spectrometry. In addition, digestion also helps to prevent interferences due to organic matter in samples (APHA, AWWA, WEF, 2005). PCBs and NPEs, on the other hand, should be removed from sludge solids by extraction methods in order to be able to analyze their concentrations. In the following sections, pretreatment and analysis methods for heavy metals, PCBs and NPEs are discussed in detail. 3.1.3.1. Total Solids Determination For solids analysis, Method 2540 B (APHA, AWWA, WEF, 2005) was followed and the results are given in Table 3.1. Total solids are required to convert concentration units to mg/kg dry weight.
Table 3.1: Total Solids (%) of Dried Sludge Samples
Sampling Month (2012) Total Solids (TS%)
January 96.7
February 93.4
March 92.7
April 93.8
May 93.8
June 92.2
July 94.1
August 96.0
September 91.8
October 90.1
November 92.3
December 93.0
3.1.3.2. Acid Digestion and Atomic Absorption Analysis Procedure for Heavy Metals For digestion of metals, nitric acid (HNO3) is usually chosen for easily oxidized samples. Since sewage sludge samples are difficult to be oxidized in terms of organic matter, perchloric acid (HClO4) addition to HNO3 was selected to be used in the study as the digestion procedure (Method 3030 H) (APHA, AWWA, WEF, 2005). For the digestion step (Method 3030H), initially, triplicate samples of 0.5 g dried sludge was weighted and put into a teflon beaker. Then, 10 mL of HNO3 was added to the teflon beaker and it was closed by a teflon cap. After adding 10 mL of HNO3, the teflon beaker was placed on the hot plate, evaporated for 1 hour until the sample did not boil and then, the teflon beaker was cooled down. 10 mL of HNO3 was added again and evaporated for 1 hour. Then, after cooling the beaker, 5 mL HClO4 was added to the beaker and evaporated until white fumes of HClO4 appeared. After evaporation
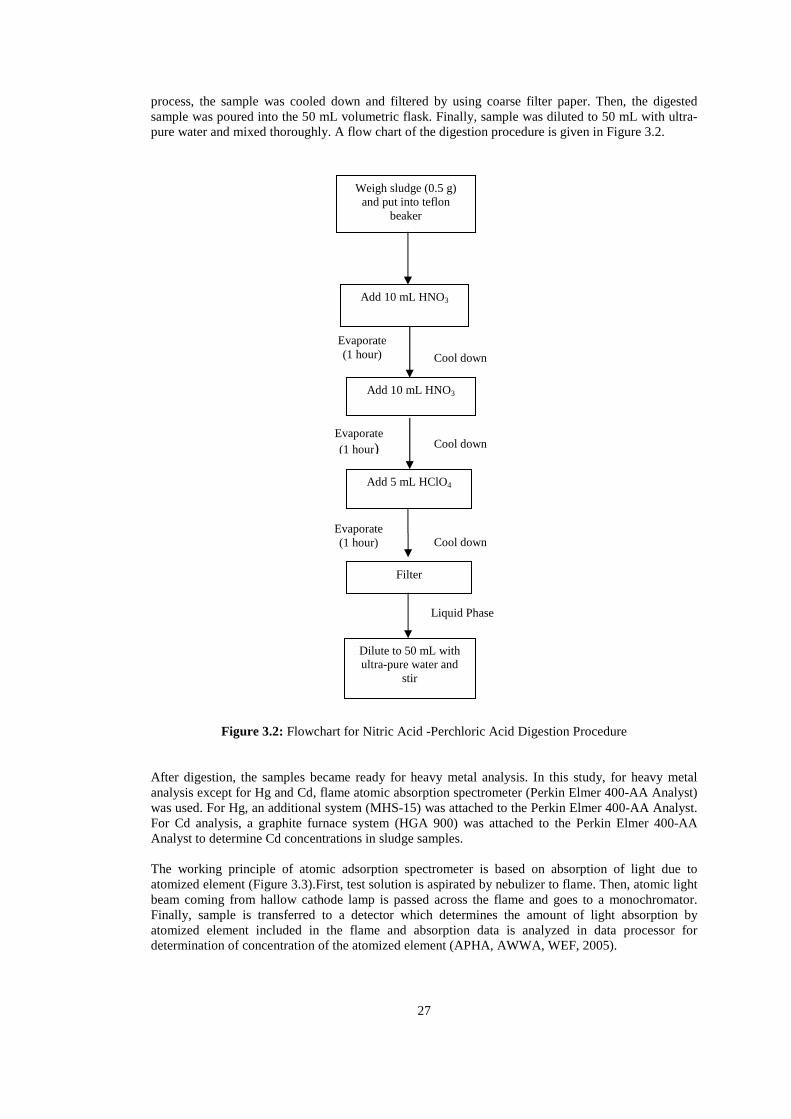
27
process, the sample was cooled down and filtered by using coarse filter paper. Then, the digested sample was poured into the 50 mL volumetric flask. Finally, sample was diluted to 50 mL with ultra-pure water and mixed thoroughly. A flow chart of the digestion procedure is given in Figure 3.2.
Figure 3.2: Flowchart for Nitric Acid -Perchloric Acid Digestion Procedure
After digestion, the samples became ready for heavy metal analysis. In this study, for heavy metal analysis except for Hg and Cd, flame atomic absorption spectrometer (Perkin Elmer 400-AA Analyst) was used. For Hg, an additional system (MHS-15) was attached to the Perkin Elmer 400-AA Analyst. For Cd analysis, a graphite furnace system (HGA 900) was attached to the Perkin Elmer 400-AA Analyst to determine Cd concentrations in sludge samples. The working principle of atomic adsorption spectrometer is based on absorption of light due to atomized element (Figure 3.3).First, test solution is aspirated by nebulizer to flame. Then, atomic light beam coming from hallow cathode lamp is passed across the flame and goes to a monochromator. Finally, sample is transferred to a detector which determines the amount of light absorption by atomized element included in the flame and absorption data is analyzed in data processor for determination of concentration of the atomized element (APHA, AWWA, WEF, 2005).
Weigh sludge (0.5 g) and put into teflon
beaker
Add 10 mL HNO3
Add 10 mL HNO3
Add 5 mL HClO4
Dilute to 50 mL with ultra-pure water and
stir
Filter
Evaporate (1 hour)
Cool down
Cool down
Evaporate (1 hour)
Cool down Evaporate (1 hour)
Liquid Phase
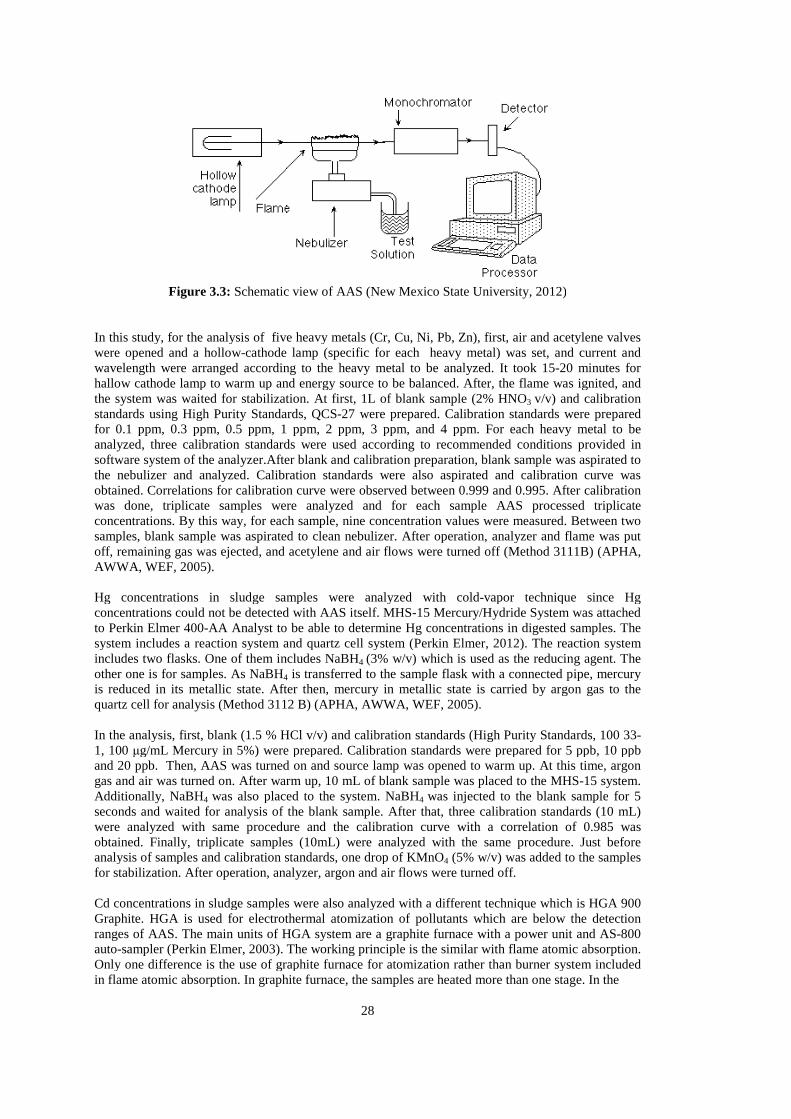
Figure 3.3: Schematic view of AAS (New Mexico State University, 2012) In this study, for the analysis of five heavy metals (Cr, Cu, Ni, Pb, Zn), first, air and acetylene valves were opened and a hollow-cathode wavelength were arranged according to the heavy metal to be analyzed. It took 15hallow cathode lamp to warm up and energy source to be balanced. After, the flame was ignited, anthe system was waited for stabilization. At first, 1L of blank sample (2% HNOstandards using High Purity Standards, QCSfor 0.1 ppm, 0.3 ppm, 0.5 ppm, 1 ppm, 2 ppm, 3 ppm, and 4analyzed, three calibration standards were used according to recommended conditions provided in software system of the analyzer.After blank and calibration preparation, blank sample was aspirated to the nebulizer and analyzed. Calibration standards were also aspirated and calibration curve was obtained. Correlations for calibration curve were observed between 0.999 and 0.995. After calibration was done, triplicate samples were analyzed and for each sample AAS processed triplconcentrations. By this way, for each sample, nine concentration values were measured. Between two samples, blank sample was aspirated to clean nebulizer. After operation, analyzer and flame was put off, remaining gas was ejected, and acetylene and aAWWA, WEF, 2005). Hg concentrations in sludge samples were analyzed with coldconcentrations could not be detected with AAS itself. MHSto Perkin Elmer 400-AA Analyst to be able to determine Hg concentrations in digested samples. The system includes a reaction system and quartz cell system (Perkin Elmer, 2012). The reaction system includes two flasks. One of them includes NaBHother one is for samples. As NaBH4
is reduced in its metallic state. After then, mercury in metallic state is carried by argon gas to the quartz cell for analysis (Method 3112 B) (APHA, AWWA, WEF, 2005). In the analysis, first, blank (1.5 % HCl v/v) and calibration standards (High Purity Standards, 100 331, 100 µg/mL Mercury in 5%) were prepared. Calibration standards were prepared for 5 ppb, 10 ppb and 20 ppb. Then, AAS was turned on and source lamp was opened to warm up. At this time, argon gas and air was turned on. After warm up, 10 mL of blank sample was placed to the MHSAdditionally, NaBH4 was also placed to the system. NaBHseconds and waited for analysis of the blank sample. After that, three calibration standards (10 mL) were analyzed with same procedure and the calibration curve with a correlation of 0.985 was obtained. Finally, triplicate samples (1analysis of samples and calibration standards, one drop of KMnOfor stabilization. After operation, analyzer, argon and air flows were turned off. Cd concentrations in sludge samples were also analyzed with a different technique which is HGA 900 Graphite. HGA is used for electrothermal atomization of pollutants which are below the detection ranges of AAS. The main units of HGA system are a graphite fauto-sampler (Perkin Elmer, 2003). The working principle is the similar with flame atomic absorption. Only one difference is the use of graphite furnace for atomization rather than burner system included in flame atomic absorption. In graphite furnace, the samples are heated more than one stage. In the
28
Schematic view of AAS (New Mexico State University, 2012)
In this study, for the analysis of five heavy metals (Cr, Cu, Ni, Pb, Zn), first, air and acetylene valves cathode lamp (specific for each heavy metal) was set, and current and
wavelength were arranged according to the heavy metal to be analyzed. It took 15-20 minutes for hallow cathode lamp to warm up and energy source to be balanced. After, the flame was ignited, anthe system was waited for stabilization. At first, 1L of blank sample (2% HNO3 v/v) and calibration standards using High Purity Standards, QCS-27 were prepared. Calibration standards were prepared for 0.1 ppm, 0.3 ppm, 0.5 ppm, 1 ppm, 2 ppm, 3 ppm, and 4 ppm. For each heavy metal to be analyzed, three calibration standards were used according to recommended conditions provided in software system of the analyzer.After blank and calibration preparation, blank sample was aspirated to
ed. Calibration standards were also aspirated and calibration curve was obtained. Correlations for calibration curve were observed between 0.999 and 0.995. After calibration was done, triplicate samples were analyzed and for each sample AAS processed triplconcentrations. By this way, for each sample, nine concentration values were measured. Between two samples, blank sample was aspirated to clean nebulizer. After operation, analyzer and flame was put off, remaining gas was ejected, and acetylene and air flows were turned off (Method 3111B) (APHA,
Hg concentrations in sludge samples were analyzed with cold-vapor technique since Hg concentrations could not be detected with AAS itself. MHS-15 Mercury/Hydride System was attached
AA Analyst to be able to determine Hg concentrations in digested samples. The system includes a reaction system and quartz cell system (Perkin Elmer, 2012). The reaction system includes two flasks. One of them includes NaBH4 (3% w/v) which is used as the reducing agent. The
4 is transferred to the sample flask with a connected pipe, mercury is reduced in its metallic state. After then, mercury in metallic state is carried by argon gas to the
sis (Method 3112 B) (APHA, AWWA, WEF, 2005).
In the analysis, first, blank (1.5 % HCl v/v) and calibration standards (High Purity Standards, 100 33g/mL Mercury in 5%) were prepared. Calibration standards were prepared for 5 ppb, 10 ppb
. Then, AAS was turned on and source lamp was opened to warm up. At this time, argon gas and air was turned on. After warm up, 10 mL of blank sample was placed to the MHS
was also placed to the system. NaBH4 was injected to the blank sampleseconds and waited for analysis of the blank sample. After that, three calibration standards (10 mL) were analyzed with same procedure and the calibration curve with a correlation of 0.985 was obtained. Finally, triplicate samples (10mL) were analyzed with the same procedure. Just before analysis of samples and calibration standards, one drop of KMnO4 (5% w/v) was added to the samples
After operation, analyzer, argon and air flows were turned off.
Cd concentrations in sludge samples were also analyzed with a different technique which is HGA 900 Graphite. HGA is used for electrothermal atomization of pollutants which are below the detection ranges of AAS. The main units of HGA system are a graphite furnace with a power unit and AS
sampler (Perkin Elmer, 2003). The working principle is the similar with flame atomic absorption. Only one difference is the use of graphite furnace for atomization rather than burner system included
absorption. In graphite furnace, the samples are heated more than one stage. In the
In this study, for the analysis of five heavy metals (Cr, Cu, Ni, Pb, Zn), first, air and acetylene valves lamp (specific for each heavy metal) was set, and current and
20 minutes for hallow cathode lamp to warm up and energy source to be balanced. After, the flame was ignited, and
v/v) and calibration 27 were prepared. Calibration standards were prepared
ppm. For each heavy metal to be analyzed, three calibration standards were used according to recommended conditions provided in software system of the analyzer.After blank and calibration preparation, blank sample was aspirated to
ed. Calibration standards were also aspirated and calibration curve was obtained. Correlations for calibration curve were observed between 0.999 and 0.995. After calibration was done, triplicate samples were analyzed and for each sample AAS processed triplicate concentrations. By this way, for each sample, nine concentration values were measured. Between two samples, blank sample was aspirated to clean nebulizer. After operation, analyzer and flame was put
(Method 3111B) (APHA,
vapor technique since Hg 15 Mercury/Hydride System was attached
AA Analyst to be able to determine Hg concentrations in digested samples. The system includes a reaction system and quartz cell system (Perkin Elmer, 2012). The reaction system
sed as the reducing agent. The is transferred to the sample flask with a connected pipe, mercury
is reduced in its metallic state. After then, mercury in metallic state is carried by argon gas to the
In the analysis, first, blank (1.5 % HCl v/v) and calibration standards (High Purity Standards, 100 33-g/mL Mercury in 5%) were prepared. Calibration standards were prepared for 5 ppb, 10 ppb
. Then, AAS was turned on and source lamp was opened to warm up. At this time, argon gas and air was turned on. After warm up, 10 mL of blank sample was placed to the MHS-15 system.
the blank sample for 5 seconds and waited for analysis of the blank sample. After that, three calibration standards (10 mL) were analyzed with same procedure and the calibration curve with a correlation of 0.985 was
with the same procedure. Just before (5% w/v) was added to the samples
Cd concentrations in sludge samples were also analyzed with a different technique which is HGA 900 Graphite. HGA is used for electrothermal atomization of pollutants which are below the detection
urnace with a power unit and AS-800 sampler (Perkin Elmer, 2003). The working principle is the similar with flame atomic absorption.
Only one difference is the use of graphite furnace for atomization rather than burner system included absorption. In graphite furnace, the samples are heated more than one stage. In the
29
first stage, graphite tube is heated and sample is dried at about 120 ˚C. In the second stage, organic matter and other matrix components are destroyed with a higher temperature (850˚C) and in the third stage; atomization for the element to be determined occurs at 1650˚C. In the final step, the tube is cleaned at 2400˚C to be ready for next analysis (Perkin Elmer, 2003; APHA, AWWA, WEF, 2005). For the analysis, first, the AAS system, HGA system and cooling system were turned on. In addition, the flow of argon gas was also turned on. Source lamp of Cd was selected for the analysis and waited for warm-up. The auto sampler was aligned before analysis in order to prevent sticking of auto sampler arm to the graphite tube or auto sampler tray. After, the calibration standard was prepared with High Purity Standards, QCS-27. The concentration of calibration standard was 5 ppb. Calibration was done with three standards which were 1 ppb, 3 ppb and 5 ppb. The analyzer was able to dilute 5ppb to 1 ppb and 3ppb.So, in the analysis, only one calibration standard (5 ppb) was prepared. In addition, blank sample (0.2 % HNO3, v/v) was also prepared. A matrix modifier was used in this analysis to eliminate interferences. As matrix modifiers, Palladium and Mg (NO3)2 were used and prepared according to technical note provide by Perkin Elmer. 5 mL Pd (1%) standard (Perkin Elmer) and 3 mL Mg (NO3)2 (1%) were prepared for this analysis. Blank samples, calibration standard, matrix modifier, and samples were put into the auto sampler tray in order and the analysis was conducted. First, blank sample and calibration standards were measured and calibration curve was formed with a correlation of 0.984. During sample analysis, the samples were diluted in the ratio of 1/20 automatically to be able to read by the analyzer (Method 3113 B) (Perkin Elmer, 2003; APHA, AWWA, WEF, 2005). 3.1.3.3. PCB Extraction and Analysis Procedure A 0.5 g of freeze-dried sludge was added into a 22-mL glass vial. Glass vial was sealed with PTFE screw cap. As extraction solvent, n-hexane was used and extraction was carried out on a shaker by shaking the samples for 16 hours. PCB analysis was done with GC/ECD (Agilent/6890 N) and the concentration was determined by the use of a previously prepared calibration curve. Other details of the procedure can be found at Kaya (2012). 3.1.3.4. NPE Extraction and Analysis Procedure A 0.5 g freeze dried samples was added into a 12-mL amber vial. Then, the sample was extracted with sonication based extraction method (5 min) using acetone as solvent. In addition, samples were derivatized by BSTFA +TMCS. For analysis, GC-MS was used. A previously prepared calibration curve was used for the determination of concentrations. NPE which is the sum of NP, NP1EO and NP2EO was measured. Other details can be found at Ömeroğlu (2012). 3.2. Health Risk Assessment Methodologies Followed in This Study Health risk assessment study for the land application of biosolids originating from ACWWTP was carried out using two different methodologies as also mentioned above; U.S. EPA’s and INERIS’s. First, the health risk assessment study conducted according to U.S. EPA’s methodology is explained. 3.2.1. Application of U.S. EPA’s Health Risk Assessment Methodology for Sludge Samples of ACWWTP As mentioned in Section 2.6.1.1, this is a four-step procedure. Below is a discussion of the work done under this four-step procedure. 3.2.1.1. Hazard Identification In the hazard identification step, the contaminants of concern (COC) needed to be selected and identified. In this study, both heavy metals and selected organic pollutants were included within the
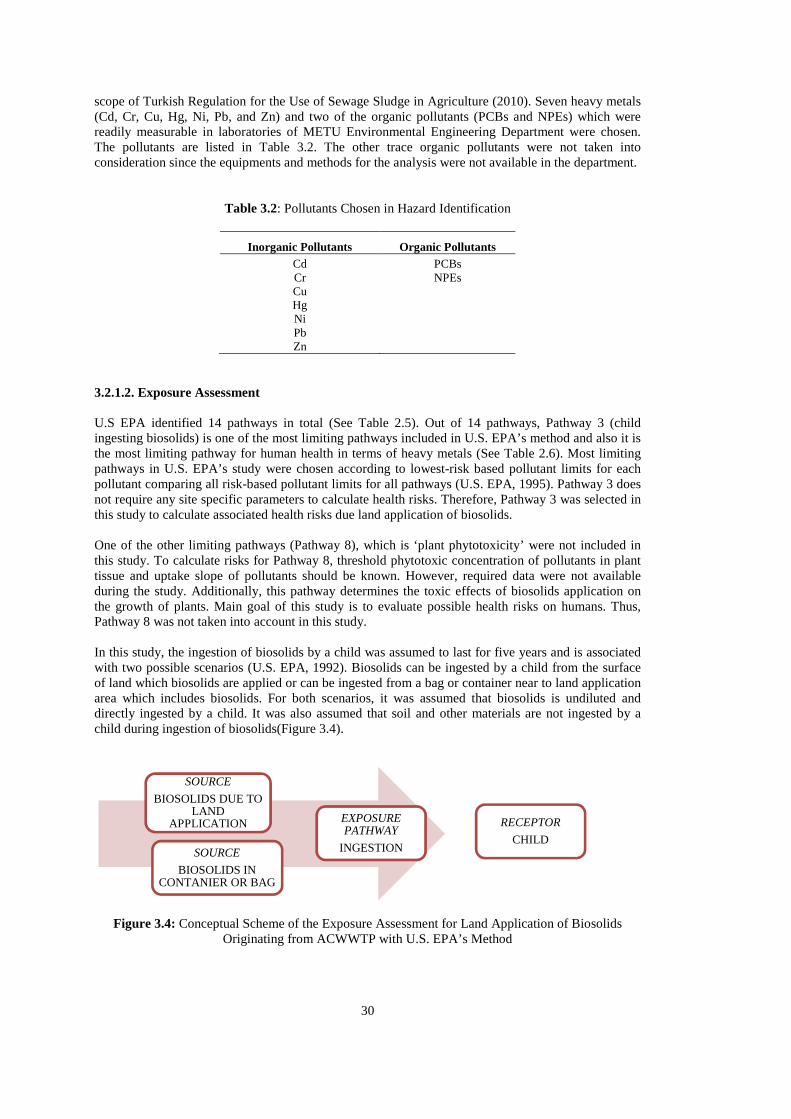
30
scope of Turkish Regulation for the Use of Sewage Sludge in Agriculture (2010). Seven heavy metals (Cd, Cr, Cu, Hg, Ni, Pb, and Zn) and two of the organic pollutants (PCBs and NPEs) which were readily measurable in laboratories of METU Environmental Engineering Department were chosen. The pollutants are listed in Table 3.2. The other trace organic pollutants were not taken into consideration since the equipments and methods for the analysis were not available in the department.
Table 3.2: Pollutants Chosen in Hazard Identification
Inorganic Pollutants Organic Pollutants Cd PCBs Cr NPEs Cu Hg Ni Pb Zn
3.2.1.2. Exposure Assessment U.S EPA identified 14 pathways in total (See Table 2.5). Out of 14 pathways, Pathway 3 (child ingesting biosolids) is one of the most limiting pathways included in U.S. EPA’s method and also it is the most limiting pathway for human health in terms of heavy metals (See Table 2.6). Most limiting pathways in U.S. EPA’s study were chosen according to lowest-risk based pollutant limits for each pollutant comparing all risk-based pollutant limits for all pathways (U.S. EPA, 1995). Pathway 3 does not require any site specific parameters to calculate health risks. Therefore, Pathway 3 was selected in this study to calculate associated health risks due land application of biosolids. One of the other limiting pathways (Pathway 8), which is ‘plant phytotoxicity’ were not included in this study. To calculate risks for Pathway 8, threshold phytotoxic concentration of pollutants in plant tissue and uptake slope of pollutants should be known. However, required data were not available during the study. Additionally, this pathway determines the toxic effects of biosolids application on the growth of plants. Main goal of this study is to evaluate possible health risks on humans. Thus, Pathway 8 was not taken into account in this study. In this study, the ingestion of biosolids by a child was assumed to last for five years and is associated with two possible scenarios (U.S. EPA, 1992). Biosolids can be ingested by a child from the surface of land which biosolids are applied or can be ingested from a bag or container near to land application area which includes biosolids. For both scenarios, it was assumed that biosolids is undiluted and directly ingested by a child. It was also assumed that soil and other materials are not ingested by a child during ingestion of biosolids(Figure 3.4).
Figure 3.4: Conceptual Scheme of the Exposure Assessment for Land Application of Biosolids Originating from ACWWTP with U.S. EPA’s Method
SOURCE
BIOSOLIDS DUE TO LAND
APPLICATION EXPOSURE PATHWAY
INGESTION
RECEPTOR
CHILDSOURCE
BIOSOLIDS IN CONTANIER OR BAG
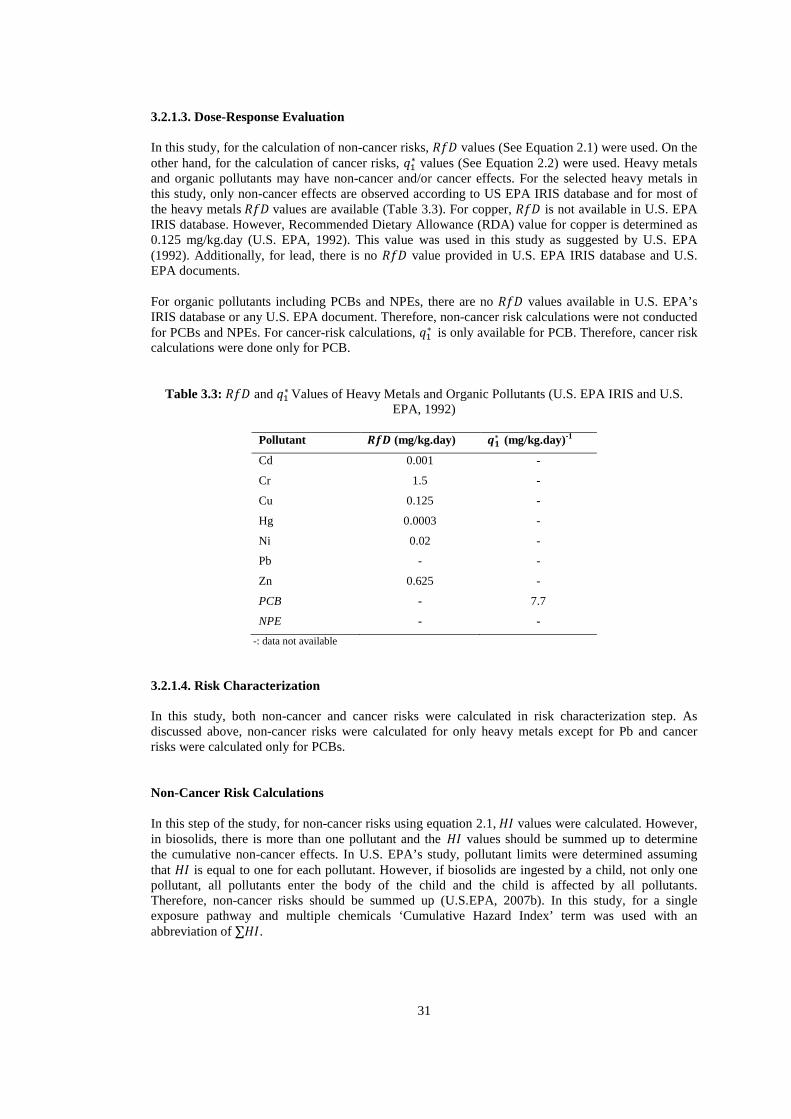
31
3.2.1.3. Dose-Response Evaluation In this study, for the calculation of non-cancer risks, ��� values (See Equation 2.1) were used. On the other hand, for the calculation of cancer risks, ��∗ values (See Equation 2.2) were used. Heavy metals and organic pollutants may have non-cancer and/or cancer effects. For the selected heavy metals in this study, only non-cancer effects are observed according to US EPA IRIS database and for most of the heavy metals ��� values are available (Table 3.3). For copper, ��� is not available in U.S. EPA IRIS database. However, Recommended Dietary Allowance (RDA) value for copper is determined as 0.125 mg/kg.day (U.S. EPA, 1992). This value was used in this study as suggested by U.S. EPA (1992). Additionally, for lead, there is no ��� value provided in U.S. EPA IRIS database and U.S. EPA documents. For organic pollutants including PCBs and NPEs, there are no ��� values available in U.S. EPA’s IRIS database or any U.S. EPA document. Therefore, non-cancer risk calculations were not conducted for PCBs and NPEs. For cancer-risk calculations, ��∗ is only available for PCB. Therefore, cancer risk calculations were done only for PCB.
Table 3.3: ��� and ��∗ Values of Heavy Metals and Organic Pollutants (U.S. EPA IRIS and U.S. EPA, 1992)
Pollutant _`a (mg/kg.day) bc∗ (mg/kg.day)-1
Cd 0.001 -
Cr 1.5 -
Cu 0.125 -
Hg 0.0003 -
Ni 0.02 -
Pb - -
Zn 0.625 -
PCB - 7.7
NPE - -
-: data not available
3.2.1.4. Risk Characterization In this study, both non-cancer and cancer risks were calculated in risk characterization step. As discussed above, non-cancer risks were calculated for only heavy metals except for Pb and cancer risks were calculated only for PCBs. Non-Cancer Risk Calculations In this step of the study, for non-cancer risks using equation 2.1, values were calculated. However, in biosolids, there is more than one pollutant and the values should be summed up to determine the cumulative non-cancer effects. In U.S. EPA’s study, pollutant limits were determined assuming that is equal to one for each pollutant. However, if biosolids are ingested by a child, not only one pollutant, all pollutants enter the body of the child and the child is affected by all pollutants. Therefore, non-cancer risks should be summed up (U.S.EPA, 2007b). In this study, for a single exposure pathway and multiple chemicals ‘Cumulative Hazard Index’ term was used with an abbreviation of ∑.
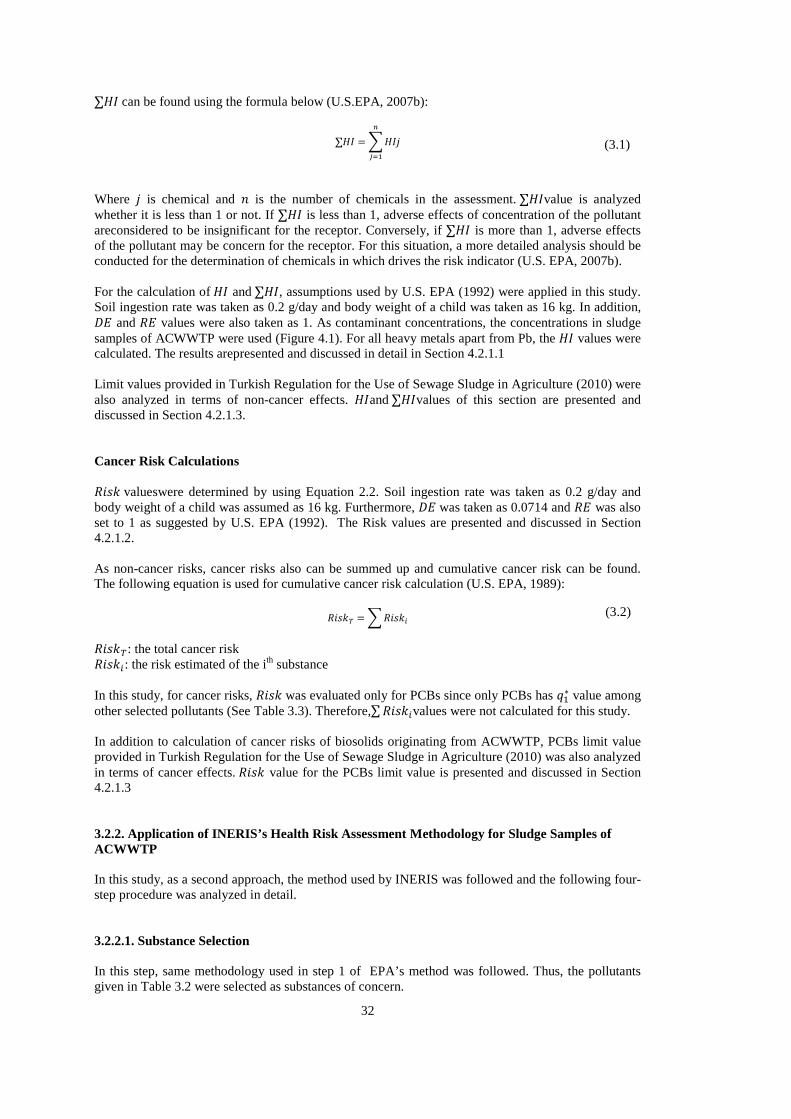
32
∑ can be found using the formula below (U.S.EPA, 2007b):
∑ = d eA
fg�
Where e is chemical and / is the number of chemicals in the assessment. ∑value is analyzed whether it is less than 1 or not. If ∑ is less than 1, adverse effects of concentration of the pollutant areconsidered to be insignificant for the receptor. Conversely, if ∑ is more than 1, adverse effects of the pollutant may be concern for the receptor. For this situation, a more detailed analysis should be conducted for the determination of chemicals in which drives the risk indicator (U.S. EPA, 2007b). For the calculation of and ∑, assumptions used by U.S. EPA (1992) were applied in this study. Soil ingestion rate was taken as 0.2 g/day and body weight of a child was taken as 16 kg. In addition, �� and �� values were also taken as 1. As contaminant concentrations, the concentrations in sludge samples of ACWWTP were used (Figure 4.1). For all heavy metals apart from Pb, the values were calculated. The results arepresented and discussed in detail in Section 4.2.1.1 Limit values provided in Turkish Regulation for the Use of Sewage Sludge in Agriculture (2010) were also analyzed in terms of non-cancer effects. and ∑values of this section are presented and discussed in Section 4.2.1.3. Cancer Risk Calculations ���� valueswere determined by using Equation 2.2. Soil ingestion rate was taken as 0.2 g/day and body weight of a child was assumed as 16 kg. Furthermore, �� was taken as 0.0714 and �� was also set to 1 as suggested by U.S. EPA (1992). The Risk values are presented and discussed in Section 4.2.1.2. As non-cancer risks, cancer risks also can be summed up and cumulative cancer risk can be found. The following equation is used for cumulative cancer risk calculation (U.S. EPA, 1989):
����h = d �����
����h: the total cancer risk �����: the risk estimated of the ith substance In this study, for cancer risks, ���� was evaluated only for PCBs since only PCBs has ��∗ value among other selected pollutants (See Table 3.3). Therefore,∑ �����values were not calculated for this study. In addition to calculation of cancer risks of biosolids originating from ACWWTP, PCBs limit value provided in Turkish Regulation for the Use of Sewage Sludge in Agriculture (2010) was also analyzed in terms of cancer effects. ���� value for the PCBs limit value is presented and discussed in Section 4.2.1.3 3.2.2. Application of INERIS’s Health Risk Assessment Methodology for Sludge Samples of ACWWTP In this study, as a second approach, the method used by INERIS was followed and the following four-step procedure was analyzed in detail. 3.2.2.1. Substance Selection In this step, same methodology used in step 1 of EPA’s method was followed. Thus, the pollutants given in Table 3.2 were selected as substances of concern.
(3.1)
(3.2)
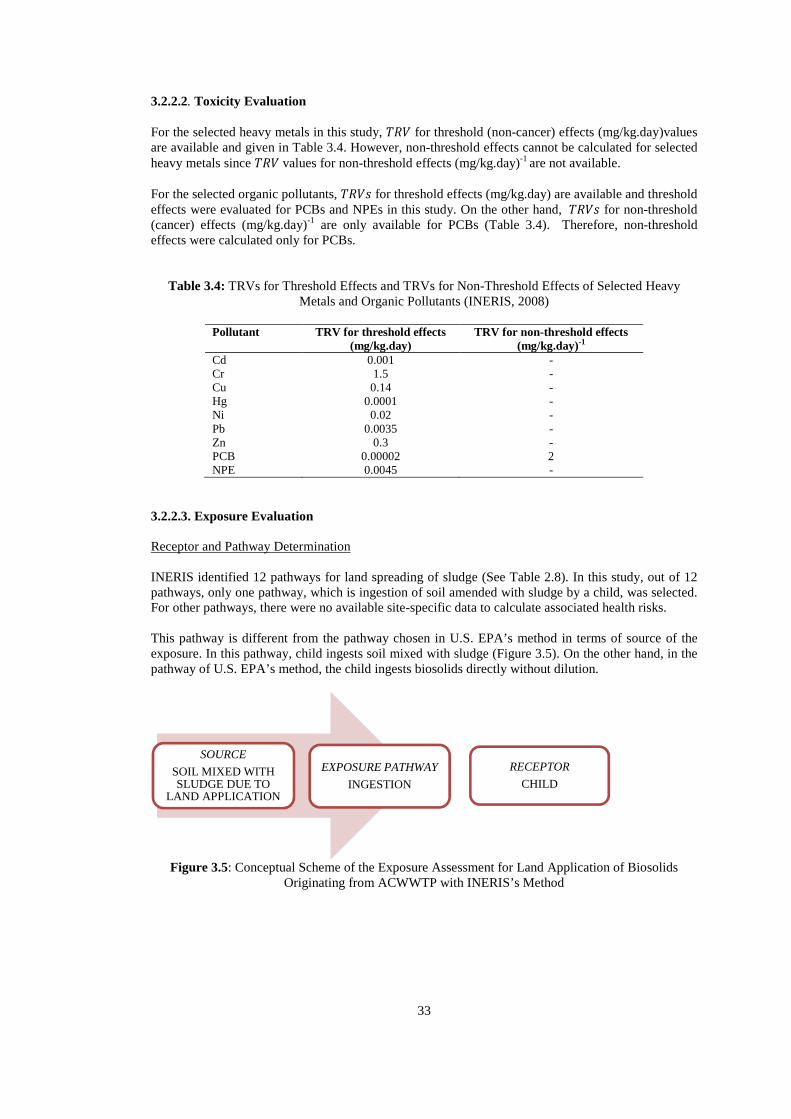
33
3.2.2.2. Toxicity Evaluation For the selected heavy metals in this study, %�& for threshold (non-cancer) effects (mg/kg.day)values are available and given in Table 3.4. However, non-threshold effects cannot be calculated for selected heavy metals since %�& values for non-threshold effects (mg/kg.day)-1 are not available. For the selected organic pollutants, %�&� for threshold effects (mg/kg.day) are available and threshold effects were evaluated for PCBs and NPEs in this study. On the other hand, %�&� for non-threshold (cancer) effects (mg/kg.day)-1 are only available for PCBs (Table 3.4). Therefore, non-threshold effects were calculated only for PCBs.
Table 3.4: TRVs for Threshold Effects and TRVs for Non-Threshold Effects of Selected Heavy Metals and Organic Pollutants (INERIS, 2008)
Pollutant TRV for threshold effects
(mg/kg.day) TRV for non-threshold effects
(mg/kg.day)-1 Cd 0.001 - Cr 1.5 - Cu 0.14 - Hg 0.0001 - Ni 0.02 - Pb 0.0035 - Zn 0.3 - PCB 0.00002 2 NPE 0.0045 -
3.2.2.3. Exposure Evaluation Receptor and Pathway Determination INERIS identified 12 pathways for land spreading of sludge (See Table 2.8). In this study, out of 12 pathways, only one pathway, which is ingestion of soil amended with sludge by a child, was selected. For other pathways, there were no available site-specific data to calculate associated health risks. This pathway is different from the pathway chosen in U.S. EPA’s method in terms of source of the exposure. In this pathway, child ingests soil mixed with sludge (Figure 3.5). On the other hand, in the pathway of U.S. EPA’s method, the child ingests biosolids directly without dilution.
Figure 3.5: Conceptual Scheme of the Exposure Assessment for Land Application of Biosolids
Originating from ACWWTP with INERIS’s Method
SOURCE
SOIL MIXED WITH SLUDGE DUE TO
LAND APPLICATION
EXPOSURE PATHWAY
INGESTION
RECEPTOR
CHILD
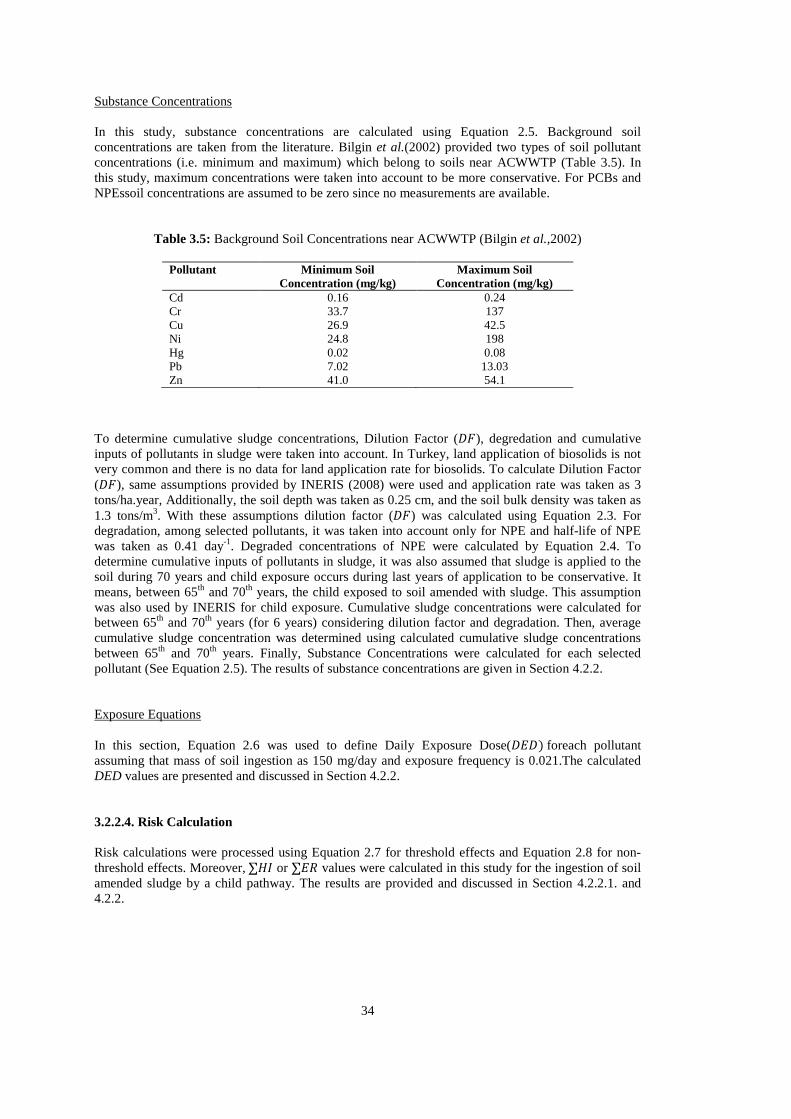
34
Substance Concentrations In this study, substance concentrations are calculated using Equation 2.5. Background soil concentrations are taken from the literature. Bilgin et al.(2002) provided two types of soil pollutant concentrations (i.e. minimum and maximum) which belong to soils near ACWWTP (Table 3.5). In this study, maximum concentrations were taken into account to be more conservative. For PCBs and NPEssoil concentrations are assumed to be zero since no measurements are available.
Table 3.5: Background Soil Concentrations near ACWWTP (Bilgin et al.,2002)
Pollutant Minimum Soil Concentration (mg/kg)
Maximum Soil Concentration (mg/kg)
Cd 0.16 0.24 Cr 33.7 137 Cu 26.9 42.5 Ni 24.8 198 Hg 0.02 0.08 Pb 7.02 13.03 Zn 41.0 54.1
To determine cumulative sludge concentrations, Dilution Factor (�'), degredation and cumulative inputs of pollutants in sludge were taken into account. In Turkey, land application of biosolids is not very common and there is no data for land application rate for biosolids. To calculate Dilution Factor (�'), same assumptions provided by INERIS (2008) were used and application rate was taken as 3 tons/ha.year, Additionally, the soil depth was taken as 0.25 cm, and the soil bulk density was taken as 1.3 tons/m3. With these assumptions dilution factor (�') was calculated using Equation 2.3. For degradation, among selected pollutants, it was taken into account only for NPE and half-life of NPE was taken as 0.41 day-1. Degraded concentrations of NPE were calculated by Equation 2.4. To determine cumulative inputs of pollutants in sludge, it was also assumed that sludge is applied to the soil during 70 years and child exposure occurs during last years of application to be conservative. It means, between 65th and 70th years, the child exposed to soil amended with sludge. This assumption was also used by INERIS for child exposure. Cumulative sludge concentrations were calculated for between 65th and 70th years (for 6 years) considering dilution factor and degradation. Then, average cumulative sludge concentration was determined using calculated cumulative sludge concentrations between 65th and 70th years. Finally, Substance Concentrations were calculated for each selected pollutant (See Equation 2.5). The results of substance concentrations are given in Section 4.2.2. Exposure Equations In this section, Equation 2.6 was used to define Daily Exposure Dose(���) foreach pollutant assuming that mass of soil ingestion as 150 mg/day and exposure frequency is 0.021.The calculated DED values are presented and discussed in Section 4.2.2. 3.2.2.4. Risk Calculation Risk calculations were processed using Equation 2.7 for threshold effects and Equation 2.8 for non-threshold effects. Moreover, ∑ or ∑�� values were calculated in this study for the ingestion of soil amended sludge by a child pathway. The results are provided and discussed in Section 4.2.2.1. and 4.2.2.
35
CHAPTER 4
RESULTS AND DISCUSSION
4.1. Pollutant Concentrations in Sludge Samples In this study, for the calculation of health risks, pollutant concentrations in sludge samples should be known. Measured concentrations of seven heavy metals (Cd, Cr, Cu, Hg, N, Pb and Zn), PCBs and NPEs in sludge samples originating from ACWWTP are presented and discussed in detail in the following sections.
4.1.1. Heavy Metal Concentrations in Sludge Samples
In ACWWTP, 10% of wastewater entering the treatment plant is industrial wastewater. Industrial wastewater originates from Sincan OSB, zinc-plating, metal industry, mine industry, and textile industry. These industries are the main sources for heavy metal concentrations in sludge of the ACWWTP. Heavy metal concentrations were analyzed in triplicate samples and for each sample, Atomic Absorption Spectrometry (AAS) processed three concentrations which means for each sample, nine heavy metal concentration values were measured. Average concentrations and standard deviations of selected heavy metals on yearly basis are given in Figure 4.1. In addition, the pollutant limit values for sludge provided in Turkish Regulation for the Use of Sewage Sludge in Agriculture (2010) are given in each figure at the top of the x-axis (See Figure 4.1) As can be seen from the Figure 4.1, the standard deviation values are usually very low showing the reproducibility of the measurements. The results also show that in a one year time frame, heavy metals concentrations in samples show some fluctuations. In addition, no common trend for all heavy metal concentrations can be observed monthly or seasonally. Irregular heavy metal inputs from the industries may be the reason for observing such differences in trends between heavy metals and fluctuations in heavy metal concentrations.
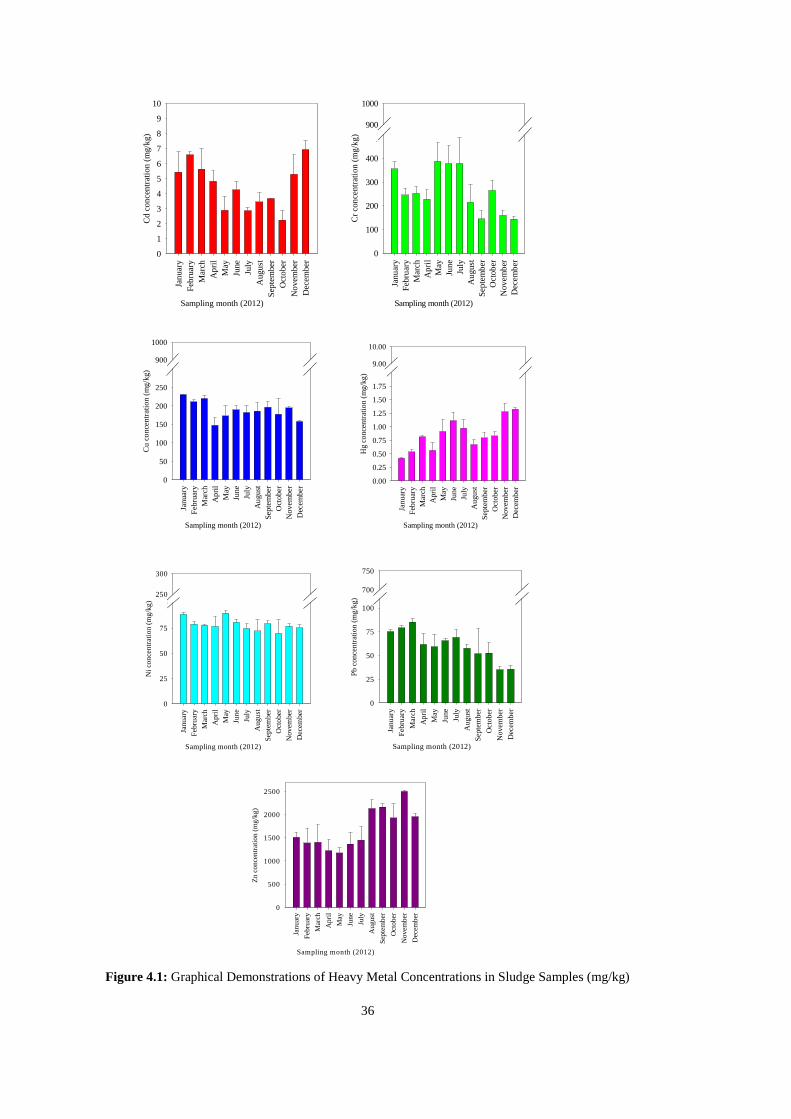
36
Figure 4.1: Graphical Demonstrations of Heavy Metal Concentrations in Sludge Samples (mg/kg)
Sampling month (2012)
Jan
uary
Feb
ruar
yM
arch
Ap
rilM
ayJu
neJu
lyA
ugu
stS
epte
mbe
rO
cto
ber
No
vem
ber
Dec
embe
r
Cd
con
cen
trat
ion
(mg/
kg)
0
1
2
3
4
5
6
7
8
9
10
Sampling month (2012)
Janu
ary
Feb
ruar
yM
arch
Apr
ilM
ayJu
neJu
lyA
ugu
stS
epte
mb
erO
ctob
erN
ovem
ber
Dec
emb
er
Cr
con
cent
ratio
n (m
g/kg
)
0
100
200
300
400
500900
1000
Sampling month (2012)
Jan
uar
yF
ebru
ary
Mar
chA
pril
May
Jun
eJu
lyA
ug
ust
Sep
tem
ber
Oct
ob
erN
ove
mb
erD
ecem
ber
Cu
co
nce
ntr
atio
n (
mg
/kg
)
0
50
100
150
200
250
300900
1000
Sampling month (2012)
Janu
ary
Feb
ruar
yM
arch
Apr
ilM
ayJu
neJu
lyA
ugu
stS
ept
emb
erO
ctob
erN
ovem
ber
Dec
emb
er
Hg
conc
entr
atio
n (m
g/kg
)
0.00
0.25
0.50
0.75
1.00
1.25
1.50
1.75
2.009.00
10.00
Sampling month (2012)
Janu
ary
Fe
bru
ary
Ma
rch
Ap
ril
May
Jun
e
July
Au
gus
t
Se
pte
mbe
r
Oct
obe
r
No
vem
ber
De
cem
ber
Ni c
on
cen
tra
tion
(mg
/kg
)
0
25
50
75
100250
300
Sampling month (2012)
Jan
uar
y
Feb
ruar
y
Mar
ch
Ap
ril
May
Jun
e
July
Au
gu
st
Sep
tem
ber
Oct
ob
er
No
vem
ber
Dec
emb
er
Pb
co
nce
ntr
atio
n (
mg
/kg
)
0
25
50
75
100
700
750
Sampling month (2012)
Jan
uar
y
Feb
ruar
y
Mar
ch
Ap
ril
May
Jun
e
July
Au
gust
Sep
tem
ber
Oct
ob
er
No
vem
ber
Dec
emb
er
Zn
co
ncen
trat
ion
(m
g/k
g)
0
500
1000
1500
2000
2500
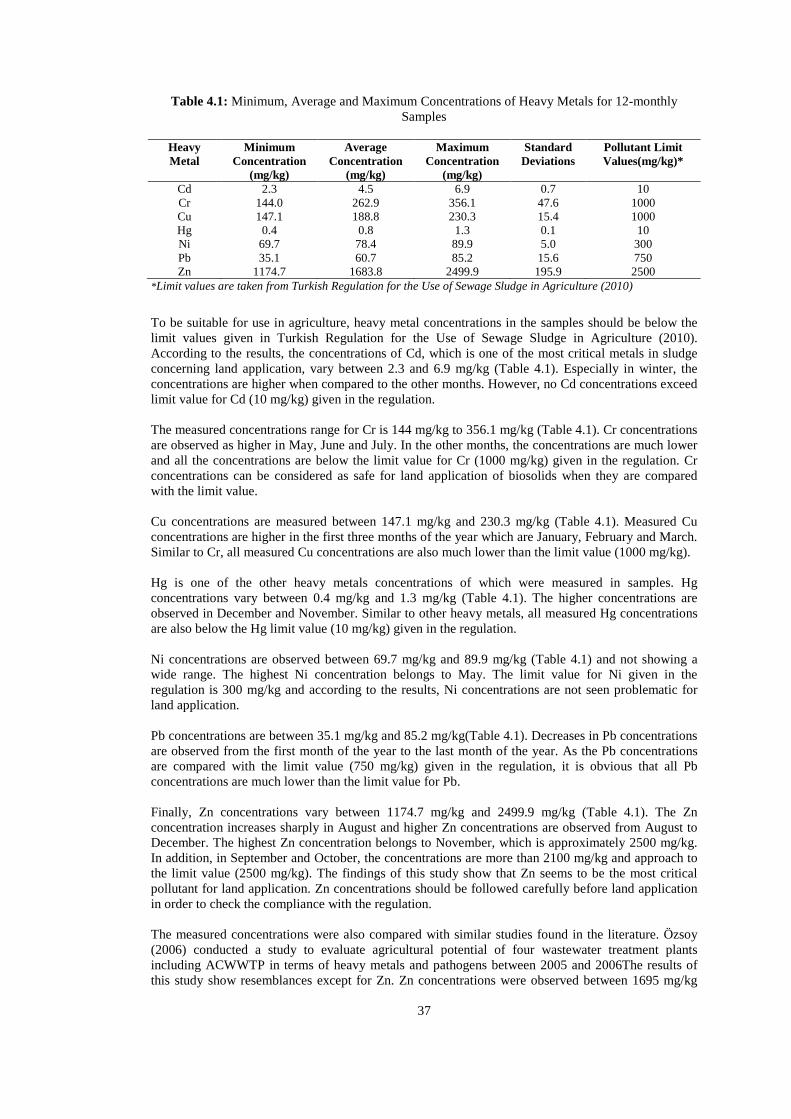
37
Table 4.1: Minimum, Average and Maximum Concentrations of Heavy Metals for 12-monthly Samples
Heavy Metal
Minimum Concentration
(mg/kg)
Average Concentration
(mg/kg)
Maximum Concentration
(mg/kg)
Standard Deviations
Pollutant Limit Values(mg/kg)*
Cd 2.3 4.5 6.9 0.7 10 Cr 144.0 262.9 356.1 47.6 1000 Cu 147.1 188.8 230.3 15.4 1000 Hg 0.4 0.8 1.3 0.1 10 Ni 69.7 78.4 89.9 5.0 300 Pb 35.1 60.7 85.2 15.6 750 Zn 1174.7 1683.8 2499.9 195.9 2500
*Limit values are taken from Turkish Regulation for the Use of Sewage Sludge in Agriculture (2010)
To be suitable for use in agriculture, heavy metal concentrations in the samples should be below the limit values given in Turkish Regulation for the Use of Sewage Sludge in Agriculture (2010). According to the results, the concentrations of Cd, which is one of the most critical metals in sludge concerning land application, vary between 2.3 and 6.9 mg/kg (Table 4.1). Especially in winter, the concentrations are higher when compared to the other months. However, no Cd concentrations exceed limit value for Cd (10 mg/kg) given in the regulation. The measured concentrations range for Cr is 144 mg/kg to 356.1 mg/kg (Table 4.1). Cr concentrations are observed as higher in May, June and July. In the other months, the concentrations are much lower and all the concentrations are below the limit value for Cr (1000 mg/kg) given in the regulation. Cr concentrations can be considered as safe for land application of biosolids when they are compared with the limit value. Cu concentrations are measured between 147.1 mg/kg and 230.3 mg/kg (Table 4.1). Measured Cu concentrations are higher in the first three months of the year which are January, February and March. Similar to Cr, all measured Cu concentrations are also much lower than the limit value (1000 mg/kg). Hg is one of the other heavy metals concentrations of which were measured in samples. Hg concentrations vary between 0.4 mg/kg and 1.3 mg/kg (Table 4.1). The higher concentrations are observed in December and November. Similar to other heavy metals, all measured Hg concentrations are also below the Hg limit value (10 mg/kg) given in the regulation. Ni concentrations are observed between 69.7 mg/kg and 89.9 mg/kg (Table 4.1) and not showing a wide range. The highest Ni concentration belongs to May. The limit value for Ni given in the regulation is 300 mg/kg and according to the results, Ni concentrations are not seen problematic for land application. Pb concentrations are between 35.1 mg/kg and 85.2 mg/kg(Table 4.1). Decreases in Pb concentrations are observed from the first month of the year to the last month of the year. As the Pb concentrations are compared with the limit value (750 mg/kg) given in the regulation, it is obvious that all Pb concentrations are much lower than the limit value for Pb. Finally, Zn concentrations vary between 1174.7 mg/kg and 2499.9 mg/kg (Table 4.1). The Zn concentration increases sharply in August and higher Zn concentrations are observed from August to December. The highest Zn concentration belongs to November, which is approximately 2500 mg/kg. In addition, in September and October, the concentrations are more than 2100 mg/kg and approach to the limit value (2500 mg/kg). The findings of this study show that Zn seems to be the most critical pollutant for land application. Zn concentrations should be followed carefully before land application in order to check the compliance with the regulation. The measured concentrations were also compared with similar studies found in the literature. Özsoy (2006) conducted a study to evaluate agricultural potential of four wastewater treatment plants including ACWWTP in terms of heavy metals and pathogens between 2005 and 2006The results of this study show resemblances except for Zn. Zn concentrations were observed between 1695 mg/kg
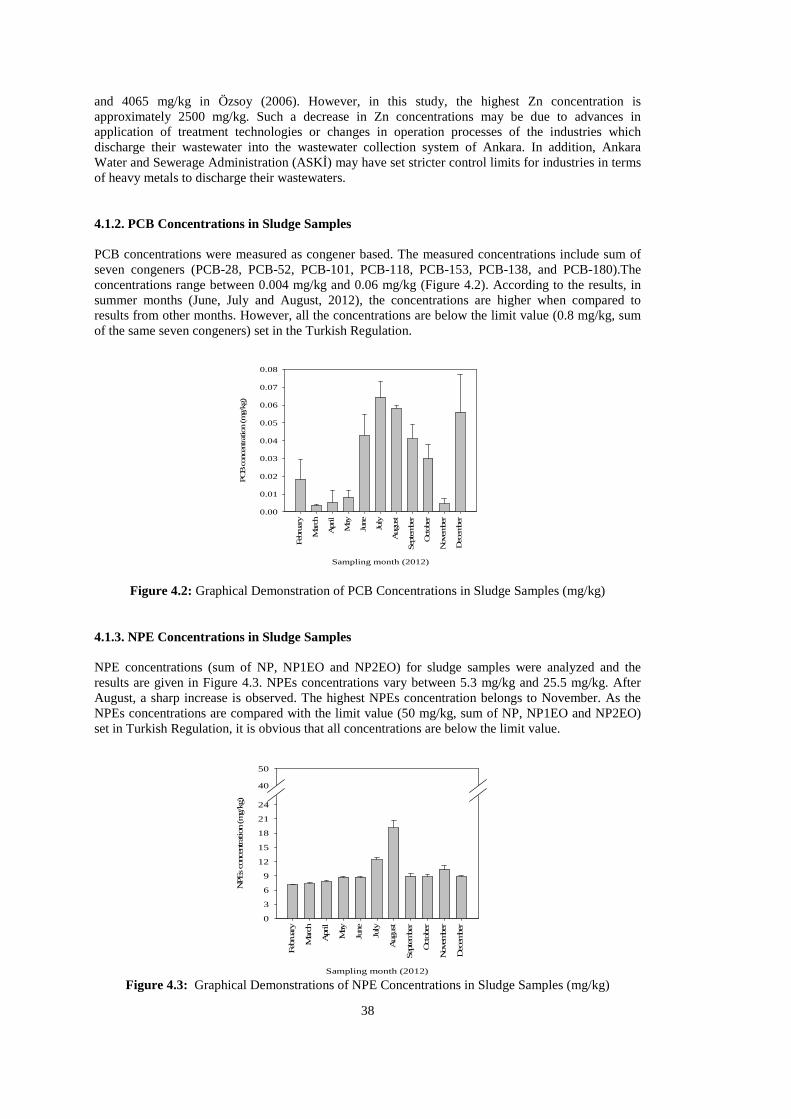
38
and 4065 mg/kg in Özsoy (2006). However, in this study, the highest Zn concentration is approximately 2500 mg/kg. Such a decrease in Zn concentrations may be due to advances in application of treatment technologies or changes in operation processes of the industries which discharge their wastewater into the wastewater collection system of Ankara. In addition, Ankara Water and Sewerage Administration (ASKİ) may have set stricter control limits for industries in terms of heavy metals to discharge their wastewaters. 4.1.2. PCB Concentrations in Sludge Samples PCB concentrations were measured as congener based. The measured concentrations include sum of seven congeners (PCB-28, PCB-52, PCB-101, PCB-118, PCB-153, PCB-138, and PCB-180).The concentrations range between 0.004 mg/kg and 0.06 mg/kg (Figure 4.2). According to the results, in summer months (June, July and August, 2012), the concentrations are higher when compared to results from other months. However, all the concentrations are below the limit value (0.8 mg/kg, sum of the same seven congeners) set in the Turkish Regulation.
Sampling month (2012)
Febru
ary
Marc
h
April
May
June
July
August
Septe
mber
Oct
ober
Nove
mber
Dece
mber
PCB c
once
ntratio
n (m
g/k
g)
0.00
0.01
0.02
0.03
0.04
0.05
0.06
0.07
0.08
Figure 4.2: Graphical Demonstration of PCB Concentrations in Sludge Samples (mg/kg) 4.1.3. NPE Concentrations in Sludge Samples NPE concentrations (sum of NP, NP1EO and NP2EO) for sludge samples were analyzed and the results are given in Figure 4.3. NPEs concentrations vary between 5.3 mg/kg and 25.5 mg/kg. After August, a sharp increase is observed. The highest NPEs concentration belongs to November. As the NPEs concentrations are compared with the limit value (50 mg/kg, sum of NP, NP1EO and NP2EO) set in Turkish Regulation, it is obvious that all concentrations are below the limit value.
Sampling month (2012)
Febru
ary
Marc
h
April
May
June
July
August
Septe
mber
Oct
ober
Nove
mber
Dece
mber
NPEs
conce
ntratio
n (m
g/k
g)
0
3
6
9
12
15
18
21
24
40
50
Figure 4.3: Graphical Demonstrations of NPE Concentrations in Sludge Samples (mg/kg)
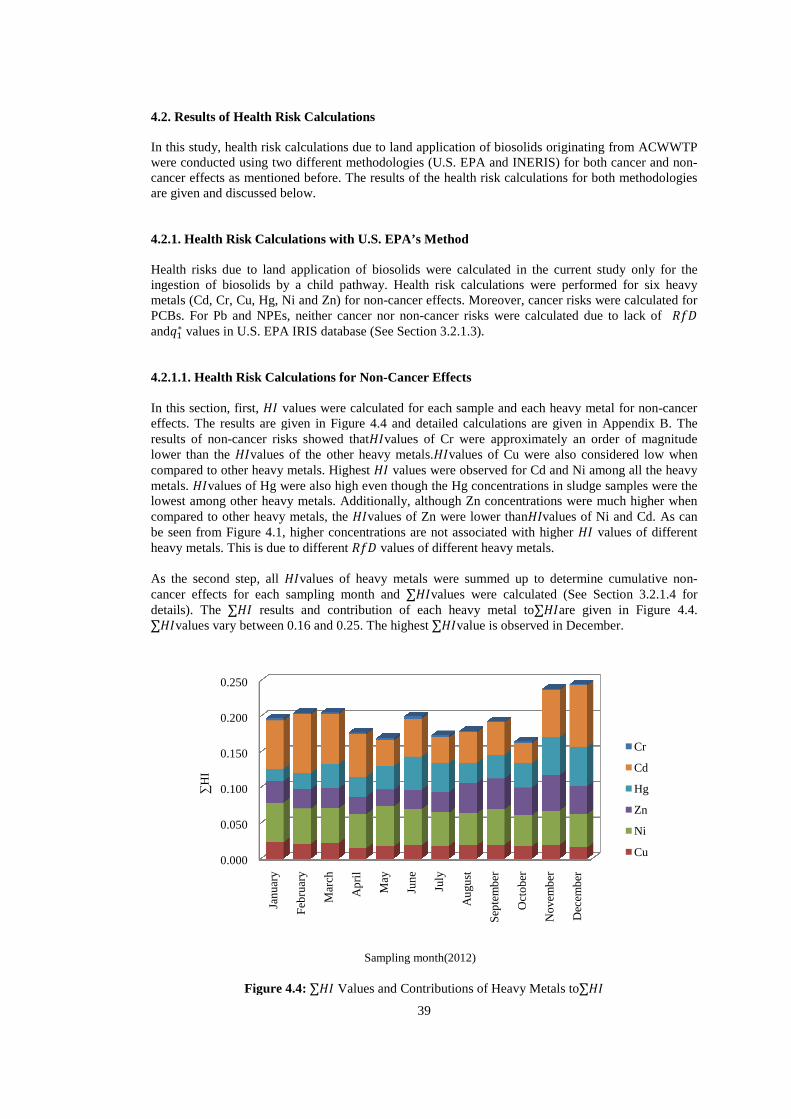
4.2. Results of Health Risk Calculations In this study, health risk calculations due to land application of biosolids originating from ACWWTP were conducted using two different methodologiescancer effects as mentioned before. The results of the health risk calculations for both methodologies are given and discussed below. 4.2.1. Health Risk Calculations with U.S. EPA’s Method Health risks due to land application of biosolids were calculated in the current studyingestion of biosolids by a child pathway. Health risk calculations were performed for six heavy metals (Cd, Cr, Cu, Hg, Ni and Zn) for nonPCBs. For Pb and NPEs, neither cancer nor nonand��∗ values in U.S. EPA IRIS database (See Section 3.2.1.3). 4.2.1.1. Health Risk Calculations for Non In this section, first, values were calculated for each sample and each heavy metal for noneffects. The results are given in Figure 4.4results of non-cancer risks showed thatlower than the values of the other heavy metals.compared to other heavy metals. Highest metals. values of Hg were also high even though the Hg concentrations in sludge samples were the lowest among other heavy metals. Additionally, although Zn concentrations were much higher when compared to other heavy metals, the be seen from Figure 4.1, higher concentrations are not associated with higher heavy metals. This is due to different As the second step, all
cancer effects for each sampling month and details). The ∑ results and contribution of each heavy metal to∑values vary between 0.16 and 0.2
Figure 4.4:
0.000
0.050
0.100
0.150
0.200
0.250
Jan
uar
y
∑H
I
39
4.2. Results of Health Risk Calculations
In this study, health risk calculations due to land application of biosolids originating from ACWWTP were conducted using two different methodologies (U.S. EPA and INERIS) for both cancer and noncancer effects as mentioned before. The results of the health risk calculations for both methodologies are given and discussed below.
4.2.1. Health Risk Calculations with U.S. EPA’s Method
to land application of biosolids were calculated in the current studyingestion of biosolids by a child pathway. Health risk calculations were performed for six heavy metals (Cd, Cr, Cu, Hg, Ni and Zn) for non-cancer effects. Moreover, cancer risks were calculated for PCBs. For Pb and NPEs, neither cancer nor non-cancer risks were calculated due to lack of
values in U.S. EPA IRIS database (See Section 3.2.1.3).
4.2.1.1. Health Risk Calculations for Non-Cancer Effects
values were calculated for each sample and each heavy metal for noneffects. The results are given in Figure 4.4 and detailed calculations are given in Appendix B
cancer risks showed thatvalues of Cr were approximately an order of magnitude values of the other heavy metals.values of Cu were also considered low when
compared to other heavy metals. Highest values were observed for Cd and Ni among all the heavy values of Hg were also high even though the Hg concentrations in sludge samples were the
lowest among other heavy metals. Additionally, although Zn concentrations were much higher when compared to other heavy metals, the values of Zn were lower thanvalues of Ni and Cd. As can be seen from Figure 4.1, higher concentrations are not associated with higher heavy metals. This is due to different ��� values of different heavy metals.
values of heavy metals were summed up to determine cumulative noncancer effects for each sampling month and ∑values were calculated (See Section 3.2.1.4 for
results and contribution of each heavy metal to∑are given in Figure 4.4. vary between 0.16 and 0.25. The highest ∑value is observed in December.
Figure 4.4: ∑ Values and Contributions of Heavy Metals to
Feb
ruar
y
Mar
ch
Ap
ril
May
Jun
e
July
Au
gust
Sep
tem
ber
Oct
ob
er
No
vem
ber
Dec
emb
er
Sampling month(2012)
In this study, health risk calculations due to land application of biosolids originating from ACWWTP (U.S. EPA and INERIS) for both cancer and non-
cancer effects as mentioned before. The results of the health risk calculations for both methodologies
to land application of biosolids were calculated in the current study only for the ingestion of biosolids by a child pathway. Health risk calculations were performed for six heavy
risks were calculated for cancer risks were calculated due to lack of ���
values were calculated for each sample and each heavy metal for non-cancer and detailed calculations are given in Appendix B. The
Cr were approximately an order of magnitude values of Cu were also considered low when
values were observed for Cd and Ni among all the heavy values of Hg were also high even though the Hg concentrations in sludge samples were the
lowest among other heavy metals. Additionally, although Zn concentrations were much higher when values of Ni and Cd. As can
be seen from Figure 4.1, higher concentrations are not associated with higher values of different
metals were summed up to determine cumulative non-values were calculated (See Section 3.2.1.4 for
are given in Figure 4.4. value is observed in December.
Values and Contributions of Heavy Metals to∑
Dec
emb
er
Cr
Cd
Hg
Zn
Ni
Cu
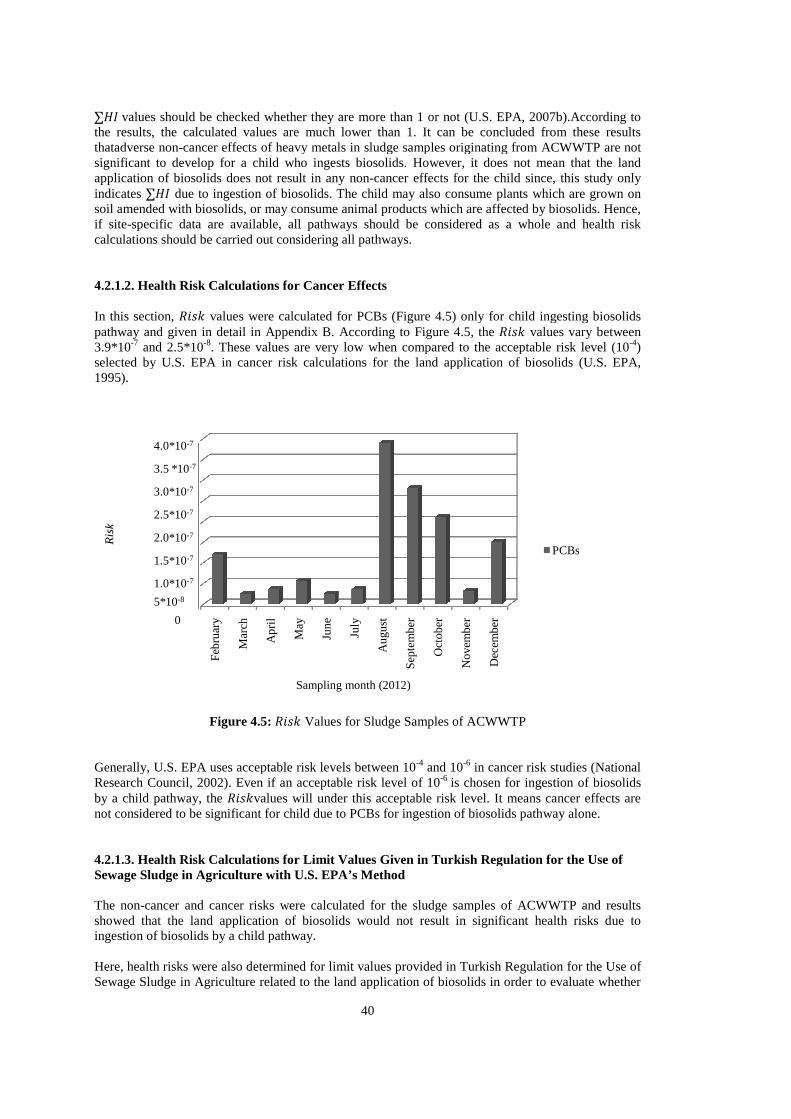
∑ values should be checked whether they are more than 1 or not (U.S. EPA, 2007b).According to the results, the calculated values are much lower than 1. It can be concluded from these results thatadverse non-cancer effects of heavy metals in sludge samples significant to develop for a child who ingests biosolids. However, it does not mean that the land application of biosolids does not result in any nonindicates ∑ due to ingestion of biosolids. The child may also consume plants which are grown on soil amended with biosolids, or may consume animal products which are affected by biosolids. Hence, if site-specific data are available, all pathways should be considered as a wholcalculations should be carried out considering all pathways. 4.2.1.2. Health Risk Calculations for Cancer Effects In this section, ���� values were calculated for PCBs (pathway and given in detail in Appendix B3.9*10-7 and 2.5*10-8. These values are very low when compared to the acceptable risk level (10selected by U.S. EPA in cancer risk calculations for the land a1995).
Figure 4.5: ����
Generally, U.S. EPA uses acceptable risk levels between 10Research Council, 2002). Even if an acceptable risk level of 10by a child pathway, the ����values will under this acceptable risk level. It means cancer effects are not considered to be significant for child due to PCBs for ingestion of biosolids pathwa 4.2.1.3. Health Risk Calculations for Limit Values Given in Turkish Regulation for the Use of Sewage Sludge in Agriculture with U.S. EPA’s Method The non-cancer and cancer risks were calculated for the sludge samples of ACWWTP and results showed that the land application of biosolids would not result in significant health risks due to ingestion of biosolids by a child pathway. Here, health risks were also determined for limit values provided in Turkish Regulation for the Use of Sewage Sludge in Agriculture related to the land application of biosolids in order to evaluate whether
Feb
ruar
y
Mar
ch
Ap
ril
4.0*10-7
3.5 *10-7
3.0*10-7
2.5*10-7
2.0*10-7
1.5*10-7
1.0*10-7
5*10-8
0
Ris
k
40
values should be checked whether they are more than 1 or not (U.S. EPA, 2007b).According to
the results, the calculated values are much lower than 1. It can be concluded from these results cancer effects of heavy metals in sludge samples originating from ACWWTP are not
to develop for a child who ingests biosolids. However, it does not mean that the land application of biosolids does not result in any non-cancer effects for the child since, this study only
ngestion of biosolids. The child may also consume plants which are grown on soil amended with biosolids, or may consume animal products which are affected by biosolids. Hence,
specific data are available, all pathways should be considered as a whole and health risk calculations should be carried out considering all pathways.
4.2.1.2. Health Risk Calculations for Cancer Effects
values were calculated for PCBs (Figure 4.5) only for child ingesting biosolids and given in detail in Appendix B. According to Figure 4.5, the ���� values vary between
. These values are very low when compared to the acceptable risk level (10selected by U.S. EPA in cancer risk calculations for the land application of biosolids (U.S. EPA,
•
���� Values for Sludge Samples of ACWWTP
Generally, U.S. EPA uses acceptable risk levels between 10-4 and 10-6 in cancer risk studies (National Research Council, 2002). Even if an acceptable risk level of 10-6 is chosen for ingestion of biosolids
values will under this acceptable risk level. It means cancer effects are for child due to PCBs for ingestion of biosolids pathway alone.
4.2.1.3. Health Risk Calculations for Limit Values Given in Turkish Regulation for the Use of Sewage Sludge in Agriculture with U.S. EPA’s Method
cancer risks were calculated for the sludge samples of ACWWTP and results showed that the land application of biosolids would not result in significant health risks due to ingestion of biosolids by a child pathway.
Here, health risks were also determined for limit values provided in Turkish Regulation for the Use of Sewage Sludge in Agriculture related to the land application of biosolids in order to evaluate whether
May
Jun
e
July
Au
gust
Sep
tem
ber
Oct
ob
er
No
vem
ber
Dec
emb
er
PCBs
Sampling month (2012)
values should be checked whether they are more than 1 or not (U.S. EPA, 2007b).According to the results, the calculated values are much lower than 1. It can be concluded from these results
iginating from ACWWTP are not to develop for a child who ingests biosolids. However, it does not mean that the land
cancer effects for the child since, this study only ngestion of biosolids. The child may also consume plants which are grown on
soil amended with biosolids, or may consume animal products which are affected by biosolids. Hence, e and health risk
only for child ingesting biosolids values vary between
. These values are very low when compared to the acceptable risk level (10-4) pplication of biosolids (U.S. EPA,
in cancer risk studies (National is chosen for ingestion of biosolids
values will under this acceptable risk level. It means cancer effects are alone.
4.2.1.3. Health Risk Calculations for Limit Values Given in Turkish Regulation for the Use of
cancer risks were calculated for the sludge samples of ACWWTP and results showed that the land application of biosolids would not result in significant health risks due to
Here, health risks were also determined for limit values provided in Turkish Regulation for the Use of Sewage Sludge in Agriculture related to the land application of biosolids in order to evaluate whether
PCBs
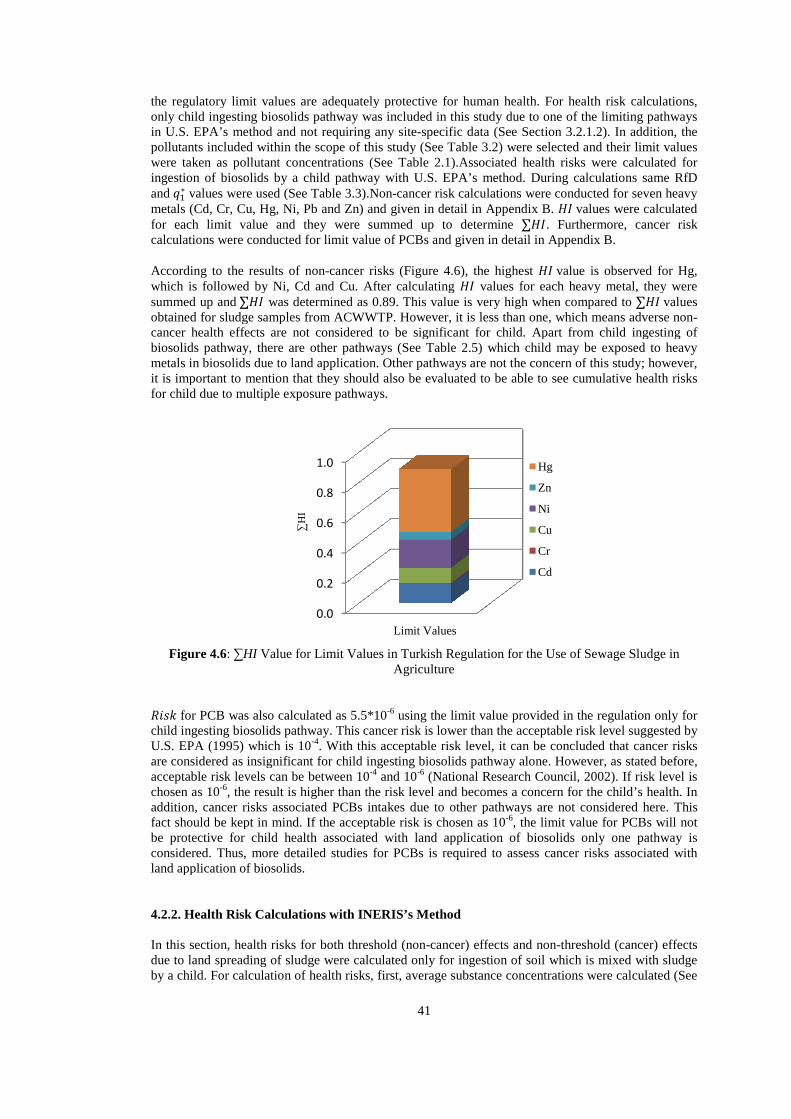
the regulatory limit values are adequately protectonly child ingesting biosolids pathwayin U.S. EPA’s method and not requiring any sitepollutants included within the scope of this study (See Table 3.2) were selected and their limit values were taken as pollutant concentrations (See Table 2.1).Associated health risks were calculated for ingestion of biosolids by a child pathway with U.S. Eand ��
∗ values were used (See Table 3.3).Nonmetals (Cd, Cr, Cu, Hg, Ni, Pb and Zn)for each limit value and they were summed up to determine calculations were conducted for limit value of PCBs and given in detail in Appendix B. According to the results of nonwhich is followed by Ni, Cd and Cu. After calculating summed up and ∑ was determined as 0.89. This value is very high when compared to obtained for sludge samples from ACWWTP. However, it is less than one, which means adverse nocancer health effects are not considered to be significantbiosolids pathway, there are other pathways (See Table 2.5) which child mametals in biosolids due to land application. Other pathways are not the concern of this study; however, it is important to mention that they should also be evaluated to be able to see cumulative health risks for child due to multiple exposure pathways.
Figure 4.6: ∑HI Value for Limit Values in Turkish Regulation for the Use of Sewage Sludge in
���� for PCB was also calculated as 5.5*10child ingesting biosolids pathwayU.S. EPA (1995) which is 10are considered as insignificantacceptable risk levels can be between 10chosen as 10-6, the result is higher than the risk level and becomes a concern addition, cancer risks associated PCBs intakes due to other pathways are not considered here. This fact should be kept in mind. If the acceptable risk is chosen as 10be protective for child hconsidered. Thus, more detailed studies for PCBs is required to assess cancer risks associated with land application of biosolids. 4.2.2. Health Risk Calculations with INERIS’s Metho In this section, health risks for both threshold (nondue to land spreading of sludge were calculated by a child. For calculation of health risks, f
41
the regulatory limit values are adequately protective for human health. For health risk calculationsonly child ingesting biosolids pathway was included in this study due to one of the limiting pathways in U.S. EPA’s method and not requiring any site-specific data (See Section 3.2.1.2)pollutants included within the scope of this study (See Table 3.2) were selected and their limit values were taken as pollutant concentrations (See Table 2.1).Associated health risks were calculated for ingestion of biosolids by a child pathway with U.S. EPA’s method. During calculations same RfD
values were used (See Table 3.3).Non-cancer risk calculations were conducted for seven heavy metals (Cd, Cr, Cu, Hg, Ni, Pb and Zn) and given in detail in Appendix B.
for each limit value and they were summed up to determine ∑. Furthermore, cancer risk ducted for limit value of PCBs and given in detail in Appendix B.
According to the results of non-cancer risks (Figure 4.6), the highest value is observed for Hg, which is followed by Ni, Cd and Cu. After calculating values for each heavy metal, they were
was determined as 0.89. This value is very high when compared to sludge samples from ACWWTP. However, it is less than one, which means adverse no
cancer health effects are not considered to be significant for child. Apart from child ingesting of biosolids pathway, there are other pathways (See Table 2.5) which child mametals in biosolids due to land application. Other pathways are not the concern of this study; however, it is important to mention that they should also be evaluated to be able to see cumulative health risks
exposure pathways.
Value for Limit Values in Turkish Regulation for the Use of Sewage Sludge in
Agriculture
for PCB was also calculated as 5.5*10-6 using the limit value provided in the regulationchild ingesting biosolids pathway. This cancer risk is lower than the acceptable risk level suggested by U.S. EPA (1995) which is 10-4. With this acceptable risk level, it can be concluded thare considered as insignificant for child ingesting biosolids pathway alone. However, as stated before, acceptable risk levels can be between 10-4 and 10-6 (National Research Council, 2002). If risk level is
, the result is higher than the risk level and becomes a concern for the child’s health. In addition, cancer risks associated PCBs intakes due to other pathways are not considered here. This fact should be kept in mind. If the acceptable risk is chosen as 10-6, the limit value for PCBs will not be protective for child health associated with land application of biosolids only one pathway is considered. Thus, more detailed studies for PCBs is required to assess cancer risks associated with land application of biosolids.
. Health Risk Calculations with INERIS’s Method
In this section, health risks for both threshold (non-cancer) effects and non-threshold (cancer) effects due to land spreading of sludge were calculated only for ingestion of soil which is mixed with sludge by a child. For calculation of health risks, first, average substance concentrations were calculated (See
0.0
0.2
0.4
0.6
0.8
1.0 Hg
Zn
Ni
Cu
Cr
Cd
∑H
I
Limit Values
health risk calculations, was included in this study due to one of the limiting pathways
(See Section 3.2.1.2). In addition, the pollutants included within the scope of this study (See Table 3.2) were selected and their limit values were taken as pollutant concentrations (See Table 2.1).Associated health risks were calculated for
PA’s method. During calculations same RfD cancer risk calculations were conducted for seven heavy
values were calculated . Furthermore, cancer risk
ducted for limit value of PCBs and given in detail in Appendix B.
value is observed for Hg, values for each heavy metal, they were
was determined as 0.89. This value is very high when compared to ∑ values sludge samples from ACWWTP. However, it is less than one, which means adverse non-
for child. Apart from child ingesting of biosolids pathway, there are other pathways (See Table 2.5) which child may be exposed to heavy metals in biosolids due to land application. Other pathways are not the concern of this study; however, it is important to mention that they should also be evaluated to be able to see cumulative health risks
Value for Limit Values in Turkish Regulation for the Use of Sewage Sludge in
using the limit value provided in the regulation only for . This cancer risk is lower than the acceptable risk level suggested by
. With this acceptable risk level, it can be concluded that cancer risks . However, as stated before,
(National Research Council, 2002). If risk level is for the child’s health. In
addition, cancer risks associated PCBs intakes due to other pathways are not considered here. This , the limit value for PCBs will not
ealth associated with land application of biosolids only one pathway is considered. Thus, more detailed studies for PCBs is required to assess cancer risks associated with
threshold (cancer) effects for ingestion of soil which is mixed with sludge
irst, average substance concentrations were calculated (See
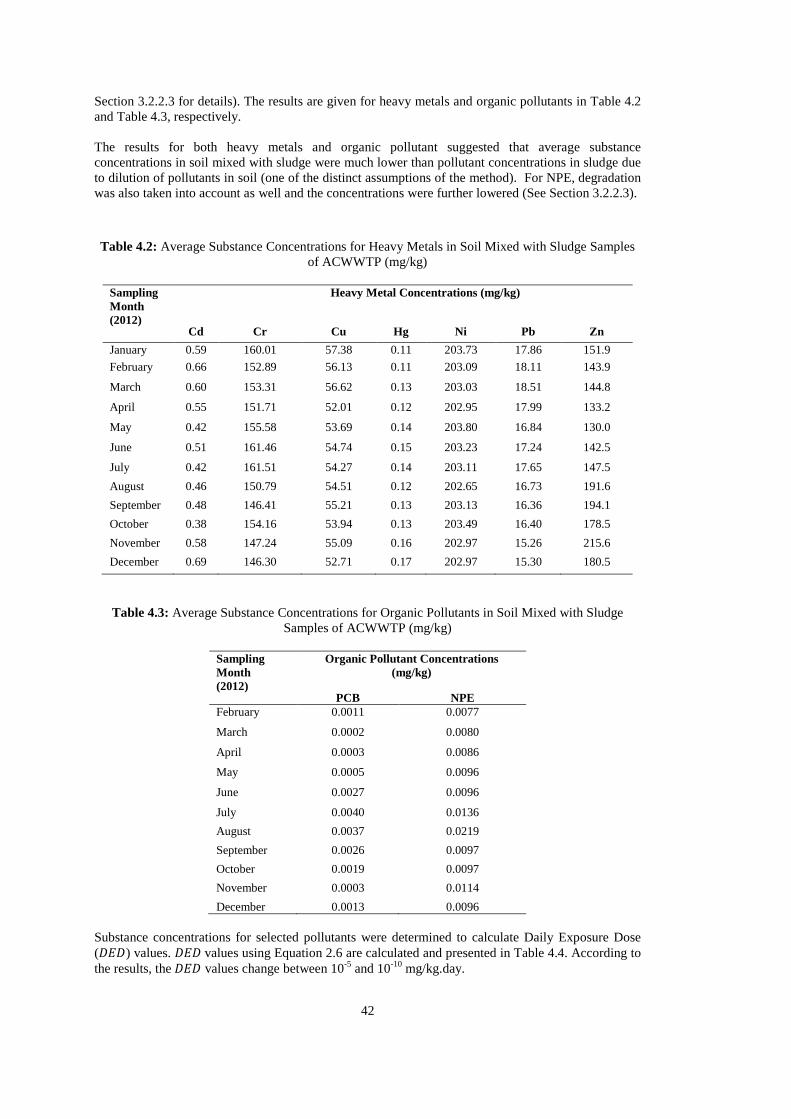
42
Section 3.2.2.3 for details). The results are given for heavy metals and organic pollutants in Table 4.2 and Table 4.3, respectively. The results for both heavy metals and organic pollutant suggested that average substance concentrations in soil mixed with sludge were much lower than pollutant concentrations in sludge due to dilution of pollutants in soil (one of the distinct assumptions of the method). For NPE, degradation was also taken into account as well and the concentrations were further lowered (See Section 3.2.2.3).
Table 4.2: Average Substance Concentrations for Heavy Metals in Soil Mixed with Sludge Samples of ACWWTP (mg/kg)
Sampling Month (2012)
Heavy Metal Concentrations (mg/kg)
Cd Cr Cu Hg Ni Pb Zn
January 0.59 160.01 57.38 0.11 203.73 17.86 151.9
February 0.66 152.89 56.13 0.11 203.09 18.11 143.9
March 0.60 153.31 56.62 0.13 203.03 18.51 144.8
April 0.55 151.71 52.01 0.12 202.95 17.99 133.2
May 0.42 155.58 53.69 0.14 203.80 16.84 130.0
June 0.51 161.46 54.74 0.15 203.23 17.24 142.5
July 0.42 161.51 54.27 0.14 203.11 17.65 147.5
August 0.46 150.79 54.51 0.12 202.65 16.73 191.6
September 0.48 146.41 55.21 0.13 203.13 16.36 194.1
October 0.38 154.16 53.94 0.13 203.49 16.40 178.5
November 0.58 147.24 55.09 0.16 202.97 15.26 215.6
December 0.69 146.30 52.71 0.17 202.97 15.30 180.5
Table 4.3: Average Substance Concentrations for Organic Pollutants in Soil Mixed with Sludge Samples of ACWWTP (mg/kg)
Sampling Month (2012)
Organic Pollutant Concentrations (mg/kg)
PCB NPE February 0.0011 0.0077
March 0.0002 0.0080
April 0.0003 0.0086
May 0.0005 0.0096
June 0.0027 0.0096
July 0.0040 0.0136
August 0.0037 0.0219
September 0.0026 0.0097
October 0.0019 0.0097
November 0.0003 0.0114
December 0.0013 0.0096 Substance concentrations for selected pollutants were determined to calculate Daily Exposure Dose (���) values. ��� values using Equation 2.6 are calculated and presented in Table 4.4. According to the results, the ��� values change between 10-5 and 10-10 mg/kg.day.
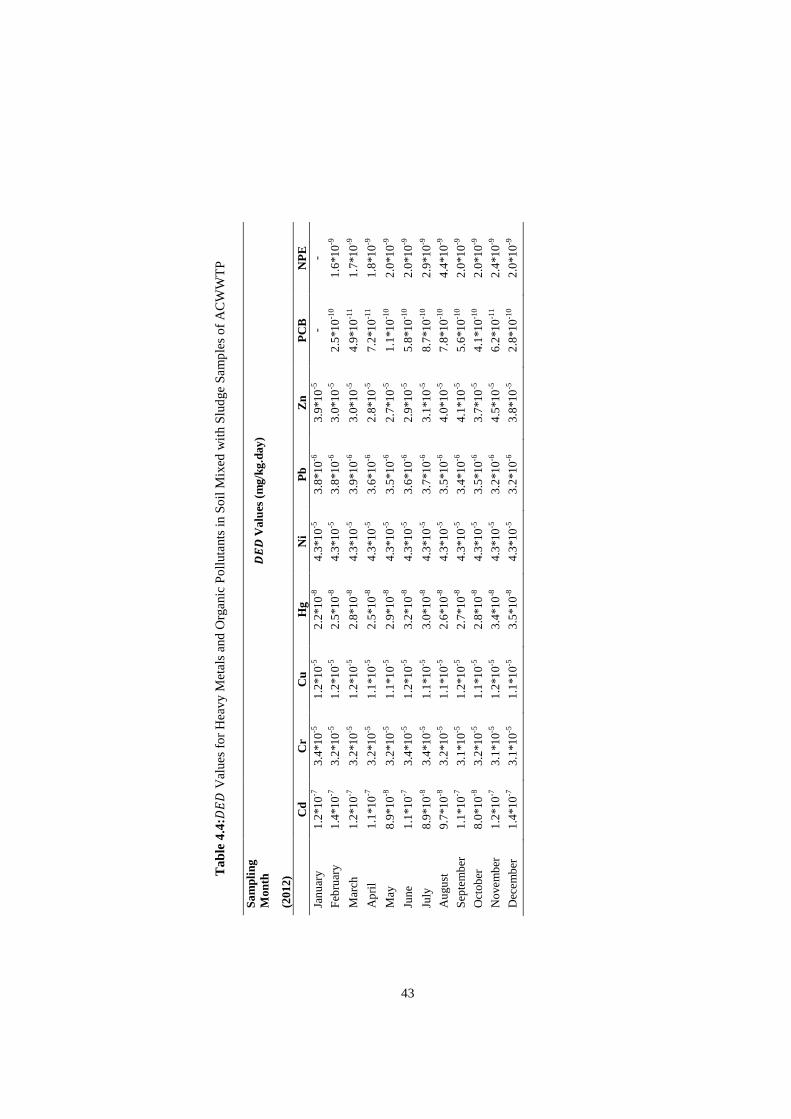
43
T
able
4.4
:���
Val
ues
for
Hea
vy M
eta
ls a
nd O
rga
nic
Po
lluta
nts
in
So
il M
ixed
with
Slu
dge
Sa
mp
les
of
AC
WW
TP
Sam
plin
g M
onth
(201
2)
ai
a V
alue
s (m
g/kg
.day
)
C
d C
r C
u H
g N
i P
b Z
n P
CB
N
PE
Ja
nu
ary
1.2
*10-7
3
.4*1
0-5
1.2
*10-5
2
.2*1
0-8
4.3
*10-5
3
.8*1
0-6
3.9
*10-5
-
-
Feb
ruar
y 1
.4*1
0-7
3.2
*10-5
1
.2*1
0-5
2.5
*10-8
4
.3*1
0-5
3.8
*10-6
3
.0*1
0-5
2.5
*10-1
0 1
.6*1
0-9
Mar
ch
1.2
*10-7
3
.2*1
0-5
1.2
*10-5
2
.8*1
0-8
4.3
*10-5
3
.9*1
0-6
3.0
*10-5
4
.9*1
0-11
1.7
*10-9
Ap
ril
1.1
*10-7
3
.2*1
0-5
1.1
*10-5
2
.5*1
0-8
4.3
*10-5
3
.6*1
0-6
2.8
*10-5
7
.2*1
0-11
1.8
*10-9
May
8
.9*1
0-8
3.2
*10-5
1
.1*1
0-5
2.9
*10-8
4
.3*1
0-5
3.5
*10-6
2
.7*1
0-5
1.1
*10-1
0 2
.0*1
0-9
Jun
e 1
.1*1
0-7
3.4
*10-5
1
.2*1
0-5
3.2
*10-8
4
.3*1
0-5
3.6
*10-6
2
.9*1
0-5
5.8
*10-1
0 2
.0*1
0-9
July
8
.9*1
0-8
3.4
*10-5
1
.1*1
0-5
3.0
*10-8
4
.3*1
0-5
3.7
*10-6
3
.1*1
0-5
8.7
*10-1
0 2
.9*1
0-9
Au
gust
9
.7*1
0-8
3.2
*10-5
1
.1*1
0-5
2.6
*10-8
4
.3*1
0-5
3.5
*10-6
4
.0*1
0-5
7.8
*10-1
0 4
.4*1
0-9
Sep
tem
ber
1
.1*1
0-7
3.1
*10-5
1
.2*1
0-5
2.7
*10-8
4
.3*1
0-5
3.4
*10-6
4
.1*1
0-5
5.6
*10-1
0 2
.0*1
0-9
Oct
ob
er
8.0
*10-8
3
.2*1
0-5
1.1
*10-5
2
.8*1
0-8
4.3
*10-5
3
.5*1
0-6
3.7
*10-5
4
.1*1
0-10
2.0
*10-9
No
vem
ber
1
.2*1
0-7
3.1
*10-5
1
.2*1
0-5
3.4
*10-8
4
.3*1
0-5
3.2
*10-6
4
.5*1
0-5
6.2
*10-1
1 2
.4*1
0-9
Dec
em
ber
1
.4*1
0-7
3.1
*10-5
1
.1*1
0-5
3.5
*10-8
4
.3*1
0-5
3.2
*10-6
3
.8*1
0-5
2.8
*10-1
0 2
.0*1
0-9
43
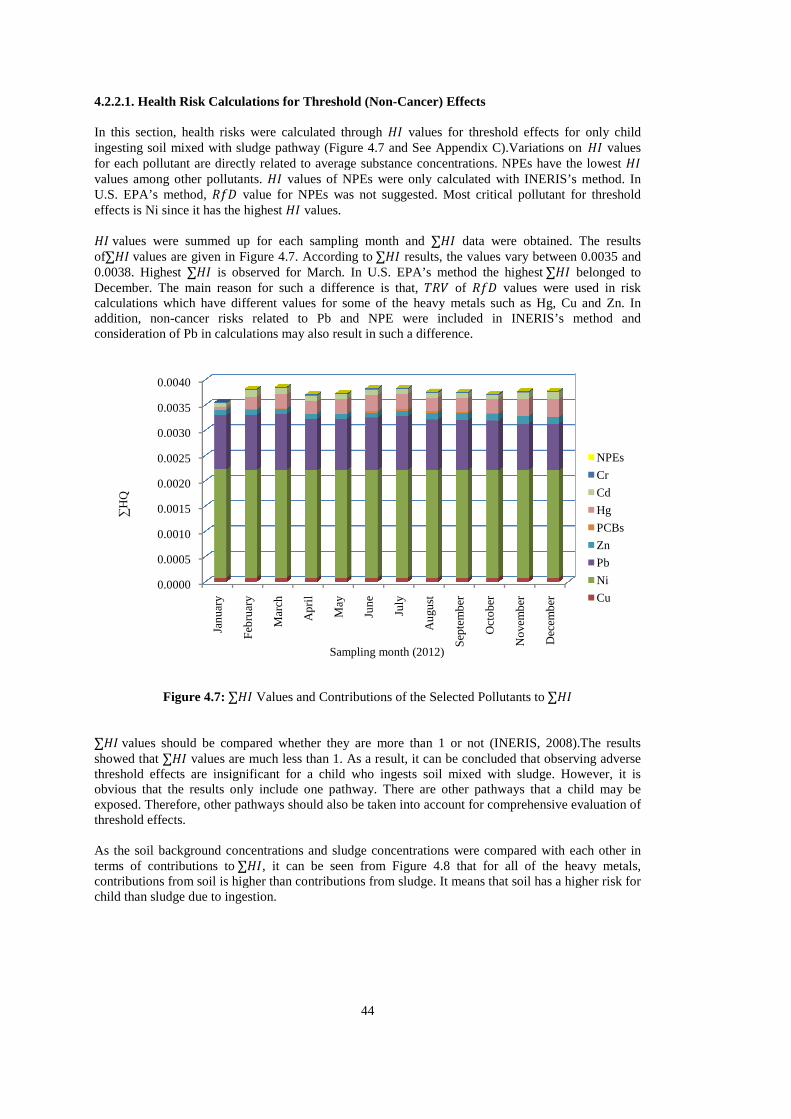
4.2.2.1. Health Risk Calculations for Threshold (Non In this section, health risks were calculated through ingesting soil mixed with sludge pathwayfor each pollutant are directly related to average substance concentrations. NPEs have the lowest values among other pollutants. U.S. EPA’s method, ��� value for NPEs effects is Ni since it has the highest values were summed up for each sampling month and of∑ values are given in Figure 4.0.0038. Highest ∑ is observed for December. The main reason for such a differencecalculations which have different values for some of the heavy metals such as Hg, Cu and Zn. In addition, non-cancer risks related to Pb and NPE were included in INERIS’s method and consideration of Pb in calculations may also result in such a difference.
Figure 4.7: ∑ Values and Contributions of the Selected Pollutants to ∑ values should be compared whether they are more than 1 or not (INERIS, 2008).The results showed that ∑ values are much less than 1. As a result, it can be concluded that threshold effects are insignificant for a child who ingests soilobvious that the results only include one pathway. There are other pathways that a child may be exposed. Therefore, other pathways should also be taken into account for comprehensive evaluation of threshold effects. As the soil background concentrations and sludge concentrations were compared with each other in terms of contributions to ∑, it can be seen from Figure 4.8 that for contributions from soil is higher thanchild than sludge due to ingestion.
0.0000
0.0005
0.0010
0.0015
0.0020
0.0025
0.0030
0.0035
0.0040
Jan
uar
y
Feb
ruar
y
Mar
ch
∑H
Q
44
4.2.2.1. Health Risk Calculations for Threshold (Non-Cancer) Effects
In this section, health risks were calculated through values for threshold effects for only child soil mixed with sludge pathway (Figure 4.7 and See Appendix C).Variations on
for each pollutant are directly related to average substance concentrations. NPEs have the lowest values of NPEs were only calculated with INERIS’s method. In
value for NPEs was not suggested. Most critical pollutant for threshold values.
alues were summed up for each sampling month and ∑ data were obtained. The results values are given in Figure 4.7. According to ∑ results, the values vary between 0.00
is observed for March. In U.S. EPA’s method the highest ∑ December. The main reason for such a difference is that, %�& of ��� values were used in risk calculations which have different values for some of the heavy metals such as Hg, Cu and Zn. In
ted to Pb and NPE were included in INERIS’s method and consideration of Pb in calculations may also result in such a difference.
Values and Contributions of the Selected Pollutants to ∑
values should be compared whether they are more than 1 or not (INERIS, 2008).The results values are much less than 1. As a result, it can be concluded that observing
for a child who ingests soil mixed with sludge. However, it is obvious that the results only include one pathway. There are other pathways that a child may be exposed. Therefore, other pathways should also be taken into account for comprehensive evaluation of
he soil background concentrations and sludge concentrations were compared with each other in , it can be seen from Figure 4.8 that for all of the heavy metals,
higher than contributions from sludge. It means that soil has a higher risk for
Ap
ril
May
Jun
e
July
Au
gust
Sep
tem
ber
Oct
ob
er
No
vem
ber
Dec
emb
er
Sampling month (2012)
values for threshold effects for only child Variations on values
for each pollutant are directly related to average substance concentrations. NPEs have the lowest values of NPEs were only calculated with INERIS’s method. In
not suggested. Most critical pollutant for threshold
a were obtained. The results the values vary between 0.0035 and
belonged to values were used in risk
calculations which have different values for some of the heavy metals such as Hg, Cu and Zn. In ted to Pb and NPE were included in INERIS’s method and
values should be compared whether they are more than 1 or not (INERIS, 2008).The results observing adverse
mixed with sludge. However, it is obvious that the results only include one pathway. There are other pathways that a child may be exposed. Therefore, other pathways should also be taken into account for comprehensive evaluation of
he soil background concentrations and sludge concentrations were compared with each other in heavy metals,
It means that soil has a higher risk for
NPEs
Cr
Cd
Hg
PCBs
Zn
Pb
Ni
Cu
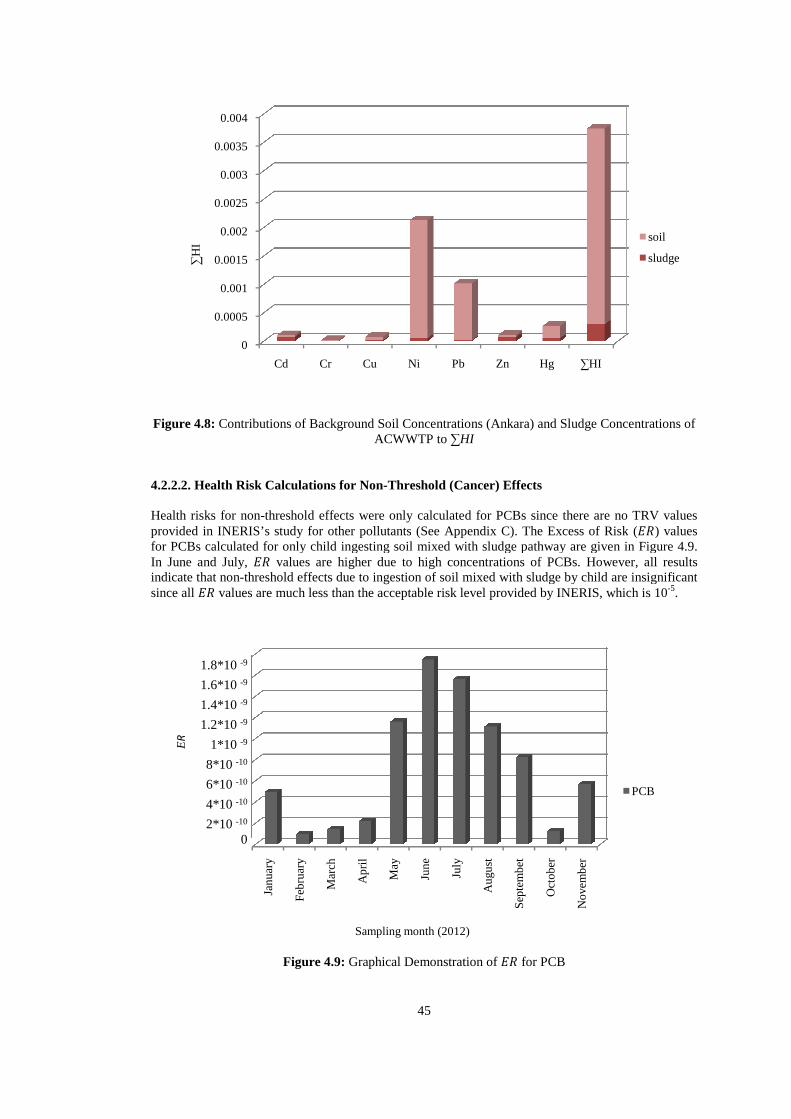
Figure 4.8: Contributions of Background Soil Concentrations (Ankara) and Sludge Concentrations
4.2.2.2. Health Risk Calculations for Non Health risks for non-threshold effects were only calculated for PCBs since there are no TRV values provided in INERIS’s study for other pollutantsfor PCBs calculated for only child ingesting soil mixed with sludge pathwayIn June and July, �� values are higher due to high concentrations of PCBs. However, all results indicate that non-threshold effects due to isince all �� values are much less than the acceptable risk level provided by INERIS, which is 10
Figure 4.
0
0.0005
0.001
0.0015
0.002
0.0025
0.003
0.0035
0.004
Cd
∑H
I
Jan
uar
y
1.8*10 -9
1.6*10 -9
1.4*10 -9
1.2*10 -9
1*10 -9
8*10 -10
6*10 -10
4*10 -10
2*10 -10
0
ER
45
Contributions of Background Soil Concentrations (Ankara) and Sludge ConcentrationsACWWTP to ∑HI
4.2.2.2. Health Risk Calculations for Non-Threshold (Cancer) Effects
threshold effects were only calculated for PCBs since there are no TRV values provided in INERIS’s study for other pollutants (See Appendix C). The Excess of Risk
calculated for only child ingesting soil mixed with sludge pathway are given in Figure 4.values are higher due to high concentrations of PCBs. However, all results
threshold effects due to ingestion of soil mixed with sludge by child are insignificantvalues are much less than the acceptable risk level provided by INERIS, which is 10
Figure 4.9: Graphical Demonstration of �� for PCB
Cd Cr Cu Ni Pb Zn Hg
Feb
ruar
y
Mar
ch
Ap
ril
May
Jun
e
July
Au
gust
Sep
tem
bet
Oct
ob
er
Sampling month (2012)
Contributions of Background Soil Concentrations (Ankara) and Sludge Concentrations of
threshold effects were only calculated for PCBs since there are no TRV values . The Excess of Risk (��) values
are given in Figure 4.9. values are higher due to high concentrations of PCBs. However, all results
h sludge by child are insignificant values are much less than the acceptable risk level provided by INERIS, which is 10-5.
∑HI
soil
sludge
No
vem
ber
PCB
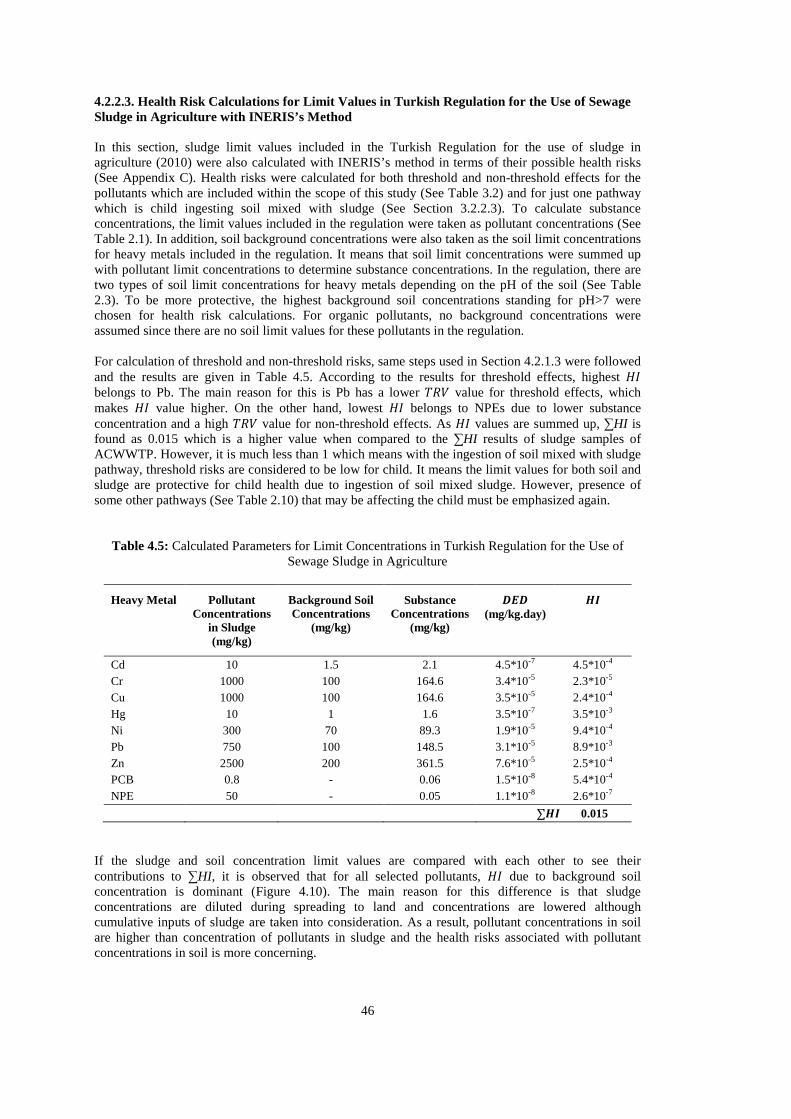
46
4.2.2.3. Health Risk Calculations for Limit Values in Turkish Regulation for the Use of Sewage Sludge in Agriculture with INERIS’s Method In this section, sludge limit values included in the Turkish Regulation for the use of sludge in agriculture (2010) were also calculated with INERIS’s method in terms of their possible health risks (See Appendix C). Health risks were calculated for both threshold and non-threshold effects for the pollutants which are included within the scope of this study (See Table 3.2) and for just one pathway which is child ingesting soil mixed with sludge (See Section 3.2.2.3). To calculate substance concentrations, the limit values included in the regulation were taken as pollutant concentrations (See Table 2.1). In addition, soil background concentrations were also taken as the soil limit concentrations for heavy metals included in the regulation. It means that soil limit concentrations were summed up with pollutant limit concentrations to determine substance concentrations. In the regulation, there are two types of soil limit concentrations for heavy metals depending on the pH of the soil (See Table 2.3). To be more protective, the highest background soil concentrations standing for pH>7 were chosen for health risk calculations. For organic pollutants, no background concentrations were assumed since there are no soil limit values for these pollutants in the regulation. For calculation of threshold and non-threshold risks, same steps used in Section 4.2.1.3 were followed and the results are given in Table 4.5. According to the results for threshold effects, highest belongs to Pb. The main reason for this is Pb has a lower %�& value for threshold effects, which makes value higher. On the other hand, lowest belongs to NPEs due to lower substance concentration and a high %�& value for non-threshold effects. As values are summed up, ∑HI is found as 0.015 which is a higher value when compared to the ∑HI results of sludge samples of ACWWTP. However, it is much less than 1 which means with the ingestion of soil mixed with sludge pathway, threshold risks are considered to be low for child. It means the limit values for both soil and sludge are protective for child health due to ingestion of soil mixed sludge. However, presence of some other pathways (See Table 2.10) that may be affecting the child must be emphasized again.
Table 4.5: Calculated Parameters for Limit Concentrations in Turkish Regulation for the Use of Sewage Sludge in Agriculture
Heavy Metal Pollutant Concentrations
in Sludge (mg/kg)
Background Soil Concentrations
(mg/kg)
Substance Concentrations
(mg/kg)
aia (mg/kg.day)
jk
Cd 10 1.5 2.1 4.5*10-7 4.5*10-4
Cr 1000 100 164.6 3.4*10-5 2.3*10-5 Cu 1000 100 164.6 3.5*10-5 2.4*10-4 Hg 10 1 1.6 3.5*10-7 3.5*10-3 Ni 300 70 89.3 1.9*10-5 9.4*10-4 Pb 750 100 148.5 3.1*10-5 8.9*10-3 Zn 2500 200 361.5 7.6*10-5 2.5*10-4 PCB 0.8 - 0.06 1.5*10-8 5.4*10-4 NPE 50 - 0.05 1.1*10-8 2.6*10-7
∑jk 0.015 If the sludge and soil concentration limit values are compared with each other to see their contributions to ∑HI, it is observed that for all selected pollutants, due to background soil concentration is dominant (Figure 4.10). The main reason for this difference is that sludge concentrations are diluted during spreading to land and concentrations are lowered although cumulative inputs of sludge are taken into consideration. As a result, pollutant concentrations in soil are higher than concentration of pollutants in sludge and the health risks associated with pollutant concentrations in soil is more concerning.
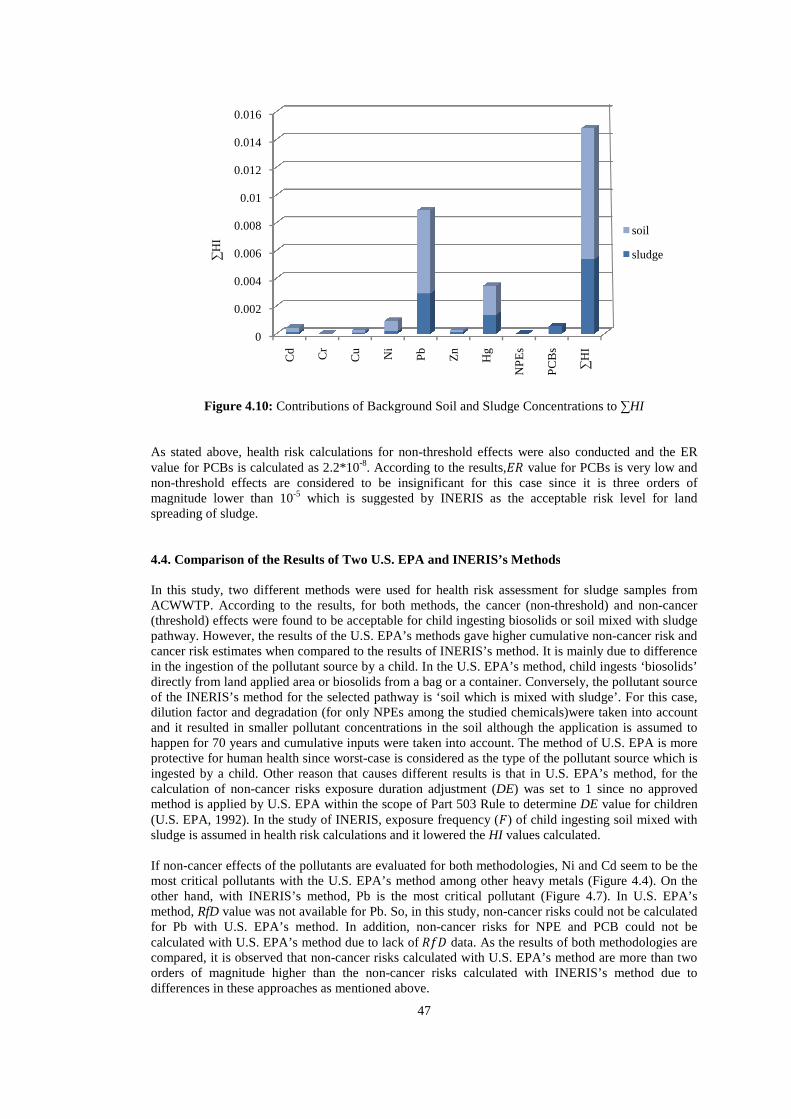
Figure 4.10: Contributions of Background Soil and Sludge Concentrations to As stated above, health risk calculations for nonvalue for PCBs is calculated as 2.2*10non-threshold effects are considered to be insignificant magnitude lower than 10spreading of sludge. 4.4. Comparison of the Results of Two U.S. EPA and INERIS’s Methods In this study, two different methods were used for health risk assessment for sludge samples from ACWWTP. According to the results, for both methods, the cancer (non(threshold) effects were found to be acceptable for child ingesting biosolids or soil mixed with sludge pathway. However, the results of the U.S. EPA’s methods gave higher cumulative noncancer risk estimates when compared to the results ofin the ingestion of the pollutant source by a child. In the U.S. EPA’s method, child ingests ‘biosolids’ directly from land applied area or biosolids from a bag or a container. Conversely, the pollutant sourof the INERIS’s method for the selected pathway is ‘soil which is mixed with sludge’. For this case, dilution factor and degradation (for only NPEs among the studied chemicals)were taken into account and it resulted in smaller pollutant concentrations ihappen for 70 years and cumulative inputs were taken into account. The method of U.S. EPA is more protective for human health since worstingested by a child. Other reason that causes different results is that in U.S. EPA’s method, for the calculation of non-cancer risks exposure duration adjustment (method is applied by U.S. EPA within the scope of Part 503 Ru(U.S. EPA, 1992). In the study of INERIS, exposure frequency (sludge is assumed in health risk calculations and it lowered the If non-cancer effects of the most critical pollutants with the U.S. EPA’s method among other heavy metals (Figure other hand, with INERIS’s method, Pb is the most critical pollutant (Figure method, RfD value was not available for Pb. So, in this study, nonfor Pb with U.S. EPA’s method. In addition, noncalculated with U.S. EPA’s method due to lackcompared, it is observed that nonorders of magnitude higher than the nondifferences in these approaches as mentioned above.
0
0.002
0.004
0.006
0.008
0.01
0.012
0.014
0.016
Cd
∑H
I
47
Contributions of Background Soil and Sludge Concentrations to
As stated above, health risk calculations for non-threshold effects were also conducted and the ER value for PCBs is calculated as 2.2*10-8. According to the results,�� value for PCBs is very low an
threshold effects are considered to be insignificant for this case since it is three orders of magnitude lower than 10-5 which is suggested by INERIS as the acceptable risk level for land
Comparison of the Results of Two U.S. EPA and INERIS’s Methods
In this study, two different methods were used for health risk assessment for sludge samples from ACWWTP. According to the results, for both methods, the cancer (non-threshold) and non(threshold) effects were found to be acceptable for child ingesting biosolids or soil mixed with sludge pathway. However, the results of the U.S. EPA’s methods gave higher cumulative noncancer risk estimates when compared to the results of INERIS’s method. It is mainly due to difference in the ingestion of the pollutant source by a child. In the U.S. EPA’s method, child ingests ‘biosolids’ directly from land applied area or biosolids from a bag or a container. Conversely, the pollutant sourof the INERIS’s method for the selected pathway is ‘soil which is mixed with sludge’. For this case, dilution factor and degradation (for only NPEs among the studied chemicals)were taken into account and it resulted in smaller pollutant concentrations in the soil although the application is assumed to happen for 70 years and cumulative inputs were taken into account. The method of U.S. EPA is more protective for human health since worst-case is considered as the type of the pollutant source which is
sted by a child. Other reason that causes different results is that in U.S. EPA’s method, for the cancer risks exposure duration adjustment (DE) was set to 1 since no approved
method is applied by U.S. EPA within the scope of Part 503 Rule to determine (U.S. EPA, 1992). In the study of INERIS, exposure frequency (') of child ingesting soil mixed with sludge is assumed in health risk calculations and it lowered the HI values calculated.
cancer effects of the pollutants are evaluated for both methodologies, Ni and Cd seem to be the most critical pollutants with the U.S. EPA’s method among other heavy metals (Figure other hand, with INERIS’s method, Pb is the most critical pollutant (Figure
value was not available for Pb. So, in this study, non-cancer risks could not be calculated for Pb with U.S. EPA’s method. In addition, non-cancer risks for NPE and PCB could not be calculated with U.S. EPA’s method due to lack of ��� data. As the results of both methodologies are compared, it is observed that non-cancer risks calculated with U.S. EPA’s method are more than two orders of magnitude higher than the non-cancer risks calculated with INERIS’s method due to
nces in these approaches as mentioned above.
Cd Cr
Cu Ni
Pb
Zn
Hg
NP
Es
PC
Bs
Contributions of Background Soil and Sludge Concentrations to ∑HI
threshold effects were also conducted and the ER value for PCBs is very low and
for this case since it is three orders of which is suggested by INERIS as the acceptable risk level for land
In this study, two different methods were used for health risk assessment for sludge samples from threshold) and non-cancer
(threshold) effects were found to be acceptable for child ingesting biosolids or soil mixed with sludge pathway. However, the results of the U.S. EPA’s methods gave higher cumulative non-cancer risk and
INERIS’s method. It is mainly due to difference in the ingestion of the pollutant source by a child. In the U.S. EPA’s method, child ingests ‘biosolids’ directly from land applied area or biosolids from a bag or a container. Conversely, the pollutant source of the INERIS’s method for the selected pathway is ‘soil which is mixed with sludge’. For this case, dilution factor and degradation (for only NPEs among the studied chemicals)were taken into account
n the soil although the application is assumed to happen for 70 years and cumulative inputs were taken into account. The method of U.S. EPA is more
case is considered as the type of the pollutant source which is sted by a child. Other reason that causes different results is that in U.S. EPA’s method, for the
) was set to 1 since no approved le to determine DE value for children
) of child ingesting soil mixed with values calculated.
pollutants are evaluated for both methodologies, Ni and Cd seem to be the most critical pollutants with the U.S. EPA’s method among other heavy metals (Figure 4.4). On the other hand, with INERIS’s method, Pb is the most critical pollutant (Figure 4.7). In U.S. EPA’s
cancer risks could not be calculated cancer risks for NPE and PCB could not be
data. As the results of both methodologies are cancer risks calculated with U.S. EPA’s method are more than two
cancer risks calculated with INERIS’s method due to
∑H
I
soil
sludge
48
Cancer risks were also calculated by both methods for only PCBs. According to the results, cancer risks were lower with INERIS method compared to U.S. EPA’s method due to the same reasons mentioned above. In this study, apart from the determination of health risks for sludge samples of ACWWTP, the sludge and soil limit values in Turkish Regulation for the Use of Sewage Sludge in Agriculture were also used to calculate health risks. In U.S. EPA’s method, only sludge limit values were used. On the other hand, in INERIS’s method, both soil and sludge limit values were taken into account and summed up to determine substance concentration. According to the results, the cancer risks and non-cancer risks calculated with U.S. EPA’s method were much higher than the results of INERIS’s method due to the same reasons explained above. If two methods are compared in general, it is obvious that U.S. EPA’s method is more protective than INERIS’s method. Although U.S. EPA’s method gave higher cancer and non-cancer risk results, the health concerns do not pose a significant risk for only ‘child ingesting sludge’ pathway. 4.5. Discussion of the Health Risk Assessment Results For both methods, health risks associated with land application of sludge samples originating from ACWWTP were found to be acceptable for the ingestion of sludge by a child pathway. The results show similar tendencies with other health risk assessment studies found in literature. In the study of INERIS (2008) health risks due to ingestion of sludge and soil mixture by a child was also determined as acceptable and the cumulative health risks were determined as acceptable as well. In the study of VKM (2009), the health risk due to ingestion of soil mixed with sludge by a child was also found to be very low. In this study, there are some limitations. This study only gives the health risk results due to child ingesting the sludge (or for INERIS approach ingesting the mixture of the sludge and the soil) pathway. There may be additional health risks due to other pathways such as ingestion of animal products and plants and drinking water. However, other pathways were not taken into account and the health risks due to other pathways were not calculated. It should be remembered that child ingesting sludge pathway was identified as the most conservative pathway by U.S. EPA (1995) for 5 heavy metals regulated by Part 503 Rule. In addition, a total of 9 pollutants were considered throughout the study since those were the only compounds that could be analyzed at METU Environmental Engineering Department laboratory. There might be other pollutants which have carcinogenic and/or non-carcinogenic health effects and they may lead to additional health risks for child. These are the uncertainties of this study. In order to reduce the limitations, more comprehensive studies should be conducted. In this study, health risks due to ingestion of sludge by a child pathway were determined and to be below the acceptable risk values recommended by U.S. EPA (1995) and INERIS (2008).However, other pathways should also be taken into account to determine a cumulative health risk for each receptor. As a result, whether the sludge samples can be used in land application or not requires a more extensive study.
49
CHAPTER 5
SUMMARY & CONCLUSION
This study is the first study conducted in Turkey concerning health risk assessment for land application of biosolids. All heavy metal concentrations (Cd, Cr, Cu, Hg, Ni, Pb, and Zn) and two of the organic pollutant concentrations (PCBs and NPEs) cited in the current Turkish regulation were examined monthly in sludge samples collected from ACWWTP for the year 2012.Then, health risk assessment methodologies developed by U.S. EPA and INERIS were applied for the samples and both non-cancer and cancer health risks were evaluated. For the calculation of health risks only one pathway (ingestion of sludge by a child) was taken into consideration. The main conclusions that can be driven from the study are as follows.
• The results of heavy metal concentrations and organic pollutant concentrations showed some fluctuations and no particular trend was observed among all concentrations.
o Cr concentrations ranged between 144 mg/kg and 356.1 mg/kg. In May, June and July (2012), the concentrations were observed to be higher than the other samples.
o Cu concentrations were measured between 147.1 mg/kg and 230.3 mg/kg. In the first three months of the year (2012), the concentrations were observed to be higher than the other samples.
o Hg concentrations varied between 0.4 mg/kg and 1.3 mg/kg. In December and November, the Hg concentrations were higher when compared to the results from other months.
o Ni concentrations were observed between 69.7 mg/kg and 89.9 mg/kg. The highest Ni concentration was observed in May(2012).
o Pb concentrations were between 35.1 mg/kg and 85.2 mg/kg and a decrease was observed between concentrations from the beginning of the year till the end of the year (2012).
o Zn concentrations ranged between 1174.7 mg/kg and 2499.9 mg/kg. After August (2012), Zn concentrations were observed to be higher and in November (2012), it reached the highest concentration.
o PCBs concentrations were observed to be very low and varied between 0.004 mg/kg and 0.06 mg/kg.
o NPEs concentrations were measured between 5.3 mg/kg and 25.5 mg/kg.
o All the PCBs, NPEs and heavy metal concentrations except for Zn are much lower than the limit values dictated by the Turkish Regulation for the Use of Sewage Sludge in Agriculture (2010). For land application, most critical pollutantseemed to be Zn. Even though it did not exceed the regulatory limit (2500 mg/kg), in one sample, the concentrationwas as high as the limit value given in the regulation. Therefore, it is recommended that Zn concentrations should be observed attentively before land application.
50
• Health Risk Calculations with U.S. EPA’s Method for Ingestion of Biosolids by a Child Pathway:
o Non – cancer risks:The lowest values were observed for Cr and highest for Ni and Cd, respectively. ∑ values were calculated to be between 0.16 and 0.25. For all months, the findings suggest that the health risks due to ingestion of biosolids by a child alone due to heavy metals is lowand does not result in adverse non-cancer health effects with respect to acceptable risk levels suggested by EPA and INERIS (U.S. EPA, 1994; INERIS, 2008).
o Cancer risks: The ���� values were calculated for PCBs between ?? 10-7 and 10-8. When these risks are compared with the acceptable risk level (10-4) which is suggested by U.S. EPA (1995), they are found to be very low. Cancer effects due to PCBsdo not pose a significant risk for child ingesting biosolids pathway.
o Health risk calculations were conducted for the limit values set in Turkish Regulation for the Use of Sewage Sludge in Agriculture (2010):
� The highest was observed for Hg limit concentration (10mg/kg) provided in the regulation. The highest ∑ value was calculated as 0.89 which was very high when compared to the results for sludge samples of ACWWTP. However, since this value is less than 1, non-cancer effects are not considered to be significant for ingestion of biosolids by a child due to seven heavy metals considered in this study. The limit values can be considered as adequately protective for child ingesting biosolids pathway. However, to have a more accurate conclusion, other pathways and receptors should be also taken into account.
� Risk value for PCB was calculated as 5.5*10-6. This value is lower than 10-
4 which is suggested by U.S. EPA (1995) as the acceptable risk level. On the other hand, if acceptable risk level is chosen as 10-6(National Research Council, 2002) and it may become a concern for child’s health.
• Health Risk Calculations with INERIS’S Method for Ingestion of Soil Mixed with Sludge by a
Child Pathway:
o Threshold (non-cancer) risks: Among all pollutants (Cd, Cr, Cu, Hg, Ni, Pb, Zn, PCBs and NPE), Ni had the highest value. According to ∑ results, the values varied between 0.0035 and 0.0038 and all the values were lower than 1. Soil concentrations result in higher risks when compared to risk caused by sludge concentrations. However, the results indicated that threshold risks due to selected pollutants are low for child who ingests soil mixed with sludge.
o Non-threshold (cancer) risks: ER values for PCBs were calculated between 9.8*10-
11and 1.7*10-9. The acceptable level suggested by INERIS (2008) is 10-5. According to results, adverse non-threshold effects due to PCBs would not pose a significant risk for child ingesting soil mixed with sludge.
o Health risk calculations were also conducted for the limit values provided in Turkish Regulation for the Use of Sewage Sludge in Agriculture (2010):
� Lowest was observed for PCBs and highest was observed for Zn. According to the results, contributions of soil background concentrations to are much higher when compared to pollutant concentrations (limit values) in sludge.
51
� ∑HI was calculated summing up all values and determined as 0.126. As it
is compared with 1, it is very low and developing of threshold effects are considered to be insignificant for a child ingesting soil mixed with sludge. The limit values can be considered as adequately protective for only child ingesting biosolids pathway. However, other pathways and receptors should also be taken into account to give a comprehensive result.
� �� value was calculated as 2.2*10-8 which is three orders of magnitude lower than the acceptable risk (10-5) suggested by INERIS (2008). The limit value for PCBs is considered to be protective for child health due to ingestion of soil mixed with sludge.
o Both cancer and non-cancer risk estimates were higher with U.S. EPA’s method. In general, U.S. EPA’s method is more protective than INERIS’s method. Different assumptions about pollutant source of the pathway, duration of exposure and exposure frequency are the main reasons causing different results for both methods.
o There are some limitations related to health risks due to other pathways, receptors and other pollutants present in sludge samples in this study. To reduce uncertainties, more comprehensive study should be conducted.

52
53
CHAPTER 6
FUTURE WORK In this study, the health risks associated with land application of biosolids were conducted for only one pathway, which is child ingesting biosolids or soil mixed with sludge, due to limited data. This study is the first work conducted to assess the health risks associated with land application of biosolids. In order to investigate this subject further, some future work can be done as follows.
o It is possible for the child to be exposed to pollutants through other pathways. Health risks for other pathways may also be calculated and summed up to be able to have more accurate total risk estimation results. In addition to child, other human receptors such as adult and ecological receptors such as animals, plants and soil organisms may be also considered to calculate risks due to land application of biosolids.
o Other studies associated with land application of biosolids may also be analyzed in detail to come up with the most appropriate health risk assessment method. For instance, Norway conducted an extensive study for land application of biosolids in 2009. This study may also be evaluated and compared with U.S. EPA and INERIS’s studies.
o A number of site-specific data are needed in health risk assessment for land application of biosolids. With limited data it is not possible to evaluate all possible health risks due to land application of biosolids. Required data for calculation of health risks through other pathways and receptors may be gathered or a substructure may be set up in the future.

54
55
REFERENCES
Andreoli C.V., Sperling M. von and Fernandes F. (2007). Sludge Treatment and Disposal.IWA Publishing, London, UK.
Ankara Water and Sewerage Administration (ASKİ).,http://www.aski.gov.tr/tr/anasayfa, last visited on November,2012.
APHA, AWWA, WEF. (2005). Standard Methods for the Examination of Water & Wastewater, Centennial Edition.
ATSDR (2000).Public Health Statement, Polychlorinated Biphenyls. Agency for Toxic Substance and Disease Registry, Division of Toxicology,
Barnus D.G. and Dourson M. (1988). Reference Dose (RfD):Description and Use in Health Risk Assessments. Regulatory Toxicology and Pharmacology 8 (1988) 471- 486.
Bilgin N. Eyüpoğlu H. and Üstün H. (2002). Biyokatıların (Arıtma Çamurlarının) Arazide Kullanımı. ASKİ Artıma Tesisleri Daire Başkanlığı, Köy Hizmetleri Genel Müdürlüğü Ankara Araştırma Enstitüsü.
California Environmental Protection Agency (CEPA).(2009).Toxicological Profile for Nonylphenol. Integrated Risk Assessment Branch, Office of Environmental Health Hazard Assessment, California Environmental Protection Agency.
Canada Environmental Protection Act. (2001). Priority Substances List Assessment Report-Nonylphenol and Its Ethoxylates. Environment Canada, Health Canada. Cincinelli A., Martellini T., Misuri L., Lanciotti E., Sweetman A., Laschi S. and Palchetti I. (2012).PBDEs in Italian Sewage Sludge and Environmental Risk of Using Sewage Sludge for Land Application. Environmental Pollution 151 (2012) 229-234.
Epstein E. (2003). Land Application of Sewage Sludge and Biosolids.CRC Press.
European Commission (2000).Working Document on Sludge, 3rd Draft .Brussels.
European Commission (2001).Pollutants in Urban Waste Water and Sewage Sludge, Final Report. Prepared by ICON IC Consultants Ltd, London, United Kingdom.
European Commission (2008a).Environmental, Economic And Social Impacts of The Use of Sewage Sludge on Land, Final Report ,Part III: Project Interim Report. European Chemicals Bureau (2002).European Union Risk Assessment Report: 4-nonylphenol (branched) and Nonylphenol. European Chemicals Bureau, Institute for Health and Consumer Protection. Second Priority List, Volume: 10.
Gonzalez M.M., Martin J., Santos J.L., Aparicio I. and Alonso E. (2009).Occurrence and Risk Assessment of Nonylphenol and Nonylphenol Ethoxylates in Sewage Sludge from Different Conventional Treatment Processes. Science of Total Environment 408(2010)563-570.
Guney M., Zagury G.J., Dogan N. and Onay T.T. (2010). Exposure Assessment and Risk Characterization from Trace Elements Following Soil Ingestion by Children Exposed to Playgrounds, Parks and Picnic Areas. Journal of Hazardous Materials 182 (2010) 656-664.
Harrison E.Z., Oakes S.R., Hysell M. and Hay A.(2006). Organic Chemicals in Sewage Sludges. Science of the Total Environment 367 (2006) 481–497.
56
International Maritime Organization, http://www.imo.org/OurWork/Environment/SpecialProgrammesAndInitiatives/Pages/London-Convention-and-Protocol.aspx, last visited on January, 2013.
International Programme on Chemical Safety (1998). Environmental Health Criteria No. 200: Copper. Geneva: World Health Organization.
INERIS (2008).Public Health Risk Assessment of Sludge Landspreading, Final Report.
Jacobs L.W and McCreary D.S.(2001).Utilizing Biosolids on Agricultural Land. Department of Crop and Soil Sciences, Michigan State University, December, 2001
Kaya D. (2012).Attenuation of Polychlorinated Biphenlys Under Anaerobic Conditions. PhD Thesis, Middle East Technical University, Ankara, Turkey.
Kavcar P., Sofuoğlu A. And Sofuoğlu S.C. (2009). A Health Risk Assessment for Exposure to Trace Metals Via Drinking Water Ingestion Pathway. Int. J.Hyg.Environ.Health 212(2009)216-219.
Laturnus F., von Arnold K. and Grøn C .(2007). Organic Contaminants from Sewage Sludge Applied to Agricultural Soils. Environmental Science Pollution Research, 14, Special Issue 1, 53–60
McFarland M. (2001). Biosolids Engineering. Mc-Graw Hill.
National Research Council (NRC) (1983).Risk Assessment in the Federal Government: Managing the Process. National Academy Press, Washington, DC.
National Research Council (NRC)(1994).Science and Judgment in Risk Assessment. National Academy Press. Washington, DC.
National Research Council (NRC) (2002).Biosolids Applied to Land: Advancing Standards and Practices.
New Hampshire Department of Environmental Services (2005).Environmental Fact Sheet.
New Mexico State University,http://www.chemistry.nmsu.edu/Instrumentation/AAS1.html, last visited onDecember, 2012.
Norwegian Scientific Committee for Food Safety (VKM). (2009). Risk Assessment of Contaminants in Sludge Applied on Norwegian Soils.
Ömeroğlu,S. (2012). Fate of Nonyphenol Compounds in Aerobic Batch Reactors .MSc Thesis, Middle East Technical University, Ankara. Turkey.
Özsoy G. (2006). An Investigation of Agricultural Use Potential of Wastewater Sludges in Turkey with Respect to Heavy Metals and Pathogens. MSc Thesis, Middle East Technical University, Ankara. Turkey.
Öztürk, İ., (2010). Atık Sektörü Mevcut Değerlendirme Raporu. Republic of Turkey Ministry of Environment and Forestry, Ankara.
Passuello A, Mari M., Nadal M., Schuhmacher M. and Domingo J.L. (2010).POP Accumulation in the Food Chain: Integrated Risk Model for Sewage Sludge Application in Agricultural Soil. Environment International 36 (2010) 577-583
Perkin Elmer (2003). HGA 900 Users Guide. Perkin Elmer Life and Analytical Sciences.
Perkin Elmer, http://www.perkinelmer.com/CMSRources/Images/44 74685PRD_MHS15MercuryHydrideSystem.pdf, last visited on December, 2012
57
Schowanek D., Carr R., David H., Douben P., Hall J., Kirchmann H., Patria L., Sequi P., Smith S. and Webb S. (2004) A Risk-based Methodology for Deriving Quality Standards for Organic Contaminants in Sewage Sludge for Use in Agriculture- Conceptual Framework. Regulatory Toxicology and Pharmacology, 40, 226-251.
Schowanek D., David H., Francaviglia R., Hall J., Kirchmann H., Krogh P.H., Schraepen N., Smith S. and Wildemann T. (2007). Probabilistic Risk Assessment for Linear AlkylbenzenSulfonate (LAS) in Sewage Sludge Used on Agricultural Soil.Regulatory Toxicology and Pharmacology 49 (2007)245-259
Sanin,F. D., Clarkson, W. W. and P. A. Vesilind. (2011). Sludge Engineering: the Treatment and Disposal of Wastewater Sludges, DESTech Publications, Lanchester.
Singh R.P and Agrawal M.(2007). Potential Benefits and Risks of Land Application of Sewage Sludge.Waste Management 28 (2008) 347-358
Sofuoğlu S.C. and Kavcar P. (2008). An Exposure and Risk Assessment for Fluoride and Trace Metals in Black Tea. Journal of Hazardous Materials 158 (2008) 392-400. Tchobanoglous G., Burton F.I., and Stensel H.D (2003).Wastewater Engineering: Treatment and Reuse. Mc-Graw Hill. Turkish Ministry of Environment and Urban Planning (2010). Regulation for the Use of Sewage Sludge on Agriculture.
United Nations Economic Commission for Europe (UNECE).(2004). Globally Harmonized System of Classification and Labelling of Chemicals (GHS).Respiratory or Skin Sensitization.
United Nations Human Settlements Programme (UN- HABITAT) (2008). Global Atlas of Excreta,WastewaterSlduge, and BiosolidsManagement:Moving forward the Sustainable and Welcome Uses of a Global Resource.
U.S. EPA (1985).Updated Mutagenicity and Carcinogenicity Assessment of Cadmium. Addendum to the Health Assessment Document for Cadmium.EPA 600/B-83-025F.
U.S. EPA (1986).Health Assessment Document for Nickel and Nickel Compounds. Office of Health and Environmental Assessment Washington DC 20460.EPA/600/8-83/021FF.
U.S. EPA (1988).Proposed Guidelines for Exposure-related Measurement.. Federal Register 48830. U.S. EPA (1989).Risk Assessment Guidance for Superfund, Volume 1, Human Health Evaluation Manual, Part A. Office of Emergency and Remedial Response.
U.S. EPA (1992).Technical Support Document for Land Application of Sludge, Volume 1.Office of Water, Washington DC.EPA/822-R-93-001.
U.S. EPA (1994a).A Plain English Guide to the EPA Part 503 Biosolids Rule. Office of Wastewater Management, Washington, DC.EPA/832/R-93/003.
U.S. EPA (1994b).A Guide for Land Appliers on the Requirements of the Federal Standards for the Use or Disposal of Sewage Sludge, 40 CFR Part 503.Office of Enforcement and Compliance Assurance, Washington, DC 20460, EPA/831-B-93-002b.
U.S. EPA (1994c).Summary Review of Health Effects Associated with Mercuric Chloride: Health Issue Assessment. Office of Health and Environmental Assessment, Environmental Criteria and Assessment Office, Cincinnati, OH for the Office of Air Quality Planning and Standards, Research Triangle Park, NC.EPA/600/R-92/199.
58
U.S. EPA (1995).A Guide to Biosolids Risk Assessments for the EPA Part 503 Rule. U.S. Environmental Protection Agency Office of Wastewater Management, Washington, DC.EPA/832-B-93-005.
U.S. EPA (1996).PCBs: Cancer Dose-Response Assessment and Application to Environmental Mixtures. National Center for Environmental Assessment, Office of Research and Development, U.S. Environmental Protection Agency, Washington DC.EPA/600/P/001 F.
U.S. EPA (1998).Toxicological Review of Trivalent Chromium. U.S. Environmental Protection Agency, Washington DC..
U.S. EPA (2000).Biosolids Technology Fact Sheet, Land Application of Biosolids. Office of Water, Washington, DC.EPA-832-F-00-064.
U.S. EPA (2002).Land Application of Biosolids. Office of Inspector General Status Report’2002-S-000004.
U.S. EPA (2005a).Guidelines for Carcinogen Risk Assessment. U.S. Environmental Protection Agency, Washington, DC 20460, EPA/630/P-03-001F. U.S. EPA (2005b).Toxicological Review of Zinc and Compounds. U.S. Environmental Protection Agency, Washington DC. EPA/635/R-05/002.July, 2005.
U.S. EPA (2007a).Toxicological Profile for Lead. U.S. Department of Health and Human Services, Public Health Service, Agency for Toxic Substance and Disease Registry.
U.S. EPA (2007b). Concepts, Methods and Data Sources for Cumulative Health Risk Assessment of Multiple Chemicals, Exposures and Effects: A Resource Document. National Center for Environmental Assessment, Office of Research and Development
U.S EPA (2010).Nonylphenol(NP) and NonylphenolEthoxylates (NPEs) Action Plan. U.S. Environmental Protection Agency.
U.S. EPA IRIS (Integrated Risk Information System), http://www.epa.gov/iris, last visited on March, 2012
U.S. EPA, http://www.epa.gov/osw/hazard/tsd/pcbs/pubs/effects.htm, last visited on December 2011.
U.S. EPA, http://www.epa.gov/history/topics/mprsa/02.html, last visited on December 2012.
U.S. EPA, http://www.epa.gov/risk_assessment/images/risk_assess_chart/4step-live-4.gif, last visited on January, 2013.
U.S. EPA ,http://www.epa.gov/risk_assessment/glossary.htm#r, last visited on January, 2013.
U.S. EPA, http://www.epa.gov/ttn/atw/natamain/gloss1.html, last visited on January, 2013.
Wang Wang L.K., Shammas N.K., Hung Y. (2008). Biosolids Engineering and Management. Humana Press.
Wang L.K., Shammas N.K., Hung Y. (2009). Advanced Biological Treatment Processes. Humana Press.
Warhurst, A. M. (1995). An Environmental Assessment of AlkylphenolEthoxylates and Alkylphenols. Published jointly by Friends of the Earth Scotland and Friends of the Earth England, Wales and Northern Ireland. Wolf W. and Feifel T. (1998). Terrestrial Risk Assessment for Linear Alkyl Benzene Sulfonate Sludge Amended Soils. Chemosphere (36) 1319-1343

59
World Health Organization (WHO) (2004). Public Health Monitoring of the Metro Manila Air Quality Improvement Sector Development Program, March 2004,15 World Health Organization (WHO) (2010).Exposure to Cadmium: A Major Public Health Concern. Public Health and Environment.
Yang C., Meng X. , Chen L. And Xia S. (2007). Polybrominated Diphenyl Ethers in Sewage Sludge from Shangai, China: Possible Ecological Risk Applied to Agricultural Land. Chemosphere 85 (2011) 418-423
Ying, G.G., Williams, B. and Kookana, R. (2002).Environmental Fate of Alkylphenols and Alkylphenol Ethoxylates- A Review. Environment International 28/3:215–226

60
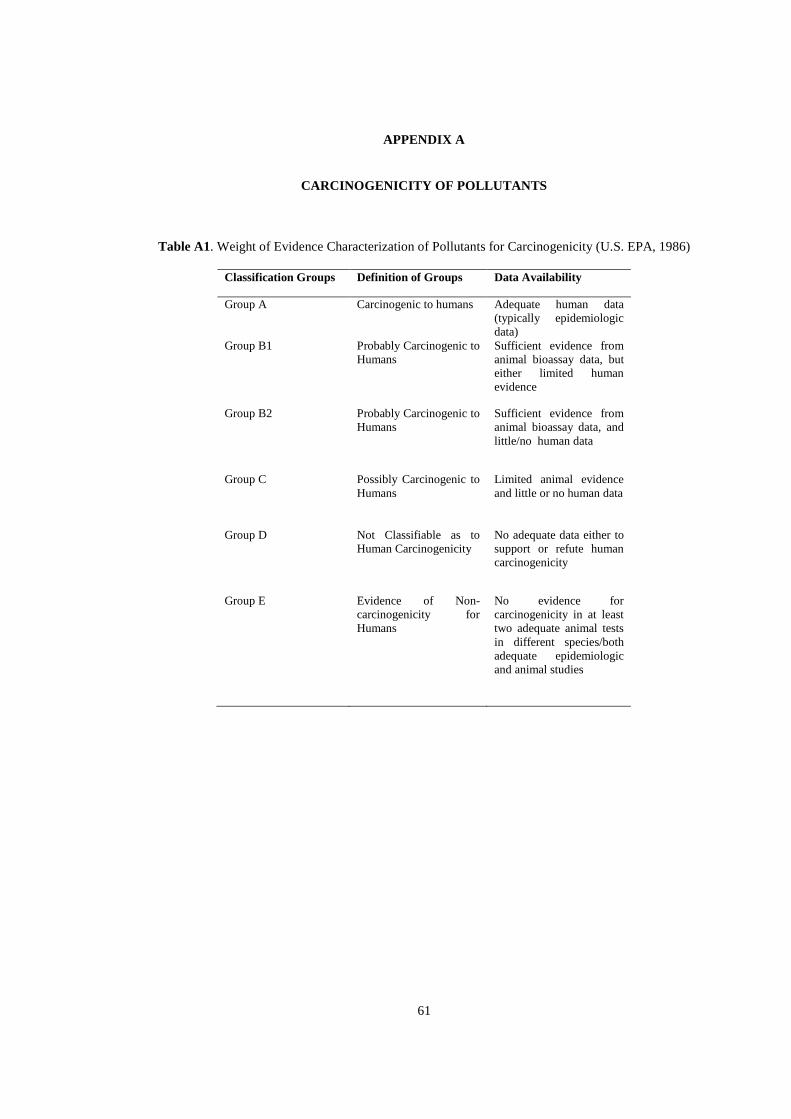
61
APPENDIX A
CARCINOGENICITY OF POLLUTANTS
Table A1. Weight of Evidence Characterization of Pollutants for Carcinogenicity (U.S. EPA, 1986)
Classification Groups Definition of Groups Data Availability
Group A Carcinogenic to humans Adequate human data (typically epidemiologic data)
Group B1 Probably Carcinogenic to Humans
Sufficient evidence from animal bioassay data, but either limited human evidence
Group B2 Probably Carcinogenic to Humans
Sufficient evidence from animal bioassay data, and little/no human data
Group C Possibly Carcinogenic to Humans
Limited animal evidence and little or no human data
Group D Not Classifiable as to Human Carcinogenicity
No adequate data either to support or refute human carcinogenicity
Group E Evidence of Non-carcinogenicity for Humans
No evidence for carcinogenicity in at least two adequate animal tests in different species/both adequate epidemiologic and animal studies

62
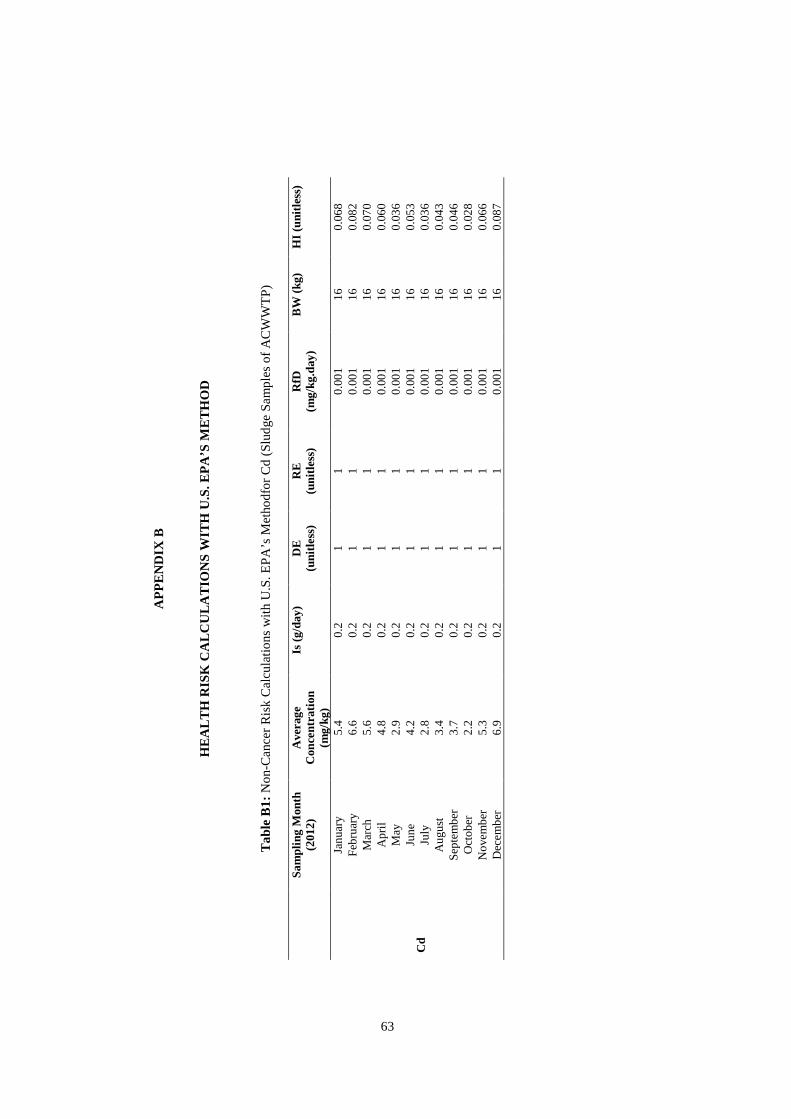
63
AP
PE
ND
IX B
HE
ALT
H R
ISK
CA
LCU
LAT
ION
S W
ITH
U.S
. EP
A’S
ME
TH
OD
T
able
B1:
No
n-C
anc
er
Ris
k C
alc
ula
tion
s w
ith U
.S.
EP
A’s
Me
tho
dfo
r C
d (
Slu
dge
Sa
mp
les
of
AC
WW
TP
)
S
ampl
ing
Mon
th
(201
2)
Ave
rage
C
once
ntra
tion
(mg/
kg)
Is (
g/da
y)
DE
(u
nitle
ss)
RE
(u
nitle
ss)
RfD
(m
g/kg
.day
) B
W (
kg)
HI (
unitl
ess)
Cd
Jan
uar
y 5
.4
0.2
1
1 0
.00
1 1
6 0
.06
8 F
ebru
ary
6.6
0
.2 1
1 0
.00
1 1
6 0
.08
2 M
arch
5
.6
0.2
1 1
0.0
01
16
0.0
70
Ap
ril
4.8
0
.2
1 1
0.0
01
16
0.0
60
May
2
.9
0.2
1 1
0.0
01
16
0.0
36
Jun
e 4
.2
0.2
1 1
0.0
01
16
0.0
53
July
2
.8
0.2
1 1
0.0
01
16
0.0
36
Au
gust
3
.4
0.2
1 1
0.0
01
16
0.0
43
Sep
tem
ber
3
.7
0.2
1 1
0.0
01
16
0.0
46
Oct
ob
er
2.2
0
.2 1
1 0
.00
1 1
6 0
.02
8 N
ove
mb
er
5.3
0
.2 1
1 0
.00
1 1
6 0
.06
6 D
ece
mb
er
6.9
0
.2 1
1 0
.00
1 1
6 0
.08
7
63
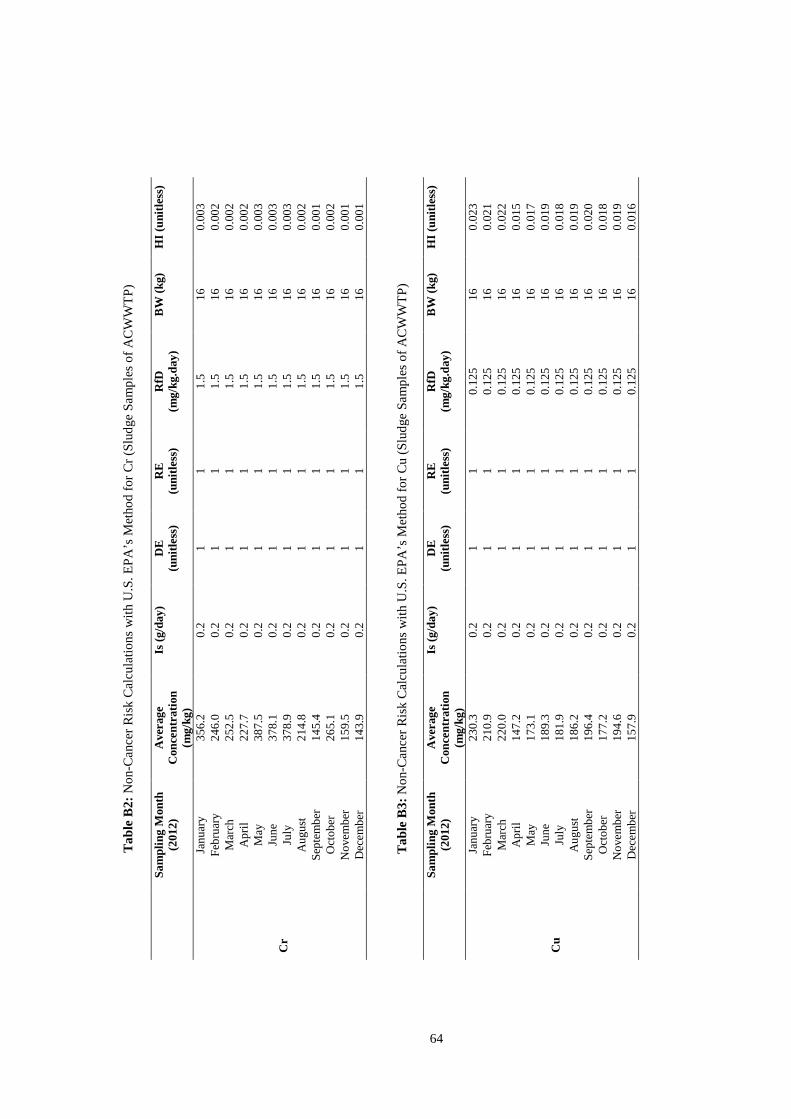
64
Tab
le B
2: N
on-
Ca
ncer
Ris
k C
alc
ula
tion
s w
ith U
.S.
EP
A’s
Me
tho
d fo
r C
r (S
lud
ge S
am
ple
s o
f A
CW
WT
P)
Sam
plin
g M
onth
(2
012)
A
vera
ge
Con
cent
ratio
n (m
g/kg
)
Is (
g/da
y)
DE
(u
nitle
ss)
RE
(u
nitle
ss)
RfD
(m
g/kg
.day
) B
W (
kg)
HI (
unitl
ess)
Cr
Jan
uar
y 3
56.
2 0
.2
1
1 1
.5
16
0.0
03
Feb
ruar
y 2
46.
0 0
.2 1
1 1
.5
16
0.0
02
Mar
ch
25
2.5
0.2
1 1
1.5
1
6 0
.00
2 A
pril
2
27.
7 0
.2 1
1 1
.5
16
0.0
02
May
3
87.
5 0
.2 1
1 1
.5
16
0.0
03
Jun
e 3
78.
1 0
.2 1
1 1
.5
16
0.0
03
July
3
78.
9 0
.2 1
1 1
.5
16
0.0
03
Au
gust
2
14.
8 0
.2 1
1 1
.5
16
0.0
02
Sep
tem
ber
1
45.
4 0
.2 1
1 1
.5
16
0.0
01
Oct
ob
er
26
5.1
0.2
1 1
1.5
1
6 0
.00
2 N
ove
mb
er
15
9.5
0.2
1 1
1.5
1
6 0
.00
1 D
ece
mb
er
14
3.9
0.2
1 1
1.5
1
6 0
.00
1
Tab
le B
3: N
on-
Ca
nce
r R
isk
Cal
cula
tion
s w
ith U
.S.
EP
A’s
Me
tho
d fo
r C
u (S
lud
ge S
am
ple
s o
f A
CW
WT
P)
Sam
plin
g M
onth
(2
012)
A
vera
ge
Con
cent
ratio
n (m
g/kg
)
Is (
g/da
y)
DE
(u
nitle
ss)
RE
(u
nitle
ss)
RfD
(m
g/kg
.day
) B
W (
kg)
HI (
unitl
ess)
Cu
Jan
uar
y 2
30.
3 0
.2
1
1 0
.12
5 1
6 0
.02
3 F
ebru
ary
21
0.9
0.2
1 1
0.1
25
16
0.0
21
Mar
ch
22
0.0
0.2
1 1
0.1
25
16
0.0
22
Ap
ril
14
7.2
0.2
1 1
0.1
25
16
0.0
15
May
1
73.
1 0
.2 1
1 0
.12
5 1
6 0
.01
7 Ju
ne
18
9.3
0.2
1 1
0.1
25
16
0.0
19
July
1
81.
9 0
.2 1
1 0
.12
5 1
6 0
.01
8 A
ugu
st
18
6.2
0.2
1 1
0.1
25
16
0.0
19
Sep
tem
ber
1
96.
4 0
.2 1
1 0
.12
5 1
6 0
.02
0 O
cto
ber
1
77.
2 0
.2 1
1 0
.12
5 1
6 0
.01
8 N
ove
mb
er
19
4.6
0.2
1 1
0.1
25
16
0.0
19
Dec
em
ber
1
57.
9 0
.2 1
1 0
.12
5 1
6 0
.01
6
64
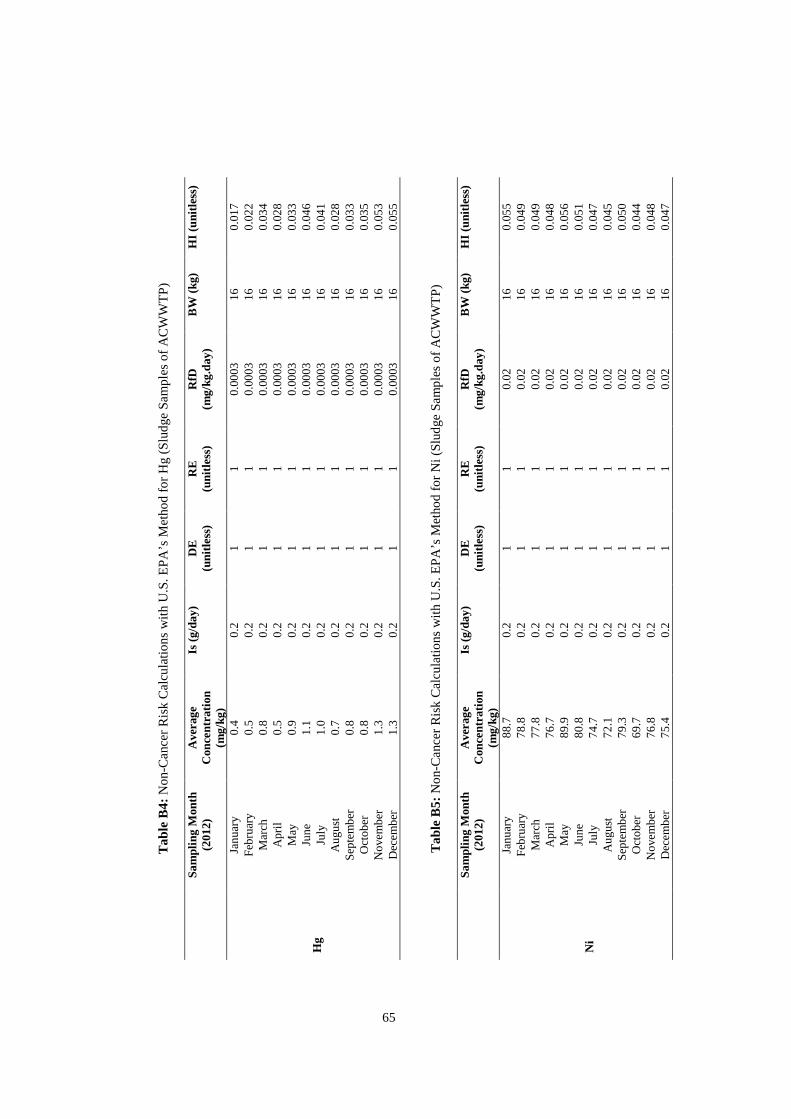
65
T
able
B4:
No
n-C
anc
er
Ris
k C
alcu
latio
ns
with
U.S
. E
PA
’s M
eth
od
for
Hg
(Slu
dge
Sa
mp
les
of
AC
WW
TP
)
S
ampl
ing
Mon
th
(201
2)
Ave
rage
C
once
ntra
tion
(mg/
kg)
Is (
g/da
y)
DE
(u
nitle
ss)
RE
(u
nitle
ss)
RfD
(m
g/kg
.day
) B
W (
kg)
HI (
unitl
ess)
Hg
Jan
uar
y 0
.4
0.2
1
1 0
.00
03
16
0.0
17
Feb
ruar
y 0
.5
0.2
1 1
0.0
003
1
6 0
.02
2 M
arch
0
.8
0.2
1 1
0.0
003
1
6 0
.03
4 A
pril
0
.5
0.2
1
1 0
.00
03
16
0.0
28
May
0
.9
0.2
1 1
0.0
003
1
6 0
.03
3 Ju
ne
1.1
0
.2 1
1 0
.00
03
16
0.0
46
July
1
.0
0.2
1 1
0.0
003
1
6 0
.04
1 A
ugu
st
0.7
0
.2 1
1 0
.00
03
16
0.0
28
Sep
tem
ber
0
.8
0.2
1 1
0.0
003
1
6 0
.03
3 O
cto
ber
0
.8
0.2
1 1
0.0
003
1
6 0
.03
5 N
ove
mb
er
1.3
0
.2 1
1 0
.00
03
16
0.0
53
Dec
em
ber
1
.3
0.2
1 1
0.0
003
1
6 0
.05
5
T
able
B5:
No
n-C
anc
er R
isk
Ca
lcu
latio
ns
with
U.S
. E
PA
’s M
eth
od
for
Ni (
Slu
dge
Sa
mp
les
of
AC
WW
TP
)
S
ampl
ing
Mon
th
(201
2)
Ave
rage
C
once
ntra
tion
(mg/
kg)
Is (
g/da
y)
DE
(u
nitle
ss)
RE
(u
nitle
ss)
RfD
(m
g/kg
.day
) B
W (
kg)
HI (
unitl
ess)
Ni
Jan
uar
y 8
8.7
0
.2
1
1 0
.02
16
0.0
55
Feb
ruar
y 7
8.8
0
.2 1
1 0
.02
16
0.0
49
Mar
ch
77
.8
0.2
1 1
0.0
2 1
6 0
.04
9 A
pril
7
6.7
0
.2 1
1 0
.02
16
0.0
48
May
8
9.9
0
.2 1
1 0
.02
16
0.0
56
Jun
e 8
0.8
0
.2 1
1 0
.02
16
0.0
51
July
7
4.7
0
.2 1
1 0
.02
16
0.0
47
Au
gust
7
2.1
0
.2 1
1 0
.02
16
0.0
45
Sep
tem
ber
7
9.3
0
.2 1
1 0
.02
16
0.0
50
Oct
ob
er
69
.7
0.2
1 1
0.0
2 1
6 0
.04
4 N
ove
mb
er
76
.8
0.2
1 1
0.0
2 1
6 0
.04
8 D
ece
mb
er
75
.4
0.2
1 1
0.0
2 1
6 0
.04
7
65
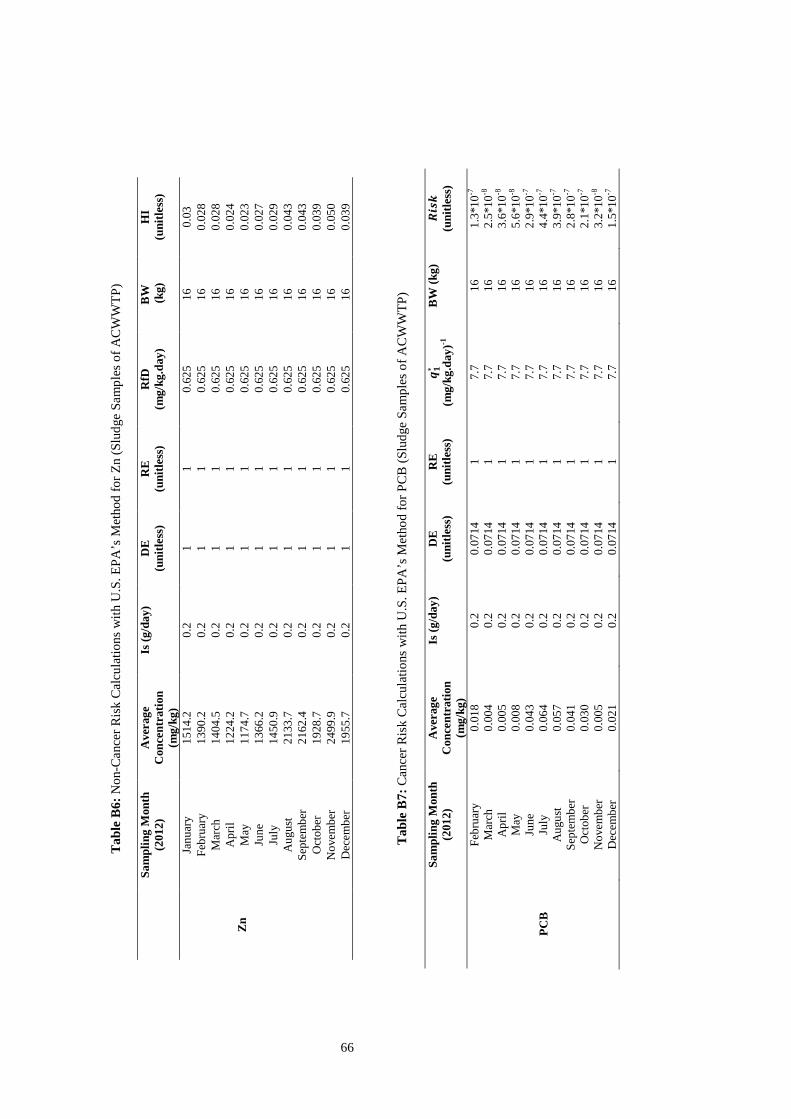
66
T
able
B6:
No
n-C
anc
er
Ris
k C
alc
ula
tion
s w
ith U
.S.
EP
A’s
Me
tho
d fo
r Z
n (S
lud
ge S
am
ple
s o
f A
CW
WT
P)
S
ampl
ing
Mon
th
(201
2)
Ave
rage
C
once
ntra
tion
(mg/
kg)
Is (
g/da
y)
DE
(u
nitle
ss)
RE
(u
nitle
ss)
RfD
(m
g/kg
.day
) B
W
(kg
) H
I (u
nitle
ss)
Z
n
Jan
uar
y 1
514
.2
0.2
1
1
0.6
25
16
0.0
3 F
ebru
ary
13
90.2
0
.2 1
1 0
.62
5 1
6 0
.02
8 M
arch
1
404
.5
0.2
1 1
0.6
25
16
0.0
28
Ap
ril
12
24.2
0
.2 1
1 0
.62
5 1
6 0
.02
4 M
ay
11
74.7
0
.2 1
1 0
.62
5 1
6 0
.02
3 Ju
ne
13
66.2
0
.2 1
1 0
.62
5 1
6 0
.02
7 Ju
ly
14
50.9
0
.2 1
1 0
.62
5 1
6 0
.02
9 A
ugu
st
21
33.7
0
.2 1
1 0
.62
5 1
6 0
.04
3 S
epte
mb
er
21
62.4
0
.2 1
1 0
.62
5 1
6 0
.04
3 O
cto
ber
1
928
.7
0.2
1 1
0.6
25
16
0.0
39
No
vem
ber
2
499
.9
0.2
1 1
0.6
25
16
0.0
50
Dec
em
ber
1
955
.7
0.2
1 1
0.6
25
16
0.0
39
T
able
B7:
Can
cer
Ris
k C
alcu
latio
ns w
ith U
.S.
EP
A’s
Me
tho
d fo
r P
CB
(S
lud
ge S
am
ple
s o
f A
CW
WT
P)
Sam
plin
g M
onth
(2
012)
A
vera
ge
Con
cent
ratio
n (m
g/kg
)
Is (
g/da
y)
DE
(u
nitle
ss)
RE
(u
nitle
ss)
b c∗ (m
g/kg
.day
)-1
BW
(kg
) _l
mn
(uni
tless
)
F
ebru
ary
0.0
18
0.2
0
.07
14
1
7.7
1
6 1
.3*1
0-7
M
arch
0
.00
4 0
.2
0.0
714
1
7
.7
16
2.5
*10
-8
A
pril
0
.00
5 0
.2
0.0
714
1
7
.7
16
3.6
*10
-8
M
ay
0.0
08
0.2
0
.07
14
1
7.7
1
6 5
.6*1
0-8
Jun
e 0
.04
3 0
.2
0.0
714
1
7
.7
16
2.9
*10
-7
PC
B
July
0
.06
4 0
.2
0.0
714
1
7
.7
16
4.4
*10
-7
A
ugu
st
0.0
57
0.2
0
.07
14
1
7.7
1
6 3
.9*1
0-7
Sep
tem
ber
0
.04
1 0
.2
0.0
714
1
7
.7
16
2.8
*10
-7
O
cto
ber
0
.03
0 0
.2
0.0
714
1
7
.7
16
2.1
*10
-7
N
ove
mb
er
0.0
05
0.2
0
.07
14
1
7.7
1
6 3
.2*1
0-8
Dec
em
ber
0
.02
1 0
.2
0.0
714
1
7
.7
16
1.5
*10
-7
66
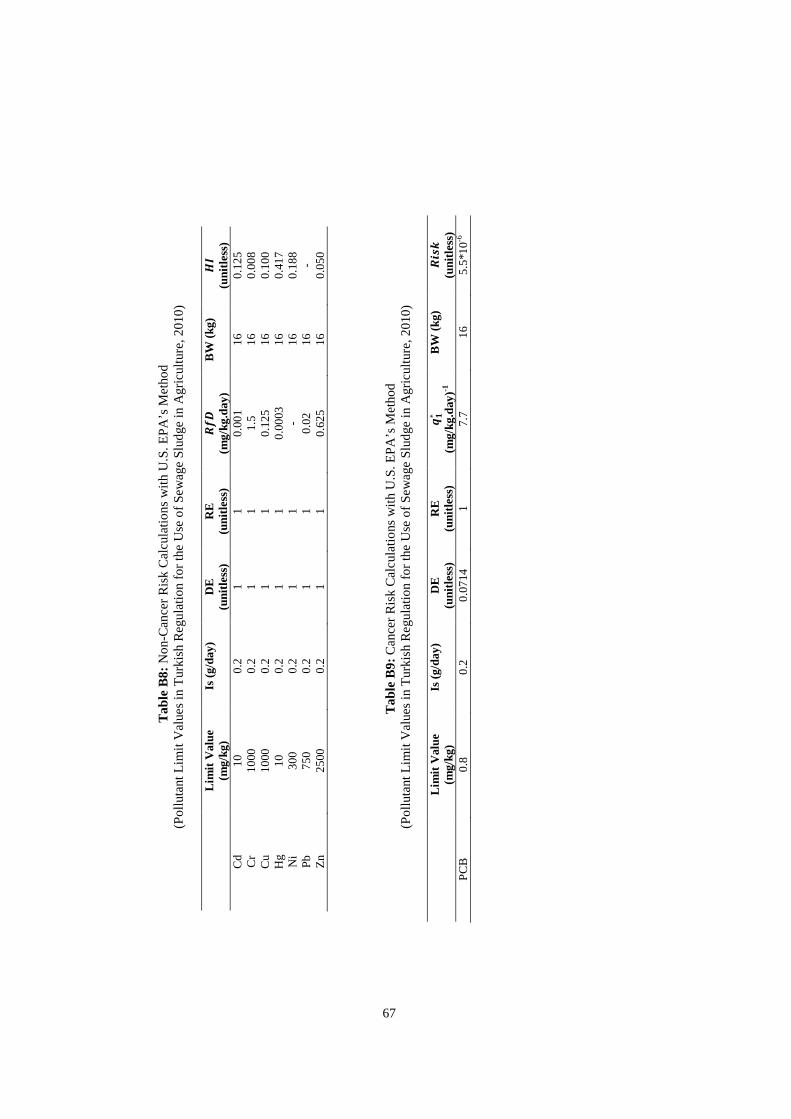
67
Tab
le B
8: No
n-C
an
cer
Ris
k C
alc
ula
tion
s w
ith U
.S.
EP
A’s
Met
hod
(
Po
lluta
nt L
imit
Val
ues
in T
urki
sh R
egu
latio
n fo
r th
e U
se o
f Se
wa
ge S
lud
ge in
Agr
icul
ture
, 2
010
)
Li
mit
Val
ue
(mg/
kg)
Is (
g/da
y)
DE
(u
nitle
ss)
RE
(u
nitle
ss)
_`a
(mg/
kg.d
ay)
BW
(kg
) jk
(u
nitle
ss)
Cd
1
0 0
.2
1
1
0.0
01
16
0.1
25
Cr
10
00
0.2
1
1
1
.5
16
0.0
08
Cu
1
000
0
.2
1
1
0.1
25
16
0.1
00
Hg
1
0 0
.2
1
1
0.0
003
1
6 0
.41
7 N
i 3
00
0.2
1
1
-
16
0.1
88
Pb
75
0 0
.2
1
1
0.0
2 1
6 -
Zn
25
00
0.2
1
1
0
.62
5 1
6 0
.05
0
Tab
le B
9: Ca
nce
r R
isk
Ca
lcul
atio
ns w
ith U
.S.
EP
A’s
Met
hod
(
Po
lluta
nt L
imit
Va
lue
s in
Tur
kish
Re
gula
tion
for
the
Use
of S
ew
age
Slu
dge
in A
gric
ultu
re,
20
10)
Lim
it V
alue
(m
g/kg
) Is
(g/
day)
D
E
(uni
tless
) R
E
(uni
tless
) b c∗
(mg/
kg.d
ay)-1
B
W (
kg)
_lmn
(u
nitle
ss)
PC
B
0.8
0
.2
0.0
714
1
7
.7
16
5.5
*10
-6
67

68
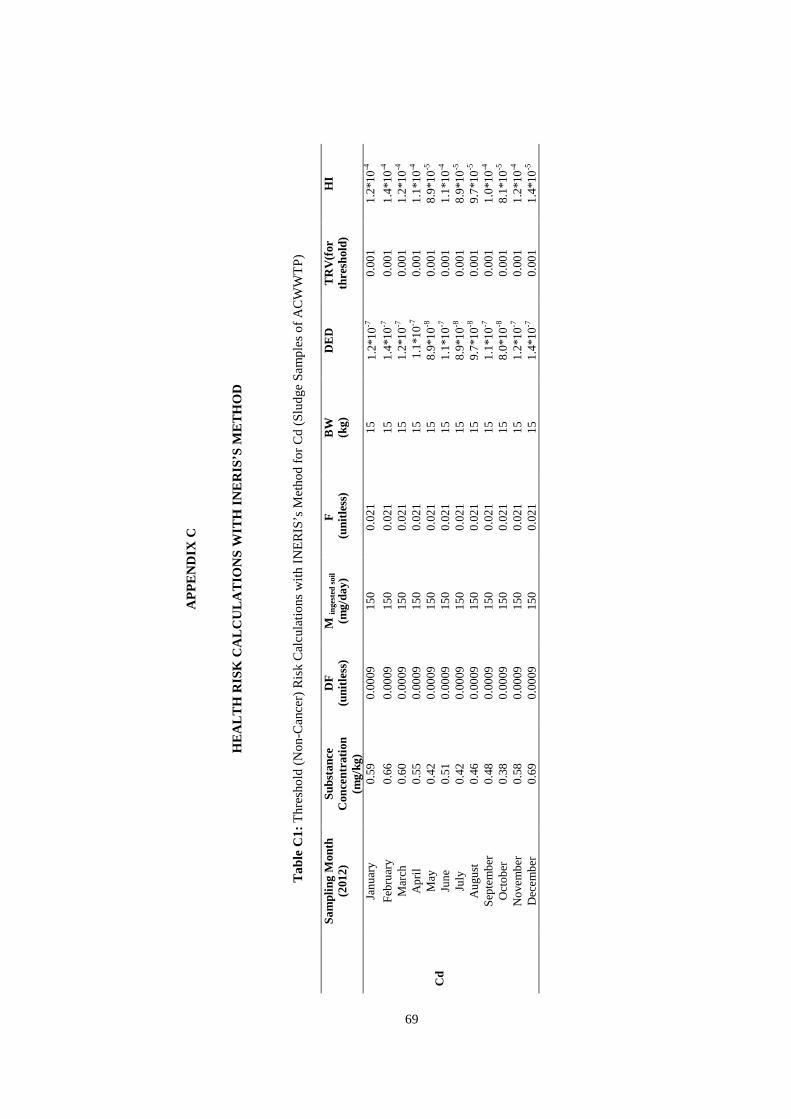
69
AP
PE
ND
IX C
HE
ALT
H R
ISK
CA
LCU
LAT
ION
S W
ITH
INE
RIS
’S M
ET
HO
D
T
able
C1:
Thr
esho
ld (
No
n-C
ance
r) R
isk
Ca
lcul
atio
ns w
ith I
NE
RI
S’s
Me
tho
d fo
r C
d (
Slu
dge
Sa
mp
les
of
AC
WW
TP
)
S
ampl
ing
Mon
th
(201
2)
Sub
stan
ce
Con
cent
ratio
n (m
g/kg
)
DF
(u
nitle
ss)
M in
gest
ed s
oil
(mg/
day)
F
(
unitl
ess)
B
W
(kg)
DE
D
TR
V(f
or
thre
shol
d)
HI
Cd
Jan
uar
y 0
.59
0.0
009
1
50
0.0
21
15
1.2
*10-7
0
.00
1 1
.2*1
0-4
Feb
ruar
y 0
.66
0.0
009
1
50
0.0
21
15
1.4
*10
-7
0.0
01
1.4
*10-4
M
arch
0
.60
0.0
009
1
50
0.0
21
15
1.2
*10
-7
0.0
01
1.2
*10-4
A
pril
0
.55
0.0
009
1
50
0.0
21
15
1.1
*10
-7
0.0
01
1.1
*10-4
M
ay
0.4
2 0
.00
09
15
0 0
.02
1 1
5 8
.9*1
0-8
0
.00
1 8
.9*1
0-5
Jun
e 0
.51
0.0
009
1
50
0.0
21
15
1.1
*10
-7
0.0
01
1.1
*10-4
Ju
ly
0.4
2 0
.00
09
15
0 0
.02
1 1
5 8
.9*1
0-8
0
.00
1 8
.9*1
0-5
Au
gust
0
.46
0.0
009
1
50
0.0
21
15
9.7
*10
-8
0.0
01
9.7
*10-5
S
epte
mb
er
0.4
8 0
.00
09
15
0 0
.02
1 1
5 1
.1*1
0-7
0
.00
1 1
.0*1
0-4
Oct
ob
er
0.3
8 0
.00
09
15
0 0
.02
1 1
5 8
.0*1
0-8
0
.00
1 8
.1*1
0-5
No
vem
ber
0
.58
0.0
009
1
50
0.0
21
15
1.2
*10
-7
0.0
01
1.2
*10-4
D
ece
mb
er
0.6
9 0
.00
09
15
0 0
.02
1 1
5 1
.4*1
0-7
0
.00
1 1
.4*1
0-5
69
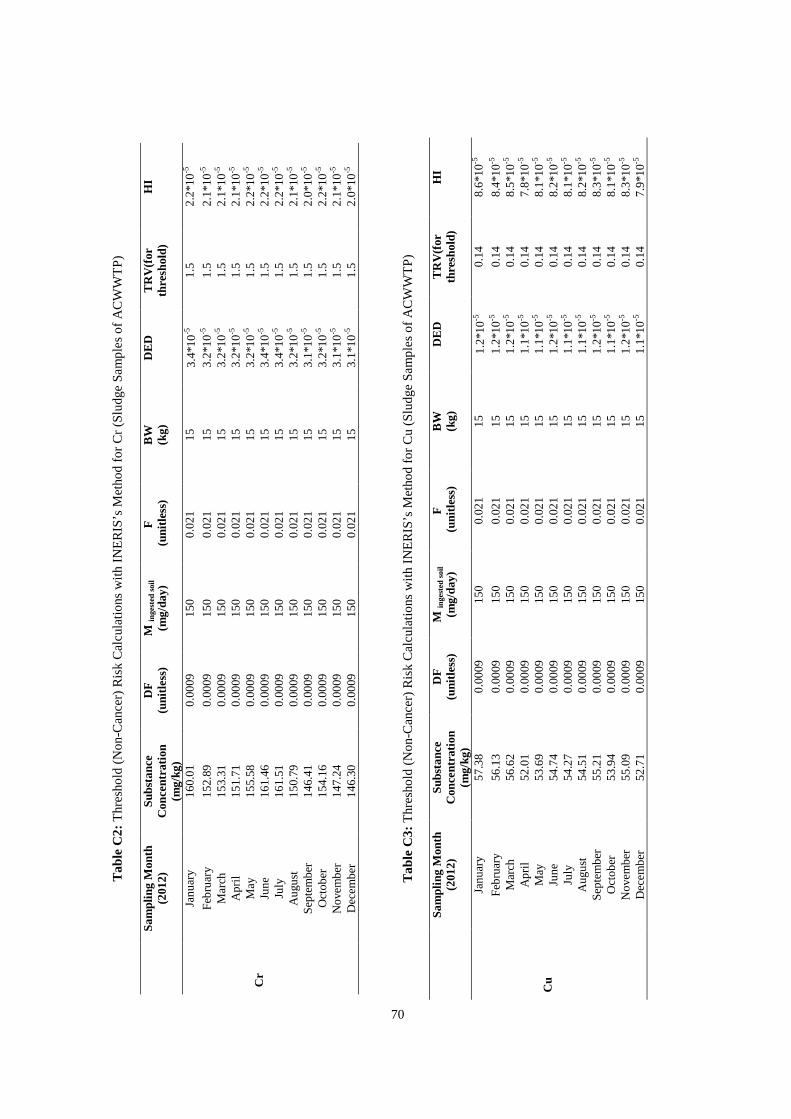
70
T
able
C2:
Thr
esho
ld (
No
n-C
ance
r) R
isk
Ca
lcul
atio
ns w
ith I
NE
RI
S’s
Me
tho
d fo
r C
r (S
lud
ge S
am
ple
s o
f A
CW
WT
P)
Sam
plin
g M
onth
(2
012)
S
ubst
ance
C
once
ntra
tion
(mg/
kg)
DF
(u
nitle
ss)
M in
gest
ed s
oil
(mg/
day)
F
(
unitl
ess)
B
W
(kg)
DE
D
TR
V(f
or
thre
shol
d)
HI
Cr
Jan
uar
y 1
60.
01
0.0
009
1
50
0.0
21
15
3.4
*10-5
1
.5
2.2
*10-5
Feb
ruar
y 1
52.
89
0.0
009
1
50
0.0
21
15
3.2
*10
-5
1.5
2
.1*1
0-5
Mar
ch
15
3.31
0
.00
09
15
0 0
.02
1 1
5 3
.2*1
0-5
1
.5
2.1
*10-5
A
pril
1
51.
71
0.0
009
1
50
0.0
21
15
3.2
*10
-5
1.5
2
.1*1
0-5
May
1
55.
58
0.0
009
1
50
0.0
21
15
3.2
*10
-5
1.5
2
.2*1
0-5
Jun
e 1
61.
46
0.0
009
1
50
0.0
21
15
3.4
*10
-5
1.5
2
.2*1
0-5
July
1
61.
51
0.0
009
1
50
0.0
21
15
3.4
*10
-5
1.5
2
.2*1
0-5
Au
gust
1
50.
79
0.0
009
1
50
0.0
21
15
3.2
*10
-5
1.5
2
.1*1
0-5
Sep
tem
ber
1
46.
41
0.0
009
1
50
0.0
21
15
3.1
*10
-5
1.5
2
.0*1
0-5
Oct
ob
er
15
4.16
0
.00
09
15
0 0
.02
1 1
5 3
.2*1
0-5
1
.5
2.2
*10-5
N
ove
mb
er
14
7.24
0
.00
09
15
0 0
.02
1 1
5 3
.1*1
0-5
1
.5
2.1
*10-5
D
ece
mb
er
14
6.30
0
.00
09
15
0 0
.02
1 1
5 3
.1*1
0-5
1
.5
2.0
*10-5
Tab
le C
3: T
hres
hold
(N
on-
Can
cer)
Ris
k C
alc
ula
tions
with
IN
ER
IS
’s M
eth
od
for
Cu
(Slu
dge
Sa
mp
les
of
AC
WW
TP
)
S
ampl
ing
Mon
th
(201
2)
Sub
stan
ce
Con
cent
ratio
n (m
g/kg
)
DF
(u
nitle
ss)
M in
gest
ed s
oil
(mg/
day)
F
(
unitl
ess)
B
W
(kg)
DE
D
TR
V(f
or
thre
shol
d)
HI
Cu
Jan
uar
y 5
7.3
8 0
.00
09
15
0 0
.02
1 1
5 1
.2*1
0-5
0.1
4 8
.6*1
0-5
Feb
ruar
y 5
6.1
3 0
.00
09
15
0 0
.02
1 1
5 1
.2*1
0-5
0
.14
8.4
*10-5
M
arch
5
6.6
2 0
.00
09
15
0 0
.02
1 1
5 1
.2*1
0-5
0
.14
8.5
*10-5
A
pril
5
2.0
1 0
.00
09
15
0 0
.02
1 1
5 1
.1*1
0-5
0
.14
7.8
*10-5
M
ay
53
.69
0.0
009
1
50
0.0
21
15
1.1
*10
-5
0.1
4 8
.1*1
0-5
Jun
e 5
4.7
4 0
.00
09
15
0 0
.02
1 1
5 1
.2*1
0-5
0
.14
8.2
*10-5
July
5
4.2
7 0
.00
09
15
0 0
.02
1 1
5 1
.1*1
0-5
0
.14
8.1
*10-5
A
ugu
st
54
.51
0.0
009
1
50
0.0
21
15
1.1
*10
-5
0.1
4 8
.2*1
0-5
Sep
tem
ber
5
5.2
1 0
.00
09
15
0 0
.02
1 1
5 1
.2*1
0-5
0
.14
8.3
*10-5
O
cto
ber
5
3.9
4 0
.00
09
15
0 0
.02
1 1
5 1
.1*1
0-5
0
.14
8.1
*10-5
N
ove
mb
er
55
.09
0.0
009
1
50
0.0
21
15
1.2
*10
-5
0.1
4 8
.3*1
0-5
Dec
em
ber
5
2.7
1 0
.00
09
15
0 0
.02
1 1
5 1
.1*1
0-5
0
.14
7.9
*10-5
70
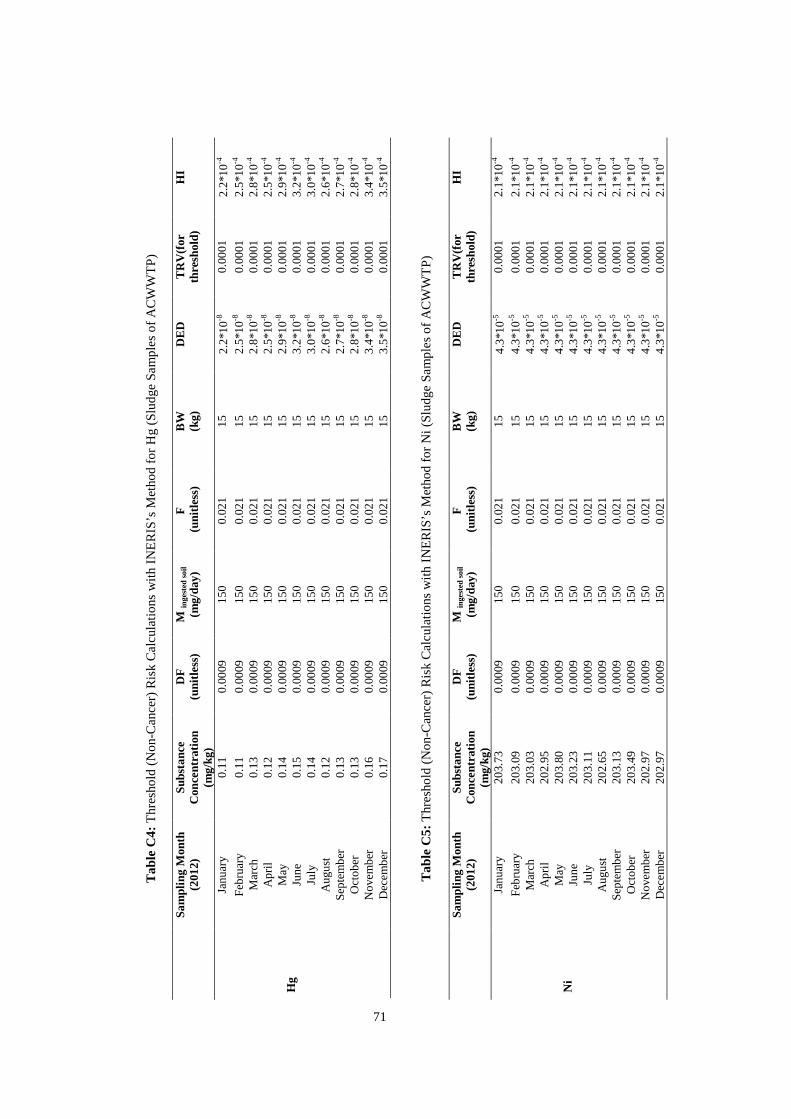
71
Tab
le C
4: T
hres
hold
(N
on-
Can
cer)
Ris
k C
alc
ula
tions
with
IN
ER
IS
’s M
eth
od
for
Hg
(Slu
dge
Sa
mp
les
of
AC
WW
TP
)
S
ampl
ing
Mon
th
(201
2)
Sub
stan
ce
Con
cent
ratio
n (m
g/kg
)
DF
(u
nitle
ss)
M in
gest
ed s
oil
(mg/
day)
F
(
unitl
ess)
B
W
(kg)
DE
D
TR
V(f
or
thre
shol
d)
HI
Hg
Jan
uar
y 0
.11
0.0
009
1
50
0.0
21
15
2.2
*10-8
0
.00
01
2.2
*10-4
Feb
ruar
y 0
.11
0.0
009
1
50
0.0
21
15
2.5
*10
-8
0.0
001
2
.5*1
0-4
Mar
ch
0.1
3 0
.00
09
15
0 0
.02
1 1
5 2
.8*1
0-8
0
.00
01
2.8
*10-4
A
pril
0
.12
0.0
009
1
50
0.0
21
15
2.5
*10
-8
0.0
001
2
.5*1
0-4
May
0
.14
0.0
009
1
50
0.0
21
15
2.9
*10
-8
0.0
001
2
.9*1
0-4
Jun
e 0
.15
0.0
009
1
50
0.0
21
15
3.2
*10
-8
0.0
001
3
.2*1
0-4
July
0
.14
0.0
009
1
50
0.0
21
15
3.0
*10
-8
0.0
001
3
.0*1
0-4
Au
gust
0
.12
0.0
009
1
50
0.0
21
15
2.6
*10
-8
0.0
001
2
.6*1
0-4
Sep
tem
ber
0
.13
0.0
009
1
50
0.0
21
15
2.7
*10
-8
0.0
001
2
.7*1
0-4
Oct
ob
er
0.1
3 0
.00
09
15
0 0
.02
1 1
5 2
.8*1
0-8
0
.00
01
2.8
*10-4
N
ove
mb
er
0.1
6 0
.00
09
15
0 0
.02
1 1
5 3
.4*1
0-8
0
.00
01
3.4
*10-4
D
ece
mb
er
0.1
7 0
.00
09
15
0 0
.02
1 1
5 3
.5*1
0-8
0
.00
01
3.5
*10-4
Tab
le C
5: T
hre
sho
ld (
No
n-C
anc
er)
Ris
k C
alc
ula
tions
with
IN
ER
IS
’s M
eth
od
for
Ni (
Slu
dge
Sa
mp
les
of
AC
WW
TP
)
S
ampl
ing
Mon
th
(201
2)
Sub
stan
ce
Con
cent
ratio
n (m
g/kg
)
DF
(u
nitle
ss)
M in
gest
ed s
oil
(mg/
day)
F
(
unitl
ess)
B
W
(kg)
DE
D
TR
V(f
or
thre
shol
d)
HI
Ni
Jan
uar
y 2
03.
73
0.0
009
1
50
0.0
21
15
4.3
*10-5
0
.00
01
2.1
*10-4
Feb
ruar
y 2
03.
09
0.0
009
1
50
0.0
21
15
4.3
*10
-5
0.0
001
2
.1*1
0-4
Mar
ch
20
3.03
0
.00
09
15
0 0
.02
1 1
5 4
.3*1
0-5
0
.00
01
2.1
*10-4
A
pril
2
02.
95
0.0
009
1
50
0.0
21
15
4.3
*10
-5
0.0
001
2
.1*1
0-4
May
2
03.
80
0.0
009
1
50
0.0
21
15
4.3
*10
-5
0.0
001
2
.1*1
0-4
Jun
e 2
03.
23
0.0
009
1
50
0.0
21
15
4.3
*10
-5
0.0
001
2
.1*1
0-4
July
2
03.
11
0.0
009
1
50
0.0
21
15
4.3
*10
-5
0.0
001
2
.1*1
0-4
Au
gust
2
02.
65
0.0
009
1
50
0.0
21
15
4.3
*10
-5
0.0
001
2
.1*1
0-4
Sep
tem
ber
2
03.
13
0.0
009
1
50
0.0
21
15
4.3
*10
-5
0.0
001
2
.1*1
0-4
Oct
ob
er
20
3.49
0
.00
09
15
0 0
.02
1 1
5 4
.3*1
0-5
0
.00
01
2.1
*10-4
N
ove
mb
er
20
2.97
0
.00
09
15
0 0
.02
1 1
5 4
.3*1
0-5
0
.00
01
2.1
*10-4
D
ece
mb
er
20
2.97
0
.00
09
15
0 0
.02
1 1
5 4
.3*1
0-5
0
.00
01
2.1
*10-4
71
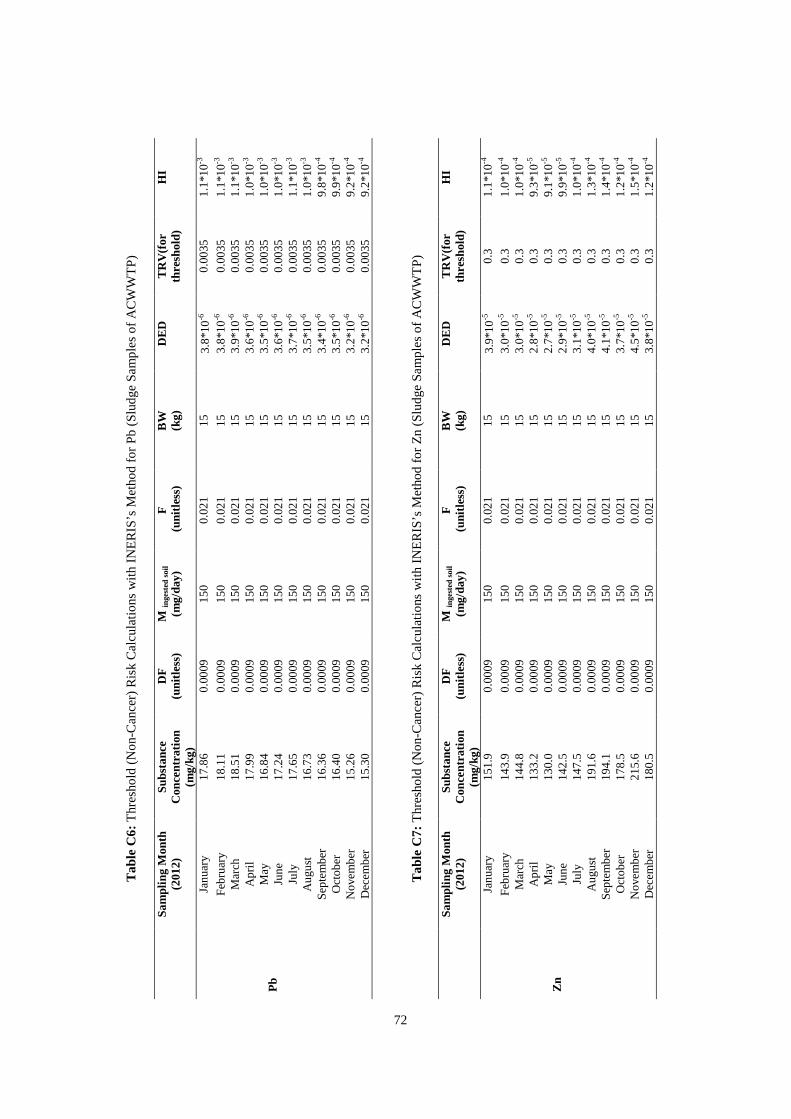
72
T
able
C6:
Thr
esho
ld (
No
n-C
ance
r) R
isk
Ca
lcul
atio
ns w
ith I
NE
RI
S’s
Me
tho
d fo
r P
b (
Slu
dge
Sa
mp
les
of
AC
WW
TP
)
S
ampl
ing
Mon
th
(201
2)
Sub
stan
ce
Con
cent
ratio
n (m
g/kg
)
DF
(u
nitle
ss)
M in
gest
ed s
oil
(mg/
day)
F
(
unitl
ess)
B
W
(kg)
DE
D
TR
V(f
or
thre
shol
d)
HI
Pb
Jan
uar
y 1
7.8
6 0
.00
09
15
0 0
.02
1 1
5 3
.8*1
0-6
0.0
035
1
.1*1
0-3
Feb
ruar
y 1
8.1
1 0
.00
09
15
0 0
.02
1 1
5 3
.8*1
0-6
0
.00
35
1.1
*10-3
M
arch
1
8.5
1 0
.00
09
15
0 0
.02
1 1
5 3
.9*1
0-6
0
.00
35
1.1
*10-3
A
pril
1
7.9
9 0
.00
09
15
0 0
.02
1 1
5 3
.6*1
0-6
0
.00
35
1.0
*10-3
M
ay
16
.84
0.0
009
1
50
0.0
21
15
3.5
*10
-6
0.0
035
1
.0*1
0-3
Jun
e 1
7.2
4 0
.00
09
15
0 0
.02
1 1
5 3
.6*1
0-6
0
.00
35
1.0
*10-3
Ju
ly
17
.65
0.0
009
1
50
0.0
21
15
3.7
*10
-6
0.0
035
1
.1*1
0-3
Au
gust
1
6.7
3 0
.00
09
15
0 0
.02
1 1
5 3
.5*1
0-6
0
.00
35
1.0
*10-3
S
epte
mb
er
16
.36
0.0
009
1
50
0.0
21
15
3.4
*10
-6
0.0
035
9
.8*1
0-4
Oct
ob
er
16
.40
0.0
009
1
50
0.0
21
15
3.5
*10
-6
0.0
035
9
.9*1
0-4
No
vem
ber
1
5.2
6 0
.00
09
15
0 0
.02
1 1
5 3
.2*1
0-6
0
.00
35
9.2
*10-4
D
ece
mb
er
15
.30
0.0
009
1
50
0.0
21
15
3.2
*10
-6
0.0
035
9
.2*1
0-4
T
able
C7:
Thr
esh
old
(N
on-
Ca
ncer
) R
isk
Ca
lcul
atio
ns w
ith I
NE
RI
S’s
Me
tho
d fo
r Z
n (S
lud
ge S
am
ple
s o
f A
CW
WT
P)
Sam
plin
g M
onth
(2
012)
S
ubst
ance
C
once
ntra
tion
(mg/
kg)
DF
(u
nitle
ss)
M in
gest
ed s
oil
(mg/
day)
F
(
unitl
ess)
B
W
(kg)
DE
D
TR
V(f
or
thre
shol
d)
HI
Zn
Jan
uar
y 1
51.
9 0
.00
09
15
0 0
.02
1 1
5 3
.9*1
0-5
0.3
1
.1*1
0-4
Feb
ruar
y 1
43.
9 0
.00
09
15
0 0
.02
1 1
5 3
.0*1
0-5
0
.3
1.0
*10-4
M
arch
1
44.
8 0
.00
09
15
0 0
.02
1 1
5 3
.0*1
0-5
0
.3
1.0
*10-4
A
pril
1
33.
2 0
.00
09
15
0 0
.02
1 1
5 2
.8*1
0-5
0
.3
9.3
*10-5
M
ay
13
0.0
0.0
009
1
50
0.0
21
15
2.7
*10
-5
0.3
9
.1*1
0-5
Jun
e 1
42.
5 0
.00
09
15
0 0
.02
1 1
5 2
.9*1
0-5
0
.3
9.9
*10-5
Ju
ly
14
7.5
0.0
009
1
50
0.0
21
15
3.1
*10
-5
0.3
1
.0*1
0-4
Au
gust
1
91.
6 0
.00
09
15
0 0
.02
1 1
5 4
.0*1
0-5
0
.3
1.3
*10-4
S
epte
mb
er
19
4.1
0.0
009
1
50
0.0
21
15
4.1
*10
-5
0.3
1
.4*1
0-4
Oct
ob
er
17
8.5
0.0
009
1
50
0.0
21
15
3.7
*10
-5
0.3
1
.2*1
0-4
No
vem
ber
2
15.
6 0
.00
09
15
0 0
.02
1 1
5 4
.5*1
0-5
0
.3
1.5
*10-4
D
ece
mb
er
18
0.5
0.0
009
1
50
0.0
21
15
3.8
*10
-5
0.3
1
.2*1
0-4
72
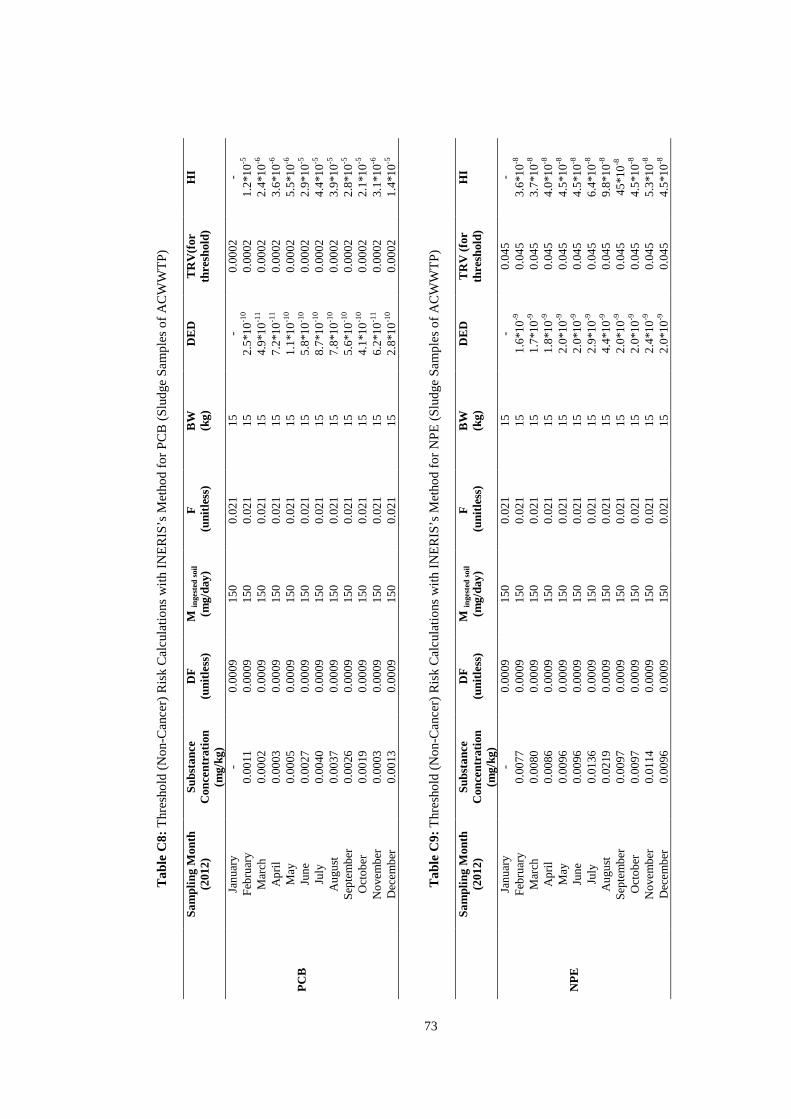
73
T
able
C8:
Thr
esho
ld (
No
n-C
anc
er)
Ris
k C
alc
ula
tions
with
IN
ER
IS
’s M
eth
od
for
PC
B (
Slu
dge
Sa
mp
les
of
AC
WW
TP
)
S
ampl
ing
Mon
th
(201
2)
Sub
stan
ce
Con
cent
ratio
n (m
g/kg
)
DF
(u
nitle
ss)
M in
gest
ed s
oil
(mg/
day)
F
(
unitl
ess)
B
W
(kg)
DE
D
TR
V(f
or
thre
shol
d)
HI
PC
B
Jan
uar
y -
0.0
009
1
50
0.0
21
15
- 0
.00
02
- F
ebru
ary
0.0
011
0
.00
09
15
0 0
.02
1 1
5 2
.5*1
0-1
0 0
.00
02
1.2
*10-5
Mar
ch
0.0
002
0
.00
09
15
0 0
.02
1 1
5 4
.9*1
0-1
1 0
.00
02
2.4
*10-6
A
pril
0
.00
03
0.0
009
1
50
0.0
21
15
7.2
*10
-11
0.0
002
3
.6*1
0-6
May
0
.00
05
0.0
009
1
50
0.0
21
15
1.1
*10
-10
0.0
002
5
.5*1
0-6
Jun
e 0
.00
27
0.0
009
1
50
0.0
21
15
5.8
*10
-10
0.0
002
2
.9*1
0-5
July
0
.00
40
0.0
009
1
50
0.0
21
15
8.7
*10
-10
0.0
002
4
.4*1
0-5
Au
gust
0
.00
37
0.0
009
1
50
0.0
21
15
7.8
*10
-10
0.0
002
3
.9*1
0-5
Sep
tem
ber
0
.00
26
0.0
009
1
50
0.0
21
15
5.6
*10
-10
0.0
002
2
.8*1
0-5
Oct
ob
er
0.0
019
0
.00
09
15
0 0
.02
1 1
5 4
.1*1
0-1
0 0
.00
02
2.1
*10-5
N
ove
mb
er
0.0
003
0
.00
09
15
0 0
.02
1 1
5 6
.2*1
0-1
1 0
.00
02
3.1
*10-6
D
ece
mb
er
0.0
013
0
.00
09
15
0 0
.02
1 1
5 2
.8*1
0-1
0 0
.00
02
1.4
*10-5
Tab
le C
9: T
hres
hold
(N
on-
Can
cer)
Ris
k C
alc
ula
tions
with
IN
ER
IS
’s M
eth
od
for
NP
E (
Slu
dge
Sa
mp
les
of
AC
WW
TP
)
S
ampl
ing
Mon
th
(201
2)
Sub
stan
ce
Con
cent
ratio
n (m
g/kg
)
DF
(u
nitle
ss)
M in
gest
ed s
oil
(mg/
day)
F
(
unitl
ess)
B
W
(kg)
DE
D
TR
V (
for
thre
shol
d)
HI
NP
E
Jan
uar
y -
0.0
009
1
50
0.0
21
15
- 0
.04
5 -
Feb
ruar
y 0
.00
77
0.0
009
1
50
0.0
21
15
1.6
*10
-9
0.0
45
3.6
*10-8
M
arch
0
.00
80
0.0
009
1
50
0.0
21
15
1.7
*10
-9
0.0
45
3.7
*10-8
A
pril
0
.00
86
0.0
009
1
50
0.0
21
15
1.8
*10
-9
0.0
45
4.0
*10-8
M
ay
0.0
096
0
.00
09
15
0 0
.02
1 1
5 2
.0*1
0-9
0
.04
5 4
.5*1
0-8
Jun
e 0
.00
96
0.0
009
1
50
0.0
21
15
2.0
*10
-9
0.0
45
4.5
*10-8
Ju
ly
0.0
136
0
.00
09
15
0 0
.02
1 1
5 2
.9*1
0-9
0
.04
5 6
.4*1
0-8
Au
gust
0
.02
19
0.0
009
1
50
0.0
21
15
4.4
*10
-9
0.0
45
9.8
*10-8
S
epte
mb
er
0.0
097
0
.00
09
15
0 0
.02
1 1
5 2
.0*1
0-9
0
.04
5 4
5*1
0-8
Oct
ob
er
0.0
097
0
.00
09
15
0 0
.02
1 1
5 2
.0*1
0-9
0
.04
5 4
.5*1
0-8
No
vem
ber
0
.01
14
0.0
009
1
50
0.0
21
15
2.4
*10
-9
0.0
45
5.3
*10-8
D
ece
mb
er
0.0
096
0
.00
09
15
0 0
.02
1 1
5 2
.0*1
0-9
0
.04
5 4
.5*1
0-8
73
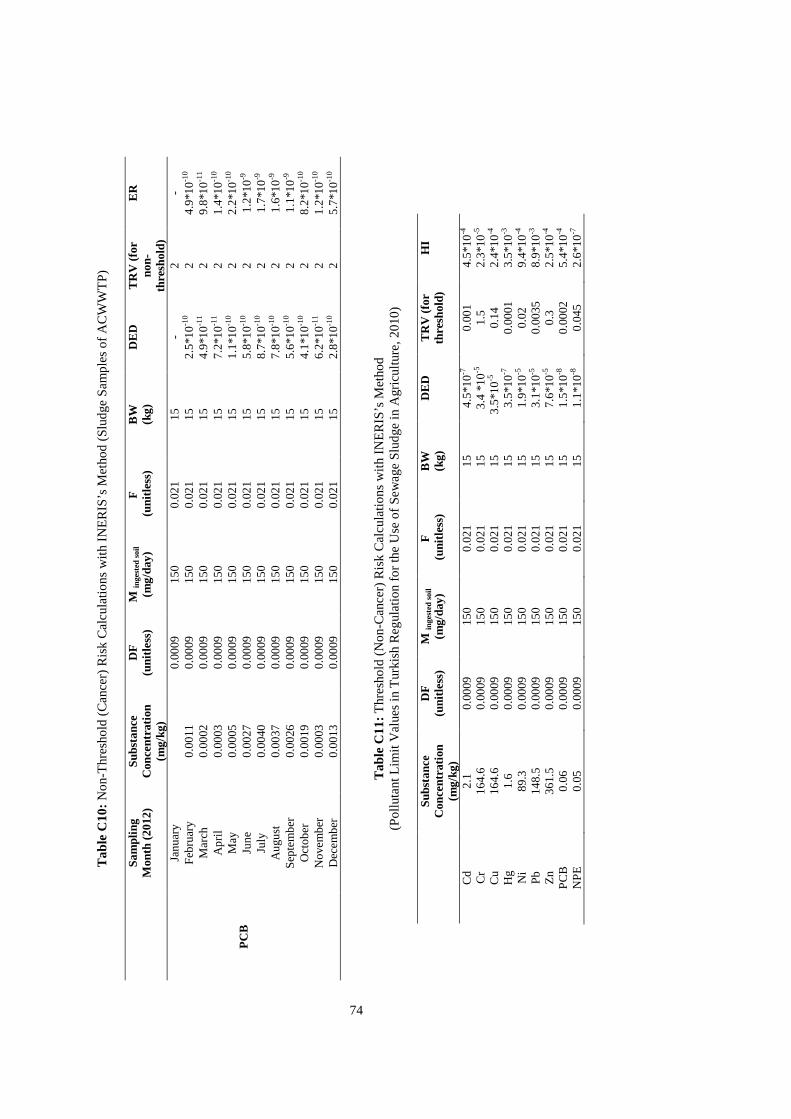
74
Tab
le C
10: N
on-
Thr
esho
ld (
Can
cer)
Ris
k C
alc
ulat
ion
s w
ith I
NE
RI
S’s
Me
tho
d (
Slu
dge
Sa
mp
les
of
AC
WW
TP
)
S
ampl
ing
Mon
th (
2012
) S
ubst
ance
C
once
ntra
tion
(mg/
kg)
DF
(u
nitle
ss)
M in
gest
ed s
oil
(mg/
day)
F
(
unitl
ess)
B
W
(kg)
DE
D
TR
V (
for
non-
thre
shol
d)
ER
P
CB
Jan
uar
y
0.0
009
1
50
0.0
21
15
- 2
-
Feb
ruar
y 0
.00
11
0.0
009
1
50
0.0
21
15
2.5
*10
-10
2
4.9
*10-1
0
Mar
ch
0.0
002
0
.00
09
15
0 0
.02
1 1
5 4
.9*1
0-1
1 2
9
.8*1
0-11
Ap
ril
0.0
003
0
.00
09
15
0 0
.02
1 1
5 7
.2*1
0-1
1 2
1
.4*1
0-10
May
0
.00
05
0.0
009
1
50
0.0
21
15
1.1
*10
-10
2
2.2
*10-1
0 Ju
ne
0.0
027
0
.00
09
15
0 0
.02
1 1
5 5
.8*1
0-1
0 2
1
.2*1
0-9
July
0
.00
40
0.0
009
1
50
0.0
21
15
8.7
*10
-10
2
1.7
*10-9
A
ugu
st
0.0
037
0
.00
09
15
0 0
.02
1 1
5 7
.8*1
0-1
0 2
1
.6*1
0-9
Sep
tem
ber
0
.00
26
0.0
009
1
50
0.0
21
15
5.6
*10
-10
2
1.1
*10-9
O
cto
ber
0
.00
19
0.0
009
1
50
0.0
21
15
4.1
*10
-10
2
8.2
*10-1
0 N
ove
mb
er
0.0
003
0
.00
09
15
0 0
.02
1 1
5 6
.2*1
0-1
1 2
1
.2*1
0-10
Dec
em
ber
0
.00
13
0.0
009
1
50
0.0
21
15
2.8
*10
-10
2
5.7
*10-1
0
Tab
le C
11: T
hre
sho
ld (
No
n-C
anc
er)
Ris
k C
alc
ula
tion
s w
ith I
NE
RI
S’s
Met
hod
(P
ollu
tant
Lim
it V
alue
s in
Tur
kish
Re
gul
atio
n fo
r t
he U
se o
f S
ew
age
Slu
dge
in A
gric
ultu
re,
20
10)
Sub
stan
ce
Con
cent
ratio
n (m
g/kg
)
DF
(u
nitle
ss)
M in
gest
ed s
oil
(mg/
day)
F
(
unitl
ess)
B
W
(kg)
DE
D
TR
V (
for
thre
shol
d)
HI
Cd
2
.1
0.0
009
1
50
0.0
21
15
4.5
*10
-7
0.0
01
4.5
*10-4
C
r 1
64.
6 0
.00
09
15
0 0
.02
1 1
5 3
.4 *
10
-5
1.5
2
.3*1
0-5
Cu
1
64.
6 0
.00
09
15
0 0
.02
1 1
5 3
.5*1
0-5
0
.14
2.4
*10-4
H
g
1.6
0
.00
09
15
0 0
.02
1 1
5 3
.5*1
0-7
0
.00
01
3.5
*10-3
N
i 8
9.3
0
.00
09
15
0 0
.02
1 1
5 1
.9*1
0-5
0
.02
9.4
*10-4
P
b 1
48.
5 0
.00
09
15
0 0
.02
1 1
5 3
.1*1
0-5
0
.00
35
8.9
*10-3
Z
n 3
61.
5 0
.00
09
15
0 0
.02
1 1
5 7
.6*1
0-5
0
.3
2.5
*10-4
P
CB
0
.06
0.0
009
1
50
0.0
21
15
1.5
*10
-8
0.0
002
5
.4*1
0-4
NP
E
0.0
5 0
.00
09
15
0 0
.02
1 1
5 1
.1*1
0-8
0
.04
5 2
.6*1
0-7
74
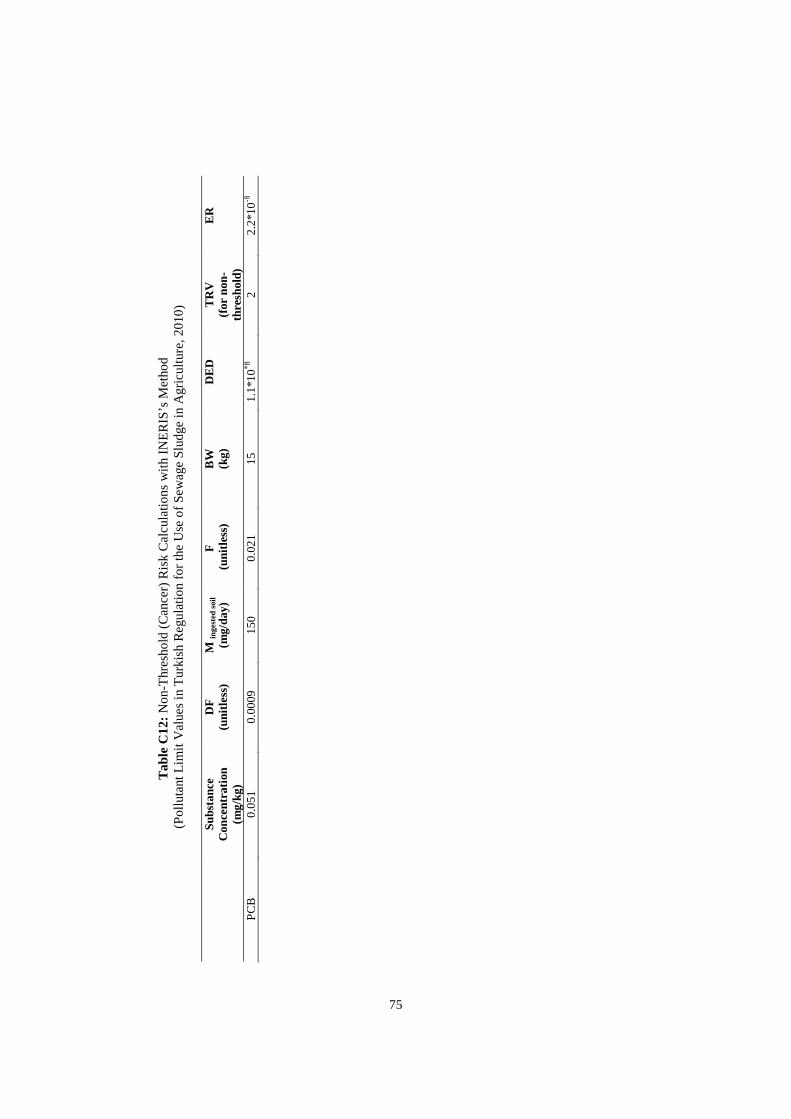
75
T
able
C12
: No
n-T
hre
sho
ld (
Ca
ncer
) R
isk
Ca
lcul
atio
ns
with
IN
ER
IS
’s M
etho
d
(P
ollu
tant
Lim
it V
alue
s in
Tur
kish
Re
gula
tion
for
the
Use
of S
ew
age
Slu
dge
in A
gric
ultu
re,
20
10)
Sub
stan
ce
Con
cent
ratio
n (m
g/kg
)
DF
(u
nitle
ss)
M in
gest
ed s
oil
(mg/
day)
F
(
unitl
ess)
B
W
(kg)
DE
D
TR
V
(for
non
-th
resh
old)
ER
PC
B
0.0
51
0.0
009
1
50
0.0
21
15
1.1
*10
*8
2
2.2
*10-8
75