Embed Size (px)
Citation preview

Enrique Caballero MD Endocrinologist/Clinical Investigator
Director of the Latino Diabetes Initiative Director, International Professional Education
Joslin Diabetes Center Harvard Medical School
Boston, MA
Health Inequities in the Latino/Hispanic
community

The Latino/Hispanic population is the largest minority group in the country ( 50.5 million – 16% of total population - 2010 census )
The prevalence of type 2 diabetes is at least twice as high as that in the White population
Diabetes care disparities – worse glycemic control, high rates of chronic complications
Social and cultural barriers Limited cultural awareness and skills among providers Significant limitations in clinical practice – time,
resources, support Limited comprehensive culturally oriented programs
that address patient, provider and health system issues
Challenges

Race Usually biological White, Black,
American Indian (Native American)/ Alaska Native (Eskimo, Aleut), Asian/Pacific Islander
Often overlapping
Ethnicity Primarily social Independent of
race Hispanic or
Latino?
Caballero AE. Diabetes in minority populations. In: Joslin’s Diabetes Mellitus. LW & W; 2005. 14th Ed. p 505-524.
Race and Ethnicity: Definitions

Mexicans 63%
Central Americans 7.9%
Puerto Ricans 9.2%
Cubans 3.5%
Others 6.8%
US Census Bureau 2010. The Hispanic Population in the United States. Available at: www.census.gov. Accessed Sept 13th, 2013
The US Hispanic/Latino Population
South Americans 7.9%
Dominicans 2.8% Spaniards 1.3%

*Unequal Treatment: Confronting Racial and Ethnic Disparities in Health Care. Institute of Medicine. The National Academies Press. Washington, D.C. 2004.

Insulin Resistance and Abdominal Obesity
Thrifty Genes + Lifestyle Beta and Alpha
Cell Dysfunction
Incretin dysfunction?
Type 2 Diabetes
Frequent Chronic Complications
Increased Mortality rates
Socio-economic and Cultural factors
Appetite and Satiety ?
Renal glucose handling ?
Caballero AE. Modified from Curr Diab and Endocrinology Reports 2007. 14:151-157
Genes, Environment and Social/Cultural Factors in Type 2 Diabetes in Racial/Ethnic Minorities

Disparate and Disproportionate prevalence of long-term complications of type 2 diabetes in minorities Vs NH Whites • lower leg amputations 2-4x • retinopathy and blindness 2-4x • stroke 2x
• ESRD 4-6x Caballero AE. Diabetes in minority populations. In: Joslin’s Diabetes Mellitus. LW & W; 2005. 14th Ed. p 505-524.
Type 2 Diabetes and its Complications in Minorities

NHANES 2003-2004 NHANES 2001-2002 NHANES 1999-2000
Ford E et al. Diabetes Care. 2008;31:102-104.
Patie
nts
(%)
0
25
50
75
Total White African American Mexican American
37.0
49.7 56.8
41.8
53.6
63.5
28.1
44.2 43.5
28.9
42.4
34.0
P=0.001 P=0.008
P=0.021 P=0.388
Metabolic control in the US Percentage of patients achieving an A1c<7%
N=1334

7.37.47.57.67.77.87.9
88.18.2
NH White NH Black Hispanics
NH WhiteNH BlackHispanics
Boltri JM, et al. Ethn Dis 2005; 15 (4): 562-7
%
A1c levels by ethnicity/race
NHANES 1999-2000

1.7
11.110.4
0
2
4
6
8
10
12
NH White NH Black Hispanics
NH WhiteNH BlackHispanics
Boltri JM, et al. Ethn Dis 2005; 15 (4): 562-7
%
Percentage of participants with diagnosed diabetes with an A1c ≥11% by ethnicity/race
NHANES 1999-2000

0
10
20
30
40
50
60
Men Women
Perc
ent
Total Non-Hispanic WhiteNon-Hispanic Black Hispanic
Narayan et al, JAMA, 2003
Estimated lifetime risk of developing diabetes for individuals born in the United States in 2000

Prevalence of major CVRF in Latinos
Daviglus ML, et al. JAMA 2012: 308(17):1775-84

Prevalence of major CVRF in Latinos
Daviglus ML, et al. JAMA 2012: 308(17):1775-84

Prevalence of major CVRF in Latinos
Daviglus ML, et al. JAMA 2012: 308(17):1775-84

Demographic and clinical characteristics between both groups, comparisons were Done with t test in case of continuous variables and x2 in case of dichotomous variables
Variable Controls (n=17)
At risk (n=21)
P value
Age 14.18+2.3 13.33+2.7 0.31 Waist/hip ratio 0.79+0.08 0.88+0.11 0.003 Total % fat 24+6 42+9 <0.0001 Trunk fat 19+5 42+9 <0.0001 Systolic BP 101.5+7 116.6+12 <0.0001 Diastolic BP 68.6+6 70.9+6 0.23 Total cholesterol 142.06
149.76 0.318
Triglycerides 58.82 108.29 0.004 HDL 42.00
37.52
0.162
LDL 89.24
93.50 0.484
Obesity and Endothelial Dysfunction in Hispanic Children

Caballero AE. Diabetes Care. 2008; 31:576-82
Obesity and Endothelial Dysfunction in Hispanic Children

Control Group Overweight Group
sVCAM ng
/mL
1,000 800 600 400 200 0
sICAM
ng/m
L
400 300 200 100
0
*
TNF-α
pg/m
L
4 3 2 1 0
* tPA
ng/m
L
10 8 6 4 2 0
* PAI-1
ng/m
L
100 80
60 40 20 0
*
hs-CRP
mg/
mL
8 6 4 2 0 -2
*
* *
White Blood Cell Count
Whi
te C
ells
(z
x10-
3) 12
10 8 6 4 2
*
Adiponectin
μg/
mL
20 15 10 5 0
*
0
IL-6
pg/m
L
4.5 3.5 2.5 1.5 0.5
Caballero AE. Diabetes Care. 2008; 31:576-82

A comprehensive strategy that involves clinical care, patient education, community outreach, research and provider education
The Latino Diabetes Initiative at Joslin
www.joslin.org/latino

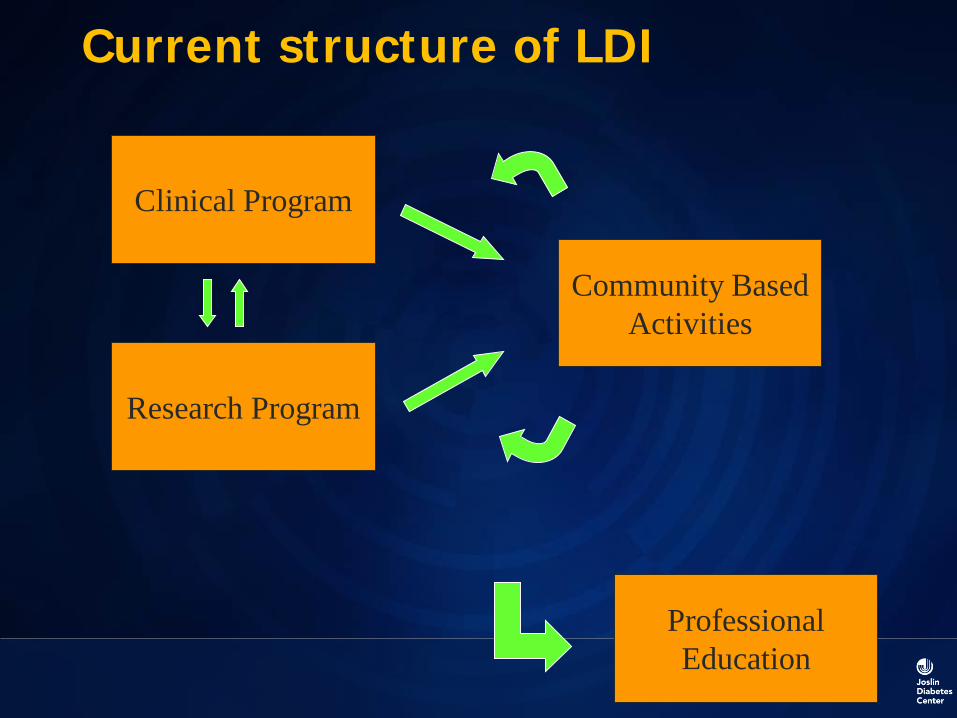
Current structure of LDI
Clinical Program
Research Program
Community Based Activities
Professional Education

Patient
Provider
System
Socio-economic status
Education/Health literacy
Health seeking behavior
Cultural factors
Mistrust
Lack of cultural awareness
Stereotyping or biases
Language barrier
Lack of resources
Lack of culturally oriented programs
Inadequate interpreter services
Time pressures and resource constraints
Lack of adequate training
Limited Access
What Causes Disparities in Healthcare?

Community and policy
System, group, culture
Family, friends, small
group
Individual
The health of individuals is inseparable from the health of communities (Healthy People 2010)
Ecological Model

Primary Factors That May Influence Diabetes Development and Care in Culturally Diverse Populations
Acculturation Body image Cultural competence Depression Educational level Fears General family integration and support Health literacy Individual and social interaction Judgment about disease
Caballero AE. Am J Med 2011; 124, S10-S15

Primary Factors That May Influence Diabetes Development and Care in Culturally Diverse Populations
Knowledge about the disease Language Myths Nutritional preferences Other forms of medicine (alternative) Physical activity preferences Quality of life Religion Socioeconomic status
Caballero AE. Am J Med 2011; 124, S10-S15

A true story: 64 y/o Hispanic woman Patient does not speak English Treated for Hypertension Received a prescription for : Lisinopril 10 mg. Once/d. Patient rushed to the ER due to severe hypotension
Language Barrier

Prevalent Racial/Ethnic Differences Related to Diabetes Medications
0 10 20 30 40 50 60 70 80
I worry about side effects from my medications
I worry about becoming dependent on my medications
I worry about the expense of my medications or glucose-monitoring supplies
If my doctor asked me to change my medication regimen, itwould make me worry more about my health
If my doctor told me that I would benefit from taking moremedications, I would be willing to take more P=0.0008
P<0.0001
P<0.0001
P<0.0001
P<0.0001
Huang ES et al. Diabetes Care. 2009;32:311-316.
Patients responding affirmatively (%)
}
} }
}
}
Latino (n=167)
African American (n=279)
Caucasian (n=230)

Education Level by Race/Ethnicity, 2010 18 and older only
0%
20%
40%
60%
80%
100%
White, NH Black, NH Hispanic Asian, NH
Less than high school College graduate
US Census 2010 Data

How common is Low Health Literacy?
30 million Americans (14%) scored below basic on health literacy • Grasp of no more than the simplest, most
concrete literacy skills 47 million (22% or 1 in 5) of the
population at basic health literacy • Basic is defined as skills needed to
perform simplest everyday literacy activities
White S. Assessing the Nation’s Health Literacy. Accessed at http://www.ama-assn.org/ama1/pub/upload/mm/367/hl_report_2008.pdf on August 28, 2009: p. 45.

Assessing Literacy: The “Newest Vital Sign” Validated tool
• Correlates with TOFHLA English and Spanish version Screening tool
• Score 0–1: High likelihood of limited literacy
• Score 2–3: Possible limited literacy • Score 4–6: Almost always adequate • http://www.pfizerhealthliteracy.com/physicians-
providers/newestvitalsign.aspx Weiss BD, Mays MZ, Martz W, et al. Ann Fam Med. 2005;(6):514-552.

Evaluation of health literacy can guide education efforts
0
10
20
30
40
50
Intervention Control
A1C < 7%
Rothman et al. JAMA. 2004;292(14):1711-6.

Provider Manual English
Patient Booklet Spanish
Rosa’s Story

Culturally Appropriate Translations

Practice Listening!
And observing! Patients are interrupted by the
healthcare provider after an average of 23 seconds
In only 28% of visits did patients completely express concerns
In 25% of visits, the healthcare provider never asked about patient’s concerns
Marvel MK et al. JAMA. 1999;281:283-287.

Goal setting
S - Specific M - Measurable A - Attainable R - Realistic T – Time

Current structure of LDI
Clinical Program
Research Program
Community Based Activities
Professional Education

Health Care Team 1.3
Work 80
Family 285
Person with diabetes 365
Time spent for a patient with diabetes

Esto es mejor: Improving food purchasing selection among low-income Spanish-speaking Latinos through social marketing messages
Other activities:
• Home Visits
• Supermarket tours
• Photovoice
• Rosa’s Story
Baseline Evaluation:
Analysis of the Grocery Receipt:
930 Calories per dollar
29 gr of Fat per dollar
150 gr of Carbs per dollar
5 gr of Fiber per dollar
21 gr of Protein per dollar
46500 cal – 50 USD
Salud America - RWJ Foundation Cortés D. et al. Am J Prev Med April 2013.

010002000300040005000600070008000
Total Fat - gr Total Carbs -gr
Fiber - gr Protein - gr
1st supermarket 2nd supermarket
Calories per receipt
0
10000
20000
30000
40000
50000
60000
70000
1st supermarket 2nd supermarket
Each dollar bought: 1st Supermarket 2nd Supermarket
1320 Calories 583 Calories
84 grams of fat 28 grams of fat
135 grams of carbs 56 grams of carbs
10 grams of fiber 4 grams of fiber
9 grams of protein 18 grams of protein
Esto es mejor: Improving Food Purchasing Selection Among Low-income Spanish-speaking Latinos

Before After
Esto es mejor: Improving Food Purchasing Selection Among Low-income Spanish-speaking Latinos - RWJ Project

Patient Care and Education

Health Care Professionals Education
Joslin CME programs Community Health Centers Medical Students Visitors Program National and International Meetings Publications Health Coach training program

The knowledge and interpersonal skills that allow providers to understand, appreciate, and work with individuals from cultures other than their own. It involves an awareness and acceptance of cultural differences; self-awareness; knowledge of patient’s culture; and adaptation of skills.
American Medical Association
What is Cultural Competence?
Purnell’s Model:
Person, Family, Community, Society
•Unconsciously incompetent
•Consciously incompetent
•Consciously competent
•Unconsciously competent
Cultural Competence

The ESFT Model
Explanatory Model
Social Risk for Noncompliance
Fears/Concerns about the Medication
Therapeutic Contracting/Playback

Elicit
Factors
Negotiate
Models
Awareness of Cultural and Social
Factors
Implement Management
Strategies
Model for Cross-Cultural Care: A Patient-Based Approach
Tools and skills necessary to provide quality care to any patient we see, regardless of race, ethnicity, culture, class or language proficiency.

Resources – Cultural Awareness
http://medweb.med.harvard.edu
www.diversity.org
www.healthcarecommunities.org
www.nimhd.nih.gov
www.hispanichealth.org

Resources – Latinos with Diabetes
diabetes.org
www.joslin.org/latino
www.cdc.gov/minorityhealth
ndep.nih.gov
diabetes.niddk.nih.gov

THANK YOU