Embed Size (px)
Citation preview

0
Health effects of commercially- available complementary foods: a systematic review
Emma Tzioumis MPH, Melissa Kay MS, MPH, RD, Melecia Wright, Linda Adair, PhD Department of Nutrition
Gillings School of Global Public Health University of North Carolina at Chapel Hill

1
Table of Contents Conflict of interest statement ...................................................................................................................... 1
Abstract ........................................................................................................................................................ 2
List of abbreviations ..................................................................................................................................... 3
Part 1 – Breastfeeding replacement ............................................................................................................ 4
1.1 Background ......................................................................................................................................... 4
1.2 Objective ............................................................................................................................................. 2
1.3 Methods .............................................................................................................................................. 2
1.4 Results ................................................................................................................................................. 6
1.5 Conclusion ........................................................................................................................................... 9
Part 2 – Obesity and chronic disease risk .................................................................................................. 20
2.1 Background ....................................................................................................................................... 20
2.2 Objective ........................................................................................................................................... 20
2.3 Methods ............................................................................................................................................ 20
2.4 Results ............................................................................................................................................... 22
2.5 Conclusion ......................................................................................................................................... 27
Part 3 – Nutritional quality ........................................................................................................................ 28
3.1 Background ....................................................................................................................................... 28
3.2 Objective ........................................................................................................................................... 28
3.3 Methods ............................................................................................................................................ 28
3.4 Results ............................................................................................................................................... 30
3.5 Conclusion ......................................................................................................................................... 44
Part 4 – Portion size ................................................................................................................................... 45
4.1 Background ....................................................................................................................................... 45
4.2 Objective ........................................................................................................................................... 45
4.3 Methods ............................................................................................................................................ 45
4.4 Results ............................................................................................................................................... 46
4.5 Conclusion ......................................................................................................................................... 47
Part 5 – Stunting, anemia, micronutrient deficiency risk ......................................................................... 48
5.1 Background ....................................................................................................................................... 48
5.2 Objective ........................................................................................................................................... 48
5.3 Methods ............................................................................................................................................ 48
5.4 Results ............................................................................................................................................... 50
5.5 Conclusion ......................................................................................................................................... 54
Appendices ................................................................................................................................................. 55

2
Appendix 1.1 Search terms for PubMed for question 1 ......................................................................... 55
Appendix 1.2 Table of full texts reviewed and excluded for question 1 ................................................ 57
Appendix 2.1 Search terms for PubMed for question 2 ......................................................................... 61
Appendix 2.2 Table of full texts reviewed and excluded for question 2 ................................................ 62
Appendix 3.1 Search terms for PubMed for question 3 ......................................................................... 63
Appendix 3.2 Table of full texts reviewed and excluded for question 3 ................................................ 64
Appendix 4.1 Search terms for PubMed for question 4 ......................................................................... 66
Appendix 4.2 Table of full texts reviewed and excluded for question 4 ................................................ 67
Appendix 5.1 Search terms for PubMed for question 5 ......................................................................... 68
Appendix 5.2 Table of full texts reviewed and excluded for question 5 ................................................ 69
References .................................................................................................................................................. 72

1
Conflict of interest statement The authors are faculty (LA) or PhD students (ET, MK, MW) in the Department of Nutrition at the Gillings School of Global Public Health. In 2012-14, the Department of Nutrition received an educational grant from Pfizer Nutrition, which supported graduate student stipends for students with a research focus on pediatric nutrition (including the co-authors of this report), and an educational seminar series. In this time frame, Pfizer’s nutrition division was acquired by Nestlé who continued support of the educational program. Under provisions of the agreement with the company, students were free to select and pursue research topics of their choice, and to publish their work without any influence of the company. Funding ended in August 2014, prior to the commissioning of this review.

2
Abstract With the broad goal of informing WHO’s consideration of inappropriate promotion of foods for infants and young children, this systematic review aimed to locate and synthesize results of scientific literature on the health effects of commercially-available complementary foods (CACF) for infants and young children under 2 years of age. The review addresses 5 specific research questions:
Q1. To what degree do commercially-available products replace, rather than complement, the intake
of breast milk in children 6-23 months of age? Q2. To what degree do commercially-available products consumed by children 6-23 months of age
increase the risk of childhood obesity or chronic disease risk factors? Q3. Are commercially-available products nutritionally inferior or superior to home-prepared and/or
local foods? Do they contain higher or lower amounts of trans fat, saturated fat, free sugars, or salt? Do they contain higher or lower amounts of essential micronutrients? Do commercially-available products provide nutrients that are generally lacking in the diets of young children?
Q4. Are the portion sizes of commercially-available products greater than would be appropriate based on age?
Q5. Do commercially-available products reduce the risk of stunting, anemia, or micronutrient deficiencies?
We searched the following data bases: PubMed, CINAHL plus, EMBASE, Agricola, CAS (Clinicaltrials.gov), Cochrane, Global Health, WHO Global Library, Business Source Premier, AgEcon, Mintel Oxygen, as well as relevant conference proceedings, and sources of grey literature and reviewed reference lists from highly relevant reviews and articles. Titles and abstracts were extracted and reviewed for relevance. Inter-rater reliability was assessed using Kappa statistics. Outcomes included breastfeeding duration or frequency or breast milk intake for Q1; anthropometric indicators of weight status or biomarkers of chronic disease risk for Q2; nutritional composition of foods or infant intake of nutrients for Q3; portion sizes of complementary foods (CFs) for Q4, and stunting, anemia, and micronutrient deficiencies for Q5. The Population-Intervention-Comparison-Outcome (PICO) for each question was narrowly defined to compare CACFs to home-prepared or locally-available CFs. CACFs were defined as commercial products developed and marketed for infant consumption, or products developed for studies to closely mimic CACFs. We also included investigator-prepared local foods that mimicked home-prepared foods. For feeding trials, these were necessary to allow for blinding, quality control and safety. We found very few studies that met the PICO criteria, most often because they did not report on direct comparisons of CACFs with similar home-prepared foods. For all of the research questions, the evidence was judged to be of low or very low quality. For Q1, we found limited evidence that CACFs did not displace breast milk intake, but their consumption was associated with shorter duration of breastfeeding. For Q2, limited evidence suggests that high protein intake and intake of milk-cereal drinks are associated with higher child BMI. For Q3, results were highly heterogeneous given the wide variety of CACFs and home-prepared foods that were assessed: some CACFs were nutritionally superior to home-prepared or local foods, while the converse was true for others. We found no studies that addressed Q4. For Q5, we found no evidence that CACFs improved infant nutritional status.
More evidence is needed to identify the benefits and potential harms of CACFs. Additional evidence might be brought to bear on the research questions by comparing CACFs and home-prepared foods to reference data rather than to each other.

3
List of abbreviations AHRQ Agency for Health Care Research and Quality BF Breastfed, breastfeeding CACF Commercially-available complementary food CF Complementary food GRADE Grading of Recommendations Assessment, Development and Evaluation LMIC Low and middle income countries RCT Randomized controlled trial LNS Lipid Nutrition Supplement

4
PART 1. RESEARCH QUESTION 1 To what degree do commercially-available products replace, rather than complement, the intake of breast milk in children 6-23 months of age? 1.1 Background Owing to the high quality of nutrients and other beneficial aspects of breastfeeding, it is desirable, starting at 6 months, to add high nutritional quality foods to the infant’s diet without displacing breast milk intake. Infants have the ability to self-regulate their intake to maintain energy balance. 1 Thus, concern has been raised that in response to feeding of complementary foods (CF) --- particularly those high in energy density --- infants will consume less breast milk. If the foods displacing breast milk are of lower nutritional quality than breast milk, the infant’s nutritional status may suffer. Evidence on whether breast milk is displaced by CFs should ideally come from experimental studies with accurate and precise quantification of breast milk intake before and after feeding of CFs. Since CFs are recommended for infants 6 months and older,2 it would not be ethical to assign infants to a no-CF food (exclusively breast-fed) comparison group. Thus, relevant studies allowing causal inference are those that examine how different amounts, forms, and composition of CFs provided as part of an experimental protocol influence breast milk intake. No-supplement control groups would be consuming their usual diet, which would need to be carefully quantified. A relatively small number of studies have used this ideal design. The “gold standard” method of quantifying breast milk intake is estimation using deuterium dose to the mother. 3,4 Less accurate methods include test weighing of infants before and after breastfeeding,5 estimation from mother’s report of feeding frequency and duration, and estimation based on usual intakes of infants of given size, age, and growth rate. Respondent burden for test weighing is high, and estimated intakes require researchers to make assumptions that may not be valid for individual infants. In particular, breast milk intake modeled as the difference of estimated total intake and quantitated intake from CFs would not allow investigators to examine how breast milk intake is influenced by CF. Other insights can be obtained by comparing duration of breastfeeding or age-specific prevalence of breastfeeding associated with different amount, type, or composition of CFs. However, no causal inferences can be derived from these types of studies. Such studies would have high potential for endogeneity bias, since mothers make simultaneous decisions about breastfeeding and choice of complementary foods. 1.2 Objective The objective for Q1 is to review evidence on the degree to which commercially-available products replace, rather than complement, the intake of breast milk in children 6-23 months of age. 1.3 Methods 1.3.1 Criteria for considering studies. We did not restrict our search by study design: randomized-controlled trials (RCTs) and observational studies were included. For inclusion, studies had to present evidence on infants and young children,

5
ages 6-23 months, who were still breastfed. The main exposure was consumption of commercially-available complementary food products (CACFs) compared to home-prepared or local CF products. We included studies with a quantifiable aspect of breastfeeding as an outcome variable, including quantification of infant milk intake by one of the methods described in the background, or mother’s reports of duration and/or frequency of breastfeeding. 1.3.2 Search method strategies for identification of studies 1.3.2.1 Electronic searches The following electronic databases were searched to identify relevant studies:
PubMed (2000 – 30 Mar 2015)
CINAHL plus (2000 – 31 Mar 2015)
EMBASE (2000 – 30 Mar 2015)
Agricola (2000 – 31 Mar 2015)
CAS (2000 – 31 Mar 2015)
Clinicaltrials.gov (2000 – 31 Mar 2015)
Cochrane (2000 – 31 Mar 2015)
Global Health (2000 – 31 Mar 2015)
WHO Global Library (2000 – 2 Apr 2015)
Business Source Premier (2000 – 6 Apr 2015) 1.3.2.2 Searching other resources We searched other economics databases (AgEcon, Mintel Oxygen), relevant conference proceedings (Association for Consumer Research, International Health Economics Association), and sources of grey literature (New York Academy of Medicine's Grey Literature Report, Open Grey, PH Partners). We also reviewed reference lists from highly relevant reviews and articles. 1.3.2.3 Search strategy The search strategy was created using a combination of subject headings and free-text keywords to identify publications (see Appendix 1.1). We did not restrict by language or study design. We restricted to studies published after 2000, to ensure that the CACFs analyzed would provide relevant and contemporary evidence. References were extracted and imported into EndNote. Duplicate articles were identified and removed. All articles were assigned a unique record number. 1.3.3 Data collection and analysis 1.3.3.1 Selection of studies Two reviewers independently screened titles and abstracts from electronic databases to identify potentially eligible studies. Prior to starting the work, inter-rater agreement was assessed by screening a subset of titles and abstracts and calculating Cohen's Kappa. Discrepancies were resolved by discussion with a third reviewer. One reviewer screened titles and summaries from the other resources. Full-text articles were obtained, and were independently reviewed by two reviewers according to the inclusion

6
criteria. Discrepancies were resolved with discussion. When the full-text was not available in English it was excluded. 1.3.3.2 Data extraction Excel workbooks created for systematic review data management were utilized for abstract screening and full-text reviews. 6 Record numbers, titles, and abstracts were exported from EndNote into the Excel workbook, and all title and abstract screening and full-text review took place within Excel. Comments on reasons for full-text exclusions were noted in a separate file. Each reviewer had her own Excel workbook, to keep the review process blinded. Two reviewers extracted data into standardized tables. Information was extracted on: general study characteristics (design, location/setting, recruitment strategy), participant characteristics (sample size, age, inclusion/exclusion criteria), description of the commercially-available complementary food and comparison foods, outcome, and results. Two separate risk of bias assessment tables were created (for RCTs vs. observational studies). 1.3.3.3 Assessment of risk bias and quality in included studies Articles included in the review were assessed for quality using AHRQ tools for observational studies, 7,8 and the Cochrane tools for Interventions. 9 The studies included in the final review were highly heterogeneous in design, CFs, and settings, and were not amenable to a meta-analysis of results. Overall quality of the evidence from the final studies was assessed using GRADE evidence profiles. 10 1.4 Results 1.4.1 Literature search We identified 3038 abstracts for initial screening, from which 88 were referred for full-text review. Of these, 8 were included in the final review. Figure 1.1 shows the flowchart of the screening and eligibility evaluation phases. Main reasons for exclusion were that the study did not include CACFs, breastfeeding was not a quantifiable outcome of the study, the comparison group was not infants consuming home-prepared CFs, and the full-text was not available in English (see Appendix 1.2 for a full description of full-texts that were reviewed and excluded from the final set).

7
3038 records identified from all sources
274 duplicates excluded
2765 titles & abstracts reviewed
88 full-text records to be reviewed
2 items not available for review
86 full-text records reviewed
78 3 9 24 10 9 7 12 4
Full-text articles excluded: Incorrect population age Did not include CACFs BF outcome not
quantifiable Incomplete data Irrelevant Not in English Duplicate Published before 2000
8 publications included
Figure 1.1 Flowchart of review process
1.4.2 Characteristics of included studies Of the eight papers included in the review, four were RCTs that assigned alternate CFs to infants and compared their breast milk intake. All were done in LMIC (1 in India, 1 in the Democratic Republic of the Congo (DRC), and 2 in Malawi). Of the four, three used deuterium dose to the mother to quantify breast milk intake, while the fourth relied on mother’s reports of breastfeeding frequency and duration of each feeding episode. Three observational studies, one each in Italy, Germany and Guatemala, related breastfeeding to CFs. An additional paper was a secondary analysis of data from a RCT designed for obesity prevention in Australia. The studies differ markedly in the CFs given to infants and in their comparison groups, as well as methods of quantifying CF intakes. Qualitative summaries of the studies are therefore presented. Detailed descriptions of each included study and their results are included in table 1.1 (RCTs) and table 1.2 (observational studies). Owing to the vast differences in the design and quality of RCTs and observational studies, they are separately evaluated. 1.4.3 Substantive findings from RCTs (Table 1.1) Bhandari et al. 11 provided a milk-cereal supplement produced by a local dairy to Indian infants from 4 to 12 months in a 4-arm study whose primary outcome was infant growth. Investigators also compared the

8
proportion breastfed, and mean breastfeeding frequency in the CF supplement group to that of infants in a nutrition counseling group, a visitation only, and a control group. The proportion of infants breastfed was significantly lower in the CF supplement compared to the visitation only group at 38 (-5%) and 52 weeks (-12.8%). Mean breastfeeding frequency was also lower in the food supplement group compared to the visitation group at 26 (-1.7 feedings/d) and 38 weeks (-1.2 feedings per day). The other RCTs aimed to determine whether infant CFs displace breast milk. Three studies quantified breast milk intake by deuterium dose to the mother after varying periods of feeding CFs in different amounts or energy density. These studies were carried out in the context of high rates of infant stunting in Malawi and the DRC, and were aimed at determining how to optimize infant nutrition with CFs without displacing breast milk. Two studies in Malawi 12,13 used lipid-based fortified spreads given in different daily doses to either a no-supplement group,12 or to a corn-soy blend porridge. 13 The study by Galpin et al. 13 used a product produced by a local NGO, which while not commercially sold, is directly comparable to a commercial product, and was therefore included in our analysis. The third study, done in the DRC 14 compared a ready-to-use mix of locally available foods to UNIMIX porridge. None of these studies found intergroup differences in mean breast milk intake. Only 1 study assessed change in breast milk intake in response to one month of feeding of the alternate CFs, and found that breast milk intake per kg infant body weight declined after 1 month of CF supplementation, but there was no difference between the fortified spread and corn-soy blend CF groups in the amount of change. 13 1.4.3.1 Quality of included studies: RCTs Only one study used the optimal design of comparing change in breast milk intake in individual children randomized to alternate CFs. 13 Two studies compared breast milk intake several months after randomization to alternate CFs, and were therefore unable to confirm that there were no initial intergroup differences in breast milk intake at the time of randomization. 12,14 1.4.3.2 Quality of outcomes: RCTs (GRADE) Overall, there is low quality evidence that CACFs do not displace breast milk. Risk of bias. Owing to differences in the nature, amount, or physical characteristics of the CFs used in the RCTs, masking of treatment is not possible for participants and study personnel who deliver the supplements and this lack of blinding is a potential source of bias. Sequence generation was not judged to pose risk of bias. Sufficient information to judge bias associated with allocation concealment was not available for 3 of the 4 studies. There was no significant differential attrition across study groups in any of the RCTs nor was there evidence of selective outcome reporting. Inconsistency. Heterogeneity in effects was not directly assessed across the studies, owing to substantial differences in recruitment strategies, participant populations, sample size, and CFs tested. The interventions varied in duration and in composition and dose of CFs. The outcome measures were similar in 3 of the 4 studies. However, the studies that used objective measures of breast milk intake were consistent in showing no clear evidence of displacement of breast milk by CFs. Indirectness. The RCTs directly assessed the outcome of interest. It was not clear whether all of the CFs tested were commercially available, but we included them because of their direct comparability with CACFs. All of the trials were in LMIC where prevalence rates of child stunting and/or micronutrient
9
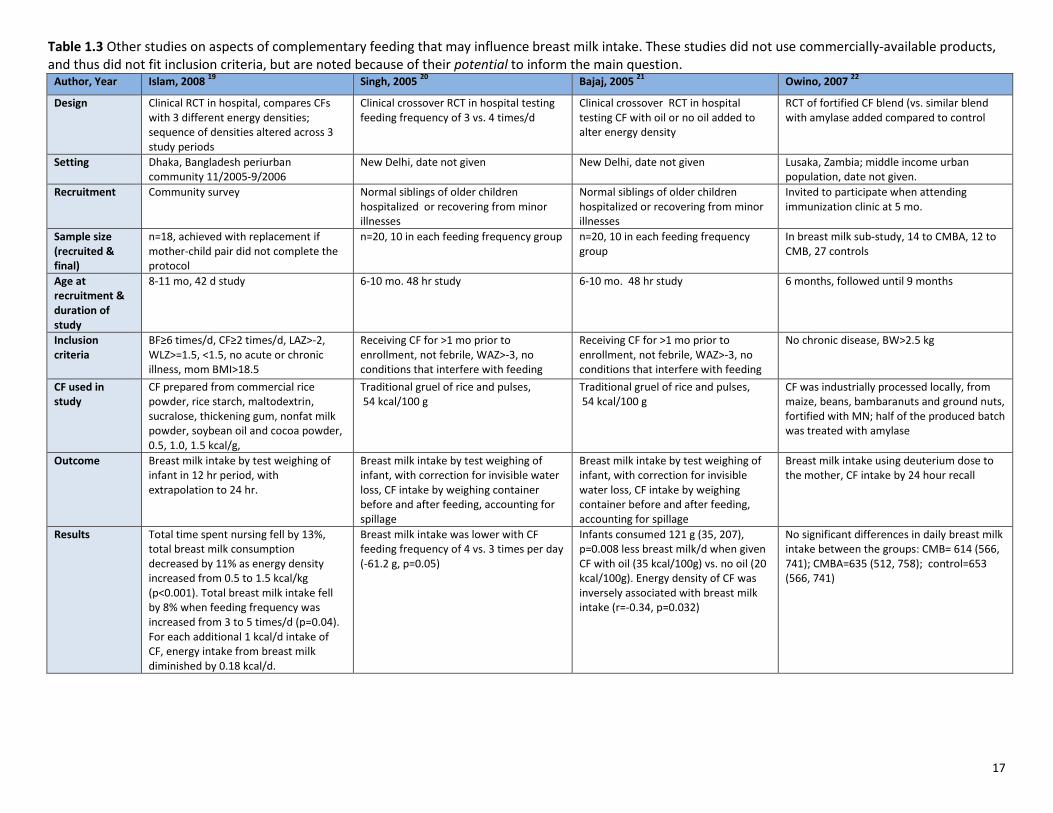
deficiencies were high. Studies excluded severely malnourished children, but the results from these trials may not be generalizable to high income settings. Imprecision. All studies had wide, overlapping confidence intervals when comparing alternate CFs. Sample size is small (<60) for 2 of the 4 studies. Publication bias. It was not possible to formally assess publication bias. 1.4.4 Substantive findings from observational studies (Table 1.2) The observational studies come from three high income countries (Italy, Germany, and Australia), and one LMIC (Guatemala). In all of these studies, data on breastfeeding and CF were collected at the same point in time, so no causal inferences can be drawn, but they may be useful to provide insights into how breastfeeding relates to intake of CACFs. In most cases, CACFs were consumed as part of mixed diets, and the studies varied in the extent to which it is possible to isolate differences in breastfeeding that are associated with CACFs versus other foods. Pani et al. 15 in their study of Italian infants, found that at 6 months, total average daily energy intake was higher in infants who were not breastfed, owing to their higher intake of CFs, particularly CACFs which represented their main source of carbohydrates. Foterek 16 quantified breast milk intake of German infants in the DONALD study by weighing infants before and after feeding, and quantified CFs using 3-day records of weighed foods. Infants with high CACF consumption were fully breastfed for about 5 weeks less than those with lower CACF consumption, and also had significantly shorter duration (10 weeks) of any breastfeeding. Bell 17 analyzed data collected at 14 and 24 months, in participants in multisite RCTs of obesity prevention in Australia. They quantified breast milk intake by time sucking, assuming that the infant consumed 10 g per minute. In this study, longer breastfeeding duration was associated with a dietary pattern characterized by lower intake of CACFs. In Hernandez’s Guatemala study 18, breast milk intake was estimated as the difference between the infant’s estimated total energy requirement (based on age and weight) and intake from CFs. This method precludes drawing any conclusions about how CFs and breast milk intake are related. 1.4.4.1 Quality of included studies: observational studies Owing to high risk of strong bias related to the simultaneous measurement of breastfeeding and CF, inaccurate and potentially biased estimates of breastfeeding outcomes based on maternal self-report, and inability to clearly differentiate CACFs from other CFs, the evidence from these studies is judged to be of very low quality. However, the observational studies suggest higher energy intake among infants consuming CACFs. Considering the RCTs and observational studies together, there is low quality evidence for no displacement of breastfeeding by CACFs, but consumption of CACFs may be associated with higher total energy intake. 1.4.5 Other studies of potential relevance We identified other RCTs that directly assess whether CFs influence breast milk intake, but these studies did not assess a specific CACF (table 1.3). We include the presentation and discussion of these studies because of their potential to inform Q1. For example, one might be able to make inferences that CACFs

10
with characteristics similar to the tested CFs would have similar effects on breast milk intake. In addition, these studies are cited in several of the included studies. Islam et al. 19 compared breast milk intake (by test weighing of infants) in groups of Bangladeshi infants randomized to CFs of 3 different energy densities fed either 3, 4 or 5 times per day. Each infant went through a sequence of different treatment assignments, allowing comparison of intra- and inter-individual differences in response to CF. Total time spent nursing fell by 13%, and total breast milk consumption decreased by 11% when energy density of CF was increased from 0.5 to 1.5 kcal/kg, p<0.001. Total breast milk intake fell by 8% when feeding frequency was increased from 3-5 times/d (p=0.04). For each additional kcal/d intake of CF, energy intake from breast milk diminished by 0.18 kcal/d.
Similarly, in a study of New Delhi infants, Singh and colleagues 20 found that breast milk intake (measured by test weighing) was lower when infants were fed CFs more frequently: 4 vs 3 times per day was associated with -61.2 g (p=0.05). A limitation of this study was the short duration of exposure to each feeding frequency, which may have allowed insufficient time for the infant to respond. In this same setting, the research team also found that breast milk intake was reduced by 121 g/d when consuming a high (35 kcal/100g) vs. low (20 kcal/100 g) energy density porridge. 21 They concluded that adding higher energy density CF to the infant diet does not translate into increased total intake because of breast milk displacement. Finally, Owino 22 randomized 9 month old Zambian infants to receive a CF prepared from local products, with the only difference being inclusion of alpha amylase in one of the mixes. These 2 CF groups were compared to controls. Breast milk intake, measured by deuterium dose to the mother, was not different across the groups. Three of these studies thus provide some evidence that breast milk intake is sensitive to energy density of the CF’s fed, and to feeding frequency, and suggest displacement of breast milk by CFs depending on CF characteristics and how often CFs are fed.

11
Table 1.1 Study Characteristics of Q1 Randomized Controlled Trials
Author, Year Owino, 2011 14
Kumwenda, 2014 12
Galpin, 2007 13
Bhandari, 2001 11
Design RCT subgroup analysis from cluster RCT efficacy trial of RUCF from local ingredients vs. CSB: assessed differences in breast milk intake after about 3 months of receiving CF supplement
RCT sub-study of iLiNS DOSE trial: assessed differences in breast milk intake after about 3 months of receiving CF supplement
RCT, prospective, parallel group trial of 3 complementary feeding regimens: assessed breast milk intake before and 1 month after beginning of CF supplement
RCT. Stratified by infant weight-for-height (80% of NCHS median), then assigned to 1 of 4 groups followed over time: Food supplement (FS), nutrition counseling, no intervention, and visitation (for assessment of morbidity).
Location/year/setting Lwiro Pediatric Hospital, South Kivu, Democratic Republic of Congo, October 2009-November 2010
Mangochi, Malawi. 12 month intervention. March 2010-Nov 2011
Lungwena, Malawi. Study dates not given
Urban slums of Delhi, India. Dates of study not given.
Recruitment strategy Ensured equal number of males and females; systematic sample of large cluster randomized trial assessing the efficacy of RUCF compared with “UNIMIX"
Participants identified by community surveys
All children in 11 villages invited to participate
Community survey identified all pregnant women and infants < 4 months, participants enrolled when infant reached 4 months
Sample size (n) (recruited vs. final)
Of the 1400 infants in the larger RCT, 420 were in the RUCF and 330 in the UNIMIX arm. 58 infants were included in the smaller breast milk intake sub-study.
n=359 as final sample in 4 groups (control=79, 10g=75, 20g=98, 40g=107); study powered for 10% difference in total breast milk intake (55-60 Kcal)
Planned enrollment was 15/group for 3 groups. Enrolled 44, 41 completed.
418 enrolled at 4 months, 368 (88%) had complete data at 12 months
Age (age at recruitment and duration of study)
8.5 - 10.5 months. Duration: 14 days Assessed at 9-10 months in study where CF supplement is given from 6 to 18 months
Enrolled at 5.5-6.5 months, study duration = 1 month
4 months at enrollment, followed until 12 months
Inclusion/exclusion criteria
Larger RCT: Inclusion: gestational age of 37+ weeks, birth weight 2500g+ informed consent. Exclusion: bottle-fed children, malformations and neurological impairment. Smaller, nested study: Inclusion: informed consent to participate in the breast milk study, drink the deuterium oxide, allow saliva sampling of mother and infant and allow anthropometric measure of mother. Exclusion: Infant illness at the beginning of the study.
At recruitment (5.5-6.49 mo), mom is breastfeeding only 1 child, excluded if severe illness or anemia in mother or infant, or participating in any other trial
Excluded HAZ<-2, edema, severe illness, peanut allergy, multi-births, participants in other trials
Congenital malformations, those unlikely to remain in study area

12
Table 1.1 Study Characteristics of Q1 Randomized Controlled Trials, con’t
Author, Year Owino, 2011 (14) Kumwenda, 2014 (12) Galpin, 2007 (13) Bhandari, 2001 (11)
Commercial food studied/comparison group (how CF intake was measured)
RUCF=cooked maize, soybeans, sorghum, milk powder, veg. oil, sugar, 3% micronutrient powder that met RDAs for 6-12 mo-old infants, energy density of 5.5 kcal/g. Recommended intake: 50g/day in 2 meals- no mixing with other foods/water. UNIMIX= maize, soybean, vitamin-mineral pre-mix. Required cooking with 3 spoonsful of flour (35g) to achieve desired consistency. 280 kcal of this UNIMIX porridge (1.1 kcal/ml) was recommended per day.
Milk or non-milk based LNS in 3 doses (10, 20, and 40 g/d) compared to no LNS, control group.
FS (LNS) Nutriset5.3 kcal/g vs. CSB with 1.1 kcal/g, compares 25 vs 50 g FS vs. CSB. NOTE FS is made by an NGO, not commercially available
Milk-cereal supplement produced by a local dairy; produced in foil packets; quantified by twice weekly maternal report of proportion of packet(s) given. Not entirely clear if the milk cereal supplement is commercially available
Outcome (how it was measured)
Breast milk intake measured by deuterium dose to the mother
Breast milk intake measured by deuterium dose to the mother
Breast milk intake measured by deuterium dose to the mother
Main study outcome was infant weight and length. Mothers report= source of information for energy intake from non-breast milk sources, prevalence of BF, and BF frequency.
Results Mean breast milk intake was not different between RUCF (705±236 g/d) vs. UNIMIX (678±285 g/d), p=0.69; nor was there a difference when expressed per kg infant body weight.
Mean intake of breast milk compared to the control: 10g dose =+62 (-18,143); 20 g dose +30 (-40,99); 40 g dose +2(-68, 72). Differences not significant (wide CIs). CF did not reduce breast milk intake in any group at "non-inferiority margin" of -86 g/d pre-established by study design.
No intergroup differences in mean breast milk intake. Expressed as g/kg/day, infants consumed 7-13% less breast milk after 1 month of CF, but there were no intergroup differences. Infants in the 25 g supplement group had lower weight gain.
Proportion of infants breastfed significantly lower [-12.8% (-4, -21)] in the FS group compared to visitation group at 52 weeks; [-5% (-12.3,-0.4) at 38 weeks]. Mean BF frequency was lower compared to visitation group at 26 weeks [-1.7 (-2.7,-0.70)] and 38 weeks [-1.2 (-2.34, -0.06)]

13
Table 1.1, con’t Risk of bias assessment
Author, Year Owino, 2011 (14) Kumwenda, 2014 (12) Galpin, 2007 (13) Bhandari, 2001 (11)
Sequence generation LOW RISK. Random-number generator to assign infants to study groups
LOW RISK: allocation prior to study LOW RISK: 3 envelopes with study group prepared
UNCLEAR RISK: not indicated
Allocation concealment
LOW RISK. Done by computer, data entry clerk blinded to study group. Suitable for larger study: staff presented study assignment to mothers in sealed envelopes.
UNCLEAR RISK: initial randomization to sub-study was done at enrollment, but owing to attrition and need for adequate sub-study sample, more participants were added from the main trial.
UNCLEAR RISK: not indicated: mother chooses 1 of 3 envelopes with group assignment info, not clear which study staff knew group assignment
UNCLEAR RISK: not indicated
Blinding HIGH RISK: Statisticians and data entry clerks were blinded to the identity of study foods, field staff and mothers are not blinded. CFs are different, blinding not possible
HIGH RISK: foods delivered in different packaging depending on assigned dose
HIGH RISK: investigator blinded, participant not blinded (different foods)
HIGH RISK: NOT blinded (CF vs. no CF groups, blinding not possible)
Attrition/incomplete outcome
LOW RISK: No attrition (cross sectional) LOW RISK: balanced by study group LOW RISK: lost 3/44 participants MODERATE RISK: completion rates at 52 weeks: 87% in FS, 97% in counselling, 93% in no intervention and 91% in visitation groups.
Selective outcome reporting
LOW RISK: LOW RISK: LOW RISK: LOW RISK:
Other sources of bias Intent-to-treat analysis used, non-compliance may have affected results. Since preparations are different for each treatment, mothers not blind to treatment - compliance may have varied between groups. Results may be different in infants receiving no study foods, but the study did not include a no-treatment control arm. Systematic selection from larger RCT, sample includes those coming to clinic
Authors note that mothers may have over-reported consumption of FS
OVERALL QUALITY ASSESSMENT
Low Low Low Low

14
Table 1.2 Study Characteristics Q1 Observational Studies Author, Year Pani, 2014
15 Hernandez, 2011
18 Foterek, 2014
16 Bell, 2013
17
Design Observational, longitudinal Observational, cross sectional study
Observational, open-cohort, longitudinal Secondary analysis of longitudinal data from RCT of obesity prevention
Location/year/setting 2007-2008, Institute of Maternal Health in Trieste, Italy
Guatemala city infants attending a health center serving low income population, August 2008
Dortmund Germany, open cohort began in 1985
Australia, multisite (Brisbane, Adelaide) NOURISH study (3/2008-4/2009, SAIDI study 9/2008-3/2009
Recruitment strategy Those born in the Trieste maternal hospital between July 2007 and July 2008
Mothers approached when attending clinic for well-child care, illnesses, vaccinations
Open cohort. Personal contacts, maternity wards and pediatric practices were used as avenues for recruitment
Mothers recruited for the parent studies at birth. For the current study, NOURISH controls and SAIDI dyads were selected
Sample size (n) (recruited vs. final)
400 infants enrolled at birth, 268 had complete data at 6 month follow up.
97 initially included, 64 completed. Most excluded owing to missing 3 days of intake data, unbalanced M/F
Used data from 366 infants 552 (14 months), 493 (24 months)
Age (age at recruitment and duration of study)
Birth, 6 month duration, data from 6 months used for current study
6-12 months, median=8 mo. Recruited at age 3 months, followed until young adulthood. Current study uses data from 6-24 months.
Data from, 14 and 24 months analyzed as cross sectional data.
Inclusion/exclusion criteria Eligible: 2000g+, gestational age 36 weeks+, no severe diseases or congenital malformation, mother resident in Trieste
Must be breastfed and receiving CF, no congenital anomalies
[From the background paper] Inclusion: no prevalent diseases affecting growth and/or diet, German, age 3-6 months, with a willing mother/father who consents to this long-term study, and a German-speaking parent
Full term, > 2500 g included
Commercial food studied/comparison group (how CF intake was measured)
3 non-consecutive feeding diaries gave type, quantity and method of feeding in the previous 24 hour period. Food labels provided nutrient intake from commercial products. Mothers gave frequency and ~duration of BF.
Intake of full range of CFs assessed, intakes include CACFs such as Incaparina®
3-day weighed dietary records. Reported brand and type of food, recipes, information from food labels.
This was an analysis of dietary patterns using PCA. One pattern was characterized by low intake of commercially-available infant foods
Outcome (how it was measured)
Analyzed in breastfed/non-breastfed strata. Estimated volumes of 60, 80 and 100ml for short, normal or long duration of breastfeeding.
Breast milk intake MODELED: Energy intake from breast milk assumed to be estimated requirement - measured intake from CFs. Note that this method precludes assessment of how CFs may influence breastfeeding.
Scale for weighing breastfed babies before and after breastfeeding.
Breast milk intake was quantified as time sucking, assuming 10 g/min, up to 10 minutes. BF duration reported by the mother. Dietary pattern is the outcome: thus not appropriate for this question
Results NBF infants had more milk energy intake from formula than estimated breastmilk intake in the breastfed category (median 363 Kcal, IQR 274–469 vs. 301 Kcal, IQR 243–393). Mean differences not significant. NBF infants had more macronutrients from commercial baby foods than BF infants (183kcal vs. 87kcal).
Can use data for this analysis since calculated breast milk intakes cannot be related to CF intake. Results presented in paper focus on extent to which intakes meet recommendations
Infants with high (>62%) CACF consumption also had significantly lower duration of full breastfeeding (19.4 vs. 13.6 wk), lower duration of total breastfeeding (41.9 vs. 31.8 wk), and lower age at introduction of CF (5.5 vs. 5.2 mo), higher total CF intake (54.3 vs. 69.8 kcal/kg birth weight. (Values are compared with low CF consumption)
Longer BF duration associated with dietary pattern characterized by lower intake of CACFs; breast milk loads positively in the pattern characterized by higher intake of breads, other milks, dairy products

15
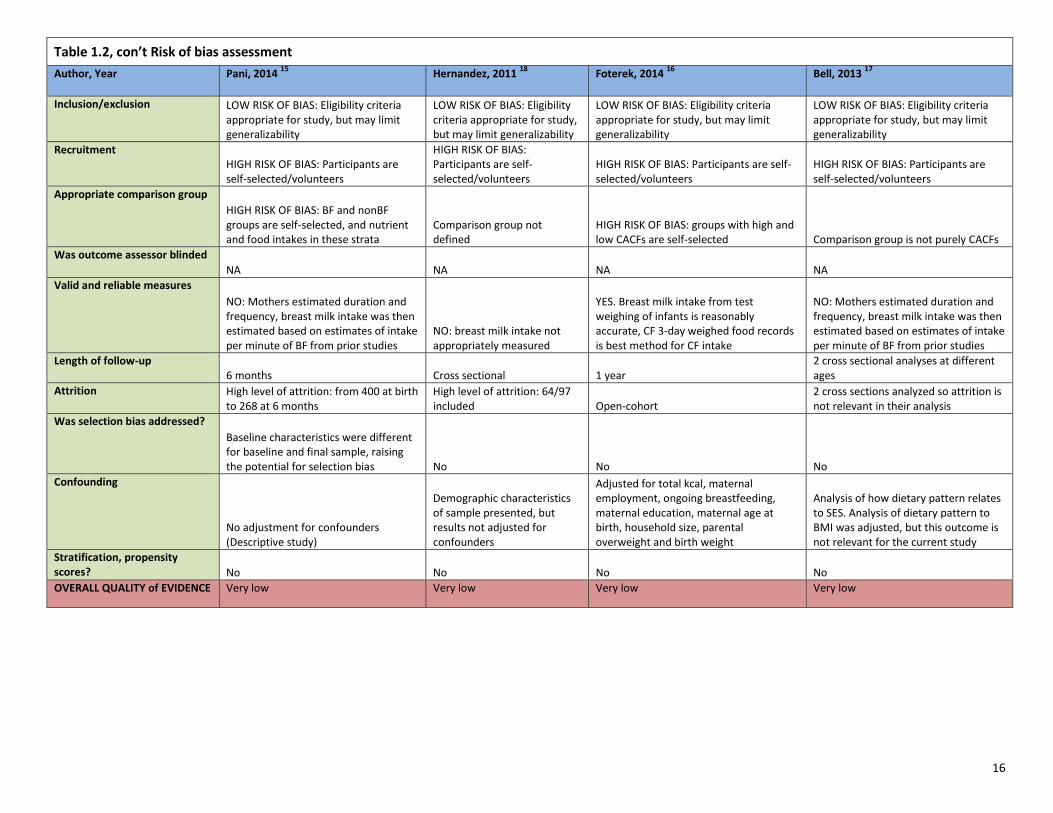
Table 1.2, con’t Risk of bias assessment
Author, Year Pani, 2014 15
Hernandez, 2011 18
Foterek, 2014 16
Bell, 2013 17
Inclusion/exclusion LOW RISK OF BIAS: Eligibility criteria appropriate for study, but may limit generalizability
LOW RISK OF BIAS: Eligibility criteria appropriate for study, but may limit generalizability
LOW RISK OF BIAS: Eligibility criteria appropriate for study, but may limit generalizability
LOW RISK OF BIAS: Eligibility criteria appropriate for study, but may limit generalizability
Recruitment HIGH RISK OF BIAS: Participants are self-selected/volunteers
HIGH RISK OF BIAS: Participants are self-selected/volunteers
HIGH RISK OF BIAS: Participants are self-selected/volunteers
HIGH RISK OF BIAS: Participants are self-selected/volunteers
Appropriate comparison group
HIGH RISK OF BIAS: BF and nonBF groups are self-selected, and nutrient and food intakes in these strata
Comparison group not defined
HIGH RISK OF BIAS: groups with high and low CACFs are self-selected Comparison group is not purely CACFs
Was outcome assessor blinded
NA NA NA NA
Valid and reliable measures
NO: Mothers estimated duration and frequency, breast milk intake was then estimated based on estimates of intake per minute of BF from prior studies
NO: breast milk intake not appropriately measured
YES. Breast milk intake from test weighing of infants is reasonably accurate, CF 3-day weighed food records is best method for CF intake
NO: Mothers estimated duration and frequency, breast milk intake was then estimated based on estimates of intake per minute of BF from prior studies
Length of follow-up 6 months Cross sectional 1 year
2 cross sectional analyses at different ages
Attrition High level of attrition: from 400 at birth to 268 at 6 months
High level of attrition: 64/97 included Open-cohort
2 cross sections analyzed so attrition is not relevant in their analysis
Was selection bias addressed?
Baseline characteristics were different for baseline and final sample, raising the potential for selection bias No No No
Confounding
No adjustment for confounders (Descriptive study)
Demographic characteristics of sample presented, but results not adjusted for confounders
Adjusted for total kcal, maternal employment, ongoing breastfeeding, maternal education, maternal age at birth, household size, parental overweight and birth weight
Analysis of how dietary pattern relates to SES. Analysis of dietary pattern to BMI was adjusted, but this outcome is not relevant for the current study
Stratification, propensity scores? No No No No
OVERALL QUALITY of EVIDENCE Very low Very low Very low Very low
16
Table 1.2, con’t Risk of bias assessment
Author, Year Pani, 2014 15
Hernandez, 2011 18
Foterek, 2014 16
Bell, 2013 17
Inclusion/exclusion LOW RISK OF BIAS: Eligibility criteria appropriate for study, but may limit generalizability
LOW RISK OF BIAS: Eligibility criteria appropriate for study, but may limit generalizability
LOW RISK OF BIAS: Eligibility criteria appropriate for study, but may limit generalizability
LOW RISK OF BIAS: Eligibility criteria appropriate for study, but may limit generalizability
Recruitment HIGH RISK OF BIAS: Participants are self-selected/volunteers
HIGH RISK OF BIAS: Participants are self-selected/volunteers
HIGH RISK OF BIAS: Participants are self-selected/volunteers
HIGH RISK OF BIAS: Participants are self-selected/volunteers
Appropriate comparison group
HIGH RISK OF BIAS: BF and nonBF groups are self-selected, and nutrient and food intakes in these strata
Comparison group not defined
HIGH RISK OF BIAS: groups with high and low CACFs are self-selected Comparison group is not purely CACFs
Was outcome assessor blinded
NA NA NA NA
Valid and reliable measures
NO: Mothers estimated duration and frequency, breast milk intake was then estimated based on estimates of intake per minute of BF from prior studies
NO: breast milk intake not appropriately measured
YES. Breast milk intake from test weighing of infants is reasonably accurate, CF 3-day weighed food records is best method for CF intake
NO: Mothers estimated duration and frequency, breast milk intake was then estimated based on estimates of intake per minute of BF from prior studies
Length of follow-up 6 months Cross sectional 1 year
2 cross sectional analyses at different ages
Attrition High level of attrition: from 400 at birth to 268 at 6 months
High level of attrition: 64/97 included Open-cohort
2 cross sections analyzed so attrition is not relevant in their analysis
Was selection bias addressed?
Baseline characteristics were different for baseline and final sample, raising the potential for selection bias No No No
Confounding
No adjustment for confounders (Descriptive study)
Demographic characteristics of sample presented, but results not adjusted for confounders
Adjusted for total kcal, maternal employment, ongoing breastfeeding, maternal education, maternal age at birth, household size, parental overweight and birth weight
Analysis of how dietary pattern relates to SES. Analysis of dietary pattern to BMI was adjusted, but this outcome is not relevant for the current study
Stratification, propensity scores? No No No No
OVERALL QUALITY of EVIDENCE Very low Very low Very low Very low
17
Table 1.3 Other studies on aspects of complementary feeding that may influence breast milk intake. These studies did not use commercially-available products, and thus did not fit inclusion criteria, but are noted because of their potential to inform the main question.
Author, Year Islam, 2008 19
Singh, 2005 20
Bajaj, 2005 21
Owino, 2007 22
Design Clinical RCT in hospital, compares CFs with 3 different energy densities; sequence of densities altered across 3 study periods
Clinical crossover RCT in hospital testing feeding frequency of 3 vs. 4 times/d
Clinical crossover RCT in hospital testing CF with oil or no oil added to alter energy density
RCT of fortified CF blend (vs. similar blend with amylase added compared to control
Setting Dhaka, Bangladesh periurban community 11/2005-9/2006
New Delhi, date not given New Delhi, date not given Lusaka, Zambia; middle income urban population, date not given.
Recruitment Community survey Normal siblings of older children hospitalized or recovering from minor illnesses
Normal siblings of older children hospitalized or recovering from minor illnesses
Invited to participate when attending immunization clinic at 5 mo.
Sample size (recruited & final)
n=18, achieved with replacement if mother-child pair did not complete the protocol
n=20, 10 in each feeding frequency group n=20, 10 in each feeding frequency group
In breast milk sub-study, 14 to CMBA, 12 to CMB, 27 controls
Age at recruitment & duration of study
8-11 mo, 42 d study 6-10 mo. 48 hr study 6-10 mo. 48 hr study 6 months, followed until 9 months
Inclusion criteria
BF≥6 times/d, CF≥2 times/d, LAZ>-2, WLZ>=1.5, <1.5, no acute or chronic illness, mom BMI>18.5
Receiving CF for >1 mo prior to enrollment, not febrile, WAZ>-3, no conditions that interfere with feeding
Receiving CF for >1 mo prior to enrollment, not febrile, WAZ>-3, no conditions that interfere with feeding
No chronic disease, BW>2.5 kg
CF used in study
CF prepared from commercial rice powder, rice starch, maltodextrin, sucralose, thickening gum, nonfat milk powder, soybean oil and cocoa powder, 0.5, 1.0, 1.5 kcal/g,
Traditional gruel of rice and pulses, 54 kcal/100 g
Traditional gruel of rice and pulses, 54 kcal/100 g
CF was industrially processed locally, from maize, beans, bambaranuts and ground nuts, fortified with MN; half of the produced batch was treated with amylase
Outcome Breast milk intake by test weighing of infant in 12 hr period, with extrapolation to 24 hr.
Breast milk intake by test weighing of infant, with correction for invisible water loss, CF intake by weighing container before and after feeding, accounting for spillage
Breast milk intake by test weighing of infant, with correction for invisible water loss, CF intake by weighing container before and after feeding, accounting for spillage
Breast milk intake using deuterium dose to the mother, CF intake by 24 hour recall
Results Total time spent nursing fell by 13%, total breast milk consumption decreased by 11% as energy density increased from 0.5 to 1.5 kcal/kg (p<0.001). Total breast milk intake fell by 8% when feeding frequency was increased from 3 to 5 times/d (p=0.04). For each additional 1 kcal/d intake of CF, energy intake from breast milk diminished by 0.18 kcal/d.
Breast milk intake was lower with CF feeding frequency of 4 vs. 3 times per day (-61.2 g, p=0.05)
Infants consumed 121 g (35, 207), p=0.008 less breast milk/d when given CF with oil (35 kcal/100g) vs. no oil (20 kcal/100g). Energy density of CF was inversely associated with breast milk intake (r=-0.34, p=0.032)
No significant differences in daily breast milk intake between the groups: CMB= 614 (566, 741); CMBA=635 (512, 758); control=653 (566, 741)

18
Table 1.3 Other studies, con’t
Author, Year Islam, 2008 19
Singh, 2005 20
Bajaj, 2005 21
Owino, 2007 22
Risk of bias assessment
Double blind, not possible to determine sequence generation or allocation concealment, incomplete cases replaced to maintain sample size
Randomized after weight screening, no information about blinding
Randomized after weight screening, no information about blinding
Control group had potential to be healthier because they were healthy when recruited at 9 mo (intervention group recruited at 6 mo could have illness at 9 m) random allocation, double-blinded, baseline characteristics balanced across groups but differential attrition in study groups vs. control
Comments Highly selected group of infants screened for initial weight status and BF & CF feeding patterns
1 d of 3x/d and 1d 4x/d likely insufficient to alter infant patterns
19
1.5 Conclusions To what degree do commercially-available products replace, rather than complement, the intake of breast milk in children 6-23 months of age? From RCTs of CACFs or comparable CFs, there is low quality evidence to suggest that energy dense foods do not displace breast milk. However, the supplemental studies on other aspects of complementary feeding suggest that breast milk intake is sensitive to energy density of the CFs fed, and to feeding frequency, providing some evidence for potential displacement of breast milk by CFs depending on characteristics of the CF and how often they are fed. The inconsistency in these findings strongly suggest that more RCTs are needed, with protocols that include accurate methods of quantification of breast milk in response to feeding of CF, with consideration of amount and energy density as well as feeding frequency of CFs. Evidence from observational studies often report reduced breastfeeding duration or frequency with introduction of CFs, but since the studies measure concurrent breastfeeding and CF intake, and likely make simultaneous choices about these feeding practices, no causal inferences can be drawn from these studies about how CF affects breast milk intake. The included studies represented a very limited selection of CACFs. They were primarily focused on products designed to improve nutritional status of infants during the weaning period in LMIC settings with high rates of stunting and micronutrient deficiencies. There were no RCTs in high income settings, using any of a broad range of CACFs for infants. This large gap in the literature limits ability to draw conclusions about a wider range of CACFs and their effects in infants of high income countries. Additional rigorous RCTs in healthy infants are needed to assess change in objectively measured breast milk intake in response to feeding of specific CFs.

20
PART 2. RESEARCH QUESTION 2 To what degree do commercially-available products consumed by children 6-23 months of age increase the risk of childhood obesity or chronic disease risk factors? 2.1 Background Most research on the relationship of infant feeding to child obesity or chronic disease risk factors has focused on mode of feeding, mainly breast vs. bottle feeding of infant formula, 23-25 the timing of introduction of solid foods, 26 and the type or macronutrient composition of foods. 27 Less attention has been paid to specific infant foods or food sources other than types of milks. Infant diet composition is a concern because eating habits and taste preferences are established early in life, 28 and because short term responses to foods may initiate pathophysiology that persists into later life. 29 In the context of obesity and chronic disease risk, some CACFs are of particular interest because of their high macronutrient density and added salt and sugars. For example, Cogswell et al. 30 in their review of 1074 US infant and toddler foods and drinks noted that while most infant vegetables, dinners, fruits, dry cereals and ready-to-serve mixed grains were low in sodium, a high percentage of toddler dinners, and savory infant and toddler snacks had a high sodium content, and 41/79 infant mixed-grain foods and fruits included one or more added sugars. Studies of 240 infant and toddler foods sold in US retail stores, 31 and 186 sold in Canada 32 found that 58% and 63%, respectively, had high sodium or >20% of energy from sugar. A study of all infant foods made by 6 suppliers in the UK (n=479 products) found that 65% were “sweet foods”, with energy density similar to breast milk. Studies examining potential adverse effects of specific foods are quite limited. 2.2 Objective The objective for Q2 is to review evidence on the degree to which commercially-available products consumed by children 6-23 months of age increase the risk of childhood obesity or chronic disease risk factors. 2.3 Methods 2.3.1 Criteria for considering studies We did not restrict our search by study design. We included evidence on infants and young children, ages 6-23 months randomized or observed to be consuming CACFs compared to home-prepared or local complementary food products. For this question, CACFs included follow-on formula for infants 6 months of age and older. We included studies which reported on anthropometric indicators of adiposity or rapid weight gain (attained weight, weight-for-length or BMI Z-scores, or change in Z-scores) or other methods of assessing body composition; or chronic disease risk factors (elevated blood pressure or glucose, abnormal blood lipids, inflammation). 2.3.2 Search method strategies for identification of studies 2.3.2.1 Electronic searches The following electronic databases were searched to identify relevant studies:
PubMed (2000 – 7 Apr 2015)

21
CINAHL plus (2000 – 8 Apr 2015)
EMBASE (2000 – 7 Apr 2015)
Agricola (2000 – 8 Apr 2015)
CAS (2000 – 8 Apr 2015)
Clinicaltrials.gov (2000 – 9 Apr 2015)
Cochrane (2000 – 9 Apr 2015)
Global Health (2000 – 8 Apr 2015)
WHO Global Library (2000 – 9 Apr 2015)
Business Source Premier (2000 – 8 Apr 2015) 2.3.2.2 Searching other sources We also searched other economics databases (AgEcon, Mintel Oxygen), relevant conference proceedings (Association for Consumer Research, International Health Economics Association), and sources of grey literature (New York Academy of Medicine's Grey Literature Report, Open Grey, PH Partners). Additionally, we reviewed reference lists from highly relevant reviews and articles. 2.3.2.3 Search strategy The search strategy was created using a combination of subject headings and free-text keywords to identify publications (see Appendix 2.1). We did not restrict by language or study design. We restricted to studies published after 2000, to ensure that the commercially-available products analyzed would provide relevant and contemporary evidence. References were extracted and imported into EndNote. Duplicate articles were identified and removed first in EndNote, and then manually in Excel. All articles were assigned a unique record number. 2.3.3 Data collection and analysis 2.3.3.1 Selection of studies Two reviewers independently screened titles and abstracts from electronic databases to identify potentially eligible studies. Prior to starting the work, inter-rater agreement was assessed by screening a subset of titles and abstracts and calculating Cohen's Kappa. Discrepancies were resolved by discussion with a third reviewer. One reviewer screened titles and summaries from the other resources. Full-text articles were obtained, and were independently reviewed by two reviewers according to the inclusion criteria. Discrepancies were resolved with discussion. When the full-text was not available in English it was excluded. 2.3.3.2 Data extraction Excel workbooks created for systematic review data management were utilized in the abstract screening and full-text review process. 6 Record numbers, titles, and abstracts were exported from EndNote into the Excel workbook, and all title and abstract screening and full-text review took place within Excel. Comments on reasons for full-text exclusions were noted in a separate file. Each reviewer had her own Excel workbook, to keep the review process blinded.

22
One reviewer extracted data into standardized tables. Information was extracted on: general study characteristics (design, location/setting, recruitment strategy), participant characteristics (sample size, age, inclusion/exclusion criteria), description of the commercially-available complementary food and comparison foods, outcome, and results. Two separate risk of bias assessment tables were created (for RCTs vs. observational studies). 2.3.3.3 Assessment of risk bias and quality in included studies Articles included in the review were assessed for quality using Cochrane criteria for RCTs and AHRQ guidelines for non-randomized and observational studies. 7,8 Since only 4 studies were identified, and found to be highly heterogeneous in design, focus, types of CFs, study site, and analysis, they were not combined in a meta-analysis. Overall quality of evidence from the final studies was evaluated using GRADE criteria. 10 2.4 Results 2.4.1 Literature search
We identified 929 abstracts for initial screening, from which 17 were referred for full-text review. Of these, 4 were included in the review (Figure 2.1). The main reasons for exclusion were that the study did not include commercially-available foods, obesity/adiposity/rapid weight gain or chronic disease risk factors were not an outcome of the study, the comparison group was not infants consuming home-prepared CFs, or the full-text was not available in English (see table 2.1 for a description of full-texts that were reviewed and excluded from the final set).
929 records identified from all sources
109 duplicates excluded
820 titles & abstracts reviewed
17 full-text records reviewed
13 2 3 3 1
4
Full-text articles excluded
Does not include CACF Irrelevant Review paper No homemade/local
comparison Incomplete data
4 publications included
Figure 2.2 Flowchart of review process
Of the 4 papers included in the review, two were RCTs. The first was a multi-center European trial focused on comparing low vs. high protein infant formula, which included follow-on formula given to infants from 6-12 months. 33 The second was a trial aimed at improvement of nutritional quality of weaning diets in Cambodia, and compared animal source CFs to corn-soy-blend. 34 The two observational studies related milk-cereal drink to child obesity in Sweden. 35,36

23
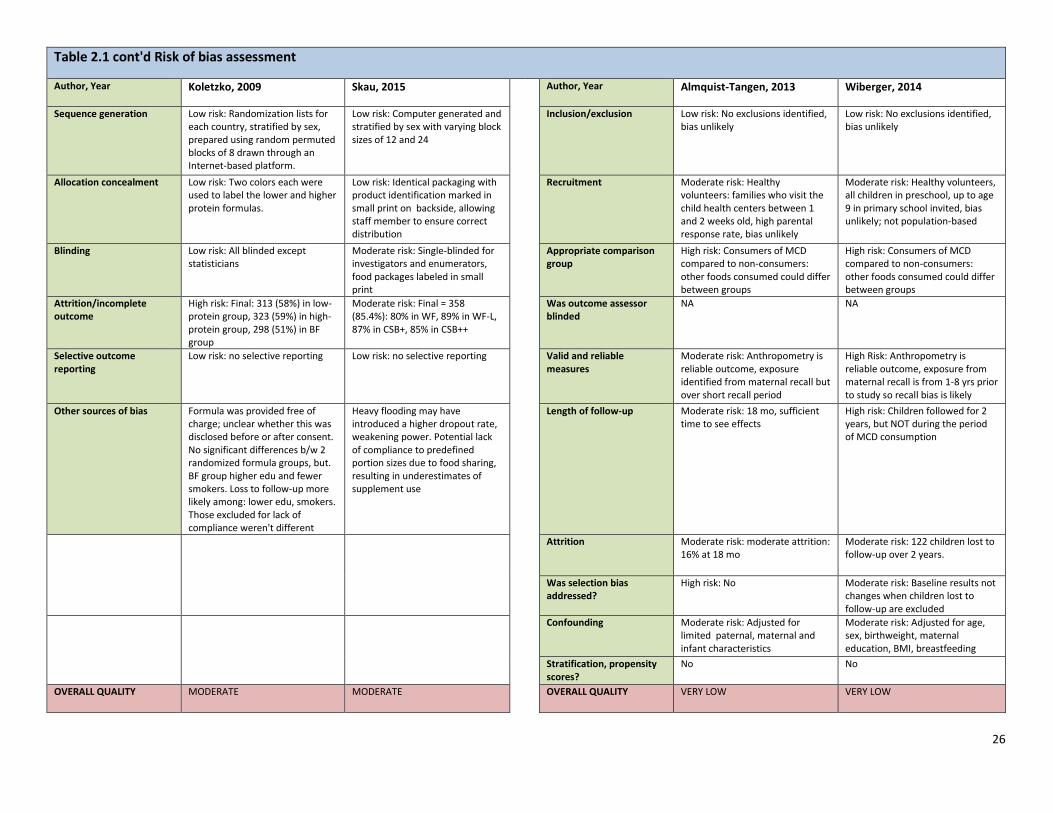
2.4.2 Substantive findings of the included studies(Table 2.1) Koletzko et al. 33 randomized infants who were exclusively formula fed at 8 weeks to consume lower protein vs. higher protein formula. When mothers began to feed CFs after the fifth month, follow-on formula with low (8.8%) or high (17.6%) protein was provided up to 12 months of age. The formulas were prepared for the study by a company in France, and their protein content corresponded to the lower and upper limits of the range of commercially-available products marketed in the countries during the course of the study. Intake of other CFs, and infant weight and length were assessed at 6, 12, and 24 months. The groups randomized to high or low protein were compared to an observational group of breastfed infants. Weight-for-length and BMI Z-scores were significantly higher in the high protein compared to the low protein group at 6, 12 and 24 months, with the largest differences observed at 12 months. Growth in the low protein group did not differ from that of breastfed infants in the observation group. During a 9 month intervention period (6-15 months) among Cambodian infants living in a food-insecure area, there were no significant differences in fat mass estimated by deuterium dilution between infant groups consuming two commercially prepared products (CSB+ and CSB++) available through the World Food Program, compared to locally produced alternative CFs with added animal source foods. 34 The two observational studies focused on how consumption of milk-cereal drink (MCD), a product widely consumed by Swedish infants, relates to infant or child BMI. Sold as a powder, MCD is reconstituted by adding water and often given in a feeding bottle. Almquist-Tangen et al. 35 related MCD consumption to the likelihood of having a high BMI, defined as BMI >1 SD above their study population median. Bottle feeding with MCD at 6 months increased the odds of having a high BMI at 12 months [OR=1.58, (1.12-2.22)] and 18 months [OR=1.52 (1.07, 2.17)]. These associations were not different according to breastfeeding or consumption of other foods. Wilberger et al. 36 assessed older children (4-9 yr) according to their history of MCD consumption earlier in life. MCD consumers were more likely to be overweight [1.70 (1.06-2.71] compared to non-consumers, after adjusting for confounders as well as breastfeeding status in infancy. Consumers of MCD were also 4.78 (1.68-13.59) times more likely to become overweight between the baseline assessment and follow-up 2 years later. 2.4.3 Quality of included studies The RCTs had moderate 33 and high 34 risk of bias. One was a double-blind, multi-site study with high external validity, but higher than expected attrition. 33 However, attrition and non-compliance (i.e. not feeding the study formula) was equal in the 2 randomized groups. The randomized formula groups differed from the observational breastfed group in parental characteristics. A limitation of this study for the current research question is that it is not possible to attribute differences only to the protein content of the follow-on formula, since significant differences were already apparent at 6 months of age (suggesting the importance of protein intake in the first 6 months). The Cambodian study also had high attrition, which reduced statistical power. There was suspected sharing of the CF supplements, 34 and intake of non-study CFs was not measured. The observational studies had high risk of bias. Both relied on maternal recall of infant consumption of MCD. In one study, anthropometric outcomes were measured during the period when toddlers were consuming MCD. 35 In the second study, participants were 2-9 years old, and MCD was reported

24
retrospectively on parental questionnaires. 36 Children’s diet during the subsequent 2 years of follow-up was not measured. No causal inferences can be made from these studies. 2.4.4 Quality of outcomes (GRADE) Based on these studies, the overall quality of evidence that CACFs increase risk of obesity and chronic disease risk is low. Risk of bias. Both RCTs had high rates of attrition, but equal attrition rates across randomized study groups. There was evidence of selective outcome reporting. However, one study labeled supplement packets (albeit in small print), and was therefore not blinded to participants. The observational studies had a high risk of bias. Inconsistency. Heterogeneity in effects was not directly assessed across the studies, owing to substantial differences in recruitment strategies, participant populations, sample size, and CFs tested. The 2 observational studies of MCD were consistent in their findings of elevated risk of infant overweight associated with consumption of MCD, but the outcome in the two studies was measured at different ages. Indirectness. Three of the populations studied were in high income countries, and their main research questions were framed in the context of child obesity. The fourth study was in a context of food insecurity, and aimed to improve quality of CFs fed to poorly nourished infants. The applicability of two of the studies is questionable: the follow-on formulas were produced specifically for the research, but mimicked commercially-available follow-on formulas. In the Cambodian study, local foods were compared to corn-soy-blend, and it is not clear whether this commodity food should be considered a CACF. Imprecision. All studies had wide confidence intervals when comparing alternate CFs. Sample size was adequate based on a priori power calculations, but attrition substantially reduced sample size in all of the studies. Publication bias. It was not possible to formally assess publication bias.

25
Table 2.1 Q2 Full-texts reviewed
RCTs
Observational
Author, Year Koletzko, 2009 33
Skau, 2015 34
Author, Year Almquist-Tangen, 2013 35
Wiberger, 2014 36
Design RCT, multicenter RCT, WINFOOD products vs. CSB Design Observational cohort Observational cohort
Location/setting/year Multi-site: Belgium, Germany, Italy, Poland, Spain 2002-2004
7 communes in rural Cambodia March 2011-March 2012
Location/setting/year South-western Sweden October 2007 - December 2008
Sweden, part of multi-country study, 2007-2008
Recruitment strategy Recruited shortly after birth (in hospital/clinic)
6 mo infants attending referral hospital in PeaRieng town.
Recruitment strategy All families at first visit to child health centers.
Recruited in preschool/primary school
Sample size (n) (recruited vs. final)
1090 randomized, final sample at 24 mo = 636 (58%). Recruited 619 for BF observation group, final sample = 298 (48%)
419 randomized, final = 358 (85%) Sample size (n) (recruited vs. final)
3860 births, 2666 chose to participate, 2241 remained at 18 mo. (84%)
Initial study: 2759 contacted, 1837 participated, current study included 1077 (59%) with complete feeding and anthropometric data
Age Enrolled at 8 weeks (baseline), followed until 24 months
6 mo at baseline, followed until 15 mo
Age 1-2 weeks at recruitment, outcomes measured at 6, 12, 18 months
2-9 at recruitment, used retrospective data on feeding from 6-24 mo
Inclusion/exclusion criteria Inclusion: exclusively formula fed at 8 wks (for RCT) or BF since birth (comparison group). Exclusion: multi-birth, maternal hormonal/metabolic disease, illicit drug addiction, medical conditions that might restrict growth, relocation far from study center.
Severe malnutrition [<−3 (WLZ)], pitting edema, clinical signs of vitamin A deficiency, and severe anemia.
Inclusion/exclusion criteria Not stated All children in school eligible
Commercial food studied/comparison group (how was CF measured)
Low & high protein infant/Follow-on "study formula" randomized, compared to BF. Food intakes measured w/3-d weighed food records at 3, 6, 12, and 24 months
4 processed CACFs: WF, WF-L (fortified with a mineral and vitamin mix), CSB+, or CSB++. Both WF products locally produced. Daily rations before cooking: 50 g at 6–8 mo, 75 g at 9–11 mo, and 125 g at 12–15 mo
Commercial food studied/comparison group (how was CF measured)
Milk cereal drink (MCD) and/or porridge compared to breast milk and/or semi-solids
Välling: a milk-cereal drink, ever/never consumed, age first consumed, # months consumed
Outcome (how it was measured)
Height and weight, conversion to Z scores with WHO growth reference. Performed twice - took average
Changes in fat and fat-free mass assessed using deuterium dilution. Also assessed change in iron status.
Outcome (how it was measured)
BMI at 12 and 18 mo. Anthropometry done by trained child health nurses using digital scales and calibrated stadiometers with the infant naked. Overweight defined by study specific >1 SD
BMI, weight & height measured with standard technique, portable statiometer, electronic scale IOTF definition of overweight
Results At 24 mo. High protein group had 0.20 SD higher WLZ compared to low protein. Low protein group not different from BF group. Energy intake: low protein>high protein at 6 months, not different at 6 or 24 mo
No difference in mean fat mass (kg) or increments in fat or fat free mass in the animal food supplement group compare to the CSB
Results Milk cereal drink at 6 mo increased risk of high BMI at 12 and 18 mo, respectively (OR 1.58, 95% CI 1.12–2.22, and 1.52, 1.07–2.17). No association between feeding patterns at 4 mo and a high BMI (>1 SD) at 12 or 18 mo
MCD associated with increased odds of being overweight 1.70 ( 1.06-2.71); 4.78 (1.68-13.59) for INCIDENT overweight, dose response with duration of consumption
26
Table 2.1 cont'd Risk of bias assessment
Author, Year Koletzko, 2009 Skau, 2015 Author, Year Almquist-Tangen, 2013 Wiberger, 2014
Sequence generation Low risk: Randomization lists for each country, stratified by sex, prepared using random permuted blocks of 8 drawn through an Internet-based platform.
Low risk: Computer generated and stratified by sex with varying block sizes of 12 and 24
Inclusion/exclusion Low risk: No exclusions identified, bias unlikely
Low risk: No exclusions identified, bias unlikely
Allocation concealment Low risk: Two colors each were used to label the lower and higher protein formulas.
Low risk: Identical packaging with product identification marked in small print on backside, allowing staff member to ensure correct distribution
Recruitment Moderate risk: Healthy volunteers: families who visit the child health centers between 1 and 2 weeks old, high parental response rate, bias unlikely
Moderate risk: Healthy volunteers, all children in preschool, up to age 9 in primary school invited, bias unlikely; not population-based
Blinding Low risk: All blinded except statisticians
Moderate risk: Single-blinded for investigators and enumerators, food packages labeled in small print
Appropriate comparison group
High risk: Consumers of MCD compared to non-consumers: other foods consumed could differ between groups
High risk: Consumers of MCD compared to non-consumers: other foods consumed could differ between groups
Attrition/incomplete outcome
High risk: Final: 313 (58%) in low-protein group, 323 (59%) in high-protein group, 298 (51%) in BF group
Moderate risk: Final = 358 (85.4%): 80% in WF, 89% in WF-L, 87% in CSB+, 85% in CSB++
Was outcome assessor blinded
NA NA
Selective outcome reporting
Low risk: no selective reporting Low risk: no selective reporting Valid and reliable measures
Moderate risk: Anthropometry is reliable outcome, exposure identified from maternal recall but over short recall period
High Risk: Anthropometry is reliable outcome, exposure from maternal recall is from 1-8 yrs prior to study so recall bias is likely
Other sources of bias Formula was provided free of charge; unclear whether this was disclosed before or after consent. No significant differences b/w 2 randomized formula groups, but. BF group higher edu and fewer smokers. Loss to follow-up more likely among: lower edu, smokers. Those excluded for lack of compliance weren't different
Heavy flooding may have introduced a higher dropout rate, weakening power. Potential lack of compliance to predefined portion sizes due to food sharing, resulting in underestimates of supplement use
Length of follow-up Moderate risk: 18 mo, sufficient time to see effects
High risk: Children followed for 2 years, but NOT during the period of MCD consumption
Attrition Moderate risk: moderate attrition: 16% at 18 mo
Moderate risk: 122 children lost to follow-up over 2 years.
Was selection bias addressed?
High risk: No Moderate risk: Baseline results not changes when children lost to follow-up are excluded
Confounding Moderate risk: Adjusted for limited paternal, maternal and infant characteristics
Moderate risk: Adjusted for age, sex, birthweight, maternal education, BMI, breastfeeding
Stratification, propensity scores?
No No
OVERALL QUALITY MODERATE MODERATE OVERALL QUALITY VERY LOW VERY LOW

27
2.5 Conclusions The evidence that met criteria for inclusion in this report is of low quality, and insufficient to provide a definitive answer to the question, “To what degree do commercially-available products consumed by children 6-23 months of age increase the risk of childhood obesity or chronic disease risk factors?” Higher protein follow-on formula is associated with moderately high weight-for-length Z-scores at 24 months of age, and a history of consumption of MCD is associated with higher risk of toddler or young child overweight. The energy density of MCD and follow-on formulas is similar (65 vs. 72 kcal/100 ml), but the protein content of MCD is higher, at 2.7 g/100 ml and is more similar to the high protein follow-on formula used in the multi-country study (3.2 g/100 ml) than to the average level of 1.9 g/100 ml in follow-on formulas marketed in the same countries. Given these findings, further research into the health implications of similar high protein/high energy density CACFs is needed. We found no studies meeting the inclusion criteria that related other types of CACFs to infant adiposity or chronic disease risk. While, as noted in the introduction, there are numerous studies relating timing of introduction of solid CFs or mode of feeding to infant and child weight or adiposity status, these studies do not identify specific CACFs. Thus, overall, the evidence base for how CACFs relate to infant health is extremely limited, and further focused studies on this topic are needed.

28
PART 3. RESEARCH QUESTION 3 Are commercially-available products nutritionally inferior or superior to home-prepared and/or local foods? Do they contain higher or lower amounts of trans-fat, saturated fat, free sugars, or salt? Do they contain higher or lower amounts of essential micronutrients? Do commercially-available products provide nutrients that are generally lacking in the diets of young children? 3.1 Background In LMIC, locally available and affordable CFs are often of inadequate quality, and may be fed in inadequate quantities to meet infant and young child energy and nutrient needs. Thus, most of the literature relating home-prepared or local foods to CACFs in low resource settings is aimed at undernutrition, with a focus on identifying CFs that will prevent or ameliorate micronutrient deficiencies and growth faltering. Concerns about cost and sustainability have motivated efforts to develop better quality CFs from local ingredients with high nutrient density and bioavailability. Some studies use local foods or ingredients, which may be mixed in different combinations, altered to add micronutrients (commercially-available micronutrient supplements or animal foods such as dried fish or insects), or altered to change consistency or digestibility through processes such as fermentation. CACFs widely marketed in LMIC tend to be micronutrient-fortified, high energy density foods such as dry cereals to be prepared by mixing with water or milk. In the literature on CFs from LMICs, CACFs manufactured by multinational companies have been analyzed primarily as the foods given to a control or comparison group in studies aimed at development and testing of better quality home-made or locally available CFs. There is little information based on comparison of commercially-available foods with a directly comparable home-prepared product.
In contrast, studies of CACFs in high income countries tend to focus on concerns about the potential for CFs to influence obesity and chronic disease risk. 30,37 Thus, they include comparisons of macro and micronutrient content, amount or types of fat, or amount of sugar and salt based on nutrition facts labels or chemical analyses. For obvious ethical reasons, there are no randomized trials which compare high fat/high sugar foods to healthier versions.
3.2 Objectives The objective for Q3 is to review evidence on the nutritional quality of CACFs, especially with respect to fat content, added sugar and salt, and essential micronutrients. 3.3 Methods 3.3.1 Criteria for considering studies We did not restrict our search by study design. We included evidence related to CFs for infants and young children, ages 6-23 months. CACFs were compared to: home-prepared foods, CFs that could be home prepared with local ingredients, or CFs that closely mimic home prepared foods. Included studies are those that report results of laboratory-based analyses of the nutrient composition of selected CFs without involving any human trials, OR analysis of composition of specific foods assigned for consumption in RCTs or recorded in observational studies. We considered any studies that quantified macronutrients (including types of fats, added sugars), and/or micronutrients or added salt.

29
3.3.2 Search method strategies for identification of studies 3.3.2.1 Electronic searches The following electronic databases were searched to identify relevant studies:
PubMed (2000 – 10 Apr 2015)
CINAHL plus (2000 – 10 Apr 2015)
EMBASE (2000 – 10 Apr 2015)
Agricola (2000 – 12 Apr 2015)
CAS (2000 – 12 Apr 2015)
Clinicaltrials.gov (2000 – 12 Apr 2015)
Cochrane (2000 – 12 Apr 2015)
Global Health (2000 – 10 Apr 2015)
WHO Global Library (2000 – 12 Apr 2015)
Business Source Premier (2000 – 10 Apr 2015) 3.3.2.2 Searching other resources We searched other economics databases (AgEcon, Mintel Oxygen), relevant conference proceedings (Association for Consumer Research, International Health Economics Association), and sources of grey literature (New York Academy of Medicine's Grey Literature Report, Open Grey, PH Partners). Additionally, we reviewed reference lists from highly relevant reviews and articles. 3.3.2.3 Search strategy The search strategy was created using a combination of subject headings and free-text keywords to identify publications (see Appendix 3.1). We did not restrict by language or study design. We restricted to studies published after 2000, to ensure that the commercially-available products analyzed would provide relevant and contemporary evidence. References were extracted and imported into EndNote. Duplicate articles were identified and removed first in EndNote, and then manually in Excel. All articles were assigned a unique record number. 3.3.3 Data collection and analysis 3.3.3.1 Selection of studies Two reviewers each screened one-half the titles and abstracts from electronic databases to identify potentially eligible studies. Prior to starting the work, inter-rater agreement was assessed by screening a subset of titles and abstracts and calculating Cohen's Kappa. All studies identified as possibly being eligible for inclusion were screened by a third reviewer for a final decision. One reviewer screened titles and summaries from the other resources. Full-text articles were obtained, and were independently reviewed by two reviewers according to the inclusion criteria. Discrepancies were resolved with discussion. When the full-text was not available in English it was excluded. 3.3.3.2 Data extraction

30
Excel workbooks created for systematic review data management were utilized in the abstract screening and full-text review process. 6 Record numbers, titles, and abstracts were exported from EndNote into the Excel workbook, and all title and abstract screening and full-text review took place within Excel. Comments on reasons for full-text exclusions were noted in a separate file. Each reviewer had her own Excel workbook, to keep the review process blinded. Two reviewers extracted information on: general study characteristics (design, location/setting, recruitment strategy), participant characteristics (sample size, age, inclusion/exclusion criteria), description of the commercially-available complementary food and comparison foods, outcome, and results. Risk-of-bias assessment criteria were evaluated for each study and presented in the tables which describe the studies. Tables were reviewed by another reviewer. 3.3.3.3 Assessment of risk bias and quality in included studies Given the nature of this question, most of the evidence derives from laboratory analysis of different CFs. Thus, standard review criteria for RCTs and observational studies do not apply to the laboratory studies. For studies amenable to the quality assessment for human studies, we used AHRQ tools for the observational studies. 7,8 No RCTs were relevant. The studies included in the final review were highly heterogeneous in the CFs and specific nutrients analyzed, and were not amenable to a meta-analysis of results. Overall quality of the evidence from the final studies was assessed using GRADE evidence profiles. 10 3.4 Results 3.4.1 Literature search We identified and screened 3250 abstracts. Of these, 43 were referred for full-text review, and 16 were included in the final review (see figure 3.1). Of these, three were human studies that compared infant energy and nutrient intakes and/or nutritional quality of alternate CFs, while the remaining 13 were laboratory studies of nutrient chemical composition of alternate CFs. A list of excluded full-texts and reasons for exclusion is presented in Appendix 3.2.
3250 records identified from all sources
466 duplicates excluded
2784 titles & abstracts reviewed
43 full-text records to be reviewed
2 items not available for review
41 full-text records reviewed
25 4
10 3 1 1 6
Full-text articles excluded
Does not include CACF Incorrect comparison Incomplete data Irrelevant Review paper Not in English

31
16 publications included
Figure 3.1 Flowchart of review process 3.4.2 Characteristics of included studies Owing to the differences in study design represented in the included studies, we separately reviewed studies involving humans and those based solely on laboratory assessment of the composition of CF samples. Very few studies have unaltered home-prepared foods as the comparison group. Often the investigators formulate CFs with local products so that they mimic home-prepared foods.
Of the 3 human studies, two were from LMICs (South Africa and Vietnam), and 1 from a high income country (UK). The Vietnam study was part of a RCT designed to compare two alternate CFs to home-made foods in terms of infant energy and nutrient intakes, and nutrient composition of the foods. 38 The UK study, done in the ALSPAC cohort, 39 identified dietary patterns characterized by high intake of CACFs vs. home-made foods, and related energy and nutrient intakes to those and other patterns. The South African study compared energy and nutrient intake of infants who consumed CACFs to those who did not consume CACFs. 40 Of the 13 laboratory studies, 9 were conducted and analyzed in Africa (1 in Ghana, 7 in Nigeria and 1 in Tanzania), 3 in Europe (1 in Denmark, 1 in Italy and 1 in the United Kingdom) and 1 in Asia (India). All studies reported the mean micronutrient, macronutrient and energy contents of selected CACFs with home-made infant foods and/or laboratory-prepared formulations of infant foods made from locally available ingredients.
3.4.3 Substantive findings from the human studies (Table 3.1)
Details from the three human studies are presented in table 3.1. Smithers 39 et al. identified dietary patterns using factor analysis (43 food items at 6 months, 70 items at 15 months). One factor represented a home-made, traditional dietary pattern consisting of home-prepared meat, vegetables and desserts, while another represented high intake of ready-prepared baby foods. At 8 months, the ready-prepared baby food pattern score was positively associated with many micronutrients, including iron and calcium, and negatively associated with fiber and sodium, a pattern which the authors characterized as generally positive with room for improvement. Patterns were not consistent or stable over time. Faber et al. 40 compared energy and nutrient intakes among 6-12 month old rural South African infants according to whether they consumed CACFs (fortified infant cereals, ready-to-eat baby foods and infant formula) or not. Those who consumed CACFs had significantly higher intakes at 6-9 and 9-12 months of protein, calcium, iron, and zinc as well as higher intakes of vitamins A, B6, B12 and C, thiamine, riboflavin, and niacin, but intakes of some of these nutrients were still less than adequate. Van Hoan et al.38 compared the ability of 2 CF food products to increase energy and nutrient intake of Vietnamese children. They compared Favina (made from rice, soybeans, sugar, sesame, dry milk, iodized salt, Ca3(PO4)
2 and vitamin-mineral premix) and Favilase (made from soybeans, iodized salt, Ca3(PO4)2,
vitamin-mineral premix and α-amylases) to a home-made traditional gruel consumed by 6, 7, 8, and 9 month old children. Per 100g, the home-made gruel was consistently lower in energy, protein, Ca, Fe and Zn (71kcal, 2.62g, 18mg, 0.43mg, 0.39mg, respectively) compared to the Favina (99kcal, 3.61g, 116mg, 5.37mg, 1.51mg) and Favilase (105kcal, 4.30g, 175mg, 8.59mg, 1.85mg). Median infant intakes, per meal, were 11.7 g/kg body weight higher for Favina and Favilase than home-made gruels.
32
3.4.4 Quality of the included human studies (GRADE) Based on these studies, the overall quality of evidence is low. Risk of bias. Risk of bias related to recruitment was low, but other sources of bias were high: Two of the studies were observational, and one was a trial with no blinding of CFs. Each of the three studies used a different technique to quantify consumption of CACFs and home-made foods and used assessment tools that often yield biased estimates of food intake. Smithers et al. 39used dietary questionnaires to determine patterns at 6 and 15 months of age and un-weighed 3-day diet diaries to determine nutrient intake at 8 and 18 months of age. Faber 40 used a single 24-hour dietary recall. Van Hoan et al. 38 used in-home surveying techniques to weigh and measure intake of all foods over the course of a day; their data are less subject to recall bias, but surveyors stayed in the participant’s home, introducing the potential for social desirability bias. Inconsistency Two of the studies 39,40examined combinations or patterns of intake of CACFs and could therefore not provide insights on specific CACFs. The two studies in LMIC, found that infants who consumed CACFs had higher micronutrient intakes than those who did not, likely reflecting the micronutrient fortification of CACFs. In the third study, a higher score on the dietary pattern characterized by CACFs (ready-prepared foods), was associated with a mixed profile of what might be deemed healthy vs. problem nutrients, thus limiting any clear generalizations. Indirectness. One of the studies used laboratory prepared porridges made with locally-available products and so these formulations did not necessarily reflect what is traditionally prepared in home settings but are plausible formulations nonetheless. The analysis of dietary patterns is unable to assess specific CACFs Imprecision. It is not possible to directly quantify nutrient profiles of derived dietary patterns in the UK study: mean intake of nutrients by tertile of factor score, without SDs, were presented. Publication bias. It was not possible to formally assess publication bias. 3.4.5 Substantive findings from the laboratory studies (Table 3.2) There are 9 studies from Africa that used laboratory-formulations of meals made from locally-available foods that could be prepared in home settings. In the Ghana study, Eshun et al. 41 found that their formulation diet of soybean, groundnut and rice flour mixture provided more protein, fat, energy, iron, but less calcium compared to CerevitaTM. Mosha et al. 42 reported that the two LactogenTM and two CerelacTM products were higher in sodium, calcium and zinc compared to the maize, cassava, millet, plantain-meat, sorghum and millet-composite home-made foods under study in Tanzania. However, their plantain-meat pap, millet-sardine-peanut gruel and millet gruel had a higher protein content compared to the CACFs. Ijarotimi et al. 43 found that their crayfish-ogi, soy-moinmoin and cooked beans had greater protein content than CerelacTM. Ijarotimi et al. 44 compared their formulation diets of green bananas and bambara groundnut seeds flour (70:30 (CBR1) or 60:40 (CBR2) ratio) to NutrendTM. The CBR2 infant diet had similar protein quality to that of NutrendTM. Total protein contents were not reported. Ijarotimi et al. 45,46 published 2 studies which compared NutrendTM to ogi (locally available CF) and four formulations of banana and groundnut flour with different compositions to traditional fermented maize porridge, ogi, and NutrendTM. While the flour blends had a superior nutritional profile compared to ogi, some formulations were similar to or inferior in comparison to NutrendTM. Steve et al.
33
47 found that fermented and blanched experimental mixes of popcorn and moringa leaves flours (FPM and BPM respectively) had higher protein content but lower energy compared to CerelacTM and ogi. FPM sample had higher copper, calcium and magnesium than CerelacTM. BPM had higher zinc, iron, potassium, sodium and phosphorous than CerelacTM. Lalude et al. 48 found that their laboratory prepared formulation of sorghum, soyabean, groundnut and sesame-oil seeds/flours had higher protein, energy, iron, sodium and calcium contents than the NutrendTM product. When Omueti et al. 49 compared their formulation diets of Prowena (maize flour with soyflour, groundnut meal, crayfish flour) and Propalm (maize flour with soyflour, groundnut meal, crayfish flour palm oil) to yellow maize gruel ogi and NutrendTM, they found higher protein in formulation weaning diets relative to NutrendTM and ogi. NutrendTM had higher fat, calcium, potassium, sodium and iron contents than the formulation diets. The four remaining studies were set in Europe and Asia. The UK study by Garcia et al. 37 found that ready-made meat/fish/chicken had less energy and protein compared to home-made beef and chicken. Ready-made vegetarian baby food had lower energy, protein and calcium compared to home-made potato and cauliflower and cheese dishes but more than the home-made vegetable dish used in comparison. Commercial rusks/biscuits had more energy, iron and calcium compared to home-made banana and toast alternatives. Ready-made sweet foods had less protein than stewed apple with custard, or stewed apple with tinned creamed rice alternatives. The study by Roos et al. 50 was set in Denmark but focused on local foods from Asia, Africa and Europe and CACFs available in supermarkets in the UK and Denmark. Compared to their blended non-fortified foods which used traditional recipes from small- and medium-sized enterprises, the CACFs from food-aid programs contained higher quantities of iron, zinc and calcium. Thatola et al. 51 compared the nutrient profiles of a marketed weaning mix to an unfortified weaning mix of millet, soybean and skim milk powder in India. The unfortified weaning mix had higher protein, zinc and ascorbic acid but lower iron, calcium and vitamins D and B than the marketed mix. Nudda et al. 52 reported that their fresh lamb meat meal contained more omega-3 polyunsaturated fatty acids, α-linolenic acid, eicosapentaenoic acid, docosahexaenoic acid and arachidonic acids compared to the commercial lamb meat-based infant product under study in Italy. 3.4.6 Quality of included laboratory studies The standard tools for evaluation of RCTs and trials do not apply to the laboratory studies. Key issues for these studies relate to whether they assess representative versions of CFs, and use comparable methods for determining nutrient composition of foods. The ideal study would compare nutrient profiles of home-made and commercial infant meals with similar ingredients. However, owing to the diverse commercial products available and potential home-made substitutes, such a study is not feasible. Garcia et al. 37 was distinguished in its assessment of 462 infant products. They compared means for food types (such as ‘sweet fruit only’, ‘savoury meals with meat/fish/chicken’) and those of similar home-made food types. Roos et al. 50 presented nutrient profiles of 36 CACFs that were mostly cereal-based porridges and semi-solid foods. The other studies were smaller in scale and reported on fewer than 10 infant foods. CACFs under study included NutrendTM (5 studies), CerelacTM (3 studies), LactogenTM (1 study) and CerevitaTM (1 study). The CACF was not explicitly named in the 4 remaining studies but included 1) a weaning mix fortified with micronutrients and a market weaning mix, 2) a fortified infant porridge, 3) ~318 “ready-made” spoonable baby foods and 4) homogenized and lyophilized lamb-meat based CACFs. Locally-available home-made alternatives included laboratory formulations of locally-available foods made from the flours of sorghum, soybeans, groundnuts, popcorn flour, green bananas, maize, millet,

34
plantains, crayfish, and cassava. Other ingredients included potatoes, broccoli, parsnips, cauliflower, stewed apple with custard, stewed apple with tinned creamed rice, beans, sesame-oil seeds, palm oil, butter, moringa oleifera leaves, banana, white toast, cheese, fresh lamb meat, beef stewed, stewed chicken, and sardines. Given the variety of commercially-available infant foods and diverse home-made alternatives and laboratory formulations studied, a meta-analysis of these results is not possible.

35
Table 3.1 Summary of full text reviews Q3 human studies
Author, Year Smithers, 2012 39
Faber, 2005 40
Van Hoan, 2009 38
Design Observational Observational study: baseline data from infants recruited for RCT
Cross sectional sub-study from a 3 group RCT: 1) Favina (10 villages); 2) Favilase (10 villages); 3) Traditional gruel (9 villages)
Location/setting England; 1991-1992 Rural South Africa Vietnam/community; April 2002 to October 2002
Recruitment strategy
Pregnant women residing in the former county of Avon, Southwest England who were expected to deliver between 1st April 1991 and 31st December 1992
Recruited through the community health worker program
Participants in village-based cluster RCT
Sample size (n) n = 725 at 6–8 months, n = 535 at 15–18 months 475 provided diet data (from 563 recruited) 144: 36 infants from each age group (6, 7, 8 and 9 months) were randomly selected over the three food groups allowing a total of 48 infants per food groups (12 infants of 6, 7, 8 and 9 months ± 1 week were studied in each food group)
Age 6-18 months 6-12 months 6, 7, 8 and 9 months
Inclusion/exclusion criteria
Born in the last 6 months of the cohort recruitment; had nutrient intakes at 8 and/or 18 months and dietary patterns extracted at 6 and/or 15 months
Not stated Weight-for-height Z-score >-2 and a height-for-age Z-score >-2.5 and/or suffered disease in the 7 days prior
Nature of comparison food
Home-made traditional =home-prepared meat, vegetables and desserts; Discretionary =biscuits, sweets and crisps; Home-made contemporary =herbs, legumes, nuts, cheese, raw F&V.
Comparison group was infants with no reported consumption of infant CACFs
Non-fortified traditional gruel
Commercial food studied
Ready-prepared baby foods pattern =CACF Ready-to-eat canned baby foods, infant cereals and formula milk powder
Favina = rice, soybeans, sugar, sesame, dry milk, iodized salt, Ca3(PO4)
2, and vitamin-mineral
premix. Favilase = soybeans, iodized salt, Ca3(PO4)2,
vitamin-mineral premix and alpha-amylases
Outcome Energy and nutrient intakes at 8 and 18 months associated with dietary patterns at 6 and 15 months, respectively.
Energy and nutrient intakes of infants who consumed CACFs (n=140 6-9 mo, n=120 9-12 mo) vs. no CACFs (n=91 6-12 mo, n=123 9-12 mo).
Energy and nutrient intakes of infants between 6 and 9 months
Results Home-made traditional pattern was positively associated with median energy, Na and K. At both times, the discretionary pattern was positively and the ready-prepared baby foods pattern was negatively associated with Na intake. At 6–8 months, Ca and Fe intakes decreased across scores on the home-made traditional and BF patterns, but increased across the ready-prepared baby food patterns.
Compared to infants who consumed infant products, those who did not consume infant products had significantly less protein at 6-9 and 9-12 mo (14, 17 vs. 16, 20g) Ca (273, 259, vs. 388, 407 mg), Fe (1, 1.5 vs. 4.6, 5.5mg) and Zn (2.2, 2.3 vs. 2.8, 3.4 mg) as well as vitamins A, B6, B12, C, thiamine, riboflavin, and niacin.
Per 100g, the home-made gruel was lower in energy, protein, Ca, Fe and Zn (71kcal, 2.62g, 18mg, 0.43mg, 0.39mg, respectively) than the Favina (99kcal, 3.61g, 116mg, 5.37mg, 1.51mg, respectively) and Favilase (105kcal, 4.30g, 175mg, 8.59mg, 1.85mg, respectively)

36
Table 3.1, con’t Risk of bias assessment
Author, Year Smithers, 2012 39
Faber, 2005 40
Van Hoan, 2009 38
Inclusion/exclusion Low risk: Born in the last 6 months of the cohort recruitment; had nutrient intakes at 8 and/or 18 months and dietary patterns extracted at 6 and/or 15 months
Uncertain risk: Not stated Uncertain risk: Not stated
Recruitment Low risk: Pregnant women residing in the former county of Avon, Southwest England who were expected to deliver between 1st April 1991 and 31st December 1992
Low risk: Recruited through the community health worker program
Low risk: 144 enrolled (48 per food group and 12 per month of age). Outcomes were reported for 157: Favina (n = 48), Favilase (n = 48), Home-made (n = 61)
Appropriate comparison group
High risk: Dietary patterns derived for full sample, factor scores represent mixed consumption patterns, so CACF group is not purely CACF
Moderate risk: Consumers vs. non-consumers of CACFs, based on a single 24 hr recall. May not represent consistent patterns of consumption, but nutrient analysis reflects classification for that day.
Low risk: Comparison group was infants following usual feeding practices
Was outcome assessor blinded
Not applicable Not applicable Moderate risk: not blinded
Valid and reliable measures
High risk: Questionnaire not validated in this population. Diet patterns were defined prior to measurement of nutrient intake (2-3 months apart), possibly introducing measurement error
High risk: Used a single 24 hr recall to determine local foods, subject to recall bias and errors in estimating quantities
Low risk: Accurate measurement of quantities of gruels and their ingredients (experimental and home-prepared); laboratory measures of samples of gruels as prepared by participants.
Length of follow-up
Low risk: 2-3 months Low risk: cross sectional Low risk: cross sectional
Attrition Moderate risk: Owing to attrition, patterns developed on different samples at 6 and 15 months
Moderate risk: 88 caregivers could not provide reliable diet info because they were not the permanent caregivers
Low risk: cross sectional
Was selection bias addressed?
Low risk: Patterns may not represent broader population, but associations not likely to be biased
NA NA
Confounding Adjusted patterns for total dietary energy intake NA NA
Other Moderate risk: Funded by the South African Sugar Assn; Moderate risk: Surveyors stayed in participants home, potentially influencing preparation methods and infant feeding, but bias likely to be non-differential across groups
Overall Quality Assessment
Low quality in the context of the research question owing to lack of ability to isolate the effects of specific CACFs and method of dietary intake assessment that was not validated for the study population, and is subject to recall bias
Low quality owing to use of single 24 hour recall to collect dietary data.
Moderate quality: reasonably accurate analysis of intakes and composition of CFs.

37
Table 3.2 Laboratory Studies of Nutrient Composition of CACFs Author, Year Nudda, 2011
52 Garcia, 2013
37 Roos, 2013
50
Location/setting Italy, 2008 and 2009 UK; Oct 2010 to Feb 2011 Foods from Asia, Africa and Europe - analyzed in Copenhagen. CACF were bought in supermarkets in Denmark and the UK, 2012
Recruitment strategy
NA NA NA
Sample size (n) NA NA NA
Age NA NA NA
Inclusion/exclusion criteria
Availability Ready-made and dry foods produced by main infant food manufacturers identified by product sales; all baby drinks, smoothies and milks were excluded
Selection of products was based on covering a wide range of CACFs. Fortified blended foods were selected for being used in food aid programs.
Comparison food Fresh meat (FM) from suckling lambs Beef minced stewed with butter and formula milk; stewed chicken with rice and white sauce; potatoes with butter, cheese and formula milk; potatoes, broccoli, parsnip and formula milk; cauliflower, cheese and formula milk; stewed apple with custard; stewed apple with tinned creamed rice; banana; white toast with butter
Local blended food: blended non-fortified foods based on traditional recipes and local foods produced by local small- and medium-sized enterprises.
Commercial food Homogenized (HO) from 3 different companies and lyophilized (LIO) from 2 of the same 3
Ready-made spoonable baby foods (approximately 318 foods)
Fortified instant porridge (‘processed cereal-based foods’) and semi-solid products (‘baby foods’ ready-to-eat) for European market declared as ‘whole grain’
Outcome Fatty acid profiles in fresh lamb meat compared to lamb-based CACF
Nutritional comparison of CACF to family weaning foods
Levels of anti-nutritional compounds: phytate, total polyphenol, trypsin and chymotrypsin inhibitors and lectins
Energy or other nutritive value
Ready-made meat/fish/chicken had less energy per 100 g (278kcal) compared to home-made beef (494kcal) and chicken (624kcal). Ready-made vegetarian had lower energy (267kcal) compared to home-made potato (511kcal) and cauliflower and cheese (391kcal) dishes but more than a home-made vegetable dish (253kcal). Commercial rusks/biscuits had more energy (1698kcal) compared to home-made alternatives of banana (403kcal) and toast (1270kcal).
Macronutrients For the FM, LIO and HO distributions were: % fat 3.4, 15.1, 4.0; % ARA 2.03, 0.29, 0.36; % EPA 0.65, 0.08, 0.11; % DHA 0.64, 0.05, 0.05. For the FM, LIO and HO distributions were: % protein - 18.7, 43.13, and 8.05.
Ready-made meat/fish/chicken had less and protein per 100 g (3.1g) compared to home-made beef (6.7g) and chicken (11.8g). Ready-made vegetarian had lower protein (2.6g) compared to home-made potato (4g) and cauliflower and cheese (4.6g) dishes but more than a home-made vegetable dish (1.8g). Ready-made sweet foods had less protein (1.5g vs. 2.2g and 2.4g).

38
Table 3.2 Laboratory Studies of Nutrient Composition of CACFs, con’t
Author, Date Nudda, 2011 52
Garcia, 2013 37
Roos, 2013 50
Micronutrients Ready-made vegetarian had lower Ca (48 mg) compared to home-made potato (97mg) and cauliflower and cheese (99mg) dishes but more than a home-made vegetable dish (35mg). Commercial rusks/biscuits had more Fe and Ca (5.8g, 273mg) compared to home-made alternatives of banana (0.3mg, 6mg) and toast (1.4mg, 98mg)
Fe: local: 5.4 (+ 3.0–10.5) vs. fortified: 12.32 (+ 9.5–19.9) mg/100 g. Zn: local: 3.4 (+ 1.8–5.2) vs. fortified: 12.7 + 2.4–23.4) mg/100 g. Ca: local: 111.5 (+ 29–410) vs. fortified: 408 (range: 73–654) mg/100 g
Other results Fresh lamb meat contained more Omega-3 PUFAs, α-linolenic acid, eicosapentaenoic acid, docosahexaenoic acid and arachidonic acids compared to commercial baby food.
The fortified products had higher levels of Fe, Zn, and Ca than the local blended non-fortified foods. Phytate content was high in all products. Only 4 products had rec'd phytate:Fe molar ratio (1 local), 25 for phytate:Zn (3 local) and 15 for phytate:Ca (4 local)
Risk of bias assessment
Many home-made comparison foods were made with formula milk
Some local blended foods lacked information on nutrient composition
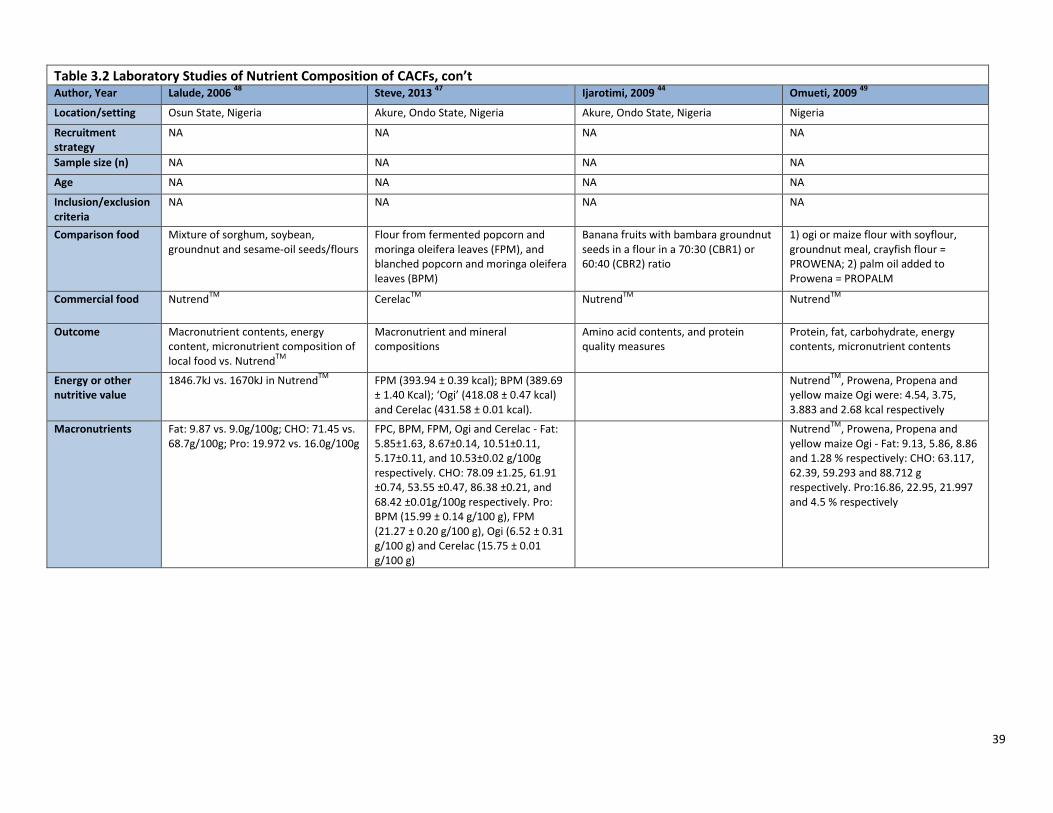
39
Table 3.2 Laboratory Studies of Nutrient Composition of CACFs, con’t Author, Year Lalude, 2006
48 Steve, 2013
47 Ijarotimi, 2009
44 Omueti, 2009
49
Location/setting Osun State, Nigeria Akure, Ondo State, Nigeria Akure, Ondo State, Nigeria Nigeria
Recruitment strategy
NA NA NA NA
Sample size (n) NA NA NA NA
Age NA NA NA NA
Inclusion/exclusion criteria
NA NA NA NA
Comparison food Mixture of sorghum, soybean, groundnut and sesame-oil seeds/flours
Flour from fermented popcorn and moringa oleifera leaves (FPM), and blanched popcorn and moringa oleifera leaves (BPM)
Banana fruits with bambara groundnut seeds in a flour in a 70:30 (CBR1) or 60:40 (CBR2) ratio
1) ogi or maize flour with soyflour, groundnut meal, crayfish flour = PROWENA; 2) palm oil added to Prowena = PROPALM
Commercial food NutrendTM
CerelacTM
NutrendTM
NutrendTM
Outcome Macronutrient contents, energy content, micronutrient composition of local food vs. Nutrend
TM
Macronutrient and mineral compositions
Amino acid contents, and protein quality measures
Protein, fat, carbohydrate, energy contents, micronutrient contents
Energy or other nutritive value
1846.7kJ vs. 1670kJ in NutrendTM
FPM (393.94 ± 0.39 kcal); BPM (389.69 ± 1.40 Kcal); ‘Ogi’ (418.08 ± 0.47 kcal) and Cerelac (431.58 ± 0.01 kcal).
NutrendTM
, Prowena, Propena and yellow maize Ogi were: 4.54, 3.75, 3.883 and 2.68 kcal respectively
Macronutrients Fat: 9.87 vs. 9.0g/100g; CHO: 71.45 vs. 68.7g/100g; Pro: 19.972 vs. 16.0g/100g
FPC, BPM, FPM, Ogi and Cerelac - Fat: 5.85±1.63, 8.67±0.14, 10.51±0.11, 5.17±0.11, and 10.53±0.02 g/100g respectively. CHO: 78.09 ±1.25, 61.91 ±0.74, 53.55 ±0.47, 86.38 ±0.21, and 68.42 ±0.01g/100g respectively. Pro: BPM (15.99 ± 0.14 g/100 g), FPM (21.27 ± 0.20 g/100 g), Ogi (6.52 ± 0.31 g/100 g) and Cerelac (15.75 ± 0.01 g/100 g)
NutrendTM
, Prowena, Propena and yellow maize Ogi - Fat: 9.13, 5.86, 8.86 and 1.28 % respectively: CHO: 63.117, 62.39, 59.293 and 88.712 g respectively. Pro:16.86, 22.95, 21.997 and 4.5 % respectively

40
Table 3.2 Laboratory Studies of Nutrient Composition of CACFs, con’t
Study (author, year) Lalude, 2006 Steve, 2013 Ijarotimi, 2009 Omueti, 2009
Micronutrients Fe: 28.5 vs. 1.0mg/100g; Ca: 93.4 vs. 39mg/100g; Na: 40.0 vs. 22mg/100g; P 22.8 vs. 26mg/100g
FPC, BPM, FPM, Ogi and CerelacTM
- Fe: 4.12 ±0.04, 1.83 ±0.01, 1.81 ±0.01, 0.26 ±0.01 and 7.50 ±0.01 mg respectively; Zn: 2.84 ±0.32, 0.16 ±0.01, 0.12 ±0.01, 0.08 ±0.00, and 5.00 ±0.00 mg; Ca: 134.80 ±0.07, 45.87 ±0.02, 85.71 ±0.02, 68.66 ±0.35 and 600.00 ±0.01 mg; Na: 140.71 ±0.45, 137.61 ±0.05, 87.62 ±0.07, 14.56 ±0.04 and 145.00 ±0.00 mg/100g respectively. P: 142.51 ±14.62, 84.12 ±0.02, 73.28 ±0.01, 85.95 ±0.02 and 400.00 ±0.01 mg; Mg: 31.44 ±0,96, 284.40 ±0.02, 285.71 ±0.01, 34.91 ±0.01 and 0.00 mg; K: 122.59 ±1.68, 270.64 ±0.25,122.86 ±0.05, 102.39 ±1.01, and 635.00 ±0.00 mg respectively.
NutrendTM
, Prowena, Propena and yellow maize Ogi - Fe: 74.3, 63.45, 68.45 and 54.2 mg/kg respectively. Zn: 62.5, 57.95, 64.65 and 14.2 mg/kg respectively. Ca: 0.58, 0.47, 0.425 and 0.018 % respectively. Na: 0.305, 0.195, 0.24 and 0.022 % respectively. Mn: 26.65, 29.35, 31.35 and 4.7 mg/kg respectively; Mg: 0.21, 0.22, 0.25 and 0.14 mg/kg respectively; K: 0.4, 0.28, 0.32 and 0.05 % respectively; P: 0.425, 0.35, 0.405 and 0.32 % respectively
Other results The experimental diet had favorable content of iron, sodium phosphorus and calcium, as well as protein, fat and carbs, and energy
Both fermented and blanched experimental mixes had higher protein content but lower energy compared to Cerelac
TM and Ogi. BPM had higher
zinc, iron, potassium, sodium and phosphorous than Cerelac. FPM sample had higher copper, calcium and magnesium than Cerelac.
The CBR2 had similar biological value, net protein utilization, protein efficiency ratio to those of Nutrend
TM.
Higher protein in formulation weaning diets relative to Nutrend
TM and ogi.
Nutrend TM
had higher fat, calcium, potassium, sodium and iron contents than the formulation diets.

41
Table 3.2 Laboratory Studies of Nutrient Composition of CACFs, con’t Author, Year Ijarotimi, 2008
46 Ijarotimi, 2008
45 Eshun, 2011
41
Location/setting Akure, Ondo State, Nigeria Akure, Ondo State, Nigeria Winneba, Ghana
Recruitment strategy
NA NA NA
Sample size (n) NA NA NA
Age NA NA NA
Inclusion/exclusion criteria
NA NA NA
Nature of comparison food
Ogi (maize flour), green banana flour with fermented bambara groundnut flour in 4 different ratios: 90:10 (CBG1), 80:20 (CBG2), 70:30 (CBG3) and 60:40 (CBG4) of cooking banana and BG flour, respectively
Ogi (maize flour) , green banana flour with fermented bambara groundnut flour in 4 different ratios: 90:10 (CBG1), 80:20 (CBG2), 70:30 (CBG3) and 60:40 (CBG4) of cooking banana and BG flour, respectively
Formulation weaning diet: soya beans, groundnut and rice flour mixture
Commercial food NutrendTM
NutrendTM
CerevitaTM
Outcome Several markers of protein quality, macronutrient and energy contents
Amino acid, micronutrient, macronutrient content Macronutrient, energy and micronutrient compositions
Energy or other nutritive value
Ogi, NutrendTM
, CBF: 1,626.97, 1,665.68, 1,569.81 - 1,658.4 kcal.
CBG energy ranged from 1569-1658 kJ, Ogi: 1626, Nutrend: 1665
Macronutrients Ogi, NutrendTM
, CBF - Fat: 0.76 ±0.04, 8.45 ± 0.36, and 6.38 ± 0.3-6.93 ± 0.4 g/100 g respectively; CHO: 88.43, 63.84, and 67.82-73.16 g/100 g; Pro: 5.62 ±0.4, 16.0 ±0.26, and 7.02 ±0.43-15.60 ± 0.23 g/100 g.
CBG, Ogi, Nutrend: Fat: 6.38-6.93g, 0.76g, and 8.45g respectively; CHO: 67.87-73.16, 88.43 and 63.84 g/100g; Pro: 7.02-15.60, 5.62, and 16.00g/100g
Formulated diet vs. CerevitaTM
- Fat: 8.99 vs. 2.49 g/100g; CHO: 67.10 vs. 86.10g/100g; Pro: 15.87 vs. 6.38g/100g.
Micronutrients Ogi, NutrendTM
, CBF - Fe: 0.3, 1.0 and 0.14-0.56 mg/100 g respectively; Zn: NA, 0.7 and 0.01-0.01 mg/100 g; Ca: 51.2, 39.0 and 22.01-34.22 mg/100 g; Na: 40.14, 22.0, and 38.95-78.33mg/100 g; Mg: 14.68, NA, and 66.03-143.71 mg/100 g; K: 52.41, 57.0, and 64.63-85.55 mg/100 g; Mn: NA, NA and 0.11-0.26 mg/100 g; P: 97.4, 22.0, and 45.85-71.72 mg/100 g.
Formulated diet vs. CerevitaTM
- Fe: 19.42 vs. 10.78 mg/100g; Ca: 96.32 vs. 463.43 mg/100g; Mg: 54.44 vs. 493.59 mg/100 g; P: 269.80 vs. 524.82 mg/100g
Other results The experimental blends ranked more favorably in terms of protein quality when compared to the local Ogi weaning food, but were significantly less favorable compared to Nutrend
TM. The 70% of
cooking banana and 30% of BG flour mixed mixture had a nutritional profile that was almost within the range of Nutrend
TM.
The experimental blend was superior to Ogi but not significantly different from Nutrend
TM.
Micronutrient content was also favorable, relative to Nutrend
TM, for some minerals
Formulation diet provided more protein, fat, energy, and iron, but less calcium compared to Cerevita
TM
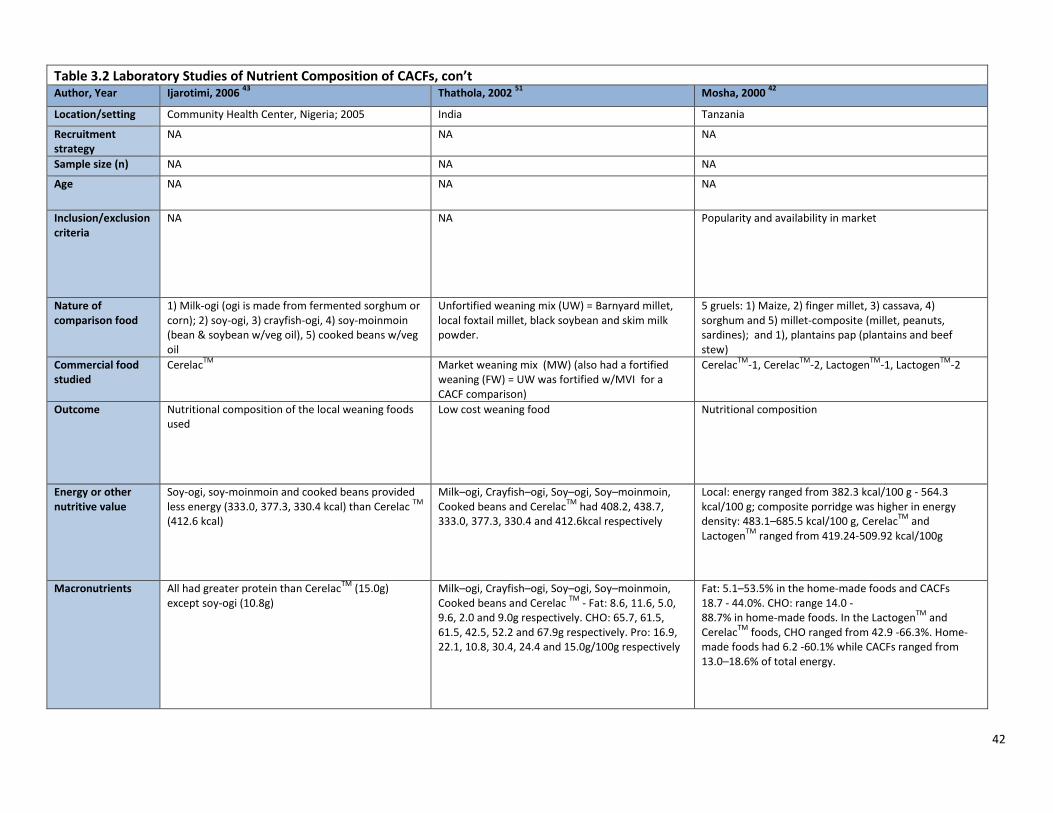
42
Table 3.2 Laboratory Studies of Nutrient Composition of CACFs, con’t Author, Year Ijarotimi, 2006
43 Thathola, 2002
51 Mosha, 2000
42
Location/setting Community Health Center, Nigeria; 2005 India Tanzania
Recruitment strategy
NA NA NA
Sample size (n) NA NA NA
Age NA NA NA
Inclusion/exclusion criteria
NA NA Popularity and availability in market
Nature of comparison food
1) Milk-ogi (ogi is made from fermented sorghum or corn); 2) soy-ogi, 3) crayfish-ogi, 4) soy-moinmoin (bean & soybean w/veg oil), 5) cooked beans w/veg oil
Unfortified weaning mix (UW) = Barnyard millet, local foxtail millet, black soybean and skim milk powder.
5 gruels: 1) Maize, 2) finger millet, 3) cassava, 4) sorghum and 5) millet-composite (millet, peanuts, sardines); and 1), plantains pap (plantains and beef stew)
Commercial food studied
CerelacTM
Market weaning mix (MW) (also had a fortified weaning (FW) = UW was fortified w/MVI for a CACF comparison)
CerelacTM
-1, CerelacTM
-2, LactogenTM
-1, LactogenTM
-2
Outcome Nutritional composition of the local weaning foods used
Low cost weaning food Nutritional composition
Energy or other nutritive value
Soy-ogi, soy-moinmoin and cooked beans provided less energy (333.0, 377.3, 330.4 kcal) than Cerelac
TM
(412.6 kcal)
Milk–ogi, Crayfish–ogi, Soy–ogi, Soy–moinmoin, Cooked beans and Cerelac
TM had 408.2, 438.7,
333.0, 377.3, 330.4 and 412.6kcal respectively
Local: energy ranged from 382.3 kcal/100 g - 564.3 kcal/100 g; composite porridge was higher in energy density: 483.1–685.5 kcal/100 g, Cerelac
TM and
LactogenTM
ranged from 419.24-509.92 kcal/100g
Macronutrients All had greater protein than CerelacTM
(15.0g) except soy-ogi (10.8g)
Milk–ogi, Crayfish–ogi, Soy–ogi, Soy–moinmoin, Cooked beans and Cerelac
TM - Fat: 8.6, 11.6, 5.0,
9.6, 2.0 and 9.0g respectively. CHO: 65.7, 61.5, 61.5, 42.5, 52.2 and 67.9g respectively. Pro: 16.9, 22.1, 10.8, 30.4, 24.4 and 15.0g/100g respectively
Fat: 5.1–53.5% in the home-made foods and CACFs 18.7 - 44.0%. CHO: range 14.0 - 88.7% in home-made foods. In the Lactogen
TM and
CerelacTM
foods, CHO ranged from 42.9 -66.3%. Home-made foods had 6.2 -60.1% while CACFs ranged from 13.0–18.6% of total energy.

43
Table 3.2 Laboratory Studies of Nutrient Composition of CACFs, con’t
Micronutrients Only milk-ogi provided rec'd Ca (267.4mg); soy-moinmoin and cooked beans provided rec'd Fe (17.4, 11.3mg); all were low in vitamin A and C and riboflavin, but all had rec'd levels of Thiamin.
Milk–ogi, Crayfish–ogi, Soy–ogi, Soy–moinmoin, Cooked beans and Cerelac
TM – Fe (mg): 4.2, 4.0,
9.8, 17.4, 11.3 and Not determined respectively; Ca (mg): 267.4, 24.6, 90.3, 227, 22.0 and Not determined respectively; P (mg): 267.8, 216.8, 107.5, 410, 124, and Not determined; Vitamin A (IU): 16.0, 0.0, 0.0, 37.5, 50.2 and Not determined respectively; Thiamine (mg) 0.41, 0.36, 0.46, 0.85, 0.9 and Not determined respectively; Niacin (mg) 2.9, 2.8, 2.98, 1.5, 1.2 and Not determined respectively Vitamin C (mg) 0.01, 0.0, 0.0, 0.0, 0.0 and Not determined respectively; Riboflavin (mg) 0.26, 0.1, 0.14, 0.15, 0.9 and Not determined respectively
Fe: home-made foods between 5.93–23.36 mg/100 g; CACF ranged between 2.50–8.40 mg/100 g. Zn: CACF was higher: 3.42 - 3.80 mg/100 g compared to home-made foods (1.02-2.81 mg/100 g). Ca: highest (429.00–770.00 mg/100 g) in the CACF and lowest (18.47–319.79 mg)/100 g) in home-made foods. Na: home-made: 8.91-3196.99 mg/100 g) CACF: 96.78–411.32 mg/100 g.
Other results UW was superior to CACF in protein (18.37 vs. 15.50), Zn (2.72 vs. NA), and ascorbic acid (74.66 vs. 35), but was lacking in the Fe (4.9 vs. 7.5), and Ca (253.33 vs. 570), and lacked vitamins D and B.
Home-made gruels did not meet the minimum standard for Ca (435.51mg/100g). Cerelac
TM-1 and -2 only did not
meet minimum for Fe (4.84mg/100g). The maize, plantain and millet-composite gruels did not meet the minimum for Zn (2.42mg/100g). All home-made gruels except plantain did not meet min Na (96.78mg/100g). The millet-composite and maize did not meet min Mg (29.03mg/100g). The maize, millet, millet-composite and sorghum did not meet min K (387.12mg/100g). All CACF's and the sorghum gruel met P min (290.34mg/100g). Maize and plantain and Lactogen-1 met ascorbic acid min (38.71mg/100g).
44
3.5 Conclusions Our systematic review of the literature is not able to provide definitive answers to the research questions posed: "Are commercially-available products nutritionally inferior or superior to home-prepared and/or local foods? Do they contain higher or lower amounts of essential micronutrients? Do commercially-available products provide nutrients that are generally lacking in the diets of young children?" CACFs and home-prepared foods are highly heterogeneous in quality. Some CACFs are higher in micronutrients than home-prepared foods owing to micronutrient fortification of CACFs. The CACFs to which local or home-made foods were most often compared were fortified cereals that had higher micronutrient levels, and similar energy density, but lower amounts of protein. CACFs are typically fortified with nutrients such as iron and zinc, which are often missing in the diets of young children. Some locally prepared or home-made foods were nutritionally superior to the CACFs to which they were compared. In particular, home-prepared foods that included animal source ingredients or groundnuts and legumes tended to be higher in protein. Two recent papers excluded from our review because they lacked specific information on specific nutrients are of potential interest because they address dietary variety, which has been linked to diet quality and nutrient adequacy. A study of participants in the US Supplemental Nutrition Program for Women, Infants, and Children (WIC) found that 81% of infants age 6-12 months received commercial baby foods, and these infants consumed a significantly greater variety of fruits and vegetables compared to infants who did not consume commercial baby foods.53 The second paper studied participants in the DONALD study in Germany, and also found that at 12 months, infants fed with commercial infant meals had a higher vegetable variety.54 Do they contain higher or lower amounts of trans-fat, saturated fat, free sugars, or salt? There was limited information based on direct comparison of CACFs to comparable home-prepared foods. Only one study directly compared the fat composition of a CACF to a directly comparable home-prepared food, and found that lamb processed as baby food had a less favorable fatty acid profile than freshly cooked lamb. We found no assessment of trans fat in CACFs for infants. The parameters of the review required comparison of CACFs to similar home or locally prepared foods. While many studies assessed nutritional quality of CFs, relatively few made this direct comparison, and few identified specific CACFs. An informative alternate approach to gain insights about the nutritional quality of CACFs would be to compare their nutrient composition to a standard, such as recommended dietary allowances or estimated average requirements. Several studies have examined the nutrition quality of CACFs for infants in high income countries, and found that a high percentage of foods, particularly mixed dishes, infant snacks and dessert items to be high in added sugars or salt, as well as added fats. 30,37,55,56

45
PART 4. RESEARCH QUESTION 4 Are the portion sizes of commercially-available products greater than would be appropriate based on age? 4.1 Background There are currently no universally agreed-upon age-specific portion size definitions or recommendations for children under 2 years. Different organizations such as the American Academy of Pediatrics or the Special Supplemental Nutrition Program for Women, Infants and Children (WIC) program in the US recommend amounts of foods to be fed to infants of different ages, and the WHO has guiding principles for amounts of food to be fed at different ages, but specific portion sizes are not defined. CACFs are sold in single and multi-serving packages, and the unit volume of CACFs may vary by manufacture and setting. In addition, many CACFs are instant foods such as cereals that require addition of water or milk. The portion of the product used by caregivers can therefore vary substantially according to both the dilution and the amount she chooses to feed. Infants and young children are able to self-regulate their intake if caregivers are responsive to their satiety cues, 1,57 but caregivers might feel the need to feed the entire portion (or more from multi-portion packages) of CACFs, potentially leading to overfeeding. 4.2 Objective The objective for Q4 is to review evidence on the appropriateness of the portion sizes of commercially-available complementary food with respect to age. 4.3 Methods 4.3.1 Criteria for considering studies We did not restrict our search by study design. Studies had to include evidence on foods for infants and young children, ages 6-23 months. The main exposure was advertised portion size of commercially-available complementary foods (CACFs) compared to the age appropriate, recommended portion size of complementary food products. 4.3.2 Search method strategies for identification of studies 4.3.2.1 Electronic searches The following electronic databases were searched to identify relevant studies:
PubMed (2000 – 21 April 2015)
CINAHL plus (2000 – 21 April 2015)
EMBASE (2000 – 21 April 2015)
Agricola (2000 – 21 April 2015)
CAS (2000 – 21 April 2015)
Clinicaltrials.gov (2000 – 21 April 2015)
Cochrane (2000 – 21 April 2015)
Global Health (2000 – 21 April 2015)
WHO Global Library (2000 – 21 April 2015)
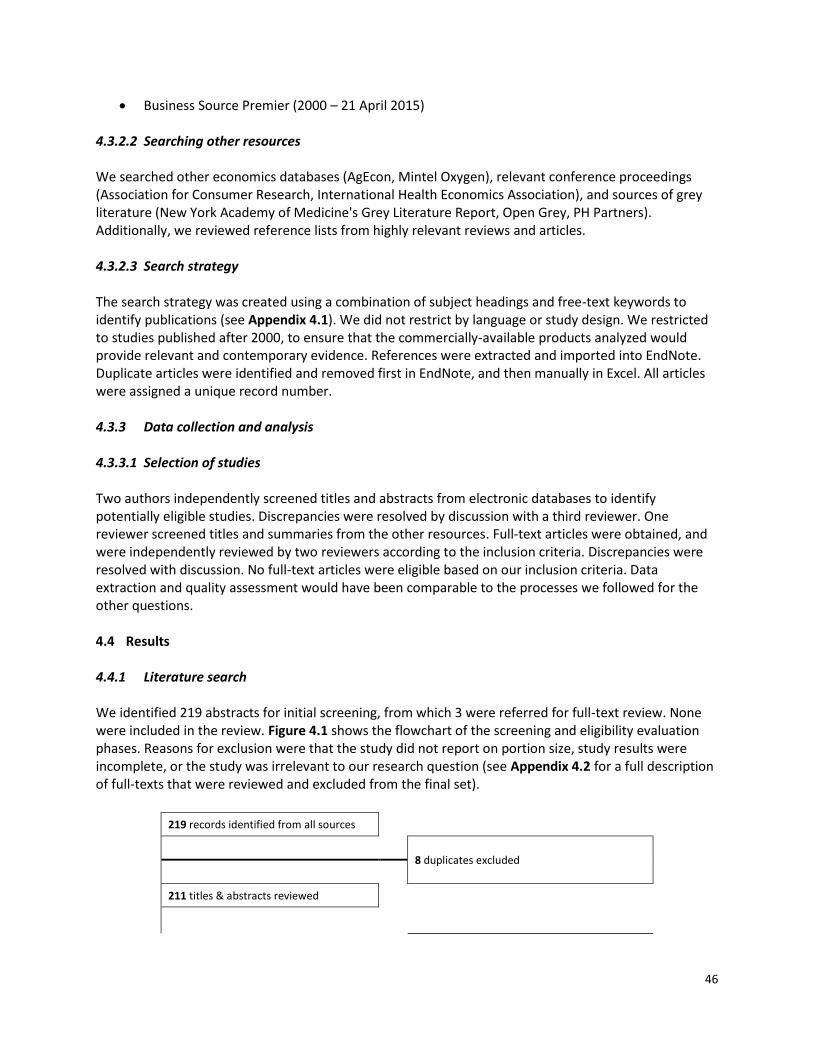
46
Business Source Premier (2000 – 21 April 2015) 4.3.2.2 Searching other resources We searched other economics databases (AgEcon, Mintel Oxygen), relevant conference proceedings (Association for Consumer Research, International Health Economics Association), and sources of grey literature (New York Academy of Medicine's Grey Literature Report, Open Grey, PH Partners). Additionally, we reviewed reference lists from highly relevant reviews and articles. 4.3.2.3 Search strategy The search strategy was created using a combination of subject headings and free-text keywords to identify publications (see Appendix 4.1). We did not restrict by language or study design. We restricted to studies published after 2000, to ensure that the commercially-available products analyzed would provide relevant and contemporary evidence. References were extracted and imported into EndNote. Duplicate articles were identified and removed first in EndNote, and then manually in Excel. All articles were assigned a unique record number. 4.3.3 Data collection and analysis 4.3.3.1 Selection of studies Two authors independently screened titles and abstracts from electronic databases to identify potentially eligible studies. Discrepancies were resolved by discussion with a third reviewer. One reviewer screened titles and summaries from the other resources. Full-text articles were obtained, and were independently reviewed by two reviewers according to the inclusion criteria. Discrepancies were resolved with discussion. No full-text articles were eligible based on our inclusion criteria. Data extraction and quality assessment would have been comparable to the processes we followed for the other questions. 4.4 Results 4.4.1 Literature search We identified 219 abstracts for initial screening, from which 3 were referred for full-text review. None were included in the review. Figure 4.1 shows the flowchart of the screening and eligibility evaluation phases. Reasons for exclusion were that the study did not report on portion size, study results were incomplete, or the study was irrelevant to our research question (see Appendix 4.2 for a full description of full-texts that were reviewed and excluded from the final set).
219 records identified from all sources
8 duplicates excluded
211 titles & abstracts reviewed

47
3 full-text records to be reviewed
3 full-text records reviewed
3 1 1 1
Full-text articles excluded Portion size not reported Incomplete data Irrelevant
0 publications included
Figure 4.3. Flow chart of review process
4.5 Conclusions Our systematic review of the literature is not able to provide an answer to the research question posed: "Are the portion sizes of commercially-available products greater than would be appropriate based on age?" There is currently no evidence on the appropriateness of the portion size of commercially-available complementary foods. The dearth of studies in this area highlights a critical research gap regarding the health impacts of the consumption commercially-available complementary foods. A key limitation is that serving sizes have not been established for children under 2 yrs, due to the dynamic and unique dietary needs of this age demographic. Therefore, any studies that do assess portion size do not have a referent against which to compare results. The USDA has also identified the need for stronger dietary guidance in this age group, and is currently working on creating dietary guidelines for infants and young children under 2. 58 Part of the evidence building process is a call for systematic reviews and data in priority research areas. One such priority is how portion size affects dietary preferences and intake. 59
48
PART 5. RESEARCH QUESTION 5 Do commercially-available products reduce the risk of stunting, anemia, or micronutrient deficiencies? 5.1 Background Stunting, anemia, and micronutrient deficiencies continue to affect millions of children worldwide. 60 Introduction of appropriate CFs should include foods that provide sufficient energy and micronutrients to promote optimal growth and development, while being affordable and sustainable. In LMIC, traditional CFs introduced at 6 months are often of poor quality with inadequate energy and micronutrient density to complement breastfeeding. 61 Additionally, while iron stores at birth may be adequate for the prevention of iron deficiency in the first few months of life, iron-rich foods are needed during the weaning period. 62 CACFs, many of which are micronutrient fortified or energy-dense by design, have been suggested as a method to improve infant growth and nutritional status. There is little evidence that directly compares CACFs to comparable home-prepared or local CFs. 5.2 Objective The objective for Q5 is to review evidence on the risk reduction of stunting, anemia, or micronutrient deficiencies with commercially-available food products versus home-made or local complementary food products. 5.3 Methods 5.3.1 Criteria for considering studies We did not restrict our search by study design. We included studies of infants and young children, ages 6-23 months. The main exposure was consumption of CACFs, compared to consumption of home-prepared or local complementary foods. Outcomes were stunting, anemia, or micronutrient deficiencies (including but not limited to iron, zinc, and vitamin A). Lipid-based nutrient supplements (LNS), "fortified spreads", and micronutrient powders are considered in a separate systematic review, and therefore are not included in our review. We also did not include therapeutic foods or foods specifically formulated for research studies, but not commercially-available or typically made at home. 5.3.2 Search method strategies for identification of studies 5.3.2.1 Electronic searches The following electronic databases were searched to identify relevant studies:
PubMed (2000 – 17 Apr 2015)
CINAHL plus (2000 – 18 Apr 2015)
EMBASE (2000 – 17 Apr 2015)
Agricola (2000 – 18 Apr 2015)
CAS (2000 – 18 Apr 2015)
Clinicaltrials.gov (2000 – 18 Apr 2015)

49
Cochrane (2000 – 18 Apr 2015)
Global Health (2000 – 18 Apr 2015)
WHO Global Library (2000 – 18 Apr 2015)
Business Source Premier (2000 – 18 Apr 2015) 5.3.2.2 Searching other resources We searched other economics databases (AgEcon, Mintel Oxygen), relevant conference proceedings (Association for Consumer Research, International Health Economics Association), and sources of grey literature (New York Academy of Medicine's Grey Literature Report, Open Grey, PH Partners). Additionally, we reviewed reference lists from highly relevant reviews and articles. 5.3.2.3 Search strategy The search strategy was created using a combination of subject headings and free-text keywords to identify publications (see Appendix 5.1). We did not restrict by language or study design. We restricted to studies published after 2000, to ensure that the commercially-available products analyzed would provide relevant and contemporary evidence. References were extracted and imported into EndNote. Duplicate articles were identified and removed first in EndNote, and then manually in Excel. All articles were assigned a unique record number. 5.3.3 Data collection and analysis 5.3.3.1 Selection of studies Two reviewers each screened one-half the titles and abstracts from electronic databases to identify potentially eligible studies. Prior to starting the work, inter-rater agreement was assessed by screening a subset of titles and abstracts and calculating Cohen's Kappa. All studies identified as possibly being eligible for inclusion were screened by a third reviewer for a final decision. Two reviewers screened titles and summaries from the other resources. Full-text articles were obtained, and were independently reviewed by two reviewers according to the inclusion criteria. Discrepancies were resolved with discussion. When the full-text was not available in English it was excluded. 5.3.3.2 Data extraction Excel workbooks created for systematic review data management were utilized in the abstract screening and full-text review process. 6 Record numbers, titles, and abstracts were exported from EndNote into the Excel workbook, and all title and abstract screening and full-text review took place within Excel. Comments on reasons for full-text exclusions were noted in a separate file. Each reviewer had her own Excel workbook, to keep the review process blinded. One reviewer extracted data into standardized tables. Information was extracted on: general study characteristics (design, location/setting, recruitment strategy), participant characteristics (sample size, age, inclusion/exclusion criteria), description of the commercially-available complementary food and comparison foods, outcome, and results. Two separate risk of bias assessment tables were created (for RCTs vs. observational studies). Tables were reviewed by another reviewer. 5.3.3.3 Assessment of risk bias and quality in included studies
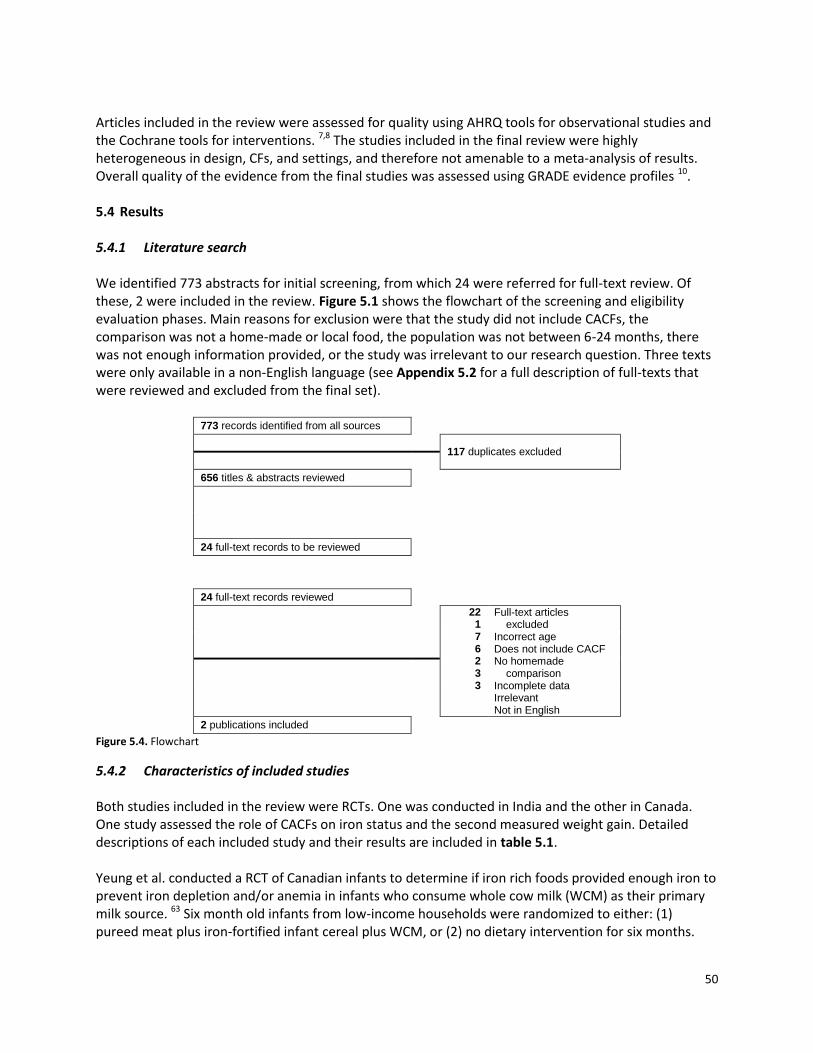
50
Articles included in the review were assessed for quality using AHRQ tools for observational studies and the Cochrane tools for interventions. 7,8 The studies included in the final review were highly heterogeneous in design, CFs, and settings, and therefore not amenable to a meta-analysis of results. Overall quality of the evidence from the final studies was assessed using GRADE evidence profiles 10. 5.4 Results 5.4.1 Literature search We identified 773 abstracts for initial screening, from which 24 were referred for full-text review. Of these, 2 were included in the review. Figure 5.1 shows the flowchart of the screening and eligibility evaluation phases. Main reasons for exclusion were that the study did not include CACFs, the comparison was not a home-made or local food, the population was not between 6-24 months, there was not enough information provided, or the study was irrelevant to our research question. Three texts were only available in a non-English language (see Appendix 5.2 for a full description of full-texts that were reviewed and excluded from the final set).
773 records identified from all sources
117 duplicates excluded
656 titles & abstracts reviewed
24 full-text records to be reviewed
24 full-text records reviewed
22 1 7 6 2 3 3
Full-text articles excluded
Incorrect age Does not include CACF No homemade
comparison Incomplete data Irrelevant Not in English
2 publications included Figure 5.4. Flowchart
5.4.2 Characteristics of included studies Both studies included in the review were RCTs. One was conducted in India and the other in Canada. One study assessed the role of CACFs on iron status and the second measured weight gain. Detailed descriptions of each included study and their results are included in table 5.1. Yeung et al. conducted a RCT of Canadian infants to determine if iron rich foods provided enough iron to prevent iron depletion and/or anemia in infants who consume whole cow milk (WCM) as their primary milk source. 63 Six month old infants from low-income households were randomized to either: (1) pureed meat plus iron-fortified infant cereal plus WCM, or (2) no dietary intervention for six months.
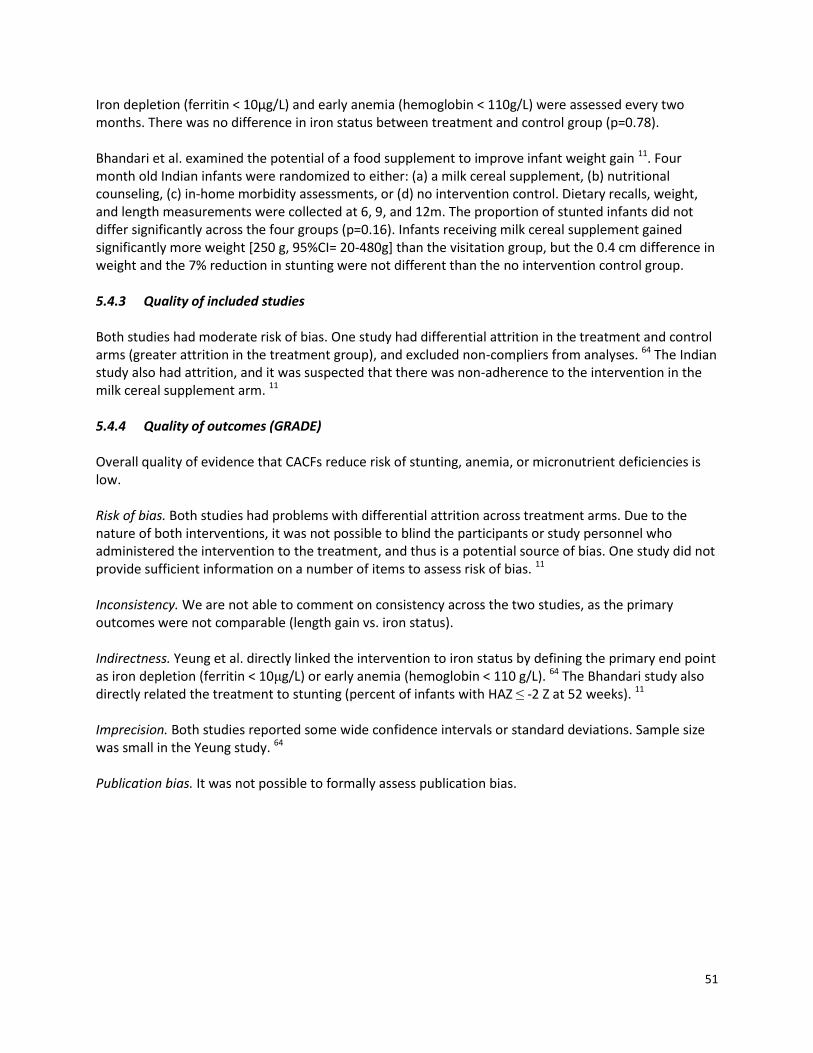
51
Iron depletion (ferritin < 10μg/L) and early anemia (hemoglobin < 110g/L) were assessed every two months. There was no difference in iron status between treatment and control group (p=0.78). Bhandari et al. examined the potential of a food supplement to improve infant weight gain 11. Four month old Indian infants were randomized to either: (a) a milk cereal supplement, (b) nutritional counseling, (c) in-home morbidity assessments, or (d) no intervention control. Dietary recalls, weight, and length measurements were collected at 6, 9, and 12m. The proportion of stunted infants did not differ significantly across the four groups (p=0.16). Infants receiving milk cereal supplement gained significantly more weight [250 g, 95%CI= 20-480g] than the visitation group, but the 0.4 cm difference in weight and the 7% reduction in stunting were not different than the no intervention control group. 5.4.3 Quality of included studies Both studies had moderate risk of bias. One study had differential attrition in the treatment and control arms (greater attrition in the treatment group), and excluded non-compliers from analyses. 64 The Indian study also had attrition, and it was suspected that there was non-adherence to the intervention in the milk cereal supplement arm. 11 5.4.4 Quality of outcomes (GRADE) Overall quality of evidence that CACFs reduce risk of stunting, anemia, or micronutrient deficiencies is low. Risk of bias. Both studies had problems with differential attrition across treatment arms. Due to the nature of both interventions, it was not possible to blind the participants or study personnel who administered the intervention to the treatment, and thus is a potential source of bias. One study did not provide sufficient information on a number of items to assess risk of bias. 11 Inconsistency. We are not able to comment on consistency across the two studies, as the primary outcomes were not comparable (length gain vs. iron status). Indirectness. Yeung et al. directly linked the intervention to iron status by defining the primary end point as iron depletion (ferritin < 10μg/L) or early anemia (hemoglobin < 110 g/L). 64 The Bhandari study also directly related the treatment to stunting (percent of infants with HAZ ≤ -2 Z at 52 weeks). 11 Imprecision. Both studies reported some wide confidence intervals or standard deviations. Sample size was small in the Yeung study. 64 Publication bias. It was not possible to formally assess publication bias.
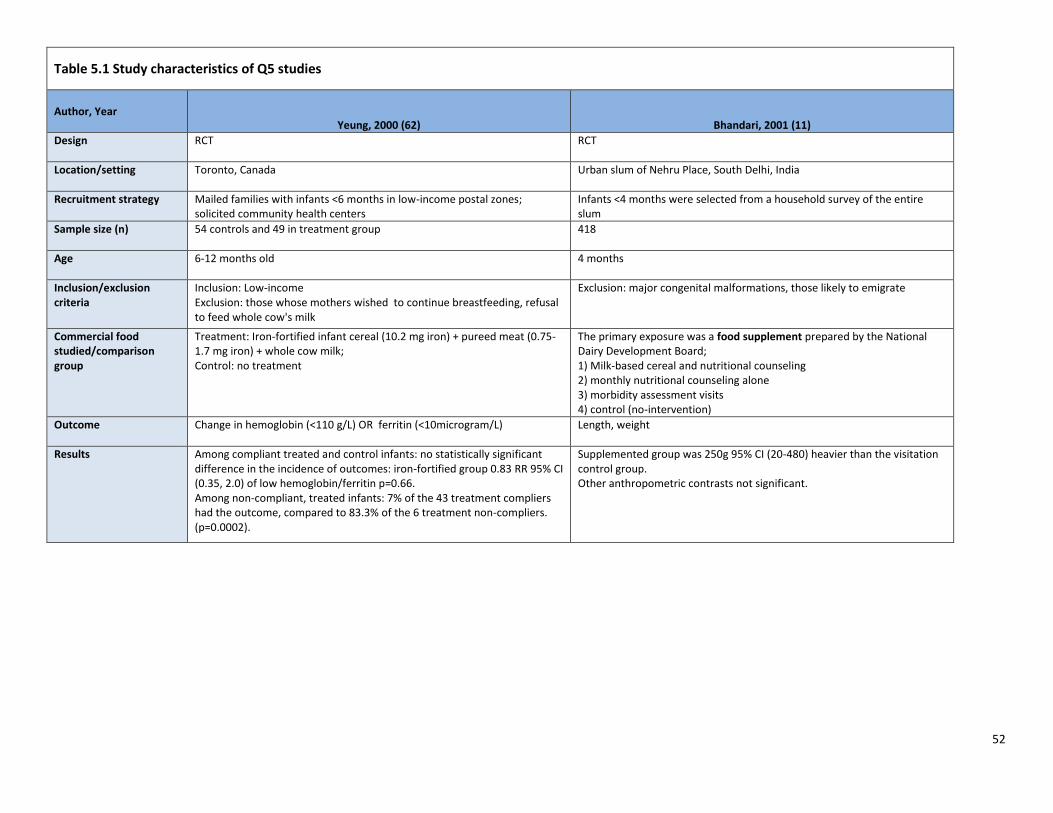
52
Table 5.1 Study characteristics of Q5 studies
Author, Year Yeung, 2000 (62) Bhandari, 2001 (11)
Design RCT RCT
Location/setting Toronto, Canada Urban slum of Nehru Place, South Delhi, India
Recruitment strategy Mailed families with infants <6 months in low-income postal zones; solicited community health centers
Infants <4 months were selected from a household survey of the entire slum
Sample size (n) 54 controls and 49 in treatment group 418
Age 6-12 months old 4 months
Inclusion/exclusion criteria
Inclusion: Low-income Exclusion: those whose mothers wished to continue breastfeeding, refusal to feed whole cow's milk
Exclusion: major congenital malformations, those likely to emigrate
Commercial food studied/comparison group
Treatment: Iron-fortified infant cereal (10.2 mg iron) + pureed meat (0.75-1.7 mg iron) + whole cow milk; Control: no treatment
The primary exposure was a food supplement prepared by the National Dairy Development Board; 1) Milk-based cereal and nutritional counseling 2) monthly nutritional counseling alone 3) morbidity assessment visits 4) control (no-intervention)
Outcome Change in hemoglobin (<110 g/L) OR ferritin (<10microgram/L) Length, weight
Results Among compliant treated and control infants: no statistically significant difference in the incidence of outcomes: iron-fortified group 0.83 RR 95% CI (0.35, 2.0) of low hemoglobin/ferritin p=0.66. Among non-compliant, treated infants: 7% of the 43 treatment compliers had the outcome, compared to 83.3% of the 6 treatment non-compliers. (p=0.0002).
Supplemented group was 250g 95% CI (20-480) heavier than the visitation control group. Other anthropometric contrasts not significant.

53
Table 5.1, cont'd Risk of bias assessment
Author, Year Yeung, 2000 (62) Bhandari, 2001 (11)
Sequence generation Low risk: Random number generator Low risk: First stratified by WHZ and then randomly assigned to one of four study groups
Allocation concealment Moderate risk: Concealed treatment assignment from participants until after randomization
Unclear risk: Not described
Blinding Moderate risk: Not blinded: parents and field nurses Blinded: laboratory technicians and data analysts
Unclear risk: Not described
Attrition/incomplete outcome
Moderate risk: Initial sample selected: 79 controls, 79 treated Final analytical sample: 54 controls and 49 treated
Moderate risk: Between 7-13% contributed no anthropometric data to the final survey at 52 weeks
Selective outcome reporting
High risk: Non-compliant individuals were excluded from analysis (did not do intent-to-treat analysis)
Low risk: No
Other sources of bias 1) Post-randomization, more mothers from the treatment group withdrew relative to the control group due to deciding to continue to breastfeed or were unwilling to feed whole cow milk 2) Education was related to treatment group assignment (control feeding patterns were more adherent to the guidelines of the Canadian Pediatric Society than expected, and therefore not representative of a 'true' low-income control)
Over-reporting of supplement use: so the null findings may be because those randomized to the treatment group did not actually take the treatment.
OVERALL QUALITY ASSESSMENT
Low Low

54
5.5 Conclusions Our systematic review of the literature is not able to provide definitive answers to the research questions posed: "Do commercially-available products reduce the risk of stunting, anemia, or micronutrient deficiencies?" In RCTs of CACFs (excluding LNS and similar products), there is low evidence that these products reduce the risk of stunting, anemia, or micronutrient deficiencies. The combination of iron-fortified infant cereal, pureed meat, and whole cow milk did not significantly reduce the incidence of iron depletion in Canadian infants, compared to a usual diet. Consumption of a milk-based cereal did not significantly reduce the proportion of stunted Indian infants compared to a usual diet (control group). There were no other studies that specifically address CACFs and their relation to stunting, anemia, or micronutrient deficiencies. A large number of studies assess the role of LNS on stunting, anemia, or micronutrient deficiencies, but that was outside the scope of our review. In many LMICs, local research groups are formulating novel products from locally sourced ingredients in an attempt to produce a CF that is affordable, hygienic, and highly nutritious. However, there is no clear plan on how to get these products into the commercial market, or how well they would be received by mothers. A critical limitation of existing studies is that many CFs assessed were not explicitly called out as either a CACF or a home-made/local product, resulting in ambiguity regarding the nature of the CF.

55
Appendix 1.1 Search terms for PubMed for question 1
1 Search infant food[MeSH Terms]
2 Search infant food*[Text Word]
3 Search baby food*[Text Word]
4 Search toddler food*[Text Word]
5 Search solid food*[Text Word]
6 Search weaning food*[Text Word]
7 Search complementary food*[Text Word]
8 Search complementary feed*[Text Word]
9 Search (((((((infant food[MeSH Terms]) OR infant food*[Text Word]) OR baby food*[Text Word]) OR toddler food*[Text Word]) OR solid food*[Text Word]) OR weaning food*[Text Word]) OR complementary food*[Text Word]) OR complementary feed*[Text Word]
10 Search commercial[Text Word]
11 Search industrial*[Text Word]
12 Search ready prepared[Text Word]
13 Search package*
14 Search package*[Text Word]
15 Search process*[Text Word]
16 Search ultraprocess*[Text Word]
17 Search ready to eat[Text Word]
18 Search ready to use[Text Word]
19 Search ready to feed[Text Word]
20 Search food product[Text Word]
21 Search designer[Text Word]
22 Search baby food[Text Word]
23 Search market[Text Word]
24 Search jar*[Text Word]
25 Search manufactur*[Text Word]
26 Search follow on[Text Word]
27 Search growing up milk[Text Word]

56
Appendix 1.1, con’t
28
Search ((((((((((((((((commercial[Text Word]) OR industrial*[Text Word]) OR ready prepared[Text Word]) OR package*[Text Word]) OR process*[Text Word]) OR ultraprocess*[Text Word]) OR ready to eat[Text Word]) OR ready to use[Text Word]) OR ready to feed[Text Word]) OR food product[Text Word]) OR designer[Text Word]) OR baby food[Text Word]) OR market[Text Word]) OR jar*[Text Word]) OR manufactur*[Text Word]) OR follow on[Text Word]) OR growing up milk[Text Word]
29
Search (((((((((infant food[MeSH Terms]) OR infant food*[Text Word]) OR baby food*[Text Word]) OR toddler food*[Text Word]) OR solid food*[Text Word]) OR weaning food*[Text Word]) OR complementary food*[Text Word]) OR complementary feed*[Text Word])) AND (((((((((((((((((commercial[Text Word]) OR industrial*[Text Word]) OR ready prepared[Text Word]) OR package*[Text Word]) OR process*[Text Word]) OR ultraprocess*[Text Word]) OR ready to eat[Text Word]) OR ready to use[Text Word]) OR ready to feed[Text Word]) OR food product[Text Word]) OR designer[Text Word]) OR baby food[Text Word]) OR market[Text Word]) OR jar*[Text Word]) OR manufactur*[Text Word]) OR follow on[Text Word]) OR growing up milk[Text Word])
30 Search breast feeding[MeSH Terms]
31 Search infant nutritional physiological phenomena[MeSH Terms]
32 Search breast feed*[Text Word]
33 Search breastfeed*[Text Word]
34 Search breast milk*[Text Word]
35 Search breastmilk*[Text Word]
36 Search (((((breast feeding[MeSH Terms]) OR infant nutritional physiological phenomena[MeSH Terms]) OR breast feed*[Text Word]) OR breastfeed*[Text Word]) OR breast milk*[Text Word]) OR breastmilk*[Text Word]
37
Search (((((((((((infant food[MeSH Terms]) OR infant food*[Text Word]) OR baby food*[Text Word]) OR toddler food*[Text Word]) OR solid food*[Text Word]) OR weaning food*[Text Word]) OR complementary food*[Text Word]) OR complementary feed*[Text Word])) AND (((((((((((((((((commercial[Text Word]) OR industrial*[Text Word]) OR ready prepared[Text Word]) OR package*[Text Word]) OR process*[Text Word]) OR ultraprocess*[Text Word]) OR ready to eat[Text Word]) OR ready to use[Text Word]) OR ready to feed[Text Word]) OR food product[Text Word]) OR designer[Text Word]) OR baby food[Text Word]) OR market[Text Word]) OR jar*[Text Word]) OR manufactur*[Text Word]) OR follow on[Text Word]) OR growing up milk[Text Word]))) AND ((((((breast feeding[MeSH Terms]) OR infant nutritional physiological phenomena[MeSH Terms]) OR breast feed*[Text Word]) OR breastfeed*[Text Word]) OR breast milk*[Text Word]) OR breastmilk*[Text Word]) Sort by: PublicationDate
38 Search ("2000"[Date - Publication] : "3000"[Date - Publication])
39
Search (((((((((((((infant food[MeSH Terms]) OR infant food*[Text Word]) OR baby food*[Text Word]) OR toddler food*[Text Word]) OR solid food*[Text Word]) OR weaning food*[Text Word]) OR complementary food*[Text Word]) OR complementary feed*[Text Word])) AND (((((((((((((((((commercial[Text Word]) OR industrial*[Text Word]) OR ready prepared[Text Word]) OR package*[Text Word]) OR process*[Text Word]) OR ultraprocess*[Text Word]) OR ready to eat[Text Word]) OR ready to use[Text Word]) OR ready to feed[Text Word]) OR food product[Text Word]) OR designer[Text Word]) OR baby food[Text Word]) OR market[Text Word]) OR jar*[Text Word]) OR manufactur*[Text Word]) OR follow on[Text Word]) OR growing up milk[Text Word]))) AND ((((((breast feeding[MeSH Terms]) OR infant nutritional physiological phenomena[MeSH Terms]) OR breast feed*[Text Word]) OR breastfeed*[Text Word]) OR breast milk*[Text Word]) OR breastmilk*[Text Word]))) AND ("2000"[Date - Publication] : "3000"[Date - Publication])

57
Appendix 1.2 Q1 Papers excluded after full text review Title Exclusion
Reason Setting Notes
Adherence with early infant feeding and complementary feeding guidelines in the Cork BASELINE Birth Cohort Study
65
BF outcome not quantifiable
Ireland Focuses on introduction of CF at <17 vs. >17 weeks. Good description of feeding patterns, details on what is fed, including CACFs and follow-on formula, and "hungry baby milk", but no study of how CF relates to BF; notes BF initiation and duration but not in relation to CF
Comparison of Food Intake Among Infants and Toddlers Participating in a South Central Texas WIC Program Reveals Some Improvements After WIC Package Changes
66
Doesn't include CACF
USA Outcome is breastfeeding duration, and exposure is differences in WIC package for 6-12 mo. infants. Might be able to infer use of CFPs, but they are not quantified.
Determinants of timely initiation of complementary feeding among children aged 6-24 months in Sagamu, Nigeria
67
BF is not the outcome
Nigeria Study aimed to identify socio-demographic factors which may influence initiation of CF under-five y Nigerian children, description of practices but no analysis of how CF relates to BF. Shows that early EBF is associated with later CF initiation (not our direction of interest)
Consumption of highly processed snacks, sugar-sweetened beverages and child feeding practices in a rural area of Nicaragua
68
Doesn't include CACF
Nicaragua Reports detailed information about a large number of specific foods, including snacks, sugar-sweetened beverages, but not specific infant foods. % contribution to recommended intakes is quantified, but there is no comparison to breastfeeding. CACFs include sweet crispy snacks and sugar-sweetened beverages.
Mixed-methods study identifies key strategies for improving infant and young child feeding practices in a highly stunted rural indigenous population in Guatemala
69
Irrelevant Guatemala Mixed methods; reports prevalence of BF; doesn't related BF to CACF
A comparison of infant and toddler feeding practices of mothers with and without histories of eating disorders
70
Irrelevant USA Infant feeding styles questionnaire reveals attitudes, practices of women with and without eating disorders. Not generalizable to broader population
Current infant feeding practices and impact on growth in babies during the second half of infancy
71
Doesn't include CACF
Sri Lanka Study focus is on growth faltering. Outcome is child growth indicators. Reports on % of children receiving CACFs, but does not relate this information to breastfeeding
Growth and HIV-free survival of HIV-exposed infants in Malawi: a randomized trial of two complementary feeding interventions in the context of maternal antiretroviral therapy
72
Irrelevant Malawi Compares Ready-to-use-food to milk powder (both commercially are CFPs), does not relate their consumption to breast-feeding, outcome is infant growth.
Exclusive breastfeeding, complementary feeding, and food choices in UK infants
73
Irrelevant Relates BF at age 3m to complementary feeding at 8-10m (mismatch of ages for our purposes)
Complementary feeding of infants in their first year of life: focus on the main pureed baby foods
74
Doesn't include CACF
Brazil Evaluation in children 4-9 mo old, focuses on pureed foods, but all are home-made. Outcome is adherence to CF recommendations for Brazil
Breastfeeding infants with phenylketonuria in the United States and Canada 75
Irrelevant USA, Canada Focuses on breastfeeding duration, % of infants receiving formula, in a specialized population: All have PKU.
Cross-border promotion of formula milk in Lao People's Democratic Republic 76
Doesn't include CACF
Laos Qualitative study of mother's attitudes about infant formula use. No specific mention of follow-on or other CACFs

58
Title Exclusion Reason
Setting Notes
Baby food giants accused of wooing mothers in India off breastfeeding 77
Irrelevant UK Brief commentary/BJN news item on infant formula and cereals
Changing WIC changes what children eat 78
Doesn't include CACF
USA Reports on time trends in prevalence of feeding patterns (fruits and vegetables, grains, milks, etc.) Notes age at introduction of solid foods. QRE does not allow identification of CACFs
Infant feeding patterns over the first year of life: influence of family characteristics
79
Can't isolate CACF from other feeding patterns
France CACFs are included in dietary pattern which is found to be inversely associated with a predominant breast-feeding-focused pattern. CA -- 1st pattern is CACF ("ready prepared vegetables, fruit purees, baby main meals") plus shorter BF duration
Emerging trends in breastfeeding practices in Singaporean Chinese women: findings from a population-based study
80
Doesn't include CACF
Singapore Reports breastfeeding initiation rates and duration, % of women using formula or expressed milk. No information on specific use of CACFs
Dietary characteristics of complementary foods offered to Guatemalan infants vary between urban and rural settings
81
Outcome isn't BF
Guatemala Detailed description of all CFs fed to infants, including brand names. Commercial and non-commercial CFs are noted, with brand names. All infants are breastfed, but no quantification of breastfeeding relative to CF intake. Grouping systems for foods are infant v family foods / modern v traditional / processed v non-processed);
Preliminary data from demographic and health surveys on infant feeding in 20 developing countries
82
Doesn't include CACF
Cross country study Uses DHS data to describe country level prevalence of breastfeeding and age specific prevalence of feeding "solid foods". CACFs not specifically noted.
Special Supplemental Nutrition Program for Women, Infants, and Children and infant feeding practices
83
Doesn’t include CACF
USA This is a program evaluation of how WIC participation relates to rates of exclusive breast-feeding, timing of introduction of solid foods. No specific CACFs included but program participation was associated with decreased likelihood of adherence to AAP feeding guidelines.
Patterns of breastfeeding in a UK longitudinal cohort study 84
Doesn't include CACF
UK Prevalence of different feeding patterns, purely descriptive. Groups are broadly categorized: all formulas and all CFs are grouped, so not CACFs can be identified.
Weaning foods and their impact on child-feeding practices among low-income Nigerian mothers
43
Outcome isn't BF
Nigeria Cross sectional study that examines utilization of local foods and analyzes their composition. Commercial products are compared in terms of composition (dried milk, Cerelac) but are not studied in relation to breastfeeding duration, frequency, or to breast milk intake.
What influences the timing of the introduction of solid food to infants? 85
Wrong age Scotland Infants are 4 months old. Study is focused on early introduction of solid foods. Does not study breastfeeding as outcome, nor does it identify CACF aside from formula
Breastfeeding practices in Mostar, Bosnia and Herzegovina: cross-sectional self-report study
86
Doesn't include CACF
Eastern Europe Purely descriptive study of prevalence of breastfeed and CF practices, along with mother's stated reasons for their feeding decisions
Infant-feeding practices of mothers of known HIV status in Lusaka, Zambia 87
Doesn't include CACF
Zambia Breastfeeding in HIV infected women. CFs are noted in general with no specific CACFs mentioned beyond "formula'.
Complementary feeding patterns in Pondok Labu, South Jakarta, Indonesia 88
BF outcome not quantifiable
Indonesia Tests hypothesis that insufficient breast milk is a common reason for introducing CF, also focuses on timing of introduction of CF. Study is in 4-6 mo old infants, and data were collected prior to 1998. Notes timing of introduction of "instant cereals".
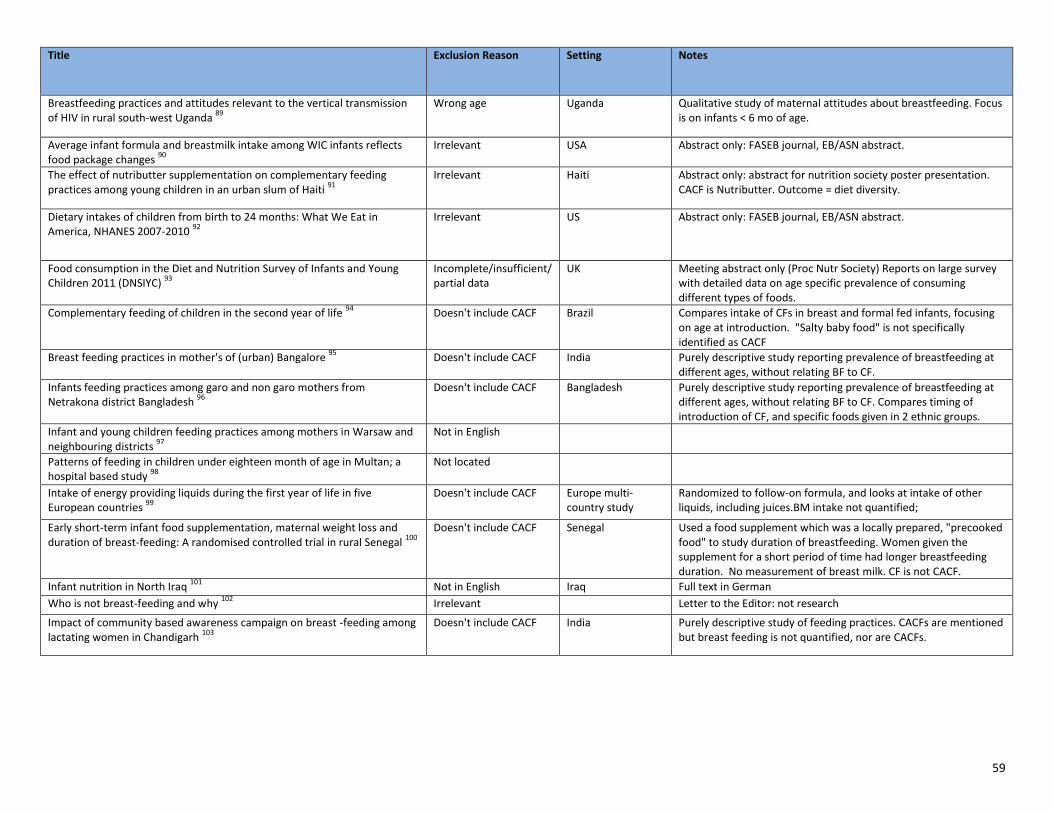
59
Title Exclusion Reason Setting Notes
Breastfeeding practices and attitudes relevant to the vertical transmission of HIV in rural south-west Uganda
89
Wrong age Uganda Qualitative study of maternal attitudes about breastfeeding. Focus is on infants < 6 mo of age.
Average infant formula and breastmilk intake among WIC infants reflects food package changes
90
Irrelevant USA Abstract only: FASEB journal, EB/ASN abstract.
The effect of nutributter supplementation on complementary feeding practices among young children in an urban slum of Haiti
91
Irrelevant Haiti Abstract only: abstract for nutrition society poster presentation. CACF is Nutributter. Outcome = diet diversity.
Dietary intakes of children from birth to 24 months: What We Eat in America, NHANES 2007-2010
92
Irrelevant US Abstract only: FASEB journal, EB/ASN abstract.
Food consumption in the Diet and Nutrition Survey of Infants and Young Children 2011 (DNSIYC)
93
Incomplete/insufficient/ partial data
UK Meeting abstract only (Proc Nutr Society) Reports on large survey with detailed data on age specific prevalence of consuming different types of foods.
Complementary feeding of children in the second year of life 94
Doesn't include CACF Brazil Compares intake of CFs in breast and formal fed infants, focusing on age at introduction. "Salty baby food" is not specifically identified as CACF
Breast feeding practices in mother's of (urban) Bangalore 95
Doesn't include CACF India Purely descriptive study reporting prevalence of breastfeeding at different ages, without relating BF to CF.
Infants feeding practices among garo and non garo mothers from Netrakona district Bangladesh
96
Doesn't include CACF Bangladesh Purely descriptive study reporting prevalence of breastfeeding at different ages, without relating BF to CF. Compares timing of introduction of CF, and specific foods given in 2 ethnic groups.
Infant and young children feeding practices among mothers in Warsaw and neighbouring districts
97
Not in English
Patterns of feeding in children under eighteen month of age in Multan; a hospital based study
98
Not located
Intake of energy providing liquids during the first year of life in five European countries
99
Doesn't include CACF Europe multi-country study
Randomized to follow-on formula, and looks at intake of other liquids, including juices.BM intake not quantified;
Early short-term infant food supplementation, maternal weight loss and duration of breast-feeding: A randomised controlled trial in rural Senegal
100
Doesn't include CACF Senegal Used a food supplement which was a locally prepared, "precooked food" to study duration of breastfeeding. Women given the supplement for a short period of time had longer breastfeeding duration. No measurement of breast milk. CF is not CACF.
Infant nutrition in North Iraq 101
Not in English Iraq Full text in German
Who is not breast-feeding and why 102
Irrelevant Letter to the Editor: not research
Impact of community based awareness campaign on breast -feeding among lactating women in Chandigarh
103
Doesn't include CACF India Purely descriptive study of feeding practices. CACFs are mentioned but breast feeding is not quantified, nor are CACFs.

60
Title Exclusion Reason
Setting Notes
Weaning practices in babies between the ages of six to nine months in the inner city of Johannesburg
104
Does not quantify breast feeding as outcome
South Africa Purely descriptive study of feeding practices, does not quantify relationship of CFs to breastfeeding.
Infant-feeding practices and beliefs about complementary feeding among low-income Brazilian mothers: a qualitative study
105
Irrelevant Brazil Qualitative study on timing of introduction of CFs, notes use of "expensive commercial foods" is a problem, but CACFs not specifically identified.
Assessment of Complementary Feeding of Canadian Infants 106
Irrelevant Canada Clinical trial registry, ongoing study.
Feeding My Baby - A National WIC Study 107
Irrelevant US Clinical trial registry, ongoing study. Current examination of infant and toddler feeding practices among families receiving WIC services. The study will include exploration of breastfeeding practices and support, more general feeding practices, nutritional intake of infants and toddlers, transitions in infant and toddler feeding practices, early precursors of obesity, and family factors that may influence all of these nutrition-related issues.

61
Appendix 2.1 Search terms for PubMed for question 2
1
Search (((((((infant food[MeSH Terms]) OR infant food*[Text Word]) OR baby food*[Text Word]) OR toddler food*[Text Word]) OR solid food*[Text Word]) OR weaning food*[Text Word]) OR complementary food*[Text Word]) OR complementary feed*[Text Word]) AND ((((((((((((((((commercial[Text Word]) OR industrial*[Text Word]) OR ready prepared[Text Word]) OR package*[Text Word]) OR process*[Text Word]) OR ultraprocess*[Text Word]) OR ready to eat[Text Word]) OR ready to use[Text Word]) OR ready to feed[Text Word]) OR food product[Text Word]) OR designer[Text Word]) OR baby food[Text Word]) OR market[Text Word]) OR jar*[Text Word]) OR manufactur*[Text Word]) OR follow on[Text Word]) OR growing up milk[Text Word]
2
Search (Obesity[Mesh] OR obesity[tw] OR Overweight[Mesh:NoExp] OR overweight[tw] OR adipos*[tw] OR body composition[mesh] OR body composition[tw] OR Body Fat Distribution[Mesh] OR body fat[tw] OR Chronic Disease[Mesh] OR chronic disease[tw] OR Cardiovascular Diseases[Mesh] OR cardiovascular disease[tw] OR Blood Pressure[Mesh:NoExp] OR blood pressure[tw] OR Hypertension[Mesh:NoExp] OR hypertension[tw] OR Prehypertension[Mesh] OR pre-hypertension[tw] OR elevated blood pressure[tw] OR high blood pressure[tw] OR Blood Glucose[Mesh] or blood glucose[tw] OR insulin/blood[mesh] OR Lipids/blood[Mesh] OR Triglycerides[Mesh:NoExp] or triglyceride[tw] OR Cholesterol, LDL[Mesh] OR LDL[tw] OR Cholesterol, HDL[Mesh] OR HDL[tw] OR Inflammation[Mesh:NoExp] OR inflammation[tw] OR Metabolic Syndrome X[Mesh] or metabolic syndrome[tw] OR Risk Factors[Mesh])
3
Search (((((((((infant food[MeSH Terms]) OR infant food*[Text Word]) OR baby food*[Text Word]) OR toddler food*[Text Word]) OR solid food*[Text Word]) OR weaning food*[Text Word]) OR complementary food*[Text Word]) OR complementary feed*[Text Word]) AND ((((((((((((((((commercial[Text Word]) OR industrial*[Text Word]) OR ready prepared[Text Word]) OR package*[Text Word]) OR process*[Text Word]) OR ultraprocess*[Text Word]) OR ready to eat[Text Word]) OR ready to use[Text Word]) OR ready to feed[Text Word]) OR food product[Text Word]) OR designer[Text Word]) OR baby food[Text Word]) OR market[Text Word]) OR jar*[Text Word]) OR manufactur*[Text Word]) OR follow on[Text Word]) OR growing up milk[Text Word])) AND ((Obesity[Mesh] OR obesity[tw] OR Overweight[Mesh:NoExp] OR overweight[tw] OR adipos*[tw] OR body composition[mesh] OR body composition[tw] OR Body Fat Distribution[Mesh] OR body fat[tw] OR Chronic Disease[Mesh] OR chronic disease[tw] OR Cardiovascular Diseases[Mesh] OR cardiovascular disease[tw] OR Blood Pressure[Mesh:NoExp] OR blood pressure[tw] OR Hypertension[Mesh:NoExp] OR hypertension[tw] OR Prehypertension[Mesh] OR pre-hypertension[tw] OR elevated blood pressure[tw] OR high blood pressure[tw] OR Blood Glucose[Mesh] or blood glucose[tw] OR insulin/blood[mesh] OR Lipids/blood[Mesh] OR Triglycerides[Mesh:NoExp] or triglyceride[tw] OR Cholesterol, LDL[Mesh] OR LDL[tw] OR Cholesterol, HDL[Mesh] OR HDL[tw] OR Inflammation[Mesh:NoExp] OR inflammation[tw] OR Metabolic Syndrome X[Mesh] or metabolic syndrome[tw] OR Risk Factors[Mesh]))
4
Search (((((((((infant food[MeSH Terms]) OR infant food*[Text Word]) OR baby food*[Text Word]) OR toddler food*[Text Word]) OR solid food*[Text Word]) OR weaning food*[Text Word]) OR complementary food*[Text Word]) OR complementary feed*[Text Word]) AND ((((((((((((((((commercial[Text Word]) OR industrial*[Text Word]) OR ready prepared[Text Word]) OR package*[Text Word]) OR process*[Text Word]) OR ultraprocess*[Text Word]) OR ready to eat[Text Word]) OR ready to use[Text Word]) OR ready to feed[Text Word]) OR food product[Text Word]) OR designer[Text Word]) OR baby food[Text Word]) OR market[Text Word]) OR jar*[Text Word]) OR manufactur*[Text Word]) OR follow on[Text Word]) OR growing up milk[Text Word])) AND ((Obesity[Mesh] OR obesity[tw] OR Overweight[Mesh:NoExp] OR overweight[tw] OR adipos*[tw] OR body composition[mesh] OR body composition[tw] OR Body Fat Distribution[Mesh] OR body fat[tw] OR Chronic Disease[Mesh] OR chronic disease[tw] OR Cardiovascular Diseases[Mesh] OR cardiovascular disease[tw] OR Blood Pressure[Mesh:NoExp] OR blood pressure[tw] OR Hypertension[Mesh:NoExp] OR hypertension[tw] OR Prehypertension[Mesh] OR pre-hypertension[tw] OR elevated blood pressure[tw] OR high blood pressure[tw] OR Blood Glucose[Mesh] or blood glucose[tw] OR insulin/blood[mesh] OR Lipids/blood[Mesh] OR Triglycerides[Mesh:NoExp] or triglyceride[tw] OR Cholesterol, LDL[Mesh] OR LDL[tw] OR Cholesterol, HDL[Mesh] OR HDL[tw] OR Inflammation[Mesh:NoExp] OR inflammation[tw] OR Metabolic Syndrome X[Mesh] or metabolic syndrome[tw] OR Risk Factors[Mesh])) Filters: Publication date from 2000/01/01
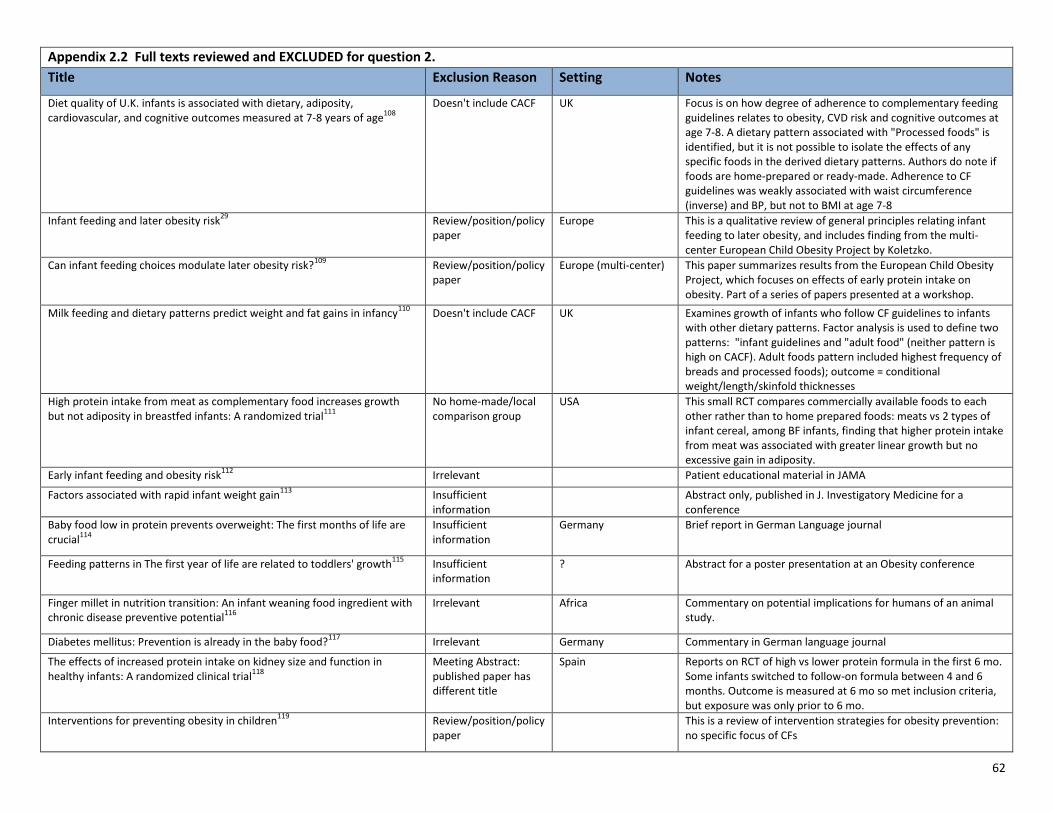
62
Appendix 2.2 Full texts reviewed and EXCLUDED for question 2.
Title Exclusion Reason Setting Notes
Diet quality of U.K. infants is associated with dietary, adiposity, cardiovascular, and cognitive outcomes measured at 7-8 years of age
108
Doesn't include CACF UK Focus is on how degree of adherence to complementary feeding guidelines relates to obesity, CVD risk and cognitive outcomes at age 7-8. A dietary pattern associated with "Processed foods" is identified, but it is not possible to isolate the effects of any specific foods in the derived dietary patterns. Authors do note if foods are home-prepared or ready-made. Adherence to CF guidelines was weakly associated with waist circumference (inverse) and BP, but not to BMI at age 7-8
Infant feeding and later obesity risk29
Review/position/policy paper
Europe This is a qualitative review of general principles relating infant feeding to later obesity, and includes finding from the multi-center European Child Obesity Project by Koletzko.
Can infant feeding choices modulate later obesity risk?109
Review/position/policy paper
Europe (multi-center) This paper summarizes results from the European Child Obesity Project, which focuses on effects of early protein intake on obesity. Part of a series of papers presented at a workshop.
Milk feeding and dietary patterns predict weight and fat gains in infancy110
Doesn't include CACF UK Examines growth of infants who follow CF guidelines to infants with other dietary patterns. Factor analysis is used to define two patterns: "infant guidelines and "adult food" (neither pattern is high on CACF). Adult foods pattern included highest frequency of breads and processed foods); outcome = conditional weight/length/skinfold thicknesses
High protein intake from meat as complementary food increases growth but not adiposity in breastfed infants: A randomized trial
111
No home-made/local comparison group
USA This small RCT compares commercially available foods to each other rather than to home prepared foods: meats vs 2 types of infant cereal, among BF infants, finding that higher protein intake from meat was associated with greater linear growth but no excessive gain in adiposity.
Early infant feeding and obesity risk112
Irrelevant Patient educational material in JAMA
Factors associated with rapid infant weight gain113
Insufficient information
Abstract only, published in J. Investigatory Medicine for a conference
Baby food low in protein prevents overweight: The first months of life are crucial
114
Insufficient information
Germany Brief report in German Language journal
Feeding patterns in The first year of life are related to toddlers' growth115
Insufficient information
? Abstract for a poster presentation at an Obesity conference
Finger millet in nutrition transition: An infant weaning food ingredient with chronic disease preventive potential
116
Irrelevant Africa Commentary on potential implications for humans of an animal study.
Diabetes mellitus: Prevention is already in the baby food?117
Irrelevant Germany Commentary in German language journal
The effects of increased protein intake on kidney size and function in healthy infants: A randomized clinical trial
118
Meeting Abstract: published paper has different title
Spain Reports on RCT of high vs lower protein formula in the first 6 mo. Some infants switched to follow-on formula between 4 and 6 months. Outcome is measured at 6 mo so met inclusion criteria, but exposure was only prior to 6 mo.
Interventions for preventing obesity in children119
Review/position/policy paper
This is a review of intervention strategies for obesity prevention: no specific focus of CFs

63
Appendix 3.1 Search terms for PubMed for question 3
1
Search (((((((((infant food[MeSH Terms]) OR infant food*[Text Word]) OR baby food*[Text Word]) OR toddler food*[Text Word]) OR solid food*[Text Word]) OR weaning food*[Text Word]) OR complementary food*[Text Word]) OR complementary feed*[Text Word])) AND (((((((((((((((((commercial[Text Word]) OR industrial*[Text Word]) OR ready prepared[Text Word]) OR package*[Text Word]) OR process*[Text Word]) OR ultraprocess*[Text Word]) OR ready to eat[Text Word]) OR ready to use[Text Word]) OR ready to feed[Text Word]) OR food product[Text Word]) OR designer[Text Word]) OR baby food[Text Word]) OR market[Text Word]) OR jar*[Text Word]) OR manufactur*[Text Word]) OR follow on[Text Word]) OR growing up milk[Text Word])
2
Search (((((((((((((((((((((((((((sodium, dietary[mesh]) OR salt*[tw]) OR sodium[tw]) OR fatty acids[mesh]) OR saturated fat[tw]) OR sat fat[tw]) OR trans fatty acids[mesh]) OR trans fat*[tw]) OR nutritive sweeteners[mesh]) OR dietary sucrose[mesh]) OR sugar*[tw]) OR micronutrients[mesh]) OR micronutrient*[tw]) OR dietary proteins[mesh]) OR dietary protein[tw]) OR protein) OR iron [mesh]) OR iron[tw]) OR zinc[tw]) OR iodine[mesh]) OR iodine[tw]) OR zinc[mesh]) OR zinc[tw]) OR calcium[mesh]) OR calcium[tw]) OR nutritive value[mesh:noexp]) OR nutritional quality[tw]) OR nutritive value[tw]
3
Search (((((((((((infant food[MeSH Terms]) OR infant food*[Text Word]) OR baby food*[Text Word]) OR toddler food*[Text Word]) OR solid food*[Text Word]) OR weaning food*[Text Word]) OR complementary food*[Text Word]) OR complementary feed*[Text Word])) AND (((((((((((((((((commercial[Text Word]) OR industrial*[Text Word]) OR ready prepared[Text Word]) OR package*[Text Word]) OR process*[Text Word]) OR ultraprocess*[Text Word]) OR ready to eat[Text Word]) OR ready to use[Text Word]) OR ready to feed[Text Word]) OR food product[Text Word]) OR designer[Text Word]) OR baby food[Text Word]) OR market[Text Word]) OR jar*[Text Word]) OR manufactur*[Text Word]) OR follow on[Text Word]) OR growing up milk[Text Word]))) AND ((((((((((((((((((((((((((((sodium, dietary[mesh]) OR salt*[tw]) OR sodium[tw]) OR fatty acids[mesh]) OR saturated fat[tw]) OR sat fat[tw]) OR trans fatty acids[mesh]) OR trans fat*[tw]) OR nutritive sweeteners[mesh]) OR dietary sucrose[mesh]) OR sugar*[tw]) OR micronutrients[mesh]) OR micronutrient*[tw]) OR dietary proteins[mesh]) OR dietary protein[tw]) OR protein) OR iron [mesh]) OR iron[tw]) OR zinc[tw]) OR iodine[mesh]) OR iodine[tw]) OR zinc[mesh]) OR zinc[tw]) OR calcium[mesh]) OR calcium[tw]) OR nutritive value[mesh:noexp]) OR nutritional quality[tw]) OR nutritive value[tw])
4
Search (((((((((((infant food[MeSH Terms]) OR infant food*[Text Word]) OR baby food*[Text Word]) OR toddler food*[Text Word]) OR solid food*[Text Word]) OR weaning food*[Text Word]) OR complementary food*[Text Word]) OR complementary feed*[Text Word])) AND (((((((((((((((((commercial[Text Word]) OR industrial*[Text Word]) OR ready prepared[Text Word]) OR package*[Text Word]) OR process*[Text Word]) OR ultraprocess*[Text Word]) OR ready to eat[Text Word]) OR ready to use[Text Word]) OR ready to feed[Text Word]) OR food product[Text Word]) OR designer[Text Word]) OR baby food[Text Word]) OR market[Text Word]) OR jar*[Text Word]) OR manufactur*[Text Word]) OR follow on[Text Word]) OR growing up milk[Text Word]))) AND ((((((((((((((((((((((((((((sodium, dietary[mesh]) OR salt*[tw]) OR sodium[tw]) OR fatty acids[mesh]) OR saturated fat[tw]) OR sat fat[tw]) OR trans fatty acids[mesh]) OR trans fat*[tw]) OR nutritive sweeteners[mesh]) OR dietary sucrose[mesh]) OR sugar*[tw]) OR micronutrients[mesh]) OR micronutrient*[tw]) OR dietary proteins[mesh]) OR dietary protein[tw]) OR protein) OR iron [mesh]) OR iron[tw]) OR zinc[tw]) OR iodine[mesh]) OR iodine[tw]) OR zinc[mesh]) OR zinc[tw]) OR calcium[mesh]) OR calcium[tw]) OR nutritive value[mesh:noexp]) OR nutritional quality[tw]) OR nutritive value[tw]) Filters: Publication date from 2000/01/01; Humans; Infant: birth-23 months Sort by: PublicationDate

64
Appendix 3.2 Q3 Papers excluded after full text review
Title Exclusion Reason Setting Notes
Nutritional and sensory evaluation of a complementary food formulated from rice, faba beans, sweet potato flour, and peanut oil
120
Doesn't have home-made/local comparison
Nigeria Three weaning food formulations made and compared to a CAP (Nutrend); weaning food formulations are not mimicking a homemade food a mom would make -- are an attempt to incorporate additional nutrients into an existing weaning food used by local moms
Sweet potato-based complementary food for infants in low-income countries
121
Irrelevant Africa Comparison of nutrients in Weanimix (CAP) to a sweet-potato based weaning food (created by the study team); have an industrial and a home preparation based on the method used -- extrusion cooking vs oven toasting -- but both use a processed initial product (the "cream-fleshed sweet potato flour"). Depends on if this home-based product qualifies as a "home-made or local" comparison
Nutrient adequacy and organoleptic quality of complementary food mixes made from combinations of digitaria exilis, sesamum indicum and glycine max
122
Incomplete/insufficient/partial data
Poster abstract
Development of local processed complementary food products-'WinFoods'-in Cambodia, for food aid programmes for prevention of child malnutrition
123
Incomplete/insufficient/partial data
Poster abstract
Adequacy of family foods for complementary feeding 124
Review/policy/position paper
Editorial
Complementary feeding: Is the nutritional profile of a homemade baby food the same as the commercial jar baby foods?
125
Not in English
Comparison of carbohydrate composition in sweetpotato-and maize-based infant foods
126
Incomplete/insufficient/partial data
Poster abstract
Nutrient composition of commonly used complementary foods in North western Nigeria
127
Doesn't include CAP Nigeria Comparison of the nutrient content of common traditional/local complementary foods in different regions of Nigeria
Comparison of nutritional contents between homemade and industrial baby food
128
Not in English
Ca, Cd, Cu, Fe, Hg, Mn, Ni, Pb, Se, and Zn contents in baby foods from the EU market: comparison of assessed infant intakes with the present safety limits for minerals and trace elements
129
Doesn't include CAP Europe (Italy, Spain, Slovakia, Sweden)
Nutritional analysis of infant formula/solids/beverages
Orange-fleshed sweet potato-based infant food is a better source of dietary vitamin A than a maize-legume blend as complementary food
130
Doesn't have home-made/local comparison
n/a (New Zealand?)
Nutrient comparison of Weanimix v. Cerelac v. sweet potato based v. maize based; sweet potato versions are meant to be something that can be made at home, but are not currently home-made products
Sweetpotato-based complementary food would be less inhibitory on mineral absorption than a maize-based infant food assessed by compositional analysis
131
Doesn't include CAP Africa Assess bioavailability of nutrients in two formulations of sweet potato based complementary foods (one "home-made", one processed) v. Weanimix; so based foods are created by study team, are not current home-made; Because Weanimix was enriched, so not CAP anymore
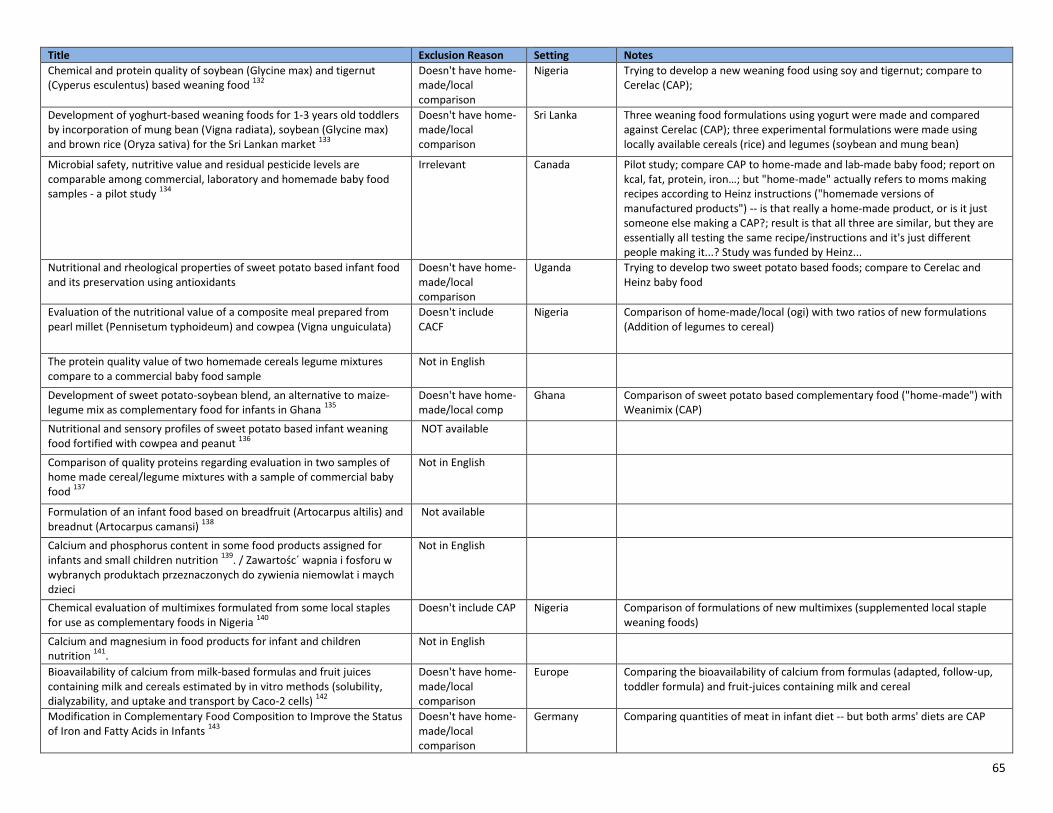
65
Title Exclusion Reason Setting Notes
Chemical and protein quality of soybean (Glycine max) and tigernut (Cyperus esculentus) based weaning food
132
Doesn't have home-made/local comparison
Nigeria Trying to develop a new weaning food using soy and tigernut; compare to Cerelac (CAP);
Development of yoghurt-based weaning foods for 1-3 years old toddlers by incorporation of mung bean (Vigna radiata), soybean (Glycine max) and brown rice (Oryza sativa) for the Sri Lankan market
133
Doesn't have home-made/local comparison
Sri Lanka Three weaning food formulations using yogurt were made and compared against Cerelac (CAP); three experimental formulations were made using locally available cereals (rice) and legumes (soybean and mung bean)
Microbial safety, nutritive value and residual pesticide levels are comparable among commercial, laboratory and homemade baby food samples - a pilot study
134
Irrelevant Canada Pilot study; compare CAP to home-made and lab-made baby food; report on kcal, fat, protein, iron…; but "home-made" actually refers to moms making recipes according to Heinz instructions ("homemade versions of manufactured products") -- is that really a home-made product, or is it just someone else making a CAP?; result is that all three are similar, but they are essentially all testing the same recipe/instructions and it's just different people making it...? Study was funded by Heinz...
Nutritional and rheological properties of sweet potato based infant food and its preservation using antioxidants
Doesn't have home-made/local comparison
Uganda Trying to develop two sweet potato based foods; compare to Cerelac and Heinz baby food
Evaluation of the nutritional value of a composite meal prepared from pearl millet (Pennisetum typhoideum) and cowpea (Vigna unguiculata)
Doesn't include CACF
Nigeria Comparison of home-made/local (ogi) with two ratios of new formulations (Addition of legumes to cereal)
The protein quality value of two homemade cereals legume mixtures compare to a commercial baby food sample
Not in English
Development of sweet potato-soybean blend, an alternative to maize-legume mix as complementary food for infants in Ghana
135
Doesn't have home-made/local comp
Ghana Comparison of sweet potato based complementary food ("home-made") with Weanimix (CAP)
Nutritional and sensory profiles of sweet potato based infant weaning food fortified with cowpea and peanut
136
NOT available
Comparison of quality proteins regarding evaluation in two samples of home made cereal/legume mixtures with a sample of commercial baby food
137
Not in English
Formulation of an infant food based on breadfruit (Artocarpus altilis) and breadnut (Artocarpus camansi)
138
Not available
Calcium and phosphorus content in some food products assigned for infants and small children nutrition
139. / Zawartośc´ wapnia i fosforu w
wybranych produktach przeznaczonych do zywienia niemowlat i maych dzieci
Not in English
Chemical evaluation of multimixes formulated from some local staples for use as complementary foods in Nigeria
140
Doesn't include CAP Nigeria Comparison of formulations of new multimixes (supplemented local staple weaning foods)
Calcium and magnesium in food products for infant and children nutrition
141.
Not in English
Bioavailability of calcium from milk-based formulas and fruit juices containing milk and cereals estimated by in vitro methods (solubility, dialyzability, and uptake and transport by Caco-2 cells)
142
Doesn't have home-made/local comparison
Europe Comparing the bioavailability of calcium from formulas (adapted, follow-up, toddler formula) and fruit-juices containing milk and cereal
Modification in Complementary Food Composition to Improve the Status of Iron and Fatty Acids in Infants
143
Doesn't have home-made/local comparison
Germany Comparing quantities of meat in infant diet -- but both arms' diets are CAP

66
Appendix 4.1 Search terms for PubMed for question 4
Search ((((((((((infant food[MeSH Terms]) OR infant food*[Text Word]) OR baby food*[Text Word]) OR toddler food*[Text Word]) OR solid food*[Text Word]) OR weaning food*[Text Word]) OR complementary food*[Text Word]) OR complementary feed*[Text Word])) AND (((((((((((((((((commercial[Text Word]) OR industrial*[Text Word]) OR ready prepared[Text Word]) OR package*[Text Word]) OR process*[Text Word]) OR ultraprocess*[Text Word]) OR ready to eat[Text Word]) OR ready to use[Text Word]) OR ready to feed[Text Word]) OR food product[Text Word]) OR designer[Text Word]) OR baby food[Text Word]) OR market[Text Word]) OR jar*[Text Word]) OR manufactur*[Text Word]) OR follow on[Text Word]) OR growing up milk[Text Word])) AND ("Portion Size"[Mesh] OR "portion size"[tw] OR "Serving Size"[Mesh] OR "serving size"[tw] OR "meal size"[tw]) Filters: Publication date from 2000/01/01; Humans
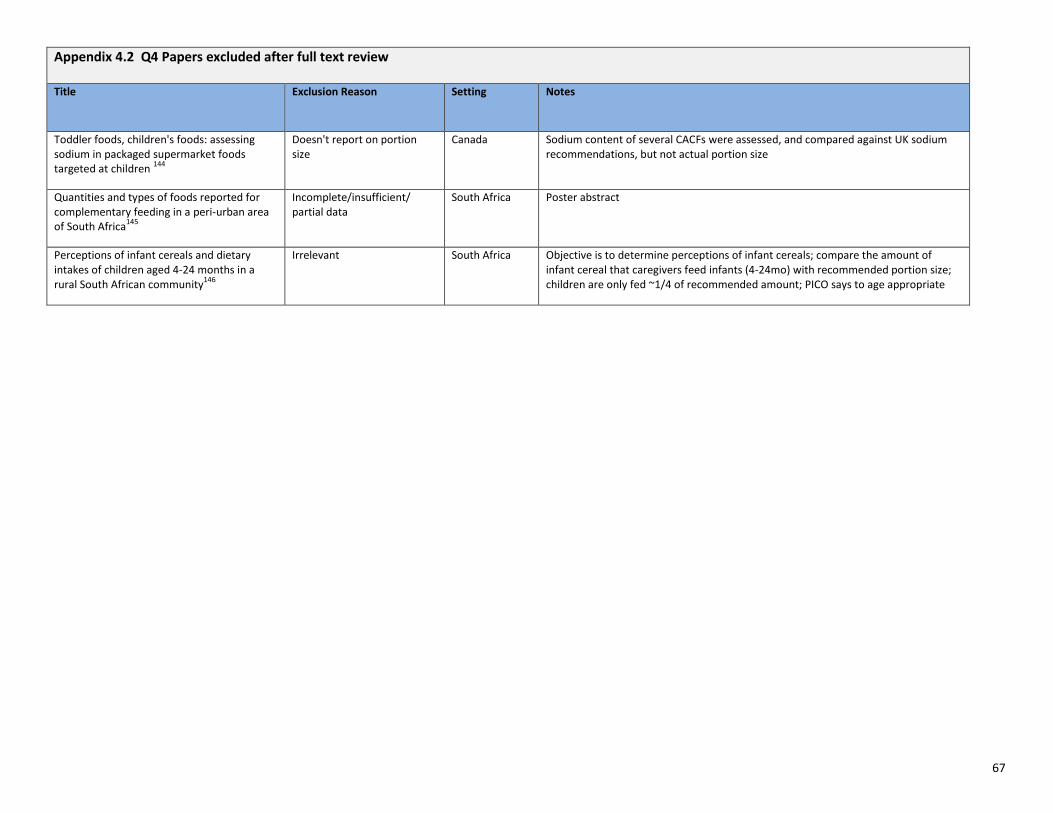
67
Appendix 4.2 Q4 Papers excluded after full text review Title Exclusion Reason Setting Notes
Toddler foods, children's foods: assessing sodium in packaged supermarket foods targeted at children
144
Doesn't report on portion size
Canada Sodium content of several CACFs were assessed, and compared against UK sodium recommendations, but not actual portion size
Quantities and types of foods reported for complementary feeding in a peri-urban area of South Africa
145
Incomplete/insufficient/ partial data
South Africa Poster abstract
Perceptions of infant cereals and dietary intakes of children aged 4-24 months in a rural South African community
146
Irrelevant South Africa Objective is to determine perceptions of infant cereals; compare the amount of infant cereal that caregivers feed infants (4-24mo) with recommended portion size; children are only fed ~1/4 of recommended amount; PICO says to age appropriate

68
Appendix 5.1 Search terms for PubMed for question 5
1 Search stunt*[tw]
2 Search anemi*
3
Search ((((((((("Infant Nutrition Disorders"[Mesh:NoExp]) OR "Deficiency Diseases"[Mesh:NoExp]) OR "Anemia"[Mesh]) OR "Micronutrients/deficiency"[Mesh]) OR "Trace Elements/deficiency"[Mesh]) OR "Avitaminosis"[Mesh]) OR "Iron/deficiency"[Mesh]) OR "Zinc/deficiency"[Mesh]) OR "Calcium/deficiency"[Mesh]) OR "Vitamin A Deficiency"[Mesh]
4 Search micronutrient deficien*[tw]
5 Search iron deficien*[tw]
6 Search zinc deficien*[tw]
7 Search calcium deficien*[tw]
8 Search vitamin A deficien*[tw]
9 Search "Malnutrition"[Mesh:NoExp]
10
Search (((((((((((((((((("Infant Nutrition Disorders"[Mesh:NoExp]) OR "Deficiency Diseases"[Mesh:NoExp]) OR "Anemia"[Mesh]) OR "Micronutrients/deficiency"[Mesh]) OR "Trace Elements/deficiency"[Mesh]) OR "Avitaminosis"[Mesh]) OR "Iron/deficiency"[Mesh]) OR "Zinc/deficiency"[Mesh]) OR "Calcium/deficiency"[Mesh]) OR "Vitamin A Deficiency"[Mesh])) OR "Malnutrition"[Mesh:NoExp]) OR stunt*[tw]) OR anemi*) OR micronutrient deficien*[tw]) OR iron deficien*[tw]) OR zinc deficien*[tw]) OR calcium deficien*[tw]) OR vitamin A deficien*[tw]
11
Search (((((((((infant food[MeSH Major Topic]) OR infant food*[tw]) OR baby food*[tw]) OR toddler food*[tw]) OR weaning food*[tw]) OR solid food*[tw]) OR complementary food*[tw]) OR complementary feed*[tw])) AND (((((((((((((((commercial*[Text Word]) OR industrial*[Text Word]) OR "ready prepared"[Text Word]) OR package*[Text Word]) OR process*[Text Word]) OR ultraprocess*[Text Word]) OR ready to eat[Text Word]) OR ready to use[Text Word]) OR ready to feed[Text Word]) OR food product[Text Word]) OR designer[Text Word]) OR baby food[Text Word]) OR market*[Text Word]) OR jar*[Text Word]) OR manufactur*[Text Word])
12
Search (((((((((((infant food[MeSH Major Topic]) OR infant food*[tw]) OR baby food*[tw]) OR toddler food*[tw]) OR weaning food*[tw]) OR solid food*[tw]) OR complementary food*[tw]) OR complementary feed*[tw])) AND (((((((((((((((commercial*[Text Word]) OR industrial*[Text Word]) OR "ready prepared"[Text Word]) OR package*[Text Word]) OR process*[Text Word]) OR ultraprocess*[Text Word]) OR ready to eat[Text Word]) OR ready to use[Text Word]) OR ready to feed[Text Word]) OR food product[Text Word]) OR designer[Text Word]) OR baby food[Text Word]) OR market*[Text Word]) OR jar*[Text Word]) OR manufactur*[Text Word]))) AND ((((((((((((((((((("Infant Nutrition Disorders"[Mesh:NoExp]) OR "Deficiency Diseases"[Mesh:NoExp]) OR "Anemia"[Mesh]) OR "Micronutrients/deficiency"[Mesh]) OR "Trace Elements/deficiency"[Mesh]) OR "Avitaminosis"[Mesh]) OR "Iron/deficiency"[Mesh]) OR "Zinc/deficiency"[Mesh]) OR "Calcium/deficiency"[Mesh]) OR "Vitamin A Deficiency"[Mesh])) OR "Malnutrition"[Mesh:NoExp]) OR stunt*[tw]) OR anemi*) OR micronutrient deficien*[tw]) OR iron deficien*[tw]) OR zinc deficien*[tw]) OR calcium deficien*[tw]) OR vitamin A deficien*[tw]) Filters: Publication date from 2000/01/01; Humans
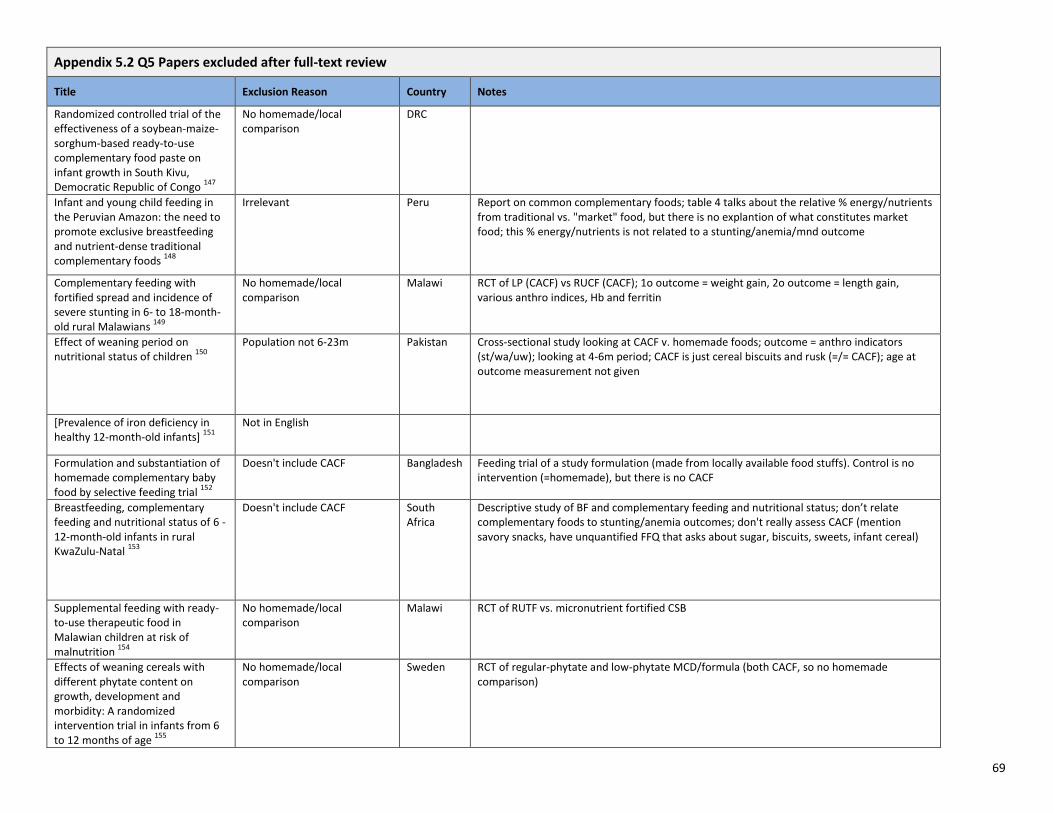
69
Appendix 5.2 Q5 Papers excluded after full-text review
Title Exclusion Reason Country Notes
Randomized controlled trial of the effectiveness of a soybean-maize-sorghum-based ready-to-use complementary food paste on infant growth in South Kivu, Democratic Republic of Congo
147
No homemade/local comparison
DRC
Infant and young child feeding in the Peruvian Amazon: the need to promote exclusive breastfeeding and nutrient-dense traditional complementary foods
148
Irrelevant Peru Report on common complementary foods; table 4 talks about the relative % energy/nutrients from traditional vs. "market" food, but there is no explantion of what constitutes market food; this % energy/nutrients is not related to a stunting/anemia/mnd outcome
Complementary feeding with fortified spread and incidence of severe stunting in 6- to 18-month-old rural Malawians
149
No homemade/local comparison
Malawi RCT of LP (CACF) vs RUCF (CACF); 1o outcome = weight gain, 2o outcome = length gain, various anthro indices, Hb and ferritin
Effect of weaning period on nutritional status of children
150
Population not 6-23m Pakistan Cross-sectional study looking at CACF v. homemade foods; outcome = anthro indicators (st/wa/uw); looking at 4-6m period; CACF is just cereal biscuits and rusk (=/= CACF); age at outcome measurement not given
[Prevalence of iron deficiency in healthy 12-month-old infants]
151
Not in English
Formulation and substantiation of homemade complementary baby food by selective feeding trial
152
Doesn't include CACF Bangladesh Feeding trial of a study formulation (made from locally available food stuffs). Control is no intervention (=homemade), but there is no CACF
Breastfeeding, complementary feeding and nutritional status of 6 - 12-month-old infants in rural KwaZulu-Natal
153
Doesn't include CACF South Africa
Descriptive study of BF and complementary feeding and nutritional status; don’t relate complementary foods to stunting/anemia outcomes; don't really assess CACF (mention savory snacks, have unquantified FFQ that asks about sugar, biscuits, sweets, infant cereal)
Supplemental feeding with ready-to-use therapeutic food in Malawian children at risk of malnutrition
154
No homemade/local comparison
Malawi RCT of RUTF vs. micronutrient fortified CSB
Effects of weaning cereals with different phytate content on growth, development and morbidity: A randomized intervention trial in infants from 6 to 12 months of age
155
No homemade/local comparison
Sweden RCT of regular-phytate and low-phytate MCD/formula (both CACF, so no homemade comparison)

70
Appendix 5.2 Q5 Papers excluded after full-text review
Title Exclusion Reason Country Notes
Processed Complementary Food Does Not Improve Growth or Hemoglobin Status of Rural Tanzanian Infants from 6-12 Months of Age in Kilosa District, Tanzania
156
Doesn't include CACF Tanzania RCT of unprocessed placebo vs processed complementary food, but neither are a CACF or home-made food
Complementary foods fortified with micronutrients prevent iron deficiency and anemia in Vietnamese infants
157
Doesn't include CACF Vietnam RCT of micronutrient fortified flour and complementary food vs. usual gruel; intervention is specially made for the study so not a CACF
Randomized controlled trial of meat compared with multimicronutrient-fortified cereal in infants and toddlers with high stunting rates in diverse settings
158
Doesn't have home-made/local comparison
DRC, Zambia, Guatemala, Pakistan
RCT of meat (lyophilized beef -- made by a camping company, so not CACF) vs. MNF cereal (looks like a CACF http://www.nutrica.com.gt/Productos_Products.html)
Effect assessment of nutrition intervention in 6-24 months old infants and young children
159
Not in English
Efficacy of amaranth grain (Amaranthus cruentus) on anaemia and iron deficiency in Kenyan pre-school children
160
Doesn't include CACF Kenya Thesis of a nutritional assessment, then analysis of amaranth
Nutritional rehabilitation using energy dense local food as ready to use therapeutic food in hospitalized malnourished children: case for primary prevention at grass root levels
161
Irrelevant India population has PEM; RCT of family diet only vs. family diet/RUTF vs. family diet/RUTF/multivitamin. RUTF =/= CACF here
A six-month intervention with two different types of micronutrient-fortified complementary foods had distinct short- and long-term effects on linear and ponderal growth of Vietnamese infants
162
Doesn't include CACF Vietnam RCT of micronutrient fortified flour and complementary food vs. usual gruel; intervention is specially made for the study so not a CACF
Neither a zinc supplement nor phytate-reduced maize nor their combination enhance growth of 6- to 12-month-old Guatemalan infants
163
Doesn't include CACF Guatemala RCT of low-phytate (imported) v. control maize (local) and zinc supplementation (tablet )v. placebo (tablet)
Infant feeding practices and nutritional status of children in North Western Nigeria
164
Incomplete/insufficient/partial data
Nigeria Only reports prevalences
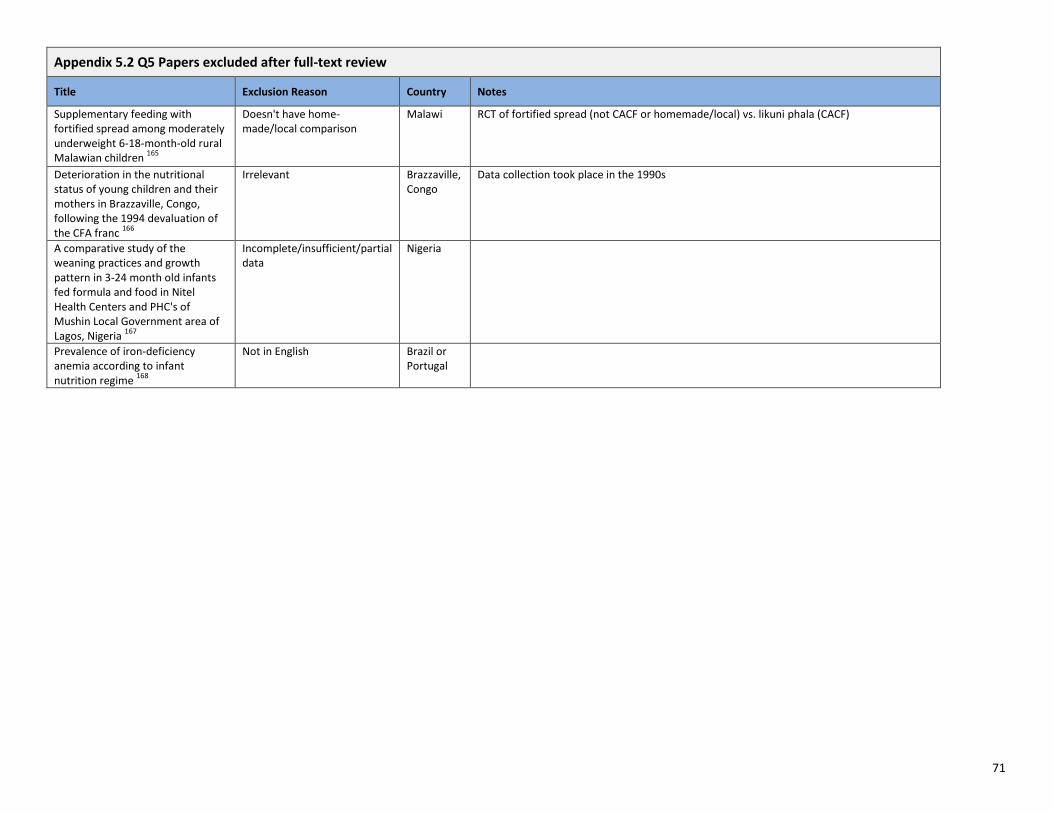
71
Appendix 5.2 Q5 Papers excluded after full-text review
Title Exclusion Reason Country Notes
Supplementary feeding with fortified spread among moderately underweight 6-18-month-old rural Malawian children
165
Doesn't have home-made/local comparison
Malawi RCT of fortified spread (not CACF or homemade/local) vs. likuni phala (CACF)
Deterioration in the nutritional status of young children and their mothers in Brazzaville, Congo, following the 1994 devaluation of the CFA franc
166
Irrelevant Brazzaville, Congo
Data collection took place in the 1990s
A comparative study of the weaning practices and growth pattern in 3-24 month old infants fed formula and food in Nitel Health Centers and PHC's of Mushin Local Government area of Lagos, Nigeria
167
Incomplete/insufficient/partial data
Nigeria
Prevalence of iron-deficiency anemia according to infant nutrition regime
168
Not in English Brazil or Portugal
72
References 1. Cohen RJ, Brown KH, Canahuati J, Rivera LL, Dewey KG. Effects of age of introduction of complementary foods on infant breast milk intake, total energy intake, and growth: a randomised intervention study in Honduras. Lancet. 1994 Jul 30;344(8918):288-93 2. World Health Organization. Global strategy on infant and young child feeding 2002. WHO, Geneva, Switzerland 3. Coward WA, Cole TJ, Sawyer MB, Prentice AM. Breast-milk intake measurement in mixed-fed infants by administration of deuterium oxide to their mothers. Human nutrition Clinical nutrition. 1982;36(2):141-8. 4. International Atomic Energy Agency. Stable Isotope Technique to assess intake of human milk in breastfed infants. 2010, Vienna, Austria. 5. Dewey KG, Heinig MJ, Nommsen LA, Lonnerdal B. Maternal versus infant factors related to breast milk intake and residual milk volume: the DARLING study. Pediatrics. 1991 Jun;87(6):829-37. 6. VonVille HM. Excel Workbooks for Systematic Reviews & Corresponding Handouts Available from: http://libguides.sph.uth.tmc.edu/excel_SR_workbook. 7. Viswanathan M, Berkman ND, Dryden DM, Hartling L. Assessing Risk of Bias and Confounding in Observational Studies of Interventions or Exposures: Further Development of the RTI Item Bank. AHRQ Methods for Effective Health Care. Rockville (MD)2013. 8. Viswanathan M, Ansari MT, Berkman ND, Chang S, Hartling L, McPheeters M, et al. Assessing the Risk of Bias of Individual Studies in Systematic Reviews of Health Care Interventions. Methods Guide for Effectiveness and Comparative Effectiveness Reviews. AHRQ Methods for Effective Health Care. Rockville (MD)2008. 9. Higgins J, Green S, editors. Cochrane Handbook for Systematic Reviews of Interventions: The Cochrane Collaboration; 2011. 10. GRADE Working Group. Grading the quality of evidence and the strength of recommendations. Available from: http://www.gradeworkinggroup.org/index.htm. 11. Bhandari N, Bahl R, Nayyar B, Khokhar P, Rohde JE, Bhan MK. Food supplementation with encouragement to feed it to infants from 4 to 12 months of age has a small impact on weight gain. The Journal of nutrition. 2001 Jul;131(7):1946-51. 12. Kumwenda C, Dewey KG, Hemsworth J, Ashorn P, Maleta K, Haskell MJ. Lipid-based nutrient supplements do not decrease breast milk intake of Malawian infants. The American journal of clinical nutrition. 2014 Mar;99(3):617-23. 13. Galpin L, Thakwalakwa C, Phuka J, Ashorn P, Maleta K, Wong WW, et al. Breast milk intake is not reduced more by the introduction of energy dense complementary food than by typical infant porridge. The Journal of nutrition. 2007 Jul;137(7):1828-33. 14. Owino VO, Bahwere P, Bisimwa G, Mwangi CM, Collins S. Breast-milk intake of 9-10-mo-old rural infants given a ready-to-use complementary food in South Kivu, Democratic Republic of Congo. The American journal of clinical nutrition. 2011 Jun;93(6):1300-4. 15. Pani P, Carletti C, Knowles A, Parpinel M, Concina F, Montico M, et al. Patterns of nutrients' intake at six months in the northeast of Italy: a cohort study. BMC pediatrics. 2014;14:127. 16. Foterek K, Hilbig A, Alexy U. Breast-feeding and weaning practices in the DONALD study: age and time trends. Journal of pediatric gastroenterology and nutrition. 2014 Mar;58(3):361-7. 17. Bell LK, Golley RK, Daniels L, Magarey AM. Dietary patterns of Australian children aged 14 and 24 months, and associations with socio-demographic factors and adiposity. European journal of clinical nutrition. 2013; 67(6):[638-45 pp.].

73
18. Hernandez L, Campos R, Enneman A, Soto-Mendez MJ, Vossenaar M, Solomons NW. Contribution of complementary food nutrients to estimated total nutrient intakes for urban Guatemalan infants in the second semester of life. Asia Pacific journal of clinical nutrition. 2011;20(4):572-83. 19. Islam MM, Khatun M, Peerson JM, Ahmed T, Mollah MA, Dewey KG, et al. Effects of energy density and feeding frequency of complementary foods on total daily energy intakes and consumption of breast milk by healthy breastfed Bangladeshi children. The American journal of clinical nutrition. 2008 Jul;88(1):84-94. 20. Singh PK, Sachdev HP, Nagpal J, Bajaj M, Dubey AP. Short-term effect of complementary feeding frequency on total ad libitum consumption in 6- to 10-month-old breast fed Indian infants. Journal of pediatric gastroenterology and nutrition. 2005 Oct;41(4):422-5. 21. Bajaj M, Dubey AP, Nagpal J, Singh PK, Sachdev HP. Short-term effect of oil supplementation of complementary food on total ad libitum consumption in 6- to 10-month-old breastfed Indian infants. Journal of pediatric gastroenterology and nutrition. 2005 Jul;41(1):61-5. 22. Owino VO, Kasonka LM, Sinkala MM, Wells JK, Eaton S, Darch T, et al. Fortified complementary foods with or without alpha-amylase treatment increase hemoglobin but do not reduce breast milk intake of 9-mo-old Zambian infants. The American journal of clinical nutrition. 2007 Oct;86(4):1094-103. 23. Beyerlein A, von Kries R. Breastfeeding and body composition in children: will there ever be conclusive empirical evidence for a protective effect against overweight? The American journal of clinical nutrition. 2011; 94:1772S-5S. 24. Fewtrell MS. Breast-feeding and later risk of CVD and obesity: evidence from randomised trials. The Proceedings of the Nutrition Society. 2011; 70:472-7. 25. Owen CG, Whincup PH, Cook DG. Breast-feeding and cardiovascular risk factors and outcomes in later life: evidence from epidemiological studies. The Proceedings of the Nutrition Society 2011;70:478-84. 26. Pearce J, Taylor MA, Langley-Evans SC. Timing of the introduction of complementary feeding and risk of childhood obesity: a systematic review. International journal of obesity (2005). 2013; 37:1295-306. 27. Pearce J, Langley-Evans SC. The types of food introduced during complementary feeding and risk of childhood obesity: a systematic review. International journal of obesity (2005). 2013; 37:477-85. 28. Mennella JA. Ontogeny of taste preferences: basic biology and implications for health. The American journal of clinical nutrition. 2014; 99:704S-11S. 29. Koletzko B, von Kries R, Monasterolo RC, et al. Infant feeding and later obesity risk. Advances in experimental medicine and biology. 2009; 646:15-29. 30. Cogswell ME, Gunn JP, Yuan K, Park S, Merritt R. Sodium and sugar in complementary infant and toddler foods sold in the United States. Pediatrics. 2015; 135:416-23. 31. Elliott CD, Conlon MJ. Packaged baby and toddler foods: questions of sugar and sodium. Pediatric obesity. 2015; 10:149-55. 32. Elliott CD. Sweet and salty: nutritional content and analysis of baby and toddler foods. Journal of public health (Oxford, England). 2011; 33:63-70. 33. Koletzko B, von Kries R, Closa R, et al. Lower protein in infant formula is associated with lower weight up to age 2 y: a randomized clinical trial. The American journal of clinical nutrition. 2009; 89:1836-45. 34. Skau J, Touch B, Chhoun C, et al. Effects of animal source food and micronutrient fortification in complementary food products on body composition, iron status, and linear growth: a randomized trial in Cambodia. The American journal of clinical nutrition. 2015; 101:742-51. 35. Almquist-Tangen G, Dahlgren J, Roswall J, Bergman S, Alm B. Milk cereal drink increases BMI risk at 12 and 18 months, but formula does not. Acta Paediatrica. 2013; 102:1174-9.

74
36. Wiberger M, Eiben G, Lissner L, Mehlig K, Papoutsou S, Hunsberger M. Children consuming milk cereal drink are at increased risk for overweight: The IDEFICS Sweden study, on behalf of the IDEFICS Consortium. Scandinavian journal of public health. 2014; 42:518-24. 37. Garcia AL, Raza S, Parrett A, Wright CM. Nutritional content of infant commercial weaning foods in the UK. Archives of disease in childhood. 2013; 98:793-7. 38. Van Hoan N, Van Phu P, Salvignol B, Berger J, Treche S. Effect of the consumption of high energy dense and fortified gruels on energy and nutrient intakes of 6-10-month-old Vietnamese infants. Appetite. 2009; 53:233-40. 39. Smithers LG, Golley RK, Brazionis L, Emmett P, Northstone K, Lynch JW. Dietary patterns of infants and toddlers are associated with nutrient intakes. Nutrients. 2012; 4:935-48. 40. Faber M. Complementary foods consumed by 6-12-month-old rural infants in South Africa are inadequate in micronutrients. Public health nutrition. 2005; 8:373-81. 41. Eshun G, Baffour NK, Ackah PY. Nutrient content and sensory acceptability of a weaning diet formulated from mixtures of soya bean, groundnut and rice. Afr J Food Sci. 2011; 5:870-7. 42. Mosha TCE, Laswai HS, Tetens I. Nutritional composition and micronutrient status of home made and commercial weaning foods consumed in Tanzania. Plant Foods Hum Nutr. 2000; 55:185-205. 43. Ijarotimi OS, Ogunsemore MT. Weaning foods and their impact on child-feeding practices among low-income Nigerian mothers. Food and nutrition bulletin. 2006; 27:327-34. 44. Ijarotimi OS, Olopade AJ. Determination of amino acid content and protein quality of complementary food produced from locally available food materials in Ondo State, Nigeria. Malaysian Journal of Nutrition. 2009; 15:87-95. 45. Ijarotimi OS. Nutritional composition, microbial status, functional and sensory properties of infant diets formulated from cooking banana fruits (Musa spp, ABB genome) and fermented bambara groundnut (Vigna subterranean L. Verdc) seeds. Nutrition & Food Science. 2008; 38:325-40. 46. Ijarotimi OS. Protein and hematological evaluations of infant formulated from cooking banana fruits (Musa spp., ABB genome) and fermented bambara groundnut (Vigna subterranean L. Verdc) seeds. Nutrition Research and Practice. 2008; 2:165-70. 47. Steve IO, Babatunde OI. Chemical compositions and nutritional properties of popcorn-based complementary foods supplemented with Moringa oleifera leaves flour. Journal of Food Research. 2013; 2:117-32. 48. Lalude LO, Fashakin JB. Development and nutritional assessment of a weaning food from Sorghum and oil - Seeds. Pakistan Journal of Nutrition. 2006; 5:257-60. 49. Omueti O, Jaiyeola O, Otegbayo B, Ajomale K, Afolabi O. Development and quality evaluation of low-cost, high-protein weaning food types: Prowena and Propalm from soybean (Glycine max), groundnut (Arachis hypogea) and crayfish (Macrobrachium spp.). British Food Journal. 2009; 111:196-204. 50. Roos N, Sorensen JC, Sorensen H, et al. Screening for anti-nutritional compounds in complementary foods and food aid products for infants and young children. Maternal & child nutrition. 2013; 9 Suppl 1:47-71. 51. Thathola A, Srivastava S. Physicochemical properties and nutritional traits of millet-based weaning food suitable for infants of the Kumaon hills, Northern India. Asia Pacific journal of clinical nutrition. 2002; 11:28-32. 52. Nudda A, McGuire MK, Battacone G, Manca MG, Boe R, Pulina G. Documentation of fatty acid profiles in lamb meat and lamb-based infant foods. Journal of food science. 2011; 76:H43-7. 53. Hurley KM, Black MM. Commercial baby food consumption and dietary variety in a statewide sample of infants receiving benefits from the special supplemental nutrition program for women, infants, and children. Journal of the American Dietetic Association. 2010; 110:1537-41.

75
54. Mesch CM, Stimming M, Foterek K, et al. Food variety in commercial and homemade complementary meals for infants in Germany. Market survey and dietary practice. Appetite. 2014; 76:113-9. 55. Haigh C, Schneider J. Junk food for babies? An investigation into foods marketed for babies and young children. London: Children's Food Campaign; 2009. 56. Fitzhugh K, T. L. Children’s Food Examined: An analysis of 358 products targeted at children. London: The Food Commission (UK) Ltd 94 White Lion Street, 2000. 57. Fox MK, Devaney B, Reidy K, Razafindrakoto C, Ziegler P. Relationship between portion size and energy intake among infants and toddlers: evidence of self-regulation. Journal of the American Dietetic Association. 2006; 106:S77-83. 58. USDA. Birth to 24 Months and Pregnant Women. Available from: http://www.cnpp.usda.gov/birthto24months. 59. Raiten DJ, Raghavan R, Porter A, Obbagy JE, Spahn JM. Executive summary: Evaluating the evidence base to support the inclusion of infants and children from birth to 24 mo of age in the Dietary Guidelines for Americans--"the B-24 Project". The American journal of clinical nutrition. 2014; 99:663S-91S. 60. Black RE, Victora CG, Walker SP, et al. Maternal and child undernutrition and overweight in low-income and middle-income countries. Lancet. 2013; 382:427-51. 61. Lutter CK, Rivera JA. Nutritional status of infants and young children and characteristics of their diets. The Journal of nutrition. 2003; 133:2941S-9S. 62. Domellof M, Braegger C, Campoy C, et al. Iron requirements of infants and toddlers. Journal of pediatric gastroenterology and nutrition. 2014; 58:119-29. 63. Yeung GS, Zlotkin SH. Efficacy of meat and iron-fortified commercial cereal to prevent iron depletion in cow milk-fed infants 6 to 12 months of age: a randomized controlled trial. Can J Public Health. 2000; 91:263-7. 64. He M, Ma J, Chen Q, et al. Growth and feeding practices of 4 and 8 months infants in Southern China. Nutrition Research. 2001; 21:103-20. 65. O'Donovan SM, Murray DM, Hourihane JO, Kenny LC, Irvine AD, Kiely M. Adherence with early infant feeding and complementary feeding guidelines in the Cork BASELINE Birth Cohort Study. Public health nutrition. 2015:1-10. 66. Reat AM, Crixell SH, Friedman BJ, Von Bank JA. Comparison of Food Intake Among Infants and Toddlers Participating in a South Central Texas WIC Program Reveals Some Improvements After WIC Package Changes. Maternal and child health journal. 2015. 67. Ogunlesi TA, Ayeni VA, Adekanmbi AF, Fetuga BM. Determinants of timely initiation of complementary feeding among children aged 6-24 months in Sagamu, Nigeria. Nigerian journal of clinical practice. 2014; 17:785-90. 68. Contreras M, Zelaya Blandon E, Persson LA, Ekstrom EC. Consumption of highly processed snacks, sugar-sweetened beverages and child feeding practices in a rural area of Nicaragua. Maternal & child nutrition. 2014. 69. Brown K, Henretty N, Chary A, et al. Mixed-methods study identifies key strategies for improving infant and young child feeding practices in a highly stunted rural indigenous population in Guatemala. Maternal & child nutrition. 2014. 70. Hoffman ER, Bentley ME, Hamer RM, Hodges EA, Ward DS, Bulik CM. A comparison of infant and toddler feeding practices of mothers with and without histories of eating disorders. Maternal & child nutrition. 2014; 10:360-72. 71. Bandara T, Hettiarachchi M, Liyanage C, Amarasena S. Current infant feeding practices and impact on growth in babies during the second half of infancy. Journal of human nutrition and dietetics : the official journal of the British Dietetic Association. 2014.

76
72. Thakwalakwa C, Phiri A, Rollins N, Heikens GT, Barnell EK, Manary M. Growth and HIV-free survival of HIV-exposed infants in Malawi: a randomized trial of two complementary feeding interventions in the context of maternal antiretroviral therapy. Journal of acquired immune deficiency syndromes (1999). 2014; 66:181-7. 73. Armstrong J, Abraham EC, Squair M, Brogan Y, Merewood A. Exclusive breastfeeding, complementary feeding, and food choices in UK infants. Journal of human lactation : official journal of International Lactation Consultant Association. 2014; 30:201-8. 74. Souza FI, Caetano MC, Ortiz TT, Silva SG, Sarni RO. Complementary feeding of infants in their first year of life: focus on the main pureed baby foods. Revista da Associacao Medica Brasileira (1992). 2014; 60:231-5. 75. Banta-Wright SA, Press N, Knafl KA, Steiner RD, Houck GM. Breastfeeding infants with phenylketonuria in the United States and Canada. Breastfeeding medicine : the official journal of the Academy of Breastfeeding Medicine. 2014; 9:142-8. 76. Phoutthakeo P, Otsuka K, Ito C, Sayamoungkhoun P, Kounnavong S, Jimba M. Cross-border promotion of formula milk in Lao People's Democratic Republic. Journal of paediatrics and child health. 2014; 50:51-6. 77. O'Dowd A. Baby food giants accused of wooing mothers in India off breastfeeding. BMJ (Clinical research ed). 2013; 347:f4934. 78. Chiasson MA, Findley SE, Sekhobo JP, et al. Changing WIC changes what children eat. Obesity (Silver Spring, Md). 2013; 21:1423-9. 79. Betoko A, Charles MA, Hankard R, et al. Infant feeding patterns over the first year of life: influence of family characteristics. European journal of clinical nutrition. 2013; 67:631-7. 80. Hornbeak DM, Dirani M, Sham WK, et al. Emerging trends in breastfeeding practices in Singaporean Chinese women: findings from a population-based study. Annals of the Academy of Medicine, Singapore. 2010; 39:88-94. 81. Enneman A, Hernandez L, Campos R, Vossenaar M, Solomons NW. Dietary characteristics of complementary foods offered to Guatemalan infants vary between urban and rural settings. Nutrition research (New York, NY). 2009; 29:470-9. 82. Marriott BM, Campbell L, Hirsch E, Wilson D. Preliminary data from demographic and health surveys on infant feeding in 20 developing countries. The Journal of nutrition. 2007;137:518s-23s. 83. Jacknowitz A, Novillo D, Tiehen L. Special Supplemental Nutrition Program for Women, Infants, and Children and infant feeding practices. Pediatrics. 2007;119:281-9. 84. Pontin D, Emmett P, Steer C, Emond A. Patterns of breastfeeding in a UK longitudinal cohort study. Maternal & child nutrition. 2007;3:2-9. 85. Alder EM, Williams FL, Anderson AS, Forsyth S, Florey Cdu V, van der Velde P. What influences the timing of the introduction of solid food to infants? The British journal of nutrition. 2004;92:527-31. 86. Simic T, Sumanovic-Glamuzina D, Boranic M, Vuksic I, Boban A. Breastfeeding practices in Mostar, Bosnia and Herzegovina: cross-sectional self-report study. Croatian medical journal. 2004;45:38-43. 87. Omari AA, Luo C, Kankasa C, Bhat GJ, Bunn J. Infant-feeding practices of mothers of known HIV status in Lusaka, Zambia. Health policy and planning. 2003;18:156-62. 88. Greta A, Sevenhuysen G, Gross U, Sastroamidjojo S. Complementary feeding patterns in Pondok Labu, South Jakarta, Indonesia. Breastfeeding review : professional publication of the Nursing Mothers' Association of Australia. 2002;10:19-24. 89. Pool R, Nyanzi S, Whitworth JA. Breastfeeding practices and attitudes relevant to the vertical transmission of HIV in rural south-west Uganda. Annals of tropical paediatrics. 2001;21:119-25. 90. Reat A, Crixell S, Von Bank J, Thornton H, Friedman BJ. Average infant formula and breastmilk intake among WIC infants reflects food package changes. FASEB Journal. 2014;28.
77
91. Iannotti L, Jean-Louis S, Lesorogol C, Green J, Nickerson N. The effect of nutributter supplementation on complementary feeding practices among young children in an urban slum of Haiti. Annals of Nutrition and Metabolism. 2013;63:1105. 92. Rhodes DG, Adler ME, Clemens JC, Goldman JD, Moshfegh AJ. Dietary intakes of children from birth to 24 months: What We Eat in America, NHANES 2007-2010. FASEB Journal. 2013;27. 93. Stephen AM, Sommerville JP, Henderson H, Pell DA, Allen RE. Food consumption in the Diet and Nutrition Survey of Infants and Young Children 2011 (DNSIYC). Proceedings of the Nutrition Society. 2013;72:E121. 94. Alves CRL, dos Santos LC, de Goulart LMHF, Castro PR. Complementary feeding of children in the second year of life. Revista Paulista de Pediatria. 2012;30:499-506. 95. Dharmendar VG, Narendranath V, Shashibhushan BL. Breast feeding practices in mother's of (urban) Bangalore. Internet Journal of Pediatrics and Neonatology. 2012;14. 96. Burhanuddin M, Rahman SMB, Hussain I. Infants feeding practices among garo and non garo mothers from Netrakona district Bangladesh. World Journal of Medical Sciences. 2011;6:202-8. 97. Piwowarczyk A, Strojnowska E, Tondys E, Zalewski B, Horvath A. Infant and young children feeding practices among mothers in Warsaw and neighbouring districts. Pediatria Polska. 2011;86:242-6. 98. Ali I, Rabbani MW, Sheikh MA. Patterns of feeding in children under eighteen month of age in Multan; a hospital based study. Medical Forum Monthly. 2010;21:37-40. 99. Schiess SA, Grote V, Scaglioni S, et al. Intake of energy providing liquids during the first year of life in five European countries. Clinical Nutrition. 2010;29:726-32. 100. Ly CT, Diallo A, Simondon F, Simondon KB. Early short-term infant food supplementation, maternal weight loss and duration of breast-feeding: A randomised controlled trial in rural Senegal. European journal of clinical nutrition. 2006;60:265-71. 101. Scherbaum V. Infant nutrition in North Iraq. Ernahrungs Umschau. 2003;50:476-80+62. 102. Moore SE, Wimbery Y, Hall RT. Who is not breast-feeding and why. Journal of Pediatrics. 2003;142:737. 103. Galhotra A, Abrol A, Agarwal N, Goel NK, Swami HM. Impact of community based awareness campaign on breast -feeding among lactating women in Chandigarh. Internet Journal of Health. 2008;7:10p. 104. Tjale A. Weaning practices in babies between the ages of six to nine months in the inner city of Johannesburg. Africa Journal of Nursing & Midwifery. 2001;3:42-5. 105. Lindsay Ana C, Machado Marcia T, Sussner Katarina M, Hardwick Cary K, Peterson Karen E. Infant-feeding practices and beliefs about complementary feeding among low-income Brazilian mothers: a qualitative study. Food and nutrition bulletin. 2008;29:15-24. 106. University of Manitoba. Assessment of Complementary Feeding of Canadian Infants. In: ClinicalTrials.gov [Internet]. Bethesda (MD): National Library of Medicine (US). 2000- [cited 2015 March 31]. Available from: https://clinicaltrials.gov/ct2/show/NCT01790542 NLM Identifier: NCT01790542. 107. USDA Food and Nutrition Service; Westat, University of California, Los Angeles, University of California, Berkeley. Feeding My Baby - A National WIC Study. In: ClinicalTrials.gov [Internet]. Bethesda (MD): National Library of Medicine (US). 2000- [cited 2015 March 31]. Available from: http://ClinicalTrials.gov/show/NCT02031978 NLM Identifier: NCT02031978 108. Golley RK, Smithers LG, Mittinty MN, Emmett P, Northstone K, Lynch JW. Diet quality of U.K. infants is associated with dietary, adiposity, cardiovascular, and cognitive outcomes measured at 7-8 years of age. The Journal of nutrition. 2013;143:1611-7. 109. Koletzko B, von Kries R, Closa R, et al. Can infant feeding choices modulate later obesity risk? The American journal of clinical nutrition. 2009;89:1502S-8S. 110. Baird J, Poole J, Robinson S, et al. Milk feeding and dietary patterns predict weight and fat gains in infancy. Paediatr Perinat Epidemiol. 2008;22:575-86.

78
111. Tang M, Krebs NF. High protein intake from meat as complementary food increases growth but not adiposity in breastfed infants: A randomized trial. American Journal of Clinical Nutrition. 2014;100:1322-8. 112. Moreno M. Early infant feeding and obesity risk. JAMA Pediatrics. 2014;168:1084. 113. White M, Kanafani N, Guild C, Rademacher S, Halloran D. Factors associated with rapid infant weight gain. Journal of Investigative Medicine. 2013;61:510. 114. Rall B. Baby food low in protein prevents overweight: The first months of life are crucial. Deutsche Apotheker Zeitung. 2012;152:54-5. 115. Betoko A, Charles MA, De Lauzon-Guillain B. Feeding patterns in The first year of life are related to toddlers' growth. Obesity Facts. 2012;5:241. 116. Kannan S. Finger millet in nutrition transition: An infant weaning food ingredient with chronic disease preventive potential. British Journal of Nutrition. 2010;104:1733-4. 117. Diabetes mellitus: Prevention is already in the baby food? Deutsche Apotheker Zeitung. 2010;150:99. 118. Escribano J, Closa R, Luque V, Zaragoza M, Ferre N, Grote V. The effects of increased protein intake on kidney size and function in healthy infants: A randomized clinical trial. Pediatric Nephrology. 2010;25:576. 119. Waters E, de Silva-Sanigorski A, Burford Belinda J, et al. Interventions for preventing obesity in children. Cochrane Database of Systematic Reviews. 2011. 120. Mahmoud AH, El Anany AM. Nutritional and sensory evaluation of a complementary food formulated from rice, faba beans, sweet potato flour, and peanut oil. Food and nutrition bulletin. 2014;35:403-13. 121. Amagloh FK, Hardacre A, Mutukumira AN, Weber JL, Brough L, Coad J. Sweet potato-based complementary food for infants in low-income countries. Food and nutrition bulletin. 2012;33:3-10. 122. Ibeanu V, Ene-Obong N, Onyechi U, Peter-Ogba G. Nutrient adequacy and organoleptic quality of complementary food mixes made from combinations of digitaria exilis, sesamum indicum and glycine max. Annals of Nutrition and Metabolism. 2013;63:451. 123. Kuong K, Chamnan C, BungTangh T, et al. Development of local processed complementary food products-'WinFoods'-in Cambodia, for food aid programmes for prevention of child malnutrition. Tropical Medicine and International Health. 2013;18:194-5. 124. Allen LH. Adequacy of family foods for complementary feeding. American Journal of Clinical Nutrition. 2012;95:785-6. 125. Okesli V, Gonzalez-Bermudez CA, Vidal-Guevara ML, Dalmau J, Ros G. Complementary feeding: Is the nutritional profile of a homemade baby food the same as the commercial jar baby foods? Acta Pediatrica Espanola. 2011;69:440-8. 126. Amagloh FK, Brough L, Weber JL, Mutukumira AN, Hardacre A, Coad J. Comparison of carbohydrate composition in sweetpotato-and maize-based infant foods. Australasian Medical Journal. 2011;4:765. 127. Anigo KM, Ameh DA, Ibrahim S, Danbauchi SS. Nutrient composition of commonly used complementary foods in North western Nigeria. African Journal of Biotechnology. 2009;8:4211-6. 128. Morante M, Cid I, Torres M, Orsola E, Vila B, Berlanga S. Comparison of nutritional contents between homemade and industrial baby food. Pediatria Catalana. 2009;69:71-4. 129. Pandelova M, Lopez WL, Michalke B, Schramm KW. Ca, Cd, Cu, Fe, Hg, Mn, Ni, Pb, Se, and Zn contents in baby foods from the EU market: comparison of assessed infant intakes with the present safety limits for minerals and trace elements. Journal of Food Composition and Analysis. 2012;27:120-7. 130. Amagloh FK, Coad J. Orange-fleshed sweet potato-based infant food is a better source of dietary vitamin A than a maize-legume blend as complementary food. Food and nutrition bulletin. 2014;35:51-9.
79
131. Amagloh FK, Brough L, Weber JL, Mutukumira AN, Hardacre A, Coad J. Sweetpotato-based complementary food would be less inhibitory on mineral absorption than a maize-based infant food assessed by compositional analysis. International Journal of Food Sciences and Nutrition. 2012;63:957-63. 132. Ikpeme-Emmanuel CA, Ekpeyoung IO, Igile GO. Chemical and protein quality of soybean (Glycine max) and tigernut (Cyperus esculentus) based weaning food. Journal of Food Research. 2012;1:246-54. 133. Munasinghe MADD, Silva KFST, Jayarathne K, Sarananda KH. Development of yoghurt-based weaning foods for 1-3 years old toddlers by incorporation of mung bean (Vigna radiata), soybean (Glycine max) and brown rice (Oryza sativa) for the Sri Lankan market. Journal of Agricultural Sciences (Sri Lanka). 2013;8:43-56. 134. Randhawa S, Kakuda Y, Wong CL, Yeung DL. Microbial safety, nutritive value and residual pesticide levels are comparable among commercial, laboratory and homemade baby food samples - a pilot study. The Open Nutrition Journal. 2012;6:89-96. 135. Amagloh FK, Hardacre A, Weber JL, Brough L, Mutukumira AN, Coad J. Development of sweet potato-soybean blend, an alternative to maize-legume mix as complementary food for infants in Ghana. Proceedings of the Nutrition Society of New Zealand. 2009;34:68-72. 136. Adenuga W. Nutritional and sensory profiles of sweet potato based infant weaning food fortified with cowpea and peanut. Journal of Food Technology. 2010;8:223-8. 137. Asemi Z, Taghizade M. Comparison of quality proteins regarding evaluation in two samples of home made cereal/legume mixtures with a sample of commercial baby food. Journal of Mazandaran University of Medical Sciences. 2009;19:28-35. 138. Nelson-Quartey FC, Amagloh FK, Oduro IN, Ellis WO. Formulation of an infant food based on breadfruit (Artocarpus altilis) and breadnut (Artocarpus camansi). Acta Horticulturae. 2007:215-23. 139. Marzec A, Marzec Z, Zareba S, Dobrowolska A. Calcium and phosphorus content in some food products assigned for infants and small children nutrition. / Zawartośc´ wapnia i fosforu w wybranych produktach przeznaczonych do zywienia niemowlat i maych dzieci. Zywienie Czowieka i Metabolizm. Warszawa; Poland: Instytut Zywności i Zywienia; 2007:852-7. 140. Nnam NM. Chemical evaluation of multimixes formulated from some local staples for use as complementary foods in Nigeria. Plant Foods for Human Nutrition. 2000;55:255-63. 141. Marzec A, Marzec Z, Zareba S. Calcium and magnesium in food products for infant and children nutrition. / Wapn´ i magnez w produktach spozywczych przeznaczonych do zywienia niemowlat i dzieci. Journal of Elementology. 2004;9:421-7. 142. Perales S, Barberá R, Lagarda MJ, Farré R. Bioavailability of calcium from milk-based formulas and fruit juices containing milk and cereals estimated by in vitro methods (solubility, dialyzability, and uptake and transport by Caco-2 cells). Journal of Agricultural and Food Chemistry. 2005;53:3721-6. 143. Research Institute of Child Nutrition, Dortmund. Modification in Complementary Food Composition to Improve the Status of Iron and Fatty Acids in Infants. In: ClinicalTrials.gov [Internet]. Bethesda (MD): National Library of medicine (US). 2000- [2015 Apr 12]. Available from: http://ClinicalTrials.gov/show/NCT00571948 NLM Identifier: NCT00571948. 144. Elliott CD, Conlon MJ. Toddler foods, children's foods: assessing sodium in packaged supermarket foods targeted at children. Public health nutrition. 2011;14:490-8. 145. Rothman M, Moreotsenye R, Berti C, et al. Quantities and types of foods reported for complementary feeding in a peri-urban area of South Africa. Annals of Nutrition and Metabolism. 2013;63:617-8. 146. Faber M, Benadé AJS. Perceptions of infant cereals and dietary intakes of children aged 4-24 months in a rural South African community. International Journal of Food Sciences and Nutrition. 2001;52:359-65.

80
147. Bisimwa G, Owino VO, Bahwere P, et al. Randomized controlled trial of the effectiveness of a soybean-maize-sorghum-based ready-to-use complementary food paste on infant growth in South Kivu, Democratic Republic of Congo. The American journal of clinical nutrition. 2012;95:1157-64. 148. Roche ML, Creed-Kanashiro HM, Tuesta I, Kuhnlein HV. Infant and young child feeding in the Peruvian Amazon: the need to promote exclusive breastfeeding and nutrient-dense traditional complementary foods. Maternal & child nutrition. 2011;7:284-94. 149. Phuka JC, Maleta K, Thakwalakwa C, et al. Complementary feeding with fortified spread and incidence of severe stunting in 6- to 18-month-old rural Malawians. Arch Pediatr Adolesc Med. 2008;162:619-26. 150. Shamim S, Naz F, Jamalvi SW, Ali SS. Effect of weaning period on nutritional status of children. J Coll Physicians Surg Pak. 2006;16:529-31. 151. Dura Trave T, Diaz Velaz L. [Prevalence of iron deficiency in healthy 12-month-old infants]. An Esp Pediatr. 2002;57:209-14. 152. Hakim MA, Alam MA, Musa MH, Rouf SMA, Alam MA, Sarker MZI. Formulation and substantiation of homemade complementary baby food by selective feeding trial. Journal of Food, Agriculture and Environment. 2013;11:346-53. 153. Faber M, Benade AJS. Breastfeeding, complementary feeding and nutritional status of 6 - 12-month-old infants in rural KwaZulu-Natal. South African Journal of Clinical Nutrition. 2007;20:16-24. 154. Patel MP, Sandige HL, Ndekha MJ, Briend A, Ashorn P, Manary MJ. Supplemental feeding with ready-to-use therapeutic food in Malawian children at risk of malnutrition. Journal of Health, Population and Nutrition. 2005;23:351-7. 155. Lind T, Persson LA, Lonnerdal B, Stenlund H, Hernell O. Effects of weaning cereals with different phytate content on growth, development and morbidity: A randomized intervention trial in infants from 6 to 12 months of age. Acta Paediatrica, International Journal of Paediatrics. 2004;93:1575-82. 156. Mamiro PS, Kolsteren PW, Van Camp JH, Roberfroid DA, Tatala S, Opsomer AS. Processed Complementary Food Does Not Improve Growth or Hemoglobin Status of Rural Tanzanian Infants from 6-12 Months of Age in Kilosa District, Tanzania. Journal of Nutrition. 2004;134:1084-90. 157. Pham Van P, Nguyen Van H, Salvignol B, et al. Complementary foods fortified with micronutrients prevent iron deficiency and anemia in Vietnamese infants. Journal of Nutrition. 2010;140:2241-7. 158. Krebs NF, Mazariegos M, Chomba E, et al. Randomized controlled trial of meat compared with multimicronutrient-fortified cereal in infants and toddlers with high stunting rates in diverse settings. American Journal of Clinical Nutrition. 2012;96:840-7. 159. Ren L. Effect assessment of nutrition intervention in 6-24 months old infants and young children. Modern Preventive Medicine. 2014;41:1984-6. 160. Macharia-Mutie CW. Efficacy of amaranth grain (Amaranthus cruentus) on anaemia and iron deficiency in Kenyan pre-school children. Wageningen; Netherlands: Wageningen Universiteit (Wageningen University); 2012. 161. Sandeep S, Mona V. Nutritional rehabilitation using energy dense local food as ready to use therapeutic food in hospitalized malnourished children: case for primary prevention at grass root levels. Journal of Medicine in the Tropics. 2014;16:22-6. 162. Phu PV, Hoan NV, Salvignol B, et al. A six-month intervention with two different types of micronutrient-fortified complementary foods had distinct short- and long-term effects on linear and ponderal growth of Vietnamese infants. Journal of Nutrition. 2012;142:1735-40. 163. Mazariegos M, Hambidge KM, Westcott JE, et al. Neither a zinc supplement nor phytate-reduced maize nor their combination enhance growth of 6- to 12-month-old Guatemalan infants. Journal of Nutrition. 2010;140:1041-8.

81
164. Matthew AK, Amodu AD, Sani I, Solomon SD. Infant feeding practices and nutritional status of children in North Western Nigeria. Asian Journal of Clinical Nutrition. 2010;2:119-29. 165. Phuka J, Thakwalakwa C, Maleta K, et al. Supplementary feeding with fortified spread among moderately underweight 6-18-month-old rural Malawian children. Maternal and Child Nutrition. 2009;5:159-70. 166. Martin-Prével Y, Delpeuch F, Traissac P, et al. Deterioration in the nutritional status of young children and their mothers in Brazzaville, Congo, following the 1994 devaluation of the CFA franc. Bulletin of the World Health Organization. 2000;78:108-18. 167. Abidoye RO, Nwachie AN, Ekanem EE. A comparative study of the weaning practices and growth pattern in 3-24 month old infants fed formula and food in Nitel Health Centers and PHC's of Mushin Local Government area of Lagos, Nigeria. Nutrition Research. 2000;20:1377-87. 168. Antunes H, Costa-Pereira A, Cunha I, Raposo T, Garcia M, Beirao I. Prevalence of iron-deficiency anemia according to infant nutrition regime. Acta Med Port. 2002;15:193-7.