Embed Size (px)
Citation preview

3 «* 9
UNCLASSIFIED
HEALTH DIVISION
REPORT FOR THE MONTH
ENDING JANUARY 31,1950
ORNL 718
OAK RIDGE NATIONAL LABORATORY
CENTRAL RESEARCH LIBRARYCIRCULATION SECTION
4500N ROOM 175
LIBRARY LOAN COPYDO NOT TRANSFER TO ANOTHER PERSON
If you wish someone else to see thisreport, send in name with report and
the library will arrange a loan.
OAK RIDGE NATIONAL LABORATORYOPERATED BY
CARBIDE AND CARBON CHEMICALS DIVISIONUNION CARBIDE AND CARBON CORPORATION
row
POST OFFICE BOX P
OAK RIDBE, TENNESBEE
UNCLASSIFIED
UNCLASSIFIED
ORNL 718
This document consists
of 20 pages.Copy O of 72.Series A
Contract No. W-7AQ5 eng 26
HEALTH DIVISION
REPORT FOR THE MONTH ENDING JANUARY 31, 1950
J. S. FELTON, lit.D.
DATE ISSUED SEP 1 J 1950
OAK RIDGE NATIONAL LABORATORY
operated byCARBIDE AND CARBON CEEMCALS DIVISION
Union Carbide and Carbon CorporationPost Office Box P
Oak Ridge, Tennessee
UNCLASSIFIED I MARIETTA ENERGY SYSTEMS LIBRARIES
3 Mi45k> 03bD7b3 1
-2- OHNL-718UNCLASSIFIED January 31, 1950
Oak Ridge National Laboratory Internal Distribution as Follows:
1. G. T. Felbeck (C & CCC, N. Y., N. Y.)2-3. 706-A Library
4. 706-B Library5-6. Training School Library
7. Health Physics Library8-9. Biology Library
10-13. Central Files14. E. J. Murphy15. J. A. Swartout16. A. M. Weinberg17. J. S. Felton, M. D.18. A. Hollaender19. E. Z. Morgan20. J. H. Frye, Jr.21. Forrest Western
22. E. A. Bagley23. C. E. Larson
24. D. W. Cardwell25. J. H. Gillette
Oak Ridge National Laboratory External Distribution as Follows:
26. A. H. Holland, M. D., (AEC, Townsite)27. A. G. Kammer, M. D., Medical Director, C & CCC, South Charleston, W. Va.28. Robert J. Hasterlik, M. D., Medical Director, Argonne National Laboratory
29-35. Argonne National Laboratory36-39. Brookhaven National Laboratory40-43. University of California Radiation Laboratory44-45. New York Directed Operations46-47. Fanford Engineer Works48-49. General Electric, Schenectady
50. Patent Branch, Washington51-65. Technical Information Division
66. Charles L. Dunham, Jr., M. D., Ass't. Chief, Medical Branch, Div. ofBiology and Medicine, AEC, Washington.
67-68. AEC, WashingtonT. L. Shipraan, M. D., Medical Director, Los Alamos69,
70-72. Los Alamos
UNCLASSIFIED
-3- OENL-718
UNCLASSIFIED January 31, 1950
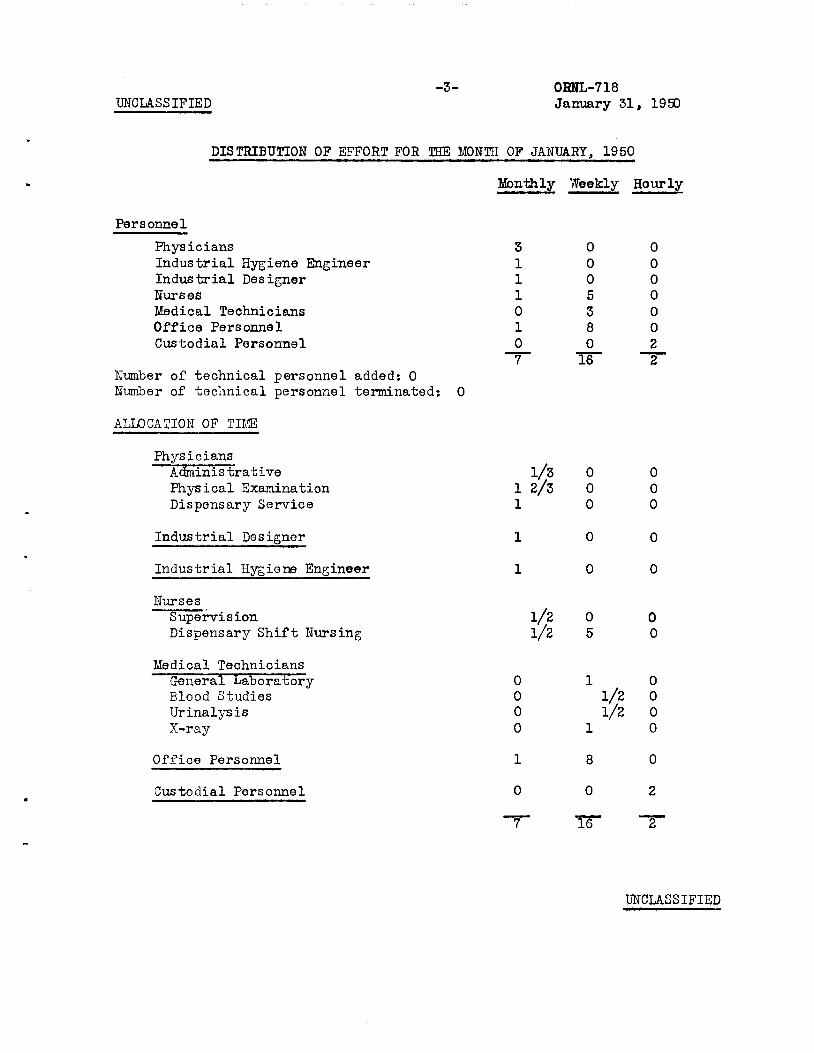
DISTRIBUTION OF EFFORT FOR THE MONTH OF JANUARY, 1950
Monthly Weekly Hourly
Personnel
PhysiciansIndustrial Hygiene EngineerIndustrial DesignerNurses
Medical Technicians
Office Personnel
Custodial Personnel
Number of technical personnel added: 0Number of technical personnel terminated: 0
ALLOCATION OF TIME
PhysiciansAdministrative l/3 0 0Physical Examination 1 2/3 0 0Dispensary Service 10 0
Industrial Designer 10 0
Industrial Hygiene Engineer 10 0
Nurses
Supervision l/2 0 0Dispensary Shift Nursing l/2 5 0
Medical Technicians
General Laboratory 0 10Blood Studies 0 l/2 0Urinalysis 0 l/2 0X-ray 0 10
Office Personnel 18 0
Custodial Personnel 0 0 2
~T ~W T
3 0 0
1 0 0
1 0 0
1 5 0
0 3 0
1 8 0
0 0 2
7 18" 2
UNCLASSIFIED
-4- 0RNL-718
January 31, 1950
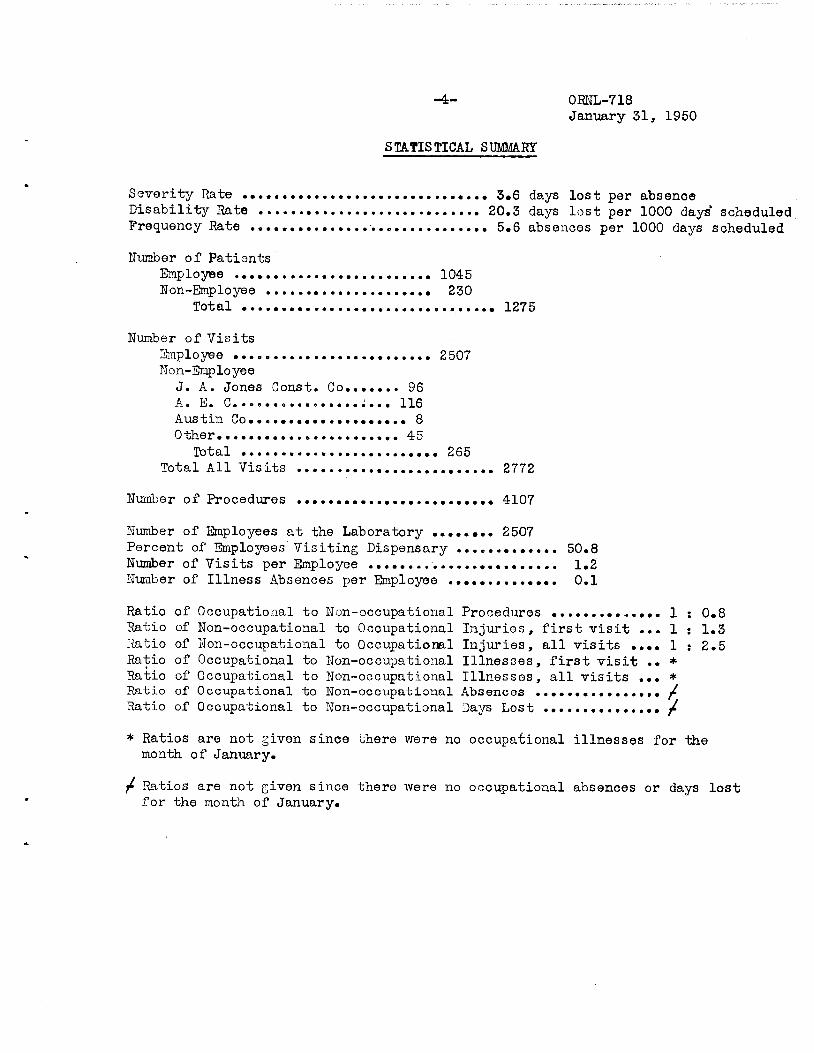
STATISTICAL SUMMARY
Severity Rate 3.6 days lost per absenceDisability Rate 20.3 days lost per 1000 days' scheduledFrequency Rate 5.6 absences per 1000 days scheduled
Number of Patients
Employee 1045Non-Employee 230
Total 1275
Number of Visits
Employee 2507Non-Employee
J. A. Jones Const. Co....... 96
A. E. C :... 116
Austin Co 8
Other..... 45
Total 265
Total All Visits 2772
Number of Procedures 4107
Number of Employees at the Laboratory 2507Percent of Employees Yisiting Dispensary 50.8Number of Visits per Employee 1.2Number of Illness Absences per Employee 0.1
Ratio of Occupational to Non-occupational Procedures .............. 1 • 0.8Ratio of Non-occupational to Occupational Injuries, first visit ... 1 : 1.3Ratio of Non-occupational to Occupational Injuries, all visits .... 1 • 2.5Ratio of Occupational to Non-occupational Illnesses, first visit .. *Ratio of Occupational to Non-occupational Illnesses, all visits ... *Ratio of Occupational to Non-occupational Absences /Ratio of Occupational to Non-occupational Days Lost /
* Ratios are not given since there were no occupational illnesses for themonth of January.
/ Ratios are not given since there were no occupational absences or days lostfor the month of January.
-5- 0RNL-718
January 31, 1950
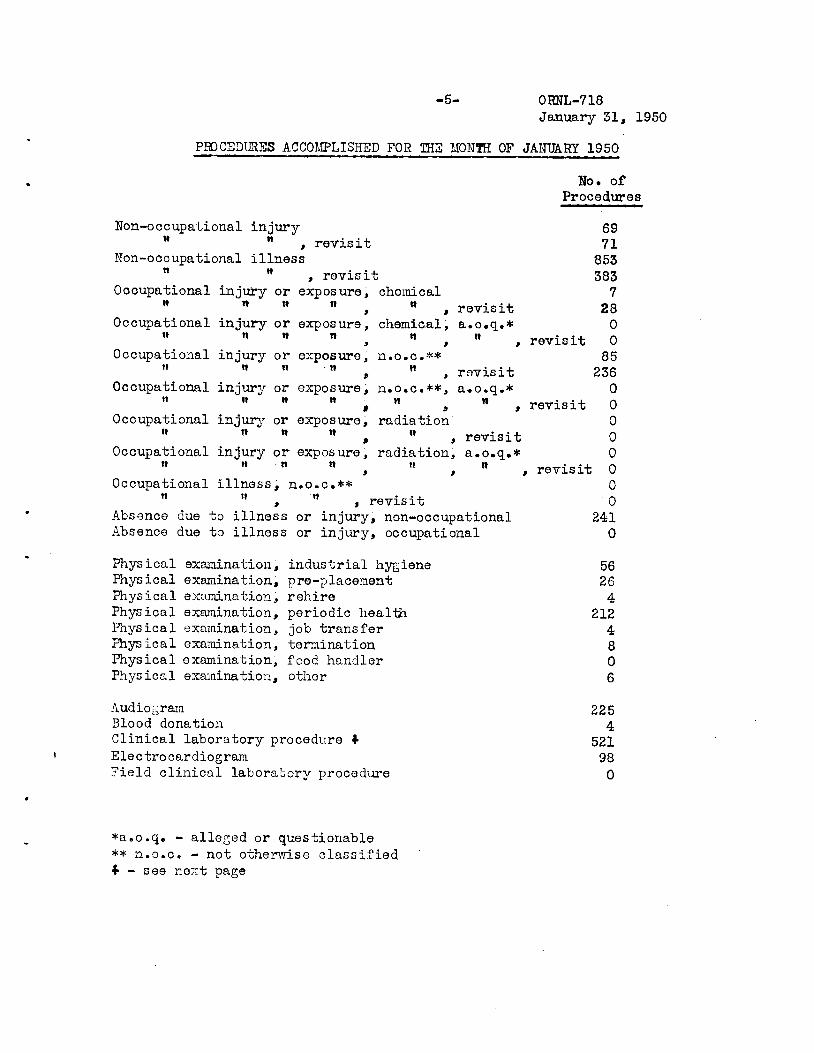
PROCEDURES ACCOMPLISHED FOR THE MONTH OF JANUARY 1950
No. of
Procedures
Non-occupational injuryw " , revisit
Non-occupational illness" n , revisit
Occupational injury or exposure, chemical" n tt B , " , revisit
Occupational injury or exposure, chemical, a.o.q.*« n it it n n
> > t
Occupational injury or exposure, n.o.c.**n " •" , " , revisit
Occupational injury or exposure, n.o.c.**, a.o.q.*« n tt w - n tt
» a t
Occupational injury or exposure, radiationn tt M , n revisit
Occupational injury or exposure, radiation, a.o.q.*w " •" n , " , n revisit
Occupational illness, n.o.c.** 0
" " , M , revisit 0Absence due to illness or injury, non-occupational 241Absence due to illness or injury, occupational 0
PhysicalPhysicalPhysicalPhysicalPhysicalPhysicalPhysicalPhysical
examination,examination,examination,
examination,examination,examination,examination,examination,
industrial hygienepre-placementrehire
periodic healthjob transfertermination
food handler
other
AudiogramBlood donation
Clinical laboratory procedure +ElectrocardiogramField clinical laboratory procedure
*a.o.q. - alleged or questionable** n.o.c. - not otherwise classified
♦ - see next page
revis it
revisit
69
71
853
383
7
28
0
0
85
236
0
0
0
0
0
0
56
26
4
212
4
8
0
6
225
4
521
98
0
-6- ORNL-718
January 31, 1950
No. of
Procedures
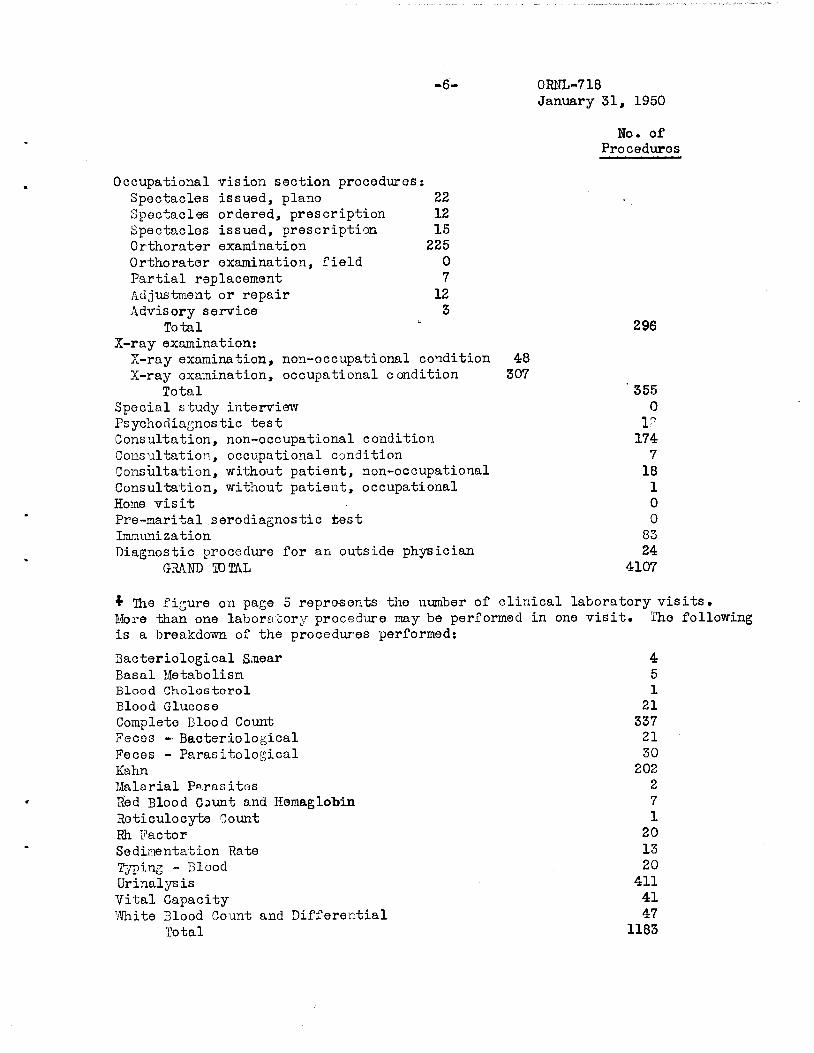
Occupational vision section procedures:Spectacles issued, piano 22Spectacles ordered, prescription 12Spectacles issued, prescription 15Orthorater examination 225
Orthorater examination, field 0Partial replacement 7Adjustment or repair 12Advisory service 3
Total
X-ray examination:X-ray examination, non-occupational condition 48X-ray examination, occupational condition 307
Total
Special study interviewPsychodiagnostic testConsultation, non-occupational conditionConsultation, occupational conditionConsultation, without patient, non-occupationalConsultation, without patient, occupationalHome visit
Pre-marital serodiagnostic testImmunization
Diagnostic procedure for an outside physicianGRAND TOTAL
296
355
0
174
7
18
1
0
0
83
24
4107
♦ The figure on page 5 repre-sents the number of clinical laboratory visits.More than one laboratory procedure may be performed in one visit. The followingis a breakdown of the procedures performed:
Bacteriological Sniear 4Basal Metabolism 5
Blood Cholesterol 1
Blood Glucose 21
Complete Blood Count 337Feces - Bacteriological 21Feces - Parasitological 30Kahn 202
Malarial Parasites 2
Red Blood Gaunt and HemagloTbin 7Reticulocyte Count 1Rh Factor 20Sedimentation Rate 13Typing - Blood 20Urinalysis 411Vital Capacity 41White Blood Count and Differential 47
Total 1183
-7- OHNL-718
January 31, 1950
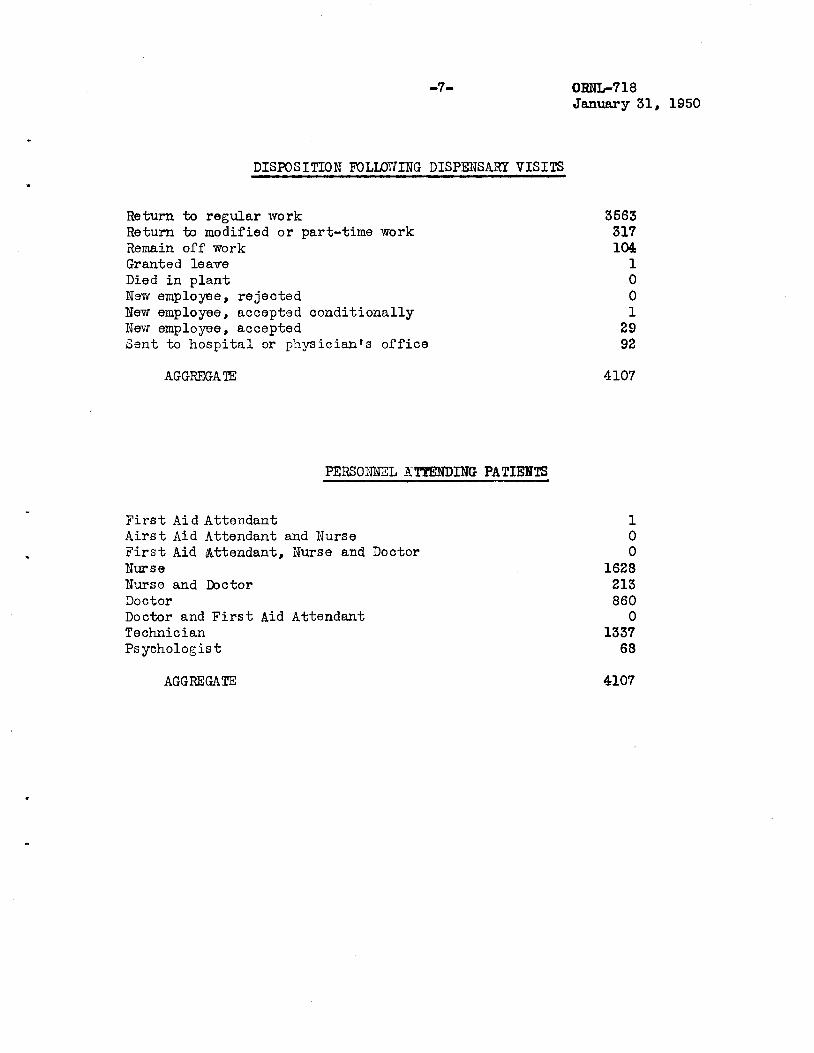
DISPOSITION FOLLOWING DISPENSARY VISITS
Return to regular work 3563Return to modified or part-time work 317Remain off work 1C4
Granted leave 1
Died in plant 0New employee, rejected 0New employee, accepted conditionally 1New employee, accepted 29Sent to hospital or physician's office 92
AGGREGATE 4107
PERSONNEL ATTENDING PATIENTS
First Aid Attendant 1
Airst Aid Attendant and Nurse 0
First Aid Attendant, Nurse and Doctor 0Nurse 1628
Nurse and Doctor 213
Doctor 860
Doctor and First Aid Attendant 0
Technician 1337
Psychologist 68
AGGREGATE 4107
o10
o>
o
Bra
w<
lH<D
CO
oo
CQ
fl«1
Ota
to
S2!.£>
CO
«{
1d
00
M1
81
ON
NO
>W
10
^S
^tO
Orl^(0
0)«
Ot-l0
05
in
(»
N|
•*O
CO
©lO
^N
(O
tO
tO
HC
lH
NH
lO
NN
tO
tO
in
to|H
ICO
U3
CJH
I6
0t0
05
^Jtr
Hl-i
O^
Wi-J
(O
MO
HN
HN
HIO
HH
HH
-aca
3
ES
aS
sS
oJcd
oS
aS
csS
cS
aJcJcJcS
GJria
ScS
aS
cS
aS
aS
TJ^T
?^T
5T
3^T
3'U
'tJ'r
>'O
TJ,T
5,T
3't
>rC
lra
'n,T
3ra
HN
W^I1
0(O
SO
OC
iO
HN
l0
^tD
Cn
wC
»lO
CO
NH
HH
HH
HH
NN
lO
fO
lO
3
-9- ORNL-718
January 31, 1950
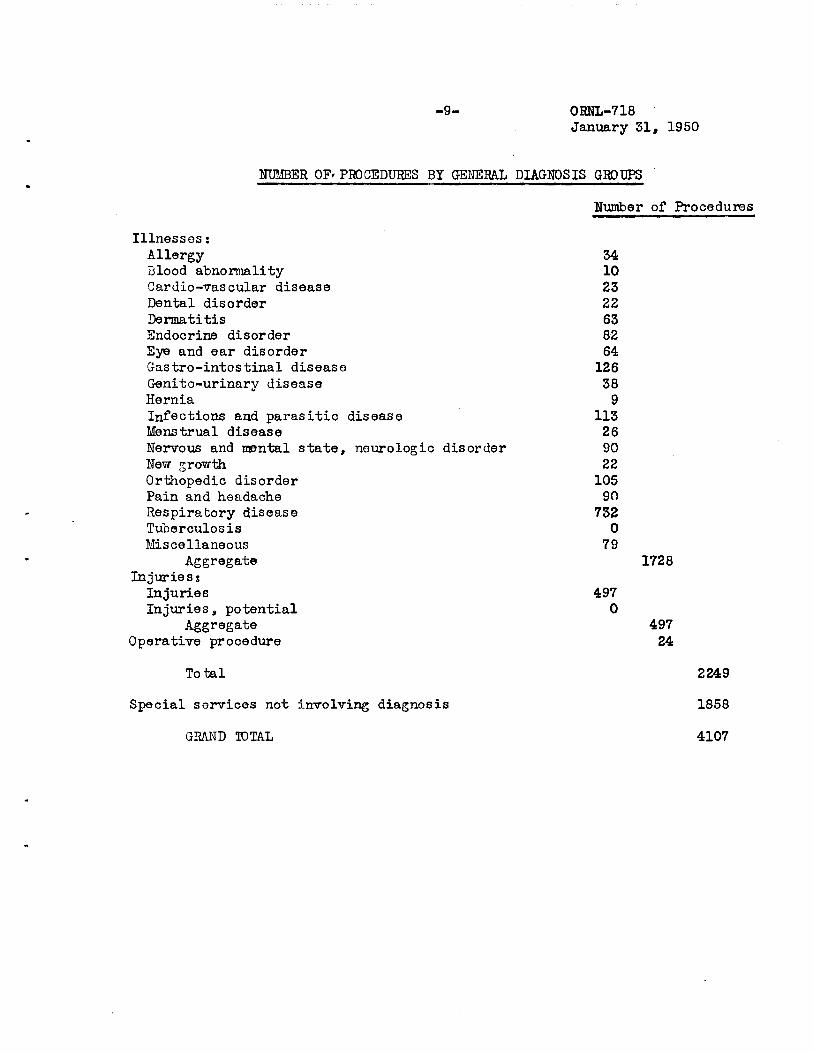
NUMBER OF*PROCEDURES BY GENERAL DIAGNOSIS GROUPS
Number of Procedures
Illnesses:
Allergy 34
Blood abnormality 10
Cardio-vascular disease 23
Dental disorder 22
Dermatitis 63
Endocrine disorder 82
Eye and ear disorder 64
Gastro-intestinal disease 126
Genito-urinary disease 38
Hernia 9
Infections and parasitic disease 113
Menstrual disease 26
Nervous and mental state, neurolog:Lc disorder 90
New growth 22
Orthopedic disorder 105
Pain and headache 90
Respiratory disease 732Tuberculosis 0
Miscellaneous 79
Aggregate 1728
Injuries:Injuries 497
Injuries, potential 0
Aggregate 497
Operative procedure 24
Total 2249
Special services not involving diagnosis 1858
GRAND TOTAL 4107
-10- 0RNL-718
January 31, 1950
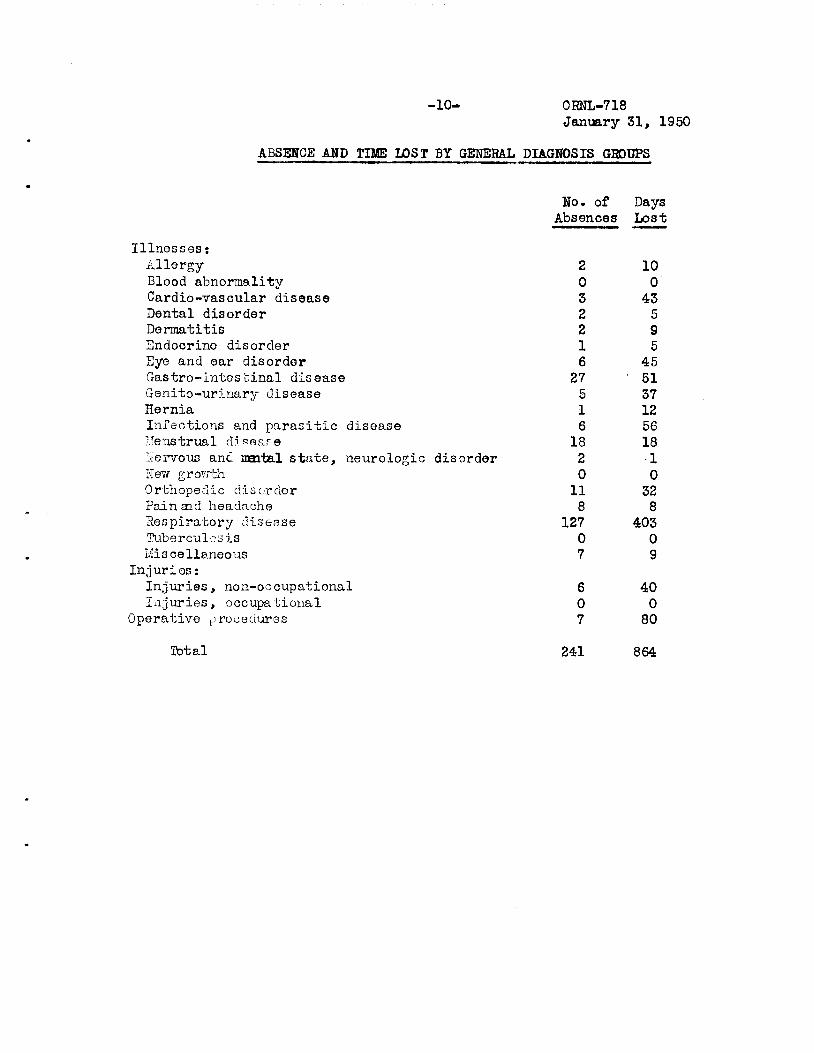
ABSENCE AND TIME LOST BY GENERAL DIAGNOSIS GROUPS
Illnesses:
AllergyBlood abnormalityCardio-vascular diseaseDental disorder
Dermatitis
Endocrine disorder
Eye and ear disorderGastro-intestinal disease
Genito-urinary diseaseHernia
Infections and parasitic diseaseJJenstrual disease
llervous and maatal state, neurologic disorderHew growthOrthopedic disorderPain aid headache
Respiratory diseaseTuberculosis
Mis cellanoous
Injuries:Injuries, non-occupationalInjuries, occupational
Operative procedures
Total 241 864
No. of DaysAbsences Lost
2 10
0 0
3 43
2 5
2 9
1 5
6 45
27 51
5 37
1 12
6 56
18 18
2 •1
0 0
11 32
8 8
127 403
0 0
7 9
6 40
0 0
7 80
-11- ORNL-718
January 31, 1950
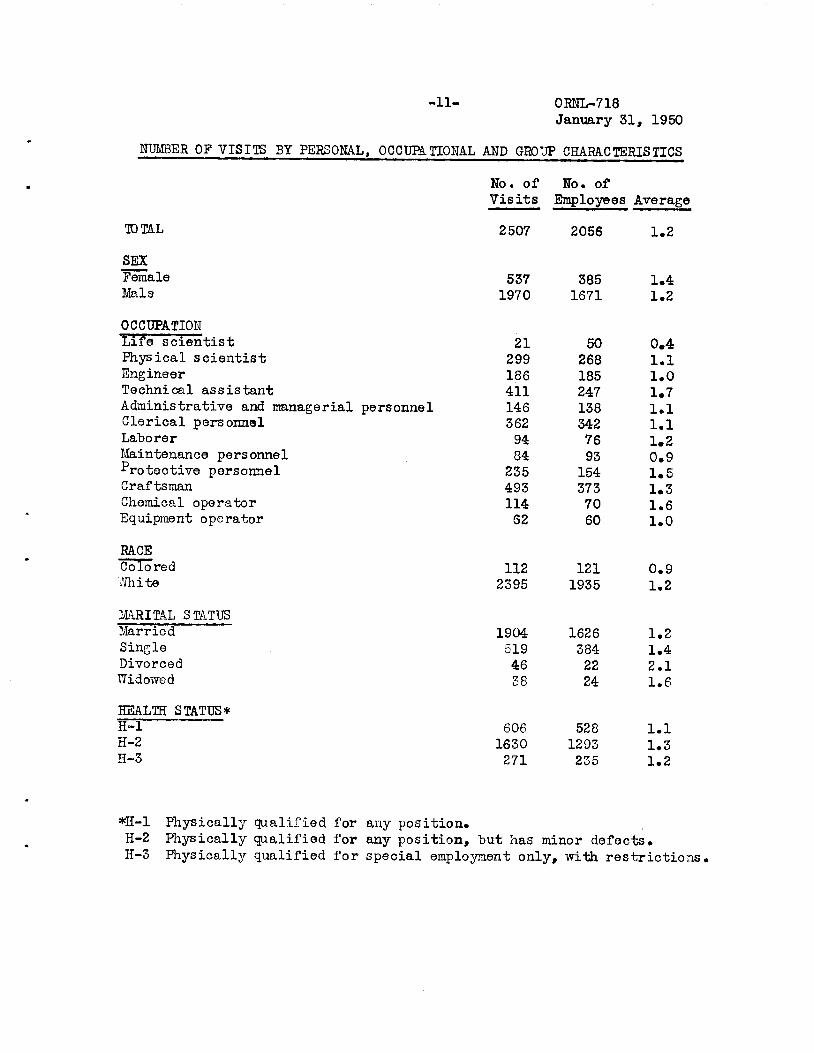
NUMBER OF VISITS BY PERSONAL, OCCUPATIONAL AND GROUP CHARACTERISTICS
No. of No. of
Visits Employees Average
TOTAL
SEX
Female
Male
OCCUPATION
Life scientist
Physical scientistEngineerTechnical assistant
Administrative and managerial personnelClerical personnelLaborer
Maintenance personnelProtective personnelCraftsman
Chemical operatorEquipment operator
RACE
Colored
White
MARITAL STATUS
Married
SingleDivorced
Widowed
HEALTH STATUS*
H-2
H-3
2507 2056 1.2
537 385 1.4
1970 1671 1.2
21 50 0.4299 268 1.1
186 185 1.0
411 247 1.7
146 138 1.1
362 342 1.1
94 76 1.2
84 93 0.9
235 154 1.5
493 373 1.3
114 70 1.6
62 60 1.0
112 121 0.9
2395 1935 1.2
1904 1626 1.2
519 384 1.4
46 22 2.1
38 24 1.6
606 528 1.1
1630 1293 1.3
271 235 1.2
*H-1 Physically qualified for any position.H-2 Physically qualified for any position, but has minor defects.H-3 Physically qualified for special employment only, with restrictions.
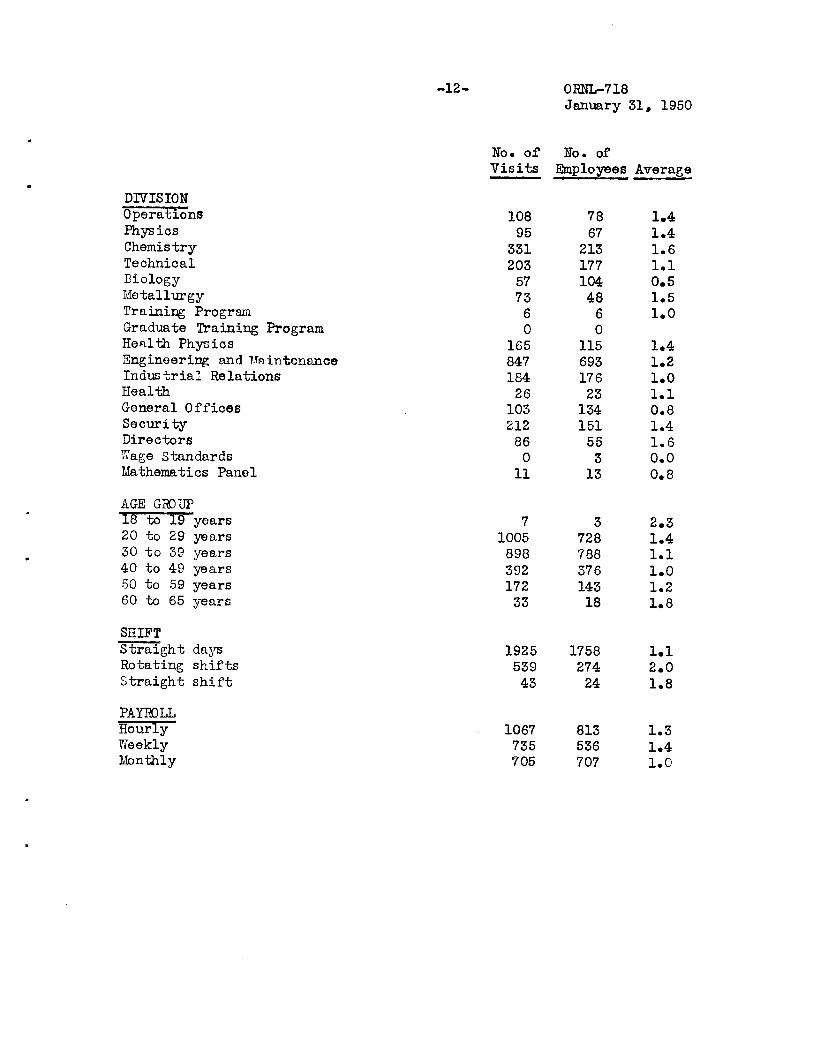
DIVISION
OperationsPhysicsChemistryTechnical
BiologyMetallurgyTraining ProgramGraduate Training ProgramHealth PhysicsEngineering and MaintenanceIndustrial Relations
Health
General Offices
SecurityDirectors
Wage StandardsMathematics Panel
AGE GROUP
18 to 19 years20 to 29 years30 to 39 years40 to 49 years50 to 59 years60 to 65 years
SHIFT
Straight daysRotating shiftsStraight shift
PAYROLL
HourlyWeeklyMonthly
-12- ORNL-718
January 131, 1950
No. of No. of
Visits Employees Average
108 78 1.4
95 67 1.4
331 213 1.6
203 177 1.1
57 104 0.5
73 48 1.5
6 6 1.0
0 0
165 115 1.4
847 693 1.2
184 176 1.0
26 23 1.1
103 134 0.8
212 151 1.4
86 55 1.6
0 3 0.0
11 13 0.8
7 3 2.3
1005 728 1.4
898 788 1.1
392 376 1.0
172 143 1.2
33 18 1.8
1925 1758 1.1
539 274 2.0
43 24 1.8
1067 813 1.3
735 536 1.4
705 707 1.0
-13- ORNL-718
January 31, 1950
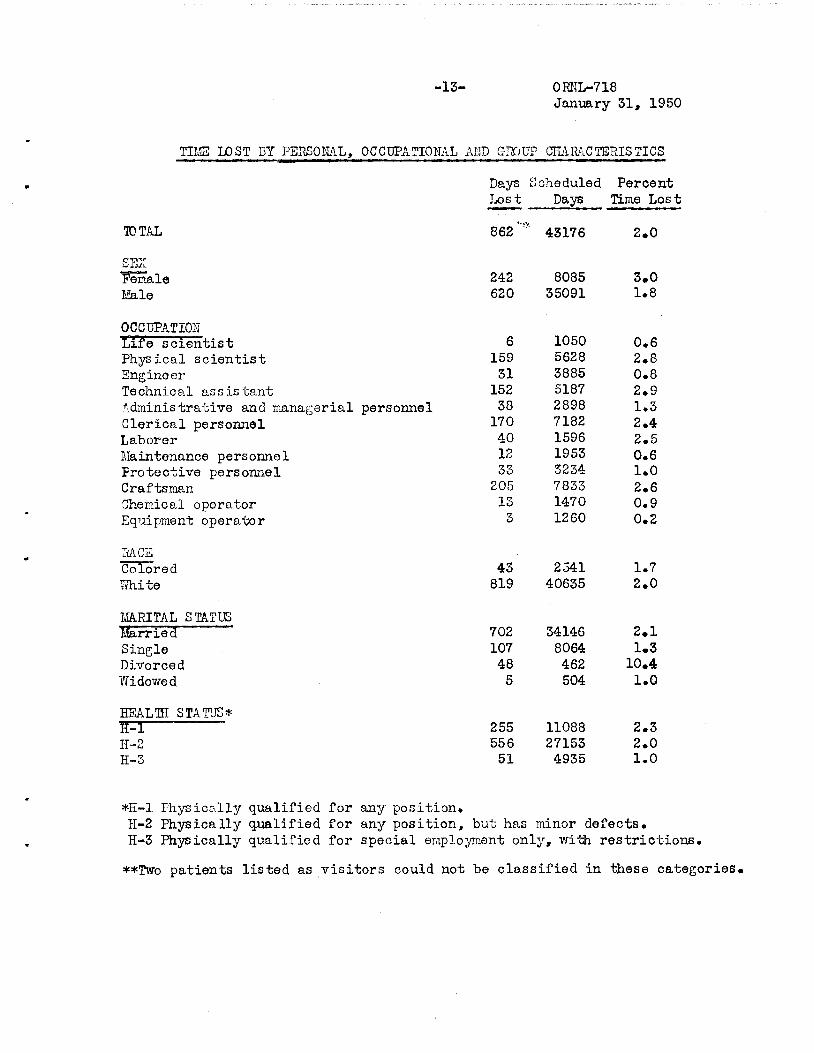
TIMS LOST BY PERSONAL, OCCUPATIONAL AND GROUP CHARACTERISTICS
Days Scheduled Percent^°s^ Days Time Lost
TOTAL
SEX
Female
Male
OCCUPATION
Life scientist
Physical scientistEngineerTechnical assistant
Administrative and managerial personnelClerical personnelLaborer
Maintenance personnelProtective personnelCraftsman
Chemical operatorEquipment operator
MCE
Colored
White
MARITAL STATUS
Married
SingleDivorced
Widowed
HEALTH STATUS*
B=IH-2
H-3
862 43176 2.0
242 8085 3.0
620 35091 1.8
6 1050 0.6
159 5628 2.8
31 3885 0.8
152 5187 2.9
38 2898 1.3
170 7182 2.4
40 1596 2.5
12 1953 0.6
33 3234 1.0
205 7833 2.6
13 1470 0.9
3 1260 0.2
43 2541 1.7
819 40635 2.0
702 34146 2.1
107 8064 1.3
48 462 10.4
5 504 1.0
255 11088 2.3
556 27153 2.0
51 4935 1.0
*H-1 Physically qualified for any position.H-2 Physically qualified for any position, but has minor defects.H-3 Physically qualified for special employment only, with restrictions.
**Two patients listed as visitors could not be classified in these categories.
DIVISION
OperationsPhysicsChemistryTechnical
BiologyMetallurgyTraining ProgramGraduate Training ProgramHealth PhysicsEngineering and MaintenanceIndustrial Relations
Health
General Office
SecurityDirectors
Wage StandardsMathematics Panel
AGE GROUP
18 to 19 years20 to 29 years30 to 39 years40 to 49 years50 to 59 years60 to 65 years
SHIFT
Straight daysRotating shiftsStraight shift
PAYROLL
HourlyWeeklyMonthly
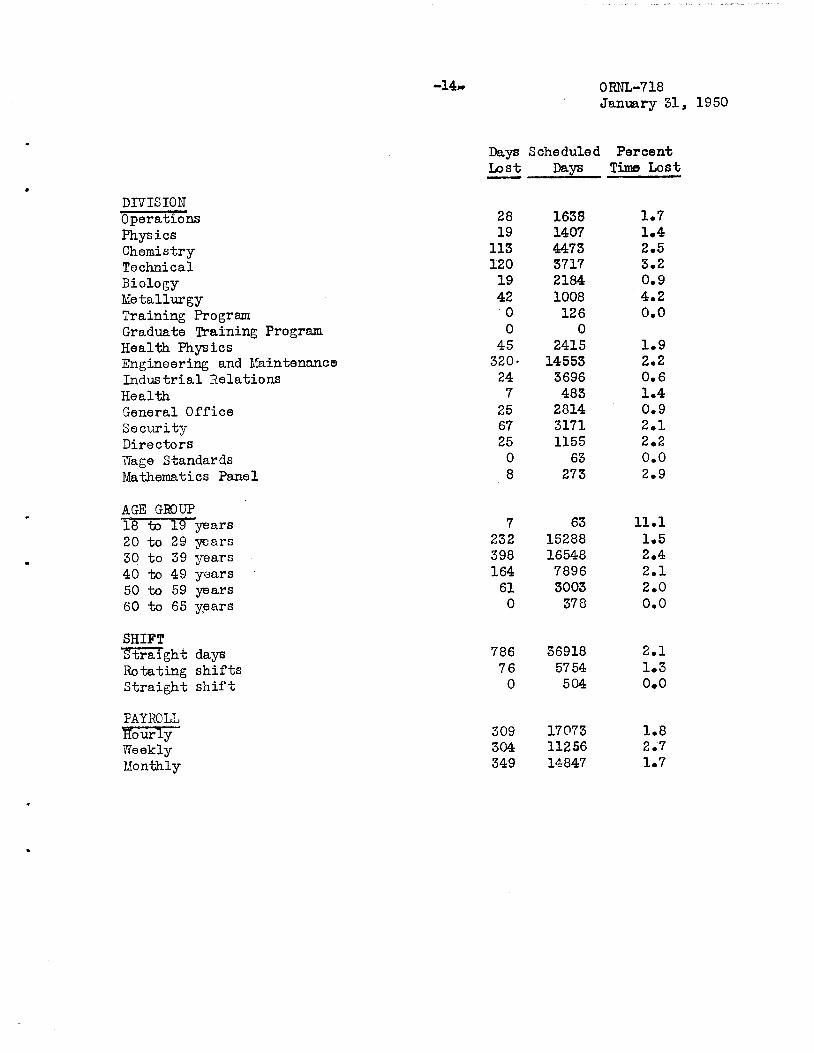
-14- ORNL-718
January 31, 1950
Days Scheduled PercentLost Days Time Lost
28 1638 1.7
19 1407 1.4
113 4473 2.5
120 3717 3.2
19 2184 0.9
42 1008 4.2
0 126 0.0
0 0
45 2415 1.9
320* 14553 2.2
24 3696 0.6
7 483 1.4
25 2814 0.9
67 3171 2.1
25 1155 2.2
0 63 0.0
8 273 2.9
7 63 11.1
232 15288 1.5
398 16548 2.4
164 7896 2.1
61 3003 2.0
0 378 0.0
786 36918 2.1
76 5754 1.3
0 504 0.0
309 17073 1.8
304 11256 2.7
349 14847 1.7
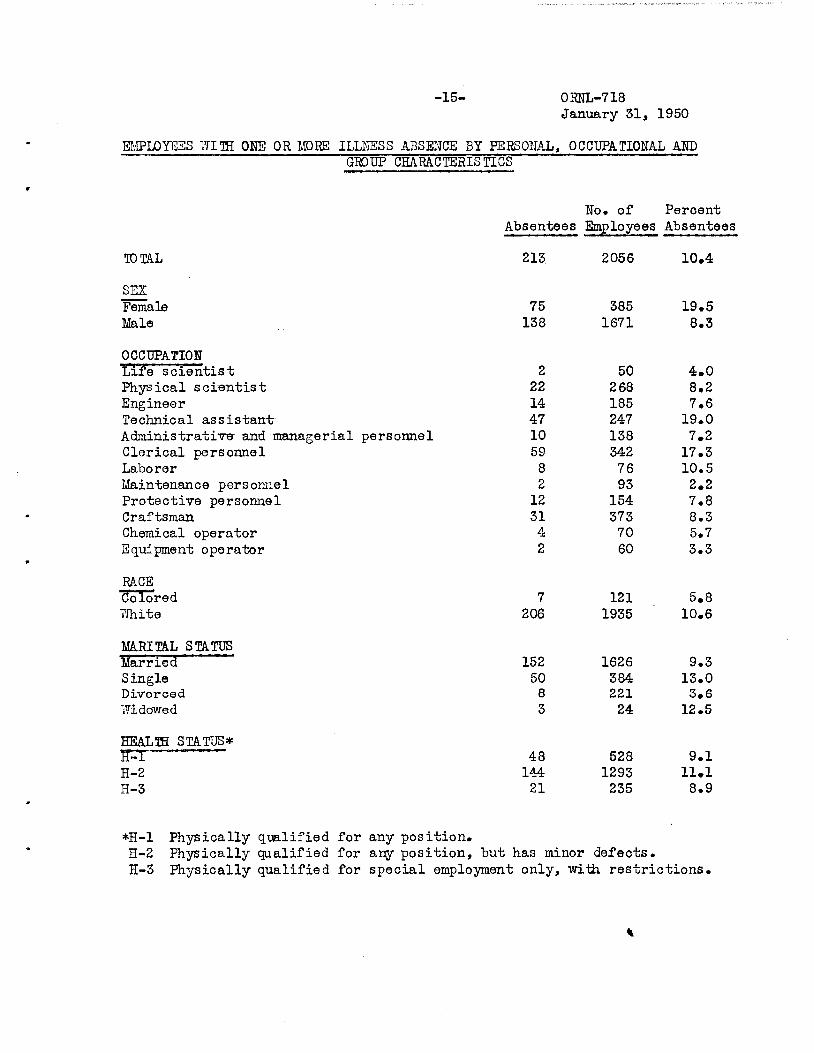
-15- ORNL-718
January 31, 1950
EMPLOYEES WITH ONE OR MORE ILLNESS ABSENCE BY PERSONAL, OCCUPATIONAL ANDGROUP CHARACTERISTICS
TOTAL
SEX
Female
Male
OCCUPATION
Life scientist
Physical scientistEngineerTechnical assistant
Administrative and managerial personnelClerical personnelLaborer
Maintenance personnelProtective personnelCraftsman
Chemical operatorEquipment operator
RACE
ColoredWhite
MARITAL STATUS
Married ""SingleDivorced
Widowed
HEALTH STATUS*
H=I—'H-2
H-3
No. of Percent
Absentees Employees Absentees
213
75
138
2
22
14
47
10
59
8
2
12
31
4
2
7
206
152
50
8
3
48
144
21
2056 10.4
385 19.5
1671 8.3
50 4.0
268 8.2
185 7.6
247 19.0
138 7.2
342 17.3
76 10.5
93 2.2
154 7.8
373 8.3
70 5.7
60 3.3
121 5.8
1935 10.6
1626 9.3
384 13.0
221 3.6
24 12.5
528 9.1
1293 11.1
235 8.9
*H-1 Physically qualified for any position.H-2 Physically qualified for any position, but has minor defects.H-3 Physically qualified for special employment only, with restrictions.
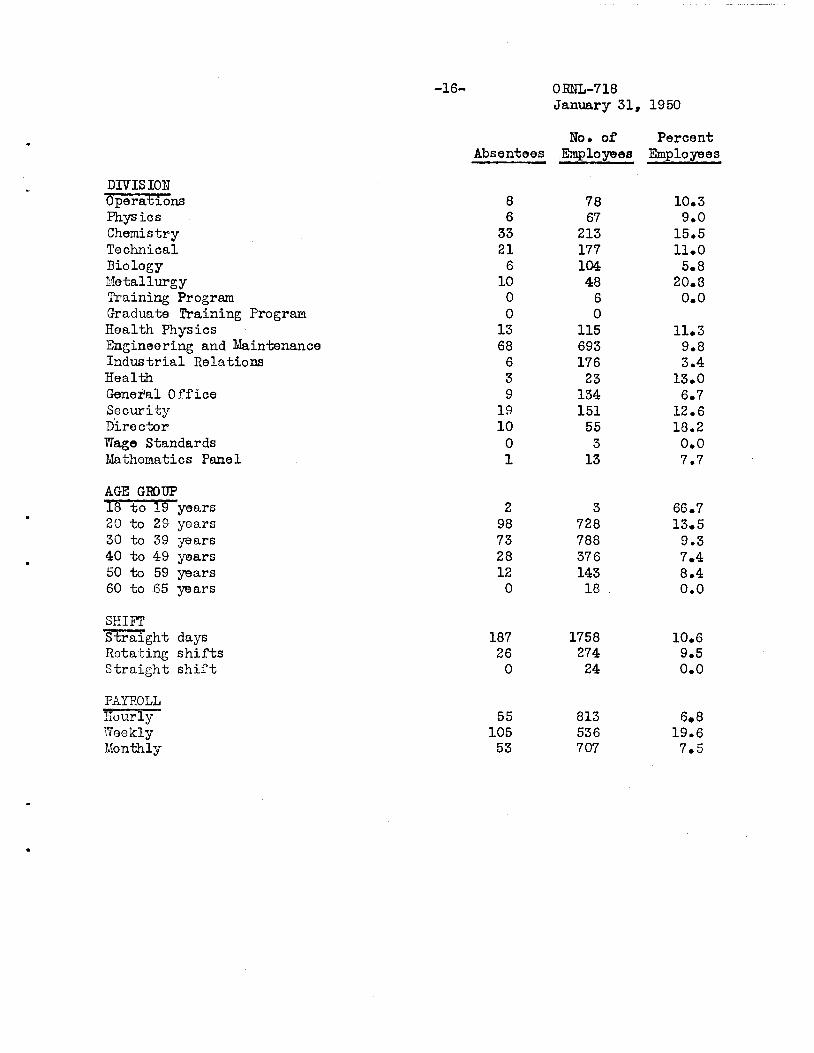
DIVISION
OperationsPhysicsChemistryTechnical
BiologyMetallurgyTraining ProgramGraduate Training ProgramHealth PhysicsEngineering and MaintenanceIndustrial Relations
Health
General Office
SecurityDirector
Wage StandardsMathematics Panel
AGE GROUP
18 to 19 years20 to 29 years30 to 39 years40 to 49 years50 to 59 years60 to 65 years
SHIFT
Straight daysRotating shiftsStraight shift
PAYROLL
HourlyWeeklyMonthly
-16- 0RNL-718
January 31, 1950
No. of Percent
Absentees Employees Employees
8 78 10.3
6 67 9.0
33 213 15.5
21 177 11.0
6 104 5.8
10 48 20.8
0 6 0.0
0 0
13 115 11.3
68 693 9.8
6 176 3.4
3 23 13.0
9 134 6.7
19 151 12.6
10 55 18.2
0 3 0.0
1 13 7.7
2 3 66.7
98 728 13.5
73 788 9.3
28 376 7.4
12 143 8.4
0 18 . 0.0
187 1758 10.6
26 274 9.5
0 24 0.0
55 813 6.8
105 536 19.6
53 707 7.5
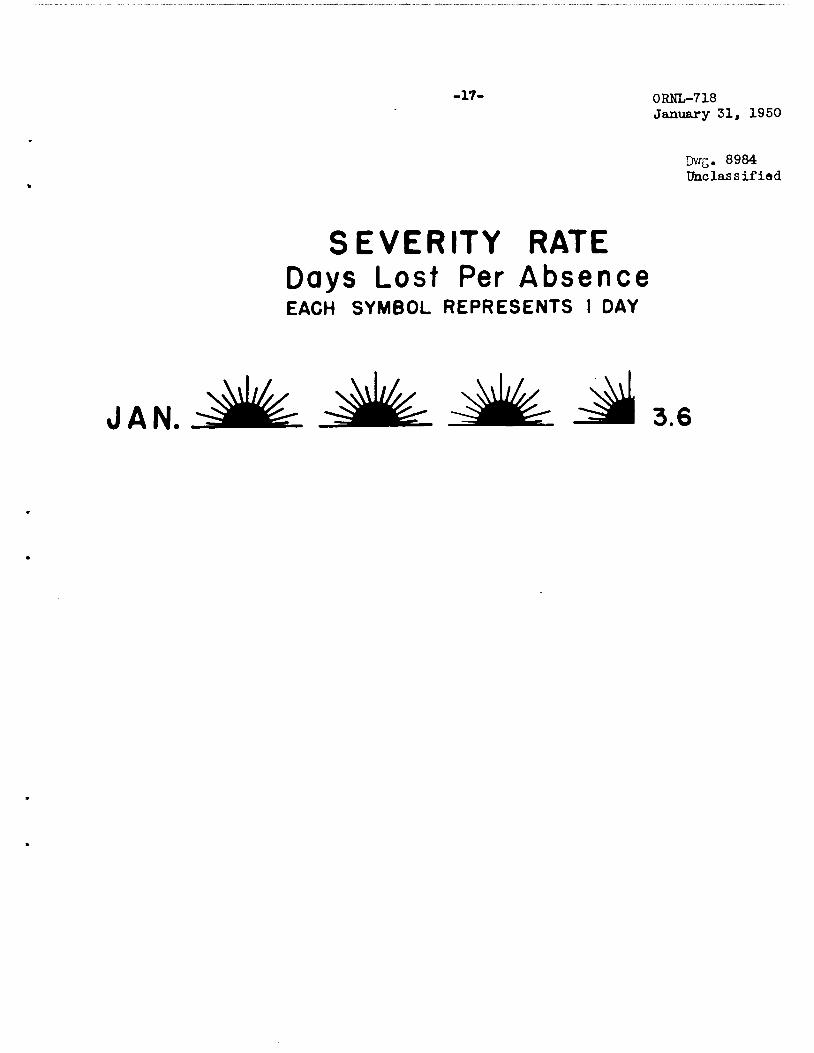
-17- ORNL-718January 31, 1950
Dwg. 8984Unclassified
SEVERITY RATEDays Lost Per AbsenceEACH SYMBOL REPRESENTS I DAY
„* Ml Ml Ml M *,
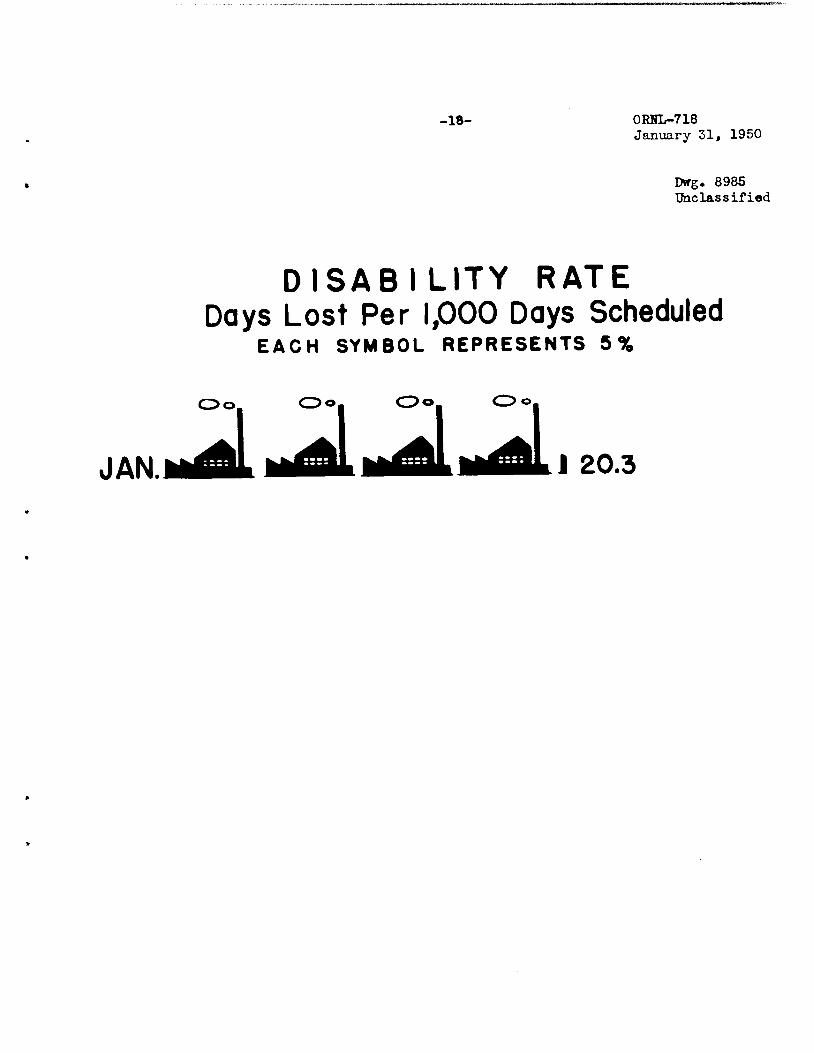
-18- ORNL-718January 31, 1950
Dwg. 8985Unclassified
DISABILITY RATEDays Lost Per 1,000 Days Scheduled
EACH SYMBOL REPRESENTS 5%
Oo °°| °°| <=>°l
jAN.n^aL ^^aL^fflLi^ffiL.1 20.3
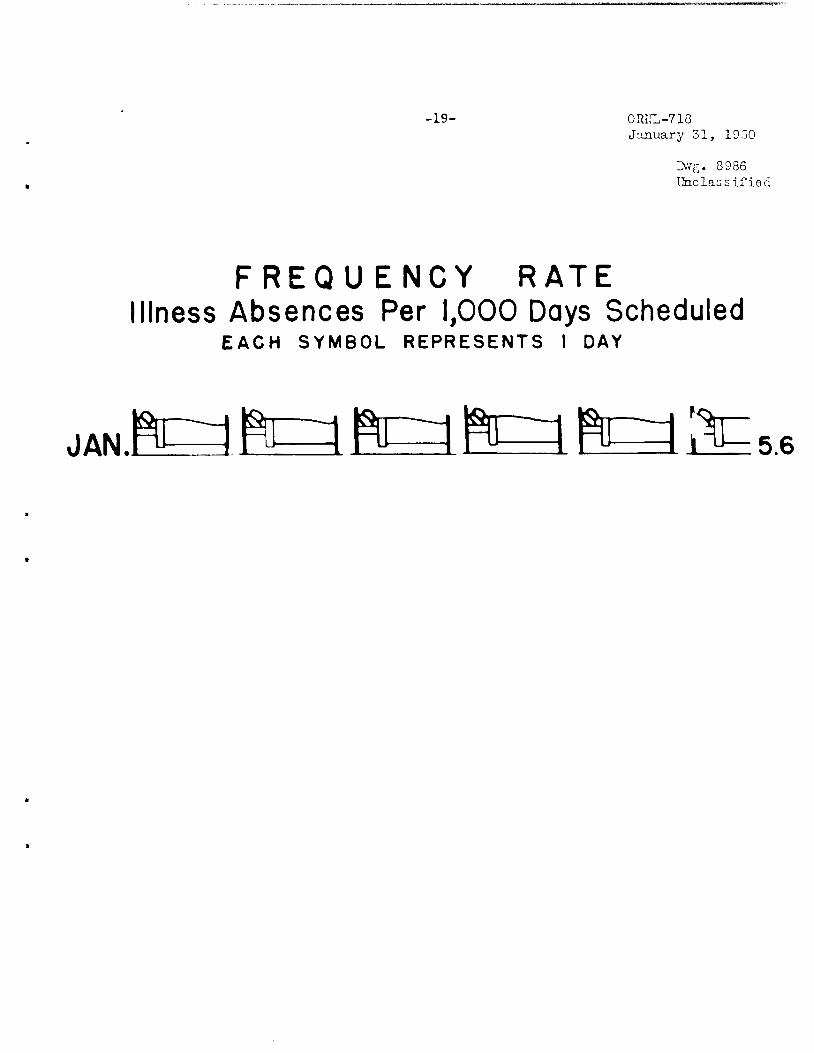
-19- ORIJL-710
January 31, 1950
Dtfg. 8986Unclassified
FREQUENCY RATEIllness Absences Per 1,000 Days Scheduled
EACH SYMBOL REPRESENTS I DAY
fta fta tata h=\ 'fc.JAN,
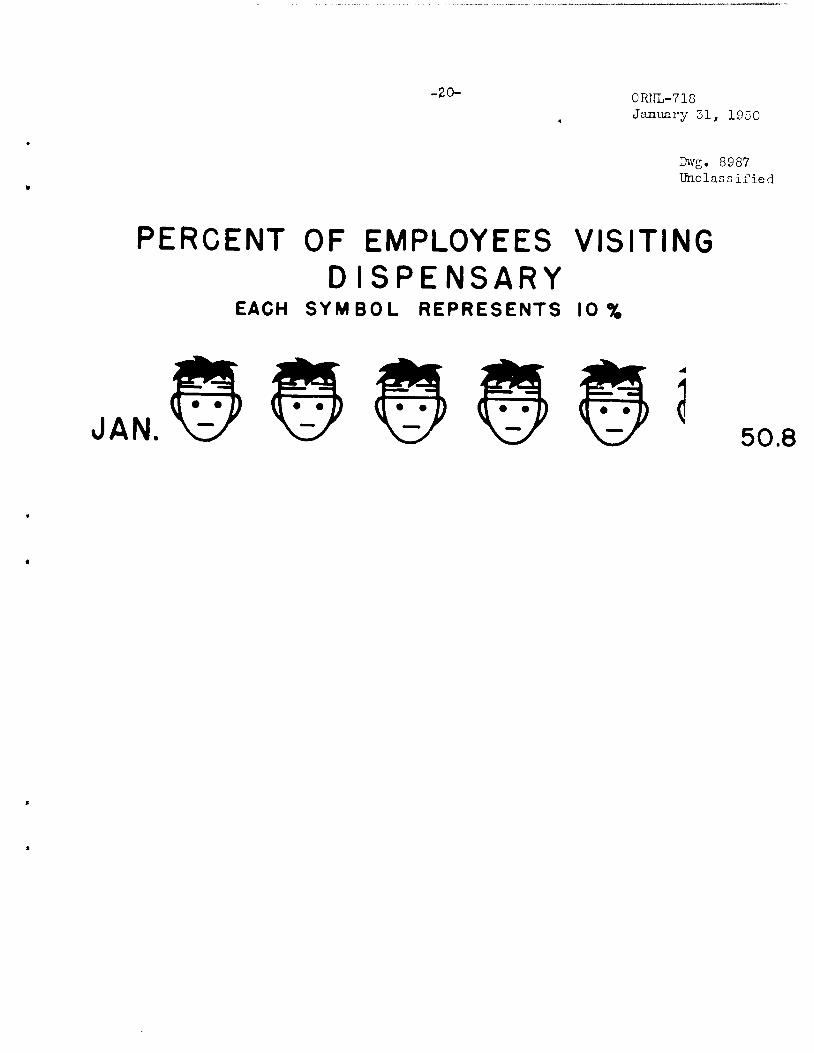
-20-ORNL-718
January 31, 1950
Dwg. 8987Unclassified
PERCENT OF EMPLOYEES VISITINGDISPENSARY
EACH SYMBOL REPRESENTS 10%
JAN. \c 50.8