Embed Size (px)
Citation preview
Health Care Financing in Thailand: Modeling and Sustainability
Mission Report to the World Bank
Joseph R. Antos, Ph.D. Wilson H. Taylor Scholar in Health Care
and Retirement Policy American Enterprise Institute
August 1, 2007
Mission activities: Workshop on Model Development of Sustainable Health Care Financing June 11-12, 2007 Consultations with Country Experts June 13, 2007 Bangkok, Thailand
1
Thailand has three major health insurance schemes that together provide access to health coverage for all of its citizens. The newest and largest insurance program is the Universal Coverage (UC) scheme, which was enacted in 2001 and fully implemented in 2002. The UC scheme provides insurance to about 70 percent of the population and accounts for about 20 percent of Thailand’s total health spending—a seeming mismatch between potential demand for health services and actual spending.1 Although the design of the UC system has effective cost containment features, these estimates raise policy concern about the adequacy of funding and health care delivery. Consequently, the financial sustainability of the UC scheme, emerging pressures that may threaten the program’s fiscal condition, access to health care services for UC beneficiaries (particularly those in rural areas), and the challenges of coordinating among the three health insurance schemes are critical matters to experts and policymakers alike.
This report briefly describes the structure of Thailand’s health insurance system and discusses issues currently under debate that could positively or negatively affect the system’s financial sustainability. The report also discusses the role that modeling plays in monitoring the performance of the health system and assessing the likely impacts of new policies on the cost and functioning of the system. Structure of the Health Insurance System Thailand’s health insurance system is the product of reforms that have played out over the last thirty years. The Medical Welfare Scheme (MWS), started in 1975, was the first program to provide health care to the poor. Since then, a variety of insurance programs have been established, and some of those programs have been incorporated into the UC scheme. Currently, Thai citizens have access to health insurance through one of three programs: the Civil Service Medical Benefit Scheme (CSMBS), the Social Security Scheme (SSS), and the UC scheme. CSMBS. The CSMBS was established in 1980 to provide health care to government employees, their dependents (children, spouses, and parents), and government retirees. CSMBS provides comprehensive medical benefits, including coverage for inpatient and outpatient services, emergency treatment, and pharmaceuticals. Health care providers are paid on a fee-for-service basis, which has led to rapid increases in program spending. In response to rising program costs, the Ministry of Finance imposed cost containment measures, including limiting some benefits and initiating a shift from full payment for
1 Enrollment estimate is for 2003 as reported in International Labour Office (ILO), A Technical Note to the Government: Financing Universal Health Care in Thailand, Geneva/Bangkok, June 2004; available online at http://www.ilo.org/public/english/protection/secsoc/downloads/publ/995sp1.pdf. Spending estimate is from the National Health Accounts for 2005. Those data are contained in a presentation by Dr. Viroj Tangcharoensatian, Director of International Health Policy Program, Ministry of Public Health, before the World Bank Workshop on Perspectives and Challenges in Healthcare Financing, February 28-March 1, 2007: International Health Policy Program (IHPP), “Healthcare Financing in Thailand: An Update in 2007,” available online at http://siteresources.worldbank.org/INTTHAILAND/Resources/333200-1089943634036/475256-1151398858396/HHealthcare_Financing_in_Thailand_2007_IHPP.ppt.
2
hospital charges to prospective payment using diagnosis-related groups (DRGs).2 The program is fully financed through general tax revenue with no premium payments from the beneficiaries. Beneficiaries are liable for copayments for the room and board charges associated with inpatient care in private hospitals, but not for care in public facilities. SSS. The SSS scheme, established in 1990, is a compulsory insurance program for employees of private businesses. Dependents and retirees are not covered by SSS and are typically enrolled in the UC scheme. SSS provides a comprehensive benefit package for non-work-related illnesses, and a separate workers compensation scheme covers work-related illnesses and injuries. Coverage is provided through a network of public and private hospitals that are contracted to provide inpatient and outpatient services. Beneficiaries select a hospital contractor of his or her choice, and the SSS pays a fixed capitation rate of 1,505 baht per enrollee (about $37.62).3 Unlike the fee-for-service arrangement of CSMBS, capitation provides strong incentives to control the cost of care. Additional payments are made for certain high-cost services and to account for the additional health care needs of patients with chronic conditions. However, expenses for certain extremely costly treatments (including renal replacement therapy for patients with end-stage renal disease and organ transplantation) are capped. The SSS scheme is financed equally by employers, employees, and the government, each of which contribute 1.5 percent of taxable wages (for a total contribution of 4.5 percent). Only the first 15,000 baht ($375) per month is subject to this tax, and that amount is not indexed for inflation. Beneficiaries are liable for copayments for some services. UC. The UC scheme is the residual insurer in Thailand, available to anyone who is not eligible for CSMBS or SSS. Benefits are similar to the SSS scheme, with certain high-cost treatments excluded from coverage. Beneficiaries register with a primary care provider, which acts as a gatekeeper to secondary and tertiary care. If beneficiaries go outside the health provider network in which they are registered, they must pay the full cost of that care out of pocket. Capitation payments cover outpatient services, disease prevention, and health promotion. Inpatient services are paid prospectively using DRGs. In addition, there is a global budget that limits total inpatient spending. The UC scheme is fully funded through general tax revenue with no premium payments from the beneficiaries. Some beneficiaries4 were initially required to pay 30 baht ($0.75) per visit, but recently that requirement was dropped. Consequently, health services are now free of charge to everyone enrolled in UC.
Because of gaps in insurance benefits in the public programs, some people also purchase private insurance to supplement their coverage. In addition, substantial sums are paid out-of-pocket for health services. Some people do not participate in one of the public insurance schemes, perhaps because they live in remote areas and have limited access to public health providers, and must pay for care themselves. Also, some health
2 The shift to DRGs begins August 2007 and will be phased in gradually. 3 Exchange rate assumed to be 40 baht per U.S. dollar. 4 Low-income enrollees were exempted from this copayment requirement from the start of the UC scheme. UC enrollees who were not enrolled previously in the Low-Income Card Scheme (which was folded into UC) were liable for the 30 baht fee until recently.
3
services may be difficult to obtain within the insurance schemes but are available with direct payment. Pharmaceuticals, for example, that may be in limited supply through hospital pharmacies (which do not charge the patient) might be obtained through private pharmacies that are not covered by UC. Some people are willing to pay the cost of pharmaceuticals purchased in private pharmacies rather than going through physicians and hospitals for their medications. In addition, traditional medicine is typically paid out-of-pocket rather than through insurance.
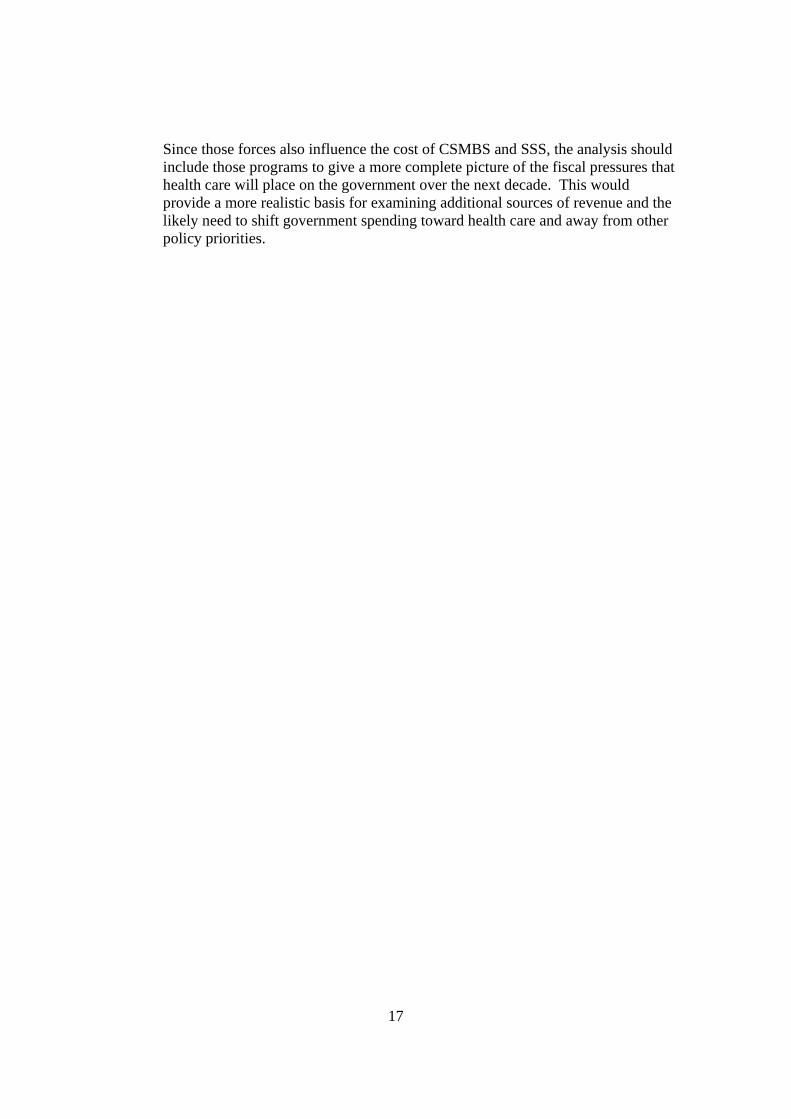
Total health expenditures (THE) came to about 248 billion baht ($62 billion) in 2005—about 3.5 percent of the country’s GDP. The three public health insurance schemes together account for about a third of THE (see Figure 1). Private insurance covers less than 10 percent of THE, with out-of-pocket payments accounting for about a quarter of health spending. The remaining third is financed primarily by the Ministry of Public Health (MOPH), which operates and staffs a system of hospitals, district and provincial health offices, and health centers. Recent Performance of the Thai Health Financing System The success of any country’s health financing system depends on how well it accomplishes a number of interdependent policy objectives. A major reform is typically adopted as a response to long-standing problems, which may include concerns about equity, access to care, efficiency of the delivery system, rising cost trends, and other issues. Financial performance alone is not a sufficient indicator of the success of health system reform.
Major objectives of Thailand’s health reform include achieving universal health insurance coverage with an acceptable level of benefits, limiting the growth of health spending, promoting efficient health care delivery, allocating more health resources to the poor and to rural areas, and maintaining the health system’s capacity to supply services. Evidence from the first five years of the UC scheme suggests that Thailand’s reform has achieved a strong measure of success. Universal coverage. The number of uninsured dropped dramatically in Thailand following the rapid implementation of the UC scheme in 2001 and 2002. Every Thai citizen is eligible to enroll in the UC, which is an entitlement to health care. Only about 5 percent of Thailand’s population were not enrolled in one of the health insurance schemes in 2003 (see Figure 2). By comparison, about 20 percent of the population was uninsured in 1998. This success is due in part to the attractiveness of covered benefits, the reliance on general tax revenue rather than enrollee premiums for financing the UC scheme, and aggressive promotion of the new insurance plan. Health spending. The evidence on the impact of health reform on health spending appears somewhat contradictory. UC, which is the major Thai health reform, covers over 70 percent of the Thai population but accounts for only 17 percent of total health spending. This is due, in part, to the closed-end nature of UC payments and benefit limitations that act to curb the increase in health spending that would typically occur

4
when insurance coverage expands greatly. The program’s spending level also reflects the make-up of its beneficiary population and the availability of health services in different geographic areas. A high proportion of UC beneficiaries live in rural areas with limited access to services (particularly tertiary hospital care). Spending trends over time also show an interesting pattern. Total spending, measured in cash terms, grew rapidly following reform and government health spending also increased sharply. However, health spending as a share of the economy remained essentially flat at a very moderate level, deviating little from historical trends. The first two measures (total health spending and government health spending) represent outflows of funds and are likely to be of great concern to policymakers and budget analysts. The third measure (health spending as a share of GDP) places the flow-of-funds measures in context, which may be of small comfort when negotiating budgets for government programs.
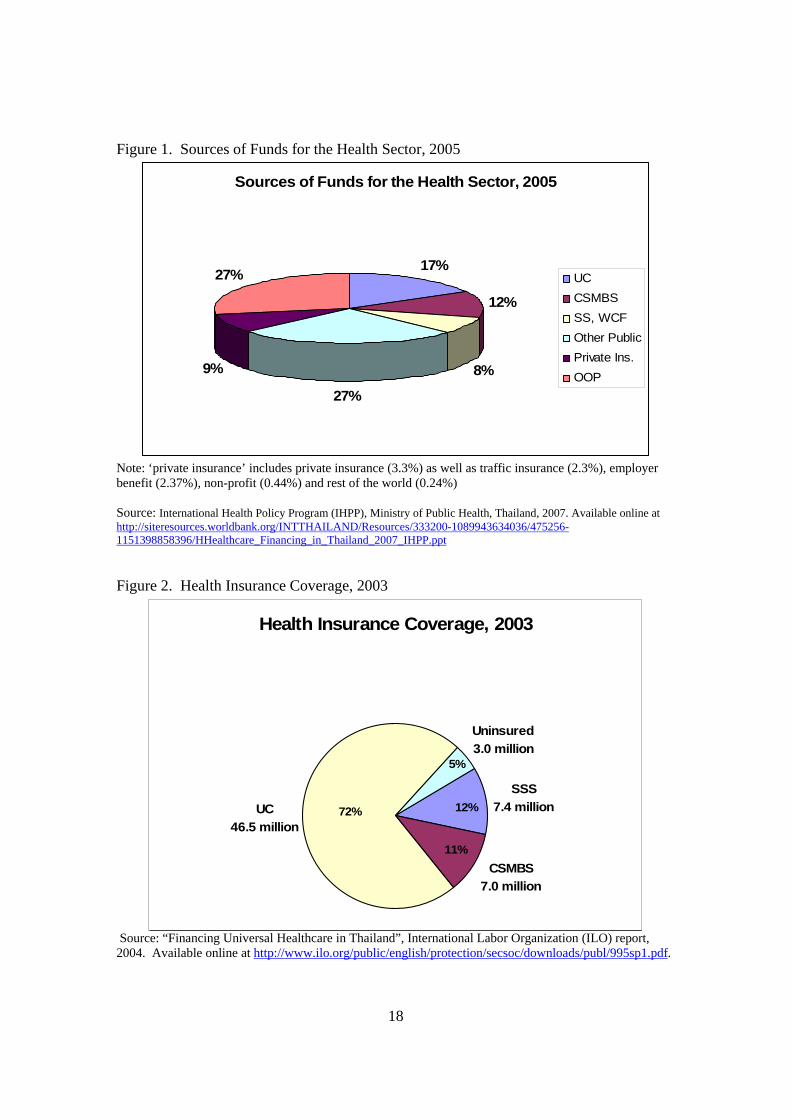
As might be expected, the increase in health insurance coverage following implementation of the UC scheme substantially increased total health spending (see Figure 3). THE grew from 170.2 billion baht in 2001 to 248.1 billion baht in 2005, an increase of 45 percent over the period. That represents a significant change in spending patterns from the 1997-2001 period, when THE actually declined. A severe economic slowdown during the earlier period is probably the major cause of the decline in health spending (see Figure 4).
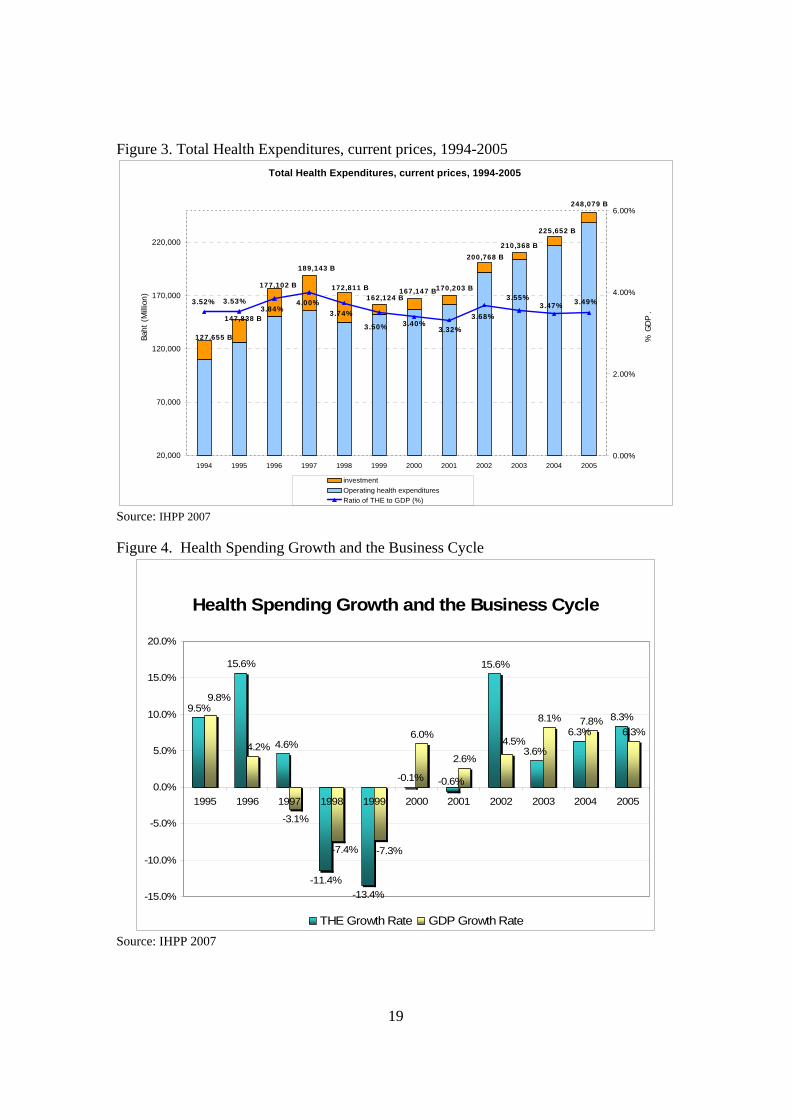
The creation of the UC scheme shifted much of health spending from the private
sector to the government (see Figure 5). The government share of THE grew from about 56 percent in 2001 to 63 percent in 2002, and that share has drifted upward slightly in 2004 and 2005. In cash terms, government health spending grew from 95.8 billion baht in 2001 to 126.9 billion baht in 2002, an increase of 32 percent. This is the largest one-year increase in government health spending since 1994.
Viewed from the perspective of the economy’s ability to finance health care, however, the recent increase in spending appears quite modest. There was no significant escalation of total health spending as a share of the economy since 2001. Moreover, THE has remained in a tight band between 3.5 and 4.0 percent of gross domestic product (GDP) since 1994. This commitment of resources to health appears quite moderate compared with other countries, suggesting that Thailand may have “fiscal space” to increase future health spending. Nonetheless, the cash flow estimates are large, which may make it difficult to negotiate increased government health insurance budgets, and future demands for health care may grow more quickly than revenue sources. Efficiency. The UC scheme incorporates several features that promote efficient health care delivery. Thailand uses capitation payment methods rather than fee-for-service payments in the UC. Capitation pays a fixed fee for a bundle of services, allowing the provider flexibility in choosing the proper course of treatment but not providing an incentive to over-treat. The use of primary care gatekeepers provides direct management of services and potentially reduces the use of inappropriate levels of service. These

5
features have proven successful in promoting efficiency and controlling cost in the SSS scheme.
Several features of the UC scheme meant to promote efficiency raise policy concerns. They include challenges setting the capitation rate, the elimination of the 30 baht copayment and the risk of moral hazard, the separation between payers and providers, and the impact of disease prevention and health promotion (P&P) services on spending.
First, although capitation payment methods encourage more efficient delivery of
care and reduce over-treatment, the fixed payment also provides an incentive to under-treat patients and reduces the availability of services that are paid for by the UC scheme. This incentive is the reverse of the fee-for-service incentive to provide more services, even when the care provides only minimal benefit to the patient.
The bias toward under-treatment cannot be resolved fully by providing higher
capitation rates, since the incentive is inherent in the fixed payment system regardless of the payment level. Instead, clear treatment standards are necessary and the performance of providers should be monitored to ensure that the quality of care is maintained.
In addition, the structure of the capitation payment could be modified to address
specific problems with access to care. For example, the UC scheme pays for certain high-cost treatments separately from the capitation payment. That approach helps to ensure access to care for such patients by eliminating or reducing the financial risk that must be borne by the hospital.
Inadequate payment levels exacerbate the incentives to under-treat patients in a
capitated payment system and discourage providers from participating in the insurance program. The International Health Policy Program (IHPP) of the MOPH estimates rates based on utilization data and unit cost of services, but negotiation with the Ministry of Finance has resulted in lower approved rates (see Figure 6). However, it is difficult to determine administratively the “market clearing” price that ensures sufficient supply of services to patients. Both utilization and unit cost are endogenous since they are at least partly under the control of the hospitals. One alternative to administrative pricing is competitive bidding, which requires well-developed cost accounting systems at the hospital level and willingness by policymakers to allow high-bidding health institutions to lose their UC patients.5
5 The broadest use of competitive bidding in health systems is by the U.S. Medicare program’s outpatient drug benefit. Private drug benefit plans bid on the basis of insurance premiums, coverage of pharmaceuticals, and beneficiary copayments. In 2006, the first year of operation for this benefit, premium bids came in about 25 percent lower than expected using administrative pricing methods. See Centers for Medicare and Medicaid Services, Fact Sheet: Drug Benefit Enrollment Up, Costs Down From Competition and Beneficiary Choices, June 8, 2006; available online at http://www.cms.hhs.gov/apps/media/press/factsheet.asp?Counter=1876&intNumPerPage=10&checkDate=&checkKey=&srchType=1&numDays=0&srchOpt=0&srchData=&keywordType=All&chkNewsType=6&intPage=&showAll=1&pYear=1&year=2006&desc=false&cboOrder=date.
6
Second, copayments can curb the over-use of health services that offer little value to the patient. The UC scheme was initiated under the principle that beneficiaries would pay 30 baht for each office visit, a modest amount that probably did little to discourage the use of unnecessary services by most people (but a barrier to treatment for those with the lowest incomes). That requirement was dropped recently, making health services free of charge to the beneficiary. Dropping that requirement might spur some additional utilization. For example, we might expect to see an increase in routine office visits, which are not limited by the availability of resources other than the time of the patient and the doctor. In addition, dropping the copayment results in a small loss of revenue from the system.
Third, the split between the insurance programs and the providers (which includes
the Ministry of Public Health as well as other public and private institutions) should reduce pressure to give additional financial support to inefficient government health providers. However, the MOPH is likely to exert considerable influence over budget negotiations on behalf of its facilities, and direct subsidies to failing institutions may be provided.
Fourth, the inclusion of disease prevention and health promotion services in the
UC benefit package is meant to reduce the incidence and severity of disease, potentially reducing the cost of treatment. Because P&P usually requires active patient participation and the payoff is likely to be realized only after an extended period (perhaps years), the effectiveness of such services is uncertain. The cost of screening the population for specific diseases might be high and could result in unnecessary treatment due to false positives and the complications of the screening process. Consequently, P&P benefits must be carefully designed to maximize their net benefit to health status and health financing. Equity. The UC scheme has substantially improved the progressivity of Thailand’s health system, providing more resources to low-income persons and promoting greater access to health services. In addition, the UC scheme provides catastrophic coverage—financial protection against the high cost of severe illness. The UC scheme attracts a disproportionately low-income population. About half of UC beneficiaries are in the lowest two income quintiles (see Figure 7). They live primarily in rural areas and rely on district health services. About half of the beneficiaries in CSMBS and SSS are in the highest income quintile. These people are concentrated in urban areas and are more likely to use higher-level health facilities, including provincial and general hospitals. Because of the expansion of insurance coverage brought about by the creation of the UC scheme, government subsidies for health care have become more progressive (see Figure 8).
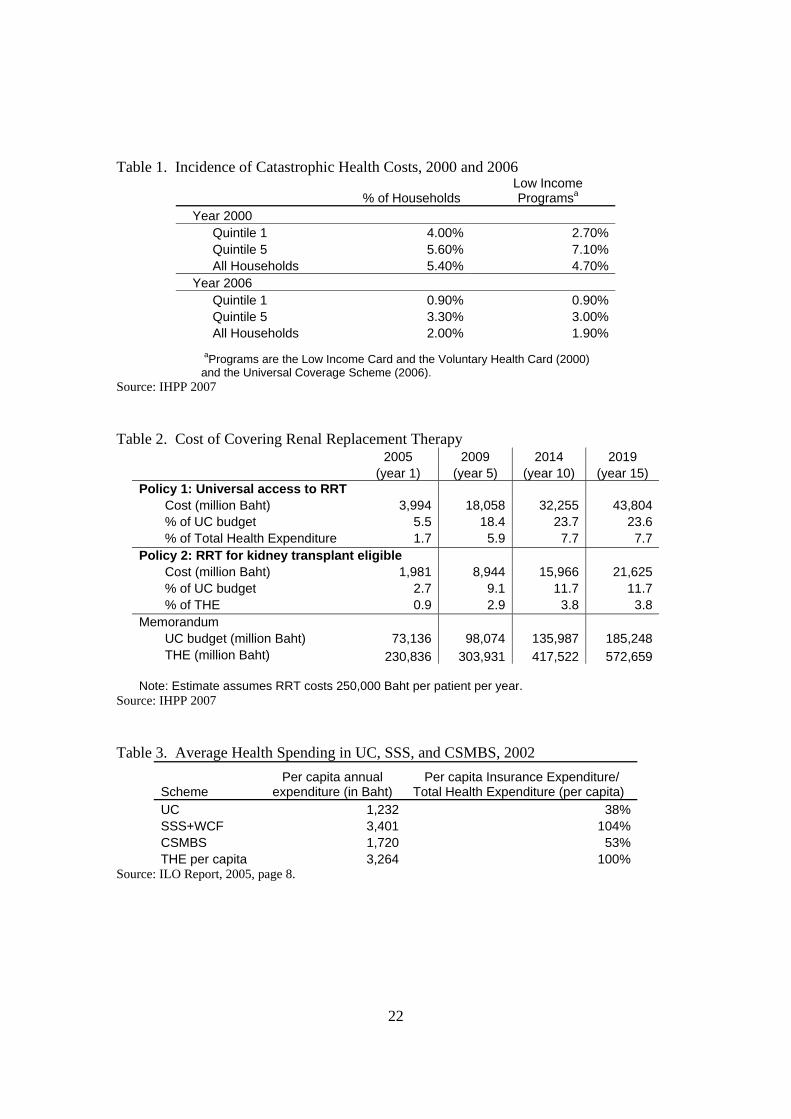
Fewer Thai households are faced with catastrophic health expenditures after the introduction of UC (see Table 1). In 2000, about 4 percent of the households in the lowest income quintile faced health expenses greater than 10 percent of their income. In 2006 that figure dropped to 0.9 percent. However, because some high-cost services are
7
not covered by UC and are thus unavailable to most UC beneficiaries who do not have the funds for expensive but necessary treatment, such estimates may be optimistic and are likely to understate future spending if there are changes in policy, expansions of medical technology, greater incidence of disease, or other forces that would increase the demand for health care. For example, there is an unmet demand for services such as renal replacement therapy that is not accommodated by the Thai health system as it is currently structured. Capacity. One of the issues of some concern is the movement of physicians from rural areas to the cities, and from the public health sector to the private sector. This “brain drain” is seen in most other countries, and policies to slow the migration of physicians have had limited effectiveness. Highly-educated professionals are likely to prefer urban life to rural life, and physicians are likely to prefer access to a larger patient population and better medical facilities.
Inadequate compensation in the public health sector certainly plays an important role, particularly as the demand for health services has increased with the implementation of UC. Wide disparities in compensation between the public and private sectors are likely to lead to greater movement out of public programs. The growth of medical tourism to Thailand has added to the problem as investors build new medical facilities and offer high salaries to staff them. Although medical tourism is a growing source of revenue for the country, the resulting brain drain is drawing off highly skilled personnel from the public health system. Issues Affecting Financial Sustainability The financial sustainability of Thailand’s health system is affected by factors that are common across countries. Use of health services is expected to increase, driven by an aging population, rising national income, and the growth of medical technology. Revenue to pay for that rising trend in demand is less certain, affected by changes in the work force over time and competing demands for revenue in the government’s budgeting process.
Thailand also faces issues arising from its current structure that could affect the health system’s financial sustainability. There are significant gaps in covered benefits under the UC scheme that could substantially increase spending. The CSMBS maintains fee-for-service payments which are substantially higher than payments under either SSS or UC, which may put stress on the financing system. The funding mechanism for UC is considered unstable, and proposals have been made to create a dedicated source of revenue for the program. The broader questions of fiscal space for health care must be addressed: What is the capacity of the country to support potentially large increases in health spending in the coming years? Can the insurance system maintain constraints on spending growth without sacrificing quality of care and access to essential new treatments?
8
Gaps in coverage. The UC scheme covers a number of high-cost medical treatments, including chemotherapy and radiation therapy for certain cancers, open heart surgery, angioplasty, coronary artery bypass grafts, and hip and shoulder replacements. Other treatments with proven value to the patient are excluded from coverage because of their high cost. Demand for these excluded treatments will grow over time, putting pressure on the government to expand coverage. An important example is renal replacement therapy (RRT) for patients with end-stage renal disease. RRT is necessary when a patient’s kidneys are no longer able to effectively cleanse the blood of waste products. A patient must either go on dialysis (peritoneal dialysis, which can be performed at home, or hemodialysis, which must be performed at a hospital or dialysis center) or receive a kidney transplant in order to survive. RRT is not covered by the UC scheme. There is no question that RRT prolongs life and improves the quality of life. Treatment costs are high. One study found that the cost of dialysis per life year saved exceeds $10,000, or about 4 times the per capita gross national income of Thailand. IHPP has estimated the cost to the UC scheme of covering RRT and found that unrestricted coverage could require nearly a 24 percent increase in the program’s budget within ten years (see Table 2). Even restricting RRT to patients who are eligible for a kidney transplant (and who have a chance to return to a normal life free of dialysis), the cost would increase the UC budget by nearly 12 percent. The UC scheme would encounter serious financial problems if it covered RRT. However, failure to provide coverage raises serious ethical concerns. Government employees and their dependents, and employees of private businesses, have coverage for RRT through CSMBS and SSS. (Note that brief episodes of dialysis required on an acute basis are covered by all three insurance schemes.) Since all three insurance schemes are operated by the government, the failure to cover RRT represents a serious disparity in access to care that primarily affects low-income people. The fiscal room that seems to be available for the health system could easily be absorbed by equalizing the coverage of expensive benefits between CSMBS, SSS, and UC. RRT is a proven technology for a clearly-defined population of patients. The problem is not whether treatment is appropriate; the problem is whether the system is willing to pay, which can only be determined in the political arena. Maintaining restraint in provider payment. The use of capitation payments by the UC scheme provides strong incentives for providers to limit the cost of care. As discussed earlier, setting an appropriate payment rate requires balancing the need to restrain spending with the need to maintain appropriate access to and quality of care. That means payment rates under the UC scheme cannot permanently remain substantially below payments made by CSMBS or SSS. Moreover, the government insurance schemes will eventually have to respond to the brain drain of skilled health workers moving to private health facilities. That response will probably include higher payment rates.
9
Tight limits on the UC capitation rate, the requirement that beneficiaries remain within the provider network in which they are registered, and limits on covered benefits result in the UC scheme having the lowest per capita annual expenditure (see Table 3). The SSS scheme, which follows similar payment and coverage practices as the UC, has only a slightly higher level of per capita spending. Per capita spending in the CSMBS system, which relies on fee-for-service payment and has fewer restrictions on the use of services, is more than twice as large as that of the UC scheme.
Some of the difference in spending between the three insurance schemes is the result of higher payment rates, and some of the difference is due to greater use of health services. It is likely that some providers limit the number of UC beneficiaries they are willing to see, preferring to treat more lucrative CSMBS beneficiaries. Some providers might also refer UC beneficiaries to their private clinics, which require out-of-pocket payment rather than payment from the insurance scheme.
It is uncertain whether requiring CSMBS to conform to the payment practices of
the UC would improve the latter scheme’s ability to maintain low payment rates. Uniform payment rates set at the UC level would eliminate the incentive to prefer the beneficiaries of one scheme over those of another. But lower rates also discourage the supply of services, which could mean an even greater shift to private practice and direct cash payment. The latter outcome would have its greatest impact on the poor, who are least able to afford unsubsidized health care. New sources of revenue. The UC scheme must negotiate its budget every year with the Ministry of Finance, which has resulted in capitation rates for providers below the amount calculated to fully cover their costs. While that process has contributed to overall spending restraint, there is concern that quality and access to care could be jeopardized. Experts involved with the Thai health sector believe that a stable source of funds and more generous financial support is necessary to maintain the health system. One plan would increase taxes on tobacco and alcohol, with the additional tax revenue earmarked for UC. The hope is that this sort of policy would insulate the UC scheme from the vagaries of the government’s budget process and preserve funds for the health system regardless of other political or macroeconomic developments.
An analysis of that proposal, prepared jointly by the International Labor Office (ILO) and IHPP, estimated that such a dedicated tax would eventually increase UC revenue by 0.64 percent of GDP. In 2015, that amounts to an additional 112 billion baht ($2.8 billion).6 A new requirement that the SSS scheme expand its coverage to include dependents would lower UC expenditures by shifting some people out of the UC scheme. According to the analysis, the two proposals together would nearly meet the financing needs of UC over the next decade or longer. These estimates seem overly optimistic. The estimates assume very slow growth in health spending well into the future. For that to happen, there can be no major 6 Details of the proposal and analysis are reported in ILO, 2004.
10
expansions of covered benefits and tight limits on the adoption of new medical technology. The estimates also appear to ignore the cost of care that would be shifted if SSS eligibility was expanded to cover dependents of private sector employees. While such a shift would represent savings to the UC, the costs would remain a liability of the government.7 The proposal does not seem to include new sources of financing for the more-expensive SSS scheme. Moreover, the hope that creating a new source of dedicated revenue for UC will eliminate the political uncertainties of health care financing is likely to be disappointed. Political demands will certainly be placed on the UC scheme in the future, and changes in policy will likely mean higher costs and a need to negotiate additional government subsidies. The U.S. Medicare program illustrates the point. Although Medicare has dedicated sources of revenue and has remained financially solvent for more than 40 years, there are annual debates in Congress over the details of Medicare policy and financing. Policies that affect Medicare spending and use of health services are enacted virtually every year, adding to the uncertainty providers already have about their financial futures. Modeling the Health Financing System Mathematical modeling has become an essential tool for health policymakers and health system managers. Information on financial flows and the use of services can provide valuable insights into the operation of the system, but only if those data are placed in a logical analytic framework. Such data along with information from household surveys can provide a detailed view of the way health financing affects the delivery of care as well as a basis for considering the potential impacts over time of policy changes. Thailand’s health system has developed substantial modeling resources and capability. In addition to financial and utilization data from the three insurance schemes, the National Statistical Office conducts the Health and Welfare Survey and the Socioeconomic Survey, which yield information on the cost and use of health care from individuals. Several consumer satisfaction surveys have been conducted to assess the impact of health reform on public perceptions. These and other data sources have been used for sophisticated analyses of issues raised by health reform. Such studies have been completed by experts in several agencies, including IHPP and the Bureau of Health Policy and Strategy. In addition, outside experts, including the ILO, have contributed to model development.
Modeling capacity is also being developed in the three insurance schemes through a collaborative process across the programs. It appears that there is a “separate but equal” concept in this capacity-building effort, reflecting the long-standing independence of CSMBS and SSS and the decision not to combine all of the insurance schemes when the UC program was created. Although the reasons for this arrangement are clear, there are arguments for creating a single modeling office for all three insurance schemes. 7 Contributions from employers and employees also would increase, but only if the maximum taxable wage or the tax rate was increased by legislation.

11
There are many technical aspects of modeling that could be discussed in the
context of the Thai health system, but several issues stand out. They include the relative contributions of short-term and long-term modeling for policy making, the development of key modeling assumptions, and the uncertainty of economic projections and estimates of policy impact. Short-term and long-term modeling. Models of the health financing sector require certain basic components, including information on demographics (age structure, births, deaths, net immigration), health utilization and spending, revenue sources, and macroeconomic conditions (employment, inflation, economic growth). Assumptions must be made about how those variables are likely to change in the future.
Analyses of policy changes over the short term (3 to 10 years, for example) require assumptions that are likely to be more realistic than models that project the impact of policies over the long term (20 years or more). In the short term, population characteristics, financial institutions, the practice of medicine, economic conditions, and people’s attitudes about health care are likely to remain fairly constant or might change in fairly predictable ways. Over the long term, each of those variables is likely to change dramatically and in ways that are not easy to anticipate. Thus the reliability of short-term models depends much more on the validity of assumptions about health policy changes and the possible reaction to such policy changes by patients and providers.
A long-term model will produce estimates for shorter projection periods, of
course. However, long-term models often do not have the institutional richness to capture the full impact of a policy change. Details that matter over the next 10 years often pale into insignificance when the time horizon is 50 or 60 years. In addition, long-term models tend to be more aggregated than short-term models, making it difficult to identify the impact of policy changes on specific subgroups of patients or providers.
Long-term models play an important role in helping policymakers understand
where the present trajectory of the health system might take us in 20 or 30 years. But most policymakers are much more concerned about the immediate impacts of policies, which can be better examined by developing a specific short-term model of that policy.
The difference in perspectives matters. For example, actuaries for the U.S.
Medicare program maintain a 75-year model of the program’s financial flows.8 Over the past few decades, their long-term report has clearly indicated an emerging financing crisis. That crisis has generally been overlooked by policymakers, whose focus is more on the day-to-day operations of Medicare. The new prescription drug benefit, which added a huge unfunded liability to the program, was enacted even though the long-term outlook for Medicare was already extremely negative. U.S. policymakers purposely ignored the long-term fiscal crisis to meet immediate demands for additional benefits. In
8 See Boards of Trustees, 2007 Annual Report of the Boards of Trustees of the Federal Hospital Insurance and Federal Supplementary Medical Insurance Trust Funds, available online at http://www.cms.hhs.gov/ReportsTrustFunds/downloads/tr2007.pdf.
12
fact, most of the debate over financing the benefit was over its 10-year cost, not the long-term cost.
Modeling assumptions. In some ways, demographic and economic assumptions that underpin health system models are easy to develop. We have great breadth and depth of information on demographic and economic trends necessary to develop the assumptions.
In contrast, it can be challenging to develop reasonable assumptions that are specific to the health system. Information requirements are higher, since the details about how specific health services are financed and used matters a great deal. We must also be careful to model the institutional detail of the health system (including how services are paid for and other conditions that affect the supply or demand for health care).
A long-term model tends to blur the detail of how the health system works
because its focus is more aggregated. However, most health policy proposals operate on aspects of the health system that may not be well-characterized in a long-term model. This is an argument for tailoring the modeling effort to the question at hand, while maintaining a set of core demographic and economic assumptions. An existing model may be difficult to modify to adequately analyze a specific policy proposal.
The need to tailor the model to fit the policy proposal is evident in debates over
the cost impact of alternative proposals to accomplish the same objective. The U.S. Congressional Budget Office (CBO) provides detailed cost estimates for legislative proposals, and their modeling must be able to distinguish the likely impact of proposals that are very similar to each other but not identical. An example of this situation is the analysis of competing Medicare prescription drug proposals.9 Uncertainty and the baseline. Because mathematical models produce numerical results, it can be easy to forget that model projections are inherently uncertain. Part of the uncertainty is due to a lack of perfect knowledge about the future and behavioral responses to policies. That problem cannot be solved, but we can develop better statistical resources and more sophisticated analysis of survey data to fine-tune our assumptions. Another element of uncertainty has to do with the comparisons modelers make to judge the net impact of a policy. One must make an assumption about what future health spending (and other parameters) will be in the future in the absence of a change in policy. That assumption, called the baseline, is the yard stick against which policies are
9 Several proposals were very similar in design but resulted in somewhat different estimates of program costs. See, for example, Congressional Budget Office (CBO), Cost Estimate: H.R. 4954 Medicare Modernization and Prescription Drug Act of 2002, June 24, 2002; available online at http://www.cbo.gov/ftpdocs/35xx/doc3542/hr4954hwm.pdf; and CBO, Cost Estimate: Medicare Modernization and Prescription Drug Act of 2002, June 24, 2002; available online at http://www.cbo.gov/ftpdocs/35xx/doc3538/MedModern.pdf. The first of those proposals was estimated to cost $341 billion over ten years, while the second proposal was estimated to cost $337 billion. Cost estimates for other such proposals may be found online at http://www.cbo.gov/publications/collections/medicare.cfm.
13
evaluated. Usually, modelers adopt a “current policy” baseline—all policies that are currently in effect are assumed to continue, and no new policies are assumed to be enacted. The net financial impact of a proposed policy is the difference between health spending under the baseline (no new policy) and spending assuming that only the proposed policy is put into effect, with no other changes. A current policy baseline is normally a reasonable standard of comparison. However, there are circumstances when it is obviously incorrect to assume that nothing fundamental will change in the health system. An example from the U.S. Medicare program is a 10 percent reduction in physician fees that is scheduled to take effect in January 2008. It is widely acknowledged that such a cut is both unwise for the health system and politically impossible, and a legislative correction is virtually certain. However, since a new law must be passed to restore physician payment, the baseline used by CBO and the Medicare actuaries assumes that the cut will be implemented. The use of seemingly unreasonable assumptions about the baseline can confuse the political debate and can also result in unrealistic estimates of the impact of new policies. The problems of modeling under uncertainty are illustrated by the ILO-IHPP analysis of a dedicated revenue source, discussed earlier. By necessity, that model is built on the past experience of Thailand’s health system, which has maintained a fairly constant level of health spending as a share of GDP. Based on that experience, the model forecasts no change in that stable pattern—even though the expansion of health insurance through the UC and the rapid growth of medical technology are likely to result in a break with the past. One could address this uncertainty in several ways. First, it seems reasonable to assume a somewhat higher trend of health spending in the future as a consequence of these factors. Overly-optimistic projections of future spending can bias policymakers, who may assume that the health system will always be successful in keeping cost growth at lower levels than is actually possible. Second, confidence bands could be estimated to indicate how large the uncertainty might be.
We cannot avoid uncertain estimates, even though the decision-making process
craves certainty. Policymakers, who typically are not trained in mathematics or statistics, often demand a single estimate when in most cases a range of estimates would be more appropriate. Although it is usually necessary to provide point estimates, some sense of the uncertainty of the estimate can be valuable information. Conclusion and Future Agenda The Thai health system has undergone a remarkable transformation with the creation of the Universal Coverage scheme. Coverage has improved greatly, strong incentives for efficiency have been established, health spending has remained fairly stable despite the insurance expansion, and the financing system is more equitable.
14
However, there are growing concerns about the adequacy and stability of financing as well as the corresponding ability of the UC scheme to provide appropriate health care services to its predominantly low-income enrollee population. The demand for services will increase with an aging population, improvements in medical technology, and pressure to expand the benefit package to cover additional expensive treatments. Tight limits on provider payments will become increasingly difficult to maintain without jeopardizing access to and quality of care. It is important to apply additional efforts assessing the strength of these pressures on the Thai health system, and to determine a range of policy approaches necessary to help the system mature. Additional resources to support data collection and modeling efforts would augment and help institutionalize the already impressive analytic capacity developed by IHPP and other government agencies. There is a need for a concrete and realistic assessment of the forces that are being brought to bear on the health financing system. Such research would contribute to both an analytic understanding and the political acceptance of the need for additional fiscal room for the health system. A specific agenda for future research should be developed in collaboration with IHPP and other interested parties. Numerous topics merit additional analysis, including the following: Utilization of Health Services
• Document the impact of UC on the use of health services, by type of service, site of care, urban and rural areas, and other characteristics. To what extent is the growth in service use the result of greater access to care? Is the greater availability of funding through UC driving growth in the use of particular services? Does the current payment structure provide appropriate incentives and adequate compensation without biasing treatment decisions?
• Compare service use between rural and urban parts of Thailand, and between different population subgroups. Assess whether the pattern of service use appears to be medically appropriate or driven by supply or access constraints. Such analysis would incorporate information about the incidence of disease and general state of health of each population group as well as other factors that influence the use of health services.
• Assess the impact on UC spending of equalizing service use rates between urban and rural areas, or between population subgroups. What is the impact on capital investment and annual operating cost if health facilities were expanded in rural areas to satisfy health needs that are currently unmet because of supply constraints? What is the likely impact of continued economic development in Thailand on the demand for health services, particularly high-cost tertiary care?
• Compare utilization patterns between UC, SSS, and CSMBS, adjusting for differences in the demographic characteristics, health status, income, and location of the three beneficiary populations. Such a comparison could reveal inappropriate under- or over-use of health services in the insurance programs, as well as likely pressures within UC for additional use of services.
15
• In addition to analyzing access to services, it is important to launch an ongoing study of the quality of care delivered through the UC. Quality measures must be developed and tested to ensure that valid data can be collected, analyzed, and interpreted. Eventually, it should be possible to track utilization and quality measures to get a more complete view of the operation of the delivery system at the local level, and to measure the financial implications of quality improvements.
Supply-Side Issues
• Document the “brain drain” from rural to urban areas and from public health units to private units. Assess the “pull” of higher wages and better professional opportunities in the private health sector versus the “push” of increasing workloads, low pay, and inadequate medical infrastructure in the public health sector. Analyze the impact of pay increases, additional investment in medical equipment and physical facilities, and other policies (such as greater flexibility in work hours, job sharing, and upgrading the skills and responsibilities of non-physician health workers) on retention of physicians and skilled health workers in the public system.
• Document disparities across regions in the availability of inpatient beds, vacancy rates, imaging and diagnostic testing equipment, physician to population ratios, and other measures of the health system’s capacity to deliver services. Assess the adequacy of the system to supply adequate health care services, given the health needs of the populations in each region. Identify areas needing improvement and estimate the financial impact of policies (including new capital investment, bonus payments to physicians working in under-served areas, and other incentives).
• Investigate the cost impact of policies that discourage the overuse of higher levels of care (including hospital care where outpatient services would be sufficient, and the use of specialist services in place of non-specialist care). How successful has the system of primary care gatekeepers been in limiting unnecessary utilization? What is the potential for savings by substituting less-expensive care and less-expensive sites of care? What savings could be realized by upgrading job skills for non-physician health workers in place of physicians, and what is the offsetting cost of providing additional training?
• Capitation rates in UC were set below the levels recommended by IHPP. Assess the impact of lower rates on the supply of health services. After several years of lower payment rates, are adverse effects beginning to be felt? Other factors influence the supply of services; can the independent effect of lower capitation rates be isolated? Such an analysis would provide information for future analysis of capitation rates by IHPP and add credibility to future rate recommendations.
Demand-Side Issues
• What are the potential savings from re-introducing copayments for UC services? The recent rescission of the 30 Baht payment creates a natural experiment to test how responsive demand is to small changes in price. Is the use of particular services more responsive to price changes than others?
• What is the extent to which pharmaceuticals are purchased directly from private pharmacies without reimbursement by the UC? If UC coverage was extended to

16
such purchases with a substantial cost-sharing requirement, what would be the financial impact on the insurance scheme and on the patients?
• What is the likely demand pressure for new medical products and services? Although benefits in the UC scheme are currently tightly controlled, pressure will build to expand coverage for innovations, including new pharmaceuticals, diagnostic, and treatment techniques. Analysis of the CSMBS, which has a richer benefit package, could shed light on the likely demand and cost implications of expanded coverage of services in the UC.
• Assess the impacts of aging and economic development on the demand for health care and the implications for health system development. The shift in emphasis toward treating chronic conditions associated with an aging population creates new demand pressures for care and a greater emphasis on outpatient treatment. Continued economic development could exacerbate this shift by reducing employment in physically-active jobs and supplanting high-fiber traditional diets with western-style diets that can lead to higher incidence of diabetes, heart disease, and other chronic conditions. These factors are likely to increase the demand for health services well into the future.
• Assess the effectiveness and potential cost savings from health promotion and disease prevention. Certain interventions (such as vaccination) are clearly cost-effective, but others may only produce savings over a very long period of time, if ever. Promotion and prevention activities could be better targeted based on such analysis.
Insurance Structure and Financing
• The UC scheme, CSMBS, and SSS operate under different rules with regard to benefit packages, provider payment methods, contracting arrangements, and other matters. An in-depth analysis of those differences could reveal possible changes in operating procedures that could reduce costs or improve performance in one or more of the insurance schemes. Particular attention must be given to interactions between the schemes. For example, the UC relies on capitation payments while CSMBS pays on a fee-for-service basis. Do these payment differences limit access to care for UC patients? Could higher CSMBS payments be gradually reduced to match UC payment levels without significantly reducing access to care in either insurance scheme?
• The UC scheme faces adverse selection in enrollment. Low-income people and those who have had little access to care prior to UC are enrolled in the program, and dependents of private sector workers covered by SSS and retirees who had been enrolled in SSS when they were in the work force are also enrolled in UC. Such populations are likely to have greater health needs than active workers who are covered by SSS. Modeling could help determine how alternative enrollment rules would alter demands for care and program costs in UC and SSS.
• An analysis of the likely growth in demand for UC services over the next decade could identify the extent to which the program is underfunded. Such an analysis would account for increased use of medical technology, greater access to services for rural Thailand, the effects of aging and chronic disease, and the rising expectations of the population for more and better services as the economy grows.
17
Since those forces also influence the cost of CSMBS and SSS, the analysis should include those programs to give a more complete picture of the fiscal pressures that health care will place on the government over the next decade. This would provide a more realistic basis for examining additional sources of revenue and the likely need to shift government spending toward health care and away from other policy priorities.
18
Figure 1. Sources of Funds for the Health Sector, 2005
Sources of Funds for the Health Sector, 2005
17%
12%
8%
27%
9%
27% UCCSMBSSS, WCFOther PublicPrivate Ins.OOP
Note: ‘private insurance’ includes private insurance (3.3%) as well as traffic insurance (2.3%), employer benefit (2.37%), non-profit (0.44%) and rest of the world (0.24%) Source: International Health Policy Program (IHPP), Ministry of Public Health, Thailand, 2007. Available online at http://siteresources.worldbank.org/INTTHAILAND/Resources/333200-1089943634036/475256-1151398858396/HHealthcare_Financing_in_Thailand_2007_IHPP.ppt Figure 2. Health Insurance Coverage, 2003
Health Insurance Coverage, 2003
UC46.5 million
Uninsured3.0 million
SSS7.4 million
CSMBS7.0 million
72%
5%
12%
11%
Source: “Financing Universal Healthcare in Thailand”, International Labor Organization (ILO) report, 2004. Available online at http://www.ilo.org/public/english/protection/secsoc/downloads/publ/995sp1.pdf.
19
Figure 3. Total Health Expenditures, current prices, 1994-2005 Total Health Expenditures, current prices, 1994-2005
3.49%3.47%3.55%
3.68%
3.52% 3.53%3.84%
4.00%3.74%
3.50% 3.40%3.32%
20,000
70,000
120,000
170,000
220,000
1994 1995 1996 1997 1998 1999 2000 2001 2002 2003 2004 2005
Ba
ht (
Mill
ion)
0.00%
2.00%
4.00%
6.00%
% G
DP
.
investmentOperating health expendituresRatio of THE to GDP (%)
127,655 B
172,811 B
189,143 B
177,102 B
147,838 B
170,203 B167,147 B162,124 B
210,368 B
200,768 B
248,079 B
225,652 B
Source: IHPP 2007 Figure 4. Health Spending Growth and the Business Cycle
Figure. 4Health Spending Growth and the Business Cycle
9.5%
15.6%
-11.4%-13.4%
-0.1%
15.6%
6.3%8.3%
-3.1%
6.0%
2.6%
8.1% 7.8%6.3%
3.6%4.6%
-0.6%
4.5%4.2%
-7.3%-7.4%
9.8%
-15.0%
-10.0%
-5.0%
0.0%
5.0%
10.0%
15.0%
20.0%
1995 1996 1997 1998 1999 2000 2001 2002 2003 2004 2005
THE Growth Rate GDP Growth Rate Source: IHPP 2007
20
Figure 5. Health Financing Sources
Health financing sources
0%
20%
40%
60%
80%
100%19
94
1995
1996
1997
1998
1999
2000
2001
2002
2003
2004
2005
Year
Non-GovernmentGovernment
555353
46 4545 44443737 3636
5555
454747
545656 6363
6464
Source: IHPP 2007 Figure 6. Proposed and Approved Capitation Rates
Proposed and approved capitation rates
1,4471,512
1,6701,788
1,901
1,202 1,2021,309
1,396
1,659
0
500
1,000
1,500
2,000
2002 2003 2004 2005 2006
baht
per
cap
ita
ProposedApproved
Source: IHPP 2007

21
Figure 7. Beneficiaries of Insurance Schemes by Income Quintiles, 2004
Beneficiaries of insurance schemes by income quintiles, 2004
4% 1%
25%7%
5%
25%
11%14%
23%
26% 31%
17%49%
10%
52%
0%
10%
20%
30%
40%
50%
60%
70%
80%
90%
100%
CSMBS SSS UC
Quintile 1 (poorest) Quintile 2 Quintile 3 Quintile 4 Quintile 5 (richest)
Source: Health and Welfare Survey 2004, Thai National Statistical Office. Reported by Viroj and others, International Conference on Social Health Insurance in Developing Countries, December 5-7, 2005. Available online at http://www.shi-conference.de/downl/2_%20Pres_Dr%20Viroj%20Tangcharoensathien_Role%20of%20SHI%20in%20UC.pdf Figure 8. Net Government Health Subsidies Shift Toward the Poor, 2001 and 2003
Net government health subsidies shift toward the poor, 2001 and 2003
28%
20%17% 17% 18%
31%
22%
16%15% 15%
0%
5%
10%
15%
20%
25%
30%
35%
1 2 3 4 5
20012003
Income Quintiles Source: IHPP 2007
22
Table 1. Incidence of Catastrophic Health Costs, 2000 and 2006
% of Households Low Income Programsa
Year 2000 Quintile 1 4.00% 2.70% Quintile 5 5.60% 7.10% All Households 5.40% 4.70%
Year 2006 Quintile 1 0.90% 0.90% Quintile 5 3.30% 3.00% All Households 2.00% 1.90%
aPrograms are the Low Income Card and the Voluntary Health Card (2000) and the Universal Coverage Scheme (2006).
Source: IHPP 2007 Table 2. Cost of Covering Renal Replacement Therapy
2005 2009 2014 2019 (year 1) (year 5) (year 10) (year 15) Policy 1: Universal access to RRT
Cost (million Baht) 3,994 18,058 32,255 43,804 % of UC budget 5.5 18.4 23.7 23.6 % of Total Health Expenditure 1.7 5.9 7.7 7.7
Policy 2: RRT for kidney transplant eligible Cost (million Baht) 1,981 8,944 15,966 21,625 % of UC budget 2.7 9.1 11.7 11.7 % of THE 0.9 2.9 3.8 3.8
Memorandum UC budget (million Baht) 73,136 98,074 135,987 185,248 THE (million Baht) 230,836 303,931 417,522 572,659
Note: Estimate assumes RRT costs 250,000 Baht per patient per year.
Source: IHPP 2007 Table 3. Average Health Spending in UC, SSS, and CSMBS, 2002
Scheme Per capita annual
expenditure (in Baht) Per capita Insurance Expenditure/
Total Health Expenditure (per capita) UC 1,232 38% SSS+WCF 3,401 104% CSMBS 1,720 53% THE per capita 3,264 100%
Source: ILO Report, 2005, page 8.