Embed Size (px)
Citation preview
ANALYSIS OF THE HEALTH SYSTEM IN SLOVENIA
EvaluatingHealth FinancingFinal Report

Evaluating Health Financing
Final Report
15th October 2015

Evaluating Health Financing
Written by:
Steve Thomas Centre for Health Policy and Management, Trinity College Dublin
Tamás Evetovits WHO Barcelona Office for Health System Strengthening, Division of Health Systems and Public Health, WHO Europe
Sarah Thomson WHO Barcelona Office for Health System Strengthening, Division of Health Systems and Public Health, WHO Europe
Contents
List of tables and figures ............................................................................................................. i
Acknowledgments...................................................................................................................... ii
List of Abbreviations ................................................................................................................. iii
Introduction ............................................................................................................................... 1
The macroeconomic context and its impact on health care financing ..................................... 3
The structure of health care financing....................................................................................... 3
1. Diversification of public revenues for health and potential new resources to ensure
adequacy and stability of health care financing .................................................................... 8
2. More stable funding of HIIS through changed contributions ....................................... 12
3. Revisiting the current benefit package and user fee policy ......................................... 19
Conclusions .............................................................................................................................. 22
References ............................................................................................................................... 23
i
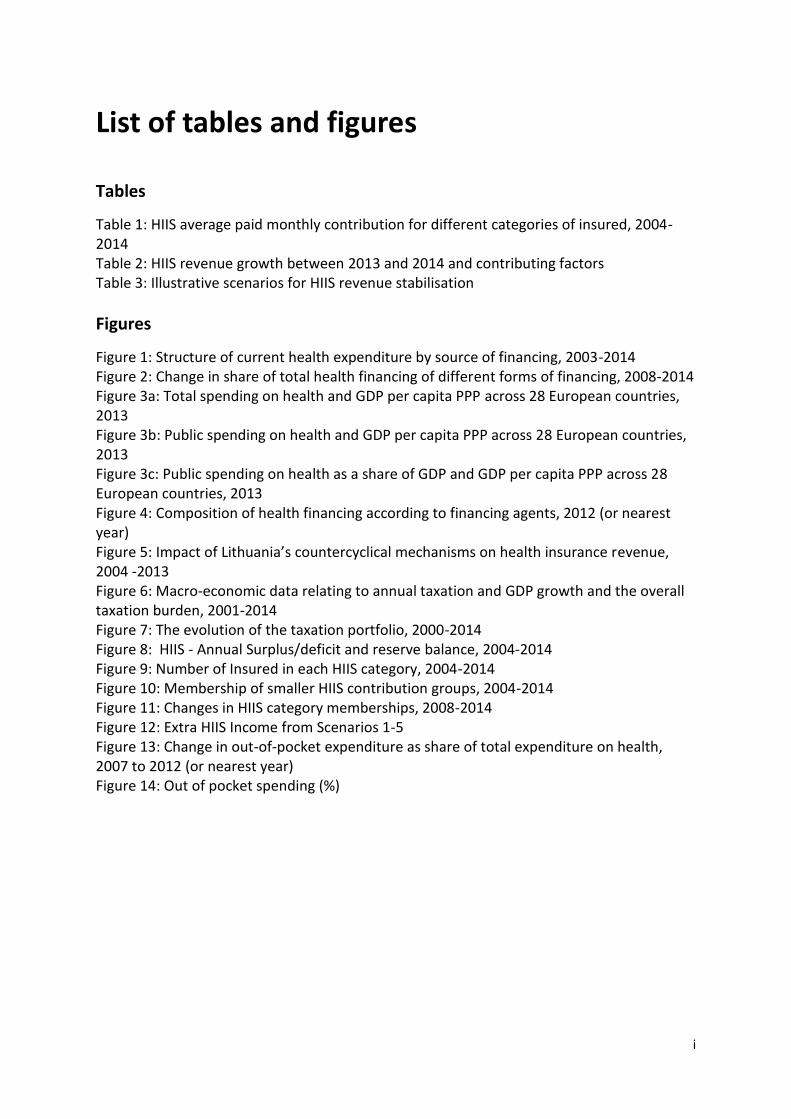
List of tables and figures
Tables
Table 1: HIIS average paid monthly contribution for different categories of insured, 2004-2014 Table 2: HIIS revenue growth between 2013 and 2014 and contributing factors Table 3: Illustrative scenarios for HIIS revenue stabilisation
Figures
Figure 1: Structure of current health expenditure by source of financing, 2003-2014
Figure 2: Change in share of total health financing of different forms of financing, 2008-2014 Figure 3a: Total spending on health and GDP per capita PPP across 28 European countries, 2013 Figure 3b: Public spending on health and GDP per capita PPP across 28 European countries, 2013 Figure 3c: Public spending on health as a share of GDP and GDP per capita PPP across 28 European countries, 2013 Figure 4: Composition of health financing according to financing agents, 2012 (or nearest year) Figure 5: Impact of Lithuania’s countercyclical mechanisms on health insurance revenue, 2004 -2013 Figure 6: Macro-economic data relating to annual taxation and GDP growth and the overall taxation burden, 2001-2014 Figure 7: The evolution of the taxation portfolio, 2000-2014 Figure 8: HIIS - Annual Surplus/deficit and reserve balance, 2004-2014 Figure 9: Number of Insured in each HIIS category, 2004-2014 Figure 10: Membership of smaller HIIS contribution groups, 2004-2014 Figure 11: Changes in HIIS category memberships, 2008-2014 Figure 12: Extra HIIS Income from Scenarios 1-5 Figure 13: Change in out-of-pocket expenditure as share of total expenditure on health, 2007 to 2012 (or nearest year) Figure 14: Out of pocket spending (%)

ii
Acknowledgments
The extensive support and comments of the Slovenian local working group were highly
appreciated in the development of this report, namely Dušan Jošar, Eva Zver, Boris
Kramberger, Stane Vencelj, Davor Dominkus, Franc Klužer, Elda Gregorič Rogelj. The authors
wish to thank them for all their insight and facilitation of data gathering.

iii
List of Abbreviations
CHI Complementary Health Insurance EU European Union HIIS Health Insurance Institute of Slovenia IMAD Institute of Economic Research OECD Organisation for Economic Co-operation and Development SHI Social Health Insurance UHC Universal Health Coverage WHO World Health Organization
1
Introduction
Key performance metrics for any health financing system tend to relate to three different
components: raising sufficient revenues to provide or purchase appropriate levels of care,
ensuring access to a comprehensive range of needed services especially for those who are
less able to afford and pooling risks across different subsections of the population (Normand
and Thomas 2008, Thomas and Darker 2013). A key constraint then for any health care
financing systems will be financial sustainability (Thomson et al, 2009) which relates both to
raising sufficient revenues for care from internal sources but also having reliable and
predictable sources of revenue to adequately cover needs (La Fond 1995, McPake and
Kutzin 1997). A key objective, sometimes in competition with financial sustainability, is
equity. Equity in health care can take many forms but may most usefully relate to health
care financing according to ability and access to health care services according to need
(WHO 2012). Often a key aim for equity of financing is that it is progressive i.e. that not only
do the rich pay more than the poor but that the rich pay a higher proportion of their income
than the poor do. Equity of access is most easily secured when services are free at the point
of contact for the entire population. However, equity of access will also depend on the
package of care being offered and the capacity of the health care system to deliver care in a
timely way across an entire country. Other considerations also typically relate to the
efficiency of revenue generation and administration, the quality of care financed and the
transparency and simplicity of financing mechanisms (Kutzin 2008).
As a foundation for this report on options for financing it is important to review how health
care financing in Slovenia performs against such metrics. Drawing on the Health Expenditure
review there are several key features of the health financing system:
1) Public spending on health is heavily reliant on payroll taxes – the share of government
budget funding is very low in contrast to other countries that use the labour market to
finance health care – and contribution rates are currently among the highest in Europe.
In spite of recent increases in contribution rates for some categories, Health Insurance
Institute of Slovenia (HIIS) funding is not sufficient to meet current liabilities. This will
become an even greater challenge in future, as the population ages and dependency
ratios change (ie. a smaller pool of workers is called on to pay for a growing pool of non-
workers).
2) The current system of financing does not have a sufficiently robust counter-cyclical
mechanism to mitigate the potential adverse effects of revenue fluctuations due to
economic cycles (see Figure 2). Financial contributions into the HIIS, the single
purchaser of the publicly funded health care system, have fallen over the economic
crisis due to rising unemployment, slower wage growth and increases in the share of
inactive enrolees who make comparatively low monthly contributions. Furthermore,
with the HIIS not being able to run a deficit year by year, then there is no automatic
2
public subsidy into the system. A more stable system of funding sources is needed to
secure quality care and full access to a comprehensive package for all.
3) Despite these funding challenges, the system has performed well in relation to both the
equity of financing and access. While there has been some cost-shifting on to private
sources, the Complementary Health Insurance (CHI) system (with almost universal CHI
enrolment) has meant that almost no households have been exposed to damaging out-
of-pocket payments. Hence, equity of access has been preserved with remarkably little
unmet need. Public financing through the HIIS is mainly progressive with higher
contribution rates broadly by those on higher incomes. The funding of CHI is, however,
regressive being based on a flat payment but the amount of funds through this channel
is not a large proportion of the total financing picture and it is still a more equitable
alternative than out-of-pocket expenditure.
4) The funding of long-term care is a growing problem which needs additional funding. The
European Commission (2015) estimates that the costs associated with health care will
rise by between 1.2% and 1.9% of GDP by 2060 (from 5.7% 1of GDP in 2013 to between
6.8% and 7.5% of GDP in 2060). Furthermore, expenditure on long-term care will rise
from 1.42 percent of GDP in 2013 to between 3.0% and 4.1% of GDP in 2060. While this
trajectory is long, if it is not appropriately planned for then acute care systems may well
reach straining point which creates problems of capacity and leads to inefficiency and
resource wastage with bed blockers. Furthermore, current financing of long-term care
is extremely piecemeal. Given the recent economic difficulties it is not immediately
obvious where extra funds will come from. There have been some suggestions that the
CHI system, while effectively preserving access to care for the population and allowing
the government to offload costs to pooled private funding, is nevertheless a source of
high and inefficient transaction costs which could be put to better use, such as
(partially) funding long-term care. Still, CHI plays an important role as outlined above
and any attempt to displace it will incur risks with only limited financial gains.
Therefore, a comprehensive and more strategic approach to devising a long-term care
financing system is required.
There are key challenges to improving the sufficiency, reliability and counter-cyclicality of
funding into the health care system while not sacrificing the good equity performance. This
report will explore the context for health care financing, current trends and different
financing reform options. An accompanying report will review the options for CHI (See
report Making Sense of Complementary Health Insurance).
1 Public expenditure for health care according to SHA methodology, but excluding long-term health care
expenditure. 2 Public Expenditure for long-term care according to SHA methodology, but including additional expenditure
for disability from ESPROSS.

3
The macroeconomic context and its impact on health care financing
The Slovenian economy experienced a deep double-dip recession which has had huge
implications for health care financing. In 2009, Slovenia suffered a severe economic decline
and real GDP shrunk by -7.8%, one of the largest declines in all of Europe in 2009 and
deeper than the average contraction across the EU-28 of -4.4%. While 2010 brought
recovery with a real GDP growth of 1.2% this rebound was small, below the EU average of
2.1%. However, from the last quarter of 2011 the economy again contracted; real GDP
declining by 2.6% and 1.0% in 2012 and 2013. Based on Eurostat data, the unemployment
rate steadily increased from a low of 4.4% in 2008 to 10.1% in 2013. However, national data
on the registered unemployed indicates an even higher unemployment rate, peaking at
13.1% in 2013. In addition, those still employed faced significantly lower wages through the
crisis. While real growth in wages remained constant at the beginning of the crisis at over
2% annually, gross wage growth per employee slowed considerably in 2011 and declined in
2012 and 2013 by -2.4% and -2.0%.
Since at least 2006, the health portion of total government expenditure in Slovenia has been
slightly below the EU-28 average in all years; for example, in 2012 health comprised 14.4%
of government spending, compared to the EU-28 average of 14.6%. The health share of total
government expenditure decreased to 11.6% in 2013 due to increased public expenditure to
bail out the banks, placing Slovenia well below the EU-28 average of 14.8%. Nevertheless,
the recent return to growth of the Slovenian economy (3% GDP growth in 2014) may, in
time and if sustained, provide some help with public financing through increased revenues
for HIIS where employment and wages increase. It will be important therefore to estimate
future revenue projections of HIIS with a return to growth, notwithstanding the lower
proportion of the population in the higher contribution categories for HIIS, and refresh the
projections for future health system financial sustainability comparing costs and revenues.
Nevertheless, a recent surplus for the HIIS was caused primarily by stark cost reductions and
cost shifting rather than recovering revenues.
What has become apparent, though, is that revenue generation in the Slovenian health
sector may be less reliable in times of crisis, because the health sector depends primarily on
social insurance contributions – which are dependent largely on those in formal
employment work and their earnings – and countercyclical mechanisms are inadequate.
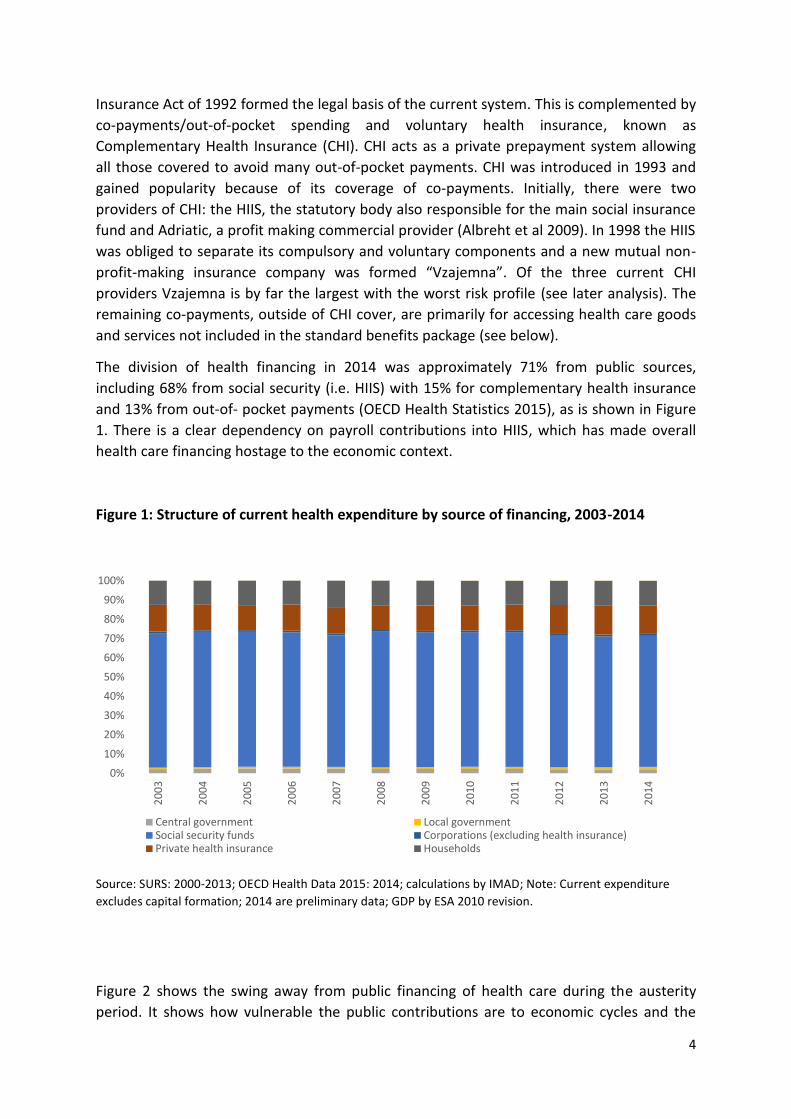
The structure of health care financing The Slovenian health care system is primarily financed by a single health insurance scheme
(Health Insurance Institute of Slovenia - HIIS). This is a Bismarckian social insurance model
which was first introduced for workers as an extension to the compulsory accident
insurance system in 1888 (Albreht T et al 2009). More recently, the Health Care and Health
4
Insurance Act of 1992 formed the legal basis of the current system. This is complemented by
co-payments/out-of-pocket spending and voluntary health insurance, known as
Complementary Health Insurance (CHI). CHI acts as a private prepayment system allowing
all those covered to avoid many out-of-pocket payments. CHI was introduced in 1993 and
gained popularity because of its coverage of co-payments. Initially, there were two
providers of CHI: the HIIS, the statutory body also responsible for the main social insurance
fund and Adriatic, a profit making commercial provider (Albreht et al 2009). In 1998 the HIIS
was obliged to separate its compulsory and voluntary components and a new mutual non-
profit-making insurance company was formed “Vzajemna”. Of the three current CHI
providers Vzajemna is by far the largest with the worst risk profile (see later analysis). The
remaining co-payments, outside of CHI cover, are primarily for accessing health care goods
and services not included in the standard benefits package (see below).
The division of health financing in 2014 was approximately 71% from public sources,
including 68% from social security (i.e. HIIS) with 15% for complementary health insurance
and 13% from out-of- pocket payments (OECD Health Statistics 2015), as is shown in Figure
1. There is a clear dependency on payroll contributions into HIIS, which has made overall
health care financing hostage to the economic context.
Figure 1: Structure of current health expenditure by source of financing, 2003-2014
Source: SURS: 2000-2013; OECD Health Data 2015: 2014; calculations by IMAD; Note: Current expenditure
excludes capital formation; 2014 are preliminary data; GDP by ESA 2010 revision.
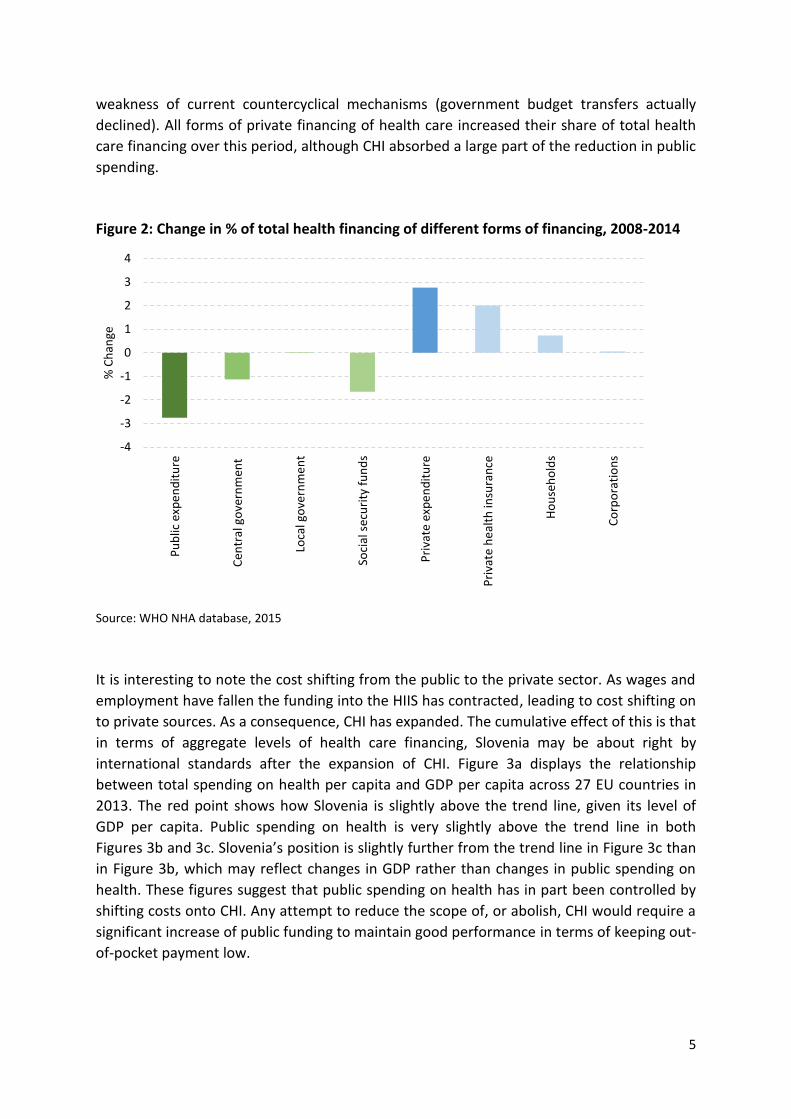
Figure 2 shows the swing away from public financing of health care during the austerity
period. It shows how vulnerable the public contributions are to economic cycles and the
0%
10%
20%
30%
40%
50%
60%
70%
80%
90%
100%
20
03
20
04
20
05
20
06
20
07
20
08
20
09
20
10
20
11
20
12
20
13
20
14
Central government Local governmentSocial security funds Corporations (excluding health insurance)Private health insurance Households
5
weakness of current countercyclical mechanisms (government budget transfers actually
declined). All forms of private financing of health care increased their share of total health
care financing over this period, although CHI absorbed a large part of the reduction in public
spending.
Figure 2: Change in % of total health financing of different forms of financing, 2008-2014
Source: WHO NHA database, 2015
It is interesting to note the cost shifting from the public to the private sector. As wages and
employment have fallen the funding into the HIIS has contracted, leading to cost shifting on
to private sources. As a consequence, CHI has expanded. The cumulative effect of this is that
in terms of aggregate levels of health care financing, Slovenia may be about right by
international standards after the expansion of CHI. Figure 3a displays the relationship
between total spending on health per capita and GDP per capita across 27 EU countries in
2013. The red point shows how Slovenia is slightly above the trend line, given its level of
GDP per capita. Public spending on health is very slightly above the trend line in both
Figures 3b and 3c. Slovenia’s position is slightly further from the trend line in Figure 3c than
in Figure 3b, which may reflect changes in GDP rather than changes in public spending on
health. These figures suggest that public spending on health has in part been controlled by
shifting costs onto CHI. Any attempt to reduce the scope of, or abolish, CHI would require a
significant increase of public funding to maintain good performance in terms of keeping out-
of-pocket payment low.
-4
-3
-2
-1
0
1
2
3
4
Pu
blic
exp
en
dit
ure
C
entr
al g
ove
rnm
ent
Lo
cal g
ove
rnm
en
t
So
cial
sec
uri
ty f
un
ds
Pri
vate
exp
en
dit
ure
P
riva
te h
eal
th in
sura
nce
H
ou
seh
old
s
C
orp
ora
tio
ns
% C
han
ge
6
Figure 3a: Total spending on health per capita and GDP per capita, EU28*, 2013
Figure 3b: Public spending on health per capita and GDP per capita, EU28*, 2013
Figure 3c: Public spending on health as a % of GDP and GDP per capita, EU28*, 2013
Source: WHO NHA database 2015; Note:* EU28 minus Luxembourg as Luxembourg is a major outlier in terms
of GDP per capita
R² = 0.91
0
1,000
2,000
3,000
4,000
5,000
6,000
0 10,000 20,000 30,000 40,000 50,000
Tota
l sp
end
ing
on
hea
lth
per
cap
ita
(cu
rren
t P
PP
)
GDP per capita (current PPP)
R² = 0.88
0
1,000
2,000
3,000
4,000
5,000
0 10,000 20,000 30,000 40,000 50,000
Pu
blic
sp
end
ing
on
hea
lth
per
cap
ita
(c
urr
ent
PP
P)
GDP per capita (current PPP)
R² = 0.65
0
2
4
6
8
10
12
0 10,000 20,000 30,000 40,000 50,000
Pu
blic
sp
end
ing
on
hea
lth
as
% G
DP
GDP per capita (current PPP)

7
Figure 4 compares the composition of health care funding across European countries by
financing agents. While this comparison does not fully take account of funding by source it
does confirm two important features:
Slovenia has high social security contributions and a very low contribution from
general taxation. It therefore has a very high dependence on payroll contributions by
international standards and this threatens the stability of health financing.
Slovenia has a very high proportion of funding flowing through CHI, the highest in
Europe, higher even than France, which has displaced out-of-pocket payments but is
less equitable than public funding sources.
Figure 4: Composition of health financing according to financing agents, 2012 (or nearest
year)
Source: OECD Health Statistics 2014; Eurostat Statistics Database; WHO Global Health Expenditure
Database.Note: the data refer to agents and not sources and therefore this may misrepresent some public
sector funding and may limit the use of international comparisons.
Given the problems of a lack of stability in funding and an absence of counter-cyclical
mechanisms we review the options for generating sufficient, stable resources for health
care in an equitable manner. Three strategies are explored in detail:
1. Diversification of public revenues for health and potential new resources to ensure
adequacy and stability of health care financing
2. More stable funding of HIIS through changed contributions
3. Revisiting the current benefit package and user fee policy
8
85 84
5 9
81
12 11 3 4
77
7
33
11
60
33
7 3
67
6
29
67
9
66 63 61
8
17
46
74
52
20
5 4 7
78 79 74 68 69
77 74 70
45
64
15
40
65 69
5
64
39
58 54 38
1
11
29
77
46
59 57 53
6 13
9 15
12 17 19 18 13
8
19 12
17 20 20 21 23
13
22 24 29
17
32 32 34 32
29 43
47
15 18
15
26 36
37 37
5
2
3 5 8
14 1
10 5 4
2 4 15
6 1
3
13
1 2 2 5
3 5 7
0
10
20
30
40
50
60
70
80
90
100
Ne
the
rla
nds 1
De
nm
ark
Un
ited
Kin
gdo
m 2
Cze
ch R
ep
ub
lic
Lu
xe
mb
ou
rg
Sw
eden
Ro
ma
nia
Esto
nia
Cro
atia
Fra
nce
Ita
ly 2
Ge
rman
y
Austr
ia
Belg
ium
Fin
lan
d
EU
28
Slo
vak R
epu
blic
Slo
venia
Spa
in
Pola
nd
Gre
ece
Irela
nd 2
Lithu
ania
Malta
2
La
tvia
Port
ug
al
Hu
ng
ary
Bulg
ari
a
Cyp
rus
No
rwa
y
Ice
lan
d
Turk
ey 2
,3
Sw
itze
rla
nd
FY
R o
f M
aced
on
ia 2
Serb
ia 2
Mon
ten
eg
ro 2
% of current expenditure
General Government Social Security Private out-of-pocket Private insurance Other
8
Specific options around CHI reform and regulation are presented in a separate
accompanying report (See report on Making Sense of Complementary Health Insurance).
1. Diversification of public revenues for health and potential new
resources to ensure adequacy and stability of health care financing
A notable feature of development in many Social Health Insurance (SHI) systems in Europe is that they are not pure in terms of being entirely funded by payroll earmarked deductions. Indeed, it is becoming increasingly difficult to differentiate where SHI systems start and tax-based systems finish. Notable examples include France, Germany and Lithuania and some investigation of these is warranted. France is a very relevant case study in that it is a SHI system in which the levy base is income rather than wages and which benefits from significant government budget support. It also has a significant market for CHI covering co-payments. It therefore provides an interesting point of comparison for Slovenia. In France, a diverse range of taxes are utilised to boost social insurance funding (Normand and Thomas 2009). The French authorities levy social insurance contributions on income as opposed to wages, using a progressive structure, with higher income tax rates for incomes from capital and gaming (e.g. casinos) and lower rates for people on benefits. As Chevreul et al (2010) note:
“The revenue base of SHI has, therefore, been widened and partially disconnected from earnings, making it less vulnerable to wage and employment fluctuations.”
Sources of government budget support for SHI include a 1% tax on the turnover of pharmaceutical companies as well as taxes on their advertising and drug retailing. In 2007, this levied €662 billion for SHI (Chevreul et al, 2010). In addition, large companies, with turnover over €760,000 are taxed on their turnover with a 0.03% tax. There are also levies on the polluting activities of all companies. Finally, revenue from an unpaid working day (the solidarity day) for the French working population, which nets €2 billion, is earmarked for long-term care and support services for the elderly and those with disabilities. Hence, France presents an interesting and imaginative example to broadening the financing base of the health care system beyond payroll taxation. Lithuania also has interesting lessons to offer. It has an elegant counter-cyclical contribution
mechanism which it uses to stabilise social health insurance funding (Kacevičius and
Karanikolos 2015). First, the health insurance fund accumulates reserves. Second, the
government makes transfers from its budget on behalf of the unemployed and those
economically less active. Third, since 2007, these transfers have been based on average
gross wages in the year two years prior to the transfer. Linking government budget transfers
to average wages and the use of a two-year lag helps to prevent sudden drops in health
insurance revenue and restrains expansion during periods of growth. As a result of this
system government budget transfers to mandatory health insurance increased during the
crisis, as can be seen in the Figure 5 below. Hence, despite a huge increase in
unemployment in Lithuania between 2008 and 2012 these policies helped to smooth and
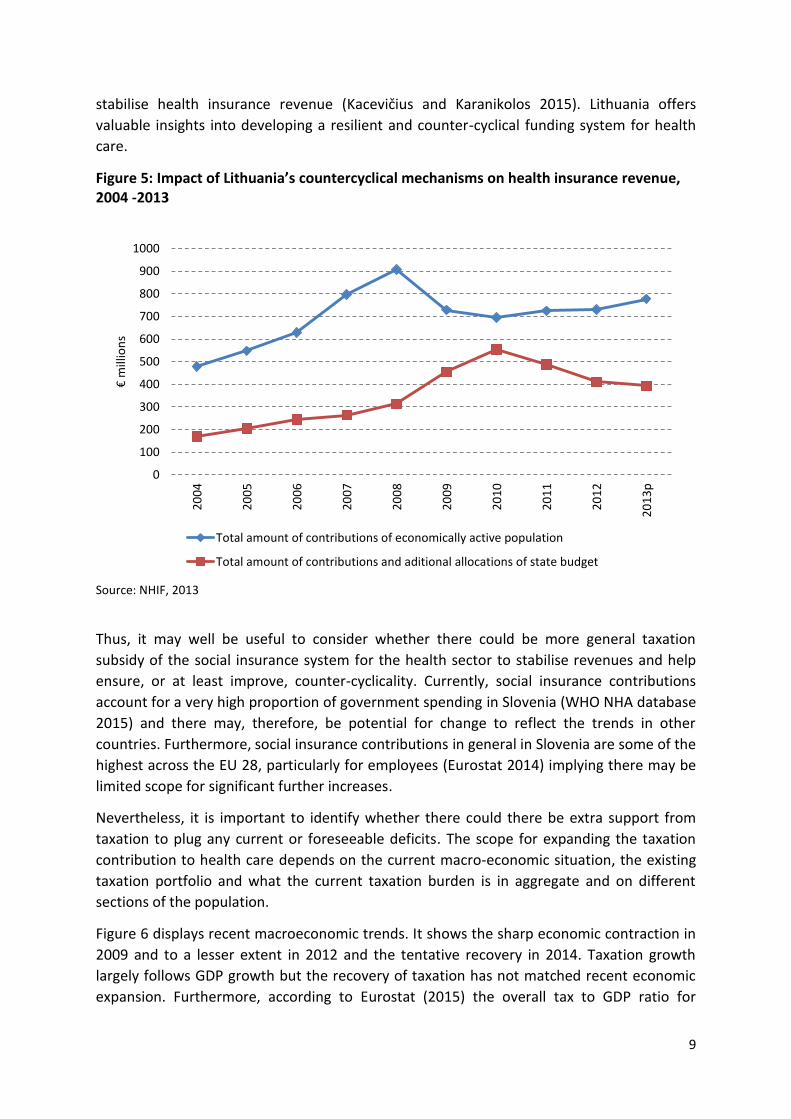
9
stabilise health insurance revenue (Kacevičius and Karanikolos 2015). Lithuania offers
valuable insights into developing a resilient and counter-cyclical funding system for health
care.
Figure 5: Impact of Lithuania’s countercyclical mechanisms on health insurance revenue, 2004 -2013
Source: NHIF, 2013
Thus, it may well be useful to consider whether there could be more general taxation
subsidy of the social insurance system for the health sector to stabilise revenues and help
ensure, or at least improve, counter-cyclicality. Currently, social insurance contributions
account for a very high proportion of government spending in Slovenia (WHO NHA database
2015) and there may, therefore, be potential for change to reflect the trends in other
countries. Furthermore, social insurance contributions in general in Slovenia are some of the
highest across the EU 28, particularly for employees (Eurostat 2014) implying there may be
limited scope for significant further increases.
Nevertheless, it is important to identify whether there could there be extra support from
taxation to plug any current or foreseeable deficits. The scope for expanding the taxation
contribution to health care depends on the current macro-economic situation, the existing
taxation portfolio and what the current taxation burden is in aggregate and on different
sections of the population.
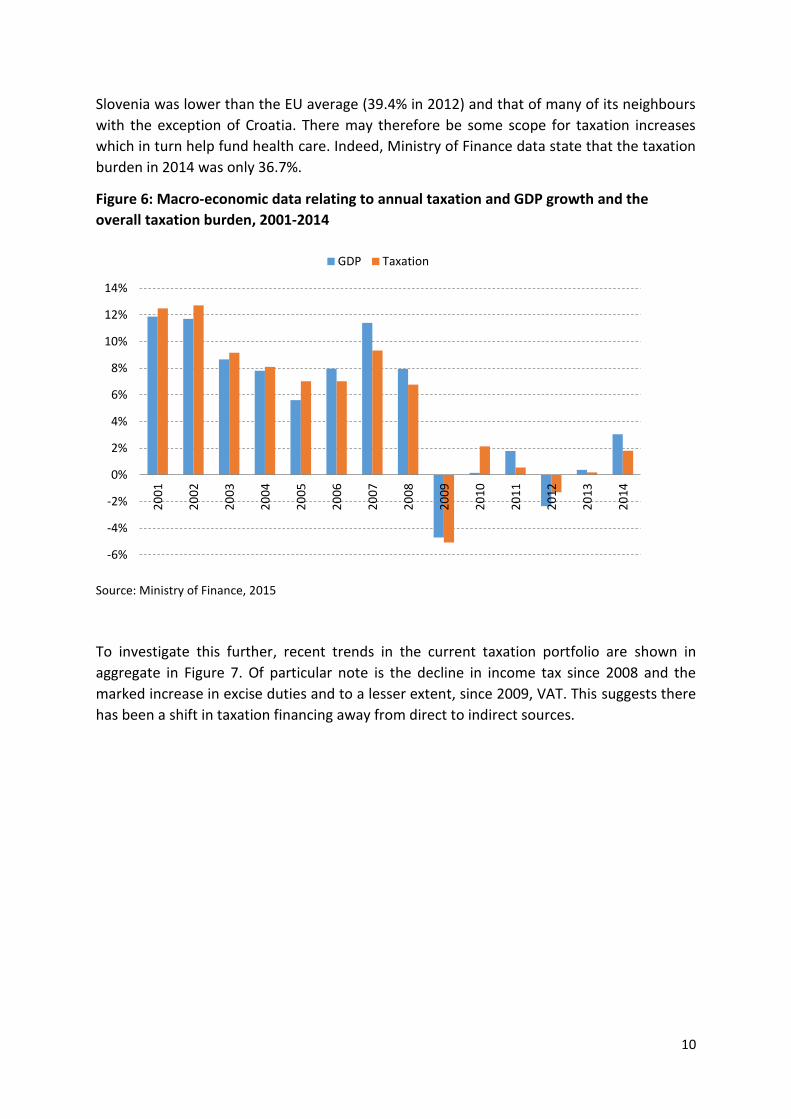
Figure 6 displays recent macroeconomic trends. It shows the sharp economic contraction in
2009 and to a lesser extent in 2012 and the tentative recovery in 2014. Taxation growth
largely follows GDP growth but the recovery of taxation has not matched recent economic
expansion. Furthermore, according to Eurostat (2015) the overall tax to GDP ratio for
0
100
200
300
400
500
600
700
800
900
1000
20
04
20
05
20
06
20
07
20
08
20
09
20
10
20
11
20
12
20
13
p
€ m
illio
ns
Total amount of contributions of economically active population
Total amount of contributions and aditional allocations of state budget
10
Slovenia was lower than the EU average (39.4% in 2012) and that of many of its neighbours
with the exception of Croatia. There may therefore be some scope for taxation increases
which in turn help fund health care. Indeed, Ministry of Finance data state that the taxation
burden in 2014 was only 36.7%.
Figure 6: Macro-economic data relating to annual taxation and GDP growth and the
overall taxation burden, 2001-2014
Source: Ministry of Finance, 2015
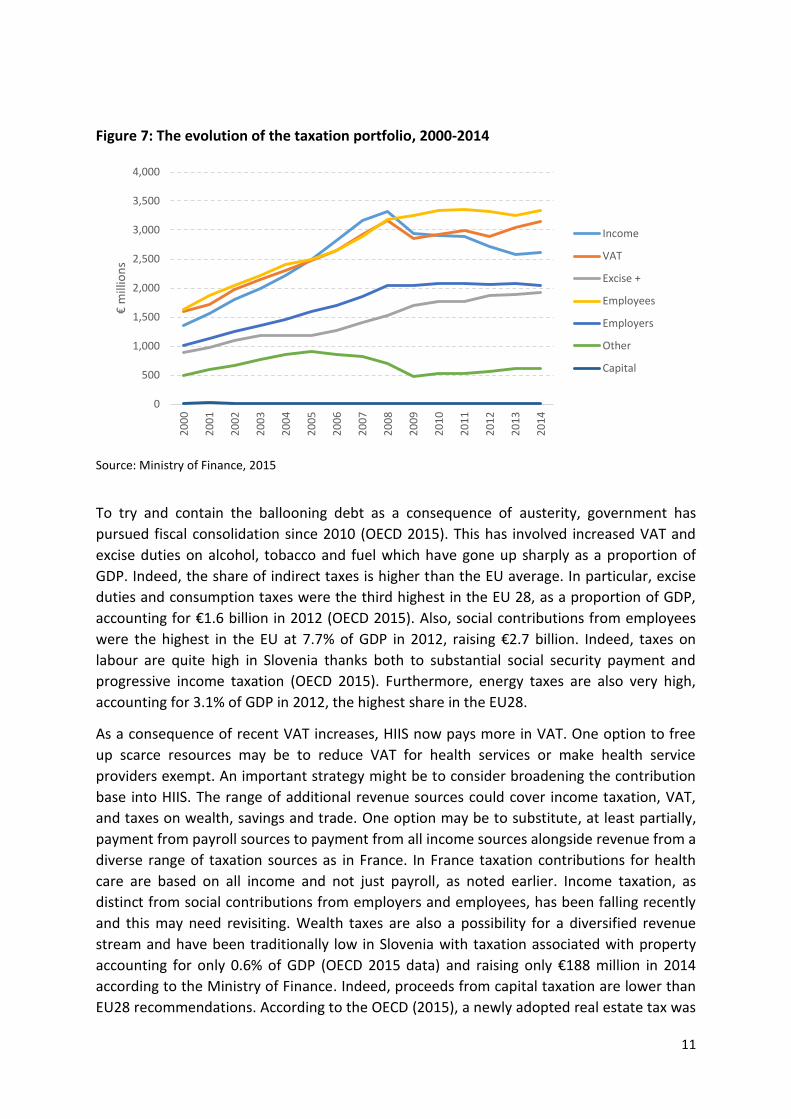
To investigate this further, recent trends in the current taxation portfolio are shown in
aggregate in Figure 7. Of particular note is the decline in income tax since 2008 and the
marked increase in excise duties and to a lesser extent, since 2009, VAT. This suggests there
has been a shift in taxation financing away from direct to indirect sources.
-6%
-4%
-2%
0%
2%
4%
6%
8%
10%
12%
14%
20
01
20
02
20
03
20
04
20
05
20
06
20
07
20
08
20
09
20
10
20
11
20
12
20
13
20
14
GDP Taxation
11
Figure 7: The evolution of the taxation portfolio, 2000-2014
Source: Ministry of Finance, 2015
To try and contain the ballooning debt as a consequence of austerity, government has
pursued fiscal consolidation since 2010 (OECD 2015). This has involved increased VAT and
excise duties on alcohol, tobacco and fuel which have gone up sharply as a proportion of
GDP. Indeed, the share of indirect taxes is higher than the EU average. In particular, excise
duties and consumption taxes were the third highest in the EU 28, as a proportion of GDP,
accounting for €1.6 billion in 2012 (OECD 2015). Also, social contributions from employees
were the highest in the EU at 7.7% of GDP in 2012, raising €2.7 billion. Indeed, taxes on
labour are quite high in Slovenia thanks both to substantial social security payment and
progressive income taxation (OECD 2015). Furthermore, energy taxes are also very high,
accounting for 3.1% of GDP in 2012, the highest share in the EU28.
As a consequence of recent VAT increases, HIIS now pays more in VAT. One option to free
up scarce resources may be to reduce VAT for health services or make health service
providers exempt. An important strategy might be to consider broadening the contribution
base into HIIS. The range of additional revenue sources could cover income taxation, VAT,
and taxes on wealth, savings and trade. One option may be to substitute, at least partially,
payment from payroll sources to payment from all income sources alongside revenue from a
diverse range of taxation sources as in France. In France taxation contributions for health
care are based on all income and not just payroll, as noted earlier. Income taxation, as
distinct from social contributions from employers and employees, has been falling recently
and this may need revisiting. Wealth taxes are also a possibility for a diversified revenue
stream and have been traditionally low in Slovenia with taxation associated with property
accounting for only 0.6% of GDP (OECD 2015 data) and raising only €188 million in 2014
according to the Ministry of Finance. Indeed, proceeds from capital taxation are lower than
EU28 recommendations. According to the OECD (2015), a newly adopted real estate tax was
0
500
1,000
1,500
2,000
2,500
3,000
3,500
4,0002
00
0
20
01
20
02
20
03
20
04
20
05
20
06
20
07
20
08
20
09
20
10
20
11
20
12
20
13
20
14
€ m
illio
ns
Income
VAT
Excise +
Employees
Employers
Other
Capital

12
repealed by the Constitutional Court in 2014. It is understood that government will try again
as the Constitutional Court ruled only against the particular form and implementation of the
property tax and not the idea of a property tax in itself. Indeed, there may be significant
potential here as revenue from taxes on property were only one third of the OECD average
in 2013. Furthermore, this form of taxation has been found to have relatively limited
negative effects on economic growth (Arnold et al 2011). Certainly a revised property tax
would raise significant resources, with initial estimates of over €300 million (OECD 2015).
One potential other additional source is to review the scope for additional or higher sin
taxes (on tobacco, alcohol, luxury products, fat, carbonated drinks) and earmark such funds
into HIIS. Such initiatives may prove reasonably acceptable to the population as such
products can be seen to directly contribute to health care problems. Hence, taxing them has
an easily accepted rationale. Revenues from such sources would be more modest but still
may make a contribution to stabilising health care funding. Other potential options could
even relate to small taxes on large corporations (as corporation tax yields are currently quite
low) and additional new taxes on tourists (airport taxes, accommodation).
There is not the space here to explore and evaluate thoroughly the current general taxation
arrangements in Slovenia. Nor is it the primary focus of this report on health care financing.
Nevertheless, the point of this brief analysis is to show that there is need for real
consideration of more revenues from taxation into health care to improve stability of health
care funding. Furthermore, this analysis indicates several possible approaches which may
warrant further exploration. They are not exhaustive but may prove useful.
2. More stable funding of HIIS through changed contributions
The HIIS is the main purchaser of health services in the Slovenian health care system. It ran
sizeable deficits over the economic crisis. As noted the financial sustainability of HIIS has
been undermined by the economic crisis and the absence of robust countercyclical
mechanisms. From 2008 the scheme incurred several annual deficits and depleted its
reserves significantly (see Figure 8). The return of economic growth, with better
employment and insurance payments may alleviate at least in part the funding problems for
HIIS. However, it will not resolve the problem of the current pro-cyclical public funding of
the health system based as it is almost exclusively on payroll contributions.

13
Figure 8: HIIS - Annual Surplus/deficit and reserve balance, 2004-2014
Source: HIIS, 2015
There have been recent attempts to boost the sustainability of HIIS financing through
cutting the prices paid to providers and shifting costs onto households by increasing user fee
rates. Yet there is more that can be done particularly on the financing side. The
contribution rates of different groups may need to be reviewed where the proportion of the
population in each group is shifting. Also, the contribution rates for poorer households and
pensioners which fall on the government may need to be increased. This would be an
excellent counter-cyclical mechanism.
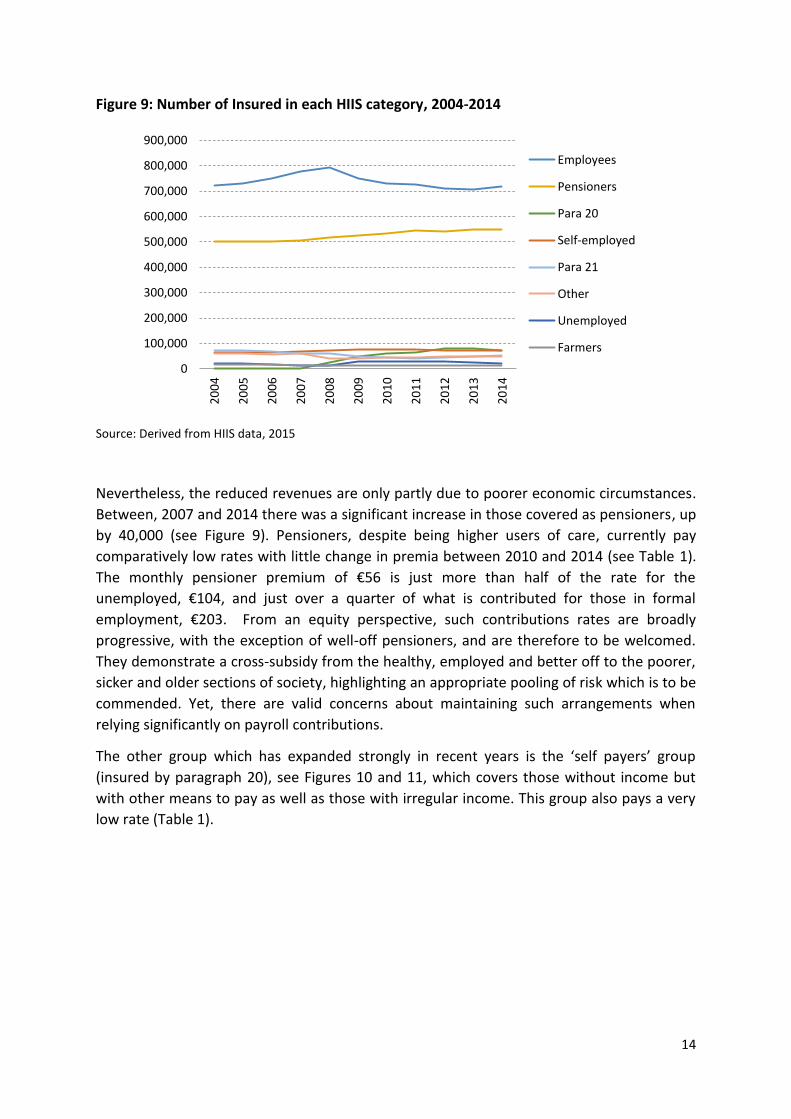
Figure 9 highlights the trends over the past decade in the number of insured in each HIIS
category. Those in formal employment accounted for 52% of all enrolled in 2004. From 2008
to 2013 the number of in this category dropped significantly by 80,000 partly due to the
severe economic austerity. While there was a recovery of around 10,000 in the contributing
formally employed in 2014, due to the improved economy, the proportion of overall
members in this group was still significantly lower than in 2008, dropping to 47%. The
significance of this was to reduce the revenue base of the HIIS. Employees and employers
together pay much higher rates than any other group (see Table 1).
-100
-80
-60
-40
-20
0
20
40
60
80
20
04
20
05
20
06
20
07
20
08
20
09
20
10
20
11
20
12
20
13
20
14
€ m
illio
ns
Surplus/deficit
Reserves
14
Figure 9: Number of Insured in each HIIS category, 2004-2014
Source: Derived from HIIS data, 2015
Nevertheless, the reduced revenues are only partly due to poorer economic circumstances.
Between, 2007 and 2014 there was a significant increase in those covered as pensioners, up
by 40,000 (see Figure 9). Pensioners, despite being higher users of care, currently pay
comparatively low rates with little change in premia between 2010 and 2014 (see Table 1).
The monthly pensioner premium of €56 is just more than half of the rate for the
unemployed, €104, and just over a quarter of what is contributed for those in formal
employment, €203. From an equity perspective, such contributions rates are broadly
progressive, with the exception of well-off pensioners, and are therefore to be welcomed.
They demonstrate a cross-subsidy from the healthy, employed and better off to the poorer,
sicker and older sections of society, highlighting an appropriate pooling of risk which is to be
commended. Yet, there are valid concerns about maintaining such arrangements when
relying significantly on payroll contributions.
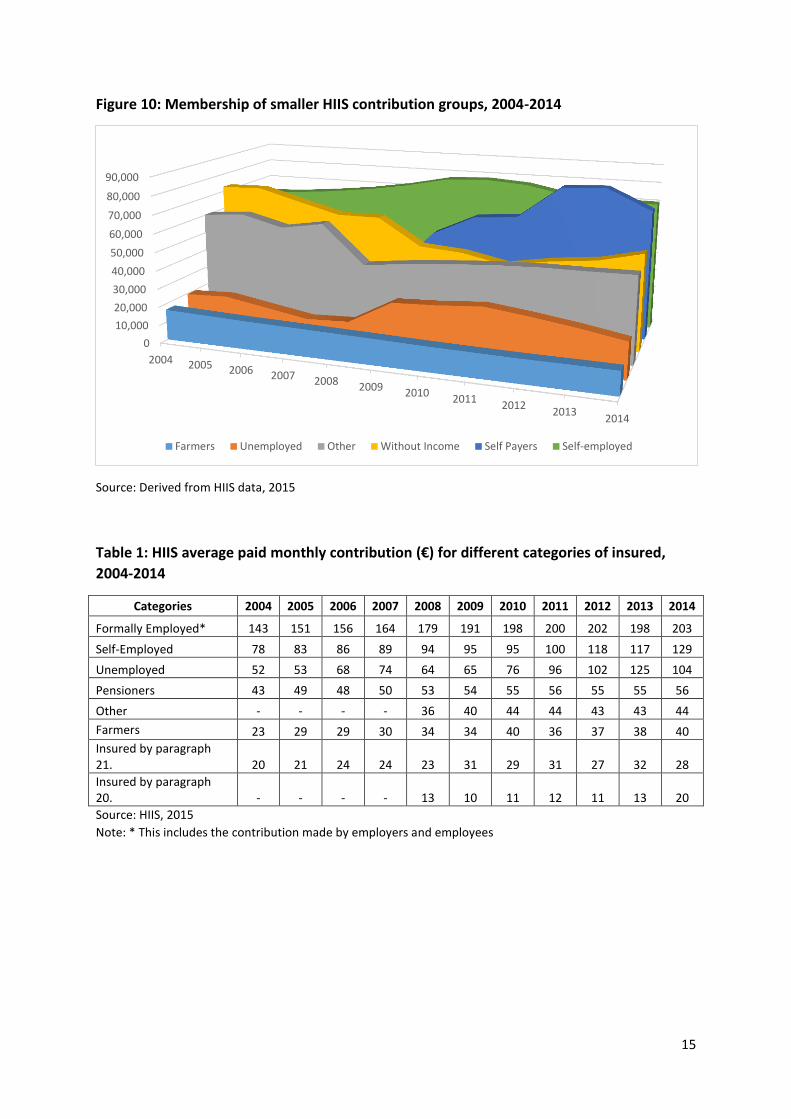
The other group which has expanded strongly in recent years is the ‘self payers’ group
(insured by paragraph 20), see Figures 10 and 11, which covers those without income but
with other means to pay as well as those with irregular income. This group also pays a very
low rate (Table 1).
0
100,000
200,000
300,000
400,000
500,000
600,000
700,000
800,000
900,000
20
04
20
05
20
06
20
07
20
08
20
09
20
10
20
11
20
12
20
13
20
14
Employees
Pensioners
Para 20
Self-employed
Para 21
Other
Unemployed
Farmers
15
Figure 10: Membership of smaller HIIS contribution groups, 2004-2014
Source: Derived from HIIS data, 2015
Table 1: HIIS average paid monthly contribution (€) for different categories of insured,
2004-2014
Categories 2004 2005 2006 2007 2008 2009 2010 2011 2012 2013 2014
Formally Employed* 143 151 156 164 179 191 198 200 202 198 203
Self-Employed 78 83 86 89 94 95 95 100 118 117 129
Unemployed 52 53 68 74 64 65 76 96 102 125 104
Pensioners 43 49 48 50 53 54 55 56 55 55 56
Other - - - - 36 40 44 44 43 43 44
Farmers 23 29 29 30 34 34 40 36 37 38 40
Insured by paragraph 21. 20 21 24 24 23 31 29 31 27 32 28
Insured by paragraph 20. - - - - 13 10 11 12 11 13 20
Source: HIIS, 2015
Note: * This includes the contribution made by employers and employees
0
10,000
20,000
30,000
40,000
50,000
60,000
70,000
80,000
90,000
2004 2005 2006 2007 2008 2009 20102011
20122013
2014
Farmers Unemployed Other Without Income Self Payers Self-employed
16
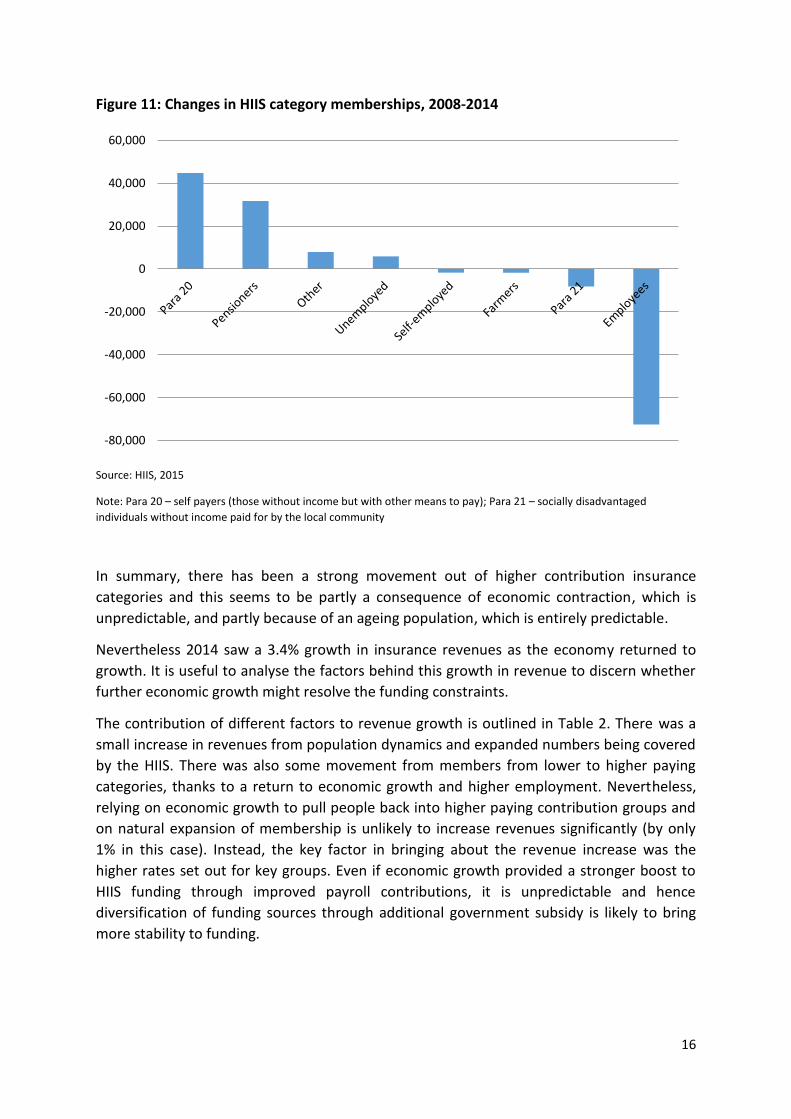
Figure 11: Changes in HIIS category memberships, 2008-2014
Source: HIIS, 2015
Note: Para 20 – self payers (those without income but with other means to pay); Para 21 – socially disadvantaged
individuals without income paid for by the local community
In summary, there has been a strong movement out of higher contribution insurance
categories and this seems to be partly a consequence of economic contraction, which is
unpredictable, and partly because of an ageing population, which is entirely predictable.
Nevertheless 2014 saw a 3.4% growth in insurance revenues as the economy returned to
growth. It is useful to analyse the factors behind this growth in revenue to discern whether
further economic growth might resolve the funding constraints.
The contribution of different factors to revenue growth is outlined in Table 2. There was a
small increase in revenues from population dynamics and expanded numbers being covered
by the HIIS. There was also some movement from members from lower to higher paying
categories, thanks to a return to economic growth and higher employment. Nevertheless,
relying on economic growth to pull people back into higher paying contribution groups and
on natural expansion of membership is unlikely to increase revenues significantly (by only
1% in this case). Instead, the key factor in bringing about the revenue increase was the
higher rates set out for key groups. Even if economic growth provided a stronger boost to
HIIS funding through improved payroll contributions, it is unpredictable and hence
diversification of funding sources through additional government subsidy is likely to bring
more stability to funding.
-80,000
-60,000
-40,000
-20,000
0
20,000
40,000
60,000
17
Table 2: HIIS revenue growth between 2013 and 2014 and contributing factors
Reasons for increase Resulting growth in revenue (%)
Increased HIIS membership 0.2
Higher Contribution Rates 2.4
Move into higher rate groups 0.8
Overall 3.4 Source: Derived from HIIS contribution and membership data, 2015
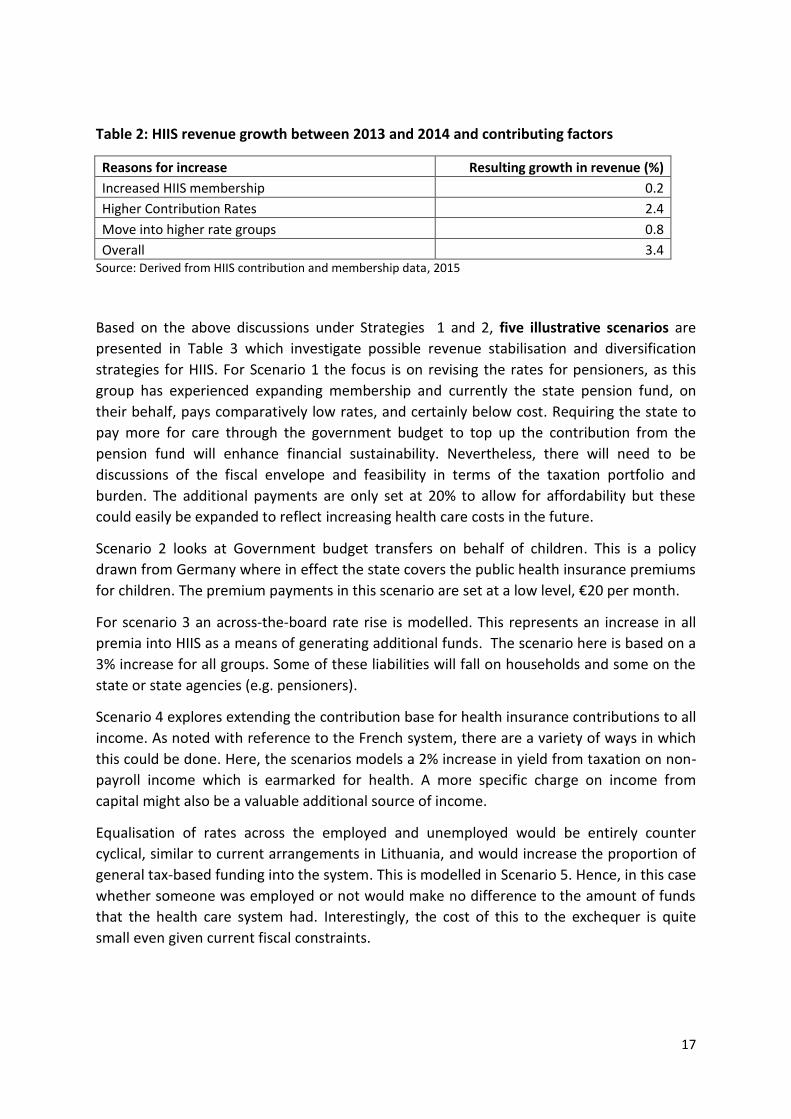
Based on the above discussions under Strategies 1 and 2, five illustrative scenarios are
presented in Table 3 which investigate possible revenue stabilisation and diversification
strategies for HIIS. For Scenario 1 the focus is on revising the rates for pensioners, as this
group has experienced expanding membership and currently the state pension fund, on
their behalf, pays comparatively low rates, and certainly below cost. Requiring the state to
pay more for care through the government budget to top up the contribution from the
pension fund will enhance financial sustainability. Nevertheless, there will need to be
discussions of the fiscal envelope and feasibility in terms of the taxation portfolio and
burden. The additional payments are only set at 20% to allow for affordability but these
could easily be expanded to reflect increasing health care costs in the future.
Scenario 2 looks at Government budget transfers on behalf of children. This is a policy
drawn from Germany where in effect the state covers the public health insurance premiums
for children. The premium payments in this scenario are set at a low level, €20 per month.
For scenario 3 an across-the-board rate rise is modelled. This represents an increase in all
premia into HIIS as a means of generating additional funds. The scenario here is based on a
3% increase for all groups. Some of these liabilities will fall on households and some on the
state or state agencies (e.g. pensioners).
Scenario 4 explores extending the contribution base for health insurance contributions to all
income. As noted with reference to the French system, there are a variety of ways in which
this could be done. Here, the scenarios models a 2% increase in yield from taxation on non-
payroll income which is earmarked for health. A more specific charge on income from
capital might also be a valuable additional source of income.
Equalisation of rates across the employed and unemployed would be entirely counter
cyclical, similar to current arrangements in Lithuania, and would increase the proportion of
general tax-based funding into the system. This is modelled in Scenario 5. Hence, in this case
whether someone was employed or not would make no difference to the amount of funds
that the health care system had. Interestingly, the cost of this to the exchequer is quite
small even given current fiscal constraints.

18
Table 3: Illustrative scenarios for HIIS revenue stabilisation
Options Rationale Description Impact Impact on financing objectives
Scenario 1
Higher effective rates for pensioners (with the additional amount paid by the state and not the pension fund)
20% increase for pensioners
Extra €73 million per annum (3.2% revenue growth)
If covered by budget transfers, this option improves diversification of funding sources and in turn sustainability of health financing. Generates significant additional revenue with the potential of adjusting further upwards if needed in the future.
Scenario 2 Government budget transfers on behalf of children
€20 per month per child paid by the state
Extra €89 million per annum (3.8% revenue growth)
This option improves diversification of funding sources and in turn sustainability of health financing. Generates significant additional revenue.
Scenario 3 General across the board increase
3% increase in premiums for all groups
Extra €69 million per annum (3.0% revenue growth)
Does not address the fundamental challenge of overreliance on payroll contributions, but generates significant additional revenue.
Scenario 4 Extend levy base for health insurance contributions to all income
Additional 2% non-payroll income taxation earmarked to health
Extra €15.8 million per annum (0.7% revenue growth)
Improves equity in financing and sustainability of the health financing systems. Generates a little more revenue for health, but could be expanded.
Scenario 5
Equalisation of rates between employed and unemployed
Contribution for unemployed to double from €104 to €203 per month
Extra €4 million per annum (0.2% revenue growth)
Very modest effect on generating additional revenue, but improves counter-cyclicality.
Note: The above scenarios are not exclusive and could be combined.

19
The impact on revenues shown in Table 3 is in addition to any caused by an increase in
membership of higher paying contribution groups or by increased formal employment. The
extra income produced by the three scenarios is also displayed by each contribution group
in Figure 12.
Figure 12: Extra HIIS Income from Scenarios 1-5
Source: Derived from HIIS data (2015) on membership and contribution rates and Ministry of Finance data
(2015) on taxation revenues.
Note: S1, S2, S3, S4 and S5 refer to scenarios 1-5 outlined in Table 3 above.
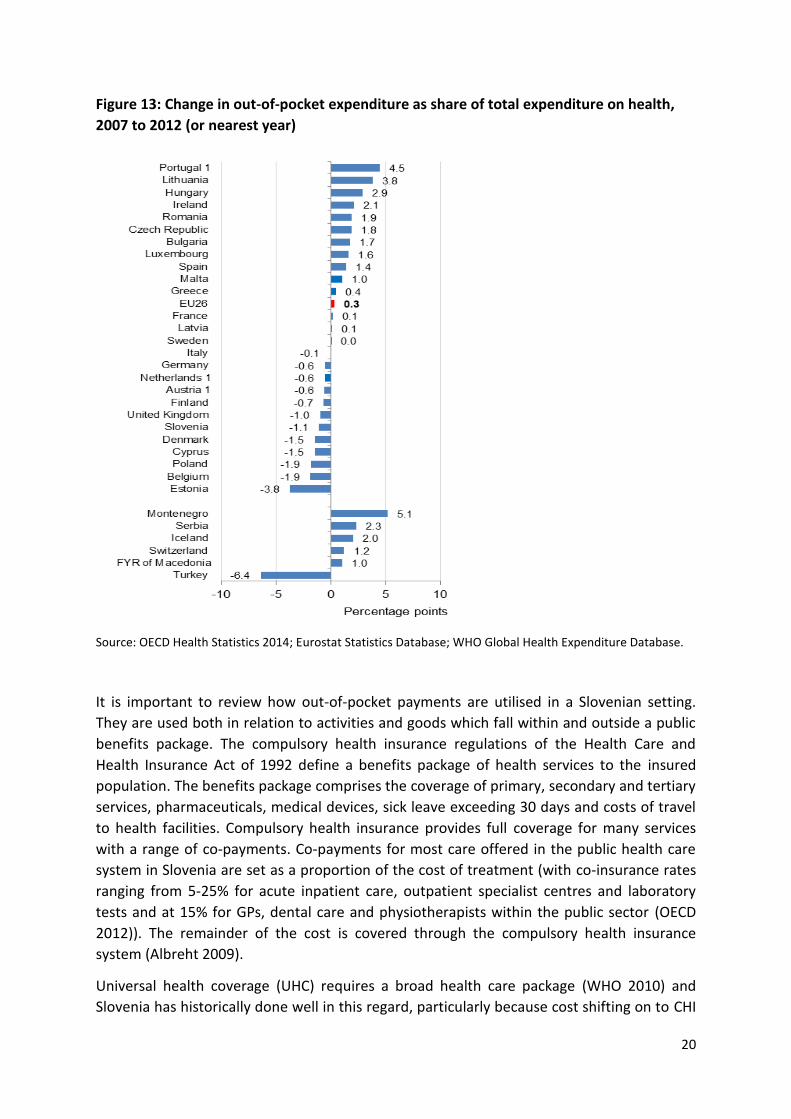
3. Revisiting the current benefit package and user fee policy
The strengths and weakness of co-payments are clear in the international literature (James
et al 2006). Co-payments are rarely a large generator of income and they impede access,
causing inequity and unmet need. They can be helpful to supporting policy in relation to
gate keeping and appropriate pathways to care. It is therefore not generally recommended
to use or increase out-of-pocket payments and certainly not in a European or high income
setting. However, where CHI covers co-payments the highly inequitable effects of co-
payments are removed. Nevertheless, CHI payments are still currently regressive and
certainly less equitable than public financing. Indeed, it appears that there was less reliance
on out-of-pocket payments as a proportion of health funding in 2012 than in 2007.
-
10
20
30
40
50
60
70
80
90
100
S1 S2 S3 s4 s5
For Pensioners For Children Employers
Employees Others Non-payroll income tax
For unemployed
20
Figure 13: Change in out-of-pocket expenditure as share of total expenditure on health,
2007 to 2012 (or nearest year)
Source: OECD Health Statistics 2014; Eurostat Statistics Database; WHO Global Health Expenditure Database.
It is important to review how out-of-pocket payments are utilised in a Slovenian setting.
They are used both in relation to activities and goods which fall within and outside a public
benefits package. The compulsory health insurance regulations of the Health Care and
Health Insurance Act of 1992 define a benefits package of health services to the insured
population. The benefits package comprises the coverage of primary, secondary and tertiary
services, pharmaceuticals, medical devices, sick leave exceeding 30 days and costs of travel
to health facilities. Compulsory health insurance provides full coverage for many services
with a range of co-payments. Co-payments for most care offered in the public health care
system in Slovenia are set as a proportion of the cost of treatment (with co-insurance rates
ranging from 5-25% for acute inpatient care, outpatient specialist centres and laboratory
tests and at 15% for GPs, dental care and physiotherapists within the public sector (OECD
2012)). The remainder of the cost is covered through the compulsory health insurance
system (Albreht 2009).
Universal health coverage (UHC) requires a broad health care package (WHO 2010) and
Slovenia has historically done well in this regard, particularly because cost shifting on to CHI

21
has protected the population against co-payments. While affordability within public
financing will always be an issue it is recommended that the package continues to be as
broad as possible to facilitate equity of access. Nevertheless, UHC and standard goals of
health care financing also focus on the quality of health care (World Bank 2013), which
partly relates to the appropriate pathway through the health care system and the right care
being provided in the most appropriate setting. It is important to identify, legitimise and
fund this quality care provision. Evaluating such best practice quality of care within the
current package may be a more effective focus for decision-making and subsequent
resource allocation than revisiting and potentially restricting the publicly provided benefit
package.
Figure 14: Out of pocket spending (%)
Source: OECD Health Statistics, 2015
There is a substantial amount of out-of-pocket payments made by households outside the
basic public health care package and not covered by CHI. In 2014 this was equivalent to 13%
of current health expenditure or €405 million (OECD Health Stat 2015); however, in
comparison to the EU average (21 % in 2013) this share of OOP is relatively low and without
CHI it would be substantially higher. The breakdown of out-of-pocket spending is shown in
Figure 14. Pharmaceuticals make up 40% of this with therapeutic appliances (eyeglasses)
also a significant factor on 20%. Though Slovenia typically has a low level of unmet need
according to EU-SILC data there is some evidence of an increase during austerity and
specifically in relation to dentistry. It may be that additional CHI cover for dental care might
help avoid this problem.
4 6
8
8
11
1 2
0.3
40
20
In-patient care
Basic medical and diagnostic services
Out-patient dental care
Out-patient specialised care
Other out-patient curative care(physioteraphy, paramedical, etc)
Out-patient rehabilitative care
Long-term nursing care
Patient transport
Pharmaceuticals
Therapeutic appliances
22
One phenomenon that needs to be understood better is the practice of paying out-of-
pocket to skip waiting lists. There is some anecdotal evidence that private fees are charged
to skip formal public waiting lists for ambulatory care only to enter back into the public
acute system. If this were the case it would clearly be inequitable and of no value to the
system. However, more evidence is needed in this area on the scale of this activity before
considering appropriate strategies.
Conclusions
In terms of aggregate health care financing Slovenia has a heavy reliance on payroll
contributions income which may not be financially sustainable. This issue has come into
sharp relief with the economic crisis and has been compounded by austerity cost-shifting
from public to private sources. There is also a long term problem through a shift of the
population into lower contribution categories for social insurance and a rapidly aging
population promising a future problem in funding long-term care. Further, there are
dangers in promoting further cost-shifting on to the private sector because of regressive
financing and the potential for growing transaction costs. Renewed economic growth will
help but not by itself alleviate the problems of an overreliance on payroll funding. It is in
this context that additional general taxation support to HIIS looks inevitable to help deal
with economic cycles and the ageing population. There is some scope for revising the
contribution rates and payments into HIIS. The rates for pensioners paid by the state
pension fund are very low and could be supplemented by funding from general taxation
revenue to help stabilise funding. This is probably the most powerful option to improve the
health financing system in Slovenia, though state funding of children’s premiums may also
be helpful. Contribution rates for the employed and unemployed could also be equalised to
provide counter-cyclical funding. Of course there are fiscal challenges with the above
strategies but the French and Lithuanian experiences show what can be done. There may
be some scope for proceeds from non-payroll income and property taxes to be earmarked
for health care.
Further use of co-payments is not recommended without regulated CHI cover. The current
benefit package should not be restricted or divided but there could be a renewed focus on
quality of care and appropriate pathways within the benefit package. It might also be worth
investigating more what the extent and impact of private payments to skip waiting lists are
in the system.
23
References
Albreht T, Turk E, Toth M, Ceglar J, Marn S, Pribakovic Brinovec R, Schafer M, Avdeeva O,
and van Ginneken E. Slovenia: Health System Review. Health Systems in Transition. 2009;
volume 11(3):1-168
Arnold, J., B. Brys, C. Heady, Å. Johansson, C. Schwellnus and L. Vartia (2011), “Tax Policy for
Economic Recovery and Growth”, The Economic Journal, Vol. 121, No. 550.
European Commission (2015), The 2015 Ageing Report. Economic and Budgetary Projections for the EU28 Member States (2013-2060).
Eurostat. Commentary on Eurostat Taxation Trends in the European Union. Data for the EU
Member States, Iceland and Norway. 2014 edition. Luxembourg. Publications Office of the
European Union
James CD1, Hanson K, McPake B, Balabanova D, Gwatkin D, Hopwood I, Kirunga
C, Knippenberg R, Meessen B, Morris SS, Preker A, Souteyrand Y, Tibouti A,Villeneuve P, Xu
K. To retain or remove co-payments? Reflections on the current debate in low- and middle-
income countries. Appl Health Econ Health Policy. 2006;5(3):137-53.
Kacevičius G and Karanikolos M (2015). The Impact of the Financial Crisis on the health
System and Health in Lithuania in A. Maresso, P. Mladovsky, S. Thomson et al. (eds) (2015)
Economic Crisis, Health Systems and Health in Europe: Country Experience. Copenhagen:
WHO/European Observatory on Health Systems and Policies.
Kutzin J (2008) Health financing policy: A guide for decision-makers. Copenhagen: WHO Regional office for Europe.
LaFond A (1995), Sustaining primary health care. The Save the Children Fund. London: Earthscan Publications Ltd.
McPake B and Kutzin J (1997), Methods for Evaluation of Health System Performance and the Effects of Reforms. World Health organisation (draft, mimeo).
McPake B, Normand C and Smith S (2013) “Health Economics: An International Perspective” Routledge. 3rd Edition.
Normand C and Thomas S. Health Care Financing and the Health System in, editor Harald Kristian Heggenhougen, Stella R. Quah. International encyclopaedia of public health. Oxford, Elsevier, 2008,
OECD Economic Surveys: Slovenia, Overview May 2015. OECD
Saltman R B (2015), Health sector solidarity: a core European value but with broadly varying content. Israel Journal of Health Policy Research 2015, 4:5 http://www.ijhpr.org/content/4/1/5
Thomas S, Darker C. “Which is the right model of Universal Health Insurance for Ireland?” In, editor Tom O'Connor, Integrated Care for Ireland in an International Context. Challenges for Policy, Institutions and Specific Service User Needs, Cork, Oak Tree Press, 2013.

24
Thomson S, Foubister T, Figueras J, Kutzin J, Permanand G, Bryndová L. Addressing Financial Sustainability in Health Systems. World Health Organization 2009 and World Health Organization, on behalf of the European Observatory on Health Systems and Policies 2009 http://www.euro.who.int/__data/assets/pdf_file/0005/64949/E93058.pdf?ua=1
World Bank (2013) Global conference on universal health coverage for inclusive and sustainable growth: a global synthesis report. Washington DC, World Bank.
WHO (2010) Health systems financing: the path to universal coverage. Geneva: World Health Organization.