Embed Size (px)
Citation preview
HAL Id: hal-02024629https://hal.archives-ouvertes.fr/hal-02024629
Submitted on 4 Mar 2019
HAL is a multi-disciplinary open accessarchive for the deposit and dissemination of sci-entific research documents, whether they are pub-lished or not. The documents may come fromteaching and research institutions in France orabroad, or from public or private research centers.
L’archive ouverte pluridisciplinaire HAL, estdestinée au dépôt et à la diffusion de documentsscientifiques de niveau recherche, publiés ou non,émanant des établissements d’enseignement et derecherche français ou étrangers, des laboratoirespublics ou privés.
Health care emergency plan modeling and simulation incase of major flood
Afafe Zehrouni, Vincent Augusto, Thierry Garaix, Raksmey Phan, XiaolanXie
To cite this version:Afafe Zehrouni, Vincent Augusto, Thierry Garaix, Raksmey Phan, Xiaolan Xie. Health care emer-gency plan modeling and simulation in case of major flood. 2017 Winter Simulation Conference(WSC), Dec 2017, Las Vegas, NV, United States. pp.2994-3005, �10.1109/WSC.2017.8248021�. �hal-02024629�
HEALTH CARE EMERGENCY PLANMODELING AND SIMULATION IN CASE OF
MAJOR FLOOD
Afafe ZehrouniVincent AugustoThierry GaraixRaksmey Phan
Xiaolan Xie
UMR CNRS 6158 LIMOSMines Saint-Etienne
158 cours Fauriel42023 Saint-Etienne cedex 2, FRANCE
March 4, 2019
ABSTRACTHealth care system is one of the most critical units in case of disasters. Floods causean increase of emergency patient flow that may overwhelm hospital resources. In thispaper, we present a simulation model that evaluates health care emergency plan and as-sesses the resilience of the Ile-de-France region in case of a major flood. We combinedin the model the health care process with a Markov chain flood model. The resultscan be used to elaborate an optimized strategy for evacuation and transfer operations.We provide a case study on three specialties and quantify the impact of several floodscenarios on the health care system.
1 INTRODUCTIONDisasters, natural or man-made, can result in significant economic loss and human ca-sualties. Disaster management operations consist of the reallocation of resources (e.g.health facilities, transportation) to respond to the disaster’s emergency while coveringthe daily emergencies. One of the main difficulties in disaster management is the lackof resources [HHM+05], and understanding the key resources and their managementis primordial to adjust their utilization during a disaster.
1
In most of the emergency preparedness plans, health facilities represent a key re-source and must accommodate the patients resulting from a disaster [Agc13]. However,hospitals may be themselves at risk of damage from internal or external sources gen-erated by a disaster. For example, in the Ile-de-France region, flood risk is relativelyhigh due the geographical position. As any disaster, flood causes an increase of emer-gency patients flow that may overwhelm hospital resources [TIKN07]. Moreover, somehospitals in the region are at risk of submersion and damages to electricity and watercoverage. The patients treated in the impacted hospitals need to be transferred to otherhospitals.
Hospital evacuation is more constrained than mass evacuation due to the patients’health conditions and the necessity to relocate them in appropriate facilities. In the lit-erature, hospital evacuation operations have been approached in different ways: projectmanagement, mathematical modeling, simulation models and hybrid models [TJS06].In disaster management, simulation models address a variety of problems (e.g. pre-vention, response, transportation) to evaluate several outcomes (e.g. costs, mortality)[AG06]. Some simulation models focus directly on the building architecture (e.g. exitsand staircases) that are used during evacuation [Hun16].
In [VDP16], a simulation model is developed to compare the impact of differentresources on the evacuation operations. The results indicate that an increase to thetransportation resources (number of ambulances or the transit rate) has a smaller ben-efit to evacuation than a change in the available capacity of the safe hospitals. Thestudy in [YGPL10] focuses on the analysis of the available capacity in safe hospitals inFlorida, ans estimates the absorption ability of the region in case of flood. In [TT06],simulation is used to evaluate the effectiveness of an evacuation plan for one hospitalunder various scenarios and resources (e.g. patient types, nurses, number of ambu-lances). Moreover, emergency patients’ flow also varies during disasters such as floodevents. However, only few studies integrate the uncertainty of disasters in the simu-lation models [SC+13]. [Ban93] suggests using interdisciplinary simulation modelsusing for example meteorological or geological principles.
In France, the French White Plan (Plan Blanc) is an emergency management planin case of a sudden increase of activity in a hospital [CGR15]. If the increase of activ-ity involves several hospitals, an Extended White Plan is triggered to coordinate bothimpacted hospitals and the hospitals receiving the evacuees. One of the main deci-sion makers in the development and application of the Extended White Plan in a givenregion is the Regional Health Agency (Agence Regionale de Sante ARS).
Our aim in the project with ARS Ile-de-France is to develop a simulation model toevaluate the performance of the regional hospitals in case of a flood event.
We present in this paper a discrete event simulation model that includes two majorparts:
• A health care process on a regional (macroscopic) level.
• A flood model using Markov chain to represent the flood dynamic and thus cap-ture the dynamic variation of patients’ flow.
The paper is organized as follows: first we describe the general approach and thevarious data used in our model. Then we detail the flood modeling and the health care
2

process. Finally, based on a real data set, we present examples of results of the modelquantified by key performance indicators.
2 GENERAL APPROACH AND INPUT DATAThe main objective of the DES model we present in this paper is to evaluate the emer-gency plan of the regional (Ile-de-France) health care system and assess the region’sresilience in case of flood.
We define the region’s resilience as the ability to treat all scheduled patients andemergency arrivals within the region (i.e. with no transfer to hospitals outside of theregion). In other words, the resilience is achieved if the non-flooded hospitals can treattheir patients as well as emergency patients and the patients coming from the floodedhospitals. In the context of very limited capacity, such solution may only be achievedby predefined management rules. For example:
• Discharging patients in order to free up as many resources as possible, beforeand during the flood.
• Preventive evacuation of high risk hospitals based on geographic location andelectric fragility.
• Transfer of flooded hospital patients according to pre-established preferences.
Unlike most other disasters (natural and man-made), these rules are feasible in caseof flood because of the alert period given by the weather forecast and water level mea-surements. However, the effectiveness of the flood management rules is highly variabledepending on the flood dynamic (water level and speed) as well as the emergency pa-tients flow.
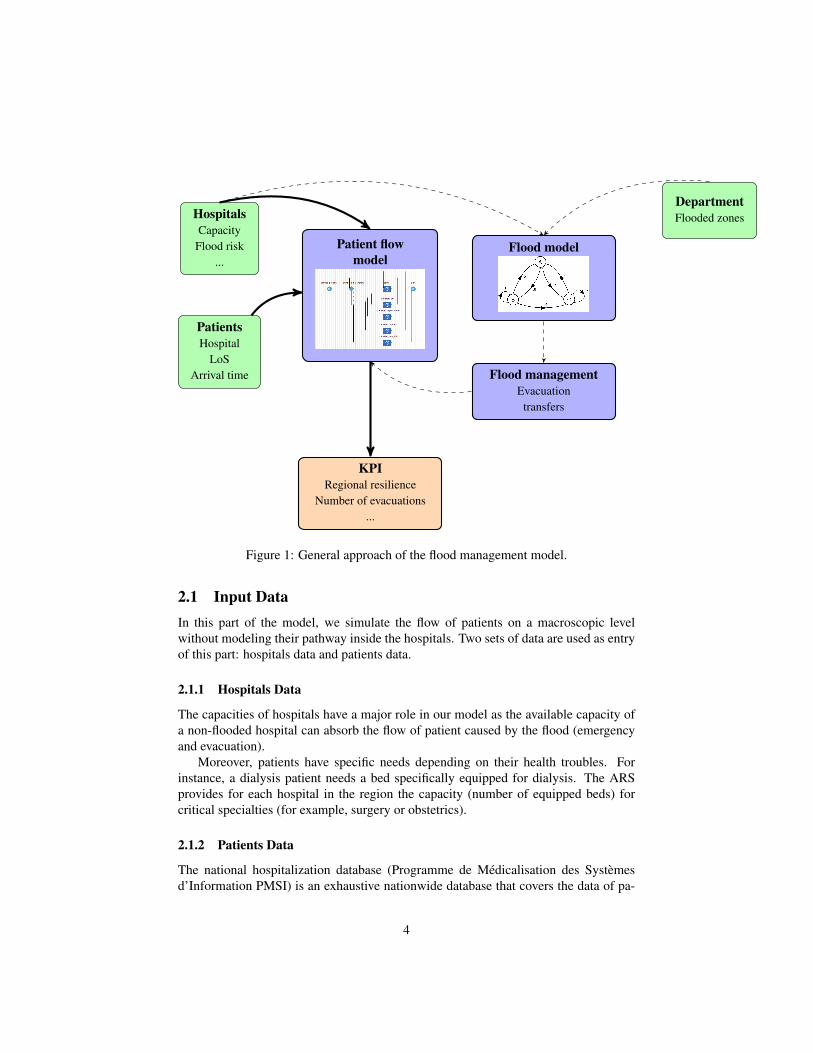
Therefore, to evaluate accurately the preparedness plan and the decisions beforeand during flood, the proposed approach (presented in Figure 1) combines a patientflow model with a dynamic flood model using Markov chains.
In this approach, two main parts are distinguished: the patient flow model and theflood model. The patient flow model is implemented in order to simulate all care path-ways in all hospitals at the macroscopic level over a long horizon (one or two years);the flood model is a dynamic short term event (few days to few weeks). When theflood alert starts, health care processes are adjusted by including the flood managementrules until the resorption of the flood. Such processes are considered as degraded carepathway (evacuation of the hospital and/or patients transfers). Input data (green boxes)feed the aforementioned models: hospital data (capacity per specialty, flood risk evalu-ation...), patient data (referred hospital, length of stay, arrival time...) and geographicaldata (maps of departments within the region, flooded zones...). Finally, several KeyPerformance Indicators (KPI) are measured (regional resilience probability, number oftransfers...) as an output of the model (orange box).
3
HospitalsCapacity
Flood risk...
PatientsHospital
LoSArrival time
DepartmentFlooded zones
Patient flowmodel
Flood model
Flood managementEvacuation
transfers
KPIRegional resilience
Number of evacuations...
Figure 1: General approach of the flood management model.
2.1 Input DataIn this part of the model, we simulate the flow of patients on a macroscopic levelwithout modeling their pathway inside the hospitals. Two sets of data are used as entryof this part: hospitals data and patients data.
2.1.1 Hospitals Data
The capacities of hospitals have a major role in our model as the available capacity ofa non-flooded hospital can absorb the flow of patient caused by the flood (emergencyand evacuation).
Moreover, patients have specific needs depending on their health troubles. Forinstance, a dialysis patient needs a bed specifically equipped for dialysis. The ARSprovides for each hospital in the region the capacity (number of equipped beds) forcritical specialties (for example, surgery or obstetrics).
2.1.2 Patients Data
The national hospitalization database (Programme de Medicalisation des Systemesd’Information PMSI) is an exhaustive nationwide database that covers the data of pa-
4
tients in both public and private hospitals. We extract from this database the dates ofstart and end of stays of patients of all hospitals for every considered specialty.
Hospitals and patients data sets are used as the entry of the discrete event model.Basically, in this part of the model, patients arrive to hospitals with specified arrival rateto receive health care in a specialty for a given length of stay. In normal conditions,hospitals have enough capacity to cover patients needs and no delays or transfers areobserved. This assumption allows us to identify the delays caused only by the floodevent.
2.1.3 Flood Data
Based on the results of a hydraulic model ( ALPHEE) , the Regional and Interdepart-mental Directorate for Environment and Energy designed regional scenarios to estimatethe impact of floods on the Ile-de-France region.
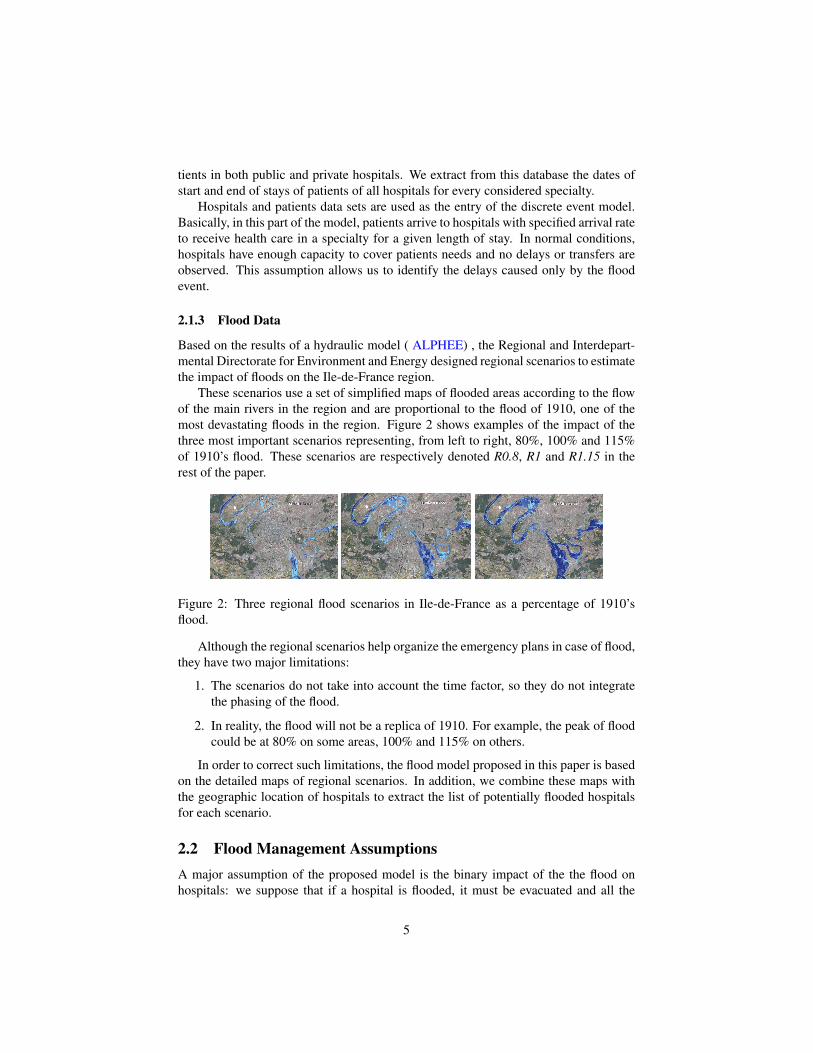
These scenarios use a set of simplified maps of flooded areas according to the flowof the main rivers in the region and are proportional to the flood of 1910, one of themost devastating floods in the region. Figure 2 shows examples of the impact of thethree most important scenarios representing, from left to right, 80%, 100% and 115%of 1910’s flood. These scenarios are respectively denoted R0.8, R1 and R1.15 in therest of the paper.
Figure 2: Three regional flood scenarios in Ile-de-France as a percentage of 1910’sflood.
Although the regional scenarios help organize the emergency plans in case of flood,they have two major limitations:
1. The scenarios do not take into account the time factor, so they do not integratethe phasing of the flood.
2. In reality, the flood will not be a replica of 1910. For example, the peak of floodcould be at 80% on some areas, 100% and 115% on others.
In order to correct such limitations, the flood model proposed in this paper is basedon the detailed maps of regional scenarios. In addition, we combine these maps withthe geographic location of hospitals to extract the list of potentially flooded hospitalsfor each scenario.
2.2 Flood Management AssumptionsA major assumption of the proposed model is the binary impact of the the flood onhospitals: we suppose that if a hospital is flooded, it must be evacuated and all the
5
patients transferred. Moreover, transfer to different specialties are not allowed in ourmodel. Flood management rules of hospitals assumed in our model are considered bothduring the alert period and during the flood event.
2.2.1 During the Alert Period
When a flood alert is triggered, the severity of the event remains unknown. We con-sider that the alert period allows the increase of preparedness to the worst possibilities.Consequently, all the hospitals in the region establish in our model a priority of their pa-tients and free, if possible, a predefined percentage of their capacity. The performanceof the rules applied during the alert period is measured through the three followingoutcomes:
• Less transferred patients in case of flood,
• better preparedness to face to the flow of emergency patients caused by the flood,
• excess capacity for patients transferred from flooded hospitals.
2.2.2 During the Flood Period
When a hospital is flooded, hospitalized patients must be transferred. Also, futurescheduled patients and emergency patients are referred to other hospitals during (atleast) the entire flood duration.
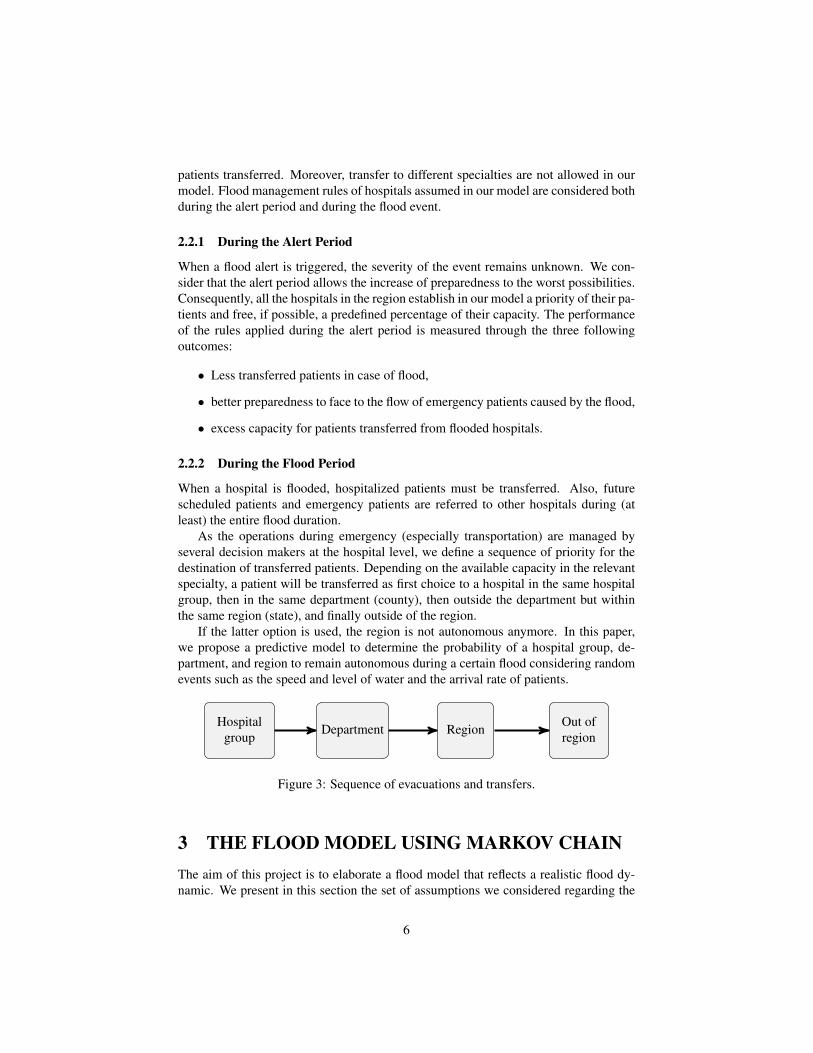
As the operations during emergency (especially transportation) are managed byseveral decision makers at the hospital level, we define a sequence of priority for thedestination of transferred patients. Depending on the available capacity in the relevantspecialty, a patient will be transferred as first choice to a hospital in the same hospitalgroup, then in the same department (county), then outside the department but withinthe same region (state), and finally outside of the region.
If the latter option is used, the region is not autonomous anymore. In this paper,we propose a predictive model to determine the probability of a hospital group, de-partment, and region to remain autonomous during a certain flood considering randomevents such as the speed and level of water and the arrival rate of patients.
Hospitalgroup
Department Region Out ofregion
Figure 3: Sequence of evacuations and transfers.
3 THE FLOOD MODEL USING MARKOV CHAINThe aim of this project is to elaborate a flood model that reflects a realistic flood dy-namic. We present in this section the set of assumptions we considered regarding the
6

flood dynamic related to its starting time and its duration. Then a new Markov chainmodeling flood dynamics is proposed.
3.1 Features of a FloodStarting time. In the Ile-de-France region, the usual period of major flooding is fromNovember to April. Consequently, most preparedness plans are designed according tothe pattern of patients flow during this period. However, flooding may occur at anytime of the year, causing the sub-optimality of some of the emergency managementrules (e.g. June 2016 flood in Paris).
Moreover, patients arrival distribution varies depending on the time of the year.In our model, the starting time of the flood event is selected randomly to capture theimpact of seasonality on the health care process.Flood types. We consider two phases in a flooding event: the flood rising and receding.The length of the first phase determines if the flood is slow or fast.
The total duration of the flood and the duration of both phases are selected randomlywithin realistic ranges extracted from the ALPHEE model and validated by experts.
3.2 Flood DynamicsIn the Ile-De-France region, several measurement stations record water level and flow,15 of which are said “reference station”. For each reference station, there is a potentialflooded area(Zone Inondable Potentielle ZIP). The reference stations and the associatedareas are shown in Figure 4. Let Z be the set of potential flooded areas indexed by z,and Sz be the set of possible states for an area.
Figure 4: Water flow and the potential flooded areas associated to reference stations.
Four states are defined for each area: the first state corresponds to non-flood area;the other three states correspond to water levels relative to the 1910’s reference floodand the scenarios we defined previously (R0.8, R1 and R1.15). Notations and states aresummarized in Table 1.
Space and time dynamic factors are modeled as follows: at each time unit, the floodadvances in the direction of the water flow (i.e. the areas on the right (East) of Figure 4are impacted first), and the changes of states follow that flow.
7
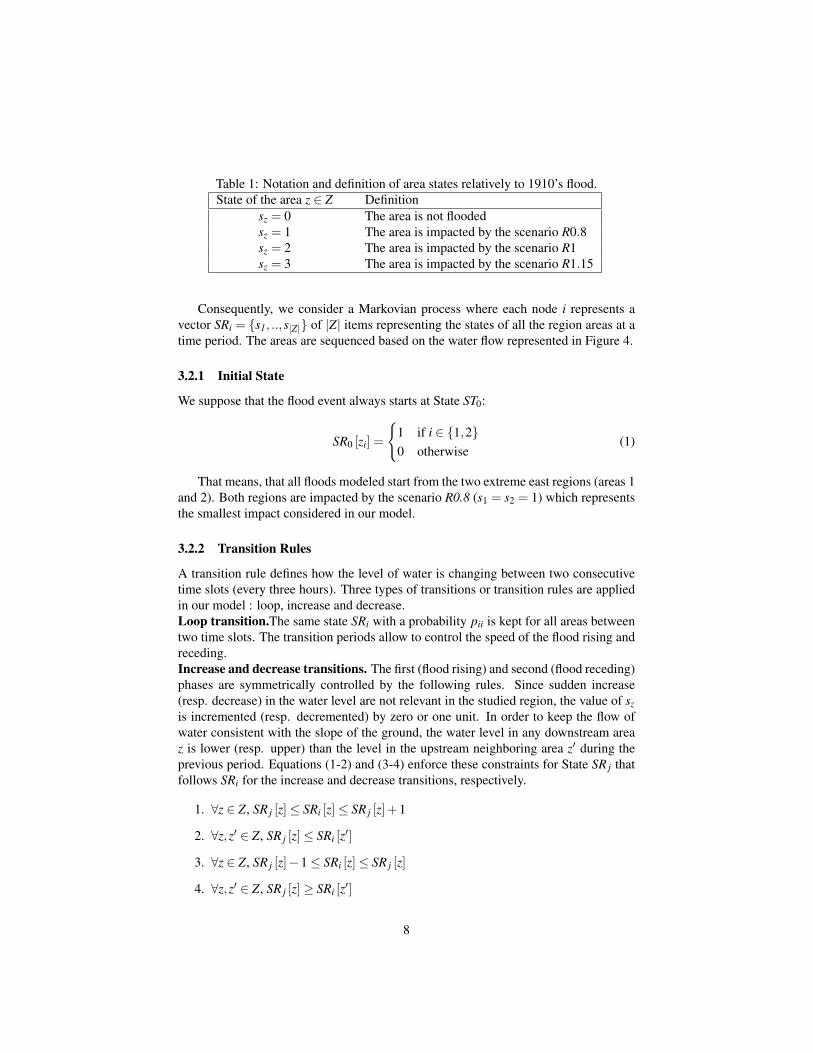
Table 1: Notation and definition of area states relatively to 1910’s flood.State of the area z ∈ Z Definition
sz = 0 The area is not floodedsz = 1 The area is impacted by the scenario R0.8sz = 2 The area is impacted by the scenario R1sz = 3 The area is impacted by the scenario R1.15
Consequently, we consider a Markovian process where each node i represents avector SRi = {s1, ..,s|Z|} of |Z| items representing the states of all the region areas at atime period. The areas are sequenced based on the water flow represented in Figure 4.
3.2.1 Initial State
We suppose that the flood event always starts at State ST0:
SR0 [zi] =
{1 if i ∈ {1,2}0 otherwise
(1)
That means, that all floods modeled start from the two extreme east regions (areas 1and 2). Both regions are impacted by the scenario R0.8 (s1 = s2 = 1) which representsthe smallest impact considered in our model.
3.2.2 Transition Rules
A transition rule defines how the level of water is changing between two consecutivetime slots (every three hours). Three types of transitions or transition rules are appliedin our model : loop, increase and decrease.Loop transition.The same state SRi with a probability pii is kept for all areas betweentwo time slots. The transition periods allow to control the speed of the flood rising andreceding.Increase and decrease transitions. The first (flood rising) and second (flood receding)phases are symmetrically controlled by the following rules. Since sudden increase(resp. decrease) in the water level are not relevant in the studied region, the value of szis incremented (resp. decremented) by zero or one unit. In order to keep the flow ofwater consistent with the slope of the ground, the water level in any downstream areaz is lower (resp. upper) than the level in the upstream neighboring area z′ during theprevious period. Equations (1-2) and (3-4) enforce these constraints for State SR j thatfollows SRi for the increase and decrease transitions, respectively.
1. ∀z ∈ Z, SR j [z]≤ SRi [z]≤ SR j [z]+1
2. ∀z,z′ ∈ Z, SR j [z]≤ SRi [z′]
3. ∀z ∈ Z, SR j [z]−1≤ SRi [z]≤ SR j [z]
4. ∀z,z′ ∈ Z, SR j [z]≥ SRi [z′]
8
All feasible transitions are equiprobable and the sum of their probabilities satisfies∑i, j| j 6=i pi j = 1− pii, with pi j the probability to transit from node i to j.
3.3 Monte-Carlo Simulation of the Flood Dynamic ModelThe proposed Markov chain model is integrated in a DES model in the following way:at each time slot, transition probabilities of the Markov models are activated. Depend-ing on the result, the states of the areas are updated, resulting in the triggering of newmanagement rules in the patient flow model described in the next Section.
4 HEALTH CARE PROCESS AND HOSPITAL MAN-AGEMENT
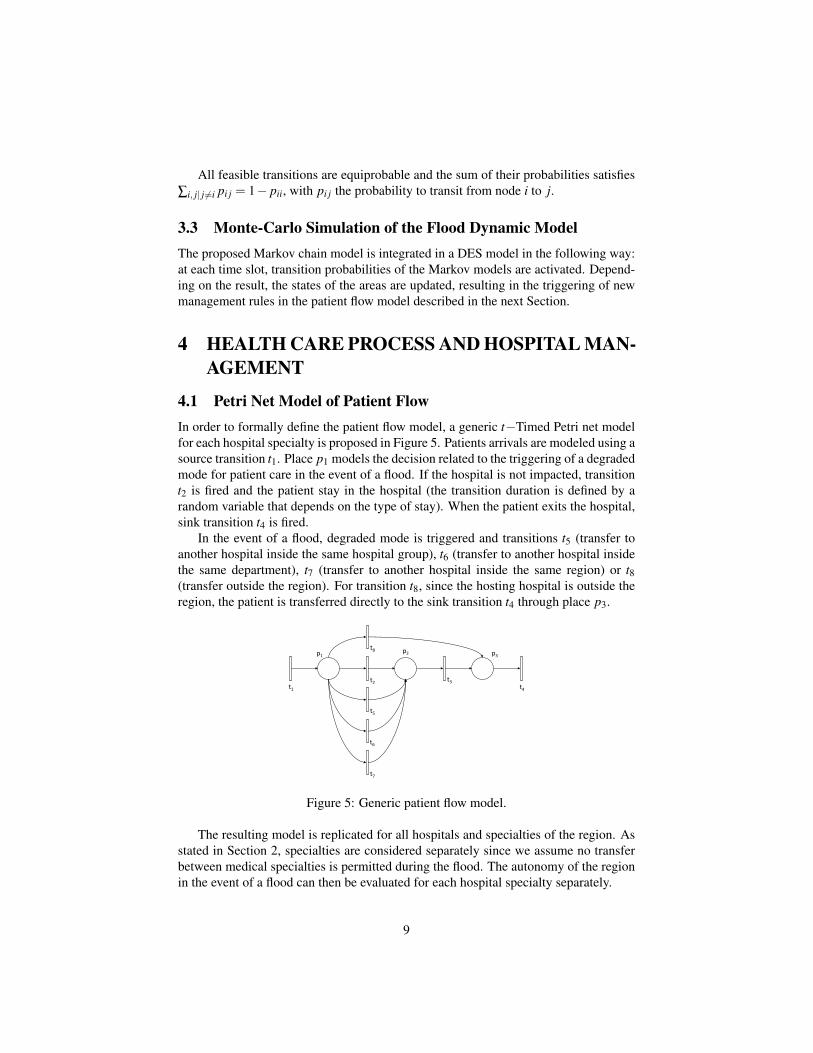
4.1 Petri Net Model of Patient FlowIn order to formally define the patient flow model, a generic t−Timed Petri net modelfor each hospital specialty is proposed in Figure 5. Patients arrivals are modeled using asource transition t1. Place p1 models the decision related to the triggering of a degradedmode for patient care in the event of a flood. If the hospital is not impacted, transitiont2 is fired and the patient stay in the hospital (the transition duration is defined by arandom variable that depends on the type of stay). When the patient exits the hospital,sink transition t4 is fired.
In the event of a flood, degraded mode is triggered and transitions t5 (transfer toanother hospital inside the same hospital group), t6 (transfer to another hospital insidethe same department), t7 (transfer to another hospital inside the same region) or t8(transfer outside the region). For transition t8, since the hosting hospital is outside theregion, the patient is transferred directly to the sink transition t4 through place p3.
t1t2 t3
t4
t5
t6
t7
p1p2 p3
t8
Figure 5: Generic patient flow model.
The resulting model is replicated for all hospitals and specialties of the region. Asstated in Section 2, specialties are considered separately since we assume no transferbetween medical specialties is permitted during the flood. The autonomy of the regionin the event of a flood can then be evaluated for each hospital specialty separately.
9
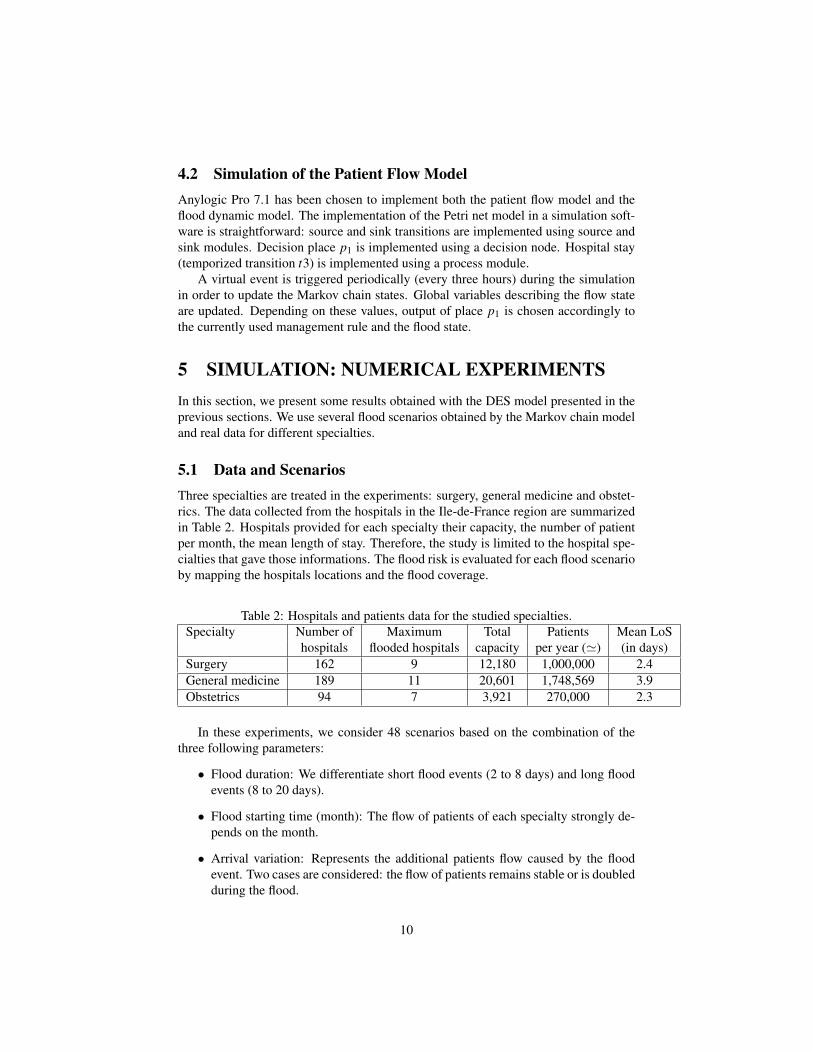
4.2 Simulation of the Patient Flow ModelAnylogic Pro 7.1 has been chosen to implement both the patient flow model and theflood dynamic model. The implementation of the Petri net model in a simulation soft-ware is straightforward: source and sink transitions are implemented using source andsink modules. Decision place p1 is implemented using a decision node. Hospital stay(temporized transition t3) is implemented using a process module.
A virtual event is triggered periodically (every three hours) during the simulationin order to update the Markov chain states. Global variables describing the flow stateare updated. Depending on these values, output of place p1 is chosen accordingly tothe currently used management rule and the flood state.
5 SIMULATION: NUMERICAL EXPERIMENTSIn this section, we present some results obtained with the DES model presented in theprevious sections. We use several flood scenarios obtained by the Markov chain modeland real data for different specialties.
5.1 Data and ScenariosThree specialties are treated in the experiments: surgery, general medicine and obstet-rics. The data collected from the hospitals in the Ile-de-France region are summarizedin Table 2. Hospitals provided for each specialty their capacity, the number of patientper month, the mean length of stay. Therefore, the study is limited to the hospital spe-cialties that gave those informations. The flood risk is evaluated for each flood scenarioby mapping the hospitals locations and the flood coverage.
Table 2: Hospitals and patients data for the studied specialties.Specialty Number of Maximum Total Patients Mean LoS
hospitals flooded hospitals capacity per year (') (in days)Surgery 162 9 12,180 1,000,000 2.4General medicine 189 11 20,601 1,748,569 3.9Obstetrics 94 7 3,921 270,000 2.3
In these experiments, we consider 48 scenarios based on the combination of thethree following parameters:
• Flood duration: We differentiate short flood events (2 to 8 days) and long floodevents (8 to 20 days).
• Flood starting time (month): The flow of patients of each specialty strongly de-pends on the month.
• Arrival variation: Represents the additional patients flow caused by the floodevent. Two cases are considered: the flow of patients remains stable or is doubledduring the flood.
10

5.2 Performance Indicators and ResultsAs introduced above, the ARS coordinates the evacuation operations and the patientstransportation over the region during a disaster. Therefore we choose a set of KPIthat quantify the impact of each scenario and identify the decision makers involved(hospital groups, departments or the entire region).
Following the sequence of evacuation and transfers, Table 3 defines the list of indi-cators measured in this experiment.
Table 3: Key performance indicators.Evac Mean number of evacueesTHG Mean number of patients transferred to a hospital in the same groupTdep Mean number of patients transferred to a hospital in the same departmentTreg Mean number of patients transferred to a hospital within the regionAuto Binary indicator that equals 1 if the region remains autonomous, 0 otherwise
We ran 100 replications per scenario. Depending on the specialty, the computingtime of one replication is between 5 and 15 seconds. Results are split into three sec-tions: the regional autonomy, the arrival variations due to the flood and the month ofthe flood start.
5.2.1 Regional Autonomy
For all simulated scenarios, Treg = 0 and Auto = 1 . This means that for the considereddata, the departments are able to absorb the effects of the flood (receive the evacueesand cover the emergencies). This also implies that the set of decisions regarding theemergency operations must be coordinated within the departments (for example, thereallocation of ambulances).
5.2.2 Arrival Variation
Arrival variation has little to no impact in this experiment (Figure 6). This may beexplained by the ability to absorb within each department (at most) the increased floweven when the flow of patients doubles during the flood.For the rest of the results willbe presented only for variation×2 for a better readability.
5.2.3 Month Impact
In Figures 7, 8 and 9, the values obtained for the performance indicators Evac, THGand Treg are given for each specialty, month and flood duration (short and long), re-spectively. The number of patients per month in normal conditions is also given foreach specialty.
As expected the number of evacuees and transferred patients increases with thelength of the flood event. For short flood events, all the areas may not be floodeddepending on the random draw of transitions. Additionally, the gap between short andlong event flood impact vary for each specialty based on hospitals location.
11
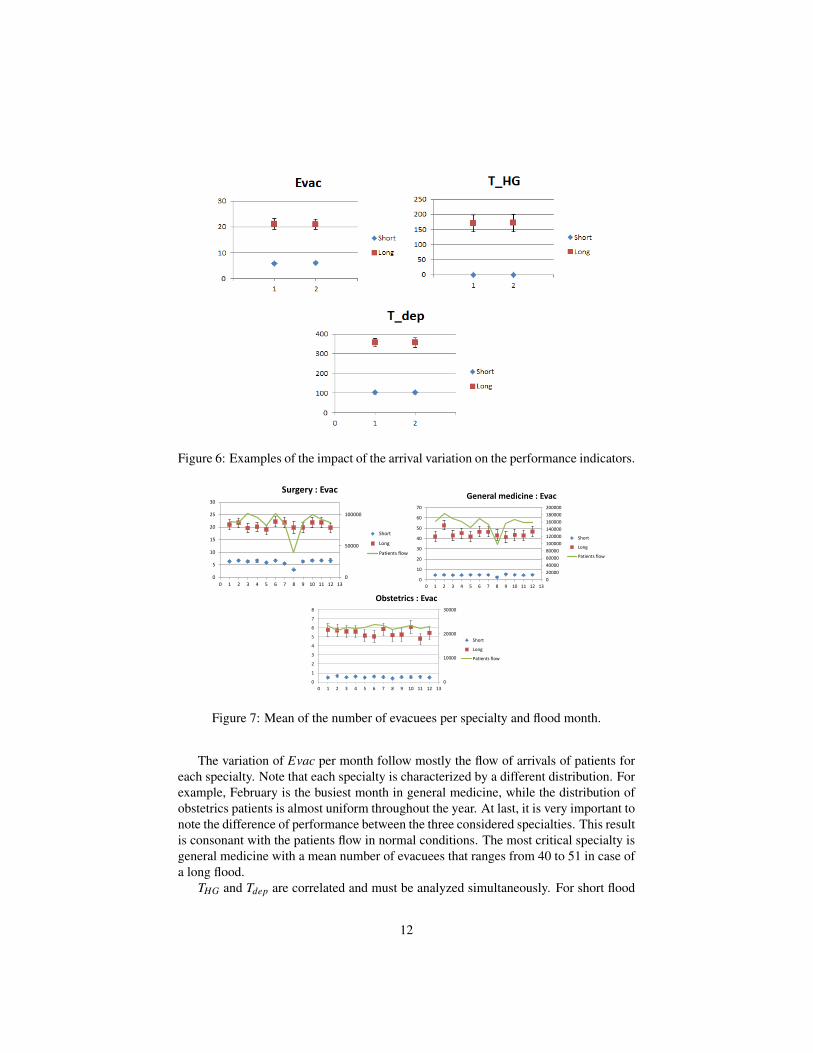
Figure 6: Examples of the impact of the arrival variation on the performance indicators.
0
50000
100000
0
5
10
15
20
25
30
0 1 2 3 4 5 6 7 8 9 10 11 12 13
Surgery : Evac
Short
Long
Patients flow
0
20000
40000
60000
80000
100000
120000
140000
160000
180000
200000
0
10
20
30
40
50
60
70
0 1 2 3 4 5 6 7 8 9 10 11 12 13
General medicine : Evac
Short
Long
Patients flow
0
10000
20000
30000
0
1
2
3
4
5
6
7
8
0 1 2 3 4 5 6 7 8 9 10 11 12 13
Obstetrics : Evac
Short
Long
Patients flow
Figure 7: Mean of the number of evacuees per specialty and flood month.
The variation of Evac per month follow mostly the flow of arrivals of patients foreach specialty. Note that each specialty is characterized by a different distribution. Forexample, February is the busiest month in general medicine, while the distribution ofobstetrics patients is almost uniform throughout the year. At last, it is very important tonote the difference of performance between the three considered specialties. This resultis consonant with the patients flow in normal conditions. The most critical specialty isgeneral medicine with a mean number of evacuees that ranges from 40 to 51 in case ofa long flood.
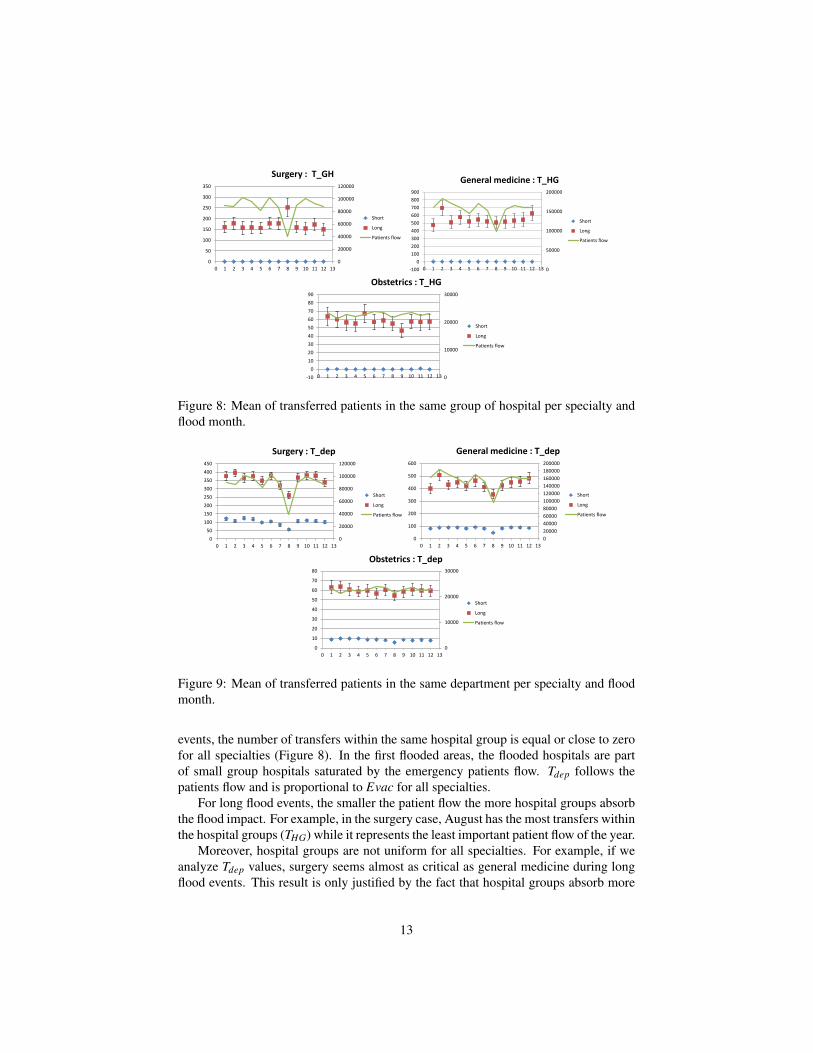
THG and Tdep are correlated and must be analyzed simultaneously. For short flood
12
0
20000
40000
60000
80000
100000
120000
0
50
100
150
200
250
300
350
0 1 2 3 4 5 6 7 8 9 10 11 12 13
Surgery : T_GH
Short
Long
Patients flow
0
50000
100000
150000
200000
-100
0
100
200
300
400
500
600
700
800
900
0 1 2 3 4 5 6 7 8 9 10 11 12 13
General medicine : T_HG
Short
Long
Patients flow
0
10000
20000
30000
-10
0
10
20
30
40
50
60
70
80
90
0 1 2 3 4 5 6 7 8 9 10 11 12 13
Obstetrics : T_HG
Short
Long
Patients flow
Figure 8: Mean of transferred patients in the same group of hospital per specialty andflood month.
0
20000
40000
60000
80000
100000
120000
0
50
100
150
200
250
300
350
400
450
0 1 2 3 4 5 6 7 8 9 10 11 12 13
Surgery : T_dep
Short
Long
Patients flow
0
20000
40000
60000
80000
100000
120000
140000
160000
180000
200000
0
100
200
300
400
500
600
0 1 2 3 4 5 6 7 8 9 10 11 12 13
General medicine : T_dep
Short
Long
Patients flow
0
10000
20000
30000
0
10
20
30
40
50
60
70
80
0 1 2 3 4 5 6 7 8 9 10 11 12 13
Obstetrics : T_dep
Short
Long
Patients flow
Figure 9: Mean of transferred patients in the same department per specialty and floodmonth.
events, the number of transfers within the same hospital group is equal or close to zerofor all specialties (Figure 8). In the first flooded areas, the flooded hospitals are partof small group hospitals saturated by the emergency patients flow. Tdep follows thepatients flow and is proportional to Evac for all specialties.
For long flood events, the smaller the patient flow the more hospital groups absorbthe flood impact. For example, in the surgery case, August has the most transfers withinthe hospital groups (THG) while it represents the least important patient flow of the year.
Moreover, hospital groups are not uniform for all specialties. For example, if weanalyze Tdep values, surgery seems almost as critical as general medicine during longflood events. This result is only justified by the fact that hospital groups absorb more
13
than half of the transfers in general medicine.
6 CONCLUSION AND FUTURE WORKWe presented in this paper the work carried out with the Regional Health Agency,which aims to evaluate health care emergency plan and assess the regional resiliencein case of major flood. We developed a discrete event simulation model that combinesa health care process with a flood model using Markov chain. The results obtainedon real data allow us to validate the model and estimate the impact of several floodscenarios on each specialty. The measured key performance indicators also identifythe decisions makers involved for each scenario (the hospital groups, counties or thestate).
In future work, additional information about patients will be added to model in or-der to take into account some specific needs. For example, three categories of maternityservices exist in France and patients of type 3 maternity may only be transferred to thesame type. Moreover, our model considers currently transfers and evacuation depend-ing only on the hospitals capacity. However, a critical part in emergency managementis patients transportation. An optimization model will be added to the simulation model(integrated or sequential) in order to plan the evacuation and transfer operations withrespect to vehicles fleet capacity and routing constraints.
References[AG06] Nezih Altay and Walter G. Green. OR/MS Research in Disaster Op-
erations Management. European Journal of Operational Research,175(1):475–493, November 2006.
[Agc13] Esra Agca. Optimization-Based Logistics Planning and PerformanceMeasurement for Hospital Evacuation and Emergency Management. PhDthesis, Virginia Tech, 2013.
[Ban93] Steve Bankes. Exploratory modeling for policy analysis. Operations Re-search, 41(3):435–449, 1993.
[CGR15] Wanying Chen, Alain Guinet, and Angel Ruiz. Modeling and Simulationof a Hospital Evacuation Before a Forecasted Flood. Operations Researchfor Health Care, 4:36–43, March 2015.
[HHM+05] Marna Hoard, Jack Homer, William Manley, Paul Furbee, ArshadulHaque, and James Helmkamp. Systems modeling in support of evidence-based disaster planning for rural areas. International Journal of Hygieneand Environmental Health, 208(1):117–125, April 2005.
[Hun16] Aoife Hunt. Simulating Hospital Evacuation. PhD thesis, University ofGreenwich, 2016.
14
[SC+13] Nikolaos Stilianakis, Sergio Consoli, et al. Operations research in disas-ter preparedness and response: the public health perspective. Technicalreport, JRC technical Reports, Report EUR 25763 EN, Publications officeof the european union publications office, Luxembourg., 2013.
[TIKN07] Akira Takahashi, Noboru Ishii, Takahisa Kawashima, and HiroyukiNakao. Assessment of Medical Response Capacity in the Time of Disas-ter: the Estimated Formula of Hospital Treatment Capacity, the MaximumReceivable Number of Patients in Hospital. The Kobe Journal of MedicalSciences, 53(5):189–98, January 2007.
[TJS06] K. Taaffe, M. Johnson, and D. Steinmann. Improving hospital evacuationplanning using simulation. In L. F. Perrone, F. P. Wieland, J. Liu, B. G.Lawson, D. M. Nicol, and R. M. Fujimoto, editors, Proceedings of theWinter Simulation Conference, pages 509–515, Piscataway, New Jersey,Dec 2006. Institute of Electrical and Electronics Engineers.
[TT06] Kevin M Taaffe and Esengul Tayfur. Evaluating the robustness of hospitalevacuation plans. In Proceedings of the IIE Annual Conference, pages 1–6, Norcross, GA, May 2006. Institute of Industrial and Systems Engineers.
[VDP16] John Voyer, Matthew D. Dean, and Christopher B. Pickles. Hospital evac-uation in disasters: Uncovering the systemic leverage using system dy-namics. International Journal of Emergency Management, 12(2):152–167, 2016.
[YGPL10] Pengfei Yi, Santhosh K. George, Jomon Aliyas Paul, and Li Lin. HospitalCapacity Planning for Disaster Emergency Management. Socio-EconomicPlanning Sciences, 44(3):151–160, September 2010.
AUTHOR BIOGRAPHIESAFAFE ZEHROUNI received her Ph.D. degree from the Ecole Nationale Superieuredes Mines de Saint-Etienne (EMSE), France, in 2016 in industrial engineering. Cur-rently, she occupies a postdoctoral position in the Center for Health Engineering and inthe IEOR team of CNRS UMR 6158 LIMOS, EMSE. Her research interests include op-erational research, modeling and simulation. Her email adress is [email protected] AUGUSTO received his Ph.D. in Industrial Engineering from Mines Saint-Etienne, France, in 2008 and the Habilitation Diriger des Recherches degree from theUniversity of Saint-Etienne, France, in 2016. He was a visiting scholar at CIRRELT(Centre Interuniversitaire de Recherche sur les Rseaux dEntreprise, la Logistique et leTransport), University of Laval, Quebec, Canada in 2009 and 2015. Currently, he isa professor of industrial engineering in the Department of Health care Engineering atMines Saint-Etienne. His research interests include modeling, simulation, optimizationof health care systems and their supply chains, process mining and machine learningapplied to health-care. His e-mail address is [email protected].
15
THIERRY GARAIX is an Assistant Professor of Healthcare Management at the Cen-ter for Health Engineering of the Ecole Nationale Superieure des Mines de Saint-Etienne (France), and member of the research laboratory LIMOS (Clermont-Ferrand,France), since 2011. He received his Ph.D. in Operations Research and Geomaticsfrom the Universit d’Avignon et des Pays de Vaucluse (France), in 2007. His researchinterests focus on the optimization of logistics and production systems, in particular,on vehicle routing and scheduling problems. Many of them are in the healthcare con-text like home healthcare and emergency department planning. He is the cofu He alsodeveloped two decision support systems for planning tyres production at Pirelli (Italy)and on demand transportation in Doubs Central (France). He is the co-founder of theresearch group on operations research applied to health care (ROSa) of the French na-tional research agency (CNRS). His research has been published in European Journalof Operational Research, Networks, Omega, Journal of Scheduling, Computers & Op-erations Research and Computers and Industrial Engineering. His e-mail address [email protected] PHAN received his Ph.D. degree from the Institut Suprieur d’Informatique,de Modlisation et de leurs Applications (ISIMA), France, in 2013 and his engineeringdegree, in 2010. Currently, he is a researcher-engineer in the Center for Health En-gineering and in the IEOR team of CNRS UMR 6158 LIMOS, EMSE. His fields ofinterest include Operational Research, Databases and Internet of Things. His e-mailand web addresses are [email protected] and http://limos.raksmey.fr/,respectively.XIAOLAN XIE received his Ph.D degree from the University of Nancy I, Nancy,France, in 1989, and the Habilitation a Diriger des Recherches degree from the Univer-sity of Metz, France, in 1995. Currently, he is a distinguished professor of industrialengineering, the head of the department of Healthcare Engineering of the Center forHealth Engineering and the head of IEOR team of CNRS UMR 6158 LIMOS, EcoleNationale Superieure des Mines (ENSMSE), Saint Etienne, France. He is also a chairprofessor and director of the Center for Healthcare Engineering at the Shanghai JiaoTong University, China. Before Joining ENSMSE, he was a Research Director at theInstitut National de Recherche en Informatique et en Automatique (INRIA) from 2002to 2005, a Full Professor at Ecole Nationale d’Ingenieurs de Metz from 1999 to 2002,and a Senior Research Scientist at INRIA from 1990 to 1999. His research interestsinclude design, planning and scheduling, supply chain optimization, and performanceevaluation, of healthcare and manufacturing systems. He is author/coauthor of over250 publications including over 90 journal articles and five books. He has rich indus-trial application experiences with European industries. He is PI for various national andinternational projects including ANR-TECSAN HOST on management of winter epi-demics, NSF China key project on planning and optimization of health care resources,French Labex IMOBS3 project on home health cares, FP6-IST6 IWARD on swarmrobots for health services. He has been an associate editor for IEEE Transactions onAutomation Science & Engineering, IEEE Transaction on Automatic Control, IEEETransactions on Robotics & Automation and International Journal of Production Re-search. He has been a Guest Editor of various special issues on healthcare engineeringand manufacturing systems. He is general chair of ORAHS’2007 and IPC chair ofthe IEEE Workshop on Health Care Management WHCM’2010. His email address is
16