Embed Size (px)
Citation preview

1
Health and Safety Statistics
2017
Data collected from 2010-2016
Spring

2
About Energy UK
Energy UK is the trade association for the UK energy industry representing over 90 suppliers and generators of electricity and gas for domestic and business consumers. Our members represent the truly diverse nature of the UK’s energy industry - from the UK’s largest energy firms to new, growing suppliers and generators, now making up over half of our membership.
Our members turn renewable energy sources, as well as nuclear, gas and coal, into electricity for over 27 million homes and every business in Britain. Over 680,000 people in every corner of the country rely on the sector for their jobs with many of our members providing lifelong employment as well as quality apprenticeships and training for those starting their careers.
Contents
About Energy UK 2
Chairman’s introduction 3
Glossary 4
Report caveat 5
Health and safety trends 6
Technology highlights 2016 10
Injury incident breakdown 12
Company highlights 2016 13
Notes 15
3
Chairman’s introduction
Welcome to Energy UK’s third annual Health and Safety performance benchmarking report.
Energy UK members aspire to deliver the highest standards of Health and Safety performance and are aligned in their approach to prevent injuries and workplace ill-health. Energy UK members are committed to sharing lessons learnt and use performance to drive continuous improvement. To achieve this, members have committed to drive forward Health and Safety management through the sharing and analysis of Health and Safety incidents provided by UK power station operators. By doing this an improved understanding has been developed of the operational performance levels of UK power stations.
This information is being used by Energy UK members to benchmark across the energy industry. The Health and Safety incident data collated throughout 2016 is presented in this report. We also take a look back over data from previous years (2010-2015) to make some comparisons.
Thank you for taking the time to read our report.
Doug SmartHealth and Safety Forum Chair
Health and Safety Statistics report 2017

4
Included definitions for benchmarking
Glossary
Health and Safety Statistics report 2017
1-7 day injury An injury at work which results in a person being away from work, or unable to do the full range of their normal duties for up to (and including) 7 consecutive days beyond the day of occurrence of the injury (including non-working days).
Greater than 7 day injury An injury at work results in the injured person being away from work, or unable to do the full range of their normal duties, for more than 7 consecutive days beyond the day of occurrence of the injury (including non-working days). These injuries must also be reported to the HSE contact centre.
LTIFR Lost Time Injury Frequency Rate – which is calculated by summing the fatalities and lost time injuries per 100,000 hours worked.
AIFR All Injury Frequency Rate – which is calculated by summing fatalities, lost time, medical treatment and first aid injuries per 100,000 hours worked.
Employee All staff directly controlled by the organisation including agency staff e.g. office temps for holiday cover
Contractor Outside parties contracted to perform work/service not directly controlled by the organisation e.g. Scaffold Service
Medical Treatment Any injury where treatment can only be administered by a trained medical professional such as a doctor, nurse or GP. If the treatment is only simple observation, or tests such as scans or x-rays which prove negative then the injury should be classified as a First Aid Injury. If there is any lost time then the incident should be classified as a Lost Time Injury. Application of stiches or glue to cuts are all classified as Medical Treatment Injuries. Where steri-strips or butterfly stitches are used in lieu of regular stitches then this is classified as a Medical Treatment Injury.
Fatality An injury sustained either a) at work which results in the death of an employee or a contractor’s employee within one year of the date of injury or b) by a third party arising from, or in connection with the business.
First aid injury Any injury where treatment could be administered by a First Aider or other person without medical training. This includes minor cuts and bruises, aches, strains or sprains, minor burns or scolds, etc. Application of steri-strips is a minor injury. If the injury results in lost time then please record it as a lost time injury. If no injury is suffered then please record the incident as a Near Hit.
Dangerous occurrence/ An incident, defined in Schedule 2 of the Reporting of Injuries, Diseases and Dangerous Occurrences Regulations 1995, which did not result in injury to any person but had the potential to do so.
Major injury (lost time) An injury as defined in Schedule 1 of the Reporting of Injuries, Diseases and Dangerous Occurrences Regulations 1995, where lost time has occurred.
Safety observation Unsafe / safe act or condition. Usually carried out by an observer and feedback given to the work party
High potential incident

5
This report is based on data received by Energy UK from its contributing members. It is used to manage health and safety through the sharing of analysis and statistics on health and safety recorded incidents throughout GB. The report presents key analysis on member health and safety incidents which can be used as a benchmark for individually reporting power stations, as well as providing a level on which to improve on in succeeding years.
The data has been provided by 68 power stations, an increase of 7 on the previous year. These reporting stations make available or record various levels and detail of data. For this reason, when collating the data across Energy UK’s contributing members, some data for particular metrics was unavailable for certain stations. To ensure the data reported is accurate when aggregating across reporting stations, Energy UK has omitted the power stations for the metric where data was not available. The number of power stations that the data was available for each metric has been listed as a footnote within the report.
Report caveat
Health and Safety Statistics report 2017
6
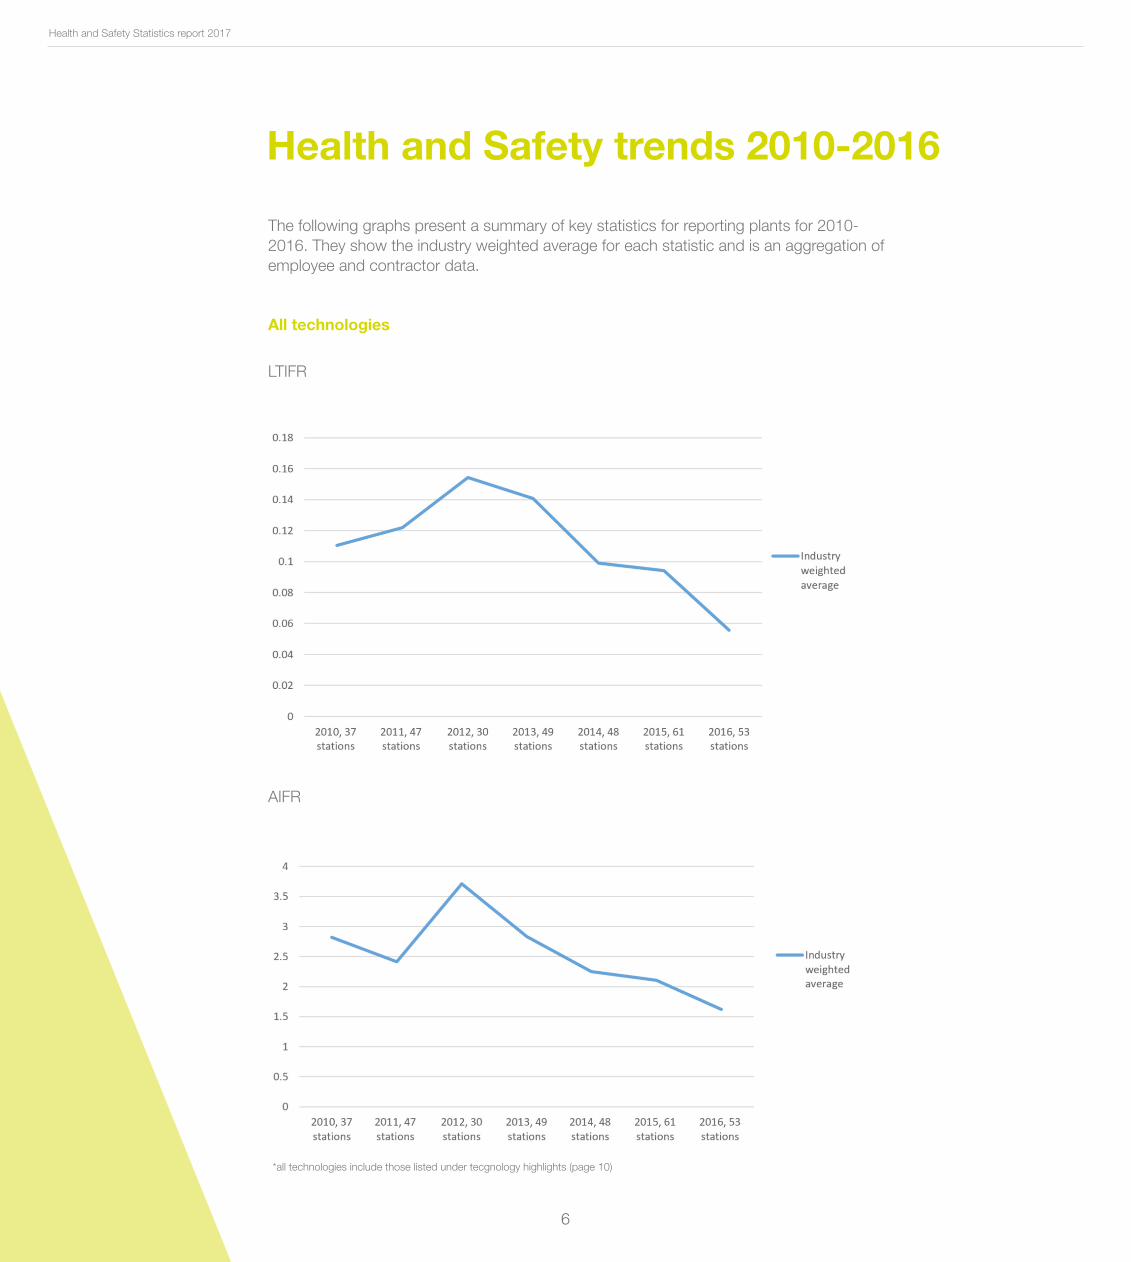
Health and Safety trends 2010-2016
The following graphs present a summary of key statistics for reporting plants for 2010-2016. They show the industry weighted average for each statistic and is an aggregation of employee and contractor data.
All technologies
LTIFR
AIFR
*all technologies include those listed under tecgnology highlights (page 10)
Health and Safety Statistics report 2017

7
Gas, Coal, Biomass
LTIFR AIFR
First aid injuries/100k hours worked Safety observations/ 100k hours worked
Health and Safety Statistics report 2017

8
Gas
LTIFR AIFR
First aid injuries/100k hours worked Safety observations/ 100k hours worked
Health and Safety Statistics report 2017

9
Coal and biomass
LTIFR AIFR
First aid injuries/100k hours worked Safety observations/ 100k hours worked
Health and Safety Statistics report 2017

10
Technology highlights 2016
Within the 2017 health and safety report, analysis has been extended to include all technologies in order to provide a more accurate representation of the reported incidents. The data represents 7 technologies: • Wind• Nuclear• Coal• Biomass
Compared to 2015 there was an overall decline in the rate of incidents (AIFR) for the reporting of all technologies. This continues the downward trend from the previous year.
In 2016 there were a total of 19 lost time injuries across employees and contractors, which resulted in an overall LTIFR of 0.056ii: a 41% fall on the previous year. In 2016 there were 21 more first aid injuries recorded compared to 2015, and 13,327 more safety observations were also recorded.
Section 6.1 provides some key summary statistics for 2016 by technologies, which have been aggregated to include both employees and contractors. Section 7 follows on from this but breaks the aggregated data down by company, where sufficient data was provided.
• Hydro• Gas• Oil
Reporting stations 68
Hours worked 35,621,465
Fatalities 0
Number of lost time incidents 19iv
Safety observations completed 111,463v
Dangerous occurrences 3,642vi
High potential incidents 129vii
First aid injuries 529viii
Health and Safety Statistics report 2017
Key aggegrated statisticsiii

11
Figure 1ix: First aid injury incidents by technology
Figure 2x: High potential incidents by technology
Health and Safety Statistics report 2017
Figure 1 values
Coal/Biomass 29%
Gas 14%
Hydro 4%
Oil* 0%
Other 5%
Nuclear 48%
Figure 2 values
Coal/Biomass 57%
Gas 26%
Hydro/Wind 9%
Nuclear 4%
Other 3%
*includes one first aid injury

12
Injury incident breakdown
In this edition of the health and safety report members were asked to provide further details on the nature of injuries reported. This is the first year this type of data has been collected so no trends have been reported.
The data reported back to Energy UK detailed 516 injuries for 2016 across employees and contractors. Graze and laceration injuries was the most reported injury type, making up 34% of the total number reported. The second most reported injury was bruising, making up 18% of the total number of reported injuries.
Bruising 91
Electric shock 15
Fractures 28
Graze or laceration 175
Internal injury 8
Burn 43
Sprains & strains 85
Superficial 17
Other* 53
Nature of injury
*injuries most common in this category were eye related incidents.
Employee breakdownUp until now, all data presented has been aggregated to include employee and contractor statistics. This section looks at employee data that was provided by reporting members only, and summarises key metrics.
Overall, there were 16xi reported lost time injuries in 2016 resulting in a lost time injury frequency rate of 0.099xii , which is a decline of 4% on 2015. This contributed to an overall fall of 29% in the rate of incidents (AIFR) being recorded on the previous year.
Health and Safety Statistics report 2017

13
The following graphs present a summary of key statistics, which includes aggregated data for employees and contractors, across reporting members.
Company highlights 2016
1 Drax
2 Centrica
3 AES
4 Corby Power
5 EDF Energy
6 ENGIE
7 Lynemouth
8 RWE
9 Scottish Power
10 SSE
11 Uniper
12 VPI Immingham
13 Siemens
14 National Grid
15 CLP Power Hong Kong
Key
Health and Safety Statistics report 2017
LTIFR AIFR

14
Major injuries/100K hours
First aid injuries/100K hours
High potential incidents/100K hours
Health and Safety Statistics report 2017

15
i Where the fuel source was not given the data has been listed under other
ii Statistic representative of 53 power stations
iii Data has been aggregated to include employees and contractors
iv Statistic representative of 53 power stations
v Statistic representative of 60 power stations
vi Statistic representative of 45 power stations
vii Statistic representative of 62 power stations
viii Statistic representative of 68 power stations
ix For those technologies where there were no high potential incidents recorded,they have been excluded from the figure
x IBID
xi Statistics representative of 68 power stations
xii Statistics representative of 69 power stations
Health and Safety Statistics report 2017
Notes