Embed Size (px)
Citation preview

UK Sea FisheriesStatistics 2020

2
About this publication The aim of this publication is to provide a comprehensive picture of UK Sea Fisheries in 2020, recent trends and long-term historical context, back to 1938 in some instances.
The publication is a summary of:
• The UK fishing fleet (Section 1) • Its activity at sea
o Landings – how much fish are caught and landed (Section 2) o Effort – how long is spent at sea (Section 3)
• Trade (Section 4)
This report contains charts and commentary to describe UK sea fisheries. View the accompanying tables for each section and underlying datasets here: https://www.gov.uk/government/statistics/uk-sea-fisheries-annual-statistics-report-2020.
Contents
Contents ........................................................................................................................... 2
Section 1: Fleet................................................................................................................. 4
Fleet characteristics ..................................................................................................... 4
Vessel length ............................................................................................................. 6
Age of vessels ........................................................................................................... 9
Industry group ......................................................................................................... 10
Fishers on UK vessels ................................................................................................ 10
Fishers by UK nation............................................................................................... 12
Section 2: Landings ....................................................................................................... 13
UK summary ............................................................................................................ 13
Vessel nationality .................................................................................................... 14
Vessel length ........................................................................................................... 15
Industry group ......................................................................................................... 17
Species group ......................................................................................................... 18
Landings by port ..................................................................................................... 31
Landings abroad by the UK fleet ............................................................................ 34
Landings into UK ports by foreign vessels ............................................................ 35
Area of capture ........................................................................................................ 36
Estimate of landings by Exclusive Economic Zone ............................................... 38
Fishing gear............................................................................................................. 43
Landings by quota and non-quota stocks .............................................................. 44

3
Section 3: Effort.............................................................................................................. 46
Over 10 metre fleet .................................................................................................. 46
Sole Recovery Zone ................................................................................................ 48
Section 4: Trade ............................................................................................................. 50
Imports and exports ................................................................................................ 50
GDP.......................................................................................................................... 56
Annex A: ICES data ........................................................................................................ 57
Annex B: Methodology................................................................................................... 59
Annex C: Revisions policy ............................................................................................. 63
Annex D: Associated publications................................................................................. 64
Annual Sea Fish Statistics ...................................................................................... 64
MMO National and Official Statistics publications ................................................. 64
Sea fisheries publications by other UK nations and international bodies ............ 64
Other Useful websites ............................................................................................. 65
Annex E: Further Information ........................................................................................ 66
National Statistics Designation............................................................................... 66
Pre-release access to statistics .............................................................................. 66
Contact .................................................................................................................... 66

4
Section 1: Fleet
View the tables accompanying this section here: https://www.gov.uk/government/statistics/uk-sea-fisheries-annual-statistics-report-2020.
Fleet characteristics
The number of UK fishing vessels has reduced by almost 50 per cent over the past three decades, from over 11 thousand vessels to below 6 thousand.
The power (kW) of the UK fleet has also decreased by 38 per cent over the past three decades1. Two key changes which have contributed to this are national and international policies introduced to ensure the future sustainability of fish stocks:
1. Greater controls on fishing opportunities,
2. Fleet capacity reductions through decommissioning exercises
Compared to 2019, the number of UK vessels has fallen by 128, a decrease of 2 per cent similar to the change between 2018 and 2019. All these vessels were under 10 metres (10m) in length. While vessels over 10m were decommissioned and registered in 2020, the total number of vessels over 10m remained the same as 2019.
1 Table 1.1
Capacity and power
As well as the total number of vessels, the fleet can also be assessed in terms of their capacity and power. Capacity is usually measured in gross tonnage (GT) which is a volumetric measure of a vessel capacity. The power (kW) of a vessel refers to the vessel’s engine power.
The MMO holds data on the capacity and power of all individual UK vessels and these figures are aggregated to compare groups of interest. This allows for a more nuanced assessment of the fleet, as opposed to looking at the number of vessels alone.

5
Figure 1.123: England contributes the highest number of vessels to the UK fleet, but Scotland’s fleet has more power and capacity
2 In this f igure and throughout the publication, Islands refers to the Crown Dependencies of Isle of Man, Jersey and Guernsey. 3 The f igures and values reported here are based on the country of administration for the vessel while the f igures in Tables 1.1 and 1.2 are based on the country associated with the district the vessel is administered by. Some Island vessels (based on country of administration) are assigned to England in the associated tables as the district of their admin port is Plymouth in England.

6
Scottish vessels account for 37 per cent of the total number of vessels in the UK while English vessels make up 45 per cent of the UK fleet. However, the Scottish fleet has the highest capacity (60 per cent) while the English fleet accounts for 29 per cent of the total f leet capacity.
Vessel length
Figure 1.2: The Northern Irish fleet has the highest proportion of vessels over 10m
The smaller number yet higher capacity of Scottish vessels compared with English vessels (Figure 1.1) can be explained by Scotland having a higher proportion of larger, more powerful vessels in comparison to the English fleet.
The fleet with the largest proportion of vessels over 10 metres in the UK is the Northern Irish fleet. The different length composition of the fleet can again be used to explain why the Northern Irish fleet has more capacity and power than the Welsh and island fleets despite having a similar number of vessels. In 2020, there were 39 vessels that could not be assigned to a country. These “Other” vessels are registered but not administered by a port; typically, new vessels and vessels changing administrations4.
4 Table 1.2
7
Owing to the diverse nature of the fishing industry, it is difficult to provide a simple explanation of the variation seen across the fleet. The main influencer is the different fish stocks that the fleets target. Key elements of the Scottish fleet target several f isheries that are high volume but lower priced, such as herring and mackerel caught in the North Sea and West of Scotland waters. To target these stocks, the Scottish fleet has moved towards having higher capacity vessels which cover large sea areas and can catch several hundred tonnes of f ish per trip.
Compared with this, the English fleet is involved in several key fisheries that are typically lower volume but higher priced, such as the Channel fisheries for sole and plaice. In addition, a greater proportion of the fisheries pursued by the English fleet cover inshore areas. Together these factors have allowed the English fleet to develop with a greater proportion of smaller vessels that are able to be economically viable through catching smaller quantities of more valuable fish. Changes in fishing opportunities over time have been key drivers for the development of the fleet.
Fish stock
A fish stock refers to a fish population that is isolated from other stocks of the same species. For example, around the UK there are several cod stocks – including e.g. Cod 7d in the Channel and North Sea Cod. Many fish stocks are managed by quotas – limits set on the tonnage that can be caught. Currently the UK has quota for around 100 different fish stocks.

8
Figure 1.3: Larger vessels contribute more to the UK fleet’s capacity than smaller vessels
Vessels under 10 metres make up 79 per cent of the UK fleet but only contribute 8 per cent to the fleet’s total capacity. Larger vessels of more than 24 metres make up 4 per cent of the total f leet by number but hold 65 per cent of the fleet’s capacity. This is because larger vessels have gear that can catch and transport larger quantities of f ish per trip and can journey for longer distances to better f ishing locations.
The Scottish fleet has larger vessels than the English fleet. The average length of a Scottish vessel is 11 metres while the average length of an English vessel is just under 9 metres. As a result of the different size composition of the two fleets, the Scottish fleet has twice the capacity than the English fleet despite the English fleet having 660 more vessels (24 per cent more).

9
Age of vessels
Figure 1.4: Vessels built in 2011 or later have a higher capacity than vessels built before 2011
While the number of vessels built in the last four decades has decreased, the total capacity and power of those built since 2011 has increased substantially. These modern vessels (built since 2011) contribute 33 per cent of the fleet’s capacity while only making up 11 per cent of the vessels in the UK fleet. Vessels built between 1981 and 1990 account for 27 per cent of the total number of vessels in the fleet but only 19 per cent of the fleet’s total capacity.

10
Industry group
On 1 January 2020, 780 vessels over 10 metres in length were members of a FPO, 63 per cent of all vessels over 10m. The remaining 455 vessels over 10m were not members of an FPO and were therefore members of the non-sector. The proportion of non-sector vessels (37%) has remained stable since 2018.
The composition of FPOs varies greatly; Scottish FPO had the highest membership with 152 vessels and Klondyke FPO had the smallest membership with 3 vessels. The average number of vessels in an FPO was 335.
Fishers on UK vessels
Figure 1.5: The number of fishers in the UK remains relatively stable over the last decade following a long period of steady decline
5 See Table 1.5. https://www.gov.uk/government/statistics/uk-sea-fisheries-annual-statistics-report-2020.
Fish Producer Organisations (FPOs)
FPOs are officially recognised bodies set up by fishery or aquaculture producers.
In the UK, they are responsible for managing the quota for their vessels and play an essential role in fisheries management.

11
Compared to 2019, the number of total UK fishers decreased by 6 per cent in 2020. This amounted to about 700 fewer jobs in the catching sector. The decrease is likely driven by the continuing Covid-19 pandemic which had a large impact on smaller vessels activity from March 2020 onwards. This impact of the pandemic is explored further in the landings section.
The number of f ishers in the United Kingdom has steadily declined by 45 per cent since 1994 and by three-quarters since 1938. The number of part time fishers in 2020 was about half as many as in 1994. Over the last decade, the number of f ishers has fluctuated around 12 thousand fishers but has remained relatively stable.
Figure 1.6: The average number of fishers per unit of capacity is over 10 times higher on vessels under 10m than on vessels over 24m6
The long-term decrease in the number of f ishers is associated with reductions in fleet size and the move to fewer larger vessels. Relative to their capacity, larger vessels do not require as many fishers as small vessels. Vessels under 10 metres have on average two fishers while vessels over 24 metres have nine fishers. As the UK fleet transitions to having few large ships rather than many small ships, there are fewer jobs in the catching sector.
Another reason for this decline is policies that limit f ishing activity to protect f ish stocks and the marine environment. National and international policies that limit f ishing activity can reduce the number of available fishing jobs while insuring the sustainability of the industry.
6This average was calculated using data on English and Welsh vessels and fishers only.

12
Fishers by UK nation
Figure 1.6: 85 per cent of fishers working on UK vessels are on English and Scottish vessels
Forty-three per cent of UK fishers work onboard English vessels and 42 per cent work on Scottish vessels. The rest (15 per cent) are almost evenly split between Welsh and Northern Irish vessels.
Welsh vessels have the highest proportion of part time workers (37 per cent). In England and Scotland only 17 and 21 per cent of their f ishers are part time respectively.
The Scottish fleet has a 52 per cent higher capacity that the English fleet but employs 86 fewer fishers. This demonstrates that fleets with a higher proportion of large ships require fewer fishers while having a higher capacity.

13
Section 2: Landings
View the tables accompanying this section here: https://www.gov.uk/government/statistics/uk-sea-fisheries-annual-statistics-report-2020.
UK summary
In 2020, UK vessels landed 623 thousand tonnes7 of sea fish into the UK and abroad with a value of £831 million8. Compared to 2019, this is a slight increase in the quantity of sea fish landed and a 16 per cent decrease in value landed.
Multiple factors impact fishing and landings tend to fluctuate considerably over time. In 2020, the biggest impact on sea fisheries was the ongoing Covid-19 pandemic where impacts were felt from March 2020 onwards. Like all parts of the UK economy, the pandemic had differential impacts on different sectors in the fishing industry. The high-level changes between 2019 and 2020 may not seem that severe but by drilling down into different parts of the industry, as we do in this chapter, we can see the varying impacts.
Species groups Fish are commonly split into three groups of similar species. Demersal f ish inhabit the bottom of the ocean. Key demersal species fished by the UK fleet include cod and haddock. Pelagic f ish inhabit the water column (not near the seabed or shore). The two main pelagic species fished by the UK fleet are mackerel and herring. Shellfish include various species of molluscs (e.g. scallops, whelks) and crustaceans (e.g. crabs and Nephrops).
The quantity of landings in 2020 remained similar to 2019 as landings of lower value pelagic species increased by 14 per cent compared to 2019. The value of landings decreased as landings of higher value shellf ish species decreased by 18 per cent.
7 In this section, tonnes always refer to live weight tonnes. This is the sum of the live weight of fish caught, prior to any processing e.g. gutting or shelling. 8 Table 2.1

14
Vessel nationality
Figure 2.1: Of the four UK nations, Scotland lands the most fish by quantity and value
At the country level, the landed weight of fish by each of the four nations remains stable over time. A notable exception is the 13 per cent decrease in landings by Scottish vessels between 2018 and 2019. This reduction is mainly driven by a reduction in landings of pelagic species, driven by smaller quotas for key pelagic species in 2019.

15
Vessel length
60 per cent of the total quantity of f ish caught by UK vessels in 2020 was landed by vessels over 24 metres in length. In 2020, these vessels constituted just 4 per cent of the UK fleet by number. The large volume of landings by these large vessels is explained by their very high fishing capacity and power (Figure 1.1).
Landings of pelagic species by vessels over 24 metres in length formed 96 per cent of the annual total pelagic landings for the whole UK fleet. 72 per cent of all landings of demersal species by the UK fleet were by vessels over 24 metres in length.
In contrast, landings of shellf ish are more evenly distributed across the fleet, with vessels 10 metres and under in length accounting for 24 per cent of the total quantity of landings.
Between 2019 and 2020, the quantity and value of landings by smaller vessels decreased by a larger amount when compared with the change for larger vessels. This is mainly driven by the different species targeted by the fleet segments; smaller vessels are more reliant on shellf ish species which were impacted the most by Covid-19. This is discussed further in the following section.
Table 2.2: Landings by UK vessels 10m and under and over 10m
Vessel length 2019 2020 Percentage
change
Quantity ('000 tonnes) 10m and under 41.3 35.1 -20%
Over 10m 580.6 588.2 0%
Value (£ million) 10m and under 132.6 99.6 -20%
Over 10m 854.2 731.3 -10%
16
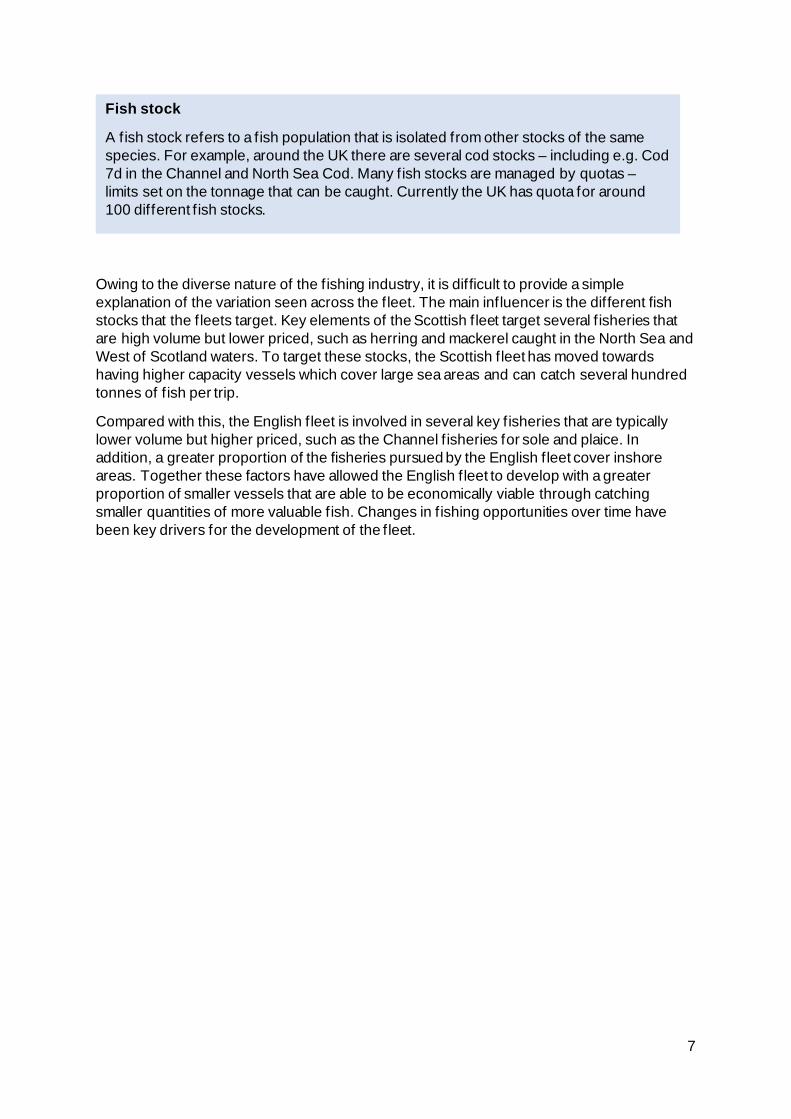
Figure 2.3: Vessels under 10 metres in length fetch higher prices for their landings

17
Overall, vessels under 10 meters fetch a higher price per tonne for their landings. This is especially true for demersal catches. Demersal landings by vessels under 10 meters fetch prices 63 per cent higher than vessels over 24 meters. Landings of demersal species by larger vessels tend to be frozen on board the vessel and sold in bulk, contributing to their lower price per tonne.
There is not as strong a relationship between vessel size and the average price per tonne for shellf ish catches. Shellf ish catches by vessels under 10 meters only fetch 22 per cent higher prices per tonne than catches by vessels over 24 meters.
Industry group9
Eight-eight per cent of the quantity of landings by the UK fleet in 2020 was landed by vessels in a Fish Producer Organisation (FPO)10. The largest FPO, Scottish FPO, accounted for almost 20 per cent of the quantity and value of f ish landed by the UK fleet.
There is clear specialisation among some producer organisations to species targeted. For example, vessels in North Atlantic FPO, Lunar Group and Interfish primarily target pelagic species. Other FPOs are segregated more by region. For example, Wales and West Coast FPO and South Western FPO.
Over a third of UK vessels over 10 metres in length were in the non-sector (vessels without producer organisation membership). These vessels typically have limited access to fishing quota11 and primarily target shellf ish species, which are mostly non-quota stocks. In 2020 they caught around a third of all shellf ish landed by the UK fleet. Vessels in the non-sector landed less than 1 per cent of the demersal and pelagic fish caught by the UK fleet.
Vessels 10 metres and under in length without producer organisation membership (the ‘10m and under pool’) also landed relatively small quantities of demersal and pelagic species. Four fifths of their catch are shellf ish. The fishing methods used by this sector and the different species targeted mean that they typically gain higher than average prices for their catch (Figure 2.3).
9 Table 2.9 10 Fish Producer Organisations (FPOs) are officially recognised bodies set up by fishery or aquaculture producers. 11 https://www.gov.uk/government/publications/fishing-quota-allocations-for-2021-for-england-and-the-uk

18
Species group
Figure 2.4: In 2020, pelagic species made up 57 per cent of the total quantity landed
Pelagic species make up over half the total landings into the UK in quantity despite bringing in less value than demersal landings (Figure 2.5). Shellf ish landings make up 19 per cent of the total quantity landed but account for only 20 million pounds less than pelagic landings.
In 2019, a higher proportion of landings by quantity were demersal (26%) and shellf ish landings (24%) than in 2020. In 2020 there were 44 thousand more tonnes of pelagic species landed than in 2019. The total quantity of landings remained relatively stable as can be seen in Figure 2.1, but this stability at a high-level masks the change in the proportion of the species landed. The increase in pelagic landings compensated for a decrease in demersal and shellf ish landings.

19
Figure 2.5: The value of shellfish and demersal landings dropped in 2020, while the value of pelagic landings increased
The value of pelagic landings between 2019 and 2020 increased by 14 per cent, in line with the 14 per cent increase in the quantity of landings. The increase in quantity and value landed is driven by an increase in quotas for key pelagic species. In particular, the UK’s West Coast mackerel (MAC/2CX14-) quota limit increased by 41 per cent (63 thousand tonnes)12 between 2019 and 2020.
The quantity of demersal landings decreased by 10 per cent while the value of those landings decreased by 17 per cent. Shellf ish landings decreased by 18 per cent while their value decreased by 33 per cent. The price per tonne13 fetched for shellfish species decreased considerably more than demersal and pelagic species, down 20 per cent compared to 8 per cent for both demersal and pelagic species.
The shellf ish sector was hit most severely because shellfish species tend to be landed and sold fresh for use in the hospitality sector in the UK and abroad. The demand for shellf ish from the hospitality sector dropped dramatically as lockdowns were imposed across the UK and EU. Although the demersal sector, and to a lesser extent the pelagic sector, were impacted by the pandemic, they were more resilient as key demersal and pelagic species are primarily for consumption in the home. Further, especially on larger vessels, demersal and pelagic species are landed and sold frozen so can weather market shocks better as businesses can wait before selling their catch.
12 https://eur-lex.europa.eu/legal-content/EN/TXT/?uri=CELEX:32020R0123 13 Table 2.16

20
Demersal
Figure 2.6: Landings and value of key demersal species decreased in 2020
Landings of demersal species were impacted throughout 2020 because of the ongoing pandemic. Larger vessels who land demersal species were impacted to a lesser extent with smaller demersal-targeting vessels being more affected by immediate price shocks at local markets as restrictions changed throughout the year. Smaller vessels are more dependent on a specific market and therefore the prices fetched there. They also have less access to storage and freezer facilities which enable larger vessels to wait until the demand is greater.

21
Landings of demersal species, particularly cod and haddock have fallen considerably since 1996. This follows the long-term declining trend reported since 193814. In 2020, landings of demersal f ish were around a fifth of the quantity landed between 1938 and 1970.
The decline in landings of demersal f ish has several causes, including reductions in fleet size, declining fish stocks and restricted fishing opportunities. National and international regulations have limited demersal f ishing activity in recent decades, through decommissioning of f ishing vessels, reductions in quotas and fishing effort limits and other provisions of stock management plans.
Figure 2.7: Landings of cod fluctuate across the year
14 Table 2.7 – note this table includes landings into the UK by UK and foreign vessels.

22
Landings of cod fluctuate more than haddock and anglerfish as the UK’s distant water fleet has targeted cod in e.g., Faroese waters. The distant water fleet are vessels that f ish outside their own territories and often into other countries exclusive economic zones and international waters. These large vessels can be out to sea for months and land huge volumes of f ish at a time. This explains the spikes in quantity landed every few months.
Sole, turbot and bass all command the highest price of demersal species landed by the UK fleet, all fetching over £8,000 per tonne in 202015. Although these species still fetch the highest prices, the prices have decreased since 2019 due to Covid-19 when all three species fetched over £10,000 a tonne. These high prices, particularly for sole and bass, are likely down to reduced supply following the introduction of the Sole Recovery Zone and restrictions placed on vessels fishing bass since 201516.
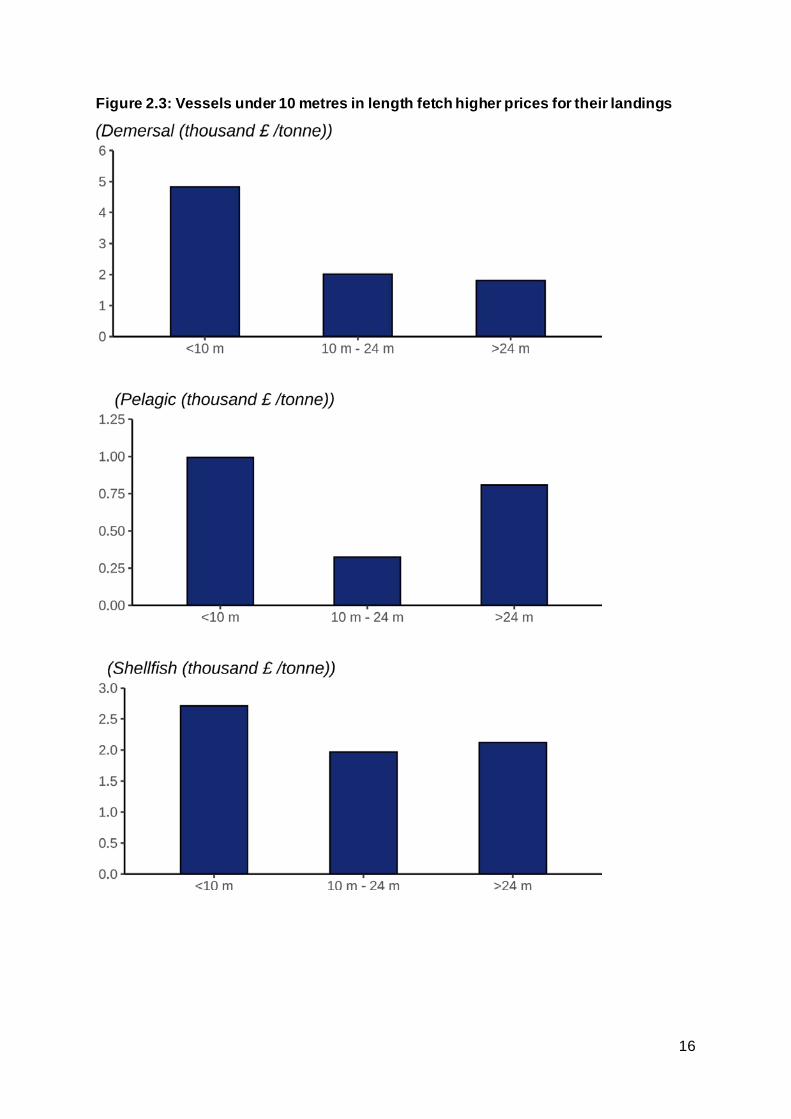
The following maps show landings of shellf ish species by the UK fleet in 2020 by ICES rectangle of capture. In 2020, the largest quantities and value of demersal species caught by the UK fleet were captured to the north-east of Scotland, in the central North Sea and in the English Channel. Demersal species with the highest average prices were captured by the UK fleet from waters to the south and west of the UK and Ireland, as well as the west coast of Scotland.
15 Table 2.16 16 https://www.gov.uk/government/publications/manage-your-fishing-effort-sole-recovery-zone/sole-recovery-zone-rules
ICES rectangle
The International Council for the Exploration of the Seas (ICES) standardise the division of sea areas for analysis. Each ICES statistical rectangle is 30 min latitude by 1-degree longitude, which is approximately 30 nautical miles by 30 nautical miles. Note that the area of ICES rectangles varies because the Earth is a sphere.
ICES rectangles are amalgamated to create ICES areas.
23
Figure 2.8: Landings of demersal species by the UK fleet in 2020 by ICES rectangle17

24
Pelagic
Figure 2.9: In 2020, the quantity and value of mackerel landed was 14 per cent higher than in 2019
The UK fleet catches more mackerel than any other species – over 200 thousand tonnes in 2020, a third of the total UK catch. Sixty per cent of mackerel landings by UK vessels are landed abroad.
17 The very high value per tonne records included here are landings of wrasse species, commonly referred to as “cleaner fish”. These are sold for their use in fish farms.

25
Most pelagic species are under stock management plans with quotas. Their annual landings therefore track quota limits. After two years of quota decreases, mackerel quotas increased between 2019 and 2020.
Landings of herring and blue whiting have not fluctuated as much as mackerel, as their quota limits have been more stable in the past five years.
Like most demersal species, most pelagic species are managed by quota limits. However, pelagic landings have not seen the same reduction as demersal species over the very long term. When compared to 1938, pelagic landings in 2020 were 50 per cent lower, while demersal landings were down 80 per cent.
Figure 2.10: Pelagic landings follow seasonal patterns
Mackerel is a winter fishery for larger vessels so large landings are seen annually in January, February and October and November. Quotas had almost been exhausted by the end of the year, so catches are consistently lower in December.

26
Ninety-eight per cent of all mackerel landings into the UK by the UK fleet in 2020 were in those four peak months. The sources of these two peaks are different: the January peak is derived almost entirely from landings captured off the West of Scotland, while the mackerel landings later in the year come from a fishery in the Northern North Sea. This North Sea fishery tends to attract higher prices.
A four-month period (June to September) accounts for three-quarters of herring landed into the UK by the UK fleet. Landings in June and July came primarily from the Northern North Sea and were supplemented in August and September by fisheries in the West of Scotland and the Irish Sea.
The following maps show landings of shellf ish species by the UK fleet in 2020 by ICES rectangle of capture. In 2020, the largest quantities and value of pelagic species caught by the UK fleet were captured from rectangles near Shetland and from the north coast of Scotland down to the north-west coast of Ireland. Price per tonne was more evenly spread across ICES rectangles, with the highest prices fetched closer to the coast.

27
Figure 2.11: Landings of pelagic species by the UK fleet in 2020 by ICES rectangle

28
Shellfish
Figure 2.12: Landings of key shellfish species decreased between 2020 and 2019
Nephrops (also known as langoustine or Norway lobster), crabs and scallops are the main shellf ish species landed by the UK fleet, accounting for sixty per cent of all shellf ish landings in 2020.
Landings of these three key species decreased between 2019 and 2020, the decrease in the value of Nephrops landings was the most severe at 44 per cent. As discussed at the start of this section the shellf ish sector has been hit the hardest by the ongoing pandemic.
Over the last eighty years, landings of demersal and pelagic landings have decreased substantially (discussed above). In contrast, landings of shellfish have increased by over 250 per cent, from 32 thousand tonnes to almost 121 thousand tonnes in 2020.

29
This is partly driven because, for shellfish species, quotas only apply to Nephrops. Further, the increase in shellf ish landings by the UK fleet is likely due to the industry diversifying into the shellf ish sector, where there are often fewer restrictions on fishing opportunities.
Another factor is improved reporting. A large proportion of shellfish landings are made by vessels 10 metres or under in length, for which there is no statutory obligation to complete a fishing logbook or landing declaration. Successive improvements in data collection for this sector in recent years, including the introduction of mandatory reporting of first sales of fish, may account for some of the increase in reported landings.
Figure 2.13: Landings of shellfish species decreased from March 2020 onwards, as the pandemic hit the UK
The following maps show landings of shellf ish species by the UK fleet in 2020 by ICES rectangle of capture. In 2020, both the largest quantity and value of shellf ish were captured in rectangles relatively close to the coast of the UK. However, shellf ish species with high prices were typically captured in rectangles away from coastal areas.

30
Figure 2.14: Landings of shellfish species by the UK fleet in 2020 by ICES rectangle

31
Landings by port
Figure 2.15: Peterhead is by far the largest UK port for landings
Peterhead continually tops the leader board for the largest port, with either Lerwick and Fraserburgh in second place. These ports are all in Northern Scotland. In England, Newlyn was the port with the highest quantity of landings while Brixham had the highest value of landings.
Seventy per cent of all landings by UK vessels into Scotland were into Peterhead and Lerwick. Contrastingly, landings into Newlyn and Brixham (the top 2 English ports) form only 28 per cent of landings into England, with the remaining landings more evenly spread around the English coast.
Landings into Peterhead and Lerwick have been affected less by Covid-19 when compared with other ports. This is because Peterhead and Lerwick specialise in pelagic species where landings are higher in 2020 than 2019.

32
Figure 2.16: Quantity of landings into the UK’s top 20 ports in 2020

33
Figure 2.17: Value of landings into the UK’s top 20 ports in 2020

34
Landings abroad by the UK fleet
Figure 2.18: Quantity of landings abroad by the UK fleet, 2020
In total in 2020, UK vessels landed 244 thousand tonnes of f ish abroad. This is 39 per cent of the total quantity of f ish landed by UK vessels and represents 28 per cent of the value of all f ish landed by UK vessels. The majority of landings abroad are pelagic fish species. Eighty-six per cent of landings abroad are pelagic species over half of which is mackerel. Pelagic species fetch a lower price than most demersal and shellf ish species which explains the 12-percentage point difference between the quantity and value landed abroad for pelagic species. Nearly half of all landings abroad are into Norway followed by a quarter of landings into ports in the Netherlands. A small number of the UK registered fishing fleet is in Dutch economic ownership; landings by these vessels contribute to the large quantities of f ish landed into the Netherlands.

35
Landings into UK ports by foreign vessels
Figure 2.19: Quantity of landings in UK ports by foreign vessels, 2020
In 2020, 38 thousand tonnes of fish were landed into the UK by foreign vessels, down 25 per cent on 2019. The average change in landings the previous three years was only 1 per cent. The decrease between 2019 and 2020 will likely be caused by reduced demand in the UK driven by the pandemic.
Almost two-thirds (24 thousand tonnes) of fish landed into the UK by foreign vessels are demersal. Most of the remainder is pelagic landings (13 thousand tonnes) and a small amount of shellf ish, less than 1 thousand tonnes.

36
Area of capture
Figure 2.20: Quantity of landings by area of capture and species group, 2020
37
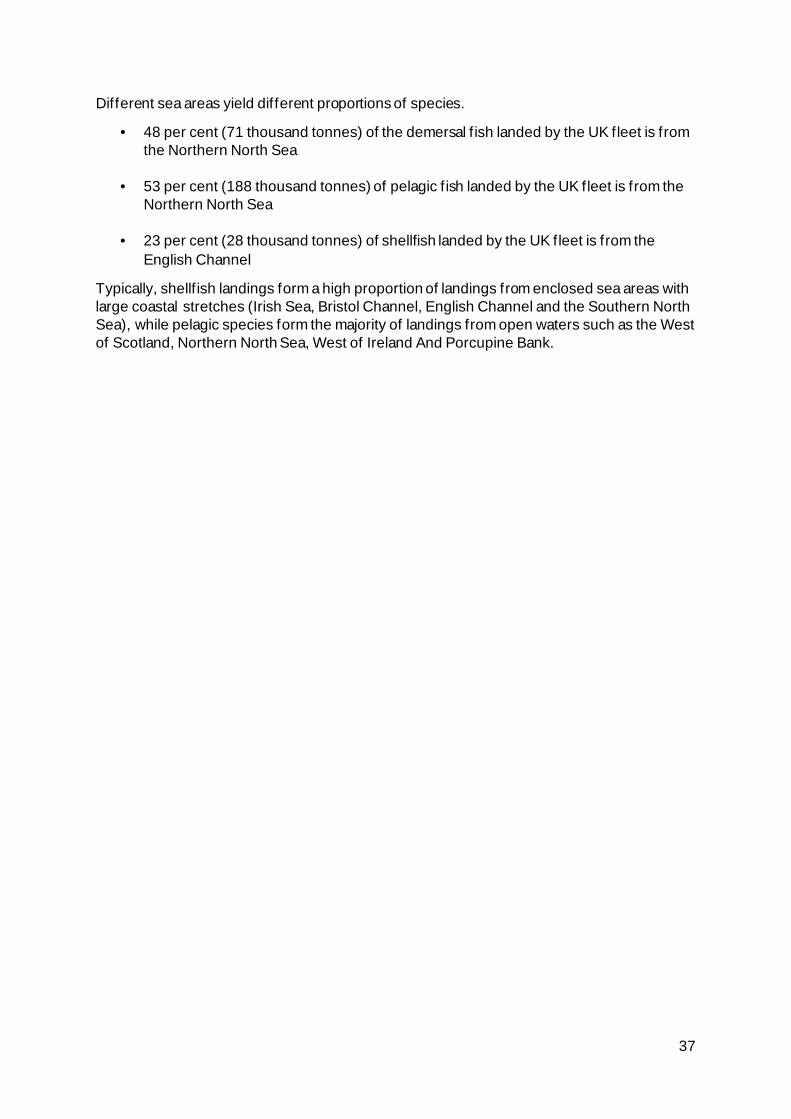
Different sea areas yield different proportions of species.
• 48 per cent (71 thousand tonnes) of the demersal f ish landed by the UK fleet is from the Northern North Sea
• 53 per cent (188 thousand tonnes) of pelagic fish landed by the UK fleet is from the Northern North Sea
• 23 per cent (28 thousand tonnes) of shellfish landed by the UK fleet is from the English Channel
Typically, shellf ish landings form a high proportion of landings from enclosed sea areas with large coastal stretches (Irish Sea, Bristol Channel, English Channel and the Southern North Sea), while pelagic species form the majority of landings from open waters such as the West of Scotland, Northern North Sea, West of Ireland And Porcupine Bank.

38
Estimate of landings by Exclusive Economic Zone
Exclusive Economic Zone The term Exclusive Economic Zone is taken to mean the entire zone under the exclusive jurisdiction of a coastal state or international organisation. This will include the territorial seas which spans 0-12 nautical miles from the coast as well as the UNCLOS Exclusive Economic Zone from 12 up to 200 nautical miles (or roughly 22 to 370 kilometres) from the coast. Where EEZs would overlap a median line is used to delineate the sovereignty of waters.
In contrast to the rest of the data in this Section, the figures presented here are estimates. The raw data used to produce Sections 2 and 3 of this publication are used to estimate landings of UK vessels split by Exclusive Economic Zone. Details of this method are in Annex B.
Because these statistics are an estimate, we calculate upper and lower bounds for our estimates, which are included in the following charts as error bars.
Interpreting upper and lower bounds To provide a view on certainty in our estimates we provide a range to show how much lower or higher the actual f igures could theoretically be compared to our spatial estimates. The lower bound only counts landings where we have absolute certainty the landings were made in that specific EEZ i.e. the ICES rectangle reported falls 100% within those waters or we have a specific zone of capture available. The upper bound includes all landings from ICES rectangles that are 100% within that EEZ and all landings from any ICES rectangle that borders that EEZ (even if only 1% of the surface area falls within that countries waters). The narrower the range between lower and upper, the more certainty we have in that f igure. Conversely a wide range suggests that a large amount of landings for that specif ic estimate required apportioning through our even spatial distribution assumption.

39
Figure 2.21: The UK’s Exclusive Economic Zone
40
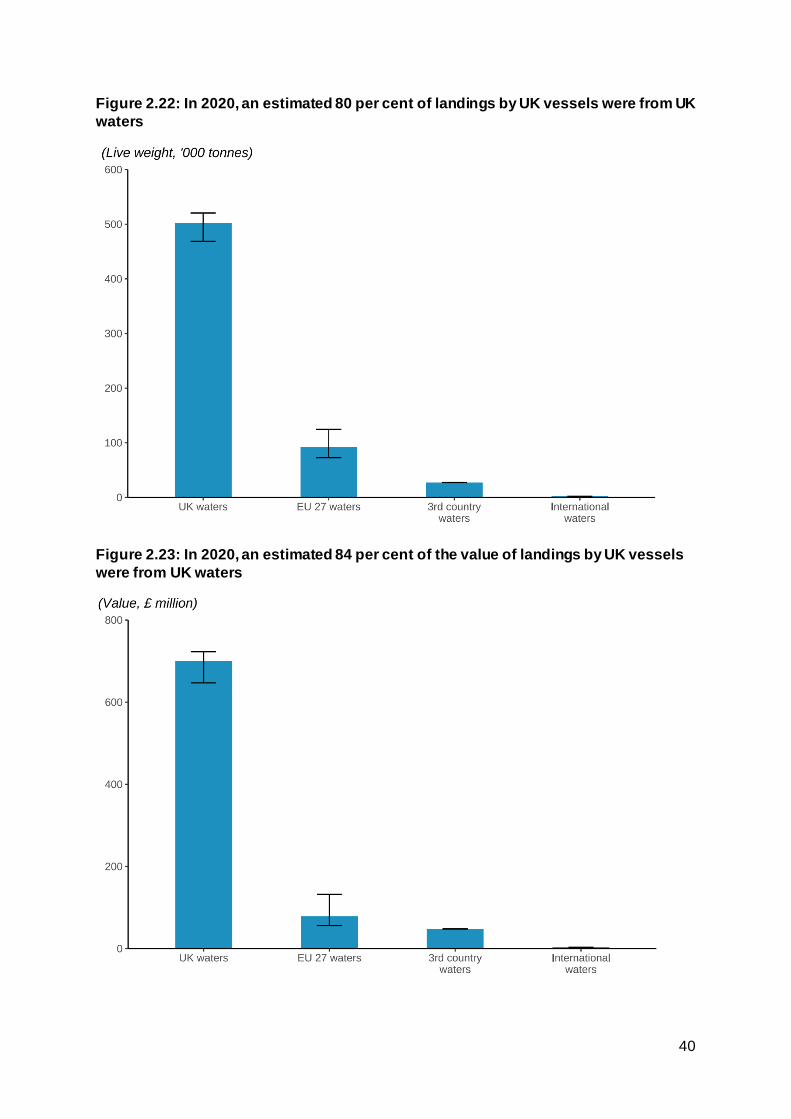
Figure 2.22: In 2020, an estimated 80 per cent of landings by UK vessels were from UK waters
Figure 2.23: In 2020, an estimated 84 per cent of the value of landings by UK vessels were from UK waters

41
Outside the UK’s waters the most important coastal state or bloc was EU-27 waters where UK vessels caught and landed 92 thousand tonnes of fish and shellf ish for a value of £79 million in 2020. This equates to 15 per cent by weight and 9 per cent by value of the UK fleet's landings.
The next most important coastal state or bloc is third country waters made up of waters of countries outside the UK and EU-27 member states (in this context primarily Norwegian and Svalbard waters). In 2020 UK vessels landed 27 thousand tonnes with value of £48 million. This accounted for 4 per cent by weight and 5 per cent by value UK landings. Lastly, landings from international waters accounted for 2.2 thousand tonnes with a first sale value of £3 million.
Figure 2.24: Estimated landings from UK waters and non-UK waters remained stable between 2019 and 2020
The trend in the change in the quantity of landings from UK and non-UK waters follows the same trajectory for all UK landings, with little change between 2019 and 2020. The sharper drop in landings from UK waters between 2018 and 2019 is driven by the decrease in pelagic landings due to reductions in quota limits.
The value of landings by UK vessels from UK waters decreased by 17 per cent between 2019 and 2020, following the pattern seen for all UK vessels in which the value of landings has decreased due to Covid-19.
42
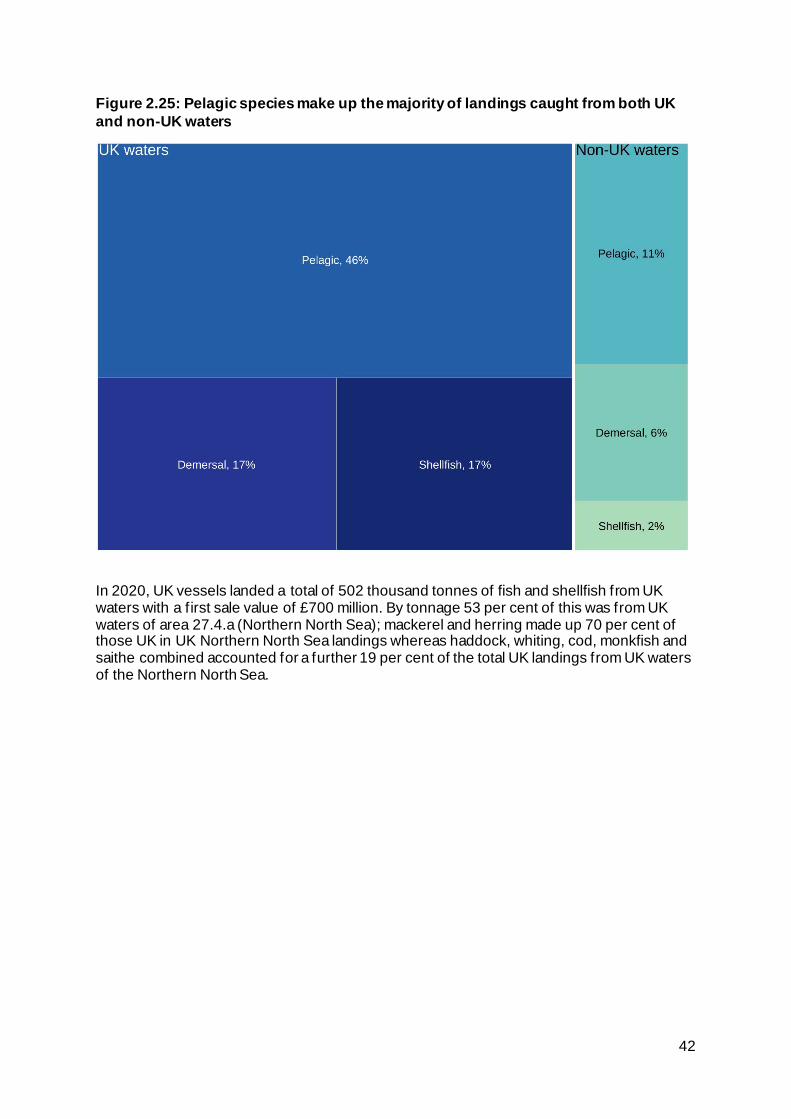
Figure 2.25: Pelagic species make up the majority of landings caught from both UK and non-UK waters
In 2020, UK vessels landed a total of 502 thousand tonnes of fish and shellfish from UK waters with a first sale value of £700 million. By tonnage 53 per cent of this was from UK waters of area 27.4.a (Northern North Sea); mackerel and herring made up 70 per cent of those UK in UK Northern North Sea landings whereas haddock, whiting, cod, monkfish and saithe combined accounted for a further 19 per cent of the total UK landings from UK waters of the Northern North Sea.

43
Fishing gear
Gear Different types of f ishing gear are used to catch different species of f ish. A single vessel can use several gears, or individual vessels may be more specialised. Gears can be grouped several ways. One grouping is active versus passive. Active gears follow the target fish while target fish come to passive gears which remain in one place. Active gears
• Beam trawlers target fish on the seabed by towing a net from either side of the boat.
• Demersal trawlers fish along or just above the seafloor to catch demersal f ish. A
funnel-shaped net is towed behind one or two boats.
• Dredges are rigid structures that are towed along the seabed by a boat. They are used to target shellf ish species such as scallops and oysters.
• Seine netting uses a net that is vertical in the water. Demersal seines target
bottom dwelling fish while pelagic seines target fish that inhabit the water column. Passive gears
• Drift and fixed nets usually target pelagic fish and hang in the water column. They are suspended from buoys or the seabed.
• Gears using hooks attract f ish by placing bait on a hook fixed to the end of e.g. a
line.
• Pots and traps are rigid structures into which fish, mainly shellf ish, are enticed through funnels that are hard to escape from.
Most (88 per cent in 2020) of fish landed by UK vessels is captured using active gears. Ninety-nine per cent of pelagic fish were caught using active gears and 92 per cent of demersal f ish18. Just over half of all shellf ish were caught using passive gears, mainly pots and traps.
The type of gear used can make a difference to the average price of fish. For demersal species, the average price of f ish captured using passive gears is higher than for active gears. Price differentials are also observed between different gears of the same class. For example, shellf ish caught using demersal trawls and seines are sold at a higher average price than dredges. This variation in prices partly reflects the different species caught by different gears. For example, demersal trawls and seines capture the majority of the nephrops landed by the UK fleet, while the bulk of the landings from dredges are scallops, which sell at a lower average price. However, there can also be a premium attached to the method by which the fish are captured. This is driven partly by consumer choice around the environmental impact of different gears.
18 Table 2.11

44
Landings by quota and non-quota stocks
Quota and non-quota stocks Landings of quota stocks are those fish which are managed via quota limits, i.e. there is an upper limit set on the amount of f ish that can be harvested from the sea. Non-quota stocks do not have an upper limit set on the quantity of f ish that can be caught but some are managed via different regimes, e.g. effort limits on days at sea. Non-quota species include almost all commercial shellf ish species, nephrops being the exception.
In 2020, landings of quota species make up 81 per cent of the total quantity of landings by the UK fleet and 72 per cent of the value.
Figure 2.26: Scottish vessels land 71 per cent of UK landings of quota species
45
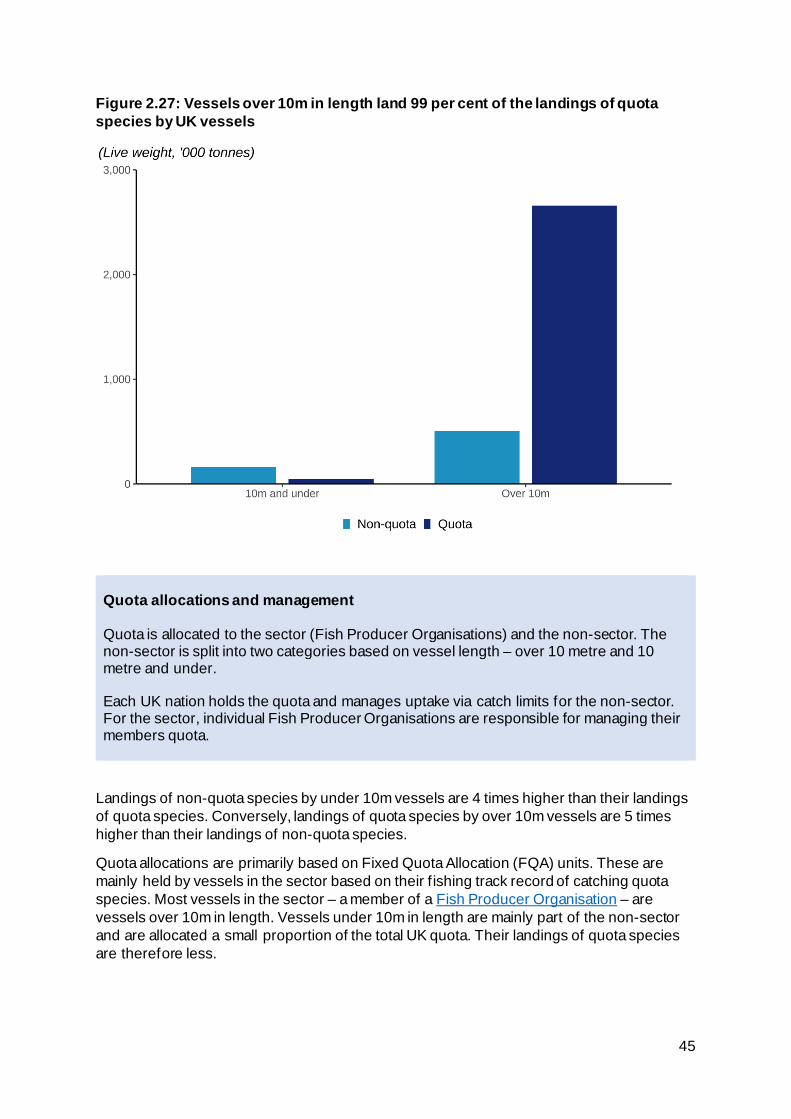
Figure 2.27: Vessels over 10m in length land 99 per cent of the landings of quota species by UK vessels
Quota allocations and management Quota is allocated to the sector (Fish Producer Organisations) and the non-sector. The non-sector is split into two categories based on vessel length – over 10 metre and 10 metre and under. Each UK nation holds the quota and manages uptake via catch limits for the non-sector. For the sector, individual Fish Producer Organisations are responsible for managing their members quota.
Landings of non-quota species by under 10m vessels are 4 times higher than their landings of quota species. Conversely, landings of quota species by over 10m vessels are 5 times higher than their landings of non-quota species.
Quota allocations are primarily based on Fixed Quota Allocation (FQA) units. These are mainly held by vessels in the sector based on their f ishing track record of catching quota species. Most vessels in the sector – a member of a Fish Producer Organisation – are vessels over 10m in length. Vessels under 10m in length are mainly part of the non-sector and are allocated a small proportion of the total UK quota. Their landings of quota species are therefore less.

46
Section 3: Effort
View the tables accompanying this section here: https://www.gov.uk/government/statistics/uk-sea-fisheries-annual-statistics-report-2020.
Western waters effort statistics are also updated monthly here: https://www.gov.uk/government/collections/effort-use-statistics19
Over 10 metre fleet
Effort Fishing effort captures the time vessels spend fishing. One measure of this is days at sea. Another measure is kW days at sea, which considers both the time vessels spend fishing and the power (kW) of the vessel’s engine. Effort restrictions are one of the ways fish stocks are managed. Limiting the number of days vessels can fish restricts their fishing opportunities.
19 These monthly statistics are provided to supervise control of fishing effort in Western Waters areas within British fisheries limits waters by UK vessels. The Western Waters regulations were originally derived from EU law and have been transposed into UK law. The statistics are made available on or after the 15th day of each month.
Western Waters
To prevent growth in fishing activity in the sea areas to the west of the UK, Ireland, Spain, Portugal and Morocco, an area (the ‘Western Waters’) was established from November 2003 in which fishing effort is limited.
Trips targeting edible crabs and spider crabs, demersal species and scallops are covered by the Western Water effort regime.

47
Figure 3.1: Since 2005, fishing effort20 by the over 10m fleet has decreased by 36 per cent
Figure 3.2: Most of the reduction in effort is driven by a decline in effort of the demersal trawl and seine segment
20 kW days at sea, table 3.2 kW days.

48
Effort by the demersal trawl and seine segment of the fleet fell by 37 per cent between 2005 and 2020, to 31 million kW days at sea. The beam trawl segment, which has relatively lower levels of effort (7 million kW days at sea in 2020) fell by 57 per cent over the same period.
This reduction in effort in the demersal trawl and seine segment was largely due to decommissioning exercises carried out by UK fisheries administrations between 2001 and 2003. The latter focussed on removing fleet capacity targeting cod in the Cod Recovery Zone (a combination of North Sea, West of Scotland and Irish Sea fishing areas) and was particularly focussed on vessels that used demersal trawls for whitefish. A further exercise was carried out to remove excess beam trawl fishing capacity in the Western Channel f ishing area as part of the recovery regime for sole. This removed eight vessels previously active in the area.
Sole Recovery Zone
Sole Recovery Zone (SRZ) As part of the measures for recovery of sole stocks, a Sole Recovery Zone was established from 2004 to apply effort controls to vessels of 10 metres or over, using certain gears (including beam trawls) in the Western Channel21. The Marine Management Organisation controls effort in the Western Channel by allocating days for f ishing with these gears to eligible vessels.
21 https://www.gov.uk/government/publications/manage-your-fishing-effort-sole-recovery-zone/sole-recovery-zone-rules

49
Figure 3.3: The number of vessels and effort of beam trawls in the SRZ has increased in the last decade
Since the implementation of the SRZ in 2004, the number of vessels beam trawling in the Sole Recovery Zone fell dramatically, as did effort, before stabilising. Reasons for this may include the effect of decommissioning schemes as well as reduced fishing opportunities owing to effort and quota controls. However, effort has increased considerably in recent years, approaching pre-2008 levels.

50
Section 4: Trade
View the tables accompanying this section here: https://www.gov.uk/government/statistics/uk-sea-fisheries-annual-statistics-report-2020.
Data on trade in collected by landed weight. This differs to the measure of quantity used in previous sections which is live weight. MMO landings data is reported in terms of live weight which is the weight of the live fish caught from the sea. Landed weight is sometimes smaller if f ish are processed (e.g. gutted or shelled) on board a ship prior to being landed.
Imports and exports
Figure 4.1: The UK’s trade gap in 2020 for sea fish was 249 thousand tonnes
The UK is a net importer of f ish. In 2020 the UK imported 672 thousand tonnes of fish22, with a value of £3,206 million. It exported 423 thousand tonnes. Compared to 2019, imports were down by 7 per cent, leading to narrowing of the crude trade gap which decreased by 8 per cent compared to 2019.
22 Excluding fish products
51
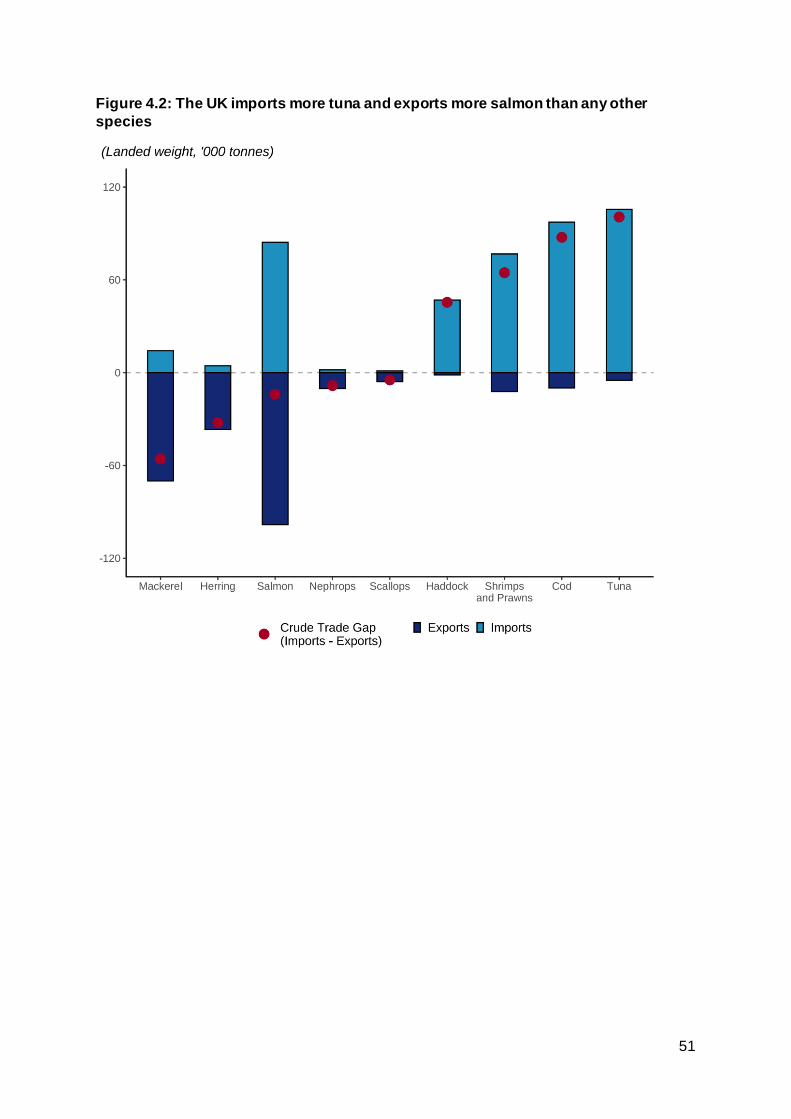
Figure 4.2: The UK imports more tuna and exports more salmon than any other species

52
Imports
Figure 4.323: The UK imported the most fish and fish products from China in 2020
Demersal and pelagic fish accounted for 85 per cent of f ish imports into the UK by weight. Shellf ish accounted for the remaining 15 per cent. In terms of value imported, shellfish made up a slightly higher percentage at 23 per cent, because of the higher price typically fetched by shellf ish species24.
The UK imported 149 thousand tonnes of f ish products25 in 2020, with most of which was fish meal (86 per cent). This brings the total imports (including sea fish, freshwater fish and fish products) to 821 thousand tonnes.
23 Imports into the UK of fish and fish products by top 5 exporting countries in 2020.
24 Table 2.12.
25 Fish products includes e.g. fish meal and oils.

53
Figure 4.426: The UK is a net importer of cod, importing 97 thousand tonnes in 2020
Figure 4.527: The UK is a net importer of tuna, importing 106 thousand tonnes in 2020
26 Imports to the UK of cod by top 5 exporting countries.
27 Imports to the UK of tuna by top 5 exporting countries.

54
Figure 4.628: The UK is a net importer of shrimps and prawns, importing 77 thousand tonnes in 2020
UK vessels landed only small amounts of shrimps and prawns into the UK, less than 3,000 tonnes in 2020. The vast majority available for domestic use are imported. In 2020, the largest exporters of shrimps and prawns to the UK were Vietnam (19 thousand tonnes) and India (12 thousand tonnes), imports from these two countries accounted for 41 per cent of the total imports of shrimps and prawns into the UK in 2020.
28 Imports to the UK of shrimps and prawns by top 5 exporting countries.

55
Exports
Figure 4.729: The UK exported the most fish and fish products to France in 2020
Demersal and pelagic fish accounted for 83 per cent of f ish exports out of the UK by weight with shellf ish accounting for 17 per cent. This is very similar to the split seen for imports. Shellf ish similarly make up a higher percentage of the exports by value owing to their higher price per tonne on average than other sea fish (28 per cent). The UK exported 36 thousand tonnes of f ish products in 2019, bringing the total exports (including sea fish, freshwater fish and fish products) to 460 thousand tonnes.
29 Exports from the UK of fish and fish products by top 5 importing countries in 2020.

56
Figure 4.830: The UK is a net exporter of mackerel, exporting 70 thousand tonnes in 2020
Mackerel exports rose by 12 per cent compared to 2019. This is consistent with the increase in landings of mackerel31, driven by higher quotas in 2020. The largest share of mackerel exports went to the Netherlands (26 thousand tonnes), some for Dutch consumption and some to be processed and exported again to countries in Africa.
GDP
The GDP for fishing in 2020 is £324 million, down 29 per cent on a year earlier. The GDP for fishing comprises 2.7 per cent of the total for agriculture, forestry and fishing. Compared to a decade ago, the GDP for fishing has decreased by 45 per cent, from £590 million in 2010.
30 Exports from the UK of Shrimps and Prawns by top 5 importing countries.
31 Table 2.2.
GDP
Gross Domestic Product (GDP) provides an economic snapshot for a country. Within countries, this is split into different sectors so you can see how much different industries contribute to the economy.
Within the UK GDP for fishing includes landings abroad by the UK fleet and the aquaculture sector. Fishing can then be grouped with the wider agriculture, forestry and fishing GDP total.

57
Annex A: ICES data
In collaboration with CEFAS, the MMO has previously published either a chapter or standalone report called Main stocks and their level of exploitation32 which summarised ICES data for 6 key species (spanning 13 stocks) of interest to the UK fleet.
ICES have improved their dissemination of scientific data and we now recommend users access this interactive data direct from ICES.
All stock assessment graphs can be accessed at the following link: https://www.ices.dk/data/assessment-tools/Pages/stock-assessment-graphs.aspx. Seafish provide a thorough guide of how to interpret ICES graphs. See pages 25-26 here: https://www.seafish.org/document/?id=23A69338-21D2-4617-ADF5-58099360DAEB.
Below we have provided a list of key stocks of interest to the UK fleet and their corresponding biological stock page on ICES. This is not an exhaustive list of stocks that the UK holds quota in.
Stock code Biological stock code Link
ANF/07. ank.27.78abd https://standardgraphs.ices.dk/ViewCharts.aspx?key=14295
ANF/07. mon.27.78abd https://standardgraphs.ices.dk/ViewCharts.aspx?key=16700
BOR/678- boc.27.6-8 https://standardgraphs.ices.dk/ViewCharts.aspx?key=15609
COD/07A. cod.27.7a https://standardgraphs.ices.dk/ViewCharts.aspx?key=14433
COD/07D. cod.27.47d20 https://standardgraphs.ices.dk/ViewCharts.aspx?key=14324
COD/2A3AX4 cod.27.47d20 https://standardgraphs.ices.dk/ViewCharts.aspx?key=14324
COD/7XAD34 cod.27.7.e–k https://standardgraphs.ices.dk/ViewCharts.aspx?key=15605
HAD/07A. had.27.7.a https://standardgraphs.ices.dk/ViewCharts.aspx?key=14557
HAD/2AC4. had.27.46a20 https://standardgraphs.ices.dk/ViewCharts.aspx?key=14386
HAD/5BC6A. had.27.46a20 https://standardgraphs.ices.dk/ViewCharts.aspx?key=14386
HAD/7X7A34 had.27.7.b–k https://standardgraphs.ices.dk/ViewCharts.aspx?key=14557
HER/07A/MM her.27.nirs https://standardgraphs.ices.dk/ViewCharts.aspx?key=14091
HER/4AB. her.27.3a47d https://standardgraphs.ices.dk/ViewCharts.aspx?key=14149
HER/4CXB7D her.27.3a47d https://standardgraphs.ices.dk/ViewCharts.aspx?key=14149
HER/7G-K. her.27.irls https://standardgraphs.ices.dk/ViewCharts.aspx?key=14087
HKE/2AC4-C hke.27.3a46‐8abd https://standardgraphs.ices.dk/ViewCharts.aspx?key=14566
HKE/571214 hke.27.3a46‐8abd https://standardgraphs.ices.dk/ViewCharts.aspx?key=14566
JAX/4BC7D hom.27.3a4bc7d https://standardgraphs.ices.dk/ViewCharts.aspx?key=14459
L/W/2AC4-C wit.27.3a47d https://standardgraphs.ices.dk/ViewCharts.aspx?key=14516
L/W/2AC4-C lem.27.3a47d https://standardgraphs.ices.dk/ViewCharts.aspx?key=14370
LEZ/07. meg.27.7b-k8abd https://standardgraphs.ices.dk/ViewCharts.aspx?key=16699
LIN/04-C. lin.27.3a4a6-91214 https://standardgraphs.ices.dk/ViewCharts.aspx?key=14347
LIN/6X14. lin.27.3a4a6-91214 https://standardgraphs.ices.dk/ViewCharts.aspx?key=14347
MAC/2A34. mac.27.nea https://standardgraphs.ices.dk/ViewCharts.aspx?key=14203
MAC/2CX14- mac.27.nea https://standardgraphs.ices.dk/ViewCharts.aspx?key=14203
NEP/07. nep.fu.14 https://standardgraphs.ices.dk/ViewCharts.aspx?key=14248
32https://assets.publishing.service.gov.uk/government/uploads/system/uploads/attachment_data/file/920035/2019_Main_stocks_and_their_level_of_exploitation.pdf.

58
Stock code Biological stock code Link
NEP/07. nep.fu.2021 https://standardgraphs.ices.dk/ViewCharts.aspx?key=14248
NEP/07. nep.fu.22 https://standardgraphs.ices.dk/ViewCharts.aspx?key=14248
NEP/2AC4-C nep.fu.5 https://standardgraphs.ices.dk/ViewCharts.aspx?key=15601
NEP/2AC4-C nep.fu.6 https://standardgraphs.ices.dk/ViewCharts.aspx?key=15601
PLE/07A. ple.27.7a https://standardgraphs.ices.dk/ViewCharts.aspx?key=14392
PLE/2A3AX4 ple.27.420 https://standardgraphs.ices.dk/ViewCharts.aspx?key=15614
PLE/7DE. ple.27.7d https://standardgraphs.ices.dk/ViewCharts.aspx?key=14598
PLE/7DE. ple.27.7e https://standardgraphs.ices.dk/ViewCharts.aspx?key=14426
PLE/7FG. ple.27.7fg https://standardgraphs.ices.dk/ViewCharts.aspx?key=15646
POL/07. pol.27.67 https://standardgraphs.ices.dk/ViewCharts.aspx?key=16701
POL/56-14 pol.27.67 https://standardgraphs.ices.dk/ViewCharts.aspx?key=16701
RJC/07D. rjc.27.3a47d https://standardgraphs.ices.dk/ViewCharts.aspx?key=15623
RJC/2AC4-C rjc.27.3a47d https://standardgraphs.ices.dk/ViewCharts.aspx?key=15623
RJC/67AKXD rjc.27.7afg https://standardgraphs.ices.dk/ViewCharts.aspx?key=15623
RJC/67AKXD rjc.27.7e https://standardgraphs.ices.dk/ViewCharts.aspx?key=15623
RJH/04-C. rjh.27.4c7d https://standardgraphs.ices.dk/ViewCharts.aspx?key=15623
RJH/07D. rjh.27.4c7d https://standardgraphs.ices.dk/ViewCharts.aspx?key=15623
SAN/234_1R san.sa.1r https://standardgraphs.ices.dk/ViewCharts.aspx?key=14067
SOL/07A. sol.27.7a https://standardgraphs.ices.dk/ViewCharts.aspx?key=14536
SOL/07D. sol.27.7d https://standardgraphs.ices.dk/ViewCharts.aspx?key=14317
SOL/07E. sol.27.7e https://standardgraphs.ices.dk/ViewCharts.aspx?key=14506
SOL/24-C. sol.27.4 https://standardgraphs.ices.dk/ViewCharts.aspx?key=14338
SOL/7FG. sol.27.7fg https://standardgraphs.ices.dk/ViewCharts.aspx?key=16761
SOL/7HJK. sol.27.7h-k https://standardgraphs.ices.dk/ViewCharts.aspx?key=14537
SPR/7DE. spr.27.7de https://standardgraphs.ices.dk/ViewCharts.aspx?key=14079
T/B/2AC4-C tur.27.4 https://standardgraphs.ices.dk/ViewCharts.aspx?key=14296
T/B/2AC4-C bll.27.3a47de https://standardgraphs.ices.dk/ViewCharts.aspx?key=15609
WHB/1X14 whb.27.1-91214 https://standardgraphs.ices.dk/ViewCharts.aspx?key=14401
WHG/07A. whg.27.7a https://standardgraphs.ices.dk/ViewCharts.aspx?key=14474
WHG/2AC4. whg.27.47d https://standardgraphs.ices.dk/ViewCharts.aspx?key=15613
WHG/7X7A-C whg.27.47d https://standardgraphs.ices.dk/ViewCharts.aspx?key=15613
WHG/7X7A-C whg.27.7b-ce-k https://standardgraphs.ices.dk/ViewCharts.aspx?key=14474

59
Annex B: Methodology
The methodology for data from 2000 and earlier included in this publication is described in earlier versions of the methodology: https://assets.publishing.service.gov.uk/government/uploads/system/uploads/attachment_data/file/920038/Methodology.pdf.
Fleet (Section 1)
Statistics on the UK fishing fleet in this publication are based on the fleet of fishing vessels as registered with the Register of Shipping and Seamen. To this is added details of f ishing vessels as registered with the Crown Dependencies (Isle of Man and the Channel Islands) to form the full UK fleet.
The UK fleet has been broken down for analysis by individual country based on the administration ports where vessels were licensed as at the end of year the report covers. Vessels which are registered but do not have an administration port at this time are not counted against any country,
Fish Producer Organisation membership (Section 1)
In the UK, FPOs (Fish Producer Organisations) are granted responsibility by Fisheries Administrations for the management of f ish quotas for vessels in their membership. Vessel owners notify UK Fisheries Administrations when transferring between FPOs for the purposes of quota management. A comprehensive database of membership of FPOs is maintained which augments the vessel data provided by the Register of Shipping and Seamen.
Employment data (Section 1)
Data on fishers’ numbers are collected separately by the Marine Management Organisation (MMO) for England, Marine Scotland, the Department of Agriculture, Environment and Rural Affairs for Northern Ireland (DAERA) and the Welsh Assembly Government (WAG). The Departments in Jersey, Guernsey and the Isle of Man do not contribute data on fishers’ numbers. In Scotland and Northern Ireland, staff in coastal offices are issued with a census of all vessels in their responsibility and asked to provide data on the number of part-time and regular fishers on each vessel. Marine Scotland and DAERA process and compile these data to provide estimates of f isher’s numbers on vessels at each port of administration.
In England and Wales, a census of f ishing vessels over 10 metres in overall length is performed. For the large number of f ishing vessels 10 metres and under in length, a stratif ied sample of vessels is taken, with strata defined by administration port, vessel length and gross tonnage. A 20 per cent sample is drawn from each stratum. As in Scotland and Northern Ireland, staff in coastal offices provide data on the number of part-time and regular fishers on each vessel in their administration based on enquiries and local knowledge.
For the purposes of the survey, a fisher is defined as a person working at sea on a commercial f ishing vessel, such as skippers or crew members. The definition excludes persons not working at sea, such as administrators and land-based processing staff. Fishers are classified as regular or part-time according to whether commercial f ishing is their main occupation.

60
Data collected for England and Wales are processed by the MMO. Checks are made on the quality and reliability of data returned and every effort is made to minimise non-response. Where no data were available on fishers’ numbers for a vessel the value was assumed to be the average number of f ishers on vessels in the same stratum, such that no bias was caused by non-response. Estimates from the survey for England and Wales are combined with those supplied by Marine Scotland and DAERA to provide overall UK estimates.
Activity and landings (Section 2 and 3)
The data in Sections 2 and 3 is administrative data which the UK is legally required to collect to enable management of the seas. The data collected via these means is used for the majority of MMO statistical products, not just this annual publication.
The data collection and processing for this administrative data is described here: https://www.gov.uk/guidance/fishing-activity-and-landings-data-collection-and-processing.
Amendments to the administrative data collected (Section 2)
Following quality assurance, MMO statistics make some amendments to the administrative data collected ahead of producing the datasets and tables for the Sea Fisheries Statistics publication.
Amendments were made this year to the 2020 value data. Firstly, where sales note mismatches were identif ied as causing gaps in landed value, the affected sales note’s value information were manually inputted into the final data sets by applying an average price per tonne derived from the mismatching sale notes to affected landings. This primarily affected ICES area 27.1 cod landed value. Further records were identified as missing value (primarily for mackerel, blue whiting, and horse mackerel landings). For these records a general annual average price per tonne was applied to the relevant live weight landings to produce estimated landed value. For example, mackerel landings were assigned value based on a price per tonne of £991 for 2020. For context on scale, this fix was applied to around 6,000 tonnes of mackerel landings in 2020 which equates to approximately 3 per cent of UK mackerel landings that year. All mussel landings with a zero landings value have been removed from the dataset used to create Section 2 and the underlying datasets. These landings were identified to be landings of mussel seed which, rather than being sold for human consumption at this point are re-laid for aquaculture. They are then harvested and sold at a later stage. As these landings are not sold at the point of initial dredging they have been removed and the data recalculated.
Estimated landings by EEZ (Section 2)
Most figures in Sections 2 and 3 are based on administrative data collected direct from vessels, with some amendments to improve the quality (described above). The exception is the section on estimated landings by EEZ.
At the time of publication, robust data on landings by EEZ for UK vessels is not available for 2020 and earlier. The MMO do hold robust data on catches by ICES rectangle. This rectangle data is used as the basis for estimating landings by EEZ.
An example to illustrate follows:
If an ICES rectangle is fully in UK waters, we can assume 100% of the catch assigned to that rectangle is from UK waters. However, EEZ lines intersect and cut across ICES rectangles so this assumption cannot be applied in all instances.
61
For example, in the English Channel, the ICES rectangles span both UK and French waters. Imagine the sea surface of an ICES rectangle falls in a way so that exactly 50 per cent of the ICES rectangle is in UK waters and 50 per cent is in French waters.
Based on the per cent of the sea surface that falls in each nation’s EEZ we can make an assumption that 50 per cent of the catch reported against that ICES rectangle was from French waters and 50 per cent was from UK waters. This same calculation can be done for all ICES rectangles and aggregated up to various groupings to estimate e.g., the percentage of landings by the UK fleet from UK waters compared to the percentage of landings from EU waters.
In reality, in the example of the English Channel described above, a vessel may have actually landed 100% of their catch on the UK side of the EEZ. Because of this, for each estimate we can calculate a confidence interval around the estimated value. Confidence intervals are presented in the charts in this section. When considering individual vessel landings, these estimates will have very wide confidence intervals. However, when we aggregate this data to the UK fleet level (for example), the confidence in our estimates is much higher.
The method described above relies on us knowing what fraction of the sea surface of an ICES rectangle falls in each nation’s EEZ. To obtain this information a spatial dataset containing the boundaries of all world EEZs was segmented by a spatial dataset containing the boundaries of the ICES rectangles. From this, the fraction of total sea surface area, excluding any land area, occupied by each national EEZ was calculated for each rectangle.
The underlying dataset titled UK_fleet_landings_by_rectangle_stock_and_estimated_EEZ_2016_2020 published alongside this report includes the estimated EEZ and region of capture based on the method described above. In this dataset there are a small number of unapportioned landings – i.e. landings which cannot be attributed to an EEZ or region. This is because these landings have an unknown ICES rectangle. They are included in the dataset for completeness but only make up 0.04 per cent of all landings.
Please refer to last year’s Economic Exclusive Zone analysis report33 for further details on the methodology and assumptions used for these figures.
Trade (Section 4)
HM Revenue & Customs (HMRC) is responsible for collecting the UK's international trade in goods data. The data are compiled from trade declarations made using commodity codes from the UN Tariff (HS Nomenclature) and its EU derivative the Intrastat Classification Nomenclature (ICN). These data are sent annually to the MMO, who process the data for this publication.
Landings of f ish into the UK by foreign vessels are typically included in import statistics; however, statistics on imports and landings by foreign registered vessels may not strictly be comparable. Arrivals of f ish should be reported where the economic owner of the vessel is outside the UK. In some cases, the countries of vessel registration and economic ownership may differ. A further complication is that import statistics do not include fish landed into the UK by foreign vessels which have a final destination outside the UK. Lastly, in some cases
33 UK commercial sea fisheries landings by Exclusive Economic Zone of capture report 2019 - GOV.UK (www.gov.uk)

62
there exists a value threshold for declaration of imports. For these reasons it is possible that imports of f ish may be below the quantity of landings reported for foreign registered vessels.
Exports include dispatches of fish by UK economically owned vessels when landing outside the UK. For similar reasons to those for imports, these are not directly comparable with landings by UK registered vessels abroad.

63
Annex C: Revisions policy
Where possible, the Marine Management Organisation produces revised figures each year to ensure that users have access to the latest data available. Revisions typically affect f ishing effort, catches and trade data, where data from logbooks, landing declarations, sales notes and trade declarations may occasionally be received or amended several months after the event. The magnitude of revisions to tables is typically larger for more recent years although the size of revisions is usually very small.
There are several causes of the revisions made in this publication:
1. Receipt of additional data. Despite strict data reporting requirements, some data are not received or entered at the time of publication. This typically affects data for more recent years.
2. Revisions to data sources. Corrections are made to database entries throughout the year where these are found to be incorrect. In addition, for landings data systematic corrections are made to implausible quantities and values prior to production of the publication to reduce the influence of outliers.
3. Rectification of data processing errors. Where data are found to have been
incorrectly processed for a previous publication, these errors are corrected as soon as possible.
Users should always refer to the latest f igures published by the Marine Management Organisation. Previous editions of all publications are made available online on the Marine Management Organisation website should users wish to examine the effect of revisions in further detail.
The Marine Management Organisation adheres to the Department for the Environment, Food and Rural Affairs’ policy on revisions and errors. Further information can be found in the Statement on Revisions and Errors at: https://www.gov.uk/government/publications/defra-policy-statement-on-revisions-andcorrections.

64
Annex D: Associated publications
Annual Sea Fish Statistics
All associated tables, underlying datasets and documents relating to this publication can be downloaded here:
https://www.gov.uk/government/statistics/uk-sea-fisheries-annual-statistics-report-2020
MMO National and Official Statistics publications
• Monthly UK sea fisheries statistics: https://www.gov.uk/government/collections/monthly-uk-sea-fisheries-statistics
• UK fishing vessel lists: https://www.gov.uk/government/collections/uk-vessel-lists
• Effort use statistics: https://www.gov.uk/government/collections/effort-use-statistics
• Quota use statistics: https://www.gov.uk/government/statistical-data-sets/quota-use-statistics
Sea fisheries publications by other UK nations and international bodies
• Scottish Sea Fisheries Statistics: https://www.gov.scot/collections/sea-fisheries-statistics/
• Department for Agriculture, Environment and Rural Affairs in Northern Ireland, fisheries policy and statistics: https://www.daera-ni.gov.uk/articles/animal-health-fisheries-food-and-forestry-statistics
• FAO Yearbook of Fishery and Aquaculture Statistics: http://www.fao.org/fishery/publications/yearbooks/en
• Eurostat Agriculture, Forestry and Fisheries Statistics: https://ec.europa.eu/eurostat/en/web/products-statistical-books/-/KS-FK-17-001

65
Other Useful websites
• Sea Fish Industry Authority: https://www.seafish.org/
• Maritime and Coastguard Agency: https://www.gov.uk/government/organisations/maritime-and-coastguard-agency
• Marine Accident Investigation Branch: https://www.gov.uk/government/publications/marine-accident-investigation-branch-current-investigations
• Centre for Environment, Fisheries and Aquaculture Science: https://www.gov.uk/government/organisations/centre-for-environment-fisheries-and-aquaculture-science
• International Council for the Exploration of the Sea (ICES): https://www.ices.dk/Pages/default.aspx
• FQA Register: https://www.fqaregister.service.gov.uk/

66
Annex E: Further Information
National Statistics Designation
National Statistics status means that our statistics meet the highest standards of trustworthiness, quality and public value, and it is our responsibility to maintain compliance with these standards.
The continued designation of these statistics as National Statistics was confirmed in February 2019 following a compliance check34 by the Office for Statistics Regulation. The statistics last underwent a full assessment against the Code of Practice for Official Statistics35 in 2014.
Pre-release access to statistics
Some ministers and officials receive access to these statistics up to 24 hours before release. Details of the arrangements for doing this and a list of the ministers and officials that receive pre-release access to these statistics can be found in the DEFRA statement of compliance36 with the Pre-Release Access to Official Statistics Order 2008.
Contact
• Statistics and Analysis Team, Marine Management Organisation
• Email: [email protected]
• Media enquiries: 0300 123 1032
34 https://osr.statisticsauthority.gov.uk/correspondence/compliance-check-of-uk-sea-fisheries-statistics/ 35 https://code.statisticsauthority.gov.uk/ 36 https://www.gov.uk/government/publications/defra-group-pre-release-access-to-official-statistics-compliance-statement