Embed Size (px)
Citation preview

Health and Environment Linked for Information Exchange (HELIX)-Atlanta: A CDC-NASA Joint Environmental Public Health Tracking Collaborative Project
Mohammad AlMohammad Al--HamdanHamdanBill Bill CrossonCrosson, Maury Estes, Ashutosh Limaye, Dale Quattrochi, Doug Rickman, C, Maury Estes, Ashutosh Limaye, Dale Quattrochi, Doug Rickman, Carol Wattsarol Watts
NASA/MSFC/NSSTCNASA/MSFC/NSSTC
Judy Judy QualtersQualters, Pamela Meyer, Pamela MeyerCenters for Disease Control and PreventionCenters for Disease Control and Prevention
Amanda Amanda NiskarNiskarIsrael Center for Disease ControlIsrael Center for Disease Control
PartnersPartnersKaiserKaiser--Permanente GeorgiaPermanente Georgia
U.S. Environmental Protection AgencyU.S. Environmental Protection AgencyGeorgia Environmental Protection DivisionGeorgia Environmental Protection Division
Georgia Division of Public HealthGeorgia Division of Public HealthEmory UniversityEmory University
Georgia Institute of TechnologyGeorgia Institute of Technology
The CDC Environmental Public Health Tracking 2006 Conference (TRACKS 2006) “Implementing the Tracking Network”. Atlanta, GA. Aug. 9-11, 2006

The CDC Environmental Public Health Tracking 2006 Conference (TRACKS 2006) “Implementing
HELIX-Atlanta Overview
HELIX-Atlanta was developed to support current and future state and local EPHT programs to implement data linking demonstration projects which could be part of the EPHT Network.
HELIX-Atlanta is a pilot linking project in Atlanta for CDC to learn about the challenges the states will encounter.
NASA/MSFC and the CDC are partners in linking environmental andhealth data to enhance public health surveillance.
The use of NASA technology creates value – added geospatial products from existing environmental data sources to facilitate public health linkages.
Proving the feasibility of the approach is the main objective

The CDC Environmental Public Health Tracking 2006 Conference (TRACKS 2006) “Implementing
HELIX-Atlanta Challenges
Sharing data between agencies with different missions and mindsets
Protecting confidentiality of informationEnsuring high quality geocoded dataEnsuring appropriate spatial and temporal resolutions
of environmental dataDeveloping sound resources and methods for
conducting data linkages and data analysis
The CDC Environmental Public Health Tracking 2006 Conference (TRACKS 2006) “Implementing
HELIX-Atlanta Respiratory Health Team
RH Team Pilot Data Linkage Project:Link environmental data related to ground-level PM2.5 (NASA+EPA)with health data related to asthma
Goals: 1. Produce and share information on methods useful for integrating
and analyzing data on asthma and PM2.5 for environmental public health surveillance.
2. Generate information and recommendations valuable to sustaining surveillance of asthma with PM2.5 in the Metro-Atlanta area.
Environmental Hazard Measure: Daily PM2.5Asthma Measure: Daily acute asthma office visits to KP-GA Medical Facilities Time period: 2001-2003Linkage Domain: 5-county metropolitan Atlanta

The CDC Environmental Public Health Tracking 2006 Conference (TRACKS 2006) “Implementing
Data Linkage
3HealthData
MODISAQS
Linkage
LinkedData
Acute Asthma Visits
Aggregationemailemail
EHTB
NCEH
HELIX - Atlanta Team
EnvironData
EPA NASA
The CDC Environmental Public Health Tracking 2006 Conference (TRACKS 2006) “Implementing
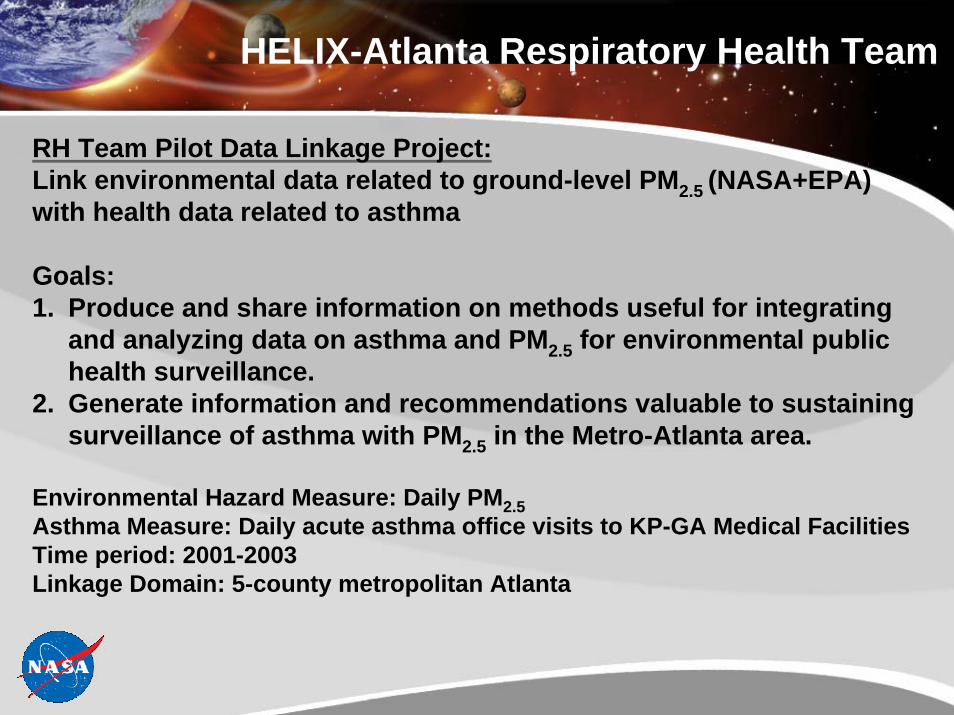
Sources of PM2.5 data: EPA AQS
EPA Air Quality System (AQS) ground measurementsNational network of air pollution monitorsConcentrated in urban areas, fewer monitors in rural areasTime intervals range
from 1 hr to 6 days(daily meas. every 6th day)
Three monitor types:• Federal ReferenceMethod (FRM)• Continuous• Speciation
FRM is EPA-acceptedstandard method;processing time 4-6 weeks
FRM sitesNon-FRM sites
6-Day sitesHourly sites

The CDC Environmental Public Health Tracking 2006 Conference (TRACKS 2006) “Implementing
Sources of PM2.5 data: MODIS
MODIS Aerosol Optical Depth (AOD)AOD is a measure of the total particulate in the atmosphereIf atmosphere is well mixed, AOD is a good indicator of surface
PM2.5Enhanced Spatial Coverage Provided on a 10x10 km gridAvailable twice per day
(Terra ~10:30 AM, Aqua ~1:30 PM) Clear-sky coverage onlyAvailable since spring 2000
June 25, 2003
MODIS
AQS

The CDC Environmental Public Health Tracking 2006 Conference (TRACKS 2006) “Implementing
Estimating PM2.5 from MODIS data
For 2002-2003, obtain MODIS AOD and EPA AQS PM2.5 data
Extract AOD data for 5 AQS site locations
Calculate daily averages from hourly AQS PM2.5 data
Using daily PM2.5 averages from all 5 Atlanta AQS sites, determine statistical regression equations between PM2.5 and MODIS AOD
Apply regression equations to estimate PM2.5 for each 10 km grid cell across region

The CDC Environmental Public Health Tracking 2006 Conference (TRACKS 2006) “Implementing
MODIS AOD - PM2.5 RelationshipPM 2.5 and MODIS AOD - 2002
0
5
10
15
20
25
30
35
40
1/1/20
022/1
/2002
3/1/20
024/1
/2002
5/1/20
026/1
/2002
7/1/20
028/1
/2002
9/1/20
0210
/1/20
0211
/1/20
0212
/1/20
02
Date
mic
rogr
ams/
m3
0.00
0.15
0.30
0.45
0.60
0.75
0.90
1.05
1.20
MO
DIS
AO
D
Mean PM 2.5Mean MODIS AOD
PM 2.5 and MODIS AOD - 2003
0
5
10
15
20
25
30
35
40
45
1/1/20
032/1
/2003
3/1/20
034/1
/2003
5/1/20
036/1
/2003
7/1/20
038/1
/2003
9/1/20
0310
/1/20
0311
/1/20
0312
/1/20
03
Date
mic
rogr
ams/
m3
0.00
0.20
0.40
0.60
0.80
1.00
1.20
1.40
1.60
1.80
MO
DIS
AOD
Mean PM 2.5Mean MODIS AOD
• Daily 5-site means of observed PM2.5 and MODIS AOD• MODIS data not available every day due to cloud cover• MODIS AOD follows seasonal patterns of PM2.5but not the day-to-day variability in fall and winter
2002
2003

The CDC Environmental Public Health Tracking 2006 Conference (TRACKS 2006) “Implementing
PM 2.5 – MODIS AOD Correlations
MODIS-Terra MODIS-Aqua2000 --> 0.5792001 --> 0.6432002 --> 0.559 0.4012003 --> 0.661 0.727
April April -- SeptemberSeptember
• Correlations between PM2.5 and MODIS AOD are generally high (> 0.55) for the warm season.• The lower correlation for MODIS-Aqua in 2002 is for July-September only.
The CDC Environmental Public Health Tracking 2006 Conference (TRACKS 2006) “Implementing
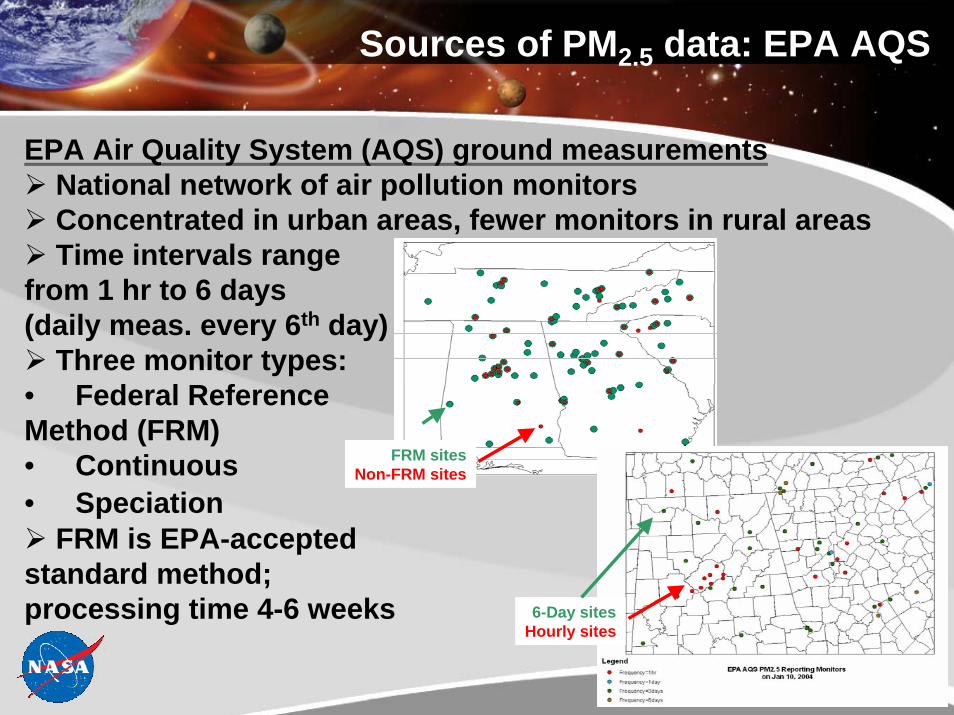
PM2.5 Exposure Assessment- Spatial Surfacing
1st degree recursive B-spline in x- and y-directions
Inverse Distance Weighted (IDW)
Daily surfaces created ona 10x10 km grid
Variable number ofmeasurements availableeach day
High : 50 µg/m3
Low : 0 µg/m3
PM2.5 Concentration
EPA sites
High : 50 µg/m3
Low : 0 µg/m3
High : 50 µg/m3
Low : 0 µg/m3
PM2.5 Concentration
EPA sites

The CDC Environmental Public Health Tracking 2006 Conference (TRACKS 2006) “Implementing
Quality Control Procedure for AQS PM2.5 data
Eliminates anomalous measurements based on a non-parametric rank-order spatial analysis
Applied to all daily AQS PM2.5 measurements before spatial surfaces are built
Suspicious value
Before After
High : 50 µg/m3
Low : 0 µg/m3
PM2.5 Concentration
EPA sites
High : 50 µg/m3
Low : 0 µg/m3
High : 50 µg/m3
Low : 0 µg/m3
PM2.5 Concentration
EPA sites

The CDC Environmental Public Health Tracking 2006 Conference (TRACKS 2006) “Implementing
MODIS PM2.5 Bias Adjustment
Assumption: AQS measurements are unbiased relative to the local mean, but MODIS PM2.5 estimates may have biases.
Procedure:1. Use a two-step B-spline algorithm to create highly smoothed versions of
the MODIS and AQS PM2.5 daily surface2. Compute the ‘Bias’ as the difference between the smoothed fields3. Subtract the bias from the MODIS PM2.5 daily surface to give the ‘bias-
corrected’ MODIS daily surface
MODIS Bias
High : 10.59
Low : -22.92
10.6 µg/m3
-22.9 µg/m3
65 µg/m3
0 µg/m3
Smooth AQSSmooth MODIS
The CDC Environmental Public Health Tracking 2006 Conference (TRACKS 2006) “Implementing
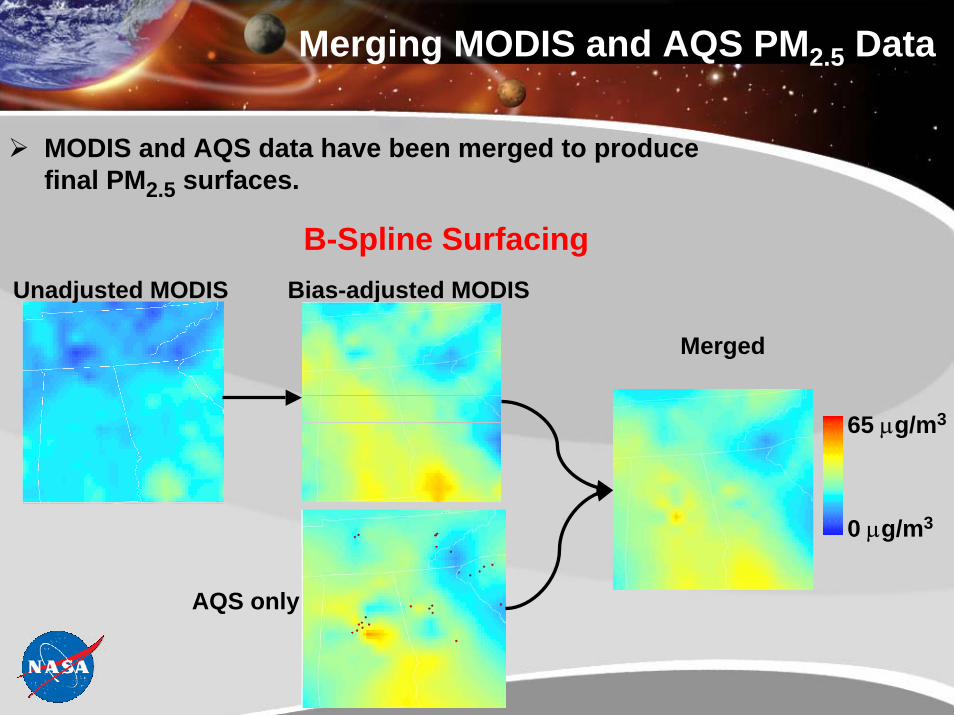
Merging MODIS and AQS PM2.5 Data
MODIS and AQS data have been merged to producefinal PM2.5 surfaces.
B-Spline Surfacing
AQS only
Unadjusted MODIS
Merged
Bias-adjusted MODIS
65 µg/m3
0 µg/m3

The CDC Environmental Public Health Tracking 2006 Conference (TRACKS 2006) “Implementing
Merging MODIS and AQS PM2.5 Data
IDW Surfacing
Merged
65 µg/m3
0 µg/m3
MODIS Only
AQS only

The CDC Environmental Public Health Tracking 2006 Conference (TRACKS 2006) “Implementing
Cross-Validation
a.k.a. ‘bootstrapping’ or ‘omit-one’ analysisObjective: Estimate errors associated with daily spatial surfacesProcedure:1. Omitting one observation, create surface using N-1 observations2. Compare value of surface at location of omitted observation with
the observed value3. Repeat for allobservations 4. Calculate errorstatistics by day or site
0
10
20
30
40
50
60
70
0 10 20 30 40 50 60 70Observed PM2.5
Boo
tstra
p PM
2.5
y = 0.924 x + 1.356yR2 = 0.949

The CDC Environmental Public Health Tracking 2006 Conference (TRACKS 2006) “Implementing
Cross-ValidationError Statistics
Bootstrap-Observed
0123456789
10
1 26 51 76 101 126 151 176 201 226 251 276 301 326 3512003 Day of Year
RMSD
(mic
rogr
ams/
m3 )
RMSD by Site
LegendRSMDBOOT_OBS
0.61 - 1.70
1.71 - 2.79
2.80 - 3.88
3.89 - 4.97
4.98 - 6.09
Time Series
RMSD = 2.7 µg/m3

The CDC Environmental Public Health Tracking 2006 Conference (TRACKS 2006) “Implementing
Surfacing Methods Comparison
Surfacing Technique and Data Source
RMSD(All
Days)
RMSD(Warm Season (Days
91-273))
Bspline, AQS only, no QC
3.302 3.556
Bspline, AQS only, with QC
2.927 3.164
IDW, AQS only 2.450 2.686
B-Spline, merged AQS/MODIS
N/A 2.756
IDW, merged AQS/MODIS
N/A 1.613
Surfacing Technique and Data Source
Improvement
Bspline: QC vs. No QC 12 %
Bspline: AQS only vs. merged AQS/MODIS
16 %
IDW: AQS only vs. merged AQS/MODIS
40 %
Surfacing Technique and Data Source
Improvement
Bspline: QC vs. No QC 12 %
Bspline: AQS only vs. merged AQS/MODIS
16 %
IDW: AQS only vs. merged AQS/MODIS
40 %
Surfacing Technique and Data Source
Surfacing Technique and Data Source
ImprovementImprovement
Bspline: QC vs. No QCBspline: QC vs. No QC 12 %12 %
Bspline: AQS only vs. merged AQS/MODISBspline: AQS only vs. merged AQS/MODIS
16 %16 %
IDW: AQS only vs. merged AQS/MODIS
IDW: AQS only vs. merged AQS/MODIS
40 %40 %

The CDC Environmental Public Health Tracking 2006 Conference (TRACKS 2006) “Implementing
Annual Composite Surfaces
PM2.5 (ug/m3)
PM2.5 (ug/m3)
B-Spline
IDW

The CDC Environmental Public Health Tracking 2006 Conference (TRACKS 2006) “Implementing
Linkage of Environmental and Health Data
Health Data Set
MembersLON LAT ID AGE GENDER YEAR/MO-84.207 99.200 1 Child M 200301-84.802 99.359 2 Adult M 200301-83.798 99.993 4 Child F 200301
Acute asthma office visitsID AGE LON LAT GENDER DATE1811 Child -84.179 99.118 F 1/1/200354767 Adult -84.625 99.802 F 1/1/200384580 Adult -84.679 99.691 F 1/1/2003
*Simulated Data Set. F=female, M=male, A=adult, C=child.

The CDC Environmental Public Health Tracking 2006 Conference (TRACKS 2006) “Implementing
Linkage of Environmental and Health Data
Data Linkage Outputs
Visit counts by grid cellDate Cell PM2.5 FC MC FA MA200301 1 21.74 1 0 2 0200301 2 12.79 0 0 0 0200301 3 12.21 0 1 0 1
PM2.5 for each visitDate ID Member Lat/Lon Cell Cell Lat/Lon County State Gender Age PM2.51 1 1811 99.572 -84.251 1944 99.552 -84.284 Coweta GA F Child 21.741 2 15299 99.063 -83.860 1608 99.104 -83.806 Upson GA F Child 12.791 2 15879 99.727 -84.369 2079 99.731 -84.403 Fulton GA M Child 12.21
*Simulated Data Set. F=female, M=male, A=adult, C=child.
The CDC Environmental Public Health Tracking 2006 Conference (TRACKS 2006) “Implementing
Successes
Proven the feasibility of linking environmental data (MODIS PM2.5 estimates and AQS) with health data (asthma)
Developed algorithms for QC, bias removal, merging MODIS and AQS PM2.5 data, and others…
Negotiated a Business Associate Agreement with a health care provider to enable sharing of Protected Health Information

The CDC Environmental Public Health Tracking 2006 Conference (TRACKS 2006) “Implementing
Team Members and Acknowledgements
Member’s Name, Affiliation• (Co-Chair) Kafayat Adeniyi, Centers for Disease Control and Prevention, • (Co-Chair) Solomon Pollard, Environmental Protection Agency (EPA), Region 4• Mohammad Z. Al-Hamdan, National Aeronautics and Space Administration• Rob Blake, DeKalb County Board of Health• David Blaney, Georgia Division of Public Health • Bill Crosson, National Aeronautics and Space Administration• Kristen Mertz, Georgia Division of Public Health • Amanda Sue Niskar, Centers for Disease Control and Prevention• Dale Quattrochi, National Aeronautics and Space Administration• Amber Sinclair, Kaiser Permanente• Allison Stock, Centers for Disease Control and Prevention• Denis Tolsma, Kaiser Permanente• Linda Thomas, Environmental Protection Agency, Region 4• Ntale Kajumba, Environmental Protection Agency, Region 4• Carolyn Williams, Georgia Division of Public HealthAcknowledgments • Leslie Fierro, Centers for Disease Control and Prevention• Gabriel Rainisch, Centers for Disease Control and Prevention• Emily Hansen• HELIX-Atlanta Partners
The CDC Environmental Public Health Tracking 2006 Conference (TRACKS 2006) “Implementing
Thanks!
Presenter’s Contact Information:
Mohammad Z. Al-Hamdan, PhD