Embed Size (px)
Citation preview

Editorial
Gene S characterization of Hantavirus species on Indonesian island
Influenza cases from Surveillance Acute Respiratory Infection in Indonesia
Flight hours, and the risk of hyperglycemia in civilianpilots in Indonesia
Education~ contraceptive use and exclusive breastfeeding in Indonesia
Dioscorea alata flour normalized the blood lipid profile of rabbits
Alternative daily intake of fruits and vegetables for Indonesian elderly
Parity, education level and risk of (pre-) eclampsia in hospitals in Jakarta
The use of antibiotics in hospitalized adult typhoid patients
Potential topical natural repellent ~gainst several mosquitoes
Identification of endoparasites in rats of various habitats
p.1-53 Jakarta, June 2014 ISSN 2087-7021 ,
r
Vol. 5, No. I, June 2014 Dioscorea alala and dyslipidemia 23
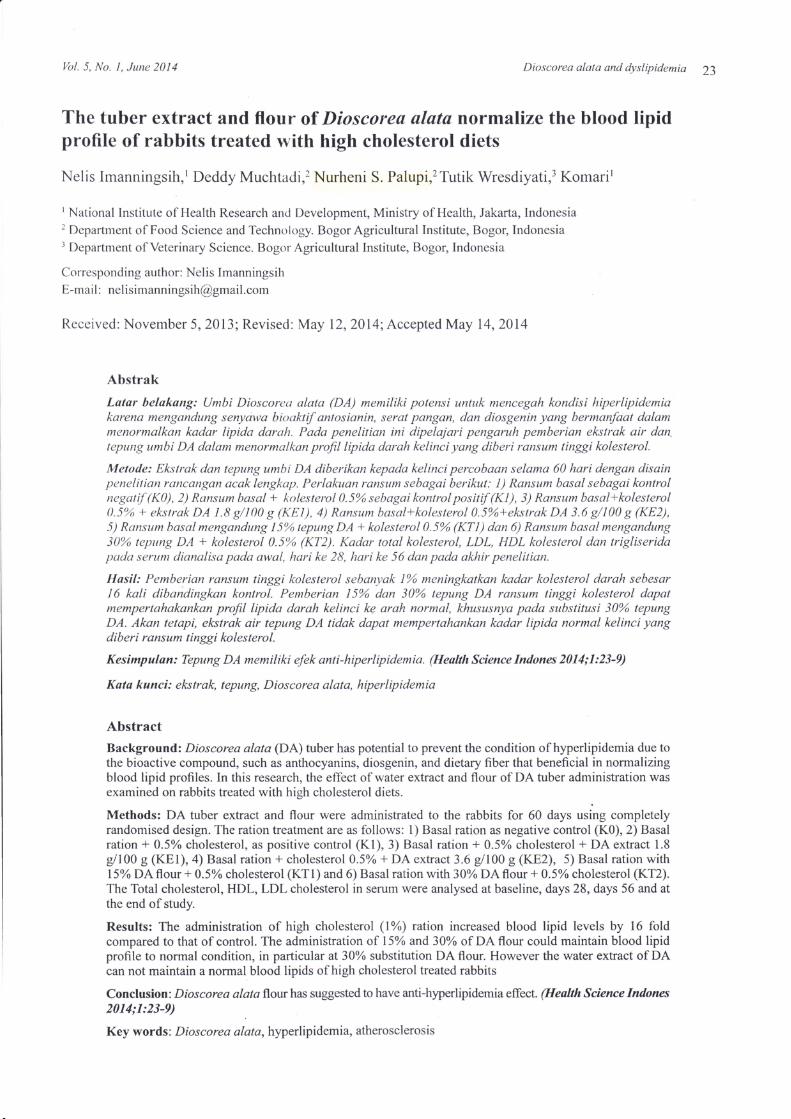
The tuber extract and flour of Dioscorea alata normalize the blood lipid profile of rabbits treated with high cholesterol diets
Nelis Imanningsih,i Deddy Muchtad i,2 Nurheni S. Palupi,2Tutik WresdiyatV Komari i
I National Institute of Health Research and Development, Ministry of Health, Jakarta, Indonesia 2 Department of Food Science and Technology. Bogor Agricultural Institute, Bogor, Indonesia
3 Department of Veterinary Science. Bogor Agricultural Institute, Bogor, Indonesia
Corresponding author: Nelis Imanningsih E-mail : [email protected]
Received: November 5,2013; Revised : May 12,2014; Accepted May 14,2014
Abstrak
LataI' belakang: Umbi Dioseorea alata (DA) memiliki potensi untuk meneegah kondisi hiperlipidemia karena mengandung senyawa biuaktiJ an/osianin, serat pangan, dan diosgenin yang berman/aat dalam menormalkan kadar lipida darah. Pada penelilian ini dipelajari pengaruh pemberian ekstrak air dan. /epung umbi DA dalam menormalkan profillipida darah kelinei yang diberi ransum tinggi kolestero!.
Metode: Ekslrak dan tepung umbi DA diberikan kepada kelinei pereobaan selama 60 hari dengan disain penelitian raneangan aeak lengkap. Perlakuan ranSUI/1 sebagai berikut: 1) Ransum basal sebagai kantrol nega/i/(KO), 2) Ransum basal + kolesterol 0.5% sebagai kontral positiJ (K1), 3) Ransum basal+kolesterol 0.5% + ekstrak DA 1.8 g/l()O g (KE I), 4) Ransum basal+kolesterol 0.5%+ekstrak DA 3.6 g/JOO g (KE2) , 5) Ran.wm basal mengandung 15% tepung DA + kolesterol 0.5% (KTl) dan 6) Ransum basalmengandung 30% /epllng DA + kolesterol 0.5% (KT2). Kadar total koles/erol, LDL, HDL kolesterol dan Irigliserida pada serum dianalisa pada awal, flari ke 28, hari ke 56 dan pada akhir penelitian.
Hasil: Pemberian ransum tinggi kolesterol sebanyak 1% meningkatkan kadar kolesterol darah sebesar J 6 kali dibmidingkan kontro/. Pemberian 15% dan 30% tepung DA ransum tinggi kolesterol dapat mempertahakankan profil lipida darah kelinei ke arah normal, khususnya pada substitusi 30% tepung DA. Akan tetapi, ekstrak air tepung DA tidak dapat mempertahankan kadar lipida normal kelinei yang diberi ransum tinggi kolestero!.
KesimpllLan: Tepung DA memiliki e/ek anti-hiperlipidemia. (Health Science Indones 2014;1:23-9)
Kata kllnci: ekstrak, tepung, Dioseorea alata, hiperlipidemia
Abstract
Background: Dioscorea alata (DA) tuber has potential to prevent the condition of hyperlipidemia due to the bioactive compound, such as anthocyan ins, diosgenin, and dietary fiber that beneficial in nonnalizing blood lipid profiles. In this research, the effect of water extract and flour of DA tuber administration was examined on rabbits treated with high cholesterol diets .
Methods: DA tuber extract and flour were administrated to the rabbits for 60 days using completely randomised design. The ration treatment are as follows: 1) Basal ration as negative control (KO), 2) Basal ration + 0.5% cholesterol, as positive control (Kl), 3) Basal ration + 0.5% cholesterol + DA extract 1.8 g/IOO g (KEl), 4) Basal ration + cholesterol 0.5% + DA extract 3.6 glIOO g (KE2), 5) Basal ration with 15% DA flour + 0.5% cholesterol (KTl) and 6) Basal ration with 30% DA flour + 0.5% cholesterol (KT2). The Total cholesterol, HDL, LDL cholesterol in serum were analysed at baseline, days 28, days 56 and at the end of study.
Results: The administration of high cholesterol (1%) ration increased blood lipid levels by 16 fold compared to that of control. The administration of 15% and 30% of DA flour could maintain blood lipid profile to normal condition, in particular at 30% substitution DA flour. However the water extract of DA can not maintain a nonnal blood lipids of high cholesterol treated rabbits
Conclusion: Dioseorea alata flour has suggested to have anti-hyperlipidemia effect. (HeaLth Science Indones 2014;1:23-9)
Key words: Dioseorea alata, hyperlipidemia, atherosclerosis

r
24 Imann ingsih et al.
Hyperlipidemia is one risk factor for atheroclerosis.1 Epidemiology and experimental researches showed that food containing high cholesterol i~ highly related with hyperlipidemia condition. High lipid level, particularly Low Density Lipoprotein-Cholesterol (LDLCholesterol) showed significant relationship with the development of atherosclerotic plaque.2 Many researches related to atherosclerosis were conducted to see the effect of bioactive compounds in nonnalizing hyperlipidemia and preventing the oxidation of blood lipid cholesterol. Currently, natural materials become a topic of interest of research as a potential substance producing biologically active component such as antioxidant, anti-hyperlipidemia or as anti-inflammatory substances. Tuber of Dioscorea alala (DA) has the potential to reduce the risk of cardiovascular disease with functional compounds.
The functional components of this tuber are anthocyanins, dietary fiber and diosgenin. Anthocyanins belongs to the polyphenolic compound which has antioxidant capacity by scavenging free radicals.) Current research indicates that anthocyan ins have physiological advantages as an antioxidant, anti-inflammatory, blood vessel relaxation, and as stabilizing compounds of capillaries.4 Anthocyanin could also improve blood lipid profile by increasing High Density Lipoprotein (HDL) and lowering Low Density Lipoprotein (LDL) plasma. 5 Musilases are compound in DA tuber that contain complex carbohydrates and protein. The carbohydrate are mainly a dietary fiber consisting of hexose and pentose monomers. Musilases could regulate lipid metabolism with anti-hyperlipidemia effect.6 Diosgenin is a plant steroid that has antihyperlipidemia effect by suppressing cholesterol absorption and increased secretion of cholesterol in bile acid, 7 therefore increased fecal cholesterol excretion.8•9
With the potency, it is expected that supplementation of DA extract or flour could normalized the blood lipid profile of rabbits. This reserach is aimed to detem1ine the efect of suplementation of DA extract and flour on blood lipid profile of rabbits fed with high cholesterol diet.
METHODS
Material and equipment
The material used in this study are: DA tuber flour, aquadest, male New Zealand White rabbits 5 months old, that obtained from the Indonesian Research Institute for Animal Production in Ciawi, Bogor . . Rabbit basal ration and experimental ration, made in
Health Science Indones
Indofeed livestock feed in Bogor. Pure cholesterol, reagent for cholesterol, LDL, HDL and triglicerides analysis (Fluitest-Chol kit) were obtained from Sigma and Analyticon Biotechologies. The equipment are shakers, centrifuge, freeze drier, spectrophotometer, a set of rabbits growing equipment, and blood taking equipments,
The production of ration
Rations was fonnulated base on nutritional need for normal growth of adult rabbits .lo Material having polyphenolic compound other than DA tuber did not included in the ration component. Ration composition calculation were perfonned using the WUFFDA (Windows-Based User Friendly Feed Fonnulation Workbook) Version 3 to obtain isocaloric and isoprotein rations. II
0.5 g of pure cholesterol was mixed with 19.5 g of basal ration, to produce a small ration of 20 g. The rabbits in cholesterol groups (KE I, KE2, KT I and KT2), were fed with .the small ration containing cholesterol in advance, and after the small ration was consumed, 80 g of basal ration was added. Therefore total cholesterol given is 0.5 g in 100 g of basal ration/ day or 0.5% in the diet.
DA dried extract of maltodextrin, contained 25 g of anthocyanins per 100 g, whereas DA flour contained 1.4 g of anthocyan ins per 100 g, or there was as much as 0.23 anthocyaninsll5 g DA flour or 0.45 g anthocyanin! 30 g DA flour. To get an equivalent amount of anthocyanin presented in 15 and 30 g DA flour, 0.9 and 1.8 g of maltodextrin extract were weight. This maltodextrin extracts was mixed with cholesterol ration, and this mixture was added by basal ration until the total weight is 20 g. This ration is given to the KEI and KE2 group to be eaten in advance, then 80 of basal ration is added. Therefore the total ration given to these groups was 0.5 g of cholesterol plus 1.8 or 3.6 g anthocyanins extract in 100 basal ration!day.
The DA flour 15 and 30 ration were made by adding 150 g and 300 g DA flour into/ Kg of basal ration ingredients. All ingredients were processed into pellets, so that at the end, the ration contained 15 and 30% DA flour. These ration were fed to rabbits in KTl and KT2 groups. Proximate content of the ration were analysed using AOAC methods. The content of dietary fiber was analysed using dietary fiber kit (Sigma-Aldrich, USA) using a combination of enzymatic and gravimetric methods.
r Vol. 5. No.1. June 2014
In vivo experiment in rabbits
In vivo experiment was conducted using 5 monthsmale of New Zealand white rabbits with initial weight approximately 2.7 kg in each. The number of rabbits in each group was calculated based on the mean difference formula. 13 To meet sampling size, the number of rabbits required in each group should be five. Rabbits were weighed and grouped according the type of ration as follow.
K I = Control negative, Basal Ration K2 = Control positive cholesterol, Basal Ration +
0.5% cholesterol KE I = Basal Ration + anthocyanins extract equal to
15 g DA flour (1.8 g) + 0.5% cholesterol KE2 = Basal Ration + anthocyan ins extract equal to
30 g DA flour (3.6 g) + 0.5% cholesterol KTI = Basal Ration contain 15% DA flour + 0.5%
cholesterol KT2 = Basal Ration contain 30% DA flour + 0.5%
cholesterol
The rabbits were adapted to the maintenance environment for I month. In adaptation phase, the standard ration was substituted gradually from 0% to 100% treatment ration. After one month, the rabbits were ready to eat treatment ration. During the study, the measurements of observed variable was carried out regularly. Rabbits was weight once a week, ration consumption was weighed and calculated everyday, blood lipids (total kolesterol, LDL, HDL, dan trigliserida) were measured at baseline, day 28, 56 and at the end of study.
Blood was taken from vein at the ears using butterfly sterile syringe. To obtain serum, blood was centrifuged at 100 g for 15 min at 4°C. Triacylglicerol (TG), total cholesterol (TC), low density lipoprotein cholesterol (LDL-cholesterol), high-density lipoprotein cholesterol (HDL-cholesterol), were analyzed using commercial kits (Fluitest® Chol, HDL-Chol, LDL-Chol dan Triacyglicerol, Analyticon Biotechnologies).
The study design was a completely randomised design with five replications. Data were analyzed using analysis of variant (ANOVA) and Least significant different (LSD) analysis to determine the difference between treatments. The value was sugested to be significantly different if the P value is smaller than 0.05. All data presented ini the form of mean ± standard deviation, The ethical approval was obtained from the Research Ethics Board of National Institute of Health Research and Development, Ministry of Health of Indonesia.
Dioscorea alala and dyslipidernia 25
RESULTS
The compositions of rabbit ration are listed in Tabel 4.1. The macro nutrient of each ingredient is analysed, and the values are used as the basis for formulation (Tabel 4.2). The purpose of the formulation is to obtain rations that contain uniform number of calories, protein, fat and crude fiber, and comply with the required nutrient for normal growth of rabbits. According to Lebas (1997), nutrition requirements for a rabbit are 350-370 kcal/IOO g of energy, 3-5 % offat, and 15-18 % of protein, whereas the need offiber was 10-14 %.
Rations are formulated to contain 0 %, 15 % and 30 % of DA flour. Formulations should meet nutritional and fiber needs for normal growth of rabbits. Protein, fat and fiber are ranged from 16.01-16.34 %, 3.2-4.92 %, and 10.51 - 11.84 %, while the energy is ranged between 360-366 kcal/l 00 g ration. With this composition, ration has meet the nutritional needs of a nonnal growth of adult rabbits. From the analysis, it can be seen that the content of protein, fat, crude fiber in the ration of all experimantal groups are equivalent. However, the dietary fiber content of the basal ration, DA-15 ration and DA-30 were different.
Rabbits in each treatment group consumed the same amount of ration (P = 0.3818, a = 0.05). The Number of ration consumed in 60 days was between 5106.9 - 5826.2 g or 83.72 -95.51 g / day. With a number of these rations, protein and calorie intake for each group ranged between 817.61 - 939.04 g or 13:40 to 15:39 g / day, and between 18.691 to 21.324 kcal or 306-349 kcal / day. The amount of energy and protein consumed by rabbits is an important factor to ensure that the difference in the parameters is caused by differences in treatment, and not due to differences in the amount of feed intake.
The differences in ration composition did not cause a significant different in weight of rabbits between groups, because the content of macro nutrient in each group was equal. Initial weight of rabbits were varied between 2255.7 - 2457.0 g (not significantly different, P= 0.9961, a=O.05), and the final weight were between 2987.0 - 3339.8 g. The weight gain is about 800 g/individual rabbit in 60 days, or about 90 g/individu/week.
The amount of cholesterol and anthocyanins consumed by the rabbits were calculated by subtracting the amount of given ration with the left behind. The amount of cholesterol consumed by a rabbit in 60 days is between 33.64 - 34.63 g or 0.50 to 0.57 g/

26 lmanningsih et af.
day. Analysis of variance showed that there was no significant difference in the amount or cholesterol consumed (P = 0.2622, a = 0.05 level). The intake of anthocyanin extract between groups KE I (extract IS) and KTI (flour 15) or between groups extract and flour KE2 and KT2 is designed the same. To extract the DA 15 and DA 15 flour, the average intake 0.24 and 0.19 g / day, and to extract DA-30 and DA-30 starch intake the average was 0.45 and 0.40 g / day.
Table 1. The changing of blood total choleste rol level
Health Science Indones
During the research, there were four times of blood lipids measurements. At the baseline, all of blood lipid parameters were in normal condition, where total cholesterol is between 54.03 - 89.88 mg / dL, HDL is between 29.65 - 41.43 mg / dL, LDL is between 43.03 - 60.05 mg / dL, and triglycerides is between 40.35 - 67.63 mg / dL. With this range, the difference in blood lipid components at baseline was not significant (p = 0.5740, a = 0.05).
Total cholesterol level (mg/dL)
Groups Baseline Day-28 Day-56 End Mean SD Mean SD Mean SD Mean SO
KO 73.53 ± 22.93 65.83 I· 21.13 ' 56.35 ± 28.65 b 54.00 ± 6.35 e
KI 89.88 ± 41.66 1443.00 ± 446.84 ' 2140.50 ± 904.97 a 1987.20 ± 770.66 '
KEI 70.45 ± 28.18 1424.50 1: 375.42 ' 2152.00 ± 1133.90 ' 1572.80 ± 218.21 ,b
KE2 68.25 ± 21.21 1410.30 j- 320.30 ' 2081 .80 ± 701.98 ' 2000.00 ± 920.13 '
KTl 54.03 ± 13.84 537.65 ± 304.08 b 680.35 ± 228.12 b 645.40 ± 228.94 be
KT2 68.25 ± 19.13 250.55 ± 110.81 be 438.80 ± 150.09 b 314.15 ± 150.71 c
'The value followed by different letter in the same coloumn indicated a significant difference (P :5 0.05)
Table 2. The changing of blood LDL cholesterol leve l
LDL cholesterol level (mgldL) Groups Baseline Da:r-28 Da:r-56 End
Mean SO Mean SD Mean SO Mean SD KO 47.55 ± 12.45 51.45 ± 14.52 c 48.50 ± 24.13 b 42.03 ± 7.81 b
KI 60.05 ± 23 .3 I 1409.30 ± 185.54 ' 978.50 ± 182.24 ' 514.48 ± 230.31 ,
KEI 43.18 ± 9.66 808.25 ± 720.77 b 974.50 ± 164.53 a 625.73 ± 346.88 '
KE2 43.03 ± 5.38 1348.00 ± 151.5 I , 872.25 ± 339.61 a 761.27 ± 171.01 a
KTl 48.98 ± 17.39 208.77 ± 56.91 e 149.82 ± 12.20 b 207.05 ± 65.97 b
KT2 45.90 ± 17.32 157.10 ± 21.65 e 153.95 ± 17.91 b 109.58 ± 44.28 b
'The value followed by different letter in the same coloumn indicated a significant difference (p :5 0.05)
Table 3. The changing of blood HDL cholesterol level
HDL cholesterol level (mgldL) Groups Baseline Day-28 Day-56 End
Mean SD Mean SD Mean SD Mean SD KO 38.03 · ± 12.69 33 .83 ± 7.70 ab 25.03 ± 9.01 a 25 .03 ± 9.86 a
KI 31.98 ± 13.25 27.95 ± 2.47 b 17.73 ± 5.34 a 17.73 ± 5.81 a
KEI 39.03 ± 16.64 42.30 ± 13.13 ab 24.30 ± 11.15 a 24.30 ± 7.82 a
KE2 35.25 ± 5.17 40.45 ± 11.15 , b 23.28 ± 8.69 a 23.28 ± 12.15 a
KTl 29.65 ± 6.42 36.13 ± 7.54 ab 20.68 ± 6.67 a 20.68 ± 3.04 a
KT2 41.43 ± 13.22 41.83 ± 8.87 a 23.70 ± 6.36 a 23.70 ± 10.17 a
'The value followed by different letter in the same coloumn indicated a significant difference (P :5 0.05)

Vol. 5. No. I . June 2014 Di()\ ("()rea alala and dyslipidemia 27
Table 4. The changing of blood tryacy\gliceride level
Tryacylgliceride level (mg/dL) Groups Baseline Day-28 Day-56 End
KO 52.58 ± 11.62 83.00 ± 13.52 h 55.43 ± 2007 ' 68.38 ± 5.90 '
KI 57.08 ± 6.82 216.22 ± 94.34 a 186.28 ± 25 70 b 271.30 ± 68.10 '
KEI 51.53 ± 16.55 183.30 ± 28.83 a 203.60 ± 43,09 b 243.42 ± 42.29 '
KE2 61.13 ± 9.76 187.90 ± 26.42 a 251.42 ± 3860 a 276.90 ± 35.33 a
KT1 48.25 ± 5.70 94.30 ± 20.81 h 91.80 ± 36.77 ' 176.10 ± 27.02 b
KT2 47.20 ± 16. 53 78.13 ± 16.97 h 68.33 ± 12 S7 ' 75.40 ± 22.27 '
*The , 'a lue followed by different letter in the same coloullln indicated a signifi cant difference (P :'S 0.05)
DlSCUSSION
Administration of cholesterol in rabbits led to a noticeable increase in total cholesterol, LDL-cholesterol, and triacylglycerol. These results are consistent with previous studies, 14. 15. 16 which found thatthe lipid foods correlates with blood lipid profile of rabbits . Rabbits in particular, are very sensitive to dietary cholesterol , a normal rabbit will synthesize and secrete about 100 mg of cholesterol per day and maintain blood cholesterol concentrations at a maximum of 100 mg / dl , but the provision of cholesterol in the diet, will increase in the extreme concentration of cholesterol in the blood rabbit. iO Total cholesterol, LDL cholesterol and blood triacylglycerol in rabbits fed a high cholesterol diet (K I) showed a very high increase. On the measurement at day 28, it is known that the level of total cholesterol increased by 16-fold, and total and LDL cholesterol increased by 20-fold from the initial conditions (Table I and 2). These conditions could happen, because rabbits are herbivores that are very sensitive to dietary cholesterol, however the animal is not able to degrade or secrete cholesterol in the form of bile acids in sufficient quantities, to balance with what has been absorbed, so that the severe hyperlipidemia condition was occurred (Weisbroth 1974).17 The conditions of high levels cholesterol, LDL cholesterol and triacylglycerol is continuously increase until the 56th day of measurement, and a there was a slight decrease in the measurement at day 60.
The administration of cholesterol ration does not cause a significant differences in HDL-cholesterol levels between treatment groups (Table4 .6.). HDLhas a function to bring the non-esterified cholesterol from the cells and from other accumulated lipoproteins, to the liver for bile acids secretion. 2 Low levels of HDLcholesterol indicates a low cholesterol carried to the
liver to balance what has been absorbed. Therefore, the levels of cholesterol in the blood is very high.
The administration of water extract ofDA (KEI and KE2) to rabbits fed with high cholesterol diet can not maintain blood lipid profile in normal conditions. Levels of total cholesterol, LDL-cholesterol, and blood triacylgliceride of rabbits in these group are closer to K I cholesterol group (p = 0.000, a = 0.05 level). Water extract of DA tubers can not nomlalize blood lipid profiles of rabbits. Water extract of DA tubers contained anthocyan ins which have the effect of lowering cholesterol absorption by modulating the withdrawal of cholesterol from the body to the liver, and secreted into bile acid fonn, through the activation of receptors that regulate the withdrawal. 18 However, this modulation effect is not shown by giving 0.23 g and 0:45 g anthocyanin extract per day. This may be due, the unsufficient dose which can lead the modulation effect.
Substitution 15 and 30% DA flour (KT-1 and KT-2) into ration, can maintain total blood cholesterol of rabbits to normal, especially in rabbits fed with 30% DA flour substitution. Rabbit blood cholesterol levels in both groups were not significantly different from those of nonnal control group (KO). Substitution of DA flour into rations not only provide anthocyanin compounds, but also dietary fiber, such as cellulose, lignin, hemicellulose and pectin. 19 The results of the analysis indicate that the soluble fiber in the basal ration with no DA flour substitution was 6.13%, while the ration with 15% and 30% DA flour substitution contain 9.17% and 13% of dietary fiber respectively.
There are several mechanisms of dietary fiber in lowering serum cholesterol levels. The most likely mechanism is that the presence of dietary fiber

28 lmanningsih et al.
increases the excretion of bile acids. Soluble fiber lowers plasma cholesterol through its ;l hility to bind bile acids in the gastrointestinal tract. Because soluble fiber binds bile acids, the formati on of micelles become distracted and reabsorption of hi Ie acids also decrease. This case will increase the excretion of the dietary fiberbile acid complex in the feces . Since the bile acids decreased, the replacement is carry out in two ways. Firstly, with taking more cho lesterol from the liver and using it for the synthesi s or bile acids, and not circulated to the body as VLIJL ( very low density lipoprotein). Secondly, the need of hepatic cholesterol will improve the regulatinll , synthesis, and LDL receptor activity, causing VI .DL and LDL remnant are taken from the circulation in the body. The overall effect of these changes is a reduction in levels of LDL and total cholesterol serum. 20 In addition, the avaibility of dietary fiber also causes changes in the activity of LDL receplors. A study showed that the experimental animal s fed with a high-fat diet, showed a low LDL receptor activity. However, if the high-fat diet and high cholesterol are given simultaneously with soluble fiber, thereforen the LDL receptor function will revert to normal. 21
Another thing that is expected to play a role 111
lowering cholesterol is the diosgenin content in DA flour which belong to stereoidal saponin grup. A study reported that plant saponins are proven to prevent the absorption of cholesterol in the lumen of the small intestine of animal models , therefore can decrease the concentration of plasma cholesterol.22
Diosgenin also been shown to increase the excretion of cholesterol through feces and increase the secretion of cholesterol through bile acid. 8 Plant sterols and steroids have the hipocholesterolemia effect by inhibiting the absorption of dietary cholesterol and endogenous cholesterol. The existence of sterols and steroids from food will compete with cholesterol for micellar solubility, thus lowering the amount of cholesterol that is absorbed by the intestinal mucosal cells.2)
CONCLUSION
The supplementation of DA flour DA by 15% and 30% maintain the blood lipid profile of rabbits towards normal conditions, in particular at 30% substitution DA flour. However the water extract of DA can not maintain a normal blood lipids of high cholesterol treated rabbits.
Health Science Indones
Acknowledgments
The author would like to thank National Institute of Health Research and Development for funding this study, and to Prof. Bastaman Basuki for lechnical assistance in preparing this manuscript.
REFERENCES
1. American Healt Association. Atherosclerosis. American Heart Association 1 Internet I. 200X. 1 cited 2009 November 12]. Available Ii·om http: //wwlV.american heart.org/ presenter. jhtmJ'lide11lificr=22X .htllll.
2. Gropper SG. Advance nutrition and human metabolism. Australia: Thomson Wads\\·nrth. 2005.
3. Mazza G. Anthocyanins and heart health. Ann Super Sanita. 2007; 43:369-74.
4. Hasselund SS, Kjcdsen SE, Seljeflot I, et aJ. The effects of anthocyan ins on cardiovascular risk factors and inflammation in pre-hypertensive men: a doubleblind randomized placebo-controlled crossover study. ] Hum Hypertens. 2012; 27: 100-6.
5. Qin Y, Xia M, Ma J, et aJ. Anthocyanin supplementation improves serum LDL- and HDL-cholesterol concentrations associated with the inhibition of cholesterol ester transfer protein in dyslipidemic subjects. Am .I Clin Nutr. 2009;90:485-92.
6. Chen HL, WangCH,ChangCT,etal. EffectofTailVanese yam (Dioscorea jafionico Ihunb. ~. Pseudo/a/Jonico yamamoto) on upper gut function and lipid metabolism in Balblc mice. Nutrition. 2003; 19:646-51.
7. ThewJes A, Parslow RA, Colemen R. Eifect of Diosgenin on biliary cholesterol transport in the rat. Biochem J. 1993;291 :793-8.
8. Temel RE, Brown JM, Ma, et al. Diosgenin stimulation of fecal cholesterol excretion in mice is not NPC I L I dependent. J Lipid Res. 2009;50:915-23.
9. Son IS. , Kim .Il-I , Sohn HY, et al. Antioxidative and hypolipidemic effects of diosgenin, a steroidal saponin of am (Dim·corea spp.), on high-cholesterol led rats. Biosci Biotechnol Riochem. 2007;71 :3063- 71 .
10. Lebas F, Coudert P, Rochambeau HD, et al. The rabbit husbandry, health and production. FAO Animal Production and Health Series. 1997.
11. Thompson E. Windows-based user-friendly feed formulation workbook. Armidale. Univ of New England. 2009.
12. Horvvittz W, Latimer G, editors. Official methods of analysis of AOAC International. 18th ed. Maryland (US): AOAC lnternational. 2007.
13 . Levy PS, Lemeslow S. Sampling of population methods and application. 3rd edition. New York; A Wileylnterscicnce Publication John Wiley & Sons Inc. 1999.
14. PrasadK. Hypocholesterolemicandantiatherosclerotic effect of flax lignan complex isolated from flax seed. Atherosclerosis. 2005; 179:269-75.

Vol. 5, No.1 , June 2014
IS . Purohit A, Vyas KB. Antiatherosclerotic l'I'!Cct of capparis decidua fruit extract in cholesterol-led rabbits. Phallllaceutical BioI. 2006;44: 172-7.
16. Jain GC, Jhalani S, Agarwal S, et al. Hypolipilklllic and anti atherosclerotic effect of Leptadenia pyrnt echnica extract in cholesterol fed rabbits. Asian J I:xp Sci. 2007 ;21: IIS-22.
17. Weisbroth SH, Flatt RE, Kraus AL. The biolo!;y of the laboratory rabbit. New York. Academic Press. 1974.
18. Xia X, Ling W, Ma J, et al. An anthocyanin-rich extractfi'om black rice enhances atheroscleroti c plaque stabilization in apolipoprotein e-deficient mice . .I Nutr. 2006; 136: 2220-S .
Dioscorea ulata and dyslipidemia 29
19. Baah FD, Maziya-Dixon B, Asiedu R, et al. NutTitional and biochemical composition of Dioscorea alata (Dioscorea spp) tubers. J Food Agri Environ. 2009;7:373-8.
20. Anderson JW, Hanna TJ. Impact of non digestable carbohydrate on serum lipoprotein and risk of cardiovascular disease. J Nutr. 1999; 129: 14S7S-1466S.
21. Yuan YV. Dietary lipids and in vivo antioxidant status in atherosclerosis resistant and sensitive animals [dissertation]. Columbia. University of British Columbia; 1995.
22. Matsuura. Saponin in garlic as modifier of the risk of cardiovascular disease. JNutr. 200 I ; 131: I OOOS-I OOOSS.
23. Deng R. Food and food supplements with hypocholesterolemic effect. Recent Patents on Food Nutr and Agr. 2009; I: IS-24.