Embed Size (px)
Citation preview

Water alternative energy and climate change -Water, alternative energy and climate change -environmental investment strategies
Jens Peers Head of KBC ECO Investments
Presentation to PortfolioConstruction Conference 2008
August 2008
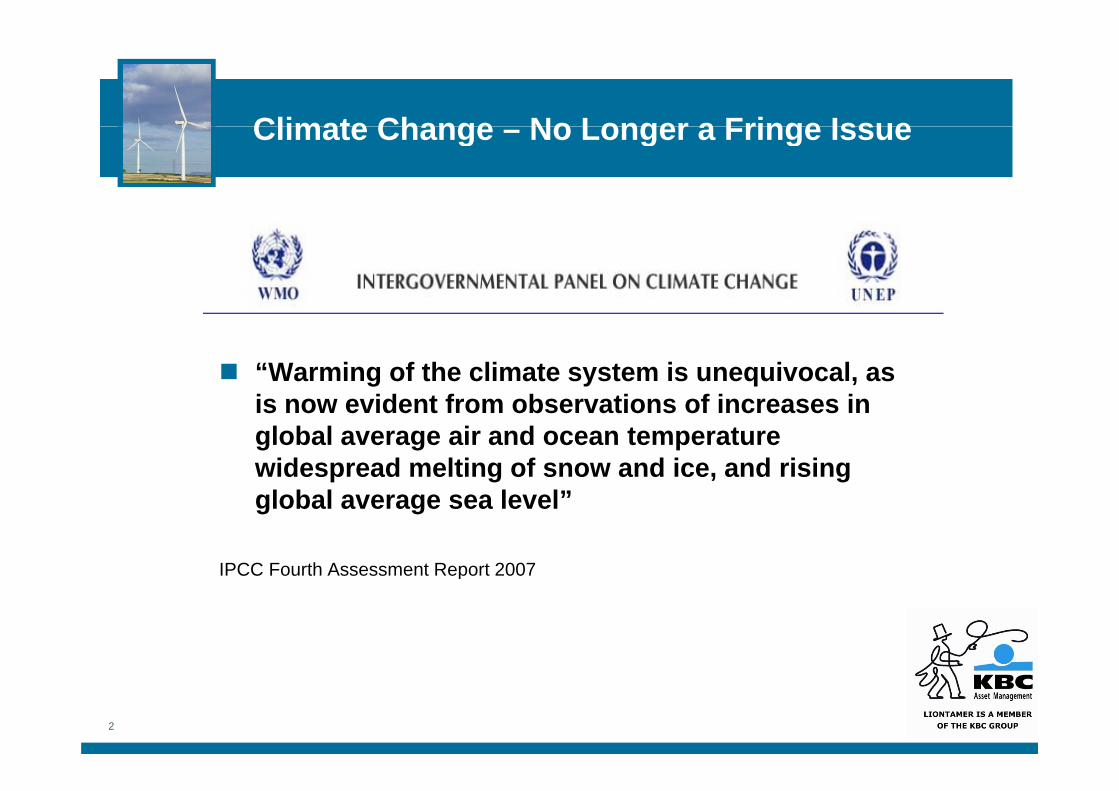
Climate Change No Longer a Fringe IssueClimate Change – No Longer a Fringe Issue
“Warming of the climate system is unequivocal, as i id t f b ti f i iis now evident from observations of increases in global average air and ocean temperature widespread melting of snow and ice, and rising global average sea level”
IPCC Fourth Assessment Report 2007IPCC Fourth Assessment Report 2007
2
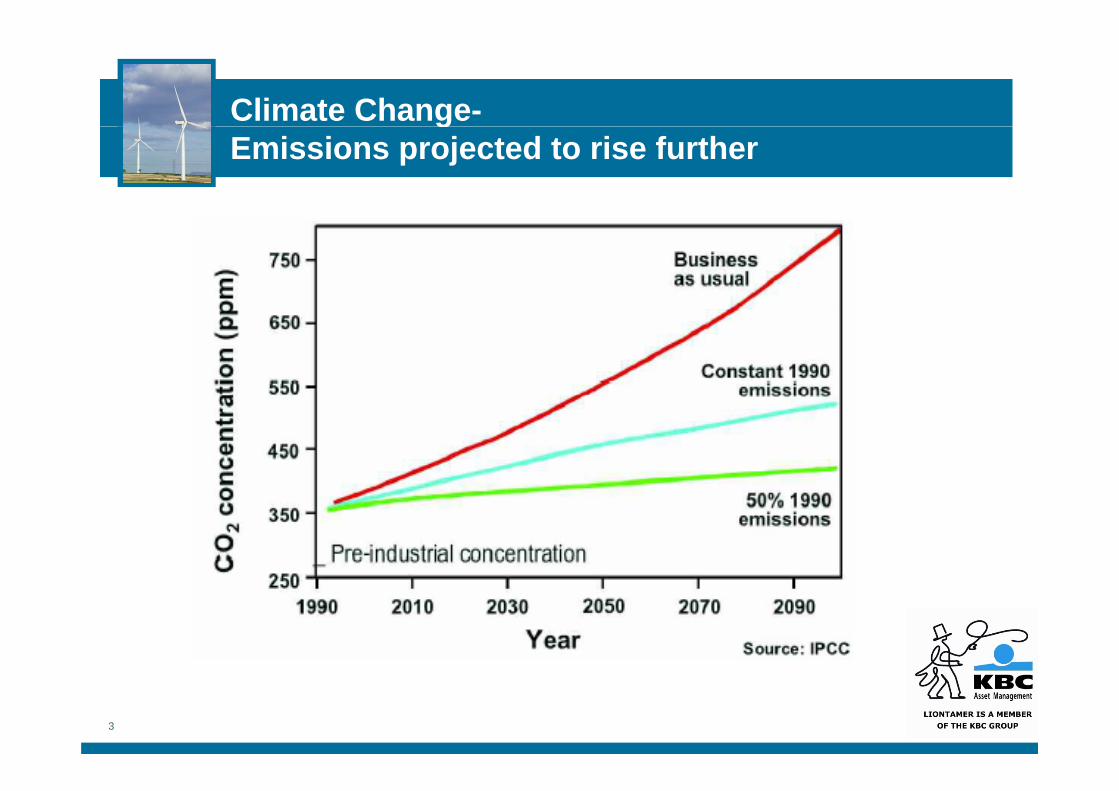
Climate Change-gEmissions projected to rise further
3
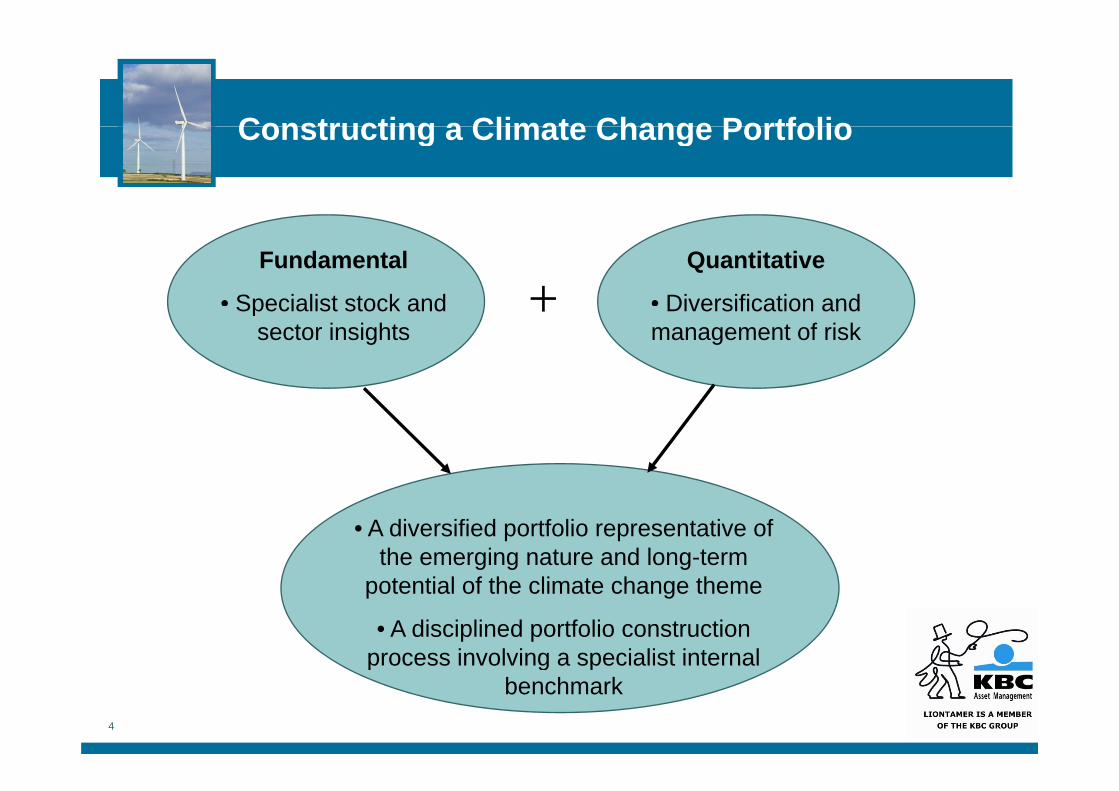
Constructing a Climate Change PortfolioConstructing a Climate Change Portfolio
Fundamental
• Specialist stock and
Quantitative
• Diversification and+Specialist stock and sector insights
Diversification and management of risk
+
• A diversified portfolio representative of the emerging nature and long-term
potential of the climate change theme
• A disciplined portfolio construction process involving a specialist internal
4
process involving a specialist internal benchmark
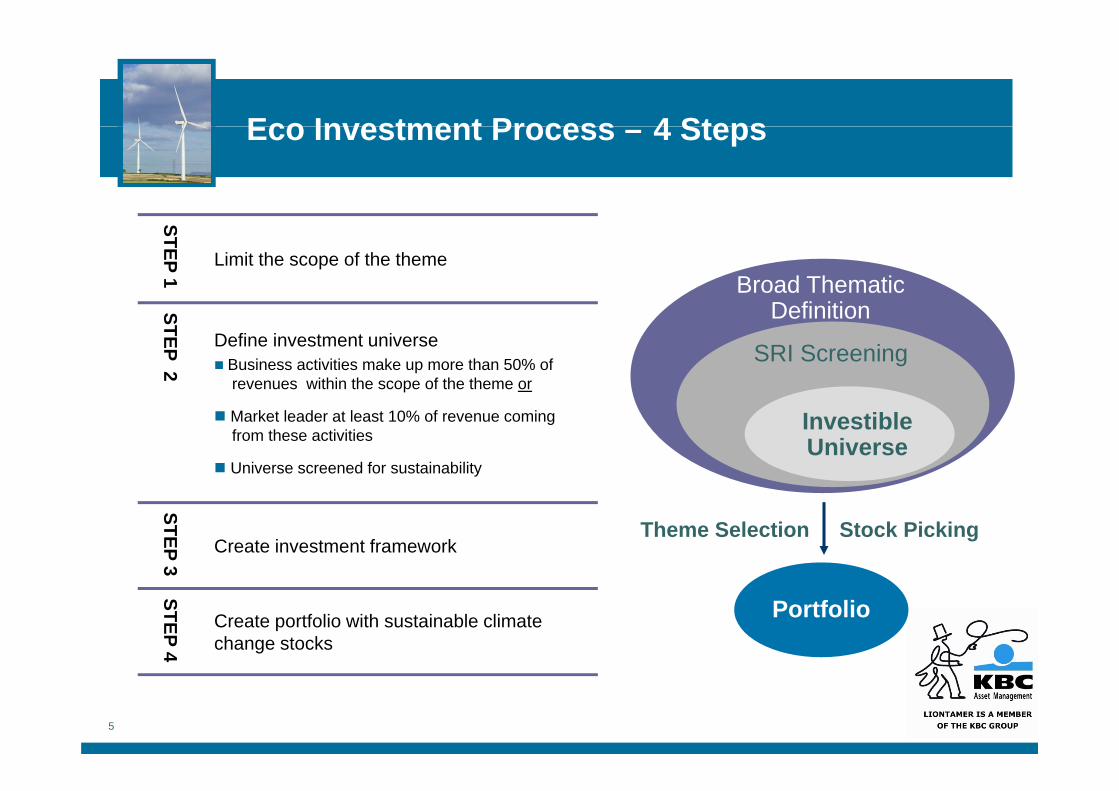
Eco Investment Process 4 StepsEco Investment Process – 4 Steps
STEP 1 Limit the scope of the themeBroad Thematic
DefinitionSTEP 2
Define investment universeBusiness activities make up more than 50% ofrevenues within the scope of the theme or
SRI Screening
Definition
Market leader at least 10% of revenue coming from these activities
Universe screened for sustainability
Investible Universe
STEP 3
Create investment frameworkTheme Selection Stock Picking
3STEP 4
Create portfolio with sustainable climate change stocks
Portfolio
5
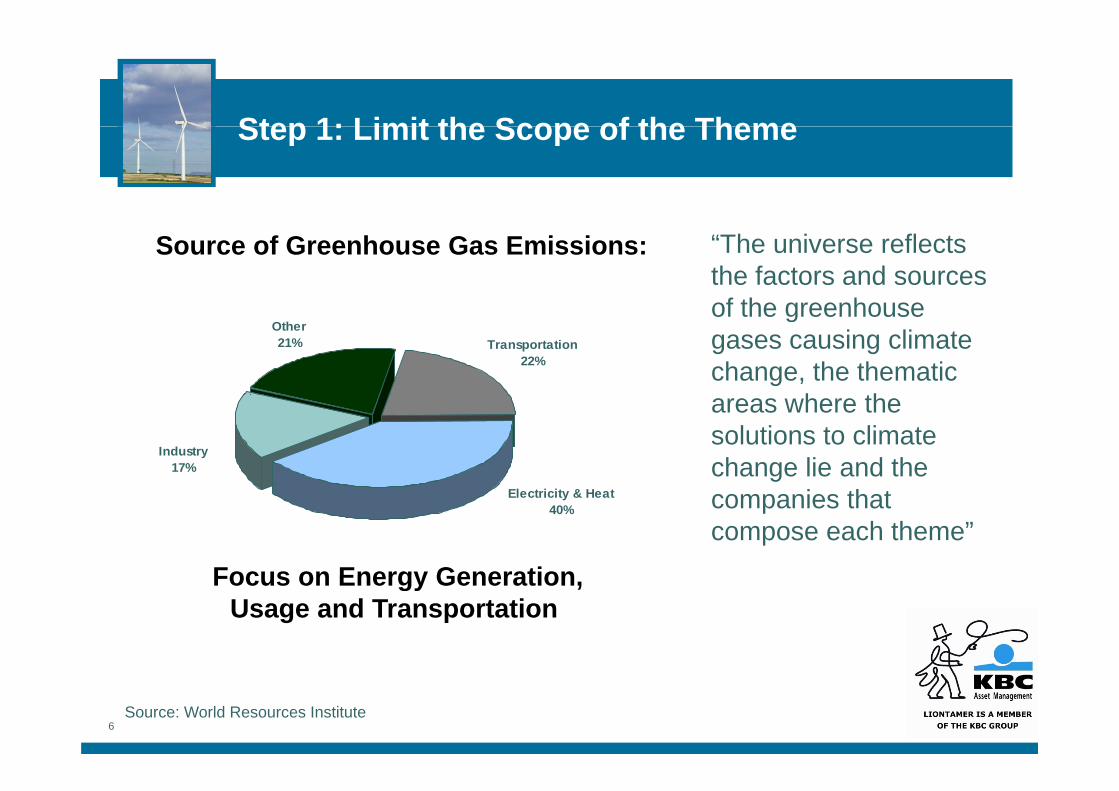
Step 1: Limit the Scope of the ThemeStep 1: Limit the Scope of the Theme
“The universe reflects the factors and sources of the greenhouse
Source of Greenhouse Gas Emissions:
Other21% Transportation
22%
of the greenhouse gases causing climate change, the thematic
h thIndustry
17%
areas where the solutions to climate change lie and the
Electricity & Heat40%
Focus on Energy Generation
companies that compose each theme”
Focus on Energy Generation,Usage and Transportation
6Source: World Resources Institute
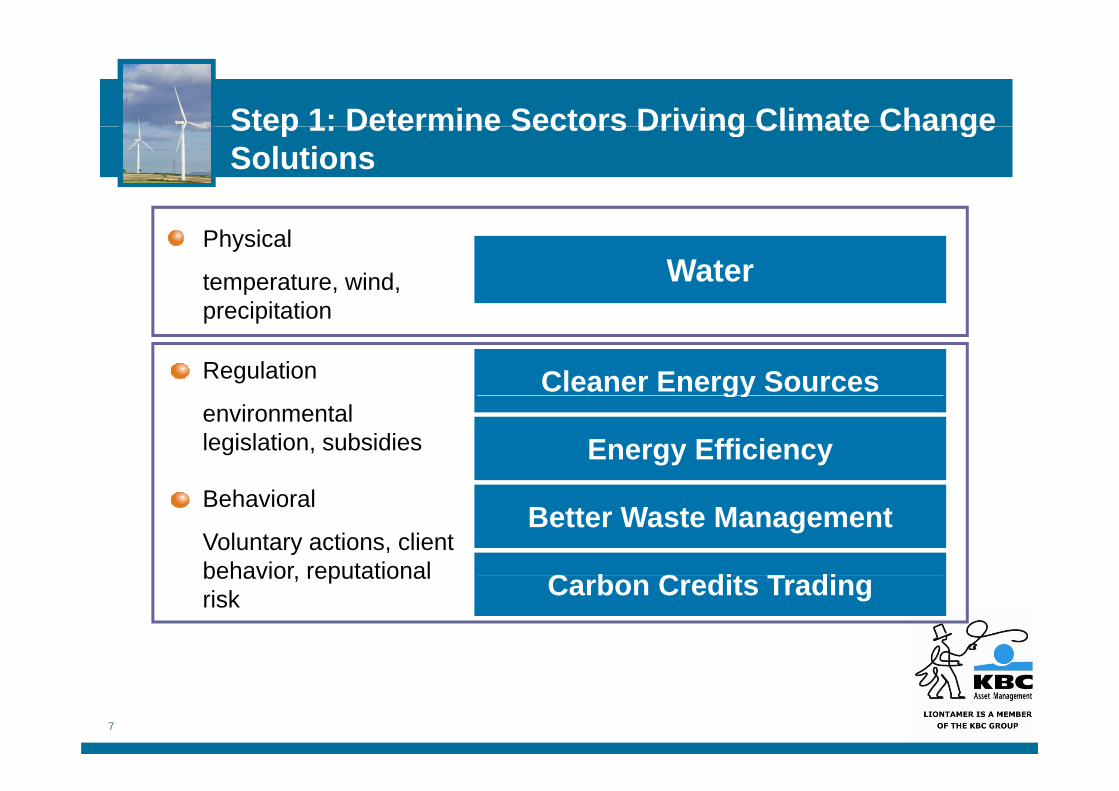
Step 1: Determine Sectors Driving Climate ChangeStep 1: Determine Sectors Driving Climate Change Solutions
WaterPhysical
temperature, wind, i it ti
Cleaner Energy Sources
precipitation
Regulation gy
Energy Efficiencyenvironmental legislation, subsidies
Better Waste Management
C b C dit T di
Behavioral
Voluntary actions, client behavior reputational Carbon Credits Tradingbehavior, reputational risk
7

Step 2: Define Investment UniverseStep 2: Define Investment Universe
Pure Plays - primary focus on product/service with an orientation towards climate change mitigation (+50% of revenues).)Market Leaders – diversified companies, market leaders within a particular ‘climate change’ sector (+10% and market leader)market leader)Universe screened for Social Responsible Investment (SRI) criteria:
Environmental ImpactNuclear EnergyHuman RightsMilitary IndustryCorporate Governance
8
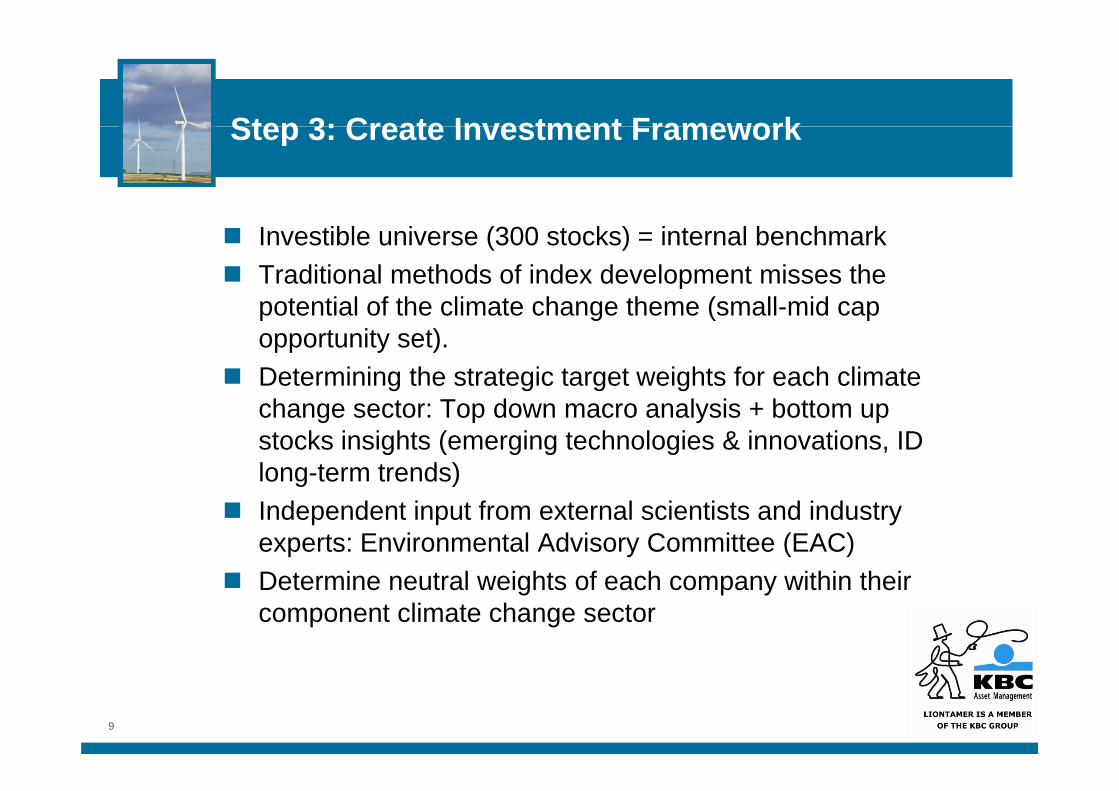
Step 3: Create Investment FrameworkStep 3: Create Investment Framework
Investible universe (300 stocks) = internal benchmarkTraditional methods of index development misses the potential of the climate change theme (small mid cappotential of the climate change theme (small-mid cap opportunity set).Determining the strategic target weights for each climate change sector: Top down macro analysis + bottom up stocks insights (emerging technologies & innovations, ID long-term trends)g )Independent input from external scientists and industry experts: Environmental Advisory Committee (EAC)D t i t l i ht f h ithi th iDetermine neutral weights of each company within their component climate change sector
9
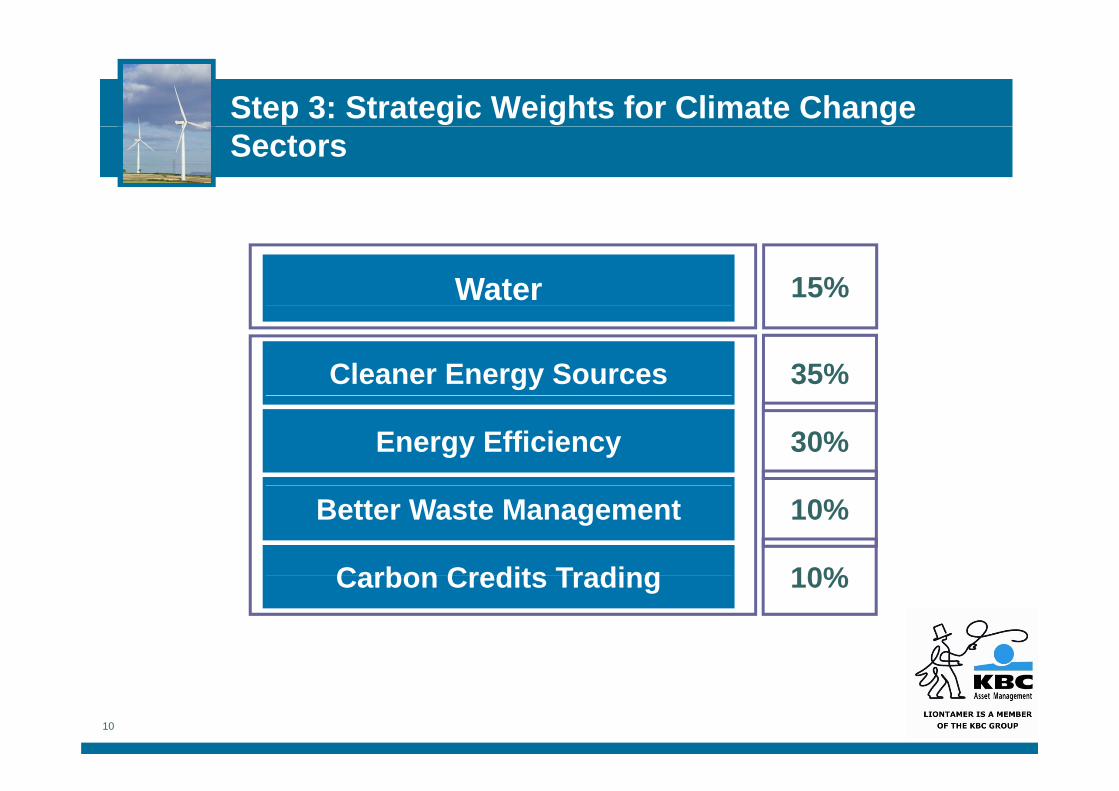
Step 3: Strategic Weights for Climate Change Sectors
Water 15%
Cleaner Energy Sources 35%
Energy Efficiency 30%
Better Waste Management
Carbon Credits Trading
10%
10%Carbon Credits Trading 10%
10

Step 3: Strategic Weight Energy Efficiency = 30%Step 3: Strategic Weight Energy Efficiency = 30%
Focus has been on alternative energy
BUTDefinition: Delivering the same or better output with reduced power consumption
Focus shifting to Energy Efficiency
I di t I t• Immediate Impact
• Multiplier effect
11
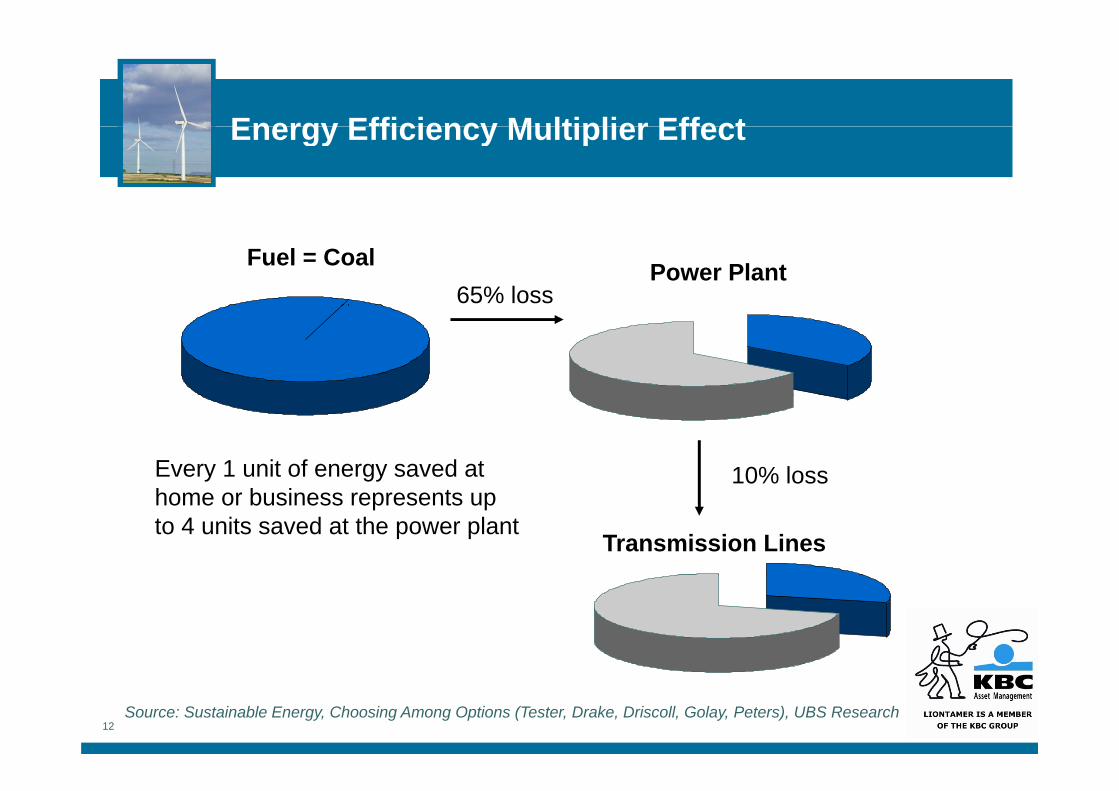
Energy Efficiency Multiplier EffectEnergy Efficiency Multiplier Effect
Fuel = Coal Power Plant65% loss
10% lossEvery 1 unit of energy saved at
Transmission Lines
home or business represents up to 4 units saved at the power plant
12Source: Sustainable Energy, Choosing Among Options (Tester, Drake, Driscoll, Golay, Peters), UBS Research
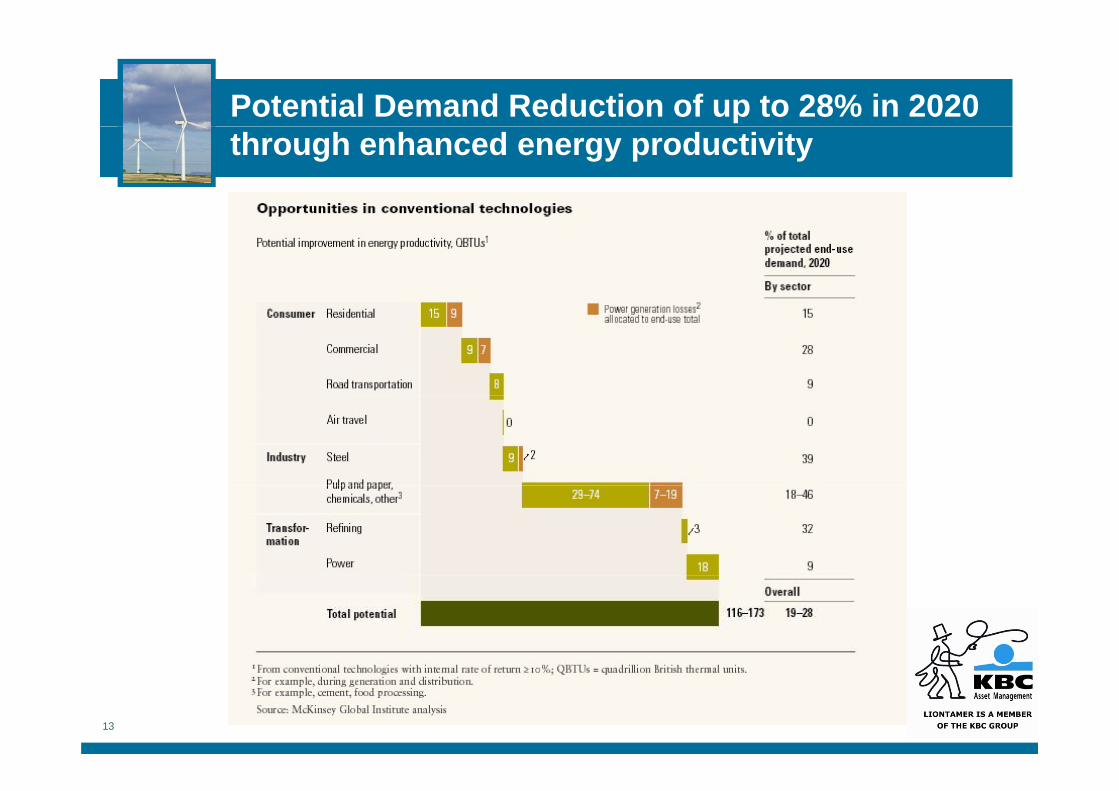
Potential Demand Reduction of up to 28% in 2020 through enhanced energy productivity
13
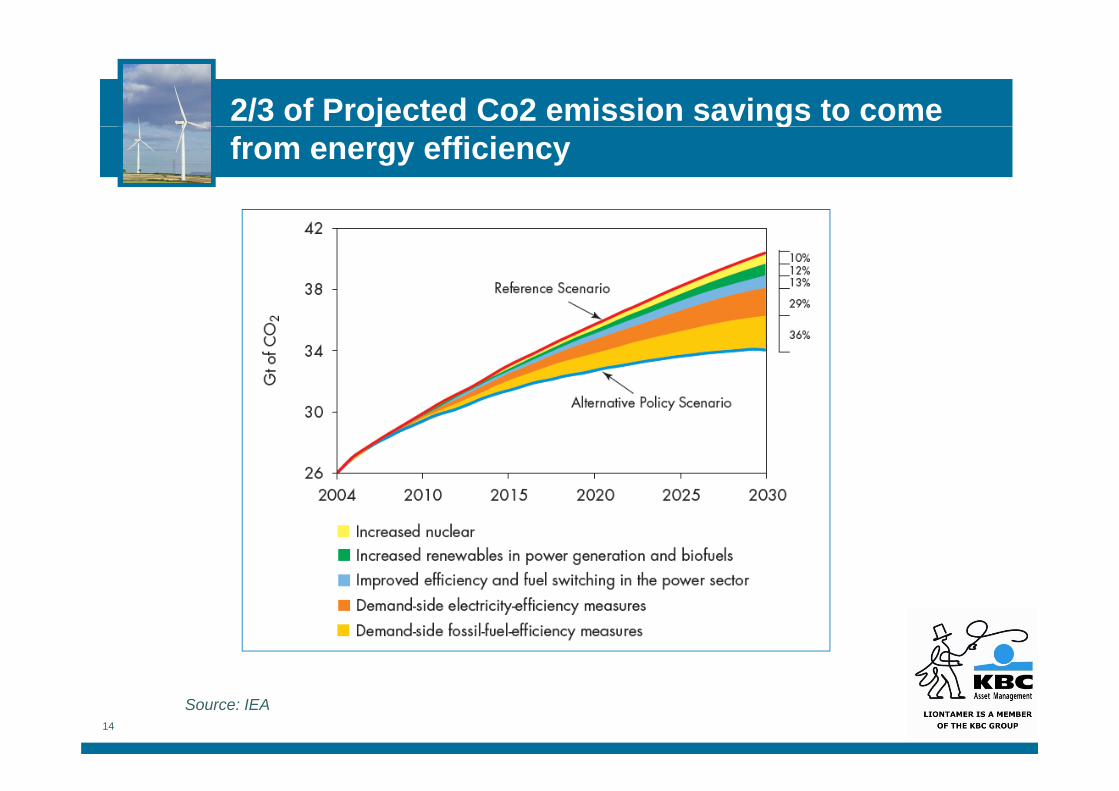
2/3 of Projected Co2 emission savings to come j gfrom energy efficiency
14
Source: IEA

Sectors where efficiency measures are most yproductive: Top down – Bottom up
Transport •Low Emission Cars•Biofuels•Mass Transportation Systems
•Umicore•D1 Oils•Canadian Nat.
Transport
B ildi •Insulation•Efficient Lighting•Water HeatingControl Light and Temp
•St Gobain•Phillips•Ceramic Fuel CellsSchneider
Buildings
•Control Light and Temp•Smart Mettering
•Combined Cycle Gas Turbine
•Schneider•Itron
•ABBPower Generation •Super Conducting Technologies
•Control & Instrumentation•Varibale Speed Drives & Motors
•American Super Conductor•Schneider•ABB
Generation, Transmission & Heavy Industry
•Varibale Speed Drives & Motors•Critiacl Power
•ABB•Emerson
15
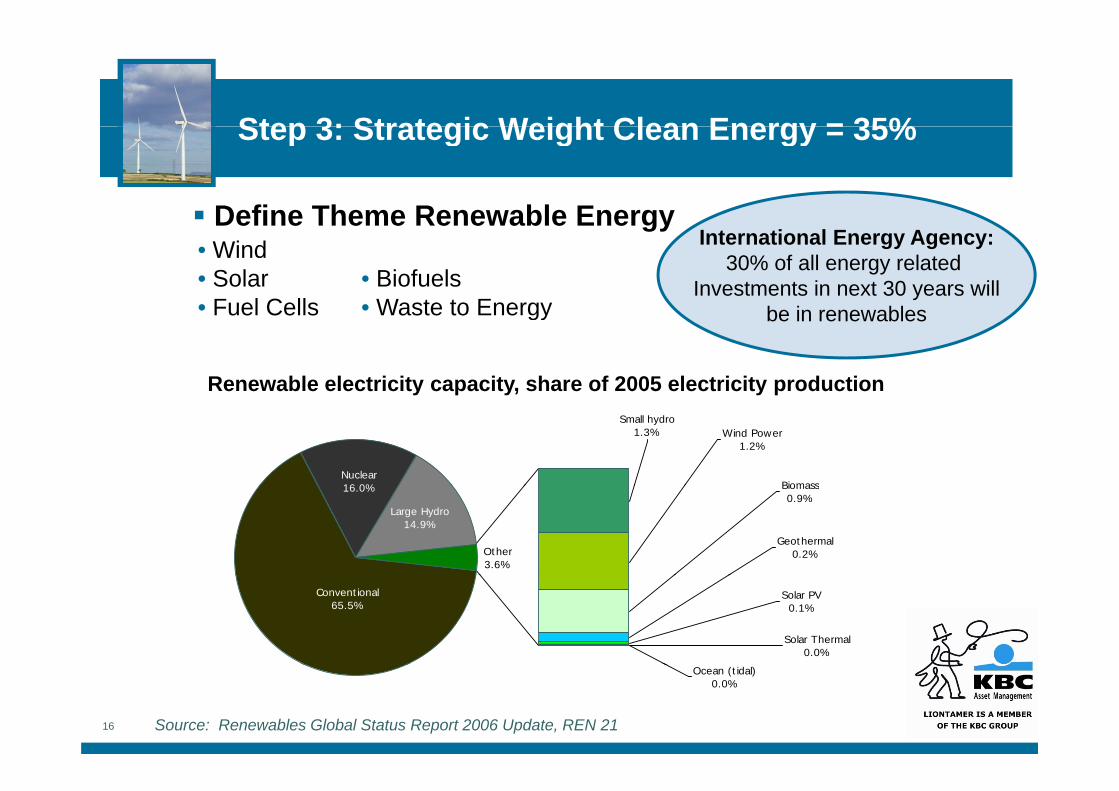
Step 3: Strategic Weight Clean Energy = 35%
Define Theme Renewable Energy
Step 3: Strategic Weight Clean Energy = 35%
Define Theme Renewable Energy• Wind• Solar • Biofuels• Fuel Cells • Waste to Energy
International Energy Agency:30% of all energy related
Investments in next 30 years will• Fuel Cells • Waste to Energy be in renewables
Renewable electricity capacity, share of 2005 electricity production
Nuclear16 0%
Small hydro1.3% Wind Power
1.2%
Biomass
Other3.6%
16.0%
Large Hydro14.9%
Geothermal0.2%
Biomass0.9%
Conventional65.5%
Solar Thermal0.0%
Solar PV0.1%
16
Ocean (tidal)0.0%
Source: Renewables Global Status Report 2006 Update, REN 21

Multi-Layer: Sectors within Clean Energy y gySources
Utilities 15%
Wind Energy 30%
Solar 30%
10%
Fuel Cells
Bio Fuels
10%
10%Bio Fuels
Other (Emerging Technologies) 5%
17
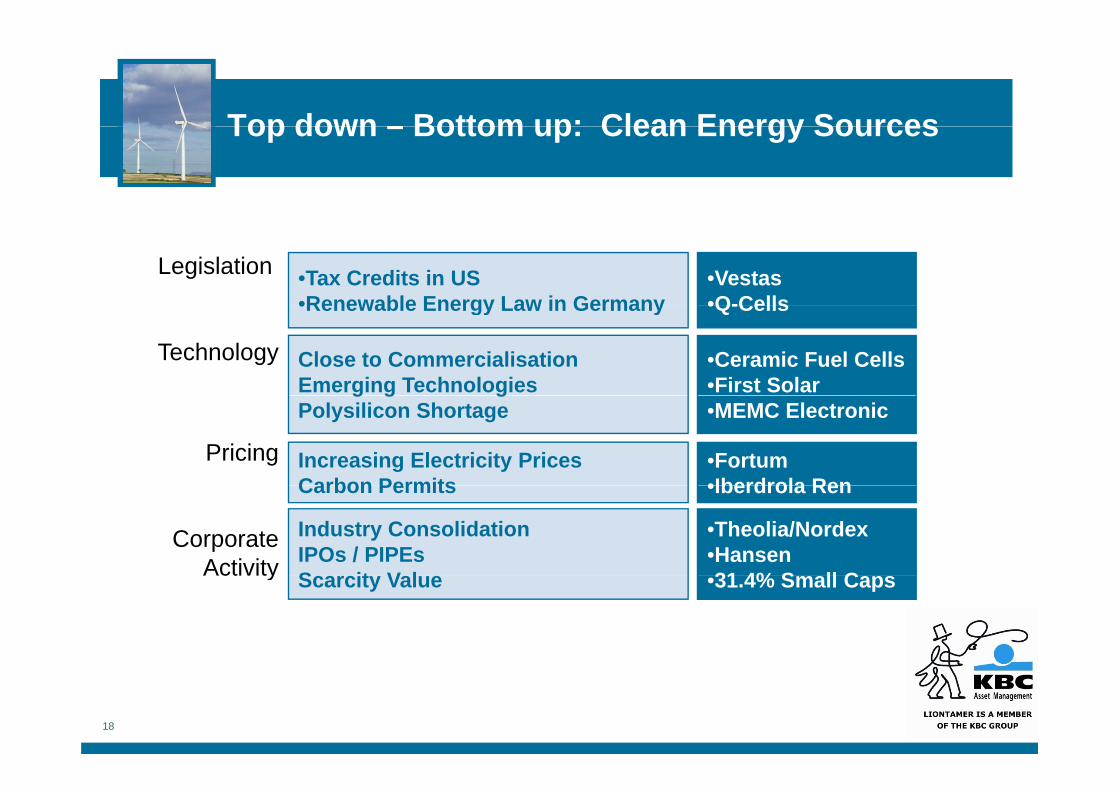
Top down – Bottom up: Clean Energy SourcesTop down – Bottom up: Clean Energy Sources
Legislation •Tax Credits in US•Renewable Energy Law in Germany
•Vestas•Q-Cells
Technology
•Renewable Energy Law in Germany
Close to CommercialisationEmerging Technologies
•Q-Cells
•Ceramic Fuel Cells•First Solar
Pricing
g g gPolysilicon Shortage
Increasing Electricity PricesCarbon Permits
•MEMC Electronic
•Fortum•Iberdrola Ren
Corporate Activity
Carbon Permits
Industry ConsolidationIPOs / PIPEsS it V l
•Iberdrola Ren
•Theolia/Nordex•Hansen 31 4% S ll CActivity Scarcity Value •31.4% Small Caps
18

Solar Industry US$10 billion marketSolar Industry – US$10 billion market
Expected growth rate – 20%+ growth a yearExpected growth rate 20%+ growth a year
19 Source: Citigroup, Solar Power Industry, Oct 2006
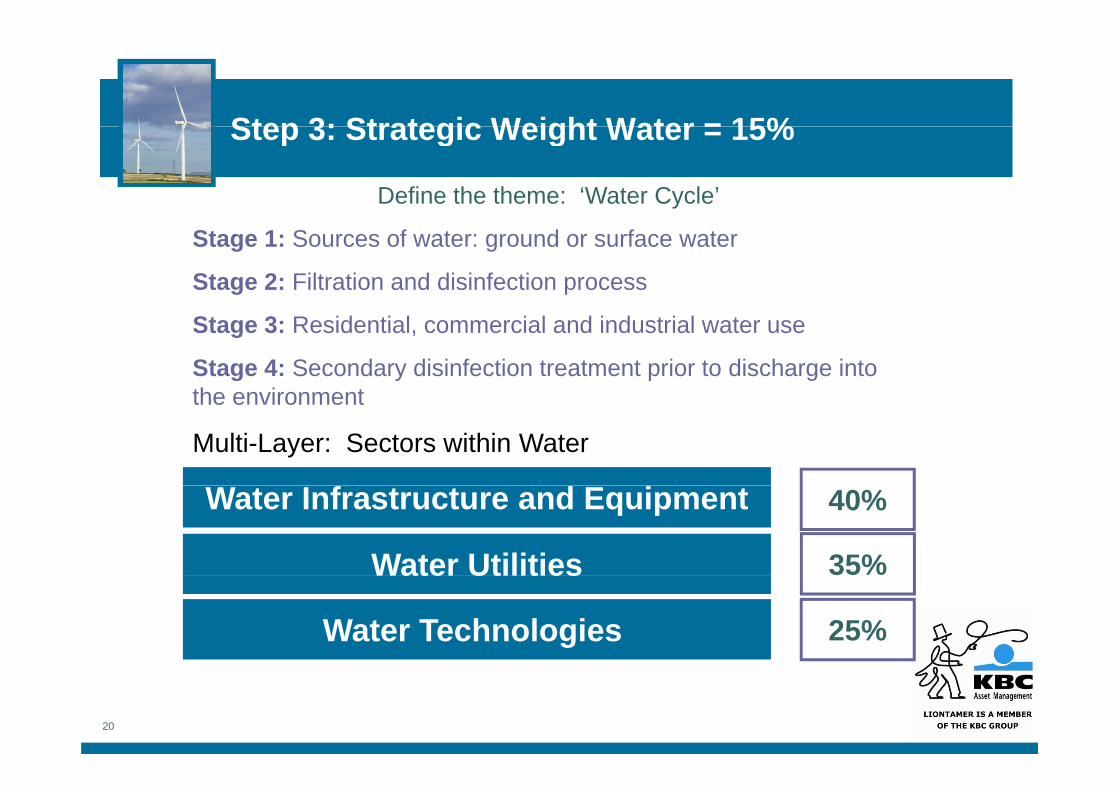
Step 3: Strategic Weight Water = 15%Step 3: Strategic Weight Water = 15%
Define the theme: ‘Water Cycle’
Stage 1: Sources of water: ground or surface water
Stage 2: Filtration and disinfection process
Stage 3: Residential, commercial and industrial water use
Stage 4: Secondary disinfection treatment prior to discharge into the environmentthe environment
Multi-Layer: Sectors within Water
35%
Water Infrastructure and Equipment
Water Utilities
40%
%Water Utilities
Water Technologies 25%
20

Top down – Bottom up: WaterTop down – Bottom up: Water
Infrastructure investmentRepair/replacing and maintenance Increased water consumption per capita
FlowserveWavin
Roper Industries
Urban Demand Growth
Desalination
Water PricingVisibility Within Regulated Utilities
Veolia
SabespPennonPrice Increase Visibility Within Regulated Utilities
Infrastructure, design of water systemsMunicipals outsourcing water treament
Pennon
United UtilitiesArcadis
Outsourcingp g
Analytics for quality and safetyFiltration treatment (legislation)
MilliporeKurita
Tech & Analytics
Metering for increased efficiency/charges Badger Meter, Itron
Scarcity Value 45% Small CapsConsolidation
21
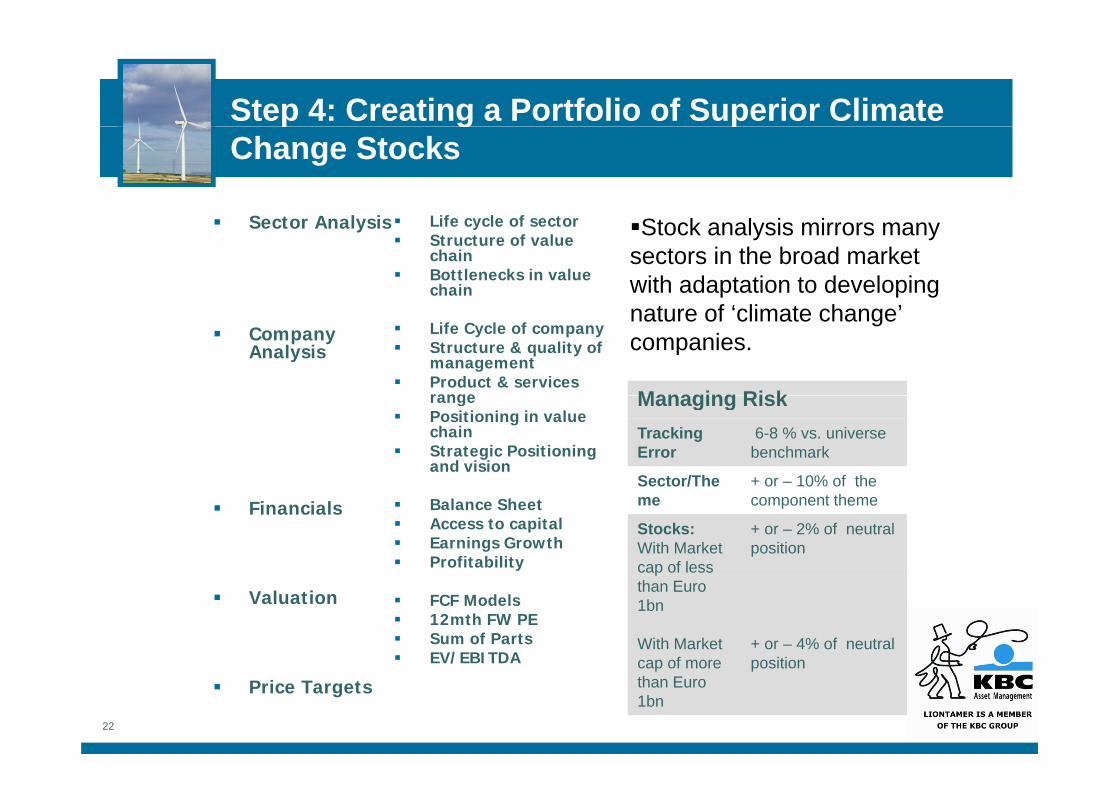
Step 4: Creating a Portfolio of Superior Climate p g pChange Stocks
S t A l i Lif l f tSector Analysis Stock analysis mirrors many sectors in the broad market with adaptation to developing
t f ‘ li t h ’
Life cycle of sectorStructure of value chainBottlenecks in value chain
Company Analysis
nature of ‘climate change’ companies.
Managing Risk
Life Cycle of companyStructure & quality of managementProduct & services range Managing Risk
Tracking Error
6-8 % vs. universe benchmark
Sector/The + or – 10% of the
rangePositioning in value chainStrategic Positioning and vision
FinancialsSector/Theme
or 10% of the component theme
Stocks:With Market cap of less
+ or – 2% of neutral position
Balance SheetAccess to capitalEarnings GrowthProfitability
Valuation
pthan Euro 1bn
With Market cap of more
+ or – 4% of neutral position
FCF Models12mth FW PESum of PartsEV/EBITDA
22
Price Targetscap of more than Euro 1bn
position/
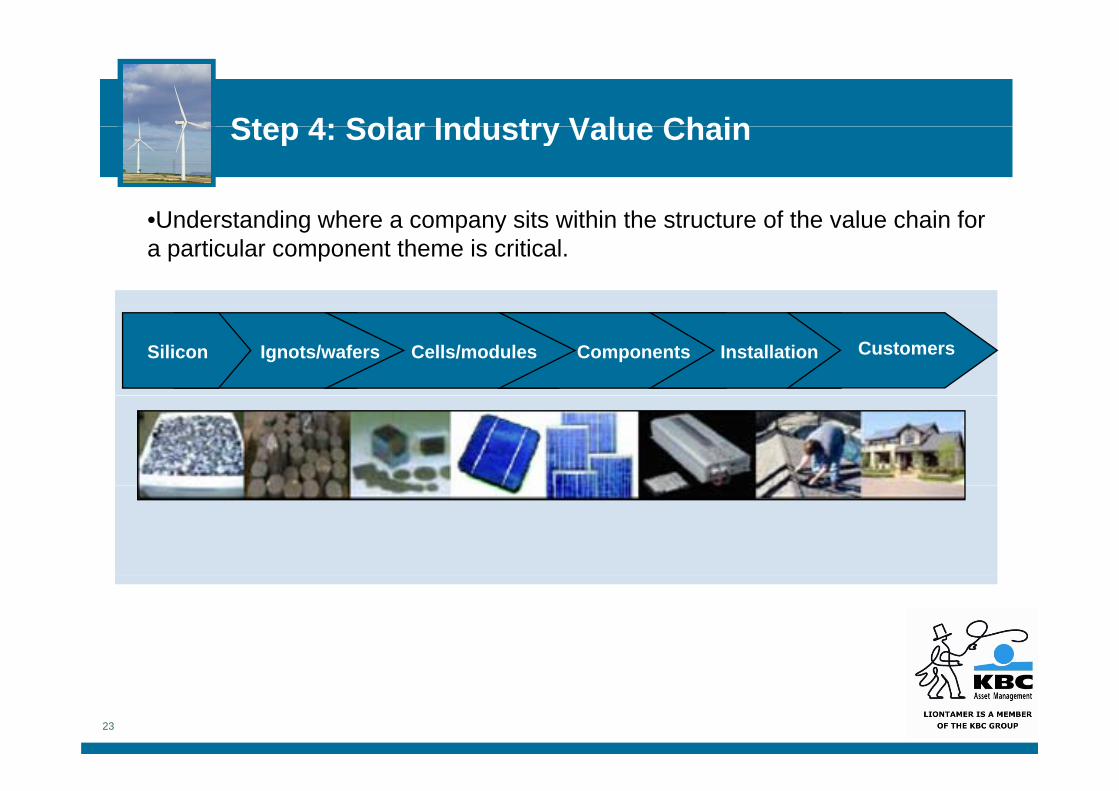
Step 4: Solar Industry Value ChainStep 4: Solar Industry Value Chain
Understanding where a company sits within the structure of the value chain for•Understanding where a company sits within the structure of the value chain for a particular component theme is critical.
Ignots/wafers Cells/modules Components InstallationSilicon Customers
23
ConclusionConclusion
Climate change solutions represent an investment opportunity. Identify the key sectors associated with climate changeIdentify the key sectors associated with climate changeIdentify the stocks best positioned to deliver innovative solutions within each sectorCombining fundamental insights with the creative use of quantitative techniques is key for:
analyzing and defining sectors within themesanalyzing and defining sectors within themesconstructing an investment universe/benchmark that represents the true potential of the Climate Change theme.b ildi di ifi d tf li f i t k th t b tbuilding diversified portfolios of superior stocks that are best positioned to deliver strong long term returns within a coherent risk control framework.
24
Q&AQ&A
Questions?
25

Liontamer & KBC Asset ManagementLiontamer & KBC Asset Management
Liontamer Investments Limited (AFSL: 306682) is the Australian registered subsidiary of KBC Asset Management NV (KBCAM)KBCAM’s advantages in the ECO investments space:
a pioneering firm in Eco investing globallya pioneering firm in Eco investing globallyexperienced and dedicated specialist team of ECO Portfolio Managersindependent input by experienced scientists and industry experts of the Environmental Advisory Committee (EAC)Environmental Advisory Committee (EAC)Socially Responsible Investing (SRI) is a core competenceover 7 years experience in constructing and maintaining an Eco investment universelong established contact network with niche brokers
For further information please contact:
Simon PadleyHead of Sales and Distribution, Liontamer Investments [email protected]: 1800 806 667
26
Let’s start thinking about…
This session was:1. awful2. mediocre3 good3. good4. excellent
Gizmos brought to you by
Let’s start thinking about…
Time’s Up!This session was:1. awful2. mediocre3 good3. good4. excellent
Gizmos brought to you by
DisclaimersDisclaimers
The material in this document contains comments of a general nature only and should notThe material in this document contains comments of a general nature only and should not be relied upon as giving any specific or general investment or financial or taxation advice of any nature. Always seek financial and taxation advice before investing.
This presentation and its contents have been prepared to the best of the knowledge and belief of Liontamer Investments Limited (Liontamer). In preparing this presentation Liontamer may have used data or opinions sourced from third parties. We do not accept any responsibility for any investment decisions or actions made by you as a result of theany responsibility for any investment decisions or actions made by you as a result of the data and opinions provided.
I addition neither Lionatmer, nor any officer, employee or representative:y p y p•makes any warranty, express or implied, as to the accuracy, reliability or completeness of the material contained in this document;•takes any responsibility for any inference, interpretation, opinion or conclusion that you may draw or form from the information in this document; ormay draw or form from the information in this document; or•is liable to compensate or reimburse you for any liabilities, costs or expenses incurred in connection with evaluating or making an investment decision.
29