Embed Size (px)
Citation preview

Love Panic
Gerry Fowler, CFAHead of Equity & Derivative Strategy
October 2013
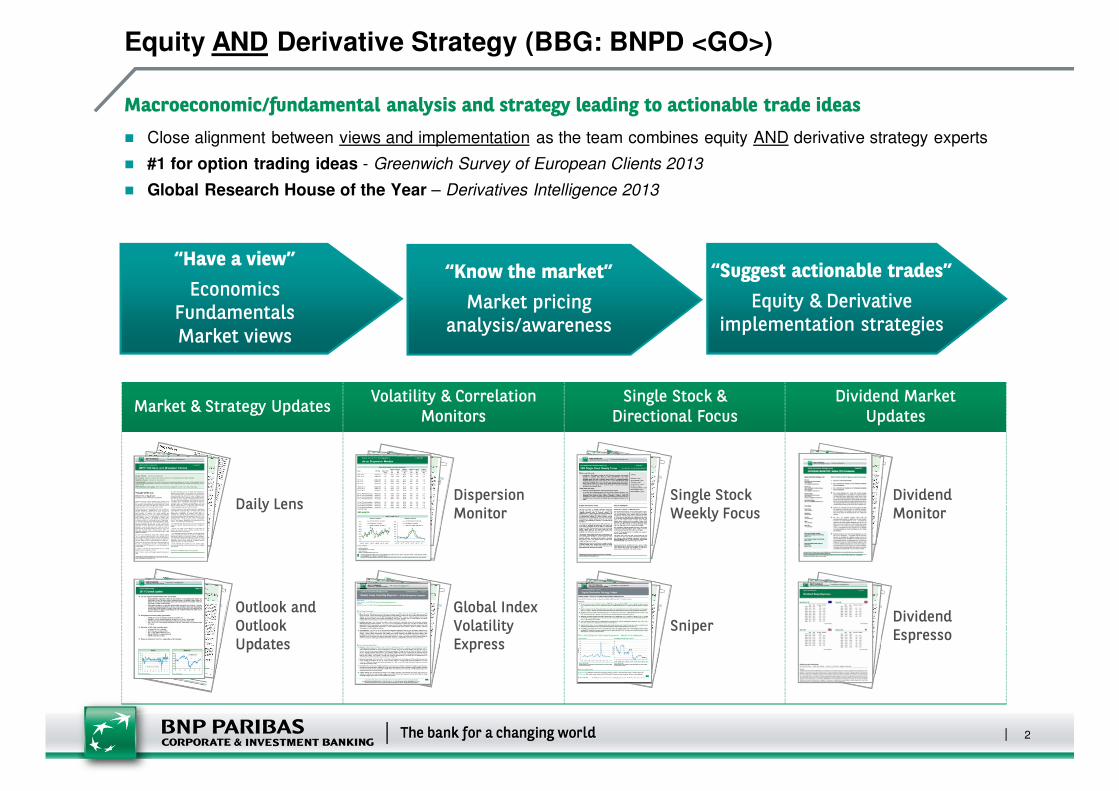
Macroeconomic/fundamental analysis and strategy leading to actionable trade ideas
� Close alignment between views and implementation as the team combines equity AND derivative strategy experts
� #1 for option trading ideas - Greenwich Survey of European Clients 2013
� Global Research House of the Year – Derivatives Intelligence 2013
Equity AND Derivative Strategy (BBG: BNPD <GO>)
“Have a view”
EconomicsFundamentalsMarket views
“Know the market”
Market pricing analysis/awareness
“Suggest actionable trades”
Equity & Derivative implementation strategies
Market & Strategy UpdatesVolatility & Correlation
MonitorsSingle Stock &
Directional FocusDividend Market
Updates
Daily Lens
Outlook andOutlook Updates
Dispersion Monitor
Global Index Volatility Express
Single Stock Weekly Focus
Sniper
Dividend Monitor
Dividend Espresso
2
Contents
Love-Panic
1. The importance of sentiment
2. Measuring sentiment
3. A hedging strategy for long only managers
Phase Attribution Model
4. Quantitative long/short sector investing using sentiment phasing
5. An option strategy for long/short managers
3
1. The importance of sentiment
4
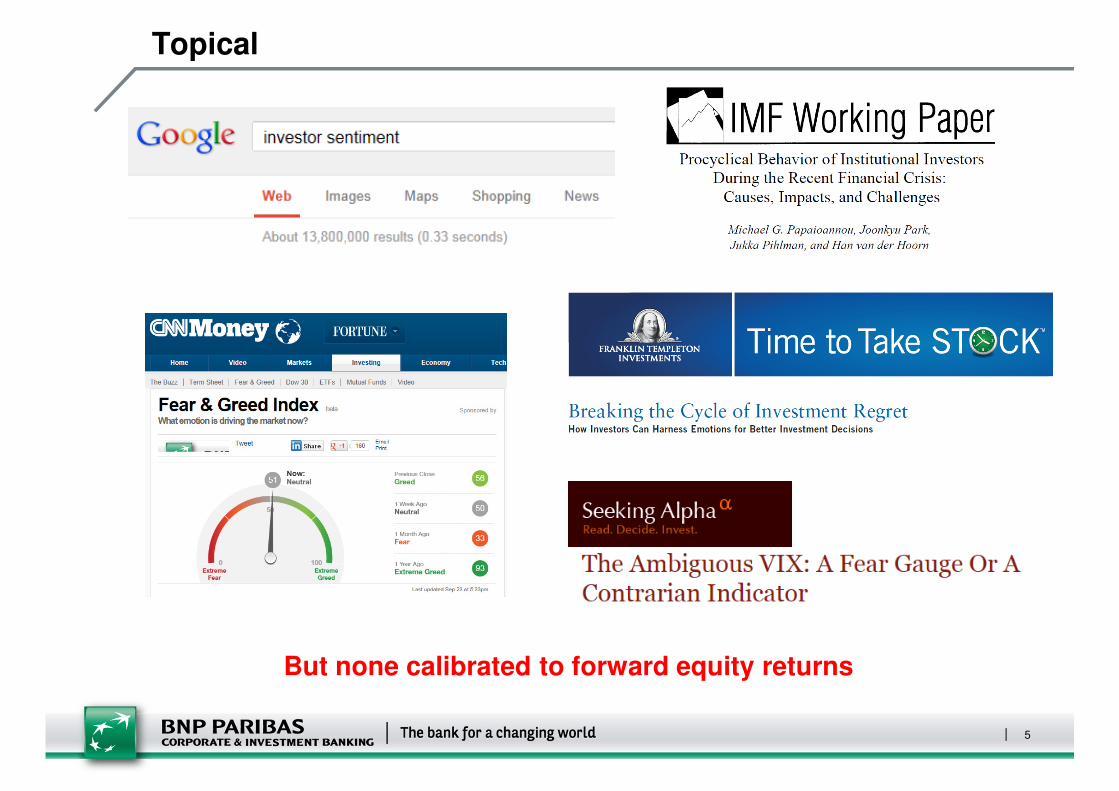
Topical
But none calibrated to forward equity returns
5
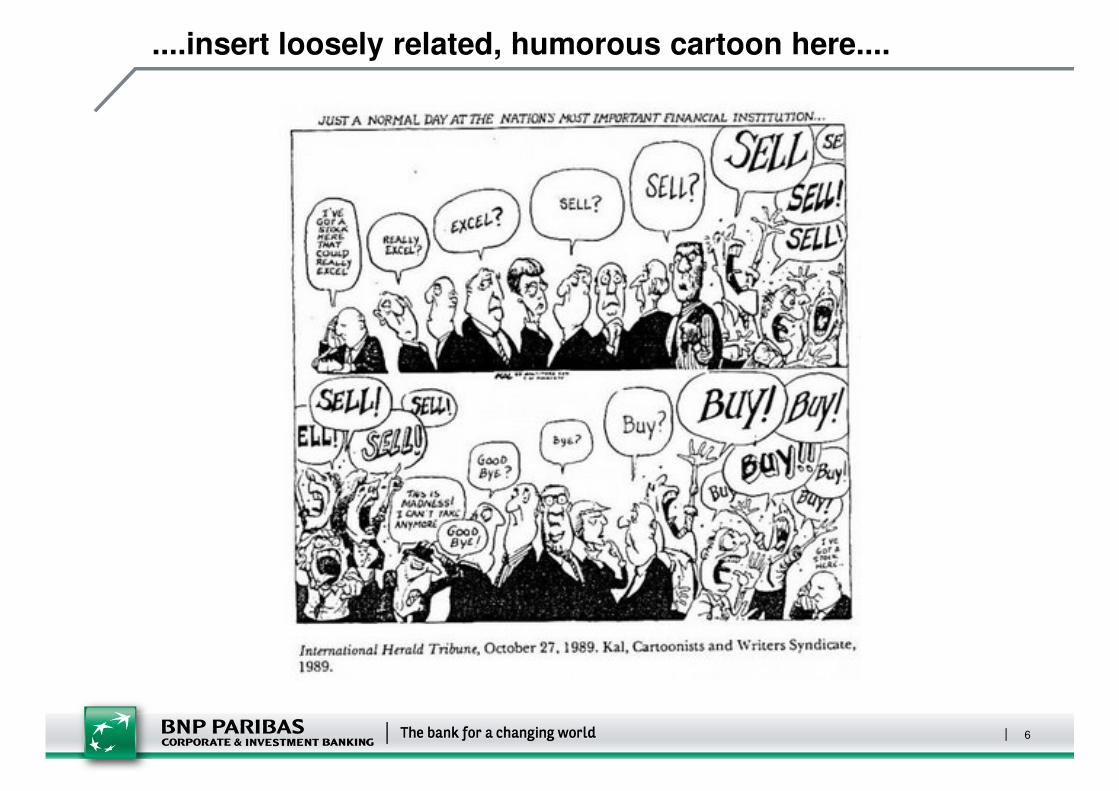
....insert loosely related, humorous cartoon here....
6
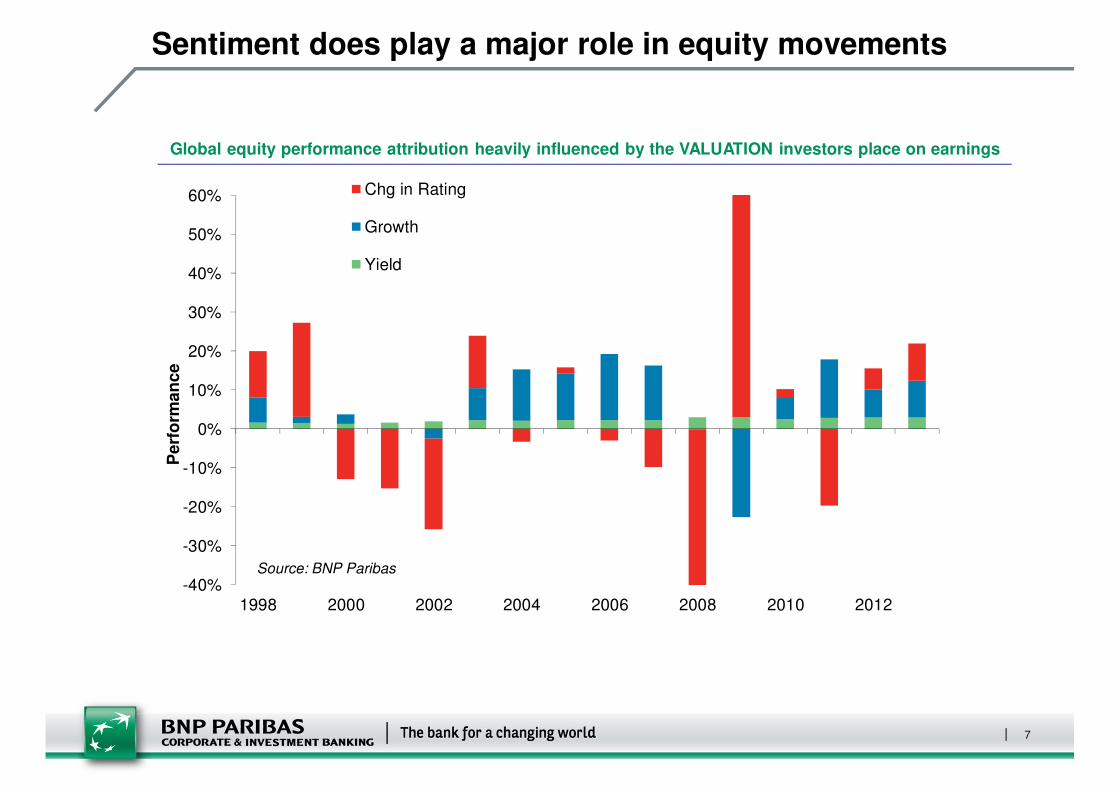
Sentiment does play a major role in equity movements
-40%
-30%
-20%
-10%
0%
10%
20%
30%
40%
50%
60%
1998 2000 2002 2004 2006 2008 2010 2012
Chg in Rating
Growth
Yield
Global equity performance attribution heavily influenced by the VALUATION investors place on earnings
Pe
rfo
rma
nc
e
Source: BNP Paribas
7
2. Measuring sentiment
8
Enter Love-Panic
Popular sentiment indicators have short-comings
� Not calibrated to equity market performance (CESI)
� Sentiment isolation is ambiguous (VIX, market volumes, advance/decline indices)
� Single indicators measure factors that are often too specific (NYSE margin debt, AAII bull/bear surveys, fund flows etc)
� Combination indices use equal/constant weightings (CNN)
Love-Panic solutions
� Calibrated to 6-mth forward equity market returns
� Combines multiple sentiment factors to remove idiosyncratic non-sentiment drivers
� Dynamically weights components according to their historical predictive strength
Love-Panic construction
� Identify indices (that are subjectively related to sentiment) with 3-yr z-scores negatively correlated to 6-mth forward equity returns
� Weight their individual predictive success across three phases (love, panic and neutral levels).
� Combine their historical levels at the appropriate phased weighting into the Love-Panic index. Individual factor weightings vary from 0-11% of the total index calculation.
� Testing period 2005 to May 2010
9

Individual indicators “hit and miss”
Smallcap outperformance of largecaps CBOE put/call ratio
+12 other indicators
Fund flow into US equities
Source: BNP Paribas
State Street Investor Confidence
Source: BNP Paribas
Source: BNP ParibasSource: BNP Paribas
10
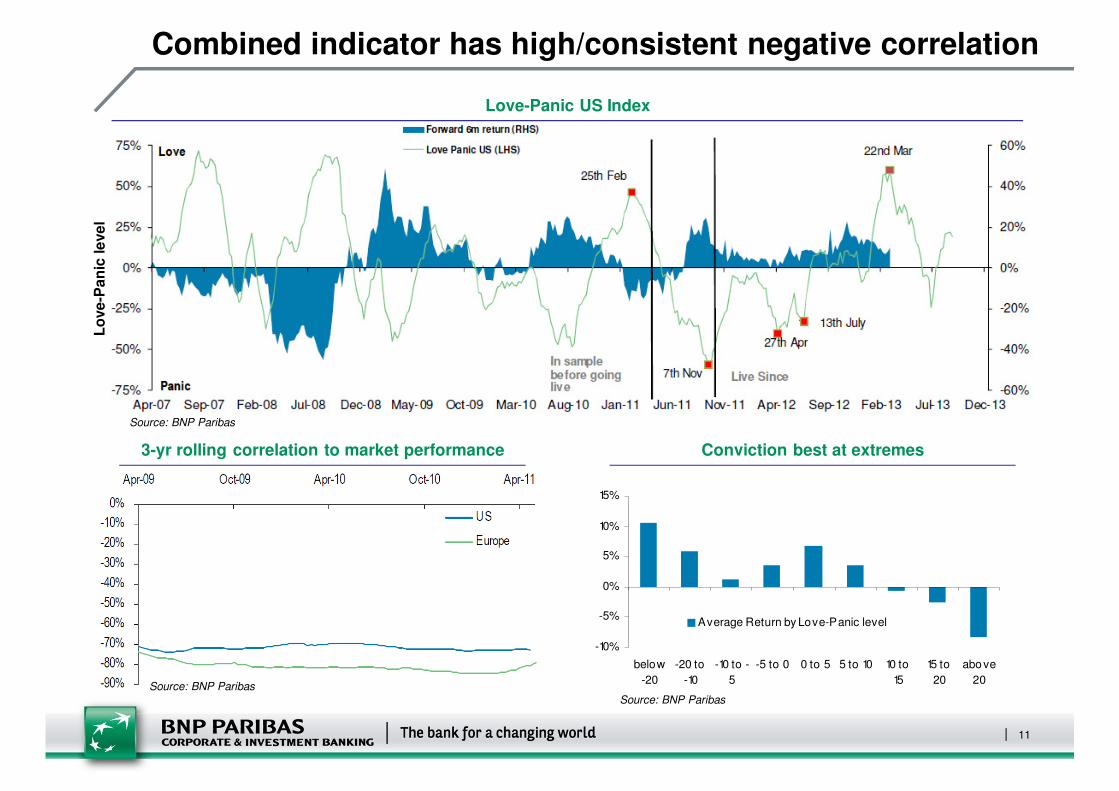
Combined indicator has high/consistent negative correlation
Love-Panic US Index
3-yr rolling correlation to market performance
-10%
-5%
0%
5%
10%
15%
below
-20
-20 to
-10
-10 to -
5
-5 to 0 0 to 5 5 to 10 10 to
15
15 to
20
above
20
Average Return by Love-Panic level
Conviction best at extremes
Lo
ve
-Pa
nic
le
ve
l
Source: BNP Paribas
Source: BNP Paribas
Source: BNP Paribas
11
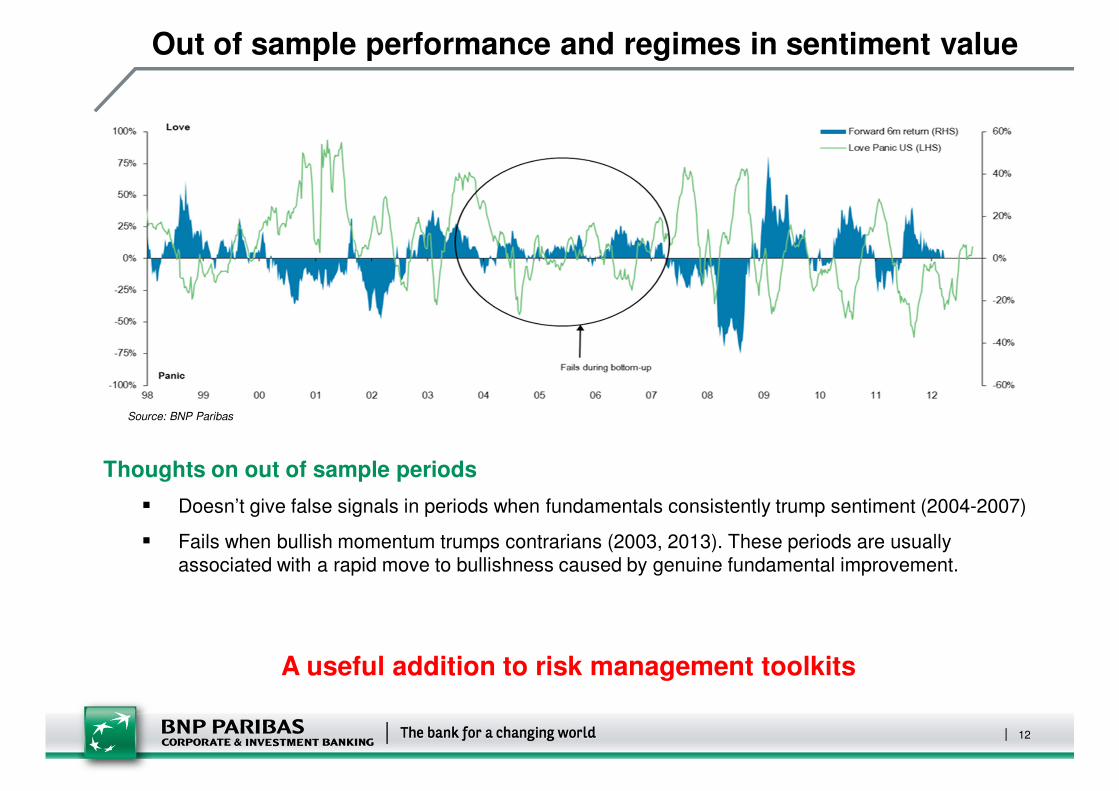
Out of sample performance and regimes in sentiment value
Thoughts on out of sample periods
� Doesn’t give false signals in periods when fundamentals consistently trump sentiment (2004-2007)
� Fails when bullish momentum trumps contrarians (2003, 2013). These periods are usually associated with a rapid move to bullishness caused by genuine fundamental improvement.
A useful addition to risk management toolkits
Source: BNP Paribas
12
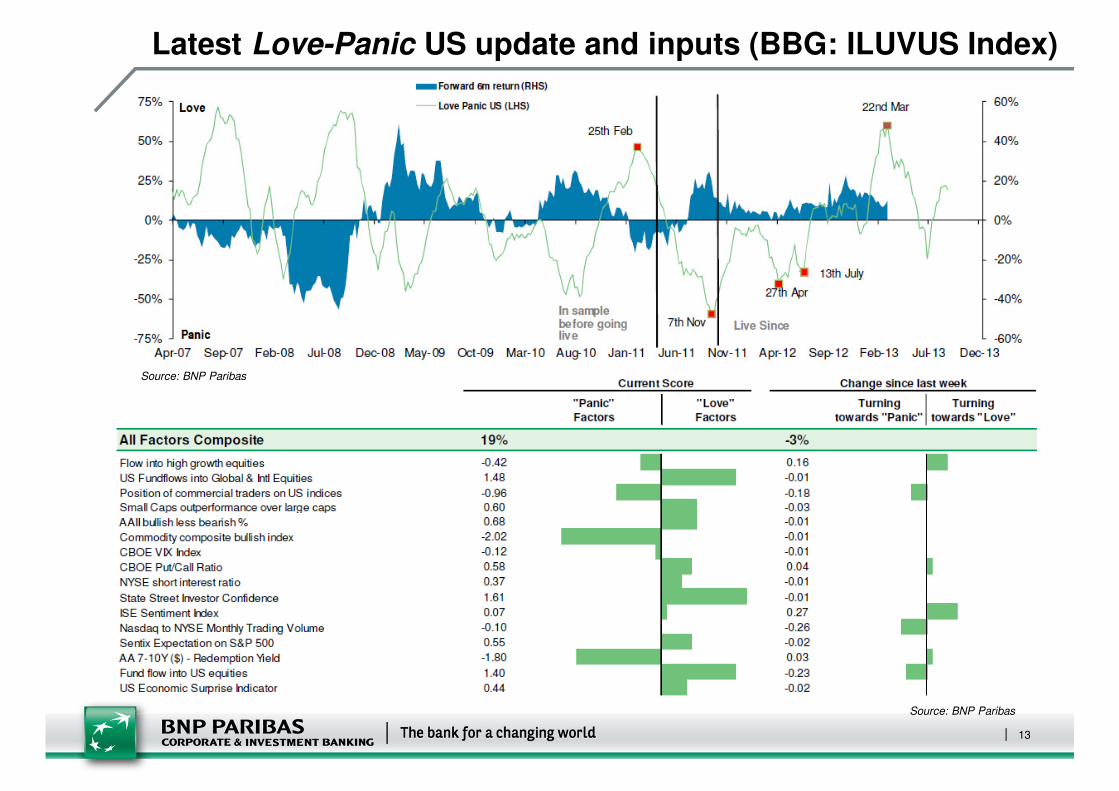
Latest Love-Panic US update and inputs (BBG: ILUVUS Index)
Source: BNP Paribas
Source: BNP Paribas
13
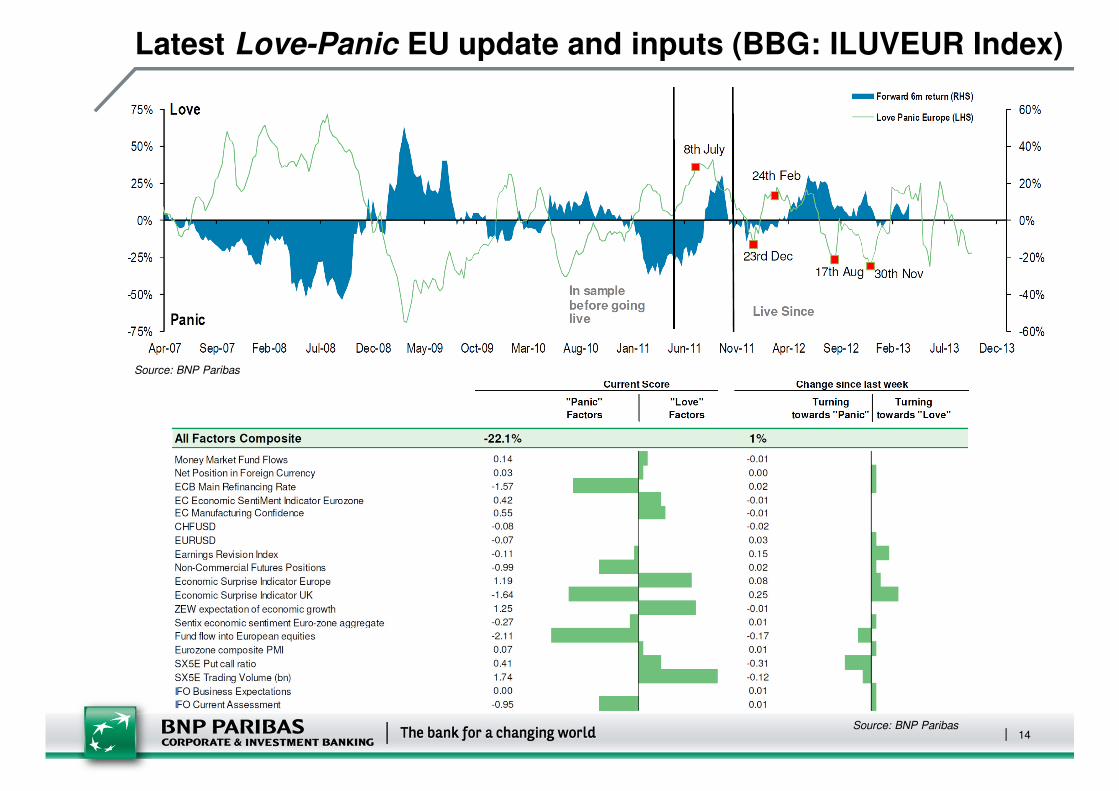
Latest Love-Panic EU update and inputs (BBG: ILUVEUR Index)
Source: BNP Paribas
Source: BNP Paribas14
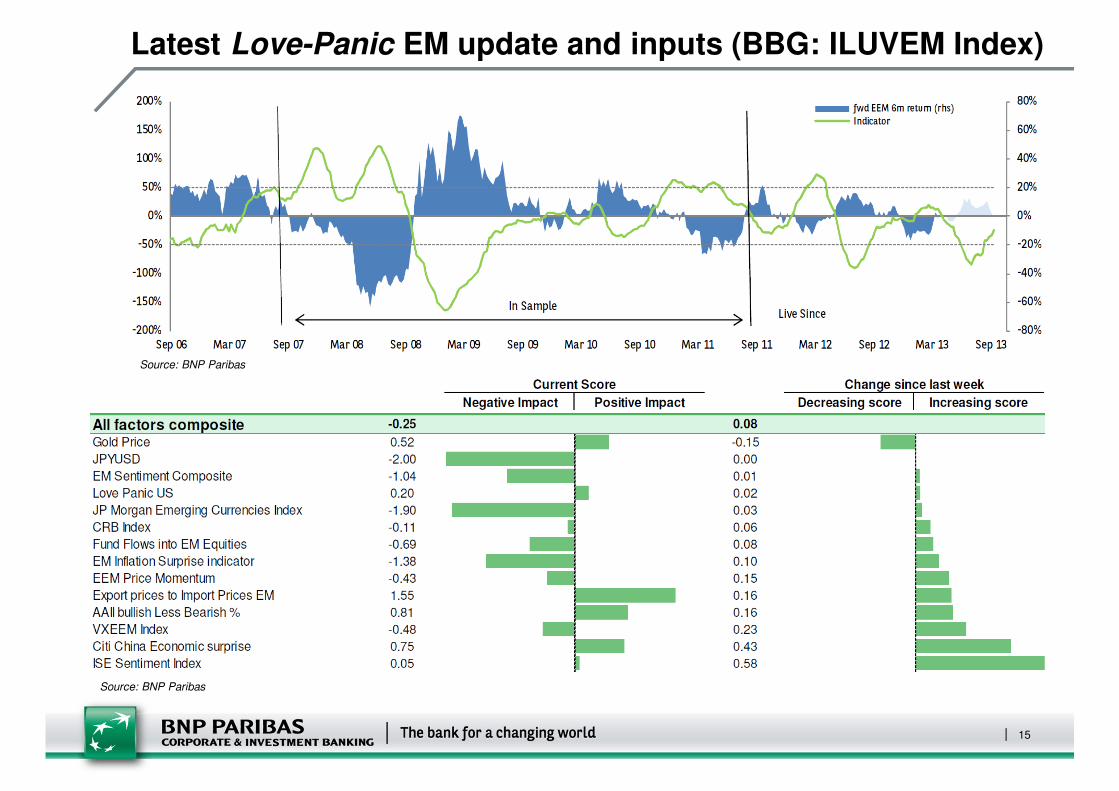
Latest Love-Panic EM update and inputs (BBG: ILUVEM Index)
Source: BNP Paribas
Source: BNP Paribas
15
3. A hedging strategy for long only managers
16
Our goal
Improve long-only risk management
� Futures or full-delta hedging are too blunt in that the cost of being wrong is high. If only partially hedging, then you’re only partially hedged!
� Option hedging is typically an expensive strategy when implemented passively. Implied volatility and skew usually overprice risks for long periods.
� Common single-factor conditional hedging strategies (volatility levels) improve decision making but suffer from the same idiosyncratic problems as using those factors for market timing.
Calibrate Love Panic signals with option hedging strategies
� Using in and out of sample data, what:
� triggers,
� option strategies,
� strikes and
� maturities
� would have been optimal for adding alpha in the past
17
Our process
Testing parameters
� Weekly data from 2000-2013 (2005-2011 is in-sample data)
� Black Scholes option calculation based on constant (non-listed) maturities
� Transaction costs of 10bps per option
� Implied volatilities taken from the surface at the time (includes skew and term structure impact)
� Dividend yield constant at 2%
� Rates assumed to be the 3-mth benchmark (for all maturities tested)
� Only one hedge strategy held at any time (regardless of additional triggers)
� Enter new hedge strategy if still triggered at expiry of initial hedge.
Selected parameters for following case studies
� Trigger: Break up through Love-Panic of 25 triggers a hedge trade
� Maturity: 6-mths
� Strategies: 95% puts and 95/105% collars
18
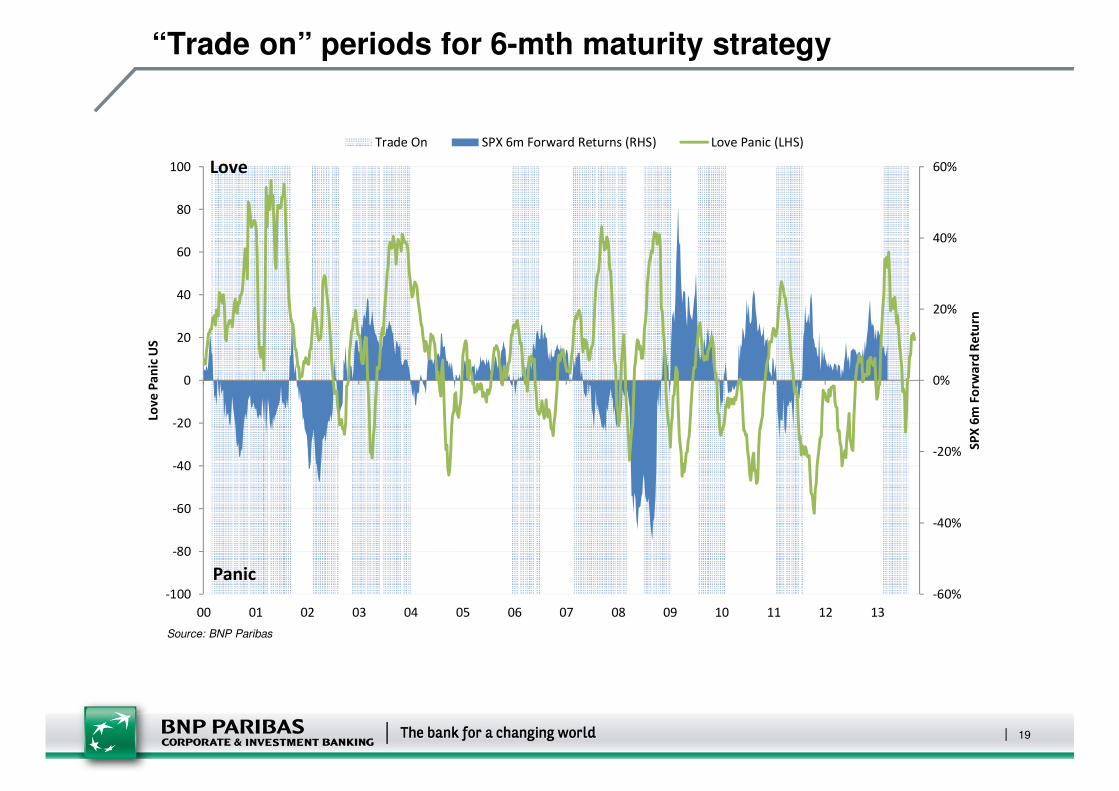
“Trade on” periods for 6-mth maturity strategy
-60%
-40%
-20%
0%
20%
40%
60%
-100
-80
-60
-40
-20
0
20
40
60
80
100
00 01 02 03 04 05 06 07 08 09 10 11 12 13
SP
X 6
m F
orw
ard
Re
turn
Lov
e P
an
ic U
STrade On SPX 6m Forward Returns (RHS) Love Panic (LHS)
Love
Panic
Source: BNP Paribas
19
3. A hedging strategy for long only managers� Puts
20
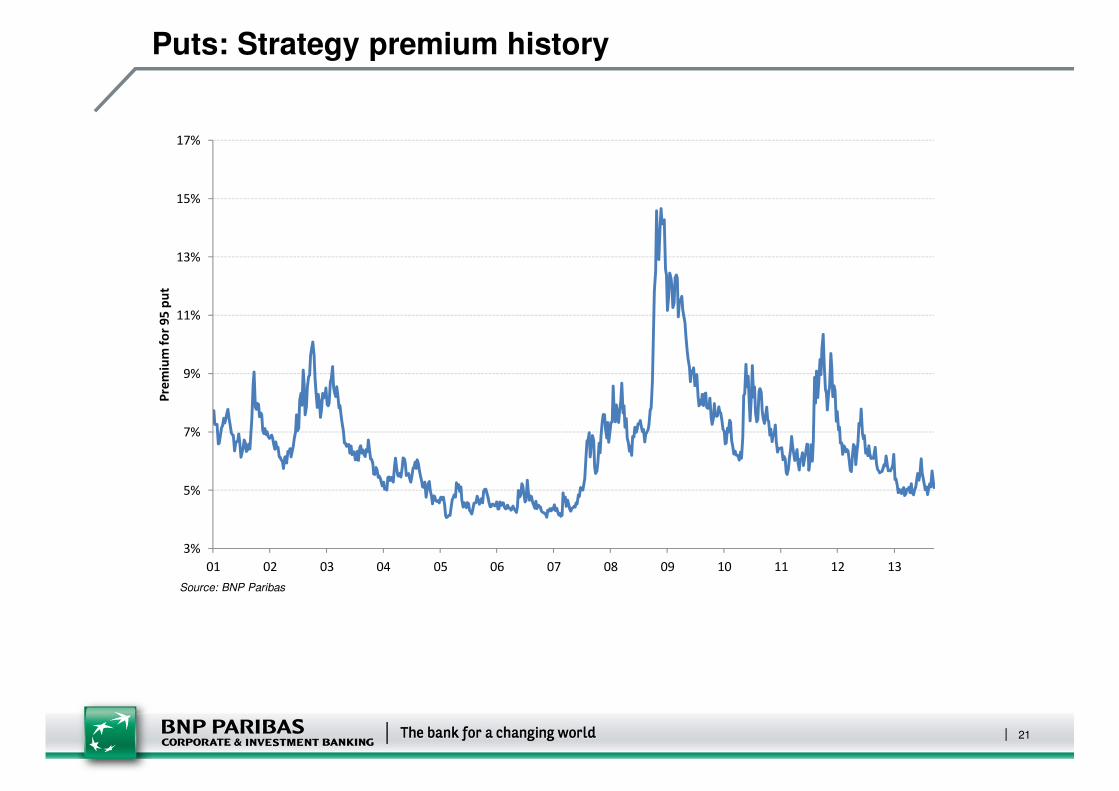
Puts: Strategy premium history
3%
5%
7%
9%
11%
13%
15%
17%
01 02 03 04 05 06 07 08 09 10 11 12 13
Pre
miu
m f
or
95
pu
t
Source: BNP Paribas
21
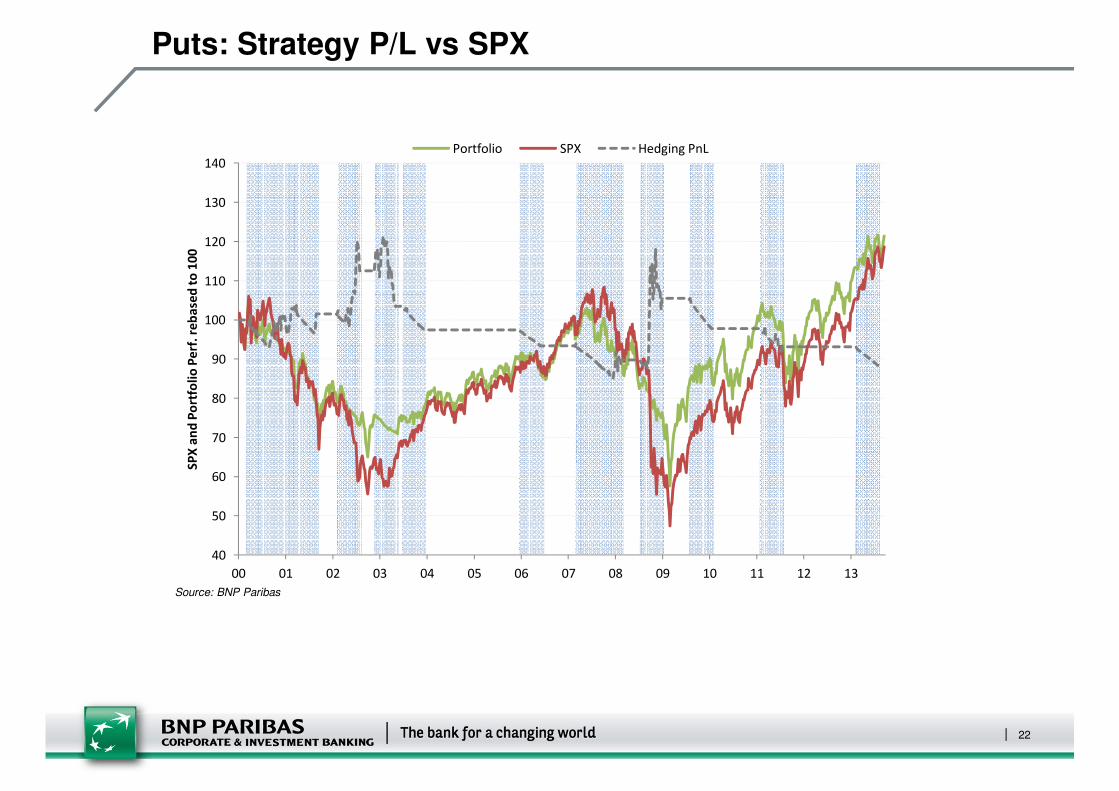
Puts: Strategy P/L vs SPX
0
0
0
0
0
1
1
1
1
1
1
40
50
60
70
80
90
100
110
120
130
140
00 01 02 03 04 05 06 07 08 09 10 11 12 13
SP
X a
nd
Po
rtfo
lio
Pe
rf.
reb
ase
d t
o 1
00
Portfolio SPX Hedging PnL
Source: BNP Paribas
22
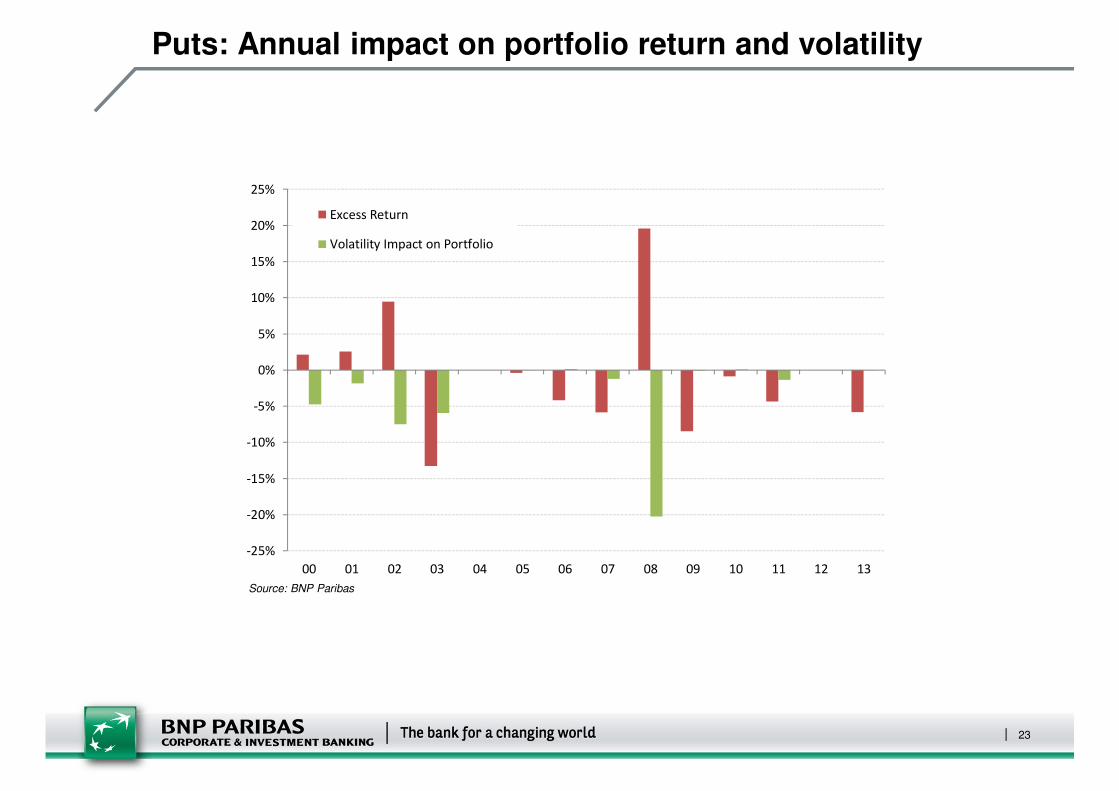
Puts: Annual impact on portfolio return and volatility
-25%
-20%
-15%
-10%
-5%
0%
5%
10%
15%
20%
25%
00 01 02 03 04 05 06 07 08 09 10 11 12 13
Excess Return
Volatility Impact on Portfolio
Source: BNP Paribas
23
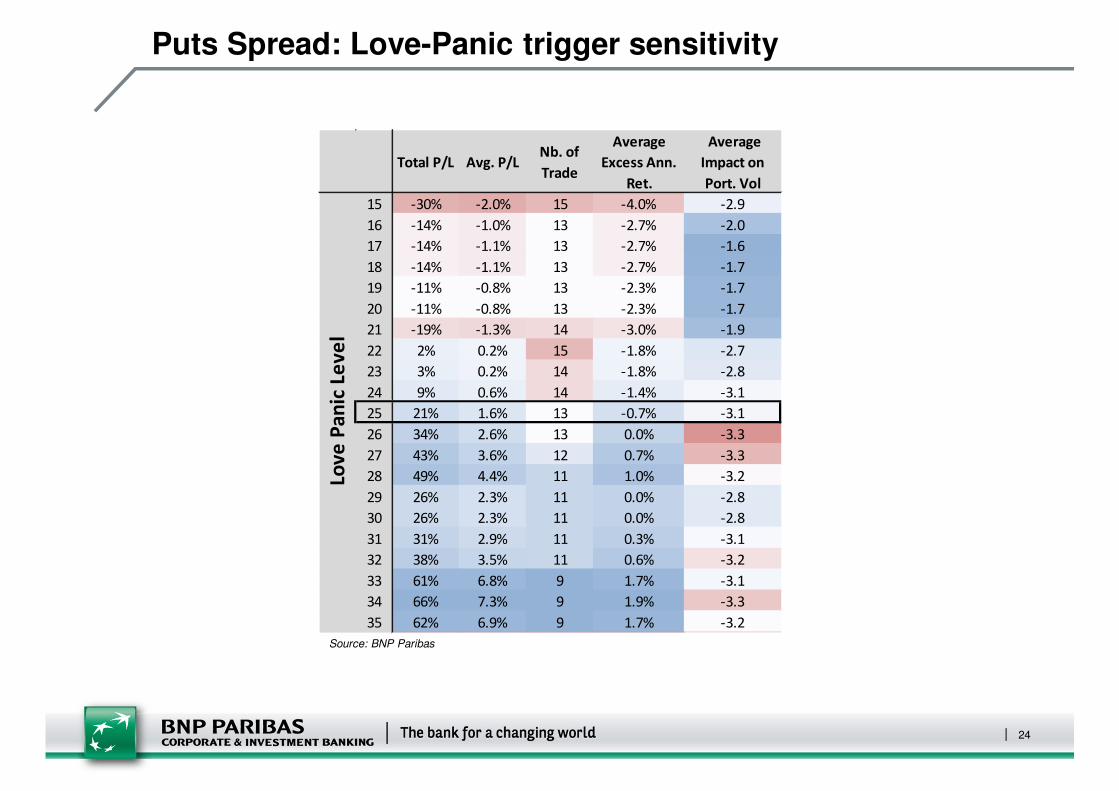
Puts Spread: Love-Panic trigger sensitivity
Total P/L Avg. P/LNb. of
Trade
Average
Excess Ann.
Ret.
Average
Impact on
Port. Vol
15 -30% -2.0% 15 -4.0% -2.9
16 -14% -1.0% 13 -2.7% -2.0
17 -14% -1.1% 13 -2.7% -1.6
18 -14% -1.1% 13 -2.7% -1.7
19 -11% -0.8% 13 -2.3% -1.7
20 -11% -0.8% 13 -2.3% -1.7
21 -19% -1.3% 14 -3.0% -1.9
22 2% 0.2% 15 -1.8% -2.7
23 3% 0.2% 14 -1.8% -2.8
24 9% 0.6% 14 -1.4% -3.1
25 21% 1.6% 13 -0.7% -3.1
26 34% 2.6% 13 0.0% -3.3
27 43% 3.6% 12 0.7% -3.3
28 49% 4.4% 11 1.0% -3.2
29 26% 2.3% 11 0.0% -2.8
30 26% 2.3% 11 0.0% -2.8
31 31% 2.9% 11 0.3% -3.1
32 38% 3.5% 11 0.6% -3.2
33 61% 6.8% 9 1.7% -3.1
34 66% 7.3% 9 1.9% -3.3
35 62% 6.9% 9 1.7% -3.2
Lov
e P
an
ic L
ev
el
Source: BNP Paribas
24
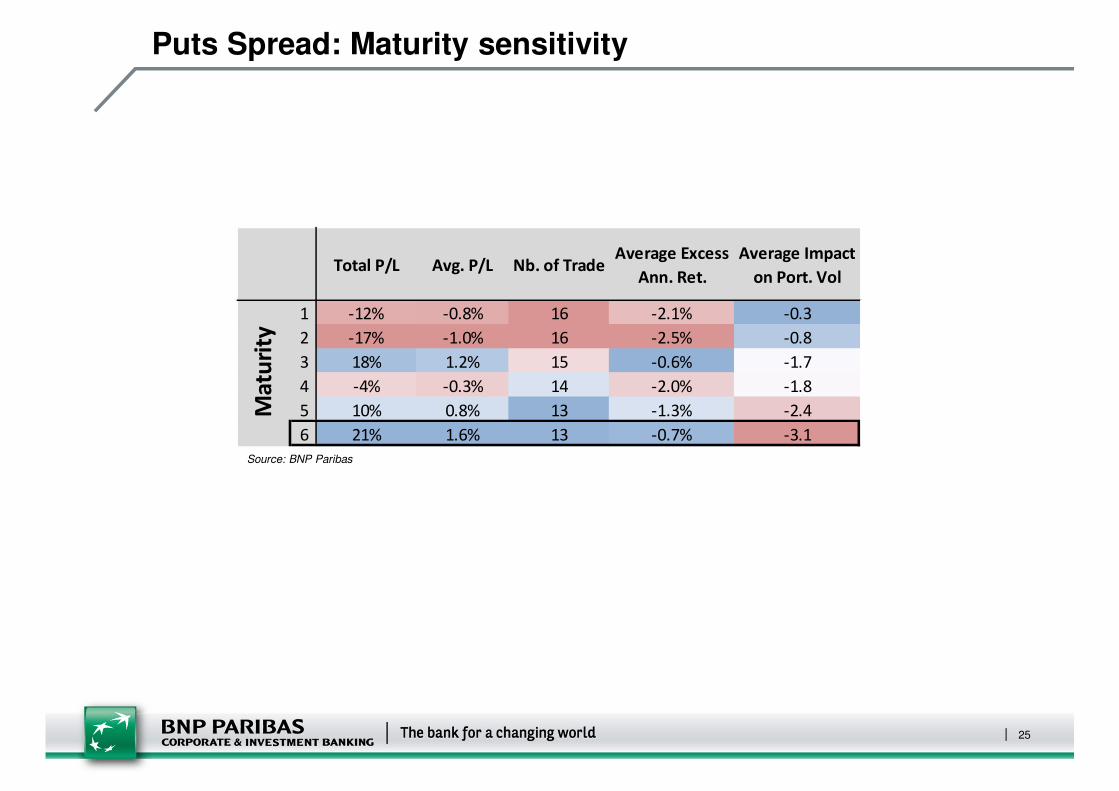
Puts Spread: Maturity sensitivity
Total P/L Avg. P/L Nb. of TradeAverage Excess
Ann. Ret.
Average Impact
on Port. Vol
1 -12% -0.8% 16 -2.1% -0.3
2 -17% -1.0% 16 -2.5% -0.8
3 18% 1.2% 15 -0.6% -1.7
4 -4% -0.3% 14 -2.0% -1.8
5 10% 0.8% 13 -1.3% -2.4
6 21% 1.6% 13 -0.7% -3.1
Ma
turi
ty
Source: BNP Paribas
25
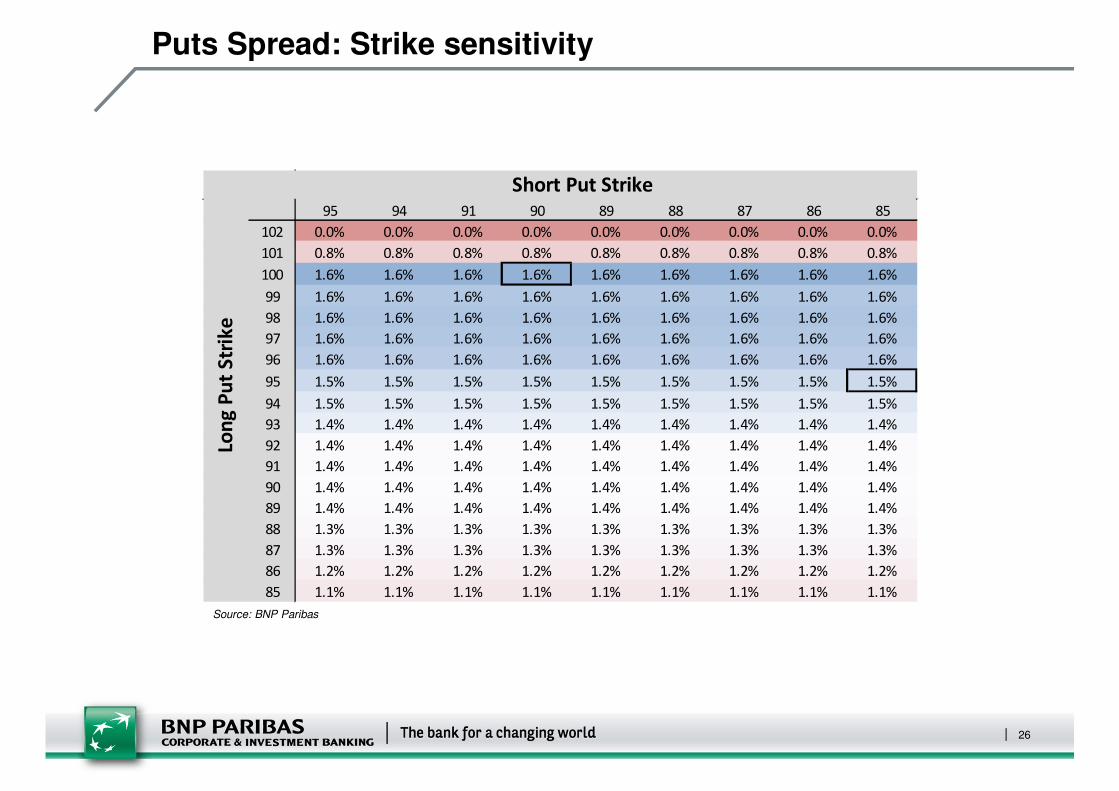
Puts Spread: Strike sensitivity
1.6% 95 94 91 90 89 88 87 86 85
102 0.0% 0.0% 0.0% 0.0% 0.0% 0.0% 0.0% 0.0% 0.0%
101 0.8% 0.8% 0.8% 0.8% 0.8% 0.8% 0.8% 0.8% 0.8%
100 1.6% 1.6% 1.6% 1.6% 1.6% 1.6% 1.6% 1.6% 1.6%
99 1.6% 1.6% 1.6% 1.6% 1.6% 1.6% 1.6% 1.6% 1.6%
98 1.6% 1.6% 1.6% 1.6% 1.6% 1.6% 1.6% 1.6% 1.6%
97 1.6% 1.6% 1.6% 1.6% 1.6% 1.6% 1.6% 1.6% 1.6%
96 1.6% 1.6% 1.6% 1.6% 1.6% 1.6% 1.6% 1.6% 1.6%
95 1.5% 1.5% 1.5% 1.5% 1.5% 1.5% 1.5% 1.5% 1.5%
94 1.5% 1.5% 1.5% 1.5% 1.5% 1.5% 1.5% 1.5% 1.5%
93 1.4% 1.4% 1.4% 1.4% 1.4% 1.4% 1.4% 1.4% 1.4%
92 1.4% 1.4% 1.4% 1.4% 1.4% 1.4% 1.4% 1.4% 1.4%
91 1.4% 1.4% 1.4% 1.4% 1.4% 1.4% 1.4% 1.4% 1.4%
90 1.4% 1.4% 1.4% 1.4% 1.4% 1.4% 1.4% 1.4% 1.4%
89 1.4% 1.4% 1.4% 1.4% 1.4% 1.4% 1.4% 1.4% 1.4%
88 1.3% 1.3% 1.3% 1.3% 1.3% 1.3% 1.3% 1.3% 1.3%
87 1.3% 1.3% 1.3% 1.3% 1.3% 1.3% 1.3% 1.3% 1.3%
86 1.2% 1.2% 1.2% 1.2% 1.2% 1.2% 1.2% 1.2% 1.2%
85 1.1% 1.1% 1.1% 1.1% 1.1% 1.1% 1.1% 1.1% 1.1%
Lon
g P
ut
Str
ike
Short Put Strike
Source: BNP Paribas
26
3. A hedging strategy for long only managers� Collars
27
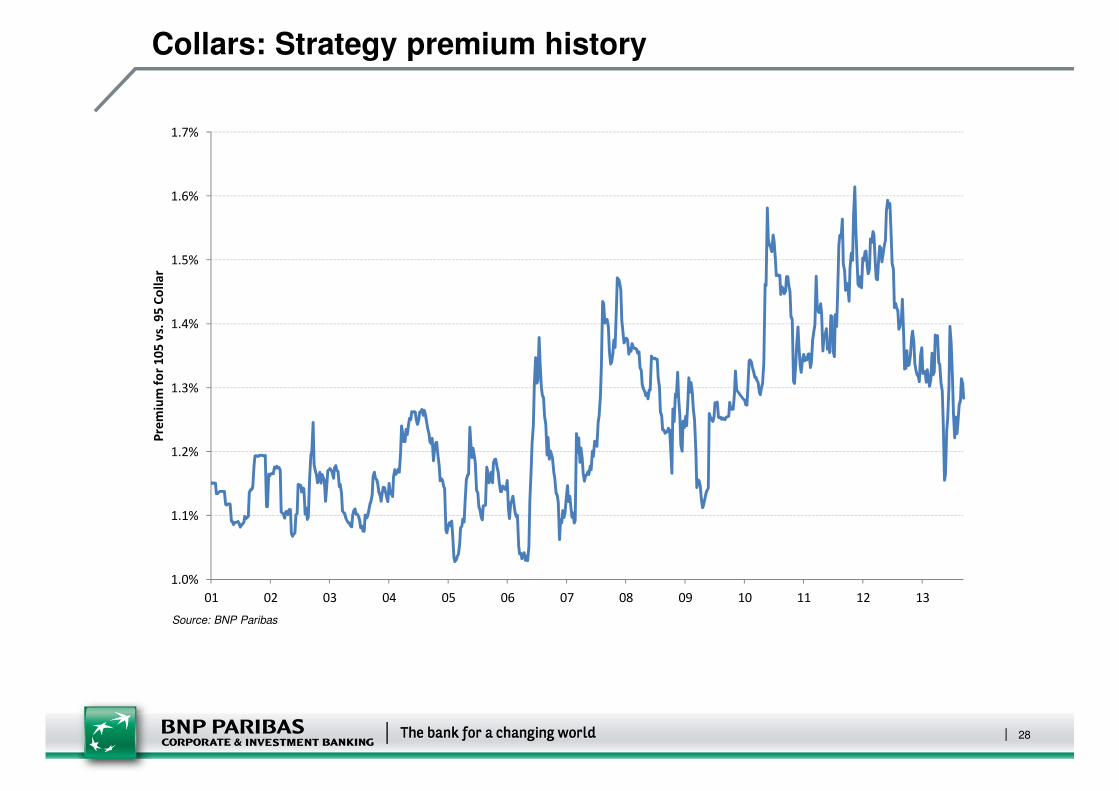
Collars: Strategy premium history
1.0%
1.1%
1.2%
1.3%
1.4%
1.5%
1.6%
1.7%
01 02 03 04 05 06 07 08 09 10 11 12 13
Pre
miu
m f
or
10
5 v
s. 9
5 C
oll
ar
Source: BNP Paribas
28
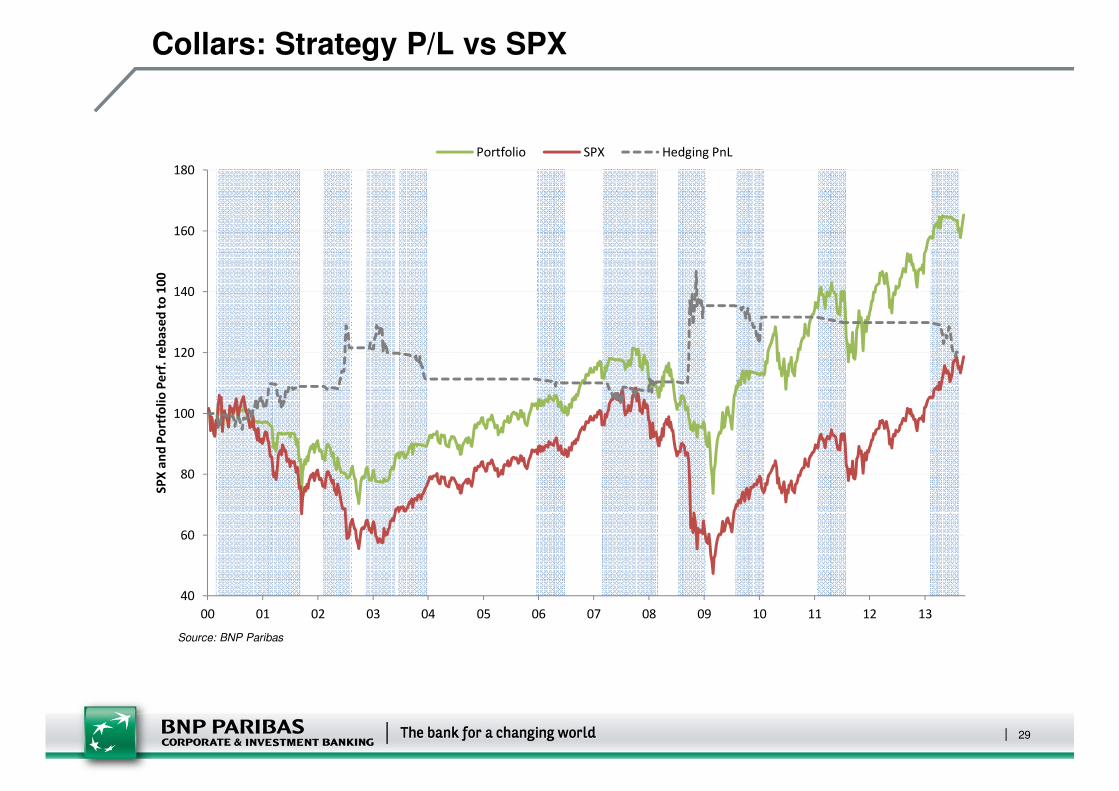
Collars: Strategy P/L vs SPX
0
0
0
0
0
1
1
1
1
1
1
40
60
80
100
120
140
160
180
00 01 02 03 04 05 06 07 08 09 10 11 12 13
SP
X a
nd
Po
rtfo
lio
Pe
rf.
reb
ase
d t
o 1
00
Portfolio SPX Hedging PnL
Source: BNP Paribas
29
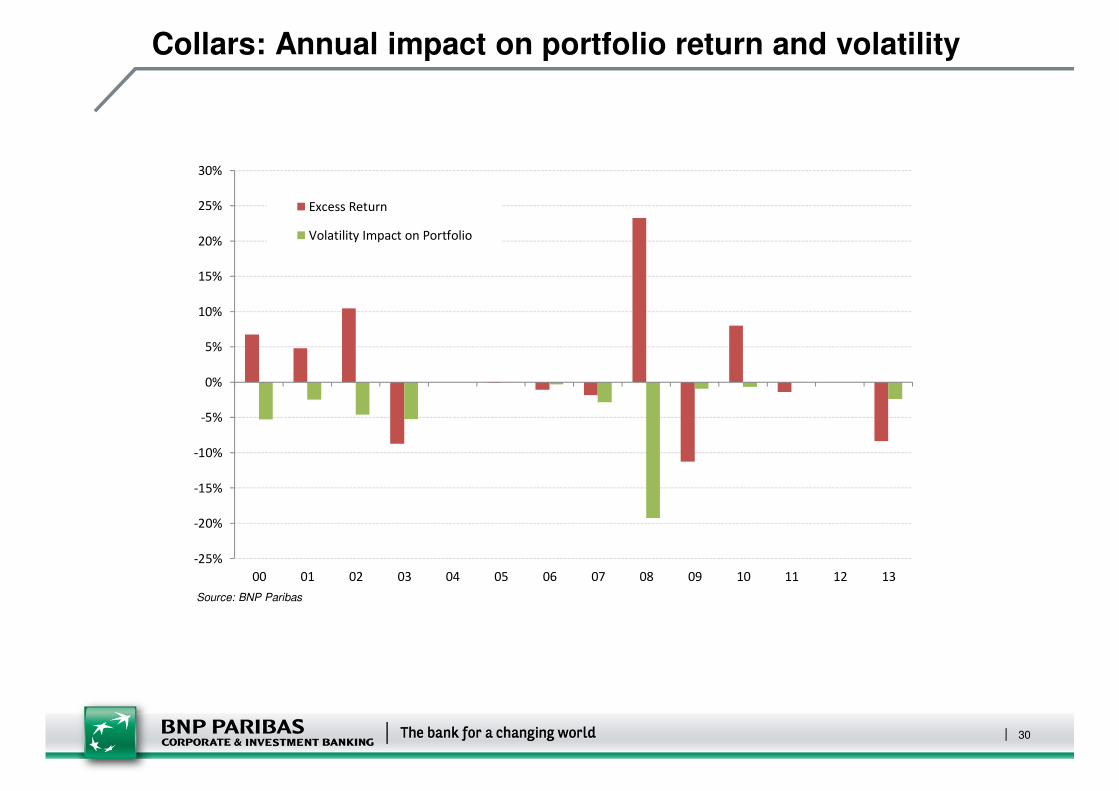
Collars: Annual impact on portfolio return and volatility
-25%
-20%
-15%
-10%
-5%
0%
5%
10%
15%
20%
25%
30%
00 01 02 03 04 05 06 07 08 09 10 11 12 13
Excess Return
Volatility Impact on Portfolio
Source: BNP Paribas
30
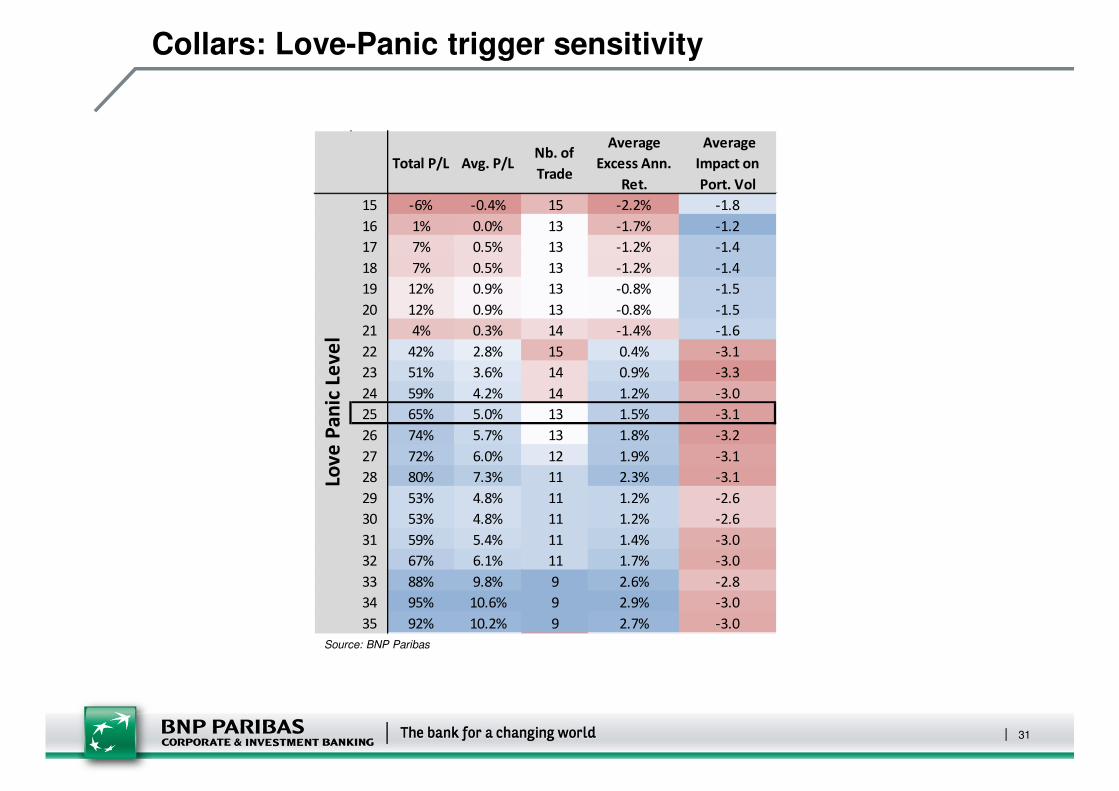
Collars: Love-Panic trigger sensitivity
Total P/L Avg. P/LNb. of
Trade
Average
Excess Ann.
Ret.
Average
Impact on
Port. Vol
15 -6% -0.4% 15 -2.2% -1.8
16 1% 0.0% 13 -1.7% -1.2
17 7% 0.5% 13 -1.2% -1.4
18 7% 0.5% 13 -1.2% -1.4
19 12% 0.9% 13 -0.8% -1.5
20 12% 0.9% 13 -0.8% -1.5
21 4% 0.3% 14 -1.4% -1.6
22 42% 2.8% 15 0.4% -3.1
23 51% 3.6% 14 0.9% -3.3
24 59% 4.2% 14 1.2% -3.0
25 65% 5.0% 13 1.5% -3.1
26 74% 5.7% 13 1.8% -3.2
27 72% 6.0% 12 1.9% -3.1
28 80% 7.3% 11 2.3% -3.1
29 53% 4.8% 11 1.2% -2.6
30 53% 4.8% 11 1.2% -2.6
31 59% 5.4% 11 1.4% -3.0
32 67% 6.1% 11 1.7% -3.0
33 88% 9.8% 9 2.6% -2.8
34 95% 10.6% 9 2.9% -3.0
35 92% 10.2% 9 2.7% -3.0
Lov
e P
an
ic L
ev
el
Source: BNP Paribas
31
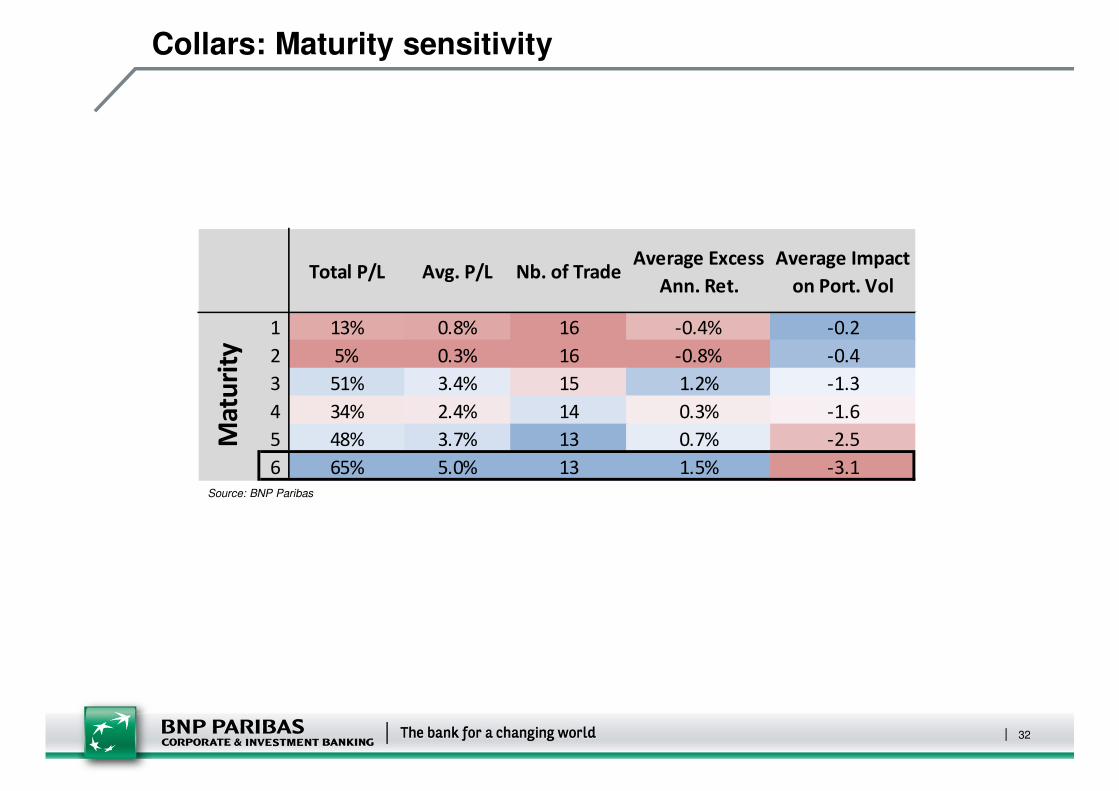
Collars: Maturity sensitivity
Total P/L Avg. P/L Nb. of TradeAverage Excess
Ann. Ret.
Average Impact
on Port. Vol
1 13% 0.8% 16 -0.4% -0.2
2 5% 0.3% 16 -0.8% -0.4
3 51% 3.4% 15 1.2% -1.3
4 34% 2.4% 14 0.3% -1.6
5 48% 3.7% 13 0.7% -2.5
6 65% 5.0% 13 1.5% -3.1
Ma
turi
ty
Source: BNP Paribas
32
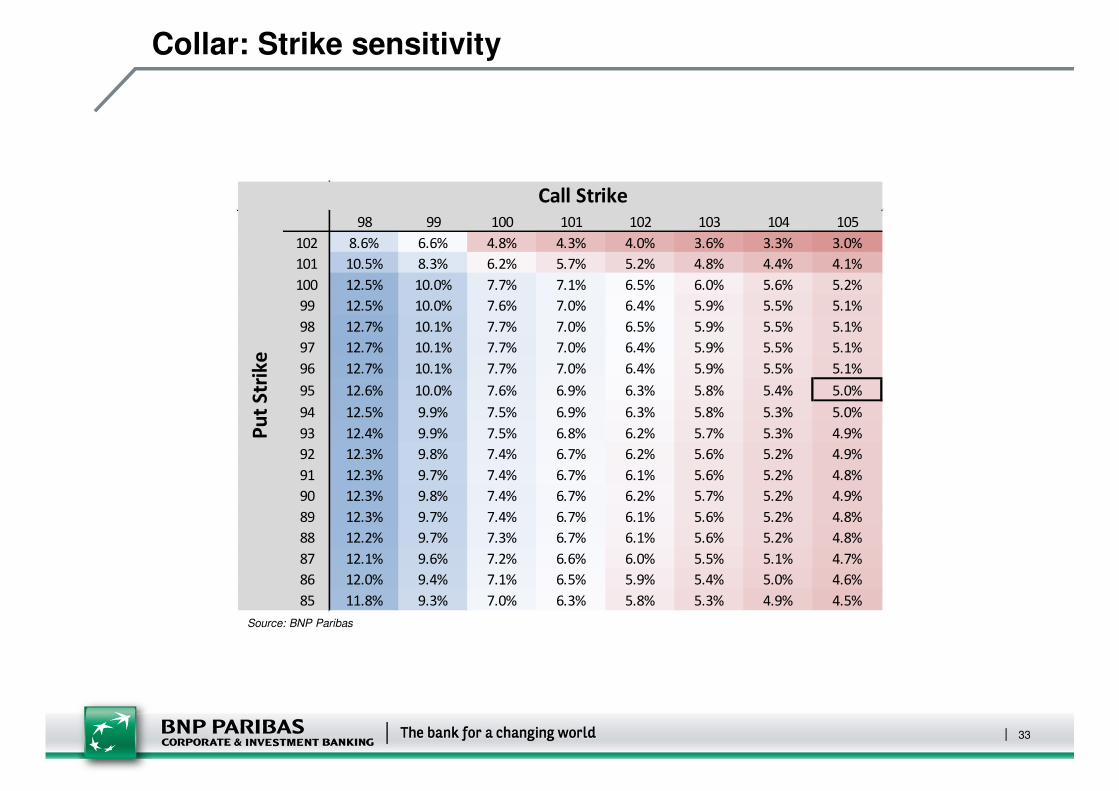
Collar: Strike sensitivity
5.0% 98 99 100 101 102 103 104 105
102 8.6% 6.6% 4.8% 4.3% 4.0% 3.6% 3.3% 3.0%
101 10.5% 8.3% 6.2% 5.7% 5.2% 4.8% 4.4% 4.1%
100 12.5% 10.0% 7.7% 7.1% 6.5% 6.0% 5.6% 5.2%
99 12.5% 10.0% 7.6% 7.0% 6.4% 5.9% 5.5% 5.1%
98 12.7% 10.1% 7.7% 7.0% 6.5% 5.9% 5.5% 5.1%
97 12.7% 10.1% 7.7% 7.0% 6.4% 5.9% 5.5% 5.1%
96 12.7% 10.1% 7.7% 7.0% 6.4% 5.9% 5.5% 5.1%
95 12.6% 10.0% 7.6% 6.9% 6.3% 5.8% 5.4% 5.0%
94 12.5% 9.9% 7.5% 6.9% 6.3% 5.8% 5.3% 5.0%
93 12.4% 9.9% 7.5% 6.8% 6.2% 5.7% 5.3% 4.9%
92 12.3% 9.8% 7.4% 6.7% 6.2% 5.6% 5.2% 4.9%
91 12.3% 9.7% 7.4% 6.7% 6.1% 5.6% 5.2% 4.8%
90 12.3% 9.8% 7.4% 6.7% 6.2% 5.7% 5.2% 4.9%
89 12.3% 9.7% 7.4% 6.7% 6.1% 5.6% 5.2% 4.8%
88 12.2% 9.7% 7.3% 6.7% 6.1% 5.6% 5.2% 4.8%
87 12.1% 9.6% 7.2% 6.6% 6.0% 5.5% 5.1% 4.7%
86 12.0% 9.4% 7.1% 6.5% 5.9% 5.4% 5.0% 4.6%
85 11.8% 9.3% 7.0% 6.3% 5.8% 5.3% 4.9% 4.5%
Call Strike
Pu
t S
trik
e
Source: BNP Paribas
33
Further thoughts
Potential improvements to use of sentiment in risk management
� Different triggers (break-up or break-down through trigger level)
� Different implementation timing (delay of a day/week)
� Add an overlay for ADDING risk when “Panic” trigger breached
34
4. Quantitative long/short sector investing
using sentiment phasing
35
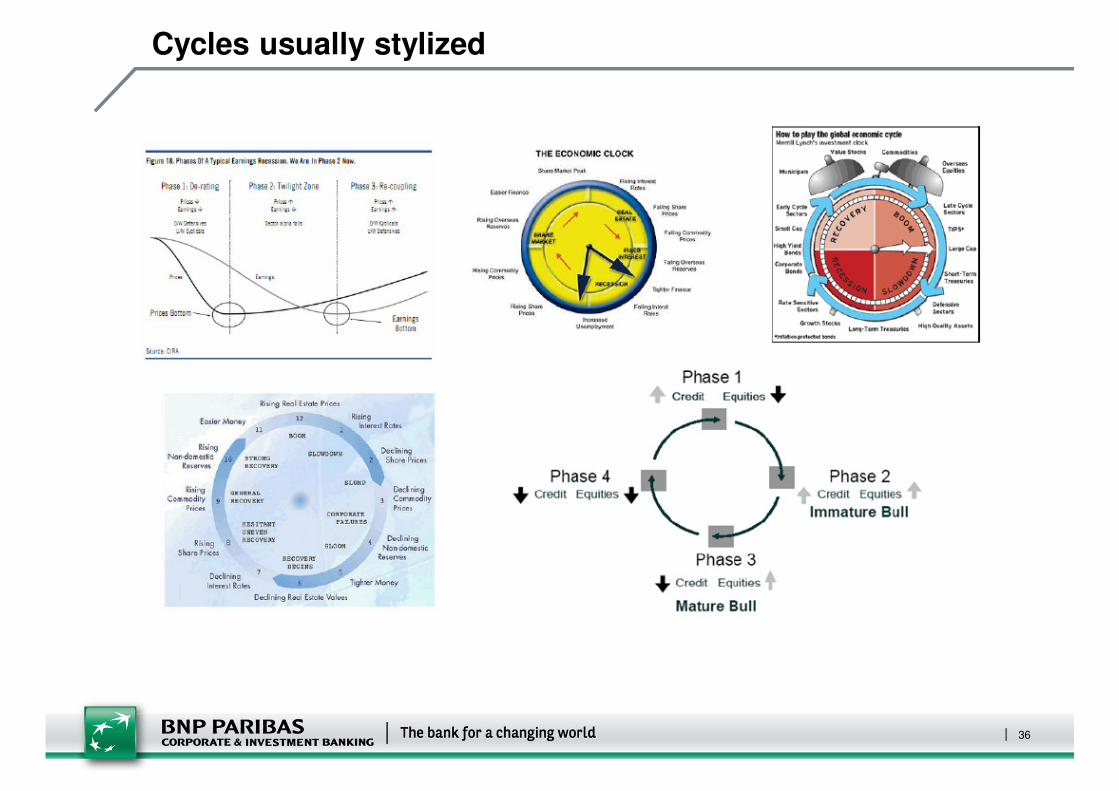
Cycles usually stylized
36
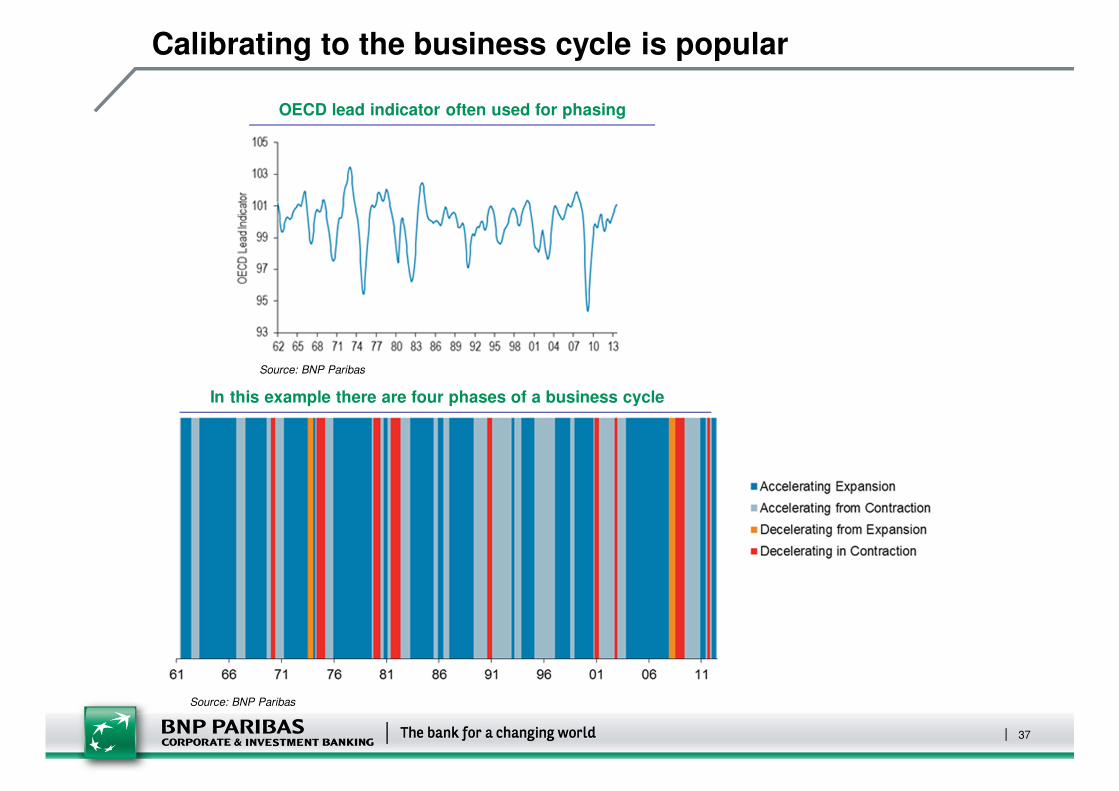
Calibrating to the business cycle is popular
OECD lead indicator often used for phasing
In this example there are four phases of a business cycle
Source: BNP Paribas
Source: BNP Paribas
37
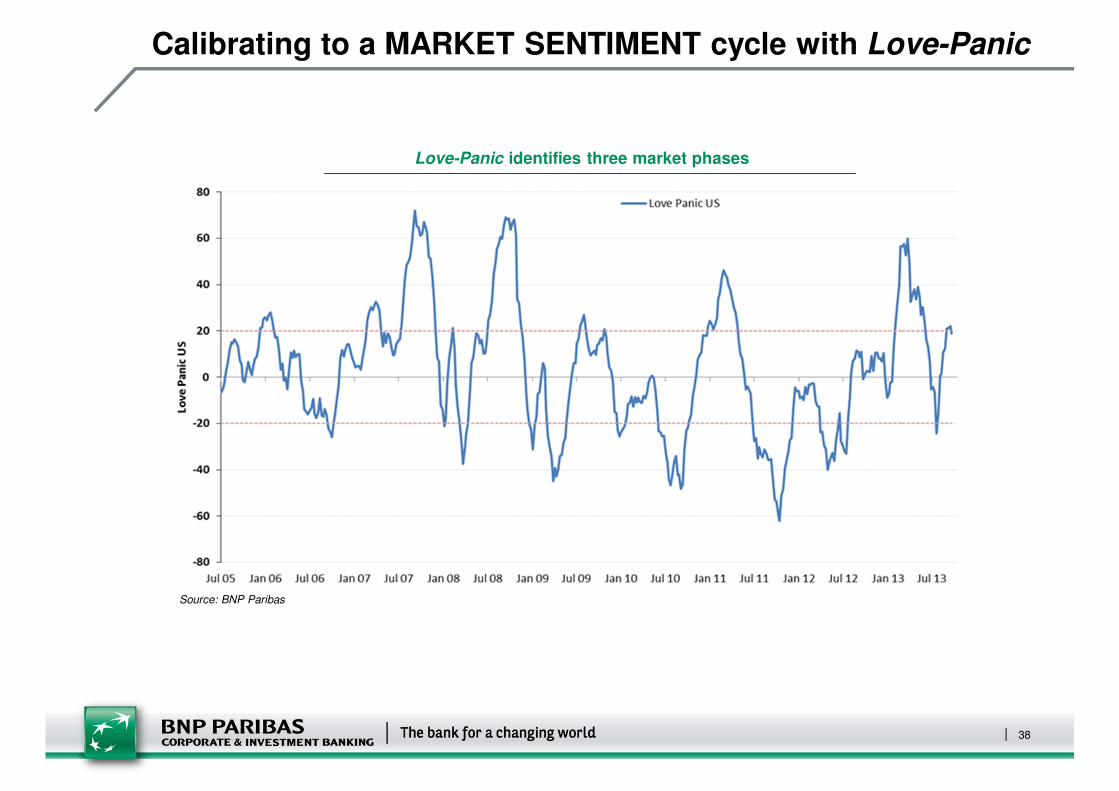
Calibrating to a MARKET SENTIMENT cycle with Love-Panic
Love-Panic identifies three market phases
Source: BNP Paribas
38
Quant long/short analysis process improved by PAM
The standard quant model
� Take a list of factors
� Measure their ability to predict 1-mth returns on each country/sector
� Create a combined score from the most predictive factors on each
� Buy the top quartile and sell the bottom quartile (but what about the middle!?)
Phase Attribution Model (PAM)
� Assess the historical predictive power of each factor only in the same “phases” as defined by Love-Panic
� Use and weight the top 8 factors for selections
� This will introduce more fear/greed, beta and cyclicality to country and sector selections
39
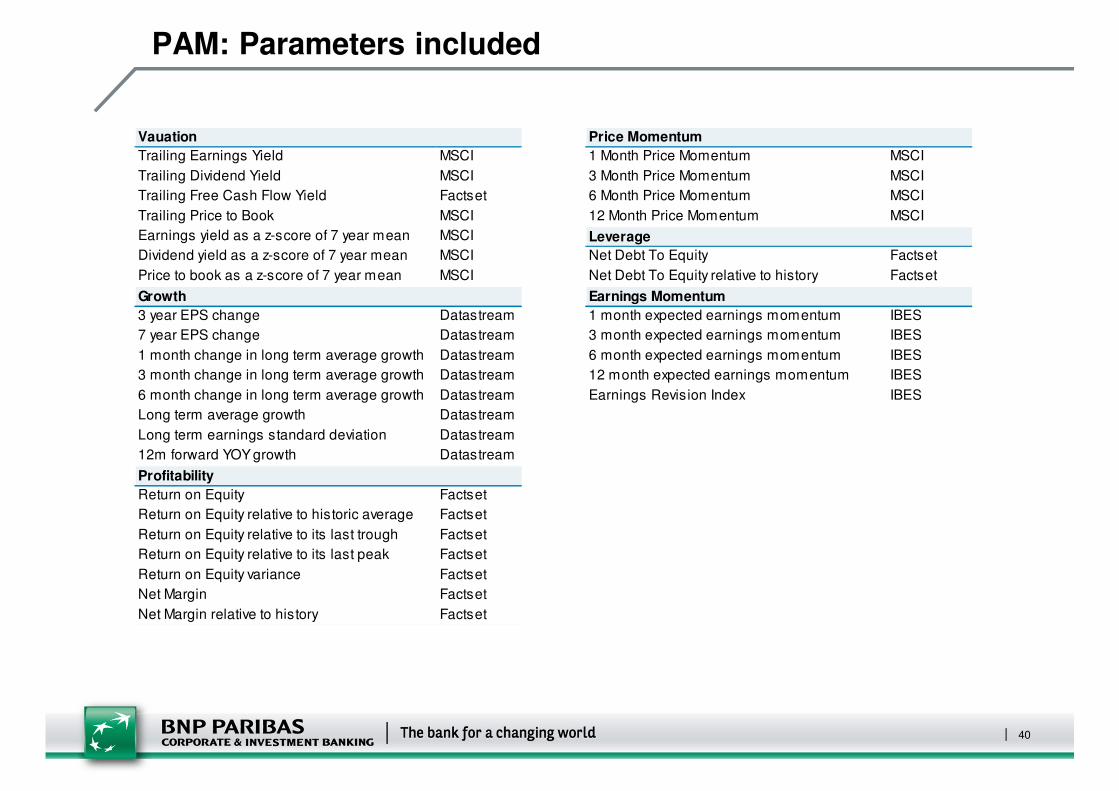
PAM: Parameters included
Trailing Earnings Yield MSCI
Trailing Dividend Yield MSCI
Trailing Free Cash Flow Yield Factset
Trailing Price to Book MSCI
Earnings yield as a z-score of 7 year mean MSCI
Dividend yield as a z-score of 7 year mean MSCI
Price to book as a z-score of 7 year mean MSCI
3 year EPS change Datastream
7 year EPS change Datastream
1 month change in long term average growth Datastream
3 month change in long term average growth Datastream
6 month change in long term average growth Datastream
Long term average growth Datastream
Long term earnings standard deviation Datastream
12m forward YOY growth Datastream
Return on Equity Factset
Return on Equity relative to historic average Factset
Return on Equity relative to its last trough Factset
Return on Equity relative to its last peak Factset
Return on Equity variance Factset
Net Margin Factset
Net Margin relative to history Factset
Vauation
Growth
Profitability
1 Month Price Momentum MSCI
3 Month Price Momentum MSCI
6 Month Price Momentum MSCI
12 Month Price Momentum MSCI
Net Debt To Equity Factset
Net Debt To Equity relative to history Factset
1 month expected earnings momentum IBES
3 month expected earnings momentum IBES
6 month expected earnings momentum IBES
12 month expected earnings momentum IBES
Earnings Revision Index IBES
Price Momentum
Leverage
Earnings Momentum
40
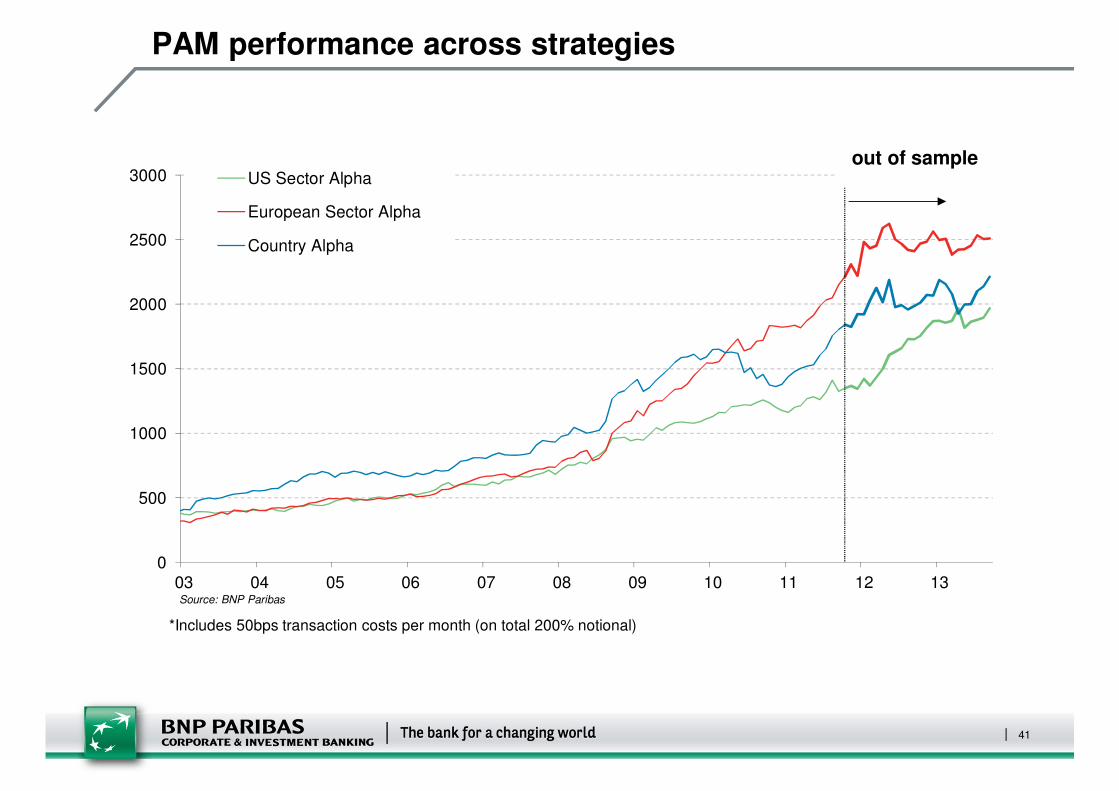
PAM performance across strategies
0
500
1000
1500
2000
2500
3000
03 04 05 06 07 08 09 10 11 12 13
US Sector Alpha
European Sector Alpha
Country Alpha
out of sample
*Includes 50bps transaction costs per month (on total 200% notional)
Source: BNP Paribas
41
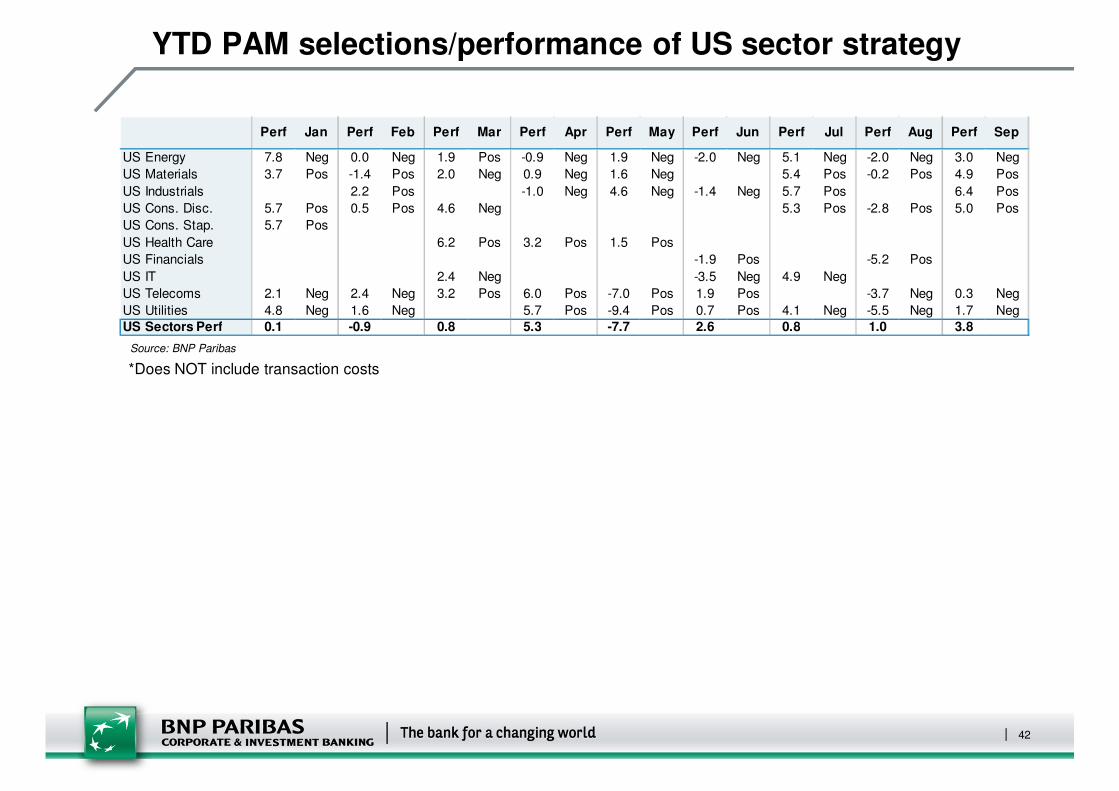
YTD PAM selections/performance of US sector strategy
Perf Jan Perf Feb Perf Mar Perf Apr Perf May Perf Jun Perf Jul Perf Aug Perf Sep
US Energy 7.8 Neg 0.0 Neg 1.9 Pos -0.9 Neg 1.9 Neg -2.0 Neg 5.1 Neg -2.0 Neg 3.0 Neg
US Materials 3.7 Pos -1.4 Pos 2.0 Neg 0.9 Neg 1.6 Neg 5.4 Pos -0.2 Pos 4.9 Pos
US Industrials 2.2 Pos -1.0 Neg 4.6 Neg -1.4 Neg 5.7 Pos 6.4 Pos
US Cons. Disc. 5.7 Pos 0.5 Pos 4.6 Neg 5.3 Pos -2.8 Pos 5.0 Pos
US Cons. Stap. 5.7 Pos
US Health Care 6.2 Pos 3.2 Pos 1.5 Pos
US Financials -1.9 Pos -5.2 Pos
US IT 2.4 Neg -3.5 Neg 4.9 Neg
US Telecoms 2.1 Neg 2.4 Neg 3.2 Pos 6.0 Pos -7.0 Pos 1.9 Pos -3.7 Neg 0.3 Neg
US Utilities 4.8 Neg 1.6 Neg 5.7 Pos -9.4 Pos 0.7 Pos 4.1 Neg -5.5 Neg 1.7 Neg
US Sectors Perf 0.1 -0.9 0.8 5.3 -7.7 2.6 0.8 1.0 3.8
*Does NOT include transaction costs
Source: BNP Paribas
42
5. An option strategy for US long/short managers
43
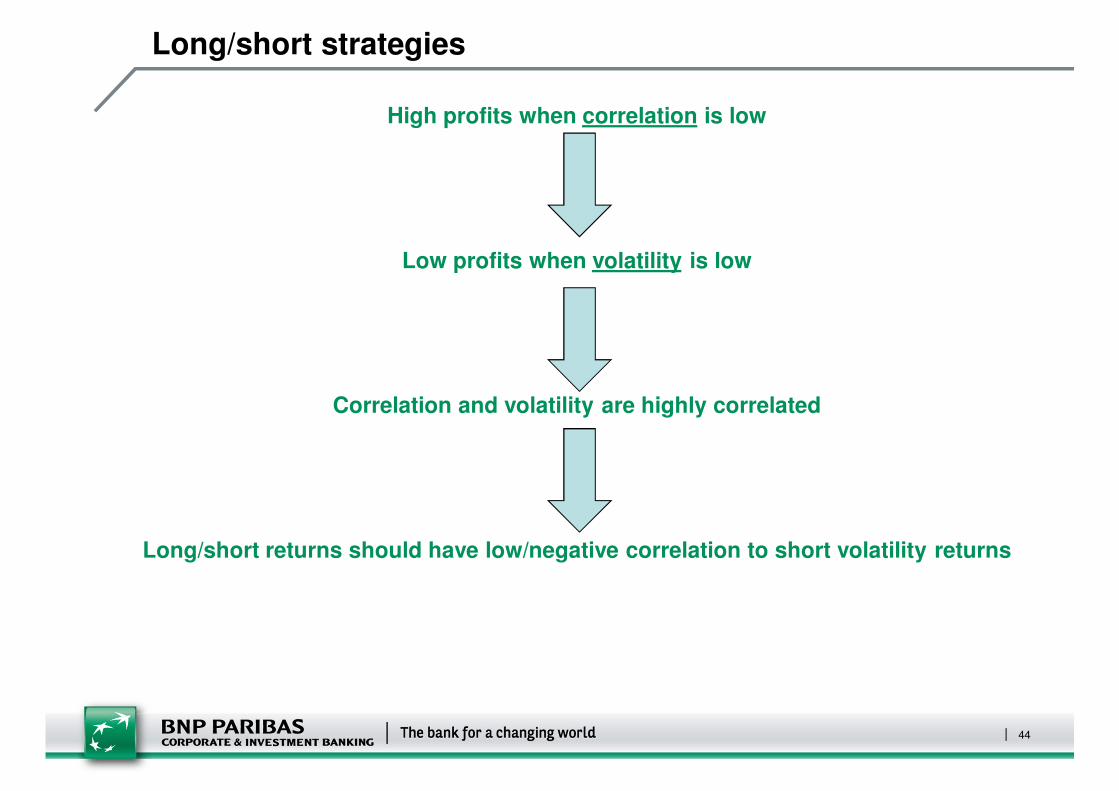
Long/short strategies
High profits when correlation is low
Low profits when volatility is low
Correlation and volatility are highly correlated
Long/short returns should have low/negative correlation to short volatility returns
44

Analysis parameters
Process followed in ad hoc analysis of thesis
� Run US sector long/short strategy on top and bottom 3 sectors from PAM
� Overlay a short straddle strategy on the 3 “middle” sectors (exlcuded telco sector)
� 1-mth maturity options (not calibrated to expiry)
� 5bps transaction cost (per option)
� ATM strikes
� Long/short uses 1x leverage ($100 long and $100 short - $33 on each sector...)
� Straddle notional positions are $100 also ($17 notional on each put and each call on each sector)
� Introduces occasional delta (up to 100%) to the “market-neutral” long/short strategy but in exchange for premium
45
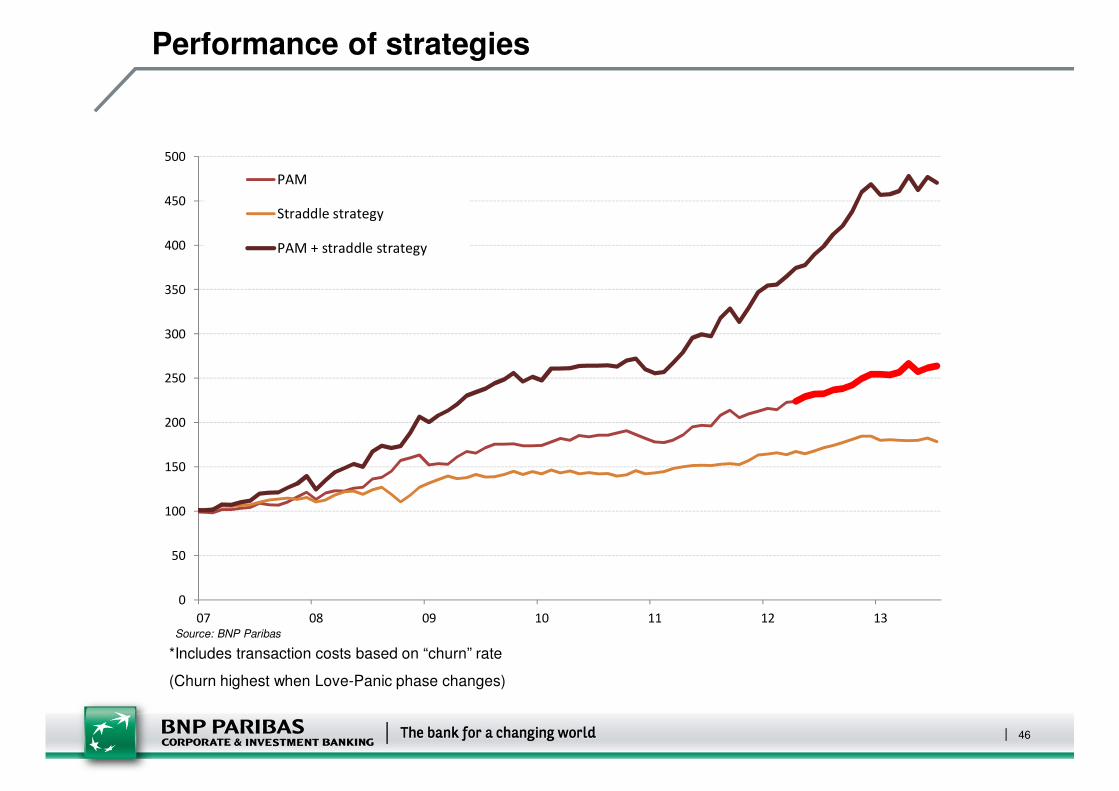
Performance of strategies
0
50
100
150
200
250
300
350
400
450
500
07 08 09 10 11 12 13
PAM
Straddle strategy
PAM + straddle strategy
*Includes transaction costs based on “churn” rate
(Churn highest when Love-Panic phase changes)
Source: BNP Paribas
46

Correlation between short vol and long/short strategies
0
10
20
30
40
50
60
70
-80%
-60%
-40%
-20%
0%
20%
40%
60%
80%
06 07 08 09 10 11 12
VIX
12
m c
orr
ela
tio
n
12m Rolling Correlation
VIX Index
Source: BNP Paribas
47
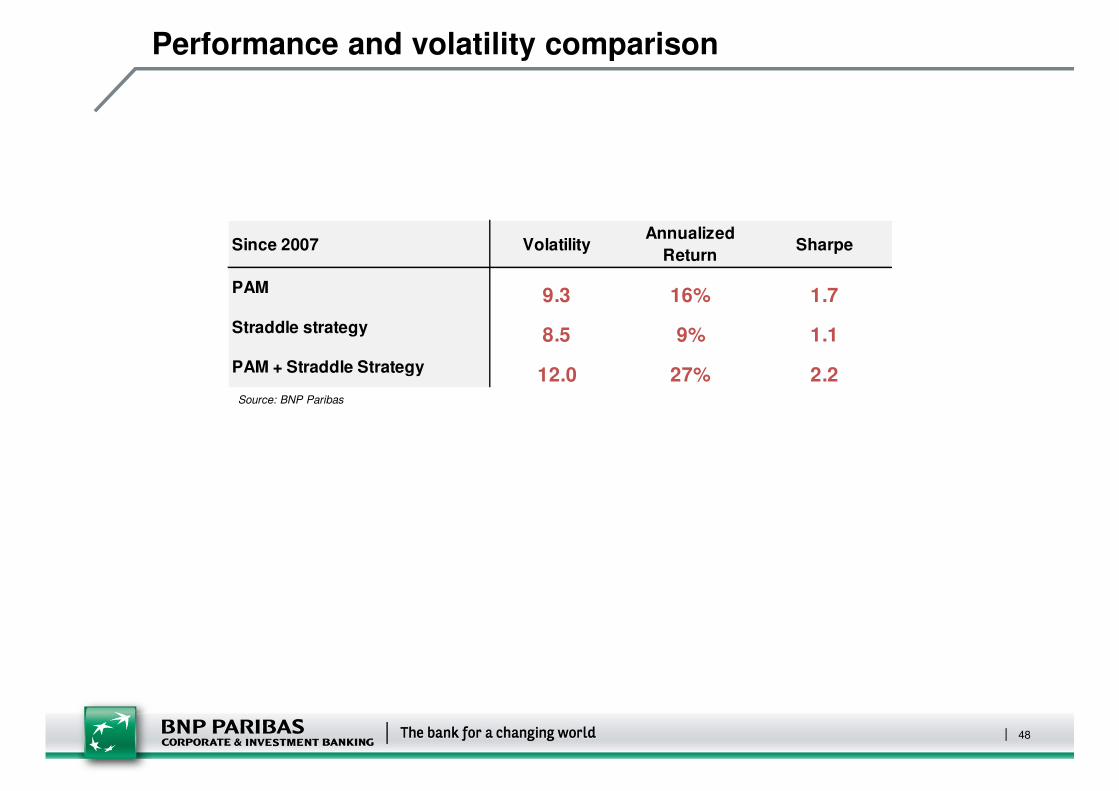
Performance and volatility comparison
Since 2007 VolatilityAnnualized
ReturnSharpe
PAM 9.3 16% 1.7
Straddle strategy 8.5 9% 1.1
PAM + Straddle Strategy 12.0 27% 2.2Source: BNP Paribas
48
Conclusions
Can sentiment indicators inform equity risk management strategies?
� Yes, at both the broad market and the sector level
� Sentiment alone should never be a black-box market timing signal
� It can help with timing option hedging strategies in a way that reduces hedging costs and maximises the effectiveness of a hedging program
� Could also be used in reverse to time option based long exposures to markets when panic is peaking
A sentiment phase overlay to quantitative US sector long/short option strategies
� Selling volatility produces returns negatively correlated to long/short returns
� Selling volatility on the “middle” ranked elements of a quant model helps maximise the alpha of a successful model
� Our Phase Attribution Model (PAM) has a great track record in US sector selection and the Sharpe ratio is enhanced further with a short straddle strategy on the “middle” sectors.
49
THE MATERIAL IN THIS DOCUMENT WAS PRODUCED BY A BNP PARIBAS GROUP COMPANY. THIS DOCUMENT MAY NOT BE DISTRIBUTED IN CANADA TO PERSONS OTHER THAN QUALIFIED INSTITUTIONAL BUYERS. THIS DOCUMENT MAY NOT BE DISTRIBUTED IN THE UNITED STATES TO PERSONS OTHER THAN MAJOR INSTITUTIONAL INVESTORS AS DEFINED IN RULE 15A-6 UNDER THE SECURITIES EXCHANGE ACT OF 1934, AS AMENDED) AND IS NOT INTENDED FOR THE USE OF ANY PERSON OR ENTITY THAT IS NOT A MAJOR INSTITUTIONAL INVESTOR. IN HONG KONG THIS REPORT IS FOR DISTRIBUTION ONLY TO PROFESSIONAL INVESTORS WITHIN THE MEANING OF SCHEDULE 1 TO THE SECURITIES AND FUTURES ORDINANCE (CAP 571) OF HONG KONG AND ANY RULES MADE THEREUNDER AND MAY NOT BE REDISTRIBUTED IN WHOLE OR IN PART IN HONG KONG TO ANY PERSON. THIS DOCUMENT MAY ONLY BE DISTRIBUTED IN THE UNITED KINGDOM TO ELIGIBLE COUNTERPARTIES AND PROFESSIONAL CLIENTS AND IS NOT INTENDED FOR, AND SHOULD NOT BE CIRCULATED TO, RETAIL CLIENTS (AS SUCH TERMS ARE DEFINED IN THE MARKETS IN FINANCIAL INSTRUMENTS DIRECTIVE 2004/39/EC (“MiFID”)). THIS DOCUMENT MAY NOT BE CIRCULATED OR DISTRIBUTED, WHETHER DIRECTLY OR INDIRECTLY, TO ANY PERSON IN SINGAPORE OTHER THAN (i)TO AN INSTITUTIONAL INVESTOR PURSUANT TO SECTION 274 OF THE SECURITIES AND FUTURES
ACT, CHAPTER 289 OF SINGAPORE (“SFA”), (ii) TO AN ACCREDITED INVESTOR OR OTHER RELEVANT PERSON UNDER SECTION 275 OF THE SFA OR (iii) OTHERWISE PURSUANT TO, AND IN ACCORDANCE WITH THE CONDITIONS OF, ANY APPLICABLE PROVISIONS OF THE SFA. IN JAPAN, THIS DOCUMENT IS BEING DISTRIBUTED TO JAPANESE BASED CLIENTS BY A SUBSIDIARY OR AFFILIATE OF BNP PARIBAS NOT REGISTERED AS A FINANCIAL INSTRUMENTS FIRM IN JAPAN AND IS INTENDED FOR PROFESSIONAL CLIENTS ONLY (AS DEFINED UNDER JAPANESE LAW). IT MAY NOT BE DISTRIBUTED TO ANY OTHER PERSON IN JAPAN.
THIS DOCUMENT IS NOT A PRODUCT OF THE RESEARCH DEPARTMENT. IT IS NOT SUBJECT TO THE LEGAL REQUIREMENTS APPLICABLE TO INVESTMENT RESEARCH AND CONSTITUTES NON-INDEPENDENT RESEARCH FOR THE PURPOSES OF THE FSA CONDUCT OF BUSINESS SOURCEBOOK. ACCORDINGLY, IN CONNECTION WITH THE DISTRIBUTION OF THIS DOCUMENT BNPP IS NOT SUBJECT TO ANY PROHIBITION ON DEALING AHEAD OF THE DISSEMINATION OF INVESTMENT RESEARCH.
This document is for information purposes only and there is no assurance that a transaction(s) will be entered into on such indicative terms. The indicative price(s) above have been prepared in good faith in accordance with BNP Paribas' own internal models and calculation methods and/or are based on or use available price sources where considered relevant. Indicative price(s) based on different models or assumptions may yield different results. Numerous factors may affect the price(s), which may or may not be taken into account. Therefore, these indicative price(s) may vary significantly from indicative price(s) obtained from other sources or market participants. BNP Paribas expressly disclaims any responsibility for the accuracy or completeness of its own internal models or calculation methods, the accuracy or reliability of any price sources used, any errors or omissions in computing or disseminating these indicative price(s), and for any use you make of the price(s) provided. The indicative price(s) do not represent (i) the actual terms on which a new transaction could be entered into, (ii) the actual terms on which any existing transactions could be unwound, (iii) the calculation or estimate of an amount that would be payable following an early termination of the transactions or (iv) the price(s) given to the transactions by BNP Paribas in its own books of account for financial reporting, credit or risk management purposes.
This document may contain certain performance data based on back-testing, i.e. simulations of performance of a strategy, index or assets as if it had actually existed during a defined period of time. To the extent any such performance data is included, the scenarios, simulations, development expectations and forecasts contained in this document are for illustrative purposes only. All estimates and opinions included in this document constitute the judgment of BNP Paribas S.A. and its affiliates as of the date of the document and may be subject to change without notice. This type of information has inherent limitations which recipients must consider carefully. While the information has been prepared in good faith in accordance with BNPP’s own internal models and other relevant sources, an analysis based on different models or assumptions may yield different results. Unlike actual performance records, simulated performance returns or scenarios may not necessarily reflect certain market factors such as liquidity constraints, fees and transactions costs. Actual historical or back tested past performance does not constitute an indication of future results or performance.
This document is only intended to generate discussion regarding particular products and investments and is subject to change and may be discontinued. We are willing to discuss it with you on the assumption that you have sufficient knowledge, experience and professional advice to understand and make your own independent evaluation of the merits and risk of the proposed structures. The information contained herein is not and under no circumstances is to be construed as, a prospectus, an advertisement, a public offering, an offer ot sell securities described herein, or solicitation of an offer to buy securities described herein, in Canada, the U.S. or any other province or territory nor shall it be deemed to provide investment, tax, accounting or other advice. Transactions involving the product(s) described in this
document may involve a high degree of risk and the value of such transactions may be highly volatile. Such risks include, without limitation, risk of adverse or unanticipated market developments, risk of counterparty or issuer default, risk of adverse events involving any underlying reference obligation or entity and risk of illiquidity. In certain transactions, counterparties may lose their entire investment or incur an unlimited loss. The information relating to performance contained in this document is illustrative and no assurance is given that any indicated returns, performance or results will be achieved. Moreover, past performance is not indicative of future results. Information herein is believed reliable but BNP Paribas and its affiliates do not warrant or guarantee its completeness or accuracy. All information, terms and pricing set forth herein reflect our judgment at the date and time hereof and are subject to change without notice. In the event that we were to enter into a transaction with you, we will do so as principal (and not as agent or in any other capacity, including, without limitation, as your fiduciary, advisor or otherwise). Only in the event of a potential transaction will an offering document be prepared, inwhich case, you should refer to the prospectus or offering document relating to the above potential transaction which includes important information, including risk factors that relate to an investment in the product(s) described herein.
As an investment bank with a wide range of activities, BNPP may face conflicts of interest, which are resolved under applicable legal provisions and internal guidelines. You should be aware, however, that BNPP may engage in transactions in a manner inconsistent with the views expressed in this document, either for its own account or for the account of its clients.
Prior to transacting, you should ensure that you fully understand (either on your own or through the use of independent expert advisors) the terms of the transaction and any legal, tax and accounting considerations applicable to them. You should also consult with independent advisors and consultants (including, without limitation, legal counsel) to determine whether entering into of any securities transactions contemplated herein would be contrary to local laws. The information contained herein is provided to you on a strictly confidential basis and you agree that it may not be copied, reproduced or otherwise distributed by you, whether in whole or in part (other than to your professional advisers), without our prior written consent. Asa principal, we will generally conduct our business without regard to the consequences of such conduct (adverse or otherwise) to you. Neither we, nor any of our affiliates, nor any of their respective directors, partners, officers, employees or representatives accepts any liability whatsoever for any direct or consequential loss arising from any use of this document or their content; and any of the foregoing may from time to time act as manager, co-manager or underwriter of a public offering or otherwise, in the capacity of principal or agent, deal in, hold or act as market makers or advisors, brokers or commercial and/or investment bankers in relation to the securities or related derivatives that are discussed herein. BNP Paribas and its affiliates may (or may in the future) hold a position or act as a market maker in the financial instruments discussed, or act as an advisor, manager, underwriter or lender to such issuer. In no circumstances shall BNP Paribas or its affiliates be obliged to disclose any information that it has received on a confidential basis or to disclose the existence thereof.
This document will have been approved for publication and distribution in the United Kingdom by BNP Paribas London Branch, a branch of BNP Paribas SA whose head office is in Paris, France. BNP Paribas London Branch is registered in England and Wales under No. FC13447. Registered Office: 10 Harewood Avenue, London, NW1 6AA. BNP Paribas SA is incorporated in France with limited liability with its registered office at 16 boulevard des Italiens, 75009 Paris. BNP Paribas London Branch is authorised and supervised by the Autorité de Contrôle Prudentiel and is authorised and subject to limited regulation by the Financial Services Authority ("FSA") for the conduct of its designated investment business in the United Kingdom. Details of the extent of its authorisation and regulation by the Financial Services Authority are available upon request. BNP Paribas SA, a limited company, is registered as a bank with the “Comité des Etablissements de Crédit et des Entreprises d’Investissement” (“CECEI”) and is regulated by the “Autorité des Marchés Financiers” (“AMF”) for the conduct of its designated investment business in France.
In the United States, this document is distributed by BNP Paribas Securities Corp., an affiliate of BNP Paribas. BNP Paribas Securities Corp. is a U.S. registered broker-dealer and a member of FINRA, the NYSE and other principal exchanges. U.S. investors considering options trading may wish to review the Options Disclosure Document: Characteristics and Risks of Standardized Options (http://www.optionsclearing.com/publications/risks/riskchap1.jsp). The risk of loss in trading options and other derivatives can be substantial. Options involve risk and are not suitable for all investors. This brief statement does not disclose all the risks and other significant aspects in connection with transactions of the type described in the document.
Any offer or sale of securities described herein in Canada will be made only under an exemption from the requirements to file a prospectus with the relevant Canadian securities regulators and only by a dealer properly registered under applicable laws or, alternatively, pursuant to an exemption from the dealer registration requirement in the relevant province or territory of Canada in which such offer or sale is made. No securities commission or similar regulatory authority in Canada has reviewed or in any way passed judgment upon these materials, the information contained herein, or the merits of any securities described herein, and any representation to the contrary is an offence.
In Hong Kong, this document is distributed by BNP Paribas Hong Kong Branch which is regulated as a Licensed Bank by the Hong Kong Monetary Authority and is registered as a Registered Institution by the Securities and Futures Commission for the conduct of dealing in securities, advising on securities and advising on corporate finance.
In Singapore, clients should contact BNP Paribas Securities Singapore Pte Ltd in respect of any matters arising from, or in connection with, the contents of this document.
Clients should contact and execute transactions through a BNP Paribas entity in their home jurisdiction unless governing law permits otherwise.
By accepting this document you agree to be bound by the foregoing limitations.
© BNP Paribas (2012). All rights reserved.
Disclaimer
50