Embed Size (px)
Citation preview

Head Disk Interface Prediction Using the Servo Variable Gain Amplifier
and Head Media Spacing
by
Weerayoot Wachirapornpongsa
A thesis submitted in partial fulfillment of the requirements for the degree of Master of Science in
Microelectronics and Embedded Systems
Examination Committee: Dr. Mongkol Ekpanyapong (Chairperson) Assoc. Prof. Erik L. J. Bohez Mr. Bundit Jangsrisert (External Expert)
Nationality: Thailand Previous Degree: Bachelor of Engineering in Computer Engineering
King Mongkut's Institute of Technology Ladkrabang, Thailand
Scholarship Donor: Western Digital - AIT Fellowship
Asian Institute of Technology
School of Engineering and Technology Thailand
May 2015

ii
ACKNOWLEDGEMENTS
I would like to express appreciation to my advisor, Dr. Mongkol Ekpanyapong, whose always guide me with good suggestion and help to fulfill some information that had been missing in this thesis. This thesis cannot be accomplished without his constant help. I also would like to thank my committee member, Assoc.Prof. Erik L.J. Bohez and Mr. Bundit Jangsrisert who share me some technical solution and help to point out some missing information in this thesis research. In addition, I would say thank you to Mr. Mak Chee Wai who is my classmate and a leader of the class during entire coursework period. He was fain to give us any suggestion and try his best to help to figure out my thesis problem. I am sincerely graceful to Mr. Tom Takan whose help me out with his useful technical experience and give me some good guidance. I also would like to give thanks to Mr. Suttisak Nilchim and Mr. Prakolkij Kanjanapa who are my classmate and be united in any group assignment as well as help out in any issue during study period. I express my warm thanks to Mr. Apisak Srihamat, Mrs. Nantaporn Nachaiphum, Mr. Khan Siringampen, Mrs. Arphaporn Krathet, and everyone in Firmware and FIT lab member for their great supports. Special thanks to Mrs. Parichat Rodthong who help me in any administration issue and coordinate with advisors about an examination appointment. Finally, very special thanks to my family and my girlfriend who always encourage and cheer me up.

iii
ABSTRACT
Head disk contact is one of the main issue in hard disk drive manufacturing which can cause head damage. This thesis study new method to avoid head and disk to be in contact by using predictive data of servo variable gain amplifier (SVGA). SVGA at head touchdown will be predicted from curve fitting data between head-media fly height and SVGA which were collected at different fly height distance. Head-media fly height will be adjusted for each data collection loop to avoid head touch down on the media. The predictive SVGA at head touchdown will be used as a reference SVGA to map out all those bad track that might come closer to head touchdown. This thesis research also convert data of predictive SVGA of each data zone to heater power to be able to compare result data with touchdown power from the conventional method. The discussion and experimental result of bad track detection with this thesis method was included in this thesis as well.

iv
TABLE OF CONTENTS
CHAPTER TITLE PAGE
Title Page i Acknowledgements ii Abstract iii Table of Contents iv List of Figures vi List of Tables vii List of Abbreviations viii 1 Introduction 1 1.1 Background 1 1.2 Statement of the problems 1 1.3 Objectives of the Research 1 1.4 Scope 2 2 Literature Review 3 2.1 Hard disk 3 2.1.1 Production test process 4 2.2 Thermal Fly Height Control (TFC) 6 2.3 Signal and Noise in PMR 6 2.4 Hard Disk Drive Servo Systems 7 2.5 Touch down detection 8 3 Methodology 11 3.1 Concepts 11 3.1.1 SVGA (Servo Variable Gain Amplifier) 11 3.1.2 HMS (Head Media Spacing) 12 3.1.3 TD (Touchdown) 13 3.2 Method 15 3.2.1 Overview 15 3.2.2 Method to find good track 16 3.2.3 Method to collect servo scan for candidate track 18 3.2.4 Method of predictive SVGA calibration 20 3.2.5 Method to detect bad track with predictive SVGA 21 4 Result and Discussion 25 4.1 The result and discussion of predicted SVGA 25 4.2 The result and discussion of predicted SVGA when convert
to DFH power 27
4.3 The result and discussion of touchdown track map out with predictive SVGA method
30
5 Conclusion and Recommendations 37 5.1 Conclusion 37 5.2 Recommendation for further study 37

v
6 Reference 39

vi
LIST OF FIGURES
FIGURE TITLE PAGE
2.1 HDD component 3 2.2 3D model of Hard disk drive 4 2.3 Test equipment machine and 6-axis robot arm for feeding drives to
tester 5
2.4 Read/Write element protrusion with and without TFC apply 6 2.5 BER improvement as head clearance reduces 7 2.6 Magnetic head position control in hard disk drive 8 2.7 Servo pattern in the servo sector 8 2.8 Signal Amplitude and modulation as a function of heater power 9 2.9 Modulation envelope as the heater power increase 10 3.1 Read Channel Block diagram (Servo Portion) 12 3.2 Head Media spacing layout 13 3.3 Head is pulled off track when touching down 14 3.4 RPM of motor is changed when touching down 14 3.5 High frequency response when touching down because of vibration 15 3.6 Flow Chart of overall process to generate SVGA at touchdown
point 16
3.7 Flow Chart of method to find good track 17 3.8 Example of next candidate track after retry 17 3.9 Flow Chart of Method to collect servo scan for candidate track 19 3.10 Flow Chart of predictive SVGA calibration 20 3.11 Data plot between SVGA and wedge for good track 21 3.12 Data plot between SVGA and wedge for bad track 22 3.13 Flow Chart of method to process entire media surface 23 3.14 Flow Chart of method to process servo scan of each track 24 4.1 Linear equation between Fly height and SVGA of zone 1 25 4.2 2nd order polynomial equation between Fly height and SVGA of
zone 1 26
4.3 Linear equation between Fly height and SVGA of zone 60 27 4.4 2nd order polynomial equation between Fly height and SVGA of
zone 60 27
4.5 Linear equation between DFH power and SVGA of zone 1 28 4.6 Linear equation between DFH power and SVGA of zone 60 29 4.7 Example of touchdown sensor when it is triggered for bad track 30 4.8 Example of surface log to indicate LTA and HTA are set 31 4.9 Example defect plot from surface log to indicate bad location 31 4.10 Example polar plot from surface log to indicate bad location 32 4.11 Example of surface log after run this thesis method 32 4.12 Example defect plot from surface log of thesis method to indicate
bad location 33
4.13 Example polar plot from surface log of thesis method to indicate bad location
33
4.14 Data plot between SVGA and wedge of one of bad location 34 4.15 Defect on the media which can cause TDS to be triggered 35 4.16 Example of polar plot of disk warp 35

vii
LIST OF TABLES
TABLE TITLE PAGE
4.1 Summary table of candidate track of zone 1 25 4.2 Summary table of candidate track of zone 60 26 4.3 Summary variant percentage result of DFH power of zone 0 28 4.4 Summary variant percentage result of DFH power of zone 60 29 4.5 Summary variant percentage result of DFH power of head 0 29 4.6 Summary variant percentage result of DFH power of head 1 29

viii
LIST OF ABBREVIATIONS
FH Fly Height TFC Thermal Fly Height Control BER Bit Error Rate SNR Signal to Noise Ratio PMR Perpendicular Magnetic Recording HDI Head Disk Interface ABS Air Bearing Surface TD Touchdown HMS Head Media Spacing SVGA Servo Variable Gain Amplifier HGA Head Gimbal Assembly TA Thermal Asperity ISR Interrupt Service Routine PES Position Error Rate HDD Hard Disk Drive PCB Print Circuit Board SOC System on Chip HSA Head Stack Assembly PES Position Error Signal DFH Dynamic Fly Height RPM Round per Minute TDS Touchdown Sensor LTA Low Thermal Asperity HTA High Thermal Asperity DAC Digital-to-Analog Converter VCM Voice Coil Motor S4W Spiral Seeded Self Servo Write

1
CHAPTER 1
INTRODUCTION
1.1 Background
As recording density continue grow to more than 1Tb/in2 in the hard disk drive, the head disk clearance between read/write heads and magnetic recording must be reduced to less than 2nm. To achieve this target spacing, the application of thermal fly height (FH) control (TFC) technology had been implemented. The approaches to reduce the head media spacing can be achieved by heat up the head during read write operation. This can cause read/write heads to protrude out and effectively reduce head media spacing. However during idle operation, head will be moved back to higher fly height. With current extremely low head media spacing during read and write can improve bit error rate (BER) and increase signal noise ratio (SNR) in perpendicular magnetic recording (PMR) however it increase the chance of read/write head to suffer with head disk interface problem (HDI). Even though TFC had been implemented and allow hard disk system to control the fly height with some critical parameters but actually fly height can be changed with uncontrolled parameters as well such as temperature, media roughness, air bearing surface (ABS), and altitude. So the method to detect head touch down (TD) need to be implemented to avoid head disk interface problem which can degrade head as well as increase some particles into hard disk system.
1.2 Statement of the Problems Head disk interface (HDI) is one of the main problems that can result in degradation of hard disk drive performance because HDI can damage head which degrade performance on both read and write operation as well as decrease overall hard disk reliability. In addition, HDI can increase particles in the hard disk system because when head contacts with lube layer of solvent that coated to the media surface. Molecule of lubricant can be move due to head fly over and can carry lube to pile together at some media spot which can be result to media peak. So this will increase possibility of HDI problem in the system. For some situation despite head is not directly contact with media but it flies too close to some media roughness. This situation can generate heat during this small gap and result in head damage as well. 1.3 Objectives of the Research
The objective of this thesis is to research a new method to predict head disk interface by using plot of servo variable gain adaptive (SVGA) and head media spacing (HMS). The SVGA value will be predicted at point of HMS zero, which was assumed as HDI point. Actually current conventional method already have process to measure head touchdown powered (mW) for each individual data zone. However there are fixed value based on the dedicated good data track for individual data zone, which assumed that it has smooth media roughness. In fact, not all of data tracks have good media roughness so this research

2
will be applied to map out the data track which exposed to risk the HDI problem with predicted SVGA from data plotted data to avoid the HDI problem.
1.4 Scope
This thesis will consist of some tasks to achieve objective of this research as below.
• Study the relation between three main parameters SVGA, HMS, and head power.
• Implement the controller firmware and process firmware to collect SVGA data and
internally apply curve-fitting to be able to predict the SVGA at zero head media
spacing or HDI point.
• Measure the accuracy of this thesis method by converting the predictive SVGA
result to power (mW) compare with fixed TD powered that processed from the
conventional process.
• Implement additional touchdown detection by using this thesis method to the
current process. Then check the result whether can be mapped out some track that
exposed to HDI risk or not.
3
CHAPTER 2
LITERATURE REVIEW
2.1 Hard disk Hard disk is the most complex component in the personal computer. Currently HDD technology can achieve to store data more than one terabyte per single platter so aerial density of media technology gets increase significantly in every single year. However to achieve the high aerial density drive, process of hard disk drive manufacturing need to be extremely precise in term of all mechanical or fabrication. One hard disk drive consist of five main component parts; head, media, motor, PCB, other accessory. Each part has different process line manufacturing and also requires specific advance engineering filed. Head or slider is the most costly component in the hard disk drive because it requires complex wafer fabrication process. The size of slider is very small so there is a lot of step from the blank wafer until completed slider head and each step require very precise machine to handle. Machine will handle the completed slider for bonding it with suspension. After slider is boned with suspension this part will be so-call head gimbal assembly (HGA). Once HGA is stacked together with the circuit and actuator, this is so called head stack assembly or HSA. Obviously that there are a lot of process for manufacturing one HSA so highly cost also from the labor operator as well. The print circuit board (PCB) consists of various chipset to take control in the different unit; there is a chipset for motor spindle controller to ensure the disk is rotated at correct RPM. There is a chipset for actuator controller to control the actuator arm to place at the correct location on the media platter. There is a chip set for hard disk drive interface to communicate with the host. However the main processor that controls the overall hard disk operation, we so called system on chip (SOC). This processor has an internal digital signal processing as well as memory interface. All these electronic components are mounted onto PCB with highly automate technology. [4]
Figure 2.1 HDD component [7] During the Hard disk assembly process, all of hard disk component will be installed onto motor based including media and HSA. However the process not just only install the component part but some test need to be performed intermittent such as after the step of media
4
installation, drive need to perform a motor spinning to verify the balance of the hard disk on both XY and Z plane and wire balance is inserted to minimize the imbalance. After every component is assembled, vacuum is performed to remove all of particles in the HDD before top cover install. Bear in mind those hard disk assemblies have to be done in clean room to ensure that non-particle is in the hard disk system. Before HDD is processed to production test, servo pattern is written to write spiral seed pattern on the media then PCBA is attached as well as servo filler is the last process before production test.
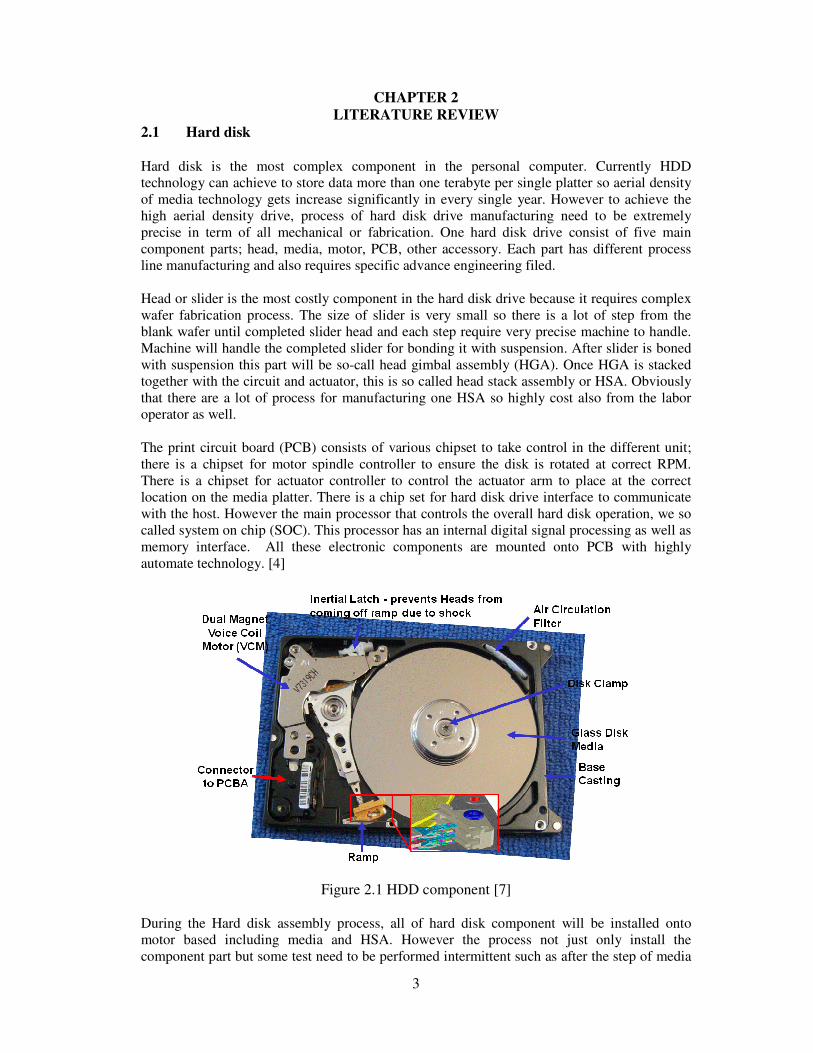
Figure 2.2 3D model of Hard disk drive [8] 2.1.1 Production test process
After every component are assembled to be a completed HDD, production test need to be performed to optimize some critical parametric to improve drive performance with various environment condition. All HDD will be performed process test on both ambient and hot temperature to ensure the drive performance reliability. This process will screen out some drive that cannot pass the defect scan process that might have too much defect location. HDD will be configured to customer configuration with in this state to ensure that our drive can meet customer requirement as well as perform some customer test to make sure that the known customer issue will not be repeated again. There are few types of test equipment machines. Typically test machine have more than thousand test slots so it can run more than thousand drives at the same time. The test machine provided a high speed, high reliability, advance automation system with high accurate 6-axis robot arm that can feed the drive to test slot or remove the drive from test slot after test completed. With this automation machine, one operator can handle around 7k slots so one operator can manage more than one machine.

5
Figure 2.3 (Top) One of the test equipment machine and (Bottom) 6-axis robot arm to feed
the drives [9] The production test process consists of 3 fixed test modules and 1 configuration module. [9]
• PreBI This module is mainly initializing the drive and prepare for burn in segment. At first flash code is loaded following with firmware code. After firmware is loaded to memory then drive can perform some specific functional such as channel optimization and defect management on reserved area. Once reserved area completely optimizes and defect manages then firmware code is downloaded and stored to reserved area. In PreBI module, channel optimization for reserved area is performed after drive can wake-up in drive initialize state. Some channel parameter is optimized to optimal value and stored to flash. These parameters are optimized to ensure that the head and media combination are ready for read and write for reserved area. In addition, some channel
• BI This module performs defect management by mapping out both servo and data defects in user area. Then format the whole user area with defect list that was populated from defect scan. Parameter optimization still need to be performed within this module however not only channel parameter need to be performed but also servo parameter. Servo system is optimized for seek and track follow performance as well as channel system is optimized for head and media performance. With these optimization, the servo and data error rate performance can be improved as well
• PostBI This module will mainly perform customer mode write and read test also system related screening to enhance drive quality. Temperature sensitive test is performed on both hot temperature to monitor on servo behavior and ambient temperature to monitor the error rate behavior. Once the drive has done the defect management test, the total capacity after drive format will be checked whether it can reach the capacity target. Finally drive will performed write test and read test on entire surface in user mode to check the error rate performance and SMART attribute checking. Some more functional test also include in this module.
• XCFG Last module will perform the limit checking by checking the result from the previous test against limit. The limit is specific on customer so different customer
6
might have different requirement and performance limitation. Finally the pass drive will be configured according to customer requirement so some drive feature might be enabled with some customer but disable with other customer.
2.2 Thermal Fly Height Control (TFC)
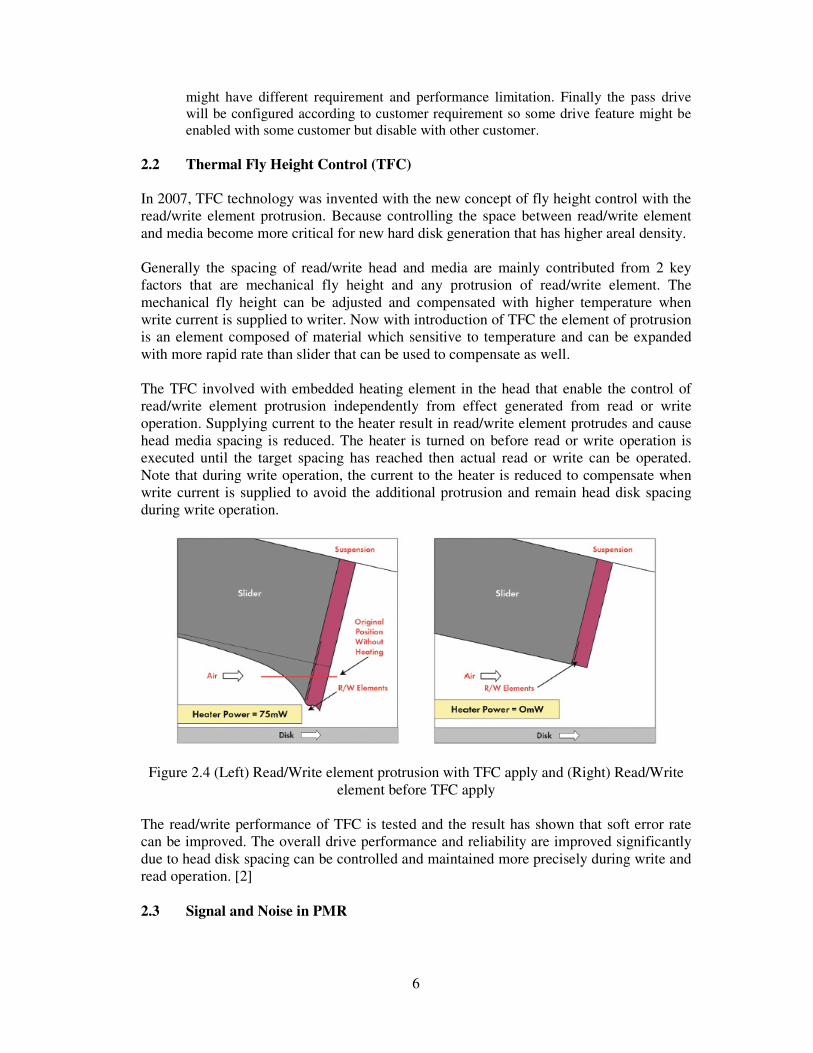
In 2007, TFC technology was invented with the new concept of fly height control with the read/write element protrusion. Because controlling the space between read/write element and media become more critical for new hard disk generation that has higher areal density. Generally the spacing of read/write head and media are mainly contributed from 2 key factors that are mechanical fly height and any protrusion of read/write element. The mechanical fly height can be adjusted and compensated with higher temperature when write current is supplied to writer. Now with introduction of TFC the element of protrusion is an element composed of material which sensitive to temperature and can be expanded with more rapid rate than slider that can be used to compensate as well. The TFC involved with embedded heating element in the head that enable the control of read/write element protrusion independently from effect generated from read or write operation. Supplying current to the heater result in read/write element protrudes and cause head media spacing is reduced. The heater is turned on before read or write operation is executed until the target spacing has reached then actual read or write can be operated. Note that during write operation, the current to the heater is reduced to compensate when write current is supplied to avoid the additional protrusion and remain head disk spacing during write operation.
Figure 2.4 (Left) Read/Write element protrusion with TFC apply and (Right) Read/Write element before TFC apply
The read/write performance of TFC is tested and the result has shown that soft error rate can be improved. The overall drive performance and reliability are improved significantly due to head disk spacing can be controlled and maintained more precisely during write and read operation. [2]
2.3 Signal and Noise in PMR
7
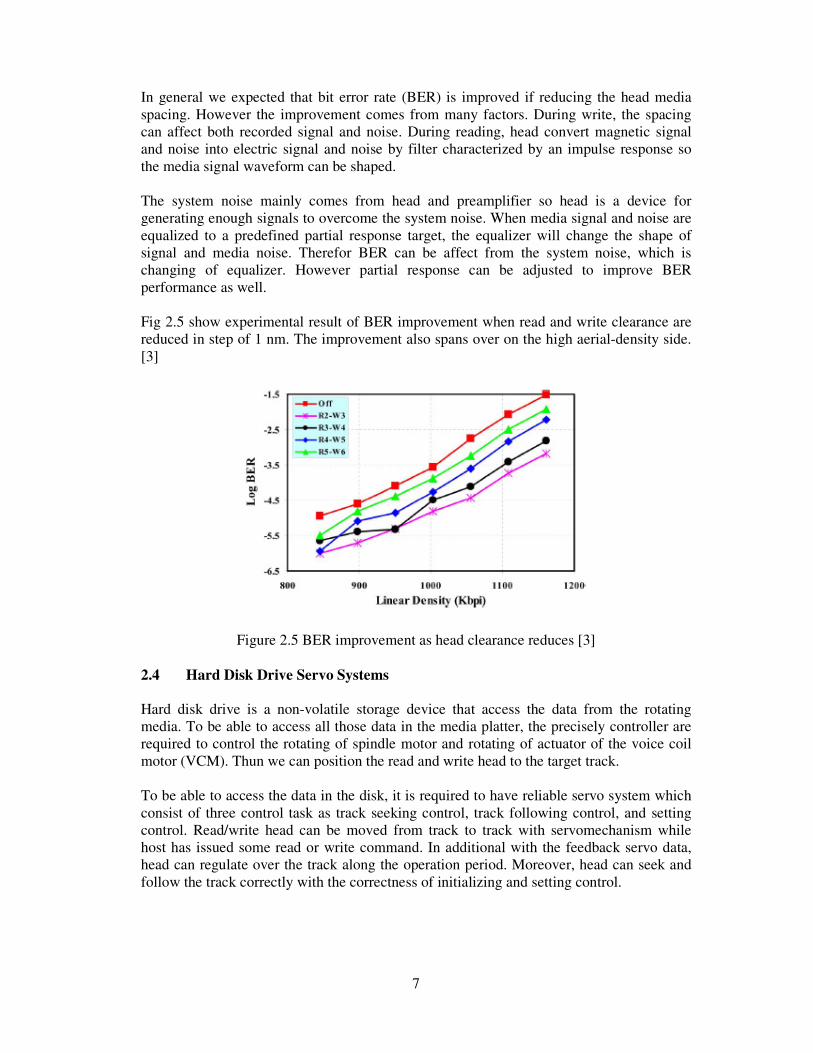
In general we expected that bit error rate (BER) is improved if reducing the head media spacing. However the improvement comes from many factors. During write, the spacing can affect both recorded signal and noise. During reading, head convert magnetic signal and noise into electric signal and noise by filter characterized by an impulse response so the media signal waveform can be shaped. The system noise mainly comes from head and preamplifier so head is a device for generating enough signals to overcome the system noise. When media signal and noise are equalized to a predefined partial response target, the equalizer will change the shape of signal and media noise. Therefor BER can be affect from the system noise, which is changing of equalizer. However partial response can be adjusted to improve BER performance as well. Fig 2.5 show experimental result of BER improvement when read and write clearance are reduced in step of 1 nm. The improvement also spans over on the high aerial-density side. [3]
Figure 2.5 BER improvement as head clearance reduces [3]
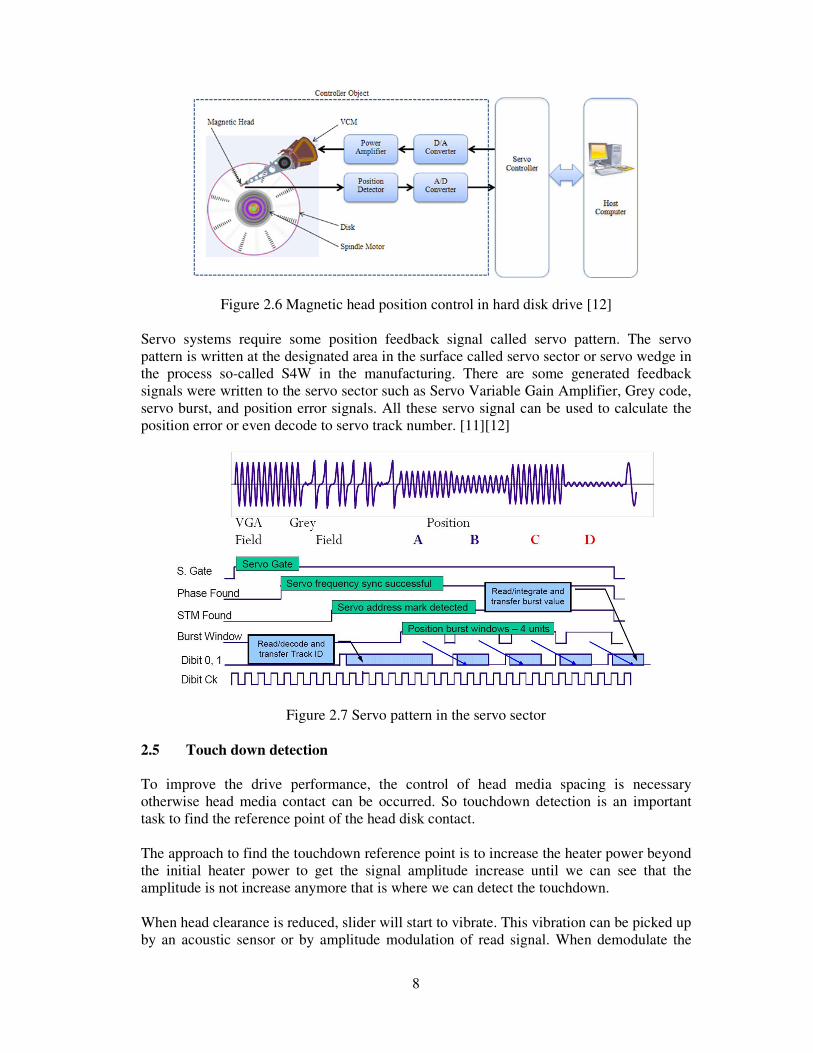
2.4 Hard Disk Drive Servo Systems
Hard disk drive is a non-volatile storage device that access the data from the rotating media. To be able to access all those data in the media platter, the precisely controller are required to control the rotating of spindle motor and rotating of actuator of the voice coil motor (VCM). Thun we can position the read and write head to the target track. To be able to access the data in the disk, it is required to have reliable servo system which consist of three control task as track seeking control, track following control, and setting control. Read/write head can be moved from track to track with servomechanism while host has issued some read or write command. In additional with the feedback servo data, head can regulate over the track along the operation period. Moreover, head can seek and follow the track correctly with the correctness of initializing and setting control.
8
Figure 2.6 Magnetic head position control in hard disk drive [12] Servo systems require some position feedback signal called servo pattern. The servo pattern is written at the designated area in the surface called servo sector or servo wedge in the process so-called S4W in the manufacturing. There are some generated feedback signals were written to the servo sector such as Servo Variable Gain Amplifier, Grey code, servo burst, and position error signals. All these servo signal can be used to calculate the position error or even decode to servo track number. [11][12]
Figure 2.7 Servo pattern in the servo sector
2.5 Touch down detection
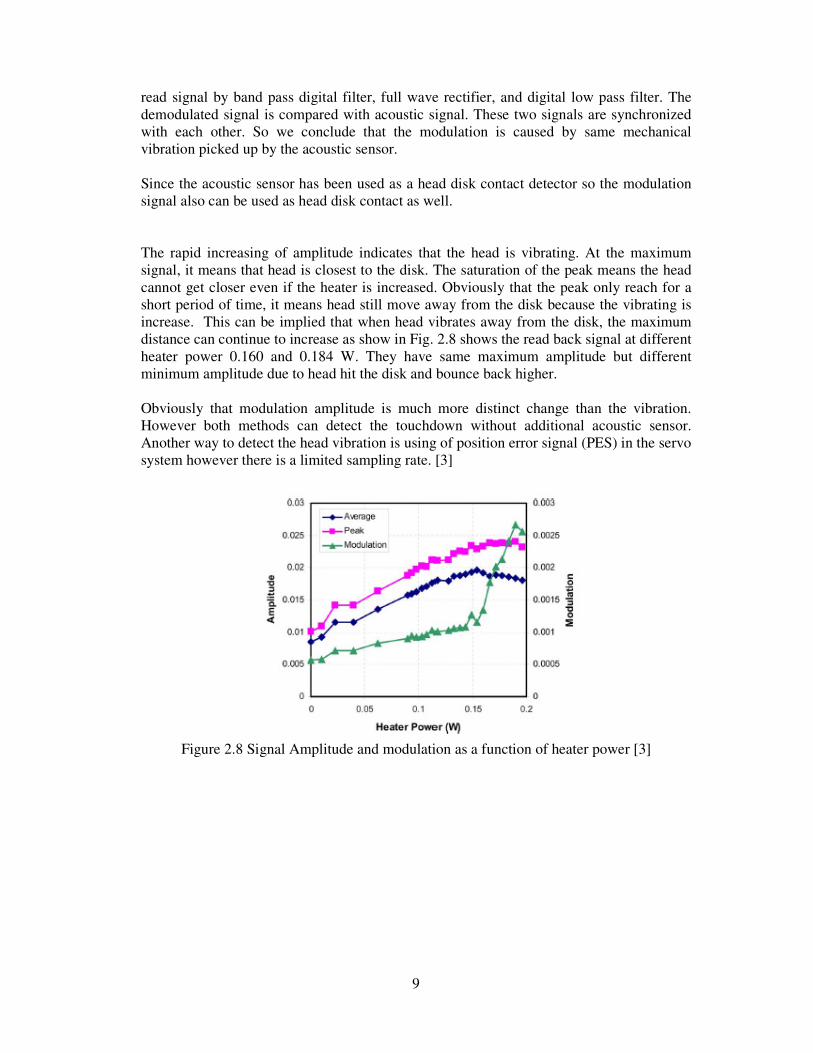
To improve the drive performance, the control of head media spacing is necessary otherwise head media contact can be occurred. So touchdown detection is an important task to find the reference point of the head disk contact. The approach to find the touchdown reference point is to increase the heater power beyond the initial heater power to get the signal amplitude increase until we can see that the amplitude is not increase anymore that is where we can detect the touchdown. When head clearance is reduced, slider will start to vibrate. This vibration can be picked up by an acoustic sensor or by amplitude modulation of read signal. When demodulate the
9
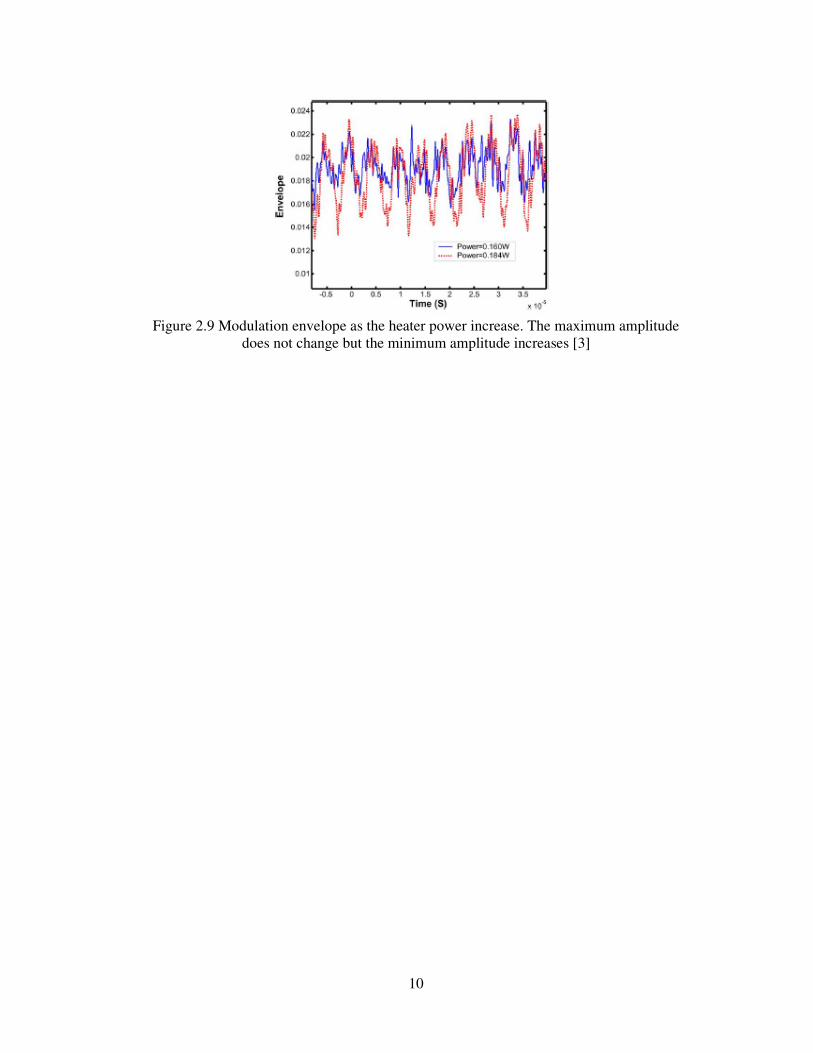
read signal by band pass digital filter, full wave rectifier, and digital low pass filter. The demodulated signal is compared with acoustic signal. These two signals are synchronized with each other. So we conclude that the modulation is caused by same mechanical vibration picked up by the acoustic sensor. Since the acoustic sensor has been used as a head disk contact detector so the modulation signal also can be used as head disk contact as well. The rapid increasing of amplitude indicates that the head is vibrating. At the maximum signal, it means that head is closest to the disk. The saturation of the peak means the head cannot get closer even if the heater is increased. Obviously that the peak only reach for a short period of time, it means head still move away from the disk because the vibrating is increase. This can be implied that when head vibrates away from the disk, the maximum distance can continue to increase as show in Fig. 2.8 shows the read back signal at different heater power 0.160 and 0.184 W. They have same maximum amplitude but different minimum amplitude due to head hit the disk and bounce back higher. Obviously that modulation amplitude is much more distinct change than the vibration. However both methods can detect the touchdown without additional acoustic sensor. Another way to detect the head vibration is using of position error signal (PES) in the servo system however there is a limited sampling rate. [3]
Figure 2.8 Signal Amplitude and modulation as a function of heater power [3]
10
Figure 2.9 Modulation envelope as the heater power increase. The maximum amplitude
does not change but the minimum amplitude increases [3]
11
CHAPTER 3 METHODOLOGY
3.1 Concepts
In this thesis, we start to study the relation between three parameters SVGA, HMS and head power. As we known that with current hard disk already implemented thermal fly height control (TFC) so the fly height will be higher or lower depend on how much protrude of the head. These protrude area will depend on how much power that the heater gain. So much power we give to heater, much protrude head will be. However much protrude head can result in lower fly height.
The new process firmware will be implemented to collect averaged raw SVGA data from each candidate tracks for certain times. Each time have different DFH power. Begin with the default DFH power that is optimum. For each time we back off DFH power with certain value. With this method, we can guarantee that we can measure SVGA at fly height equal to zero without any head touchdown problem. The data collection of HMS and SVGA will be calibrated on both linear regression and exponential regression to predict the SVGA at fly height equal to zero. The output of this process is binary result file in the hard disk drive that contain data collection of every data zone such as HMS, SVGA, and predictive SVGA. To check the accuracy of this method, predictive SVGA from both linear regression and exponential regression will be compared with the result report data from Touchdown calibration process to measure the accuracy percentage. At last, the predictive SVGA will be used as another factor in the process to map out some data track that have some wedge which has SVGA lower or close to predicted data. That mean those map out track are risk to have touchdown problem. 3.1.1 SVGA (Servo Variable Gain Amplifier)
SAGC (Servo automatic gain control) is a type of control loop, which automatically adjusts analog VGA gain to obtain the peak amplitude signal of ADC output. If the input signal has amplitude greater than the specific threshold, the negative gradient is generated which lower the VGA gain. On the other hand, if input signal has amplitude lower than the specific threshold, the positive gradient is generated which greater the VGA gain. So VGA always get adjust in every input signal to maintain the level of signal amplitude.
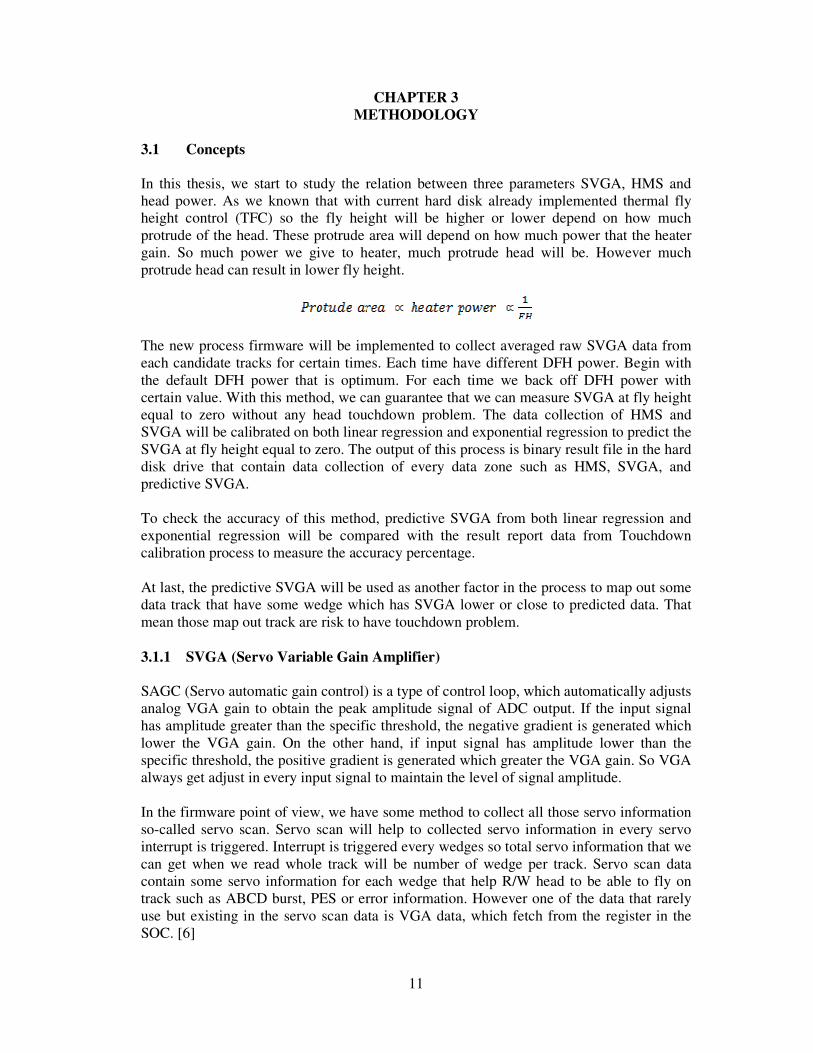
In the firmware point of view, we have some method to collect all those servo information so-called servo scan. Servo scan will help to collected servo information in every servo interrupt is triggered. Interrupt is triggered every wedges so total servo information that we can get when we read whole track will be number of wedge per track. Servo scan data contain some servo information for each wedge that help R/W head to be able to fly on track such as ABCD burst, PES or error information. However one of the data that rarely use but existing in the servo scan data is VGA data, which fetch from the register in the SOC. [6]
12
Figure 3.1 Read Channel Block diagram (Servo Portion) [6]
3.1.2 HMS (Head Media Spacing)
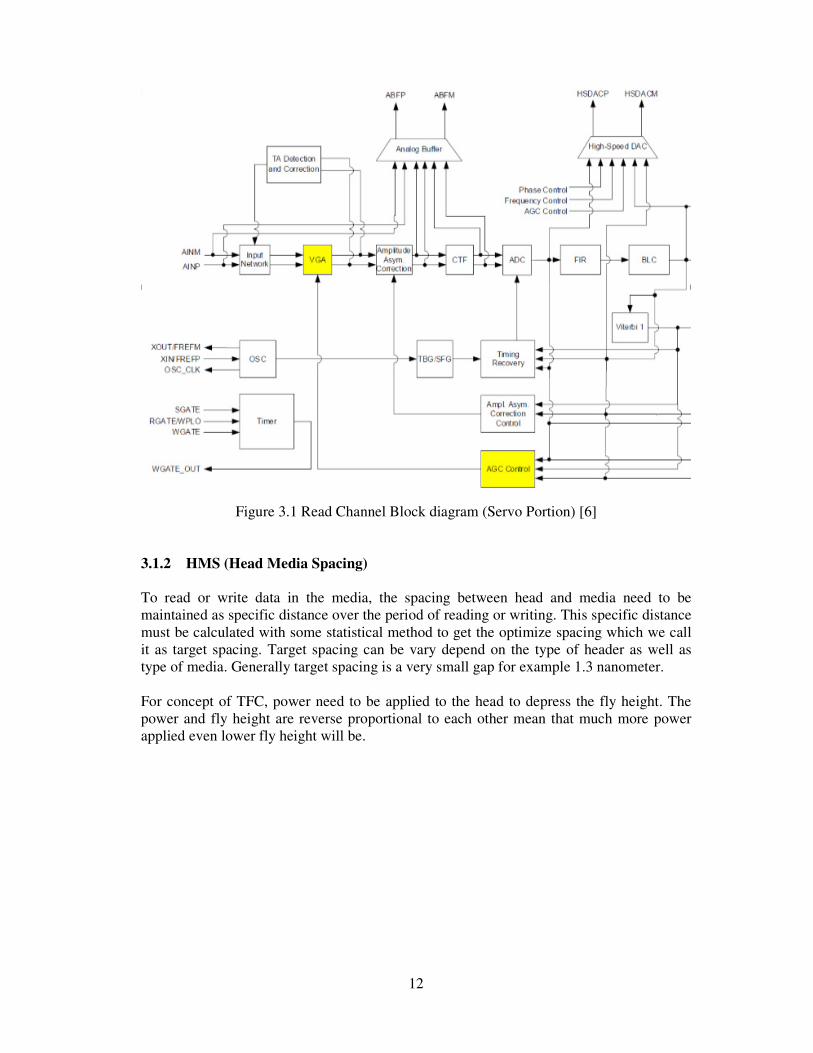
To read or write data in the media, the spacing between head and media need to be maintained as specific distance over the period of reading or writing. This specific distance must be calculated with some statistical method to get the optimize spacing which we call it as target spacing. Target spacing can be vary depend on the type of header as well as type of media. Generally target spacing is a very small gap for example 1.3 nanometer. For concept of TFC, power need to be applied to the head to depress the fly height. The power and fly height are reverse proportional to each other mean that much more power applied even lower fly height will be.
13
Figure 3.2 Head Media spacing layout [13] 3.1.3 TD (Touchdown)
Touchdown in term of hard disk drive is head touch the media. Head touchdown can cause head damage as well as media damage. However currently we have the sensor so-called TDS (Touchdown Sensor) but this sensor cannot work together when head is reading or writing because it will interfere with each other. TDS consists of two terminal thermally sensitive elements so it can detect only if head is close to touchdown or already touched the media. However with current hard disk drive process, we have one process so-call Touchdown Calibration (TD Cal) to estimate touchdown power. The result log will report an estimate power that can cause head to touchdown. This process purposely estimates touchdown power to calculate the optimum power for each data zone to achieve target spacing by using touchdown power minus with back off power. TD Cal use combination of method in order to achieve reliable touchdown detection and result log will be used as reference data to compare how accuracy of this thesis method later. [5] 3.1.3.1 Flex bias
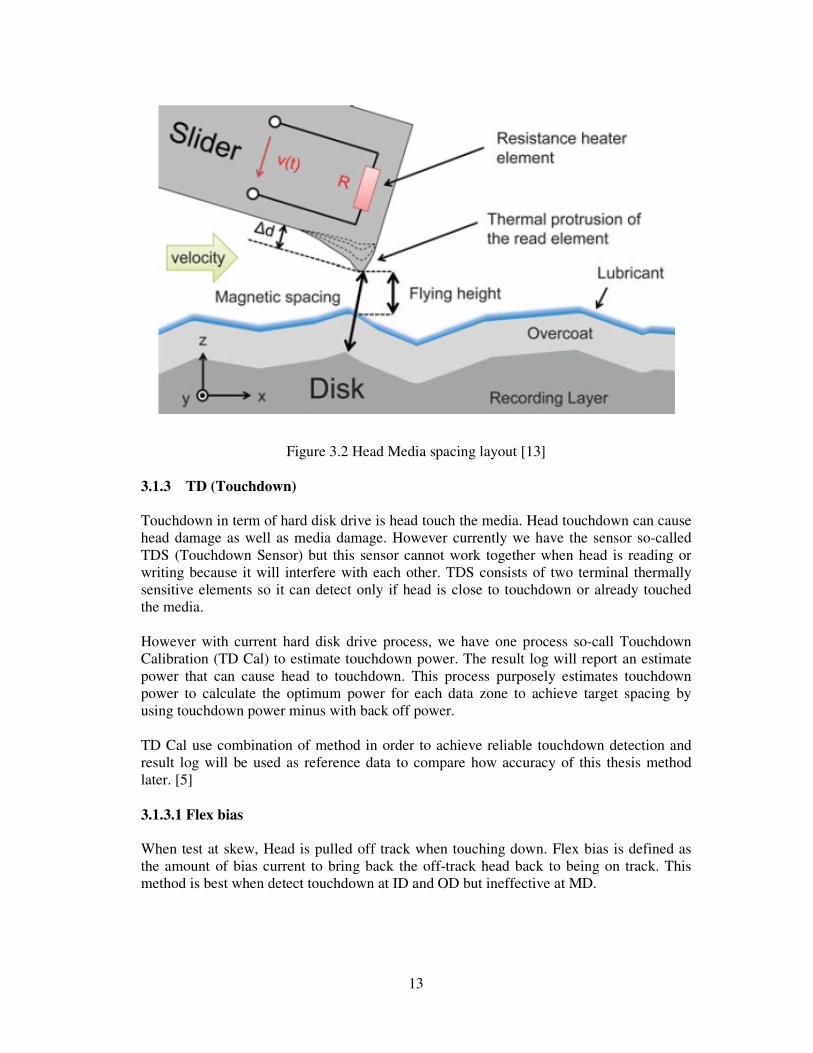
When test at skew, Head is pulled off track when touching down. Flex bias is defined as the amount of bias current to bring back the off-track head back to being on track. This method is best when detect touchdown at ID and OD but ineffective at MD.
14
Figure 3.3 head is pulled off track when touching down [5]
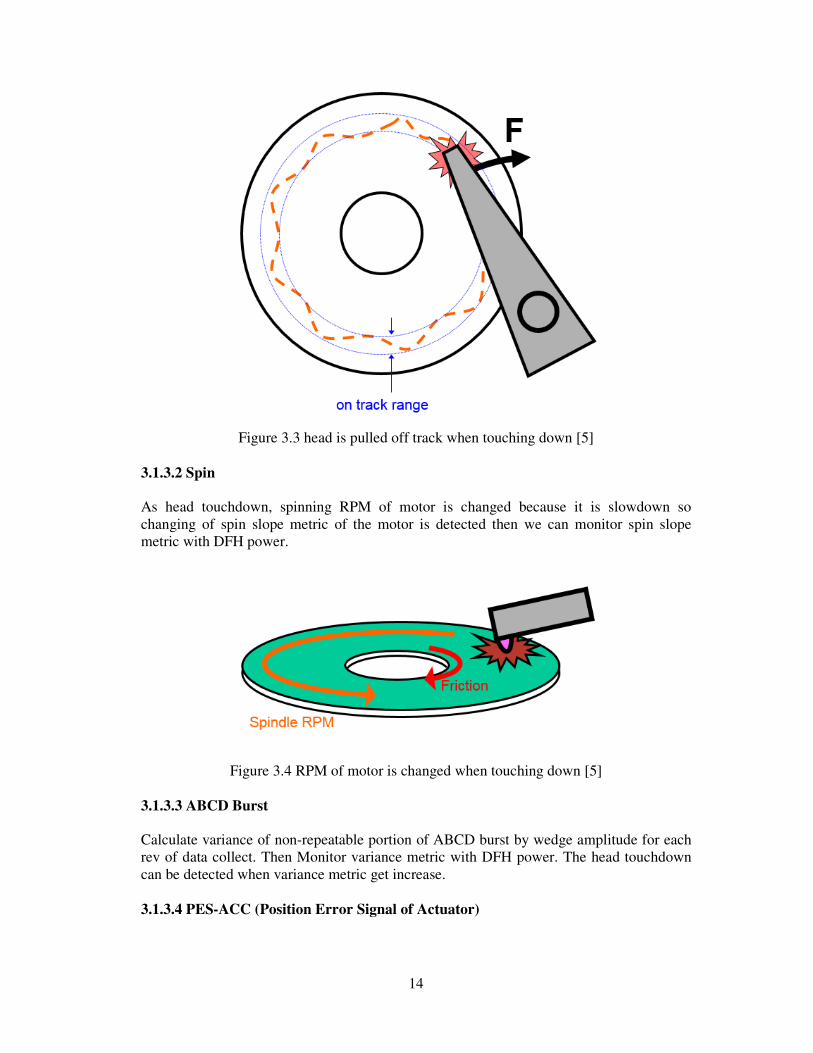
3.1.3.2 Spin As head touchdown, spinning RPM of motor is changed because it is slowdown so changing of spin slope metric of the motor is detected then we can monitor spin slope metric with DFH power.
Figure 3.4 RPM of motor is changed when touching down [5]
3.1.3.3 ABCD Burst
Calculate variance of non-repeatable portion of ABCD burst by wedge amplitude for each rev of data collect. Then Monitor variance metric with DFH power. The head touchdown can be detected when variance metric get increase. 3.1.3.4 PES-ACC (Position Error Signal of Actuator)
15
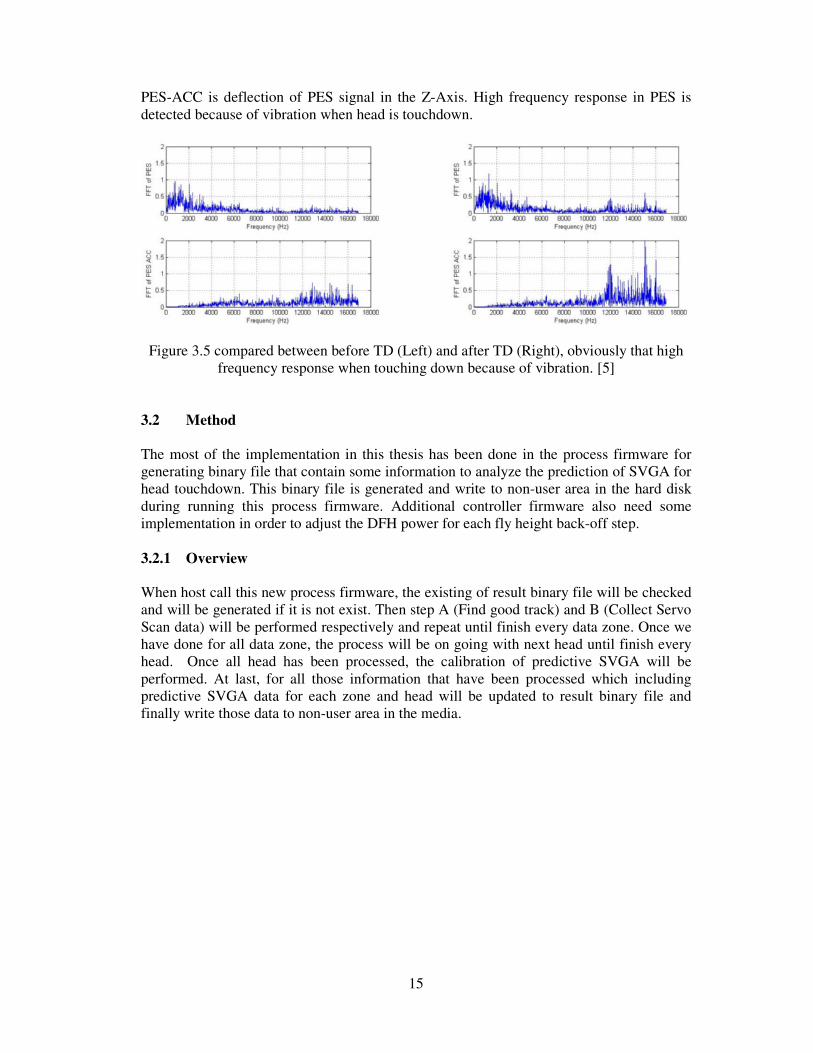
PES-ACC is deflection of PES signal in the Z-Axis. High frequency response in PES is detected because of vibration when head is touchdown.
Figure 3.5 compared between before TD (Left) and after TD (Right), obviously that high frequency response when touching down because of vibration. [5]
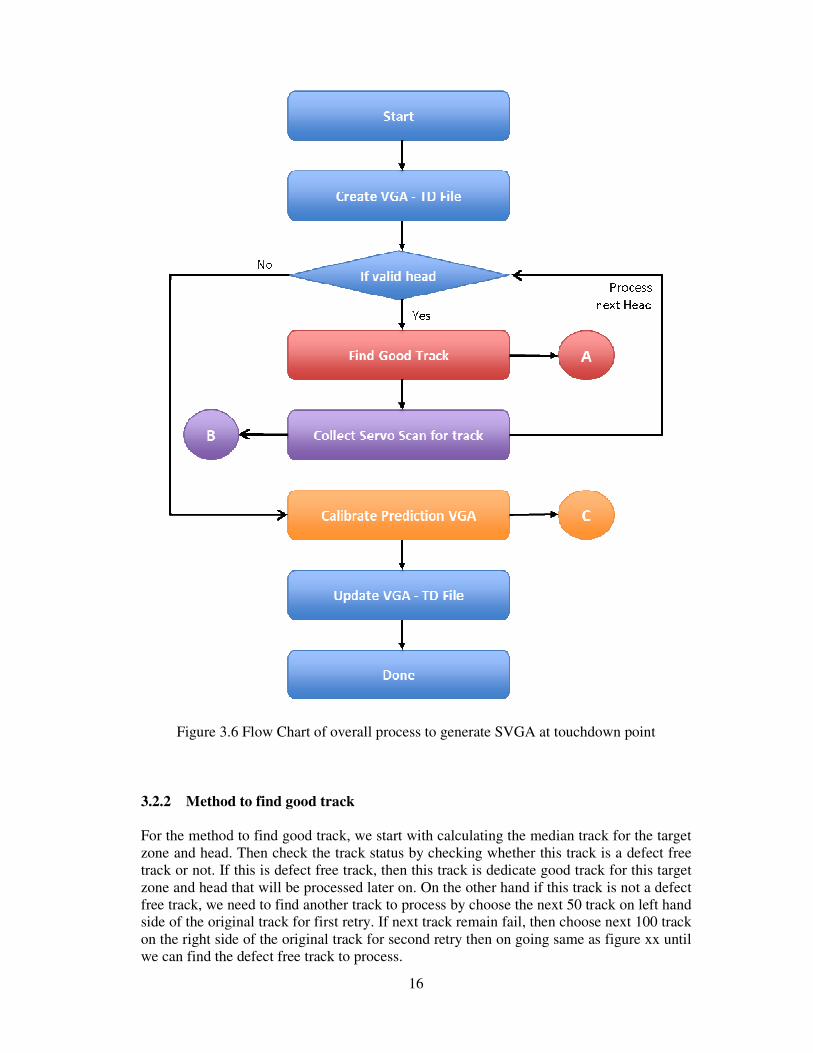
3.2 Method The most of the implementation in this thesis has been done in the process firmware for generating binary file that contain some information to analyze the prediction of SVGA for head touchdown. This binary file is generated and write to non-user area in the hard disk during running this process firmware. Additional controller firmware also need some implementation in order to adjust the DFH power for each fly height back-off step. 3.2.1 Overview
When host call this new process firmware, the existing of result binary file will be checked and will be generated if it is not exist. Then step A (Find good track) and B (Collect Servo Scan data) will be performed respectively and repeat until finish every data zone. Once we have done for all data zone, the process will be on going with next head until finish every head. Once all head has been processed, the calibration of predictive SVGA will be performed. At last, for all those information that have been processed which including predictive SVGA data for each zone and head will be updated to result binary file and finally write those data to non-user area in the media.
16
Figure 3.6 Flow Chart of overall process to generate SVGA at touchdown point
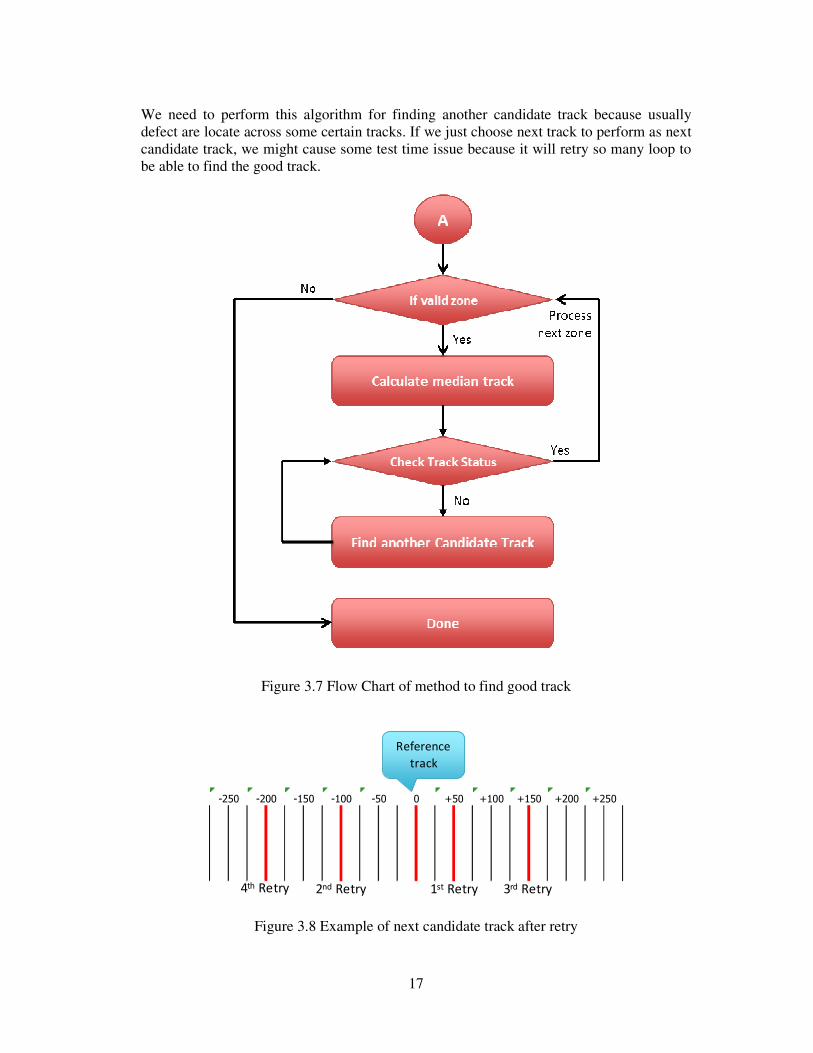
3.2.2 Method to find good track
For the method to find good track, we start with calculating the median track for the target zone and head. Then check the track status by checking whether this track is a defect free track or not. If this is defect free track, then this track is dedicate good track for this target zone and head that will be processed later on. On the other hand if this track is not a defect free track, we need to find another track to process by choose the next 50 track on left hand side of the original track for first retry. If next track remain fail, then choose next 100 track on the right side of the original track for second retry then on going same as figure xx until we can find the defect free track to process.
17
We need to perform this algorithm for finding another candidate track because usually defect are locate across some certain tracks. If we just choose next track to perform as next candidate track, we might cause some test time issue because it will retry so many loop to be able to find the good track.
Figure 3.7 Flow Chart of method to find good track
-50-100-150-200-250 0 +50 +100 +150 +200 +250
1st Retry2nd Retry 3rd Retry4th Retry
Reference
track
Figure 3.8 Example of next candidate track after retry

18
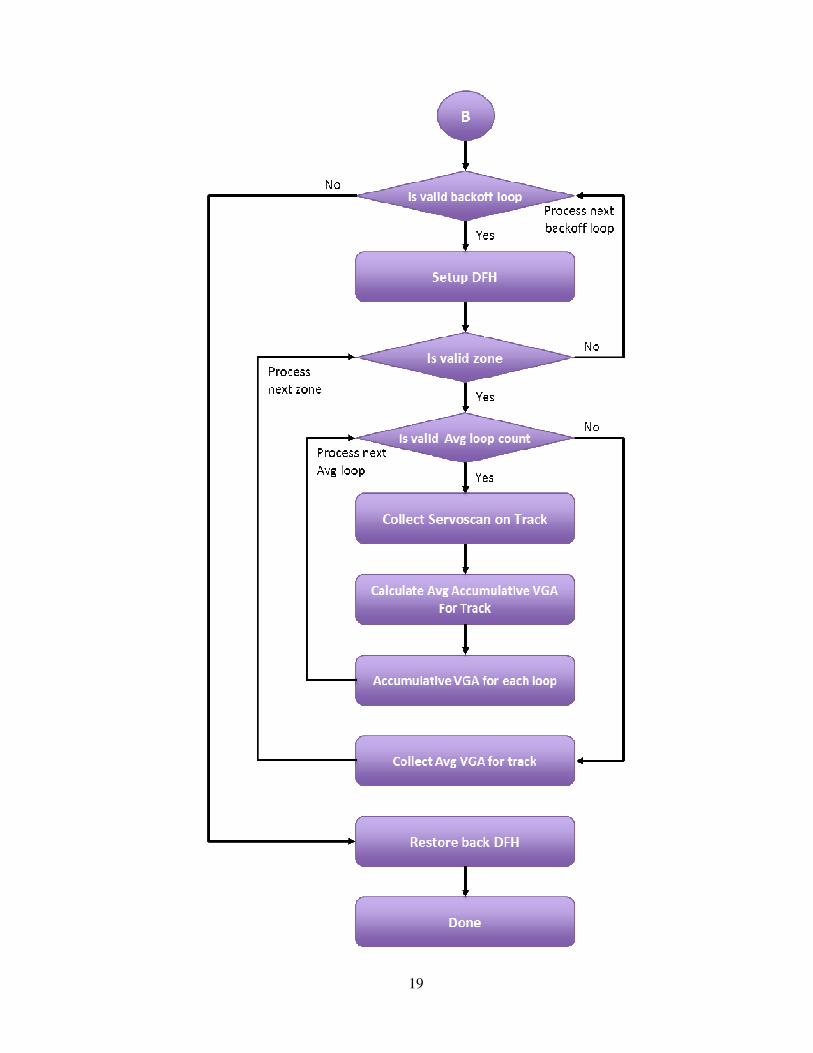
3.2.3 Method to collect servo scan for candidate track
For method to collect servo scan of target track, we start with setting up DFH power. This DFH power will be reduced for certain value to allow fly height to fly higher in every back-off loop. Then perform servo scan collection to collect all those SVGA from every wedges in the target track in order to calculate average SVGA of this track. We will perform SVGA collection and calculate average SVGA of this track for certain times to get the target value that will be used in the process of SVGA prediction. We repeat all those steps to collect SVGA until completed every data zone. Once all data zone has been collected SVGA of current DFH power so we move forward to next back off loop to repeat everything again with lower DFH power until finished every back-off loop. Once we have done SVGA collection for every data zone and every back-off loop, we will have series of data of average SVGA for each certain back-off DFH power and each data zone. Later these data will be used to predict SVGA at fly height equal to zero in the next module. However before we get out from SVGA data collection module, DFH power restoration is performed to set back DFH power to optimum state same as before we run this process.
19
20
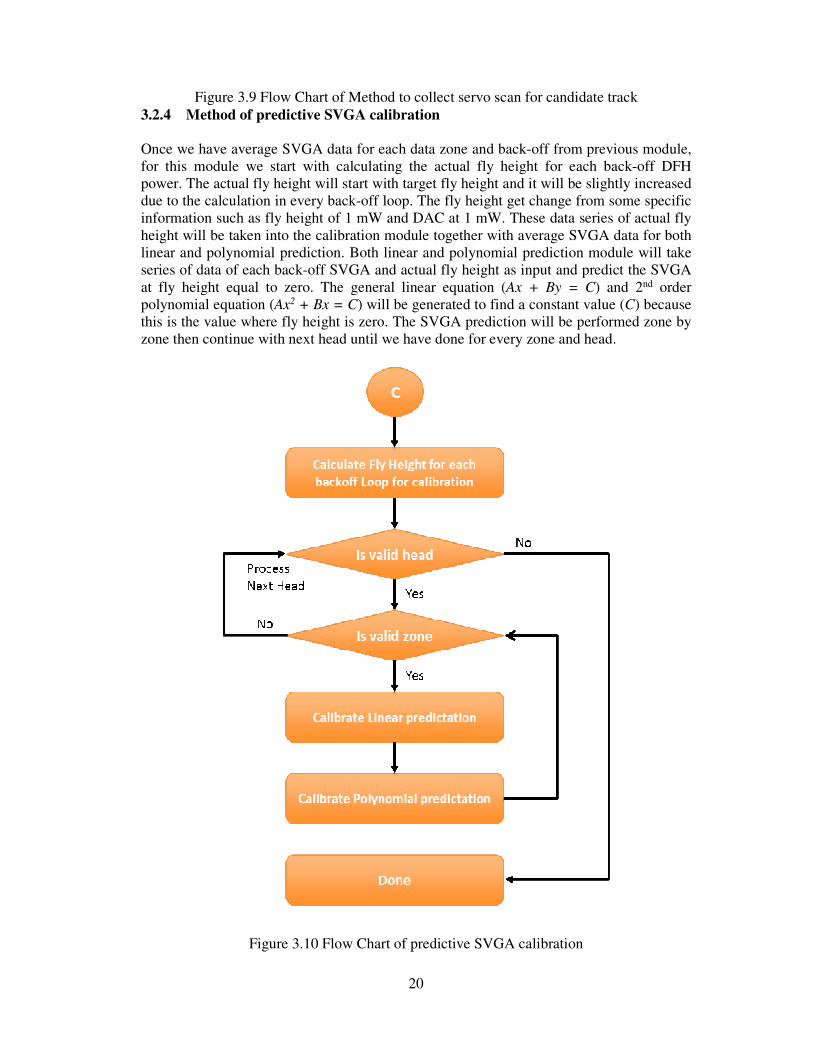
Figure 3.9 Flow Chart of Method to collect servo scan for candidate track 3.2.4 Method of predictive SVGA calibration
Once we have average SVGA data for each data zone and back-off from previous module, for this module we start with calculating the actual fly height for each back-off DFH power. The actual fly height will start with target fly height and it will be slightly increased due to the calculation in every back-off loop. The fly height get change from some specific information such as fly height of 1 mW and DAC at 1 mW. These data series of actual fly height will be taken into the calibration module together with average SVGA data for both linear and polynomial prediction. Both linear and polynomial prediction module will take series of data of each back-off SVGA and actual fly height as input and predict the SVGA at fly height equal to zero. The general linear equation (Ax + By = C) and 2nd order polynomial equation (Ax2 + Bx = C) will be generated to find a constant value (C) because this is the value where fly height is zero. The SVGA prediction will be performed zone by zone then continue with next head until we have done for every zone and head.
Figure 3.10 Flow Chart of predictive SVGA calibration
21
3.2.5 Method to detect and mapped out bad track with predictive SVGA
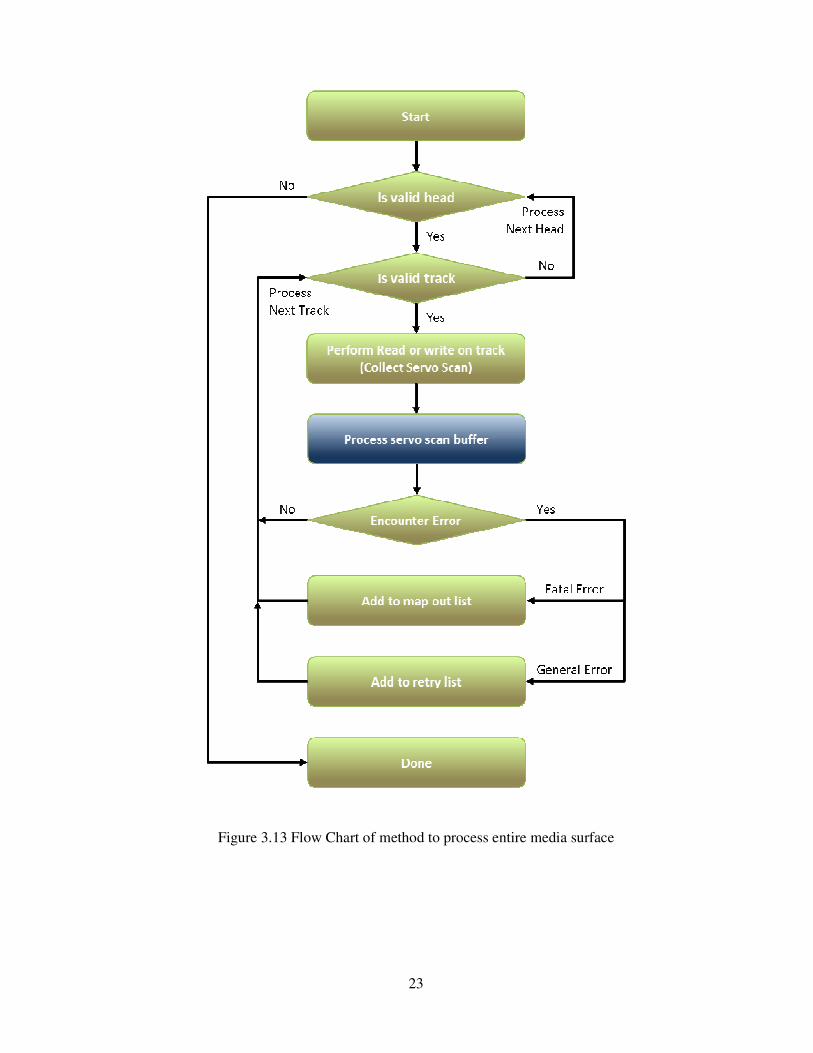
With the current conventional hard disk drive process, we have some process station to perform scanning entire media surface on both reading and writing. Write all and read all entire media will be performed on every head. If there is an error occur in any data track, the error type will be checked to determine either this track have to be mapped out or just put this track in the retry list. Fatal error type will cause this track to be added to map out list otherwise this track will be only added to retry list. However even if this track have no error after reading or writing, it doesn’t mean that this is good track because servo scan data will need to be processed to determined again whether this track is good. Because some kind of media defect even if reading or writing successfully but it might cause some damage when head fly over that particular tracks such as touch down track. Or if some track have bad servo system, it might cause head to fly off track and overwritten to adjacent track so current track might return good status but adjacent track get some data corrupted. So all these kind of media defect will be mapped out during servo scan data process. Generally servo scan will be collected at the same time as hard disk drive is performed writing and reading so servo scan will be collected in every wedges when head fly over pass through these servo wedges. The additional touchdown track detection will be included within the process of servo scan buffer to additional map out all those bad track that nearly to cause head touchdown by using predictive SVGA. Prior to check and compare data of SVGA of each wedges, the touchdown SVGA threshold need to be set up. This threshold can be set depend on how stress or tight that the user wanted. This threshold will be set based from the predictive SVGA from each data zone table and it will be used to compare with the SVGA data of each servo wedges. The new error flag will be implemented to indicate that the bad track can be captured with this thesis method. The new flag will be set if current processed servo wedges have SVGA less than this threshold. And finally this track will be mapped out because this track can cause head damaged due to head touchdown.
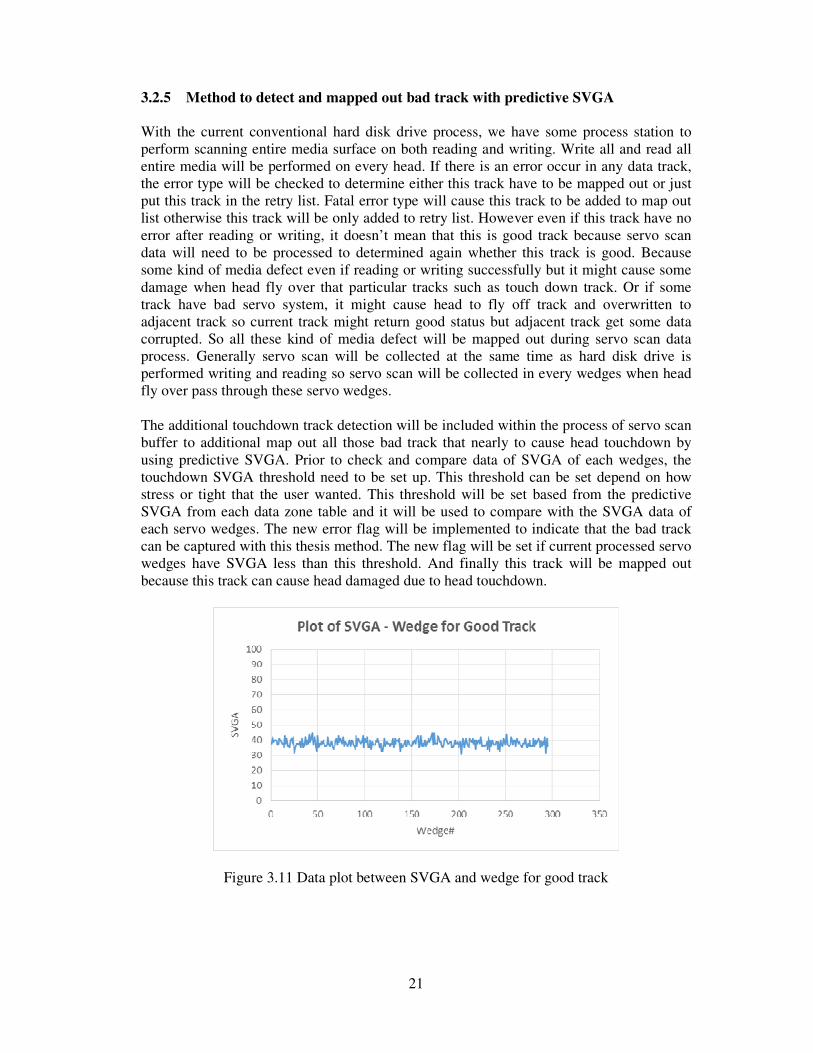
Figure 3.11 Data plot between SVGA and wedge for good track
22
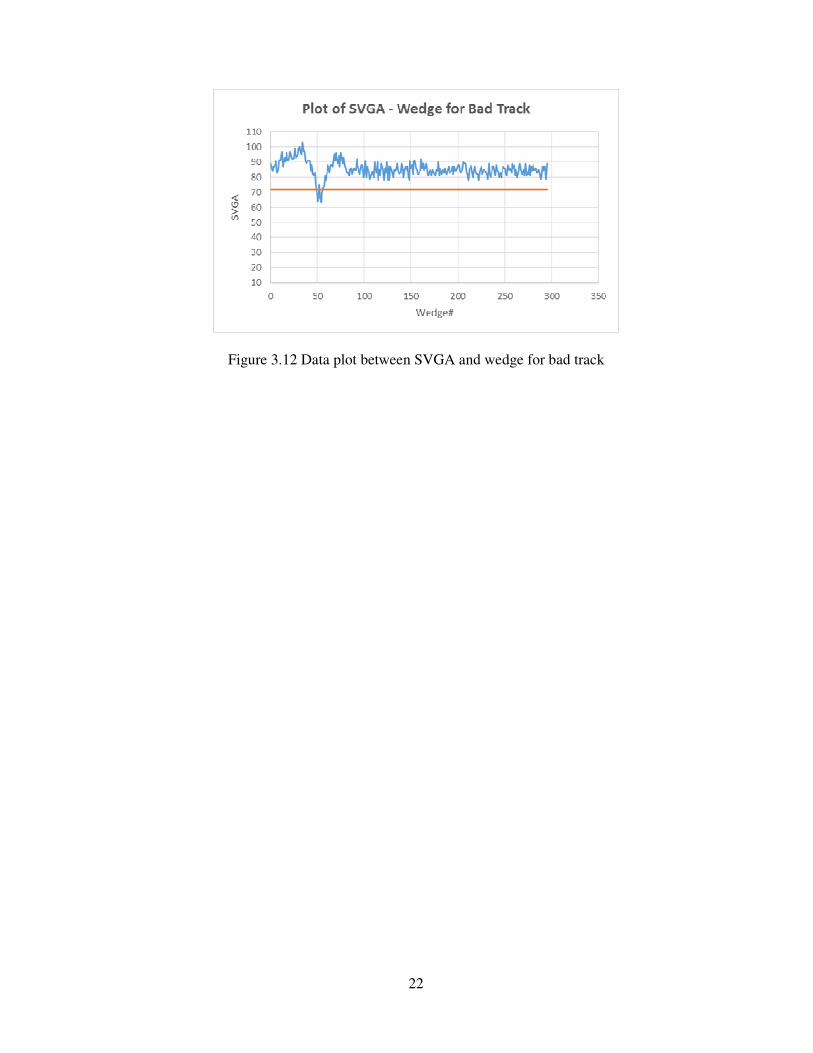
Figure 3.12 Data plot between SVGA and wedge for bad track
23
Figure 3.13 Flow Chart of method to process entire media surface
24
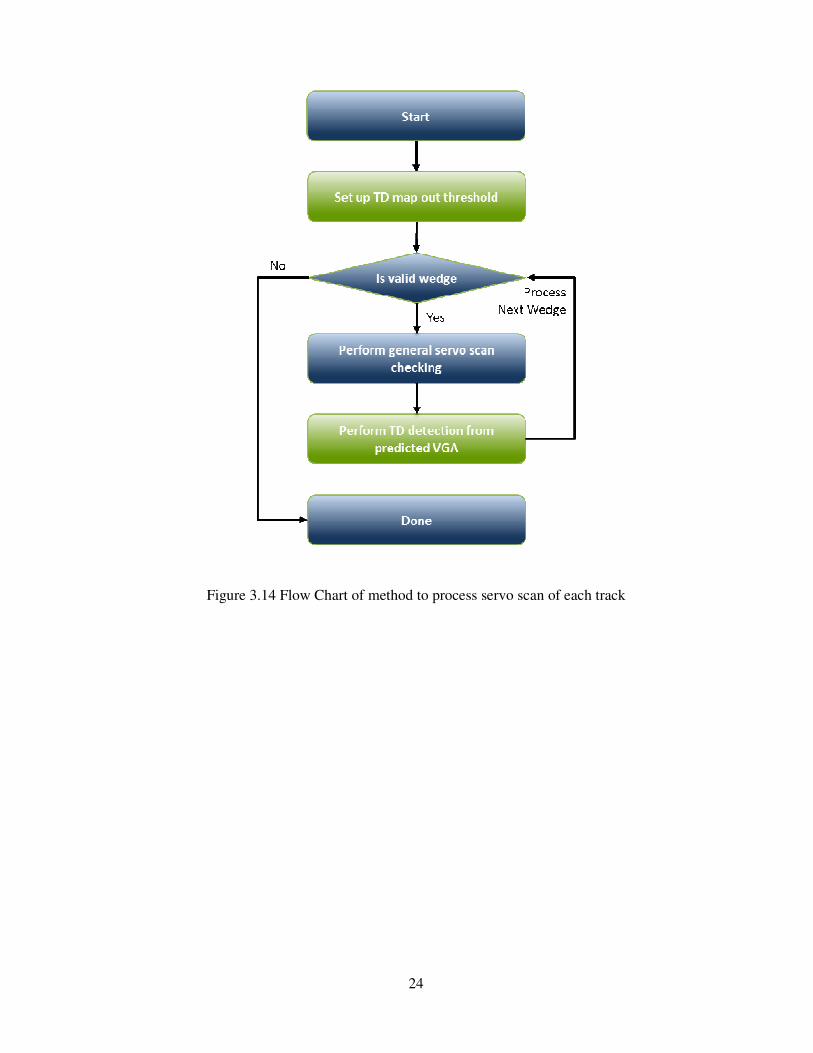
Figure 3.14 Flow Chart of method to process servo scan of each track
25
CHAPTER 4 RESULT AND DISCUSSION
4.1 The result and discussion of predictive SVGA
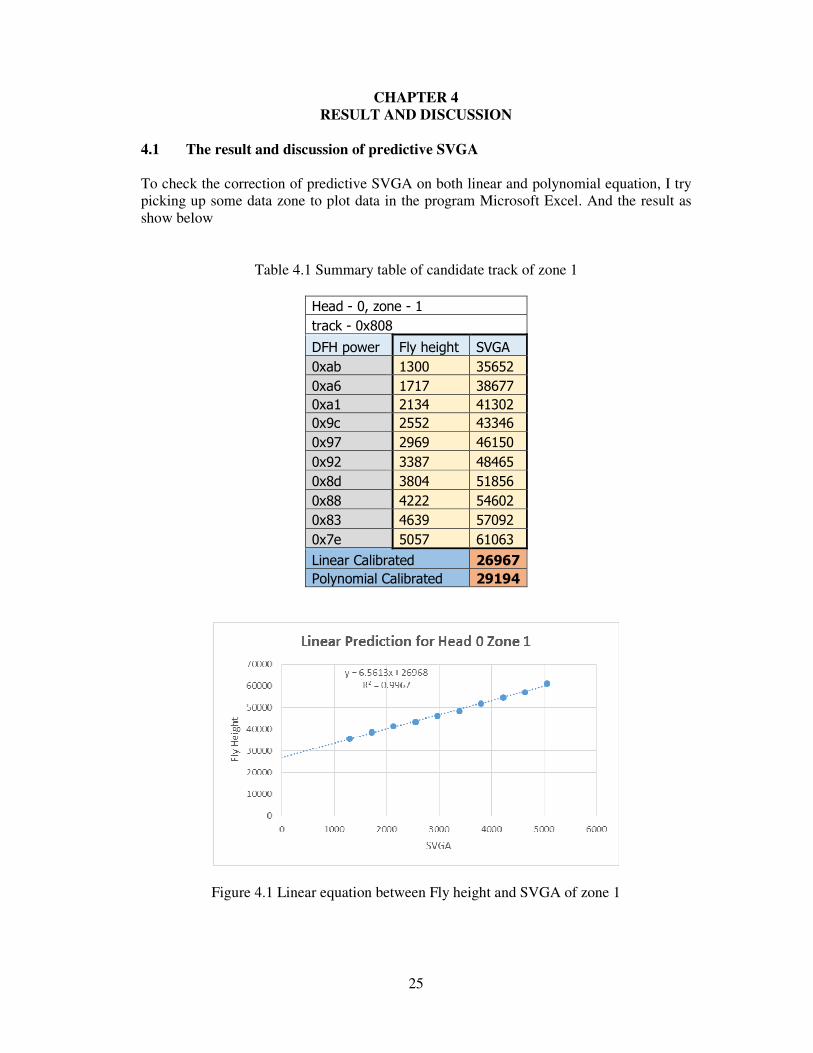
To check the correction of predictive SVGA on both linear and polynomial equation, I try picking up some data zone to plot data in the program Microsoft Excel. And the result as show below
Table 4.1 Summary table of candidate track of zone 1
Head - 0, zone - 1
track - 0x808
DFH power Fly height SVGA
0xab 1300 35652
0xa6 1717 38677
0xa1 2134 41302
0x9c 2552 43346
0x97 2969 46150
0x92 3387 48465
0x8d 3804 51856
0x88 4222 54602
0x83 4639 57092
0x7e 5057 61063
Linear Calibrated 26967
Polynomial Calibrated 29194
Figure 4.1 Linear equation between Fly height and SVGA of zone 1
26
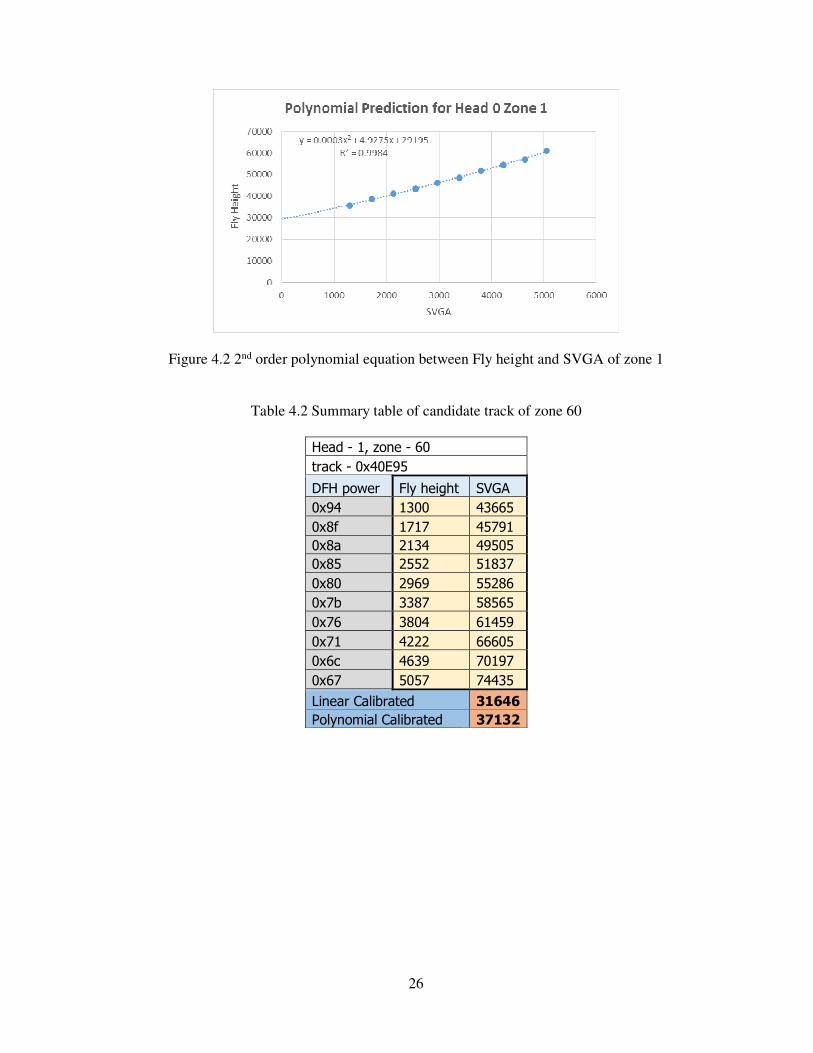
Figure 4.2 2nd order polynomial equation between Fly height and SVGA of zone 1
Table 4.2 Summary table of candidate track of zone 60
Head - 1, zone - 60
track - 0x40E95
DFH power Fly height SVGA
0x94 1300 43665
0x8f 1717 45791
0x8a 2134 49505
0x85 2552 51837
0x80 2969 55286
0x7b 3387 58565
0x76 3804 61459
0x71 4222 66605
0x6c 4639 70197
0x67 5057 74435
Linear Calibrated 31646
Polynomial Calibrated 37132
27
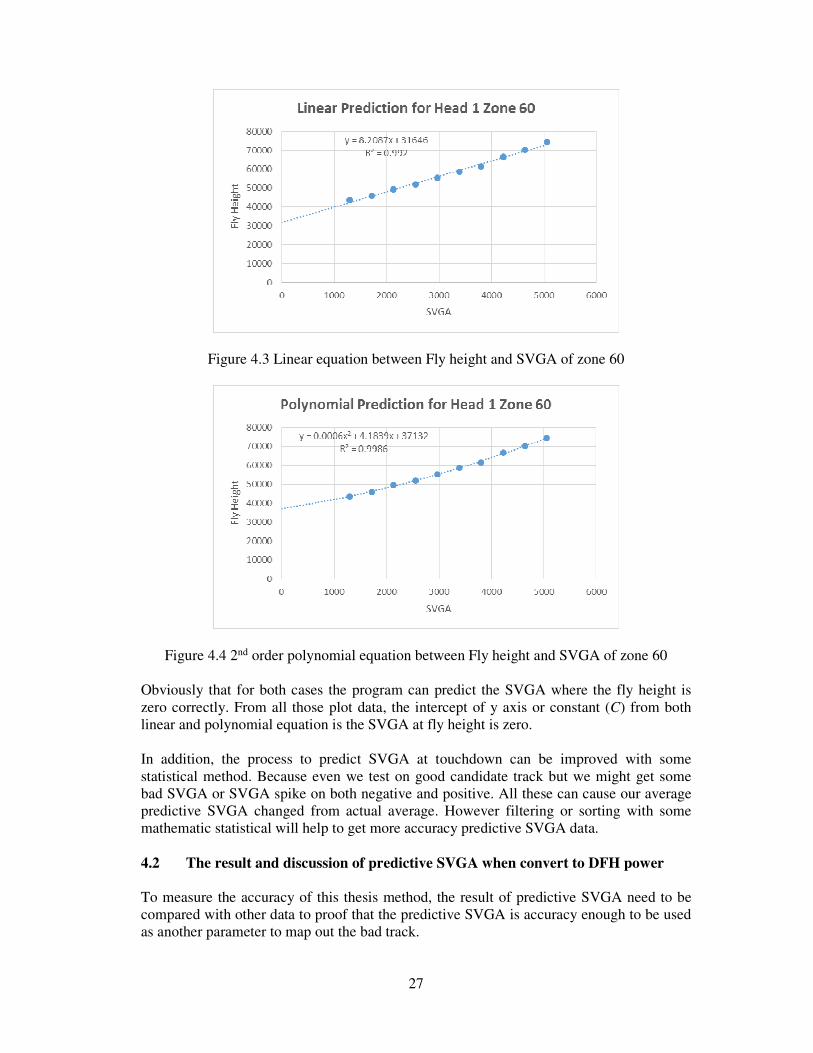
Figure 4.3 Linear equation between Fly height and SVGA of zone 60
Figure 4.4 2nd order polynomial equation between Fly height and SVGA of zone 60 Obviously that for both cases the program can predict the SVGA where the fly height is zero correctly. From all those plot data, the intercept of y axis or constant (C) from both linear and polynomial equation is the SVGA at fly height is zero. In addition, the process to predict SVGA at touchdown can be improved with some statistical method. Because even we test on good candidate track but we might get some bad SVGA or SVGA spike on both negative and positive. All these can cause our average predictive SVGA changed from actual average. However filtering or sorting with some mathematic statistical will help to get more accuracy predictive SVGA data. 4.2 The result and discussion of predictive SVGA when convert to DFH power
To measure the accuracy of this thesis method, the result of predictive SVGA need to be compared with other data to proof that the predictive SVGA is accuracy enough to be used as another parameter to map out the bad track.
28
For current drive process, we already have a process to measure the touchdown DFH power. The DFH power at touchdown point are measured for each data zone with some critical parameters such as PES, Flex Bias, servo burst, or spin velocity. So far this thesis predictive SVGA from the fly height that was calculated from the reduction of DFH power. On the contrary, we also can predict DFH power from SVGA as well. In order to predict touchdown DFH power from current data that we have, we need to do the same method as we predict SVGA but change from fly height to DFH power instead. In this thesis I predict DFH power at touch down from the linear equation of SVGA and DFH power. The DFH power at predictive SVGA that is touchdown point will be calculated to get the predicted DFH power. The predicted DFH power will be calculated from both predictive SVGA from linear and polynomial. Then the variant percentage will be calculated compare with touchdown DFH power that we have to measure either predictive SVGA from linear or polynomial equation is more accurate in order to be used as a reference in the later process data track map out.
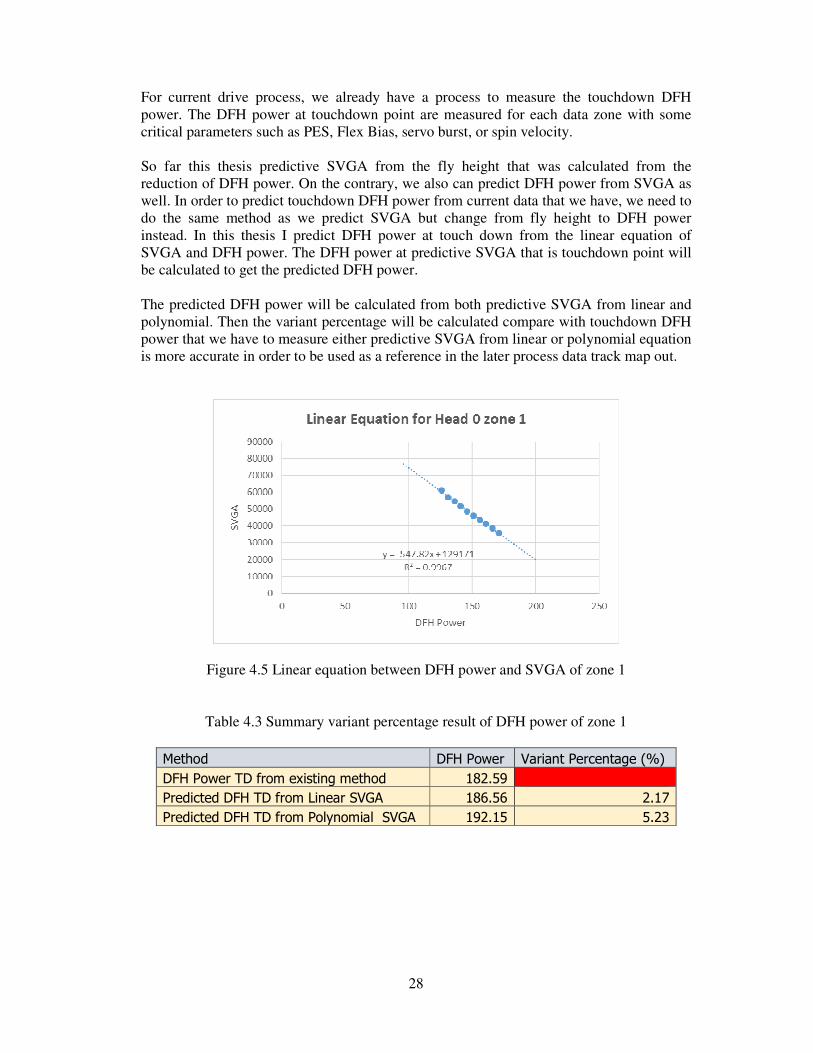
Figure 4.5 Linear equation between DFH power and SVGA of zone 1
Table 4.3 Summary variant percentage result of DFH power of zone 1
Method DFH Power Variant Percentage (%)
DFH Power TD from existing method 182.59
Predicted DFH TD from Linear SVGA 186.56 2.17
Predicted DFH TD from Polynomial SVGA 192.15 5.23
29
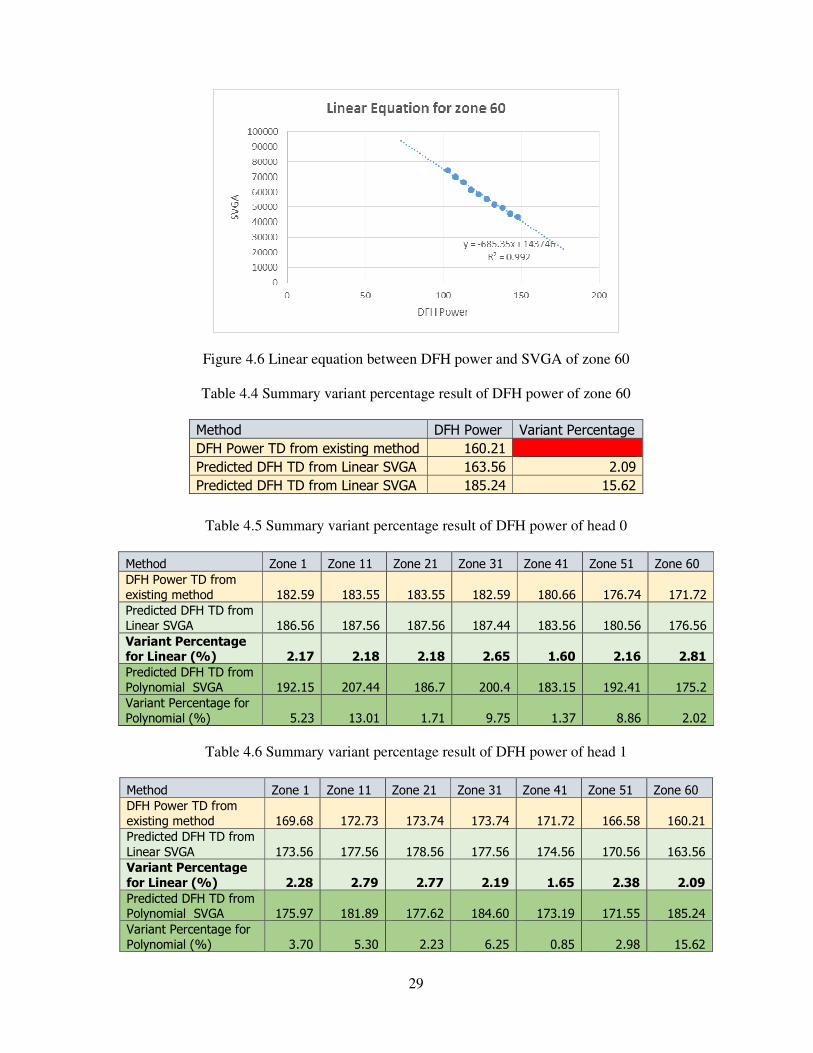
Figure 4.6 Linear equation between DFH power and SVGA of zone 60
Table 4.4 Summary variant percentage result of DFH power of zone 60
Method DFH Power Variant Percentage
DFH Power TD from existing method 160.21
Predicted DFH TD from Linear SVGA 163.56 2.09
Predicted DFH TD from Linear SVGA 185.24 15.62
Table 4.5 Summary variant percentage result of DFH power of head 0
Method Zone 1 Zone 11 Zone 21 Zone 31 Zone 41 Zone 51 Zone 60
DFH Power TD from
existing method 182.59 183.55 183.55 182.59 180.66 176.74 171.72
Predicted DFH TD from
Linear SVGA 186.56 187.56 187.56 187.44 183.56 180.56 176.56
Variant Percentage for Linear (%) 2.17 2.18 2.18 2.65 1.60 2.16 2.81
Predicted DFH TD from
Polynomial SVGA 192.15 207.44 186.7 200.4 183.15 192.41 175.2
Variant Percentage for
Polynomial (%) 5.23 13.01 1.71 9.75 1.37 8.86 2.02
Table 4.6 Summary variant percentage result of DFH power of head 1
Method Zone 1 Zone 11 Zone 21 Zone 31 Zone 41 Zone 51 Zone 60
DFH Power TD from
existing method 169.68 172.73 173.74 173.74 171.72 166.58 160.21
Predicted DFH TD from
Linear SVGA 173.56 177.56 178.56 177.56 174.56 170.56 163.56
Variant Percentage
for Linear (%) 2.28 2.79 2.77 2.19 1.65 2.38 2.09
Predicted DFH TD from Polynomial SVGA 175.97 181.89 177.62 184.60 173.19 171.55 185.24
Variant Percentage for
Polynomial (%) 3.70 5.30 2.23 6.25 0.85 2.98 15.62
30
Result from data table has shown that most of predicted DFH power from both SVGA of linear and SVGA of polynomial could give back a variant percentage in an acceptable range that are less than 10%. However obviously that the DFH power that is calculated from SVGA of linear method can give back more accurate data and quite stable at variant percentage 2. From the summary data table even though few data zone of DFH power that is calculated from SVGA of polynomial method can give very accurate data which have variant percentage less than 1 but most of them not so accurate and sometimes have variant percentage more than 10%. In conclusion, predictive SVGA from linear equation are more accurate if we convert to DFH power. So all those SVGA data from linear method will be used as a reference SVGA to map out some track that risk to have touch down problem due to the media roughness. 4.3 The result and discussion of touchdown track map out with predictive SVGA
method
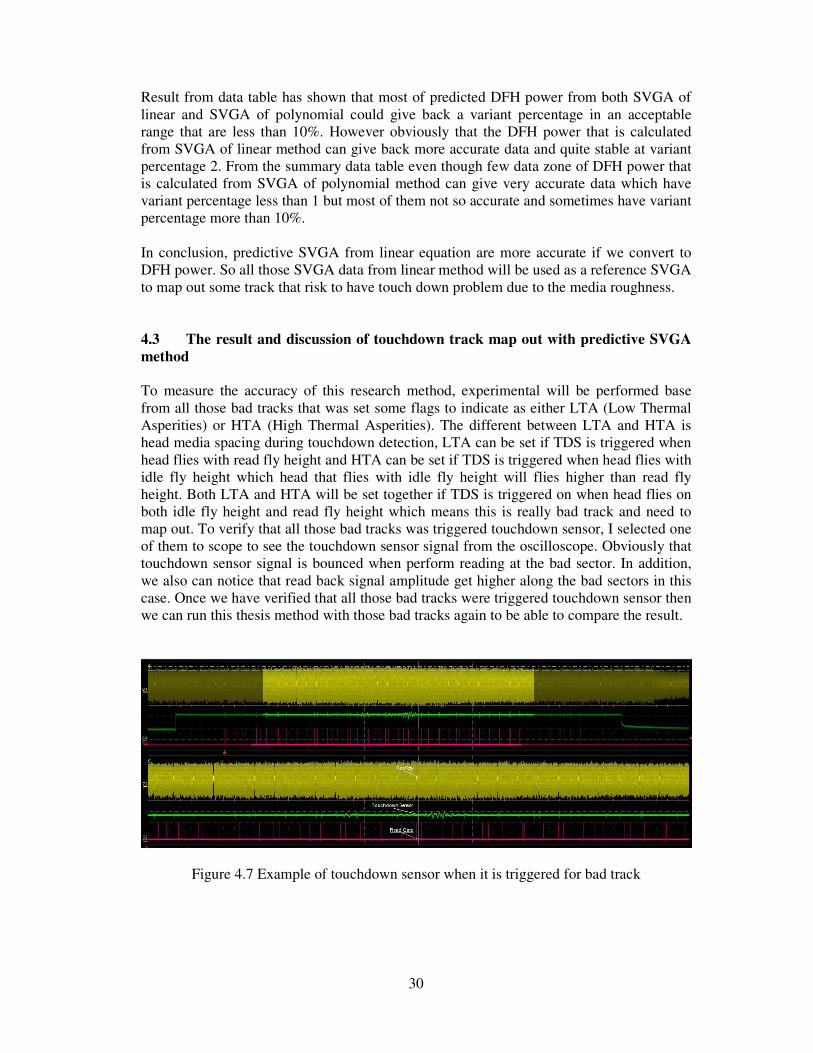
To measure the accuracy of this research method, experimental will be performed base from all those bad tracks that was set some flags to indicate as either LTA (Low Thermal Asperities) or HTA (High Thermal Asperities). The different between LTA and HTA is head media spacing during touchdown detection, LTA can be set if TDS is triggered when head flies with read fly height and HTA can be set if TDS is triggered when head flies with idle fly height which head that flies with idle fly height will flies higher than read fly height. Both LTA and HTA will be set together if TDS is triggered on when head flies on both idle fly height and read fly height which means this is really bad track and need to map out. To verify that all those bad tracks was triggered touchdown sensor, I selected one of them to scope to see the touchdown sensor signal from the oscilloscope. Obviously that touchdown sensor signal is bounced when perform reading at the bad sector. In addition, we also can notice that read back signal amplitude get higher along the bad sectors in this case. Once we have verified that all those bad tracks were triggered touchdown sensor then we can run this thesis method with those bad tracks again to be able to compare the result.
Figure 4.7 Example of touchdown sensor when it is triggered for bad track
31
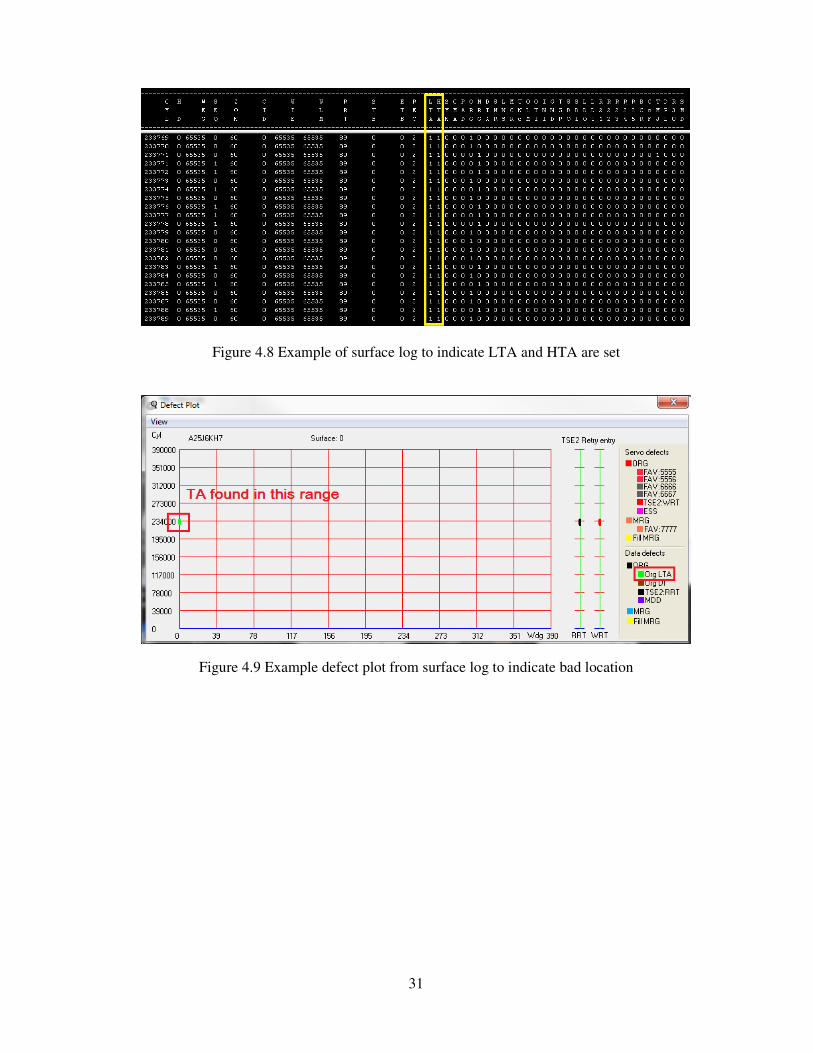
Figure 4.8 Example of surface log to indicate LTA and HTA are set
Figure 4.9 Example defect plot from surface log to indicate bad location
32
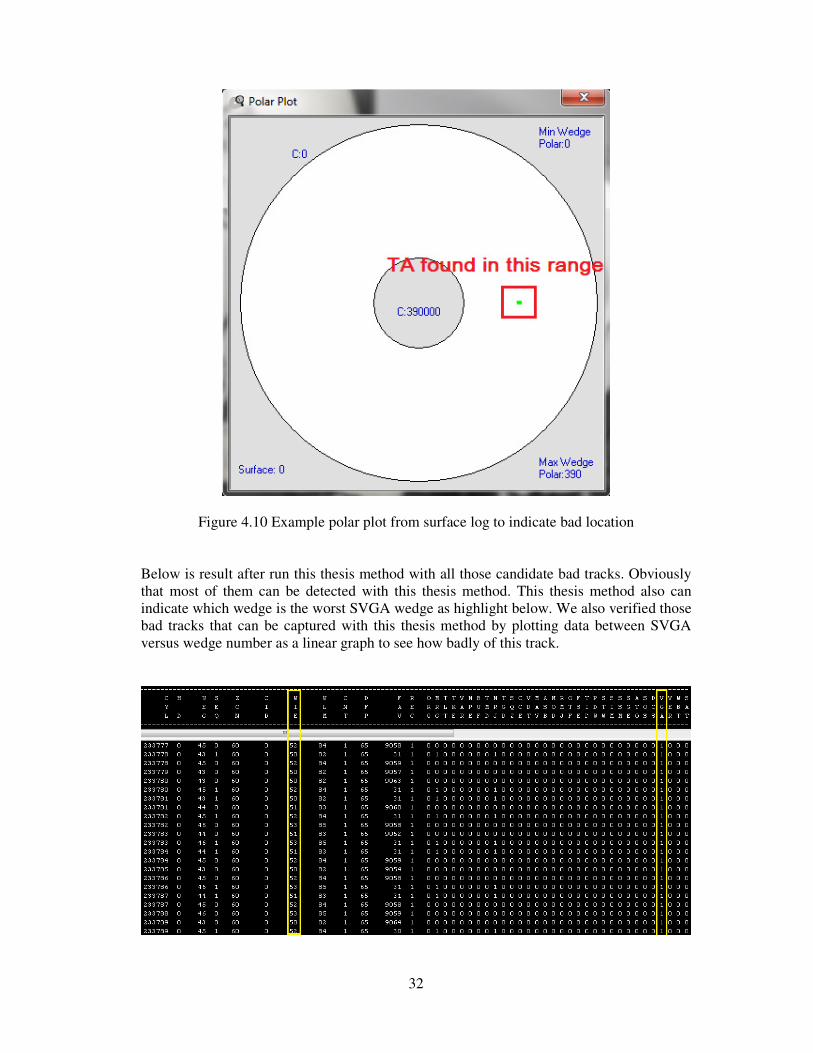
Figure 4.10 Example polar plot from surface log to indicate bad location
Below is result after run this thesis method with all those candidate bad tracks. Obviously that most of them can be detected with this thesis method. This thesis method also can indicate which wedge is the worst SVGA wedge as highlight below. We also verified those bad tracks that can be captured with this thesis method by plotting data between SVGA versus wedge number as a linear graph to see how badly of this track.
33
Figure 4.11 Example of surface log after run this thesis method
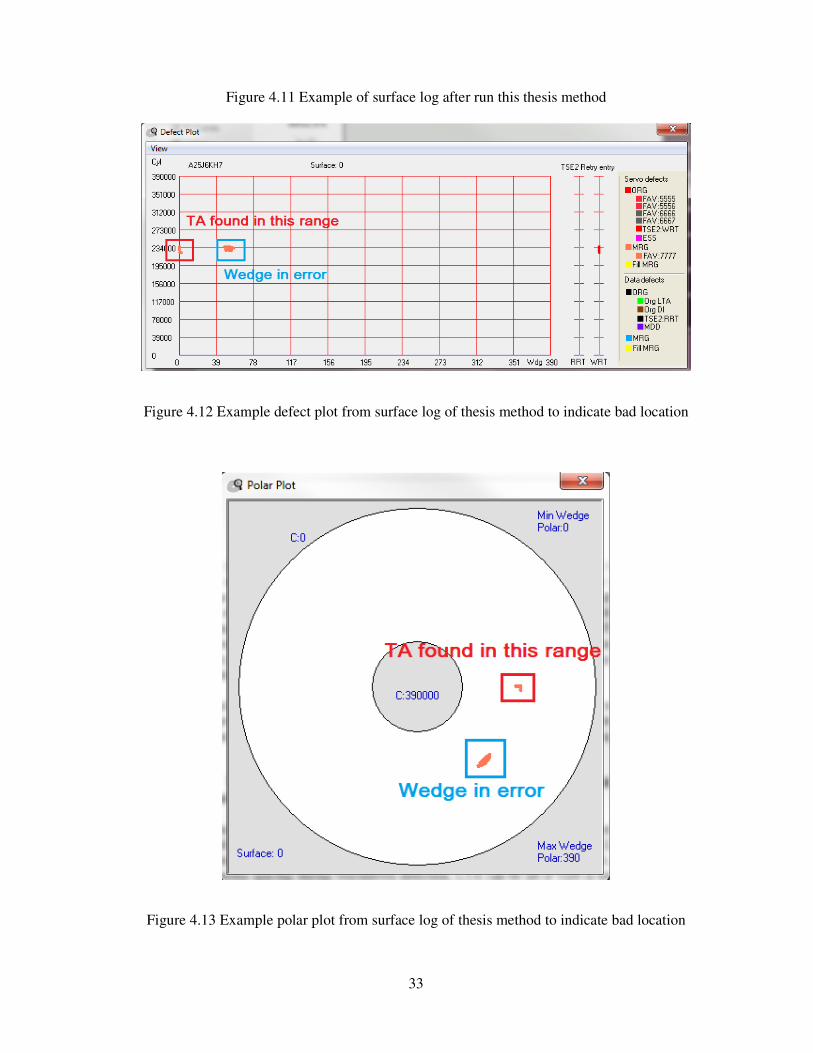
Figure 4.12 Example defect plot from surface log of thesis method to indicate bad location
Figure 4.13 Example polar plot from surface log of thesis method to indicate bad location
34
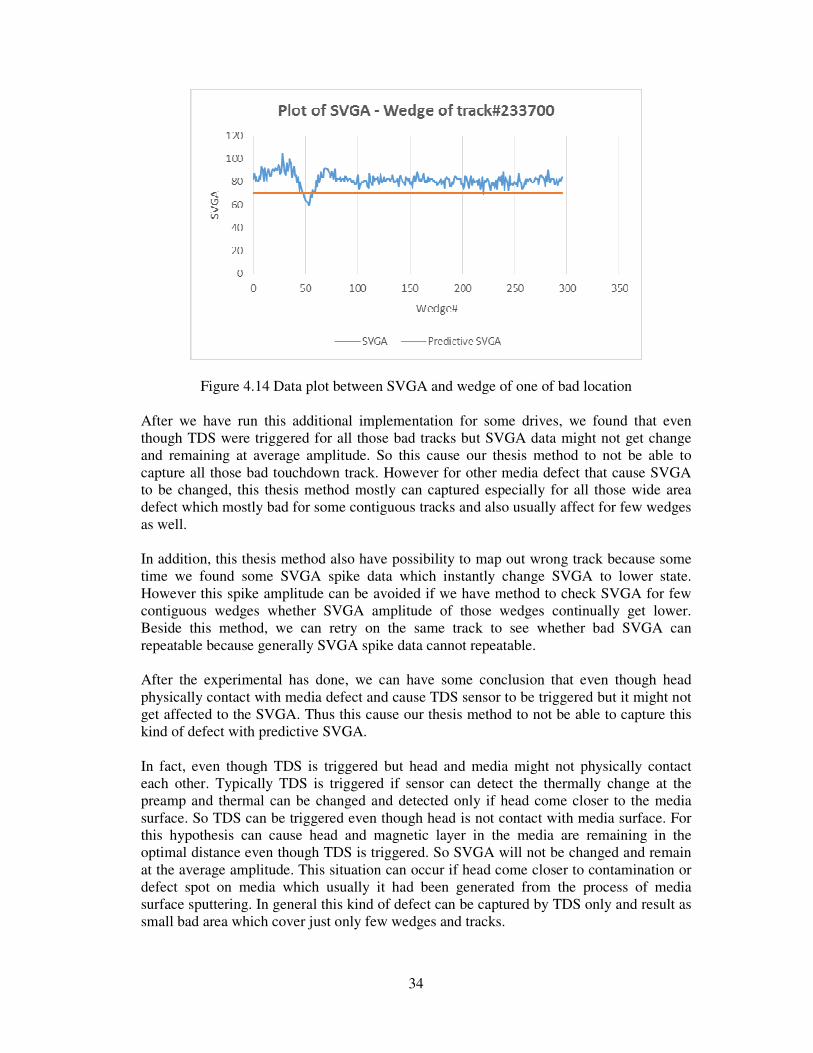
Figure 4.14 Data plot between SVGA and wedge of one of bad location After we have run this additional implementation for some drives, we found that even though TDS were triggered for all those bad tracks but SVGA data might not get change and remaining at average amplitude. So this cause our thesis method to not be able to capture all those bad touchdown track. However for other media defect that cause SVGA to be changed, this thesis method mostly can captured especially for all those wide area defect which mostly bad for some contiguous tracks and also usually affect for few wedges as well. In addition, this thesis method also have possibility to map out wrong track because some time we found some SVGA spike data which instantly change SVGA to lower state. However this spike amplitude can be avoided if we have method to check SVGA for few contiguous wedges whether SVGA amplitude of those wedges continually get lower. Beside this method, we can retry on the same track to see whether bad SVGA can repeatable because generally SVGA spike data cannot repeatable. After the experimental has done, we can have some conclusion that even though head physically contact with media defect and cause TDS sensor to be triggered but it might not get affected to the SVGA. Thus this cause our thesis method to not be able to capture this kind of defect with predictive SVGA. In fact, even though TDS is triggered but head and media might not physically contact each other. Typically TDS is triggered if sensor can detect the thermally change at the preamp and thermal can be changed and detected only if head come closer to the media surface. So TDS can be triggered even though head is not contact with media surface. For this hypothesis can cause head and magnetic layer in the media are remaining in the optimal distance even though TDS is triggered. So SVGA will not be changed and remain at the average amplitude. This situation can occur if head come closer to contamination or defect spot on media which usually it had been generated from the process of media surface sputtering. In general this kind of defect can be captured by TDS only and result as small bad area which cover just only few wedges and tracks.
35
Figure 4.15 Defect on the media which can cause TDS to be triggered [10]
For all those tracks that was captured on both TDS and predictive SVGA method, they are captured because media surface is physically have some defect and cause head to get closer or contact with media. It might cause from media defect when magnetic layer are too much sputtering until it become bad spot so this is defect from manufacturing. Or it might cause from media bended or concaved on one side and cause head to come closer to the media surface when head fly over to the bad area. This kind of defect we so-call disk warp, it usually triggered TDS for some contiguous tracks and at the same wedges alignment because generally it possibility cause by disk clamp. We also can observed negative SVGA on one surface and positive SVGA on the opposite surface for disk warp. All these media defect can cause SVGA to be changed because head and magnetic layer in the media are physically come closer to each other so these SVGA change can be captured with this thesis method.
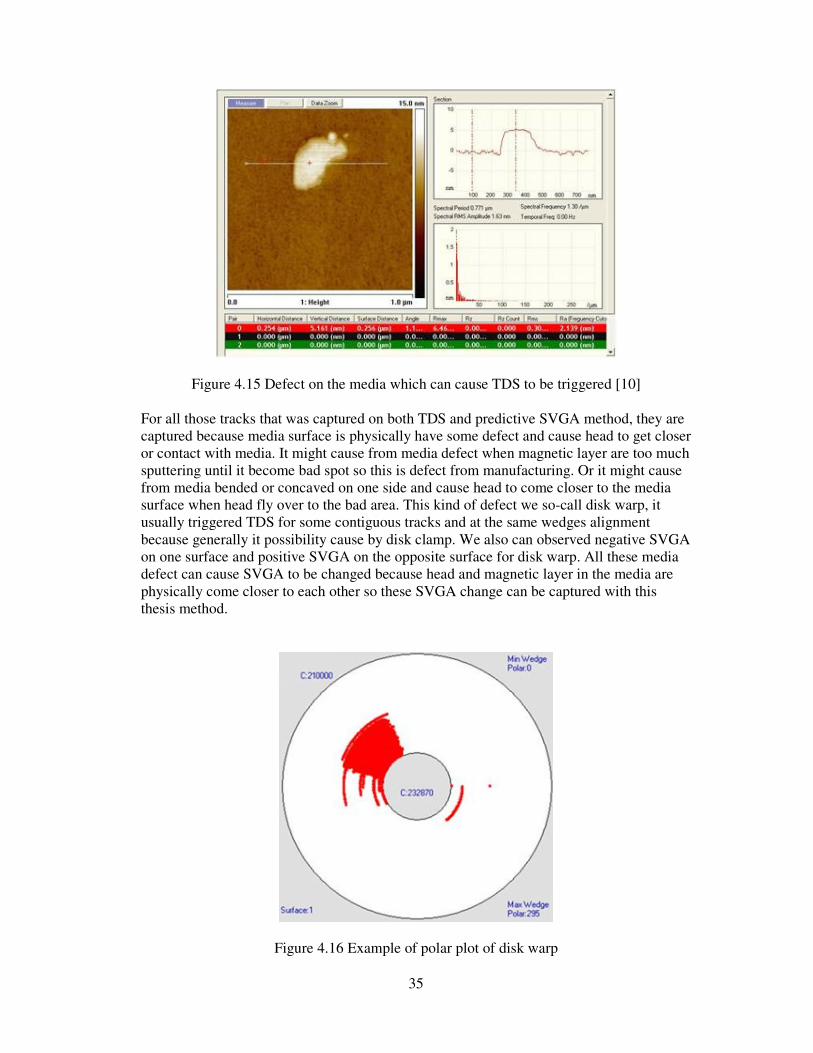
Figure 4.16 Example of polar plot of disk warp

36
At last, all those bad tracks can be captured in this thesis method by just simply compare current SVGA with predictive SVGA. In fact, the detection method can be adapted and can use some mathematic statistical to be able to vary the stress of bad track detection as well. Threshold value might be applied with reference predictive SVGA to get the final data to be used as a compared data. Also the single SVGA from current processing wedge might not enough to determine whether this is bad or not because sometimes it might be a spike data which rapidly high or low. The fault detection might be prevented if we can take some adjacent SVGA data into the consideration because generally defect will slightly step up or step down so checking with adjacent SVGA data will help to figure out defect more accuracy and can filter out some fault SVGA which rapidly change.

37
CHAPTER 5 CONCLUSION AND RECOMMENDATIONS
5.1 Conclusion
During a long way to complete this thesis research, I keep learning in every steps of doing this thesis. Hard disk is one of the most complexity devices in term of mechanical and material. The good quality hard disk drive need to pass through a lot of process during manufacturing to filter out all those bad quality hard disk drive. A lot of theory about dynamic fly height or method to allow reader or writer head to remain the spacing distance need to be studied as well as study about existing data in the hard disk drive environment that can be used to improve current process or can be used to reduce test time with a lot of limited constraint. And improving hard disk drive quality in the process has been chosen to do in this research. This thesis introduce a new method to predict a reference touchdown point. However the predictive SVGA at touchdown point from this thesis method can be found without any head physically touchdown required which different from conventional method that require head to be touchdown. So this thesis method can avoid read and write head to degrade from head damage from HDI problem. The stressful of bad track detection is another advantage from this thesis method because host can adjust how stress of the detection with some threshold value. However good hard disk drive quality might be interchanged with number of yield loss. From the experimental result, it has shown some positive data result because the predictive SVGA can be used to capture the bad track that have some media defect which cause SVGA signal to be changed from the usual. So experimental result can be assured that this can be implemented to help to find out all those bad track that might have some head touch down problem however more evaluation still need to be performed with more sample hard disk drives on both good and bad drive condition to estimate the accuracy of this thesis method detection before we can implement this thesis method to improve our process in the current production. Finally, this thesis method cannot detect all of media defect that expose to TDS so it cannot replace the ability of touchdown sensor but at least this research can differentiate some defect type. Once we know the defect type that can cause bad track so product or process engineers can focus at some specific manufacturing station that have possibility to generate this kind of defect and they can find the way to improve. 5.2 Recommendation for further study
This thesis can have further study about predictive SVGA for various temperature because temperature can affect with head disk clearance which this can cause our predictive SVGA at head touchdown is changed in different temperature and might give us more accuracy for bad track detection. Moreover, this thesis method can have ability to be adapted to additional map out those bad tracks with predicted data from data SVGA as well. However the method to extract data SVGA still needs to have some research and study about the affect with current drive

38
performance. Also the prediction when head fly too high from the media also can be another research to map out all those bad concave media spot because when head fly too high from the media the read back signal can be reduced and might result to wrong signal conversion. Once we have this prediction table, this can be used as a reference to measure the hard drive quality when it has been used for some time. Those entire data track might be scanned again and compare with the reference table. Hard disk drive might need to be backed up if we found out that this drive quality has reduced. Or predict about hard disk drive life time because bad sector always get increase and these number of bad sector might be able to predict. This can help to estimate hard disk drive life time and can be used to estimate the hard disk drive warranty as well. At last, the method for prediction can be adapted with other data that depend on the purpose of what we want to use and how that data is changed. In near future we might see some of this method has been implement in the current hard disk drive manufacturing or even in the current hard disk drive firmware to have real time drive quality monitoring.

39
REFERENCES
[1] Yawshing Tang, Soo-Youl Hong, Na Young Kim, and Xiaodong Che, “Overview of Fly Height Control Applications in Perpendicular Magnetic Recording,” IEEE Trans. Magn., vol. MAG-43, no. 2, pp. 709-714, Feb. 2007. [2] HGST, a Western Digital Company. (2012). Thermal Fly-Height Control (TFC) Technology in HGST Hard Disk Drives [White paper]. Retrieved from http://www.hgst.com/tech/techlib.nsf/techdocs/98ee13311a54cac886257171005e0f16/$file/tfc_whitepaper041807.pdf [3] B. Knigge, T. Suthar, and P.M. Baumgart, “Friction and Heat at the Head Disk Interface caused by Thermal Protrusion Touchdown,” INTERMAG, pp. 420, 2006. [4] Archanun Kohpaiboon, “Hard Disk Drives Industry in Thailand: International Production Networks Versus Industrial Cluster,” [Discussion Paper], Apr. 2010. Retrieved from https://editorialexpress.com/cgi-bin/conference/download.cgi?db_name=serc2009&paper_id=183 [5] Western Digital Corporation (2010), Touchdown Calibration (TD-Cal) DFH & WPTP Characterization, Page 9 -12 [6] MARVELL (2013), Integrated Hard Disk Drive Electronics Preliminary Specifications, Page 685, 996-997 [7] Western Digital Corporation (2009), Disk Drive Technology: Overview, Page 26
[8] Western Digital Corporation (2009), Disk Drive Technology: Disk Drive Basics, Page 2 [9] Western Digital Corporation (2009), Disk Drive Technology: Manufacturing Process, Page 48, 93 [10] Western Digital Company, Jorge Yip, “How do I scope TA location using TDS?” Retrieved from http://wiki.wdc.com/wiki/How_do_I_scope_TA_locations_using_TDS%3F [11] Jianbin Nie, and Roberto Horowitz, “A Tutorial on Control Design of Hard Disk Drive Self-Servo Track Writing,” Retrieved from http://www.ed-thelen.org/RAMAC/186c_Nie_ACC10_TutorialonSSTW.pdf
[12] Chaweng S., (2014). Automatic Stroke Measurement on Multi Disk Writer, M. Sc. Thesis. Asian Institute of Technology: Thailand, Page 4 [13] Western Digital Corporation (20013), Media contour surface by using Fly-Height measurement, Page 2