Embed Size (px)
Citation preview

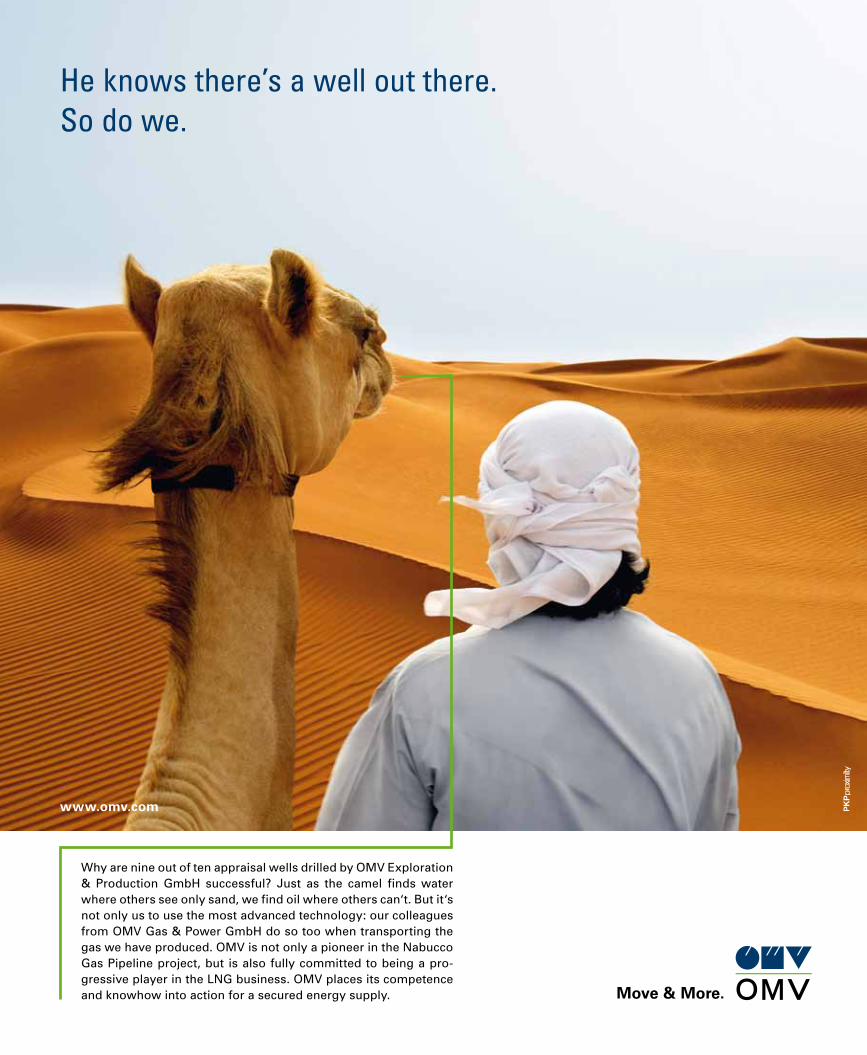
He knows there’s a well out there. So do we.
Why are nine out of ten appraisal wells drilled by OMV Exploration & Production GmbH successful? Just as the camel finds water where others see only sand, we find oil where others can‘t. But it‘s not only us to use the most advanced technology: our colleagues from OMV Gas & Power GmbH do so too when transporting the gas we have produced. OMV is not only a pioneer in the Nabucco Gas Pipeline project, but is also fully committed to being a pro-gressive player in the LNG business. OMV places its competence and knowhow into action for a secured energy supply.
www.omv.com
Move & More.
Kamel_230x280mm.indd 1 13.05.2009 16:07:41 Uhr
Co
mm
en
tary
It came and it went — OPEC’s 50th Anniversary on September 14. There was a special press conference by Secretary
General, Abdalla Salem El-Badri (see page 4), and the Golden
Jubilee Edition of the OPEC Bulletin appeared.
Otherwise it was a day like any other at the office. After
all, the world does not stop because of an anniversary, es-
pecially during these difficult times for the world economy
and the oil market.
But this is not to detract from the significance of that day
for OPEC. It was a day of achievement — 50 years of OPEC.
It was a day that people back in the tail-end of the colonial
era would have never expected to happen — a group of heav-
ily exploited developing countries standing up to the estab-
lished industrialized powers, asserting their sovereign rights
to exploit their own indigenous natural resources, develop-
ing successful modern petroleum sectors, becoming voices
of influence in the global energy sector, and then seeing in
the historic day of celebration as it dawned on September
14, 2010.
OPEC has, of course, organized a fitting series of activities
to mark this historic occasion, and these have been spread
out across the year.
The most recent was OPEC’s 50th Anniversary Exhibition
(see page 18) in the Italian renaissance-style Kursalon in
Vienna’s city centre, where famous Austrian composer
Johann Strauss used to charm his audiences with his me-
lodic waltz music. The ten-day exhibition provided a show-
case of Member Country culture, impressing upon visitors
that there is more to these countries than just oil. They all
have their rich, colourful traditions, with discernible threads
of history extending back millennia in some cases, to the
very birth of modern civilization.
At the same time, the celebrations have had an accent
on youth, underlining the importance of attracting future
generations to the oil industry. Young people were much in
evidence in organized tours at the exhibition. The Secretariat
ran an international children’s quiz on OPEC and the oil in-
dustry. And work is well advanced on a special children’s
book about oil.
Other memorable markers of this festive year have in-
cluded an eye-catching logo, a new Website, anniversary
postage stamps in Austria and Member Countries, special
publications and a host of souvenirs, including colourful ties,
scarves and pins worn by staff at the anniversary events.
More activities are planned before the year is out.
While all this provides a welcome feel-good factor for
the Organization, its Member Countries, its decision-makers
and its staff, it remains a case of ‘business as usual’ in the
world at large. OPEC is ever-mindful of the need to address
the challenges facing the oil market and further afield, such
as the approaching round of climate change negotiations
and the ever-present concern about sustainable develop-
ment and poverty eradication.
As we approach the northern hemisphere winter, the
outlook for the oil market remains uncertain. The September
issue of OPEC’s Monthly Oil Market Report commented thus:
“Forecasting world economic growth in 2010 has proved to
be a considerable challenge. The persisting impact of the
recent global recession, as well as the ongoing effects of
the unprecedented government-led stimulus, have creat-
ed a significant amount of uncertainty in forecasting GDP
growth and consequently oil demand growth.” It continued:
“Now that the current round of government stimuli appears
to be winding down, demand growth in the second half of
this year is likely to return to the initially projected growth
levels, assuming that no further government support is
forthcoming.”
Such uncertainty will be taken into consideration
when OPEC’s Ministers carry out their routine review of the
Organization’s production agreement at the 157th Meeting
of the Conference in Vienna on October 14. Indeed, in as-
sessing the oil market outlook, more emphasis is likely to
be placed on the rate, the size and the global spread of eco-
nomic recovery than on the usual seasonal factors for this
time of the year.
The Ministers will, as ever, focus on reaching an agree-
ment which will be in the best interests of the market at large,
with the accent on stable prices, secure supply and fair re-
turns to investors.
Students of OPEC history, however, will be at pains
to point out that these three objectives appeared in our
Organization’s very first resolution of September 14, 1960.
In other words, when you get down to basics with regard
to oil market essentials, very little appears to have changed
over the past 50 years!
Getting back to basics when the celebrations are over

Co
nte
nts
PublishersOPECOrganization of the Petroleum Exporting Countries
Helferstorferstraße 17
1010 Vienna, Austria
Telephone: +43 1 211 12/0
Telefax: +43 1 216 4320
Contact: The Editor-in-Chief, OPEC Bulletin
Fax: +43 1 211 12/5081
E-mail: [email protected]
Web site: www.opec.orgVisit the OPEC Web site for the latest news and infor-
mation about the Organization and back issues of the
OPEC Bulletin which are also available free of charge
in PDF format.
Hard copy subscription: $70/year
OPEC Membership and aimsOPEC is a permanent, intergovernmental
Organization, established in Baghdad, on September
10–14, 1960, by IR Iran, Iraq, Kuwait, Saudi Arabia
and Venezuela. Its objective — to coordinate
and unify petroleum policies among its Member
Countries, in order to secure fair and stable prices
for petroleum producers; an efficient, economic and
regular supply of petroleum to consuming nations;
and a fair return on capital to those investing in the
industry. The Organization comprises 12 Members:
Qatar joined in 1961; SP Libyan AJ (1962); United
Arab Emirates (Abu Dhabi, 1967); Algeria (1969);
Nigeria (1971); Angola (2007). Ecuador joined OPEC
in 1973, suspended its Membership in 1992, and
rejoined in 2007. Gabon joined in 1975 and left in
1995. Indonesia joined in 1962 and suspended its
Membership on December 31, 2008.
CoverThis month’s cover shows a dancer from Iraq, who appeared during the live performances held at OPEC’s 50th Anniversary Exhibition (see page 18).Photo: Diana Golpashin, design: Krystian Bieniek.
OP
EC
bu
lle
tin
Vol XLI, No 8, October 2010, ISSN 0474–6279
157 th OPEC Conference 16
Founder Members in Focus 8
50 th Anniversar y Exhibit ion 18
50 th Anniversar y Day 4
OPEC will be even more importantin years to come — El-Badri
OPEC meets in Vienna in uncertain economic climate — a preview
OPEC: Making collective actions, bringing collective benefits — IranOther Member CountriesOPEC’s presence will always be important — Ecuador (p11)OPEC — an instrument of change that has stood the test of time — Libya (p13)
Oil takes a back seat as Exhibition shows the other side of OPECAustria’s Post unveils OPEC Anniversary stamp (p30)Lula picks up prize money for winning OPEC Anniversary logo design competition (p31)

Market Review 46
Noticeboard 70
Vacancies 71
OPEC Publications 72
Newsline 38
Red Nose Day 34
Secretar y General ’s Diar y 42
Inter view 36
50 th Anniversar y Concer t 32
OPEC Fund News 44
Secretariat officialsSecretary GeneralAbdalla Salem El-BadriDirector, Research DivisionIn charge of Multilateral Relations DepartmentDr Hasan M QabazardGeneral Legal CounselDr Ibibia Lucky WorikaHead, Data Services DepartmentFuad Al-ZayerHead, Finance & Human Resources DepartmentIn charge of Administration and IT Services DepartmentAlejandro RodriguezHead, Energy Studies DepartmentOswaldo TapiaHead, Petroleum Studies DepartmentDr Hojatollah GhanimifardHead, PR & Information DepartmentUlunma Angela AgoawikeHead, Office of the Secretary GeneralAbdullah Al-Shameri
ContributionsThe OPEC Bulletin welcomes original contributions on
the technical, financial and environmental aspects
of all stages of the energy industry, research reports
and project descriptions with supporting illustrations
and photographs.
Editorial policyThe OPEC Bulletin is published by the PR & Informa-
tion Department. The contents do not necessar-
ily reflect the official views of OPEC nor its Member
Countries. Names and boundaries on any maps
should not be regarded as authoritative. No respon-
sibility is taken for claims or contents of advertise-
ments. Editorial material may be freely reproduced
(unless copyrighted), crediting the OPEC Bulletin
as the source. A copy to the Editor would be
appreciated. Printed in Austria by Ueberreuter Print GmbH
Editorial staffEditor-in-Chief/Editorial CoordinatorUlunma Angela AgoawikeEditorJerry HaylinsAssociate EditorsKeith Aylward-Marchant, James Griffin, Alvino-Mario Fantini, Steve HughesProductionDiana LavnickDesign & LayoutElfi Plakolm, Krystian BieniekPhotographs (unless otherwise credited)Diana GolpashinDistributionMahid Al-Saigh
Indexed and abstracted in PAIS International
Ecuador: keeping the oil in the soilIran makes first export shipment of gasoline (p39)Nigeria to seek higher production allocation (p40)Kuwait to build four nuclear reactors (p41)Saudi energy consumption “rising too fast” (p41)
OFID Governing Board approves $114 million in new financing
OPEC supports Red Nose Run in Vienna
Qatar Orchestra to mark50 years of OPEC with Vienna concert
Energy mix not expected to change in short term
Win
ters
tein
er
Reu
ters
QF

4
OPE
C bu
lleti
n 10
/10
Secretary General addresses press conference on 50th Anniversary
OPEC will continue to grow in stature and will be even
more important in the years ahead than it was in the
last half century.
That was the opinion put forward by the Organization’s
Secretary General, Abdalla Salem El-Badri, in an interview
held on OPEC’s 50th Anniversary.
In remarks to the OPEC webcast service, he said the
OPEC will be even more important
in years to come — El-Badri
Organization faced many challenges in the future, includ-
ing issues involving the environment, technology and the
evolving oil market itself.
“However, it is not like in the past because today the
challenges facing the Organization change almost every
year,” he said. “Fortunately, we have the people in place
in OPEC that are up to the task,” he added.
50
th A
nn
ive
rsa
ry D
ay

5
OPE
C bu
lleti
n 10
/10
El-Badri’s remarks followed an official press confer-
ence convened at the Organization’s Headquarters in
Vienna on September 14 to mark the Golden Jubilee.
OPEC was founded on September 14, 1960, in the Iraqi
capital, Baghdad, by five oil-exporting developing coun-
tries — Iran, Iraq, Kuwait, Saudi Arabia and Venezuela.
Safeguard interests
As El-Badri explains in his Anniversary message on the
OPEC website, these countries decided to join forces to
safeguard their legitimate rights and exercise control over
their petroleum resources after years of manipulation by
several major international oil companies.
“When we look at the history of OPEC … we cannot
do that without looking at the circumstances, the situa-
tion and the environment prevailing at the time,” he told
assembled newsmen.
He said that, back then, the world was still recover-
ing from the aftereffects of World War II and adjusting to
the end of colonial rule.
“But one thing was dominating the oil industry —
the international oil companies, known as the ‘Seven
Sisters’,” said El-Badri, in giving a brief overview of the
Organization’s history.
He pointed out that these companies completely con-
trolled the industry — from exploration activities, through
production to also dictating the level of price. This was
all done without any consultation with the countries who
owned the resources.
“The five oil producers that subsequently established
OPEC — Iran, Iraq, Kuwait, Saudi Arabia and Venezuela
— really had no say whatsoever over the exploitation of
their resources,” he affirmed.
El-Badri said that history showed that Venezuela was
the country that went to the Middle East to consult with
other oil producers there. But it took a couple of years
before the ‘Founding Five’ eventually met in Baghdad to
formally establish OPEC.
Moving through the decades, he said the first ten years
proved to be a learning period for OPEC since Member
Countries still had no control over their activities. But in
1970, Members moved to exercise some control over
their industries.
Difficult times
The1980s and 1990s, he continued, represented difficult
times for OPEC with price crises and conflicts between its
Member Countries.
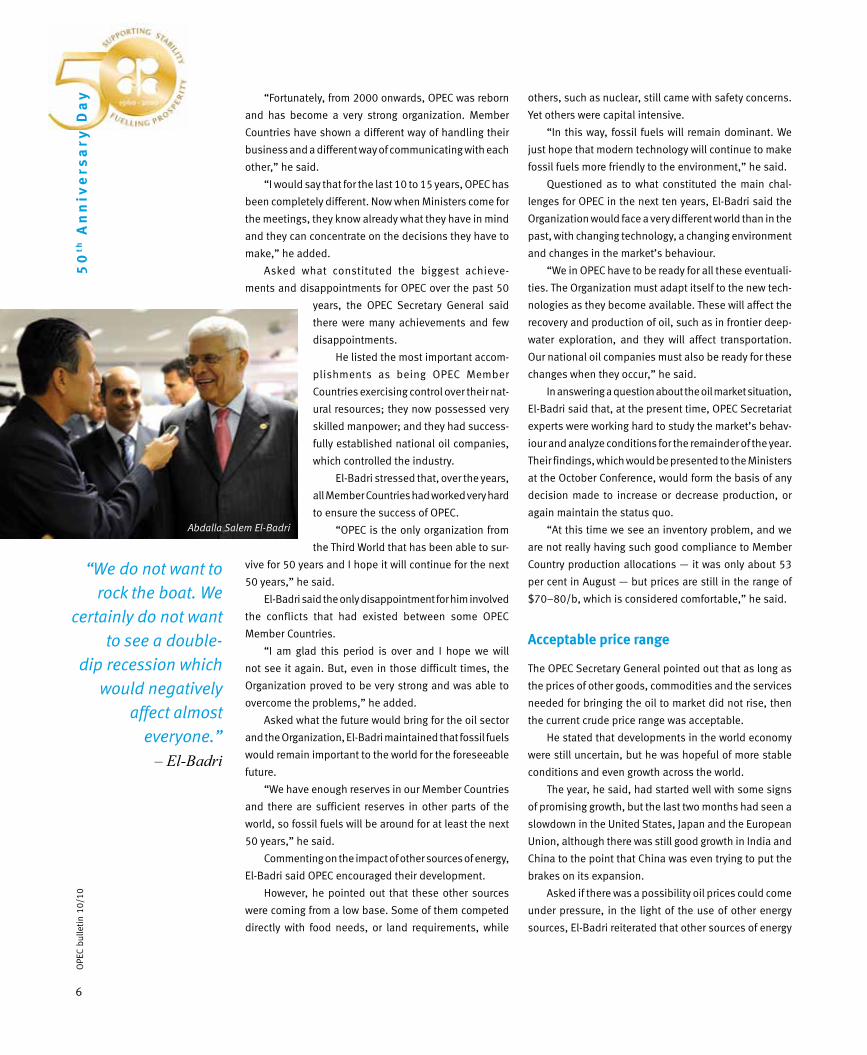
“We have enough reserves in our Member Countries and there are sufficient reserves in other parts of the world, so fossil fuels will be around for at least the next 50 years.”
– El-Badri
Abdalla Salem El-Badri (l), OPEC Secretary General and Angela Agoawike, then Officer-in-Charge of the PR & Information Department.
6
OPE
C bu
lleti
n 10
/10
“Fortunately, from 2000 onwards, OPEC was reborn
and has become a very strong organization. Member
Countries have shown a different way of handling their
business and a different way of communicating with each
other,” he said.
“I would say that for the last 10 to 15 years, OPEC has
been completely different. Now when Ministers come for
the meetings, they know already what they have in mind
and they can concentrate on the decisions they have to
make,” he added.
Asked what constituted the biggest achieve-
ments and disappointments for OPEC over the past 50
years, the OPEC Secretary General said
there were many achievements and few
disappointments.
He listed the most important accom-
plishments as being OPEC Member
Countries exercising control over their nat-
ural resources; they now possessed very
skilled manpower; and they had success-
fully established national oil companies,
which controlled the industry.
El-Badri stressed that, over the years,
all Member Countries had worked very hard
to ensure the success of OPEC.
“OPEC is the only organization from
the Third World that has been able to sur-
vive for 50 years and I hope it will continue for the next
50 years,” he said.
El-Badri said the only disappointment for him involved
the conflicts that had existed between some OPEC
Member Countries.
“I am glad this period is over and I hope we will
not see it again. But, even in those difficult times, the
Organization proved to be very strong and was able to
overcome the problems,” he added.
Asked what the future would bring for the oil sector
and the Organization, El-Badri maintained that fossil fuels
would remain important to the world for the foreseeable
future.
“We have enough reserves in our Member Countries
and there are sufficient reserves in other parts of the
world, so fossil fuels will be around for at least the next
50 years,” he said.
Commenting on the impact of other sources of energy,
El-Badri said OPEC encouraged their development.
However, he pointed out that these other sources
were coming from a low base. Some of them competed
directly with food needs, or land requirements, while
others, such as nuclear, still came with safety concerns.
Yet others were capital intensive.
“In this way, fossil fuels will remain dominant. We
just hope that modern technology will continue to make
fossil fuels more friendly to the environment,” he said.
Questioned as to what constituted the main chal-
lenges for OPEC in the next ten years, El-Badri said the
Organization would face a very different world than in the
past, with changing technology, a changing environment
and changes in the market’s behaviour.
“We in OPEC have to be ready for all these eventuali-
ties. The Organization must adapt itself to the new tech-
nologies as they become available. These will affect the
recovery and production of oil, such as in frontier deep-
water exploration, and they will affect transportation.
Our national oil companies must also be ready for these
changes when they occur,” he said.
In answering a question about the oil market situation,
El-Badri said that, at the present time, OPEC Secretariat
experts were working hard to study the market’s behav-
iour and analyze conditions for the remainder of the year.
Their findings, which would be presented to the Ministers
at the October Conference, would form the basis of any
decision made to increase or decrease production, or
again maintain the status quo.
“At this time we see an inventory problem, and we
are not really having such good compliance to Member
Country production allocations — it was only about 53
per cent in August — but prices are still in the range of
$70–80/b, which is considered comfortable,” he said.
Acceptable price range
The OPEC Secretary General pointed out that as long as
the prices of other goods, commodities and the services
needed for bringing the oil to market did not rise, then
the current crude price range was acceptable.
He stated that developments in the world economy
were still uncertain, but he was hopeful of more stable
conditions and even growth across the world.
The year, he said, had started well with some signs
of promising growth, but the last two months had seen a
slowdown in the United States, Japan and the European
Union, although there was still good growth in India and
China to the point that China was even trying to put the
brakes on its expansion.
Asked if there was a possibility oil prices could come
under pressure, in the light of the use of other energy
sources, El-Badri reiterated that other sources of energy
50
th A
nn
ive
rsa
ry D
ay
“We do not want to rock the boat. We
certainly do not want to see a double-
dip recession which would negatively
affect almost everyone.”
– El-Badri
Abdalla Salem El-Badri

7
OPE
C bu
lleti
n 10
/10
were not a challenge for OPEC and in fact the Organization
welcomed them.
“Demand for energy will continue to grow. Don’t for-
get that you have 1.5 billion people in the world without
access to modern energy services at this time and 2.5bn
people without proper energy sources for cooking. The
world is growing, not only in energy, but in population
and needs,” he stated.
In this direction, he said, OPEC was not happy with
any form of subsidization for energy resources.
Fair competition
“For example, we are not happy with countries having high
taxes on oil and then using that revenue from taxation
to subsidize other forms of energy. If you have another
source of energy, let it compete fairly with others to see
which one will prevail and which one will satisfy the
world’s energy needs.”
Asked whether OPEC would like to see crude oil prices
rising higher than $70–80/b, if the economy recovered,
El-Badri replied that as long as the cost of imports, goods
and services for OPEC Member Countries did not become
higher, then OPEC would not need a higher oil price.
“With the current conditions in the market and
with countries coming back from the recession, the
Organization is happy with this range. That is why we
are leaving things the way they are production-wise. We
do not want to rock the boat. We certainly do not want to
see a double-dip recession which would negatively affect
almost everyone,” he affirmed.
El-Badri later made it clear in his webcast comments
that OPEC did not want to have crude prices at a level
whereby consumers would start to look for alternatives
to the Organization’s oil.
“And if the consumers reduce their activities, then
the global economy will slow down again.
“However, at the same time we do not want to have a
low crude price that affects future investment levels. One
has to remember that this is the only income our Member
Countries have, so they need a certain level of oil price.
“So, all in all, there must be a balance in the price for
the producers and consumers — a level where everybody
is happy,” he added.
In fielding a question about the rise in oil use in some
OPEC Member Countries, especially those in the Gulf
region, El-Badri said this was true, their consumption
was increasing, but at the same time they were expand-
ing their oil reserves and also their export capabilities.
He expressed dis-
appointment at the pro-
duction policies of some
non-OPEC producers,
explaining that when,
as a result of the global
financial crisis, crude
oil prices fell to around
$30/b in late 2008, the
Organization had tried
talking to non-OPEC pro-
ducers about helping to
stabilize the market.
“But we knew from
experience that we would have to go it alone, so in
Algeria, we took the decision to reduce production by
over 4m b/d. Up to now, no one from outside OPEC has
helped contribute to that reduction and the fact is, OPEC
has shouldered the whole burden by itself.
“However, we do not see non-OPEC production
increasing by much in the years ahead,” he added.
Questioned about OPEC’s plans to improve its data
quality and analysis and also its cooperation with other
international organizations, El-Badri pointed out that
when he took up his position with OPEC, one of his aims
was to improve the level and quality of data and informa-
tion disseminated to the outside world and to its Member
Countries.
He said the Organization now had its World Oil
Outlook, which was a very important document, the
Annual Statistical Bulletin (ASB), as well as the Monthly
Oil Market Report.
“This data we are releasing regularly is becoming an
important part of the market,” he said.
Concerning cooperation, El-Badri said that, in the
past, OPEC did not talk to other organizations, such as
the International Energy Agency (IEA). “But now we are on
good terms with them. In fact, through the International
Energy Forum (IEF), two meetings are planned with the
IEA for this year and early next year at which we will com-
pare notes. Our respective data is not that far apart,”
he said.
In the years ahead, said El-Badri. OPEC would continue
to communicate with all countries and organizations.
“We talk to Moscow, we talk to China, we talk to the
IEA, and we talk to the European Union. It is good to
have dialogue. Let us hear each other’s views and lis-
ten to the problems. Maybe then we can solve them,”
he stated.
7
OPE
C bu
lleti
n 10
/10
Above: Members of the OPEC Management with a cake prepared for OPEC’s 50th Anniversary.
8
OPE
C bu
lleti
n 10
/10
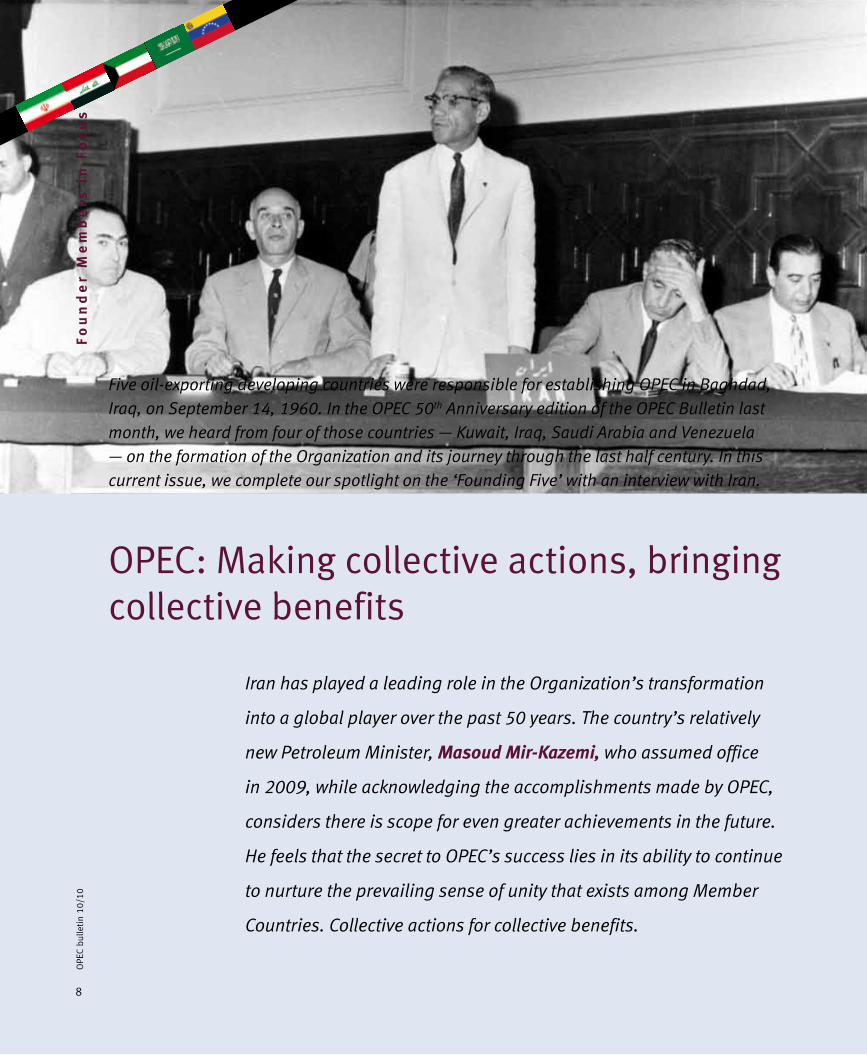
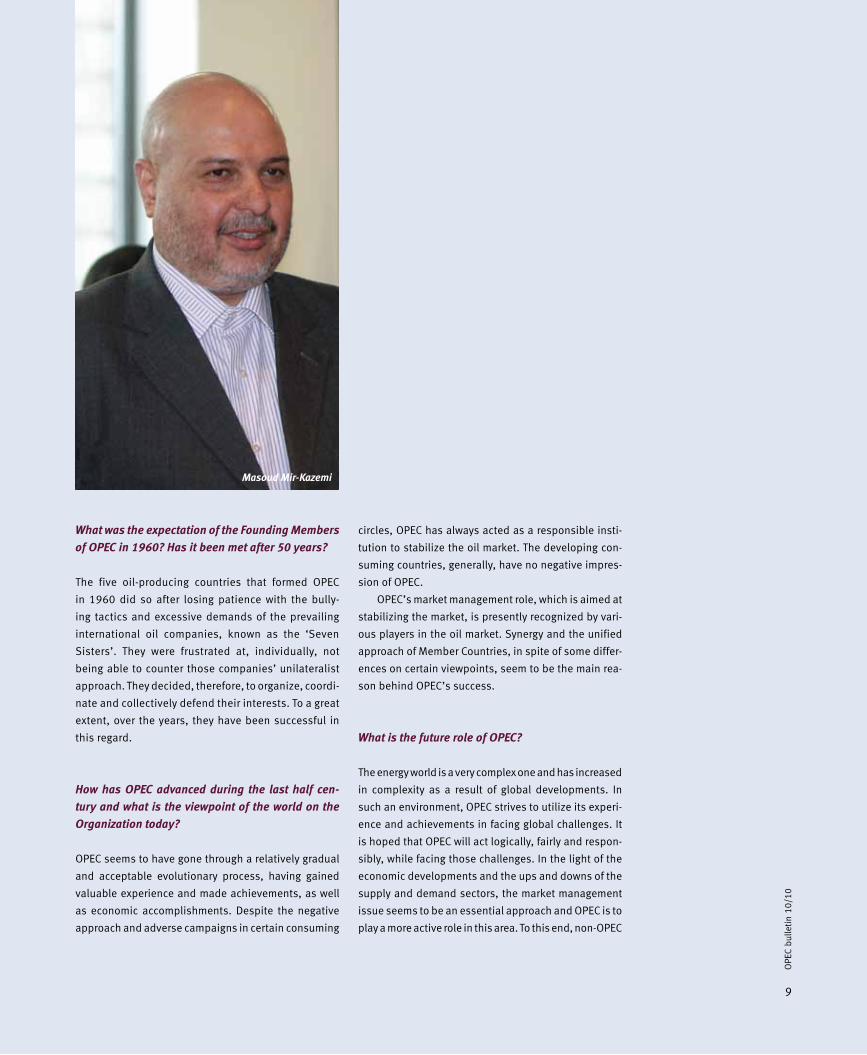
OPEC: Making collective actions, bringing collective benefits
Iran has played a leading role in the Organization’s transformation
into a global player over the past 50 years. The country’s relatively
new Petroleum Minister, Masoud Mir-Kazemi, who assumed office
in 2009, while acknowledging the accomplishments made by OPEC,
considers there is scope for even greater achievements in the future.
He feels that the secret to OPEC’s success lies in its ability to continue
to nurture the prevailing sense of unity that exists among Member
Countries. Collective actions for collective benefits.
Fo
un
de
r M
em
be
rs i
n F
oc
us
Five oil-exporting developing countries were responsible for establishing OPEC in Baghdad, Iraq, on September 14, 1960. In the OPEC 50th Anniversary edition of the OPEC Bulletin last month, we heard from four of those countries — Kuwait, Iraq, Saudi Arabia and Venezuela — on the formation of the Organization and its journey through the last half century. In this current issue, we complete our spotlight on the ‘Founding Five’ with an interview with Iran.
9
OPE
C bu
lleti
n 10
/10
What was the expectation of the Founding Members of OPEC in 1960? Has it been met after 50 years?
The five oil-producing countries that formed OPEC
in 1960 did so after losing patience with the bully-
ing tactics and excessive demands of the prevailing
international oil companies, known as the ‘Seven
Sisters’. They were frustrated at, individually, not
being able to counter those companies’ unilateralist
approach. They decided, therefore, to organize, coordi-
nate and collectively defend their interests. To a great
extent, over the years, they have been successful in
this regard.
How has OPEC advanced during the last half cen-tury and what is the viewpoint of the world on the Organization today?
OPEC seems to have gone through a relatively gradual
and acceptable evolutionary process, having gained
valuable experience and made achievements, as well
as economic accomplishments. Despite the negative
approach and adverse campaigns in certain consuming
circles, OPEC has always acted as a responsible insti-
tution to stabilize the oil market. The developing con-
suming countries, generally, have no negative impres-
sion of OPEC.
OPEC’s market management role, which is aimed at
stabilizing the market, is presently recognized by vari-
ous players in the oil market. Synergy and the unified
approach of Member Countries, in spite of some differ-
ences on certain viewpoints, seem to be the main rea-
son behind OPEC’s success.
What is the future role of OPEC?
The energy world is a very complex one and has increased
in complexity as a result of global developments. In
such an environment, OPEC strives to utilize its experi-
ence and achievements in facing global challenges. It
is hoped that OPEC will act logically, fairly and respon-
sibly, while facing those challenges. In the light of the
economic developments and the ups and downs of the
supply and demand sectors, the market management
issue seems to be an essential approach and OPEC is to
play a more active role in this area. To this end, non-OPEC
Masoud Mir-Kazemi
10
OPE
C bu
lleti
n 10
/10
Fo
un
de
r M
em
be
rs i
n F
oc
us
countries are urged to cooperate as well. Other factors
are evidently influencing the oil market, such as the
same factors that pushed oil prices up to the level of
$150 a barrel, despite the fact that the Organization was
supplying the market with sufficient oil and there was
no shortage in the market. There were also other fac-
tors that subsequently pushed prices down to $30/b,
which were also not under OPEC’s control. As a result,
one cannot claim OPEC to be the sole market manager.
OPEC has limitations in this area and the participation
of all influential players is needed for full management
of the market.
What interests does your country pursue specifically in its membership to OPEC?
The collective actions of OPEC translates into collective
benefits for Member Countries. An evaluation of OPEC’s
actions leads one to conclude that it could have func-
tioned better in defending the interests of its Member
Countries, but unfortunately did not succeed for various
reasons. We hope that in the future OPEC will be able
to defend its Member Countries’ interests more than in
the past and improve its functions.
Do you believe OPEC has also benefited from your country’s membership to the Organization?
OPEC exists because of its Member Countries. In addi-
tion to being a Founding Member, Iran is regarded as
an active and constructive Member of the Organization.
Over the past 50 years, Iran has, in addition to its indi-
vidual interests, pursued the collective interests of
the Organization, always attempting to enhance the
influencing power of the Organization in confronting
challenges and developments through synergy. Iran
has also played a prominent role in strengthening the
Organization’s Secretariat. The first Secretary General
of OPEC was Fuad Rouhani, who was from Iran, and
we have always provided the Secretariat with skilled
managerial and expert manpower. OPEC’s credibil-
ity lies in the fact that it includes countries with a
high level of reserves, major oil producers that enjoy
concerted cooperation.
Do you have a personal memory of your participa-tion in OPEC meetings?
Obviously, the first-time participation of every minister
in OPEC meetings is a memory in itself.
How do you feel when your country is considered important as a Founder Member of OPEC?
I feel honoured because developing countries have
proven that they can also appear influential on the
global stage through a unified approach. It also shows
that hardships and a limited number of fellow countries
should not frustrate or disappoint us, since OPEC, at the
start, was founded by five countries, but their determi-
nation resulted in others joining the Organization. The
Founding Members, of course, should play a greater
role in the Organization. For example, the position
of Secretary General has not been at the disposal of
the Founding Members in recent years, which is con-
sidered a point of weakness for the Organization.
Thus, in certain cases, Founding Members are to
enjoy priorities.
11
OPE
C bu
lleti
n 10
/10
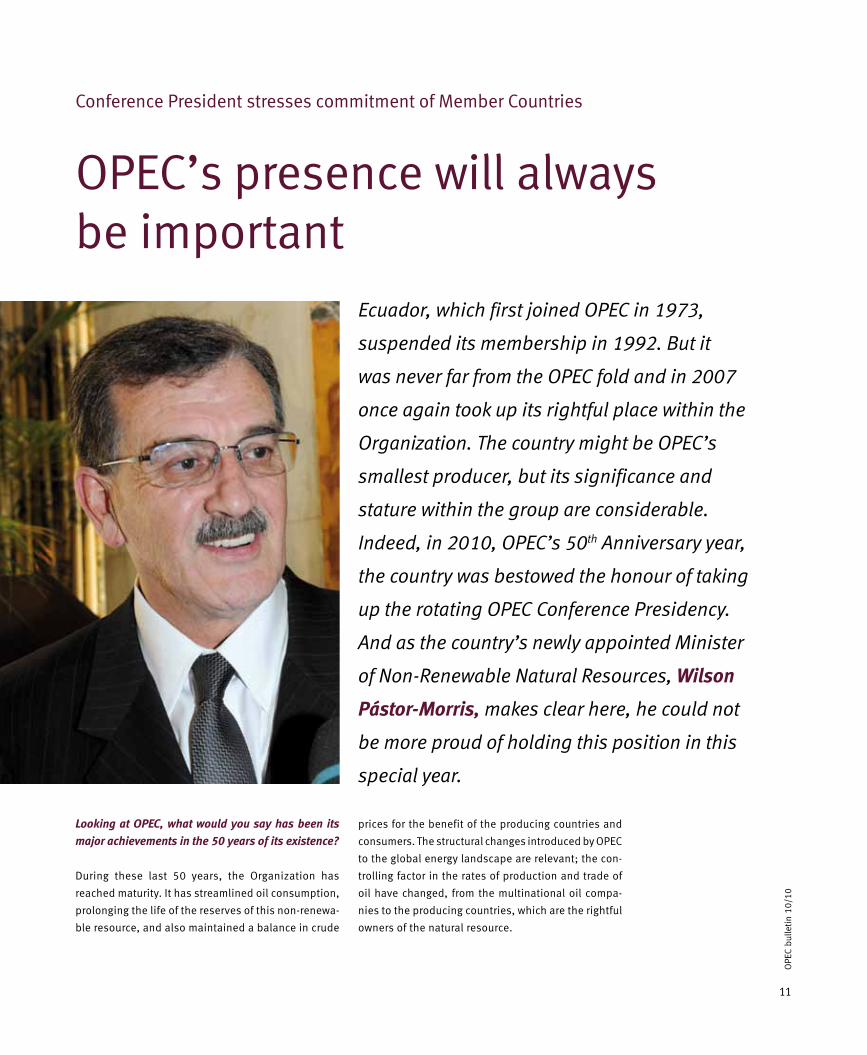
Conference President stresses commitment of Member Countries
OPEC’s presence will always be important
Looking at OPEC, what would you say has been its major achievements in the 50 years of its existence?
During these last 50 years, the Organization has
reached maturity. It has streamlined oil consumption,
prolonging the life of the reserves of this non-renewa-
ble resource, and also maintained a balance in crude
Ecuador, which first joined OPEC in 1973,
suspended its membership in 1992. But it
was never far from the OPEC fold and in 2007
once again took up its rightful place within the
Organization. The country might be OPEC’s
smallest producer, but its significance and
stature within the group are considerable.
Indeed, in 2010, OPEC’s 50th Anniversary year,
the country was bestowed the honour of taking
up the rotating OPEC Conference Presidency.
And as the country’s newly appointed Minister
of Non-Renewable Natural Resources, Wilson
Pástor-Morris, makes clear here, he could not
be more proud of holding this position in this
special year.
prices for the benefit of the producing countries and
consumers. The structural changes introduced by OPEC
to the global energy landscape are relevant; the con-
trolling factor in the rates of production and trade of
oil have changed, from the multinational oil compa-
nies to the producing countries, which are the rightful
owners of the natural resource.

12
OPE
C bu
lleti
n 10
/10
Oth
er
Me
mb
ers
in
Fo
cu
s Also, OPEC Member Countries allocate part of their
revenue surplus to aid programmes, either directly, or
through the OPEC Fund for International Development
(OFID).
In addition, OPEC also helps to reduce the techno-
logical gap through its Member Countries’ research and
educational institutions, which promote the creation of
proprietary and clean technologies for developing coun-
tries, and prepares studies to contribute towards the
mitigation of climate change.
Looking back, were there things done, decisions taken, that could have been done differently?
OPEC is a consultative institution for the countries that
belong to it. It unifies their petroleum policies in a strat-
egy that sets out to defend the interests of oil-producing
nations. OPEC decisions are taken by consensus and
take into account the interests of both the producers
and consumers.
The Organization formulates policies that seek to
secure stability of oil prices in international markets and
guarantee for the oil-producing nations stable, fair and
sufficient returns. Importantly, it ensures that consuming
countries have an efficient, economic, orderly and regular
supply of crude oil, as well as a fair return to investors in
the oil industry.
These are laudable objectives which the Organization
has carried out so effectively. There is, indeed, no cause
for any regret.
How do you envisage OPEC’s role developing in the years ahead?
Countries of the world have just been through a seri-
ous recession and OPEC has shown itself to be one of
the responsible parties in the contribution it has made
in helping to bring about solutions for stabilizing the
global economy. Through its strategic product, the
Organization’s great challenge has been to contribute
to a healthy equilibrium between supply and demand
of crude and oil products. Through its policy deci-
sions and actions, it has helped all parties involved
to overcome the crisis and achieve long-term stability
and reliability of supply and demand in what is a very
complex equation.
Furthermore, all OPEC Member Countries have the
commitment and challenge to explore new and better
ways of conducting their business and to utilize new tech-
nologies, as well as finding alternative means of helping
mitigate the climate change challenge.
These are roles that will continue to be built upon in
the years ahead.
Do you have any personal reflections/anecdotes on your involvement in OPEC?
Personally, I consider it to be an honour to have the unique
opportunity of presiding over the OPEC Conference dur-
ing its 50th Anniversary and to be able to share and meet
with my honorable colleagues and the Secretariat in this
memorable year.
What have been the benefits of OPEC membership to your country?
Ecuador has gained significantly in many areas, such
as attaining a better negotiating capability in for-
mulating oil contracts, as well as getting access to
the latest information and studies on technical and
economic energy issues and the international oil markets.
Furthermore, we have shared and benefited from
OPEC policy decisions on such issues as sovereignty,
oil price stability, the constant and reliable supply of
crude and oil products to the consumers, fair benefits
for the producers and equitable returns to our industry’s
investors.
What do you say to OPEC on its 50th birthday?
In holding the Presidency of the OPEC Conference,
Ecuador considers that the Organization’s presence
will always be important for ensuring an adequate sup-
ply of oil to the consumers. It also deems as important
the unification of the petroleum policies of its Member
Countries, defending the interests of those Members,
fortifying dialogue between the producers and the con-
sumers, bringing about integration between the organi-
zations of the South, as well as consolidating the defence
of smaller producers.
With all these in view, I would say to OPEC, happy
birthday and there is still much more to be done.
13
OPE
C bu
lleti
n 10
/10
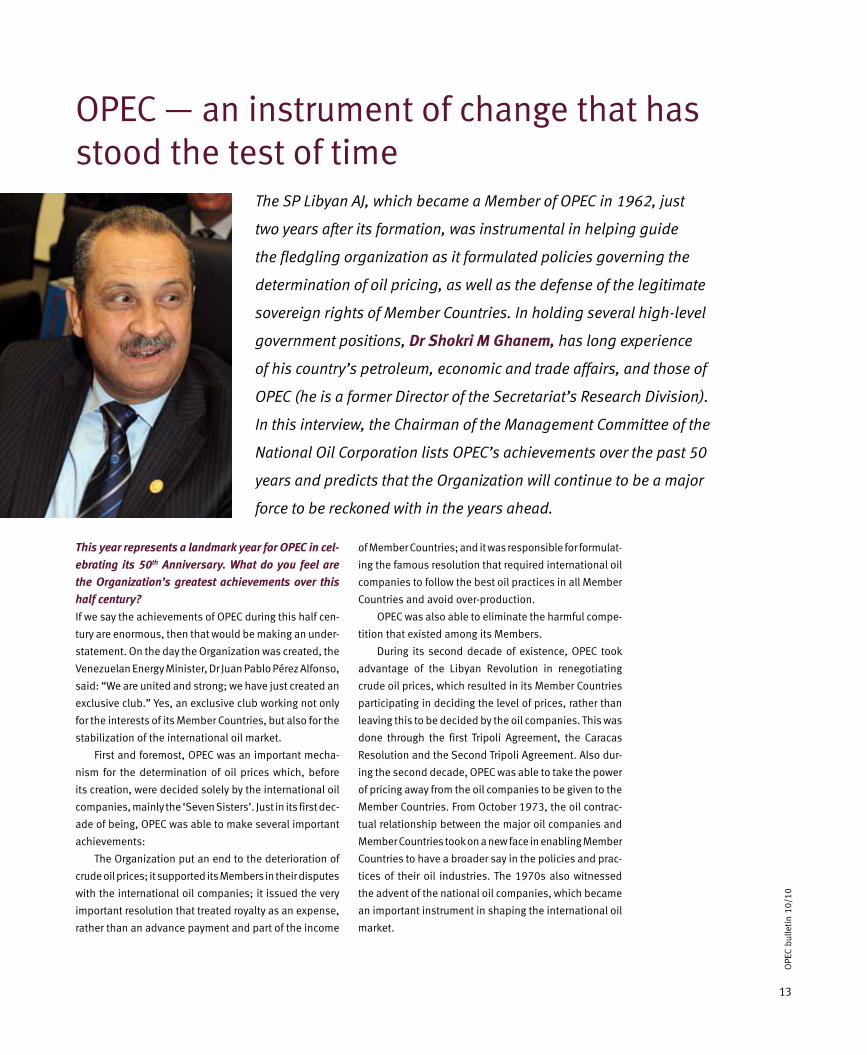
OPEC — an instrument of change that has stood the test of time
The SP Libyan AJ, which became a Member of OPEC in 1962, just
two years after its formation, was instrumental in helping guide
the fledgling organization as it formulated policies governing the
determination of oil pricing, as well as the defense of the legitimate
sovereign rights of Member Countries. In holding several high-level
government positions, Dr Shokri M Ghanem, has long experience
of his country’s petroleum, economic and trade affairs, and those of
OPEC (he is a former Director of the Secretariat’s Research Division).
In this interview, the Chairman of the Management Committee of the
National Oil Corporation lists OPEC’s achievements over the past 50
years and predicts that the Organization will continue to be a major
force to be reckoned with in the years ahead.
This year represents a landmark year for OPEC in cel-ebrating its 50th Anniversary. What do you feel are the Organization’s greatest achievements over this half century?If we say the achievements of OPEC during this half cen-
tury are enormous, then that would be making an under-
statement. On the day the Organization was created, the
Venezuelan Energy Minister, Dr Juan Pablo Pérez Alfonso,
said: “We are united and strong; we have just created an
exclusive club.” Yes, an exclusive club working not only
for the interests of its Member Countries, but also for the
stabilization of the international oil market.
First and foremost, OPEC was an important mecha-
nism for the determination of oil prices which, before
its creation, were decided solely by the international oil
companies, mainly the ‘Seven Sisters’. Just in its first dec-
ade of being, OPEC was able to make several important
achievements:
The Organization put an end to the deterioration of
crude oil prices; it supported its Members in their disputes
with the international oil companies; it issued the very
important resolution that treated royalty as an expense,
rather than an advance payment and part of the income
of Member Countries; and it was responsible for formulat-
ing the famous resolution that required international oil
companies to follow the best oil practices in all Member
Countries and avoid over-production.
OPEC was also able to eliminate the harmful compe-
tition that existed among its Members.
During its second decade of existence, OPEC took
advantage of the Libyan Revolution in renegotiating
crude oil prices, which resulted in its Member Countries
participating in deciding the level of prices, rather than
leaving this to be decided by the oil companies. This was
done through the first Tripoli Agreement, the Caracas
Resolution and the Second Tripoli Agreement. Also dur-
ing the second decade, OPEC was able to take the power
of pricing away from the oil companies to be given to the
Member Countries. From October 1973, the oil contrac-
tual relationship between the major oil companies and
Member Countries took on a new face in enabling Member
Countries to have a broader say in the policies and prac-
tices of their oil industries. The 1970s also witnessed
the advent of the national oil companies, which became
an important instrument in shaping the international oil
market.
14
OPE
C bu
lleti
n 10
/10
Oth
er
Me
mb
er
Co
un
trie
s During the 1980s, OPEC took more responsibility in the international oil
market and became a real force to be reckoned with, working hard to balance
supply and demand and ensuring enough supplies were available to meet
the needs of the world. Member Countries also sought to secure sufficient
demand so as to get a fair price for their product, which in turn would increase
the revenue required for their economic development projects.
Since the 1990s, OPEC has directed its efforts towards cooperating with
international organizations and bringing about conditions that enabled it
to co-exist with the International Energy Agency. It also looked at ways and
means of creating a better understanding between the oil-consuming and oil-
producing countries.
OPEC’s policies in recent years have also tackled the question of the envi-
ronment out of the belief that producers and consumers of oil are all living
on one planet and a clean planet is the common target. It has therefore been
participating vigorously in all environmental meetings and is advancing the
debate aimed at reducing harmful gas emissions.
At its foundation and during its formative years, OPEC had to contend with numerous detractors, many of whom predicted the Organization would not last. A half century on and they have been proved wrong. What do you consider have been OPEC’s strengths and how do you feel the Organization is perceived by the world at large today?In fact, it was a great achievement that OPEC Member Countries were able
to stick together for this half century, despite the problems it has faced and
despite the predicted demise of the Organization. However, it was able to
stick together basically because, since its inception, Member Countries have
believed that a united organization is a strong organization and therefore they
were able to keep OPEC alive, even during the worst days of their differences.
OPEC Member Countries not only witnessed differences in opinion, but
some of these Members went to war against each other — Iraq/Iran and Iraq/
Kuwait — yet their Ministers were meeting under the umbrella of OPEC and
creating an understanding for the benefit of their economies and not allowing
outsiders to interfere and affect the Organization. This factor in itself could
definitely be described as one of the biggest achievements of OPEC.
This year has been the cause of a double celebration with the Anniversary accompanying the opening of OPEC’s new Headquarters. How important is this move and do you see it enhancing the future work of the Organization?The celebration of OPEC’s Golden Jubilee is without question an important
occasion and a reason for celebration; it has now reached 50 years of age.
Moving to a new building should enhance its functions and will also help cre-
ate a better environment for its employees.
As a former manager at the OPEC Secretariat, together with the ministe-rial portfolios you have held in Libya, you have gained extensive experi-ence of the international oil sector and the Organization. How important do you feel OPEC is, especially its actions in ensuring the welfare of the global economy?It is now an accepted fact that OPEC is an instrument of change, a factor of
stabilization and an organization that is working hard to
balance supply and demand of a very important prod-
uct — ensuring the continuous supply of oil and having
a responsibility towards all humans, regardless of race,
gender or age.
OPEC has received widespread praise for the responsi-ble attitude it has shown in helping to restore stability to the oil market in 2010 after two very difficult years. How instrumental do you feel OPEC policy decisions have been in supporting the global economic recovery?OPEC received this widespread praise because it
has proved it is responsible, flexible and an active
Organization, ready to take action, whenever the need
arises. For instance, in December 2008, when there was
a real glut in the oil market, a glut that threatened future
security of supply and the market structure, OPEC reduced
its production by more than four million barrels/day,
restoring stability to the marketplace.
Further confirmation of this responsibility lies in the
fact that when the price of oil went up to levels never
experienced before, reaching close to $150/b, OPEC
increased its production, working hard to make sure that
the world recovered quickly from the economic downturn.
OPEC’s actions in putting more oil on the market led to
crude prices falling to more than half their record levels.
OPEC also increased its cooperation and dialogue with
consumers as it strived to ensure a speedy recovery and
the maintenance of a healthy economy.
With the global economic recession seemingly over, do you feel there will be a quick return to growth in oil demand in the next few years, or will uncertainty again prevail, with growth more likely to be gradual?Yes, we are sure that there will be an increase in oil demand
and, as a matter of fact, we are already witnessing an
increase in world oil demand, in particular in China, India,
Brazil and developing countries in general.
What is your feeling on global crude oil supply and demand at the moment? Is it in balance? Do you con-sider oil stocks are still too high?Yes, it is my feeling that the market is well balanced and
there is enough oil to satisfy the needs of the consumers
as demand improves. There is also enough spare capac-
ity to meet all the needs that could be created in the fore-
seeable future. But it is important that OPEC Member
Countries exercise strict discipline in their output alloca-
tion so that a balanced market will always be there. We
15
OPE
C bu
lleti
n 10
/10
need to avoid a glut in production that would lead to less
investment and lower capacity levels that could create a
shortage of supply in the future.
What do you feel is a fair and reasonable oil price range for both the producers and consumers? And how important will such a range be to supporting the investment required for securing the industry’s future?A fair and reasonable oil price is a price that ensures sta-
bility in the market, a price that will be sufficient to encour-
age investors to invest in more exploration and produc-
tion, but, at the same time, one that will not destabilize
the world economy.
We have all witnessed the destabilizing effects spec-ulation can have on oil prices. How much influence do you think speculators are having on today’s price level and do you feel any lessons have been learned in this regard after the experience of the last two years?The fact is, speculators have become a big problem for the
oil pricing system. The international oil market took a new
turn when oil was left to the market to decide the price.
Worse than this, oil was left to the futures market and the
futures market is speculative by nature. Consequently, oil
fell into the trap of the speculators. This is why we see the
continuous fluctuations in oil prices — their level is not
being decided by supply and demand, but by so many
other factors, including geopolitics, stability of the dif-
ferent countries, responsible and irresponsible declara-
tions by governments, and sensational press reporting.
All of this has fuelled speculation and led to the pric-
ing of oil not following the logical pattern of economic
behaviour, leading to almost daily fluctuations with its
ensuring adverse effects on the world economy in general
and the revenue of OPEC Member Countries, in particular.
Concerning OPEC’s cooperation with non-OPEC pro-ducers, do you feel some producers outside the Organization take advantage of OPEC’s production restraint by maximizing their output, and in so doing risk further destabilizing the oil market and the glo-bal economy in general?It is of paramount importance that OPEC Member Countries
and non-OPEC producers cooperate to ensure the stabi-
lization of the market. Unfortunately, a number of non-
OPEC countries are taking advantage of OPEC and do not
cooperate with the Organization in creating a balanced
market. On the contrary, some of them want to see OPEC
cutting its production, so they can increase theirs, creating
a situation that is destabilizing and has an adverse effect on the world econ-
omy. Yet, OPEC is trying to create an understanding that the Organization works
towards a policy followed by all and one that serves all their national interests.
Libya’s own oil developments look very promising. Could you enlighten us as to what is happening domestically in your country at the moment?In the case of Libya, and since we were able to solve the pending problems
between our country and the rest of the world, we have embarked on a new
policy based on transparency and competition, while opening up the coun-
try to investors from all over the world to enter the field of oil exploration on
the basis of new contractual relationships which we call EPSA IV, in ensuring
competition through open tenders.
We treat all companies on an equal basis as long as they are qualified
and there is no discrimination because of the nationality of the company.
Therefore, we have dealings with almost 50 qualified companies from differ-
ent parts of the world. We have companies from the United States, Europe,
India and Russia who were able to get exploration rights in Libya. We are
even awarding contracts to companies from mainland China and firms from
Taiwan.
The policy has proven to be very effective in realizing our potential which
has not been explored for the last four decades. A good number of these com-
panies have already discovered oil and/or gas and some of them are still at
the stage of drilling for petroleum resources.
Libya’s oil potential is far more than its present capacity or production.
In 1970, we used to produce more than 3.5m b/d, while now our production
is less than half that amount. This is not because our fields are depleted, but
basically because of the embargoes and sanctions we had to live through for
two decades. Therefore, with the removal of these sanctions our capacity is
now increasing and we are sure that we will, in the coming future, reach the
levels of production we were once at.
Finally, returning to the subject of OPEC’s Anniversary — do you think OPEC will still be around in 2060 to celebrate its centenary? If so, do you feel it will be a different entity, or one that is very similar in sense and purpose to the Organization we are seeing today?OPEC was able to complete 50 years of its life against all the odds and I believe
it will live to celebrate its centenary. I am sure the Organization, in the coming
decades, will face a lot of challenges from within and from outside, but I am
equally sure its Member Countries will overcome all the crises they may face.
Staying together is more beneficial for all and ensuring that the Organization
will be here to stay for many years to come is a necessity. Although it is expected
to see changes in its Membership as the years progress, the interests and
focus of the Organization on such issues as prices, supply and demand and
ensuring good relationships with the consuming nations will be among the
Organization’s most important roles.
OPEC will no doubt strengthen its role in the environment, in new tech-
nology, in new sources of energy and it will be more proactive in coordinating
issues with the rest of the international organizations — working together for
a common goal in an ever shrinking world.
16
OPE
C bu
lleti
n 10
/10
15
7th
OP
EC
Co
nfe
ren
ce
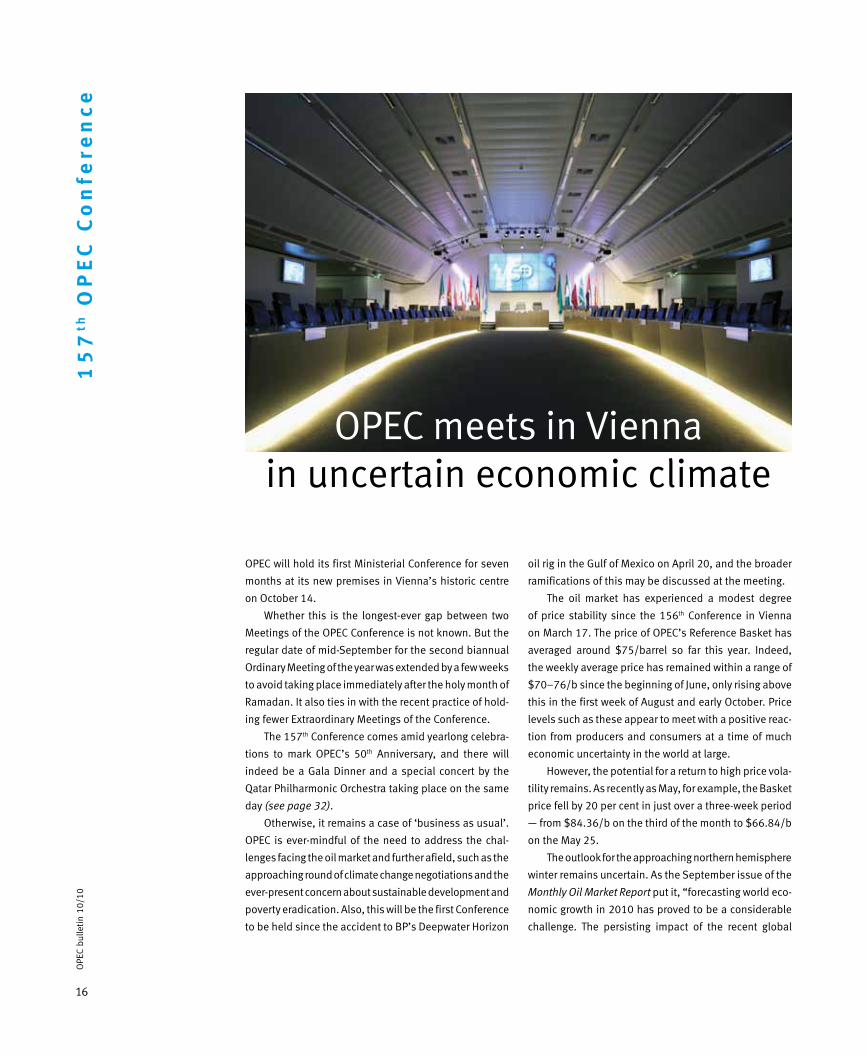
OPEC will hold its first Ministerial Conference for seven
months at its new premises in Vienna’s historic centre
on October 14.
Whether this is the longest-ever gap between two
Meetings of the OPEC Conference is not known. But the
regular date of mid-September for the second biannual
Ordinary Meeting of the year was extended by a few weeks
to avoid taking place immediately after the holy month of
Ramadan. It also ties in with the recent practice of hold-
ing fewer Extraordinary Meetings of the Conference.
The 157th Conference comes amid yearlong celebra-
tions to mark OPEC’s 50th Anniversary, and there will
indeed be a Gala Dinner and a special concert by the
Qatar Philharmonic Orchestra taking place on the same
day (see page 32).
Otherwise, it remains a case of ‘business as usual’.
OPEC is ever-mindful of the need to address the chal-
lenges facing the oil market and further afield, such as the
approaching round of climate change negotiations and the
ever-present concern about sustainable development and
poverty eradication. Also, this will be the first Conference
to be held since the accident to BP’s Deepwater Horizon
oil rig in the Gulf of Mexico on April 20, and the broader
ramifications of this may be discussed at the meeting.
The oil market has experienced a modest degree
of price stability since the 156th Conference in Vienna
on March 17. The price of OPEC’s Reference Basket has
averaged around $75/barrel so far this year. Indeed,
the weekly average price has remained within a range of
$70–76/b since the beginning of June, only rising above
this in the first week of August and early October. Price
levels such as these appear to meet with a positive reac-
tion from producers and consumers at a time of much
economic uncertainty in the world at large.
However, the potential for a return to high price vola-
tility remains. As recently as May, for example, the Basket
price fell by 20 per cent in just over a three-week period
— from $84.36/b on the third of the month to $66.84/b
on the May 25.
The outlook for the approaching northern hemisphere
winter remains uncertain. As the September issue of the
Monthly Oil Market Report put it, “forecasting world eco-
nomic growth in 2010 has proved to be a considerable
challenge. The persisting impact of the recent global
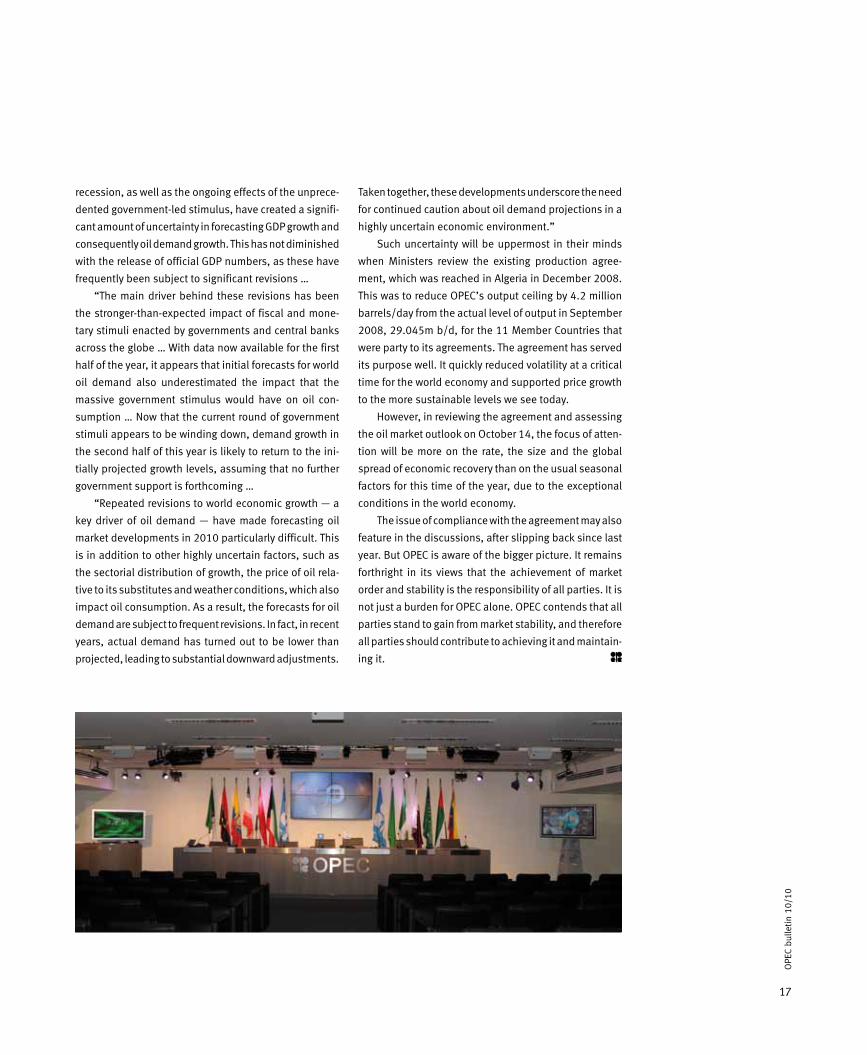
OPEC meets in Viennain uncertain economic climate
17
OPE
C bu
lleti
n 10
/10
recession, as well as the ongoing effects of the unprece-
dented government-led stimulus, have created a signifi-
cant amount of uncertainty in forecasting GDP growth and
consequently oil demand growth. This has not diminished
with the release of official GDP numbers, as these have
frequently been subject to significant revisions …
“The main driver behind these revisions has been
the stronger-than-expected impact of fiscal and mone-
tary stimuli enacted by governments and central banks
across the globe … With data now available for the first
half of the year, it appears that initial forecasts for world
oil demand also underestimated the impact that the
massive government stimulus would have on oil con-
sumption … Now that the current round of government
stimuli appears to be winding down, demand growth in
the second half of this year is likely to return to the ini-
tially projected growth levels, assuming that no further
government support is forthcoming …
“Repeated revisions to world economic growth — a
key driver of oil demand — have made forecasting oil
market developments in 2010 particularly difficult. This
is in addition to other highly uncertain factors, such as
the sectorial distribution of growth, the price of oil rela-
tive to its substitutes and weather conditions, which also
impact oil consumption. As a result, the forecasts for oil
demand are subject to frequent revisions. In fact, in recent
years, actual demand has turned out to be lower than
projected, leading to substantial downward adjustments.
Taken together, these developments underscore the need
for continued caution about oil demand projections in a
highly uncertain economic environment.”
Such uncertainty will be uppermost in their minds
when Ministers review the existing production agree-
ment, which was reached in Algeria in December 2008.
This was to reduce OPEC’s output ceiling by 4.2 million
barrels/day from the actual level of output in September
2008, 29.045m b/d, for the 11 Member Countries that
were party to its agreements. The agreement has served
its purpose well. It quickly reduced volatility at a critical
time for the world economy and supported price growth
to the more sustainable levels we see today.
However, in reviewing the agreement and assessing
the oil market outlook on October 14, the focus of atten-
tion will be more on the rate, the size and the global
spread of economic recovery than on the usual seasonal
factors for this time of the year, due to the exceptional
conditions in the world economy.
The issue of compliance with the agreement may also
feature in the discussions, after slipping back since last
year. But OPEC is aware of the bigger picture. It remains
forthright in its views that the achievement of market
order and stability is the responsibility of all parties. It is
not just a burden for OPEC alone. OPEC contends that all
parties stand to gain from market stability, and therefore
all parties should contribute to achieving it and maintain-
ing it.
18
OPE
C bu
lleti
n 10
/10
An
niv
ers
ary
Ex
hib
itio
n
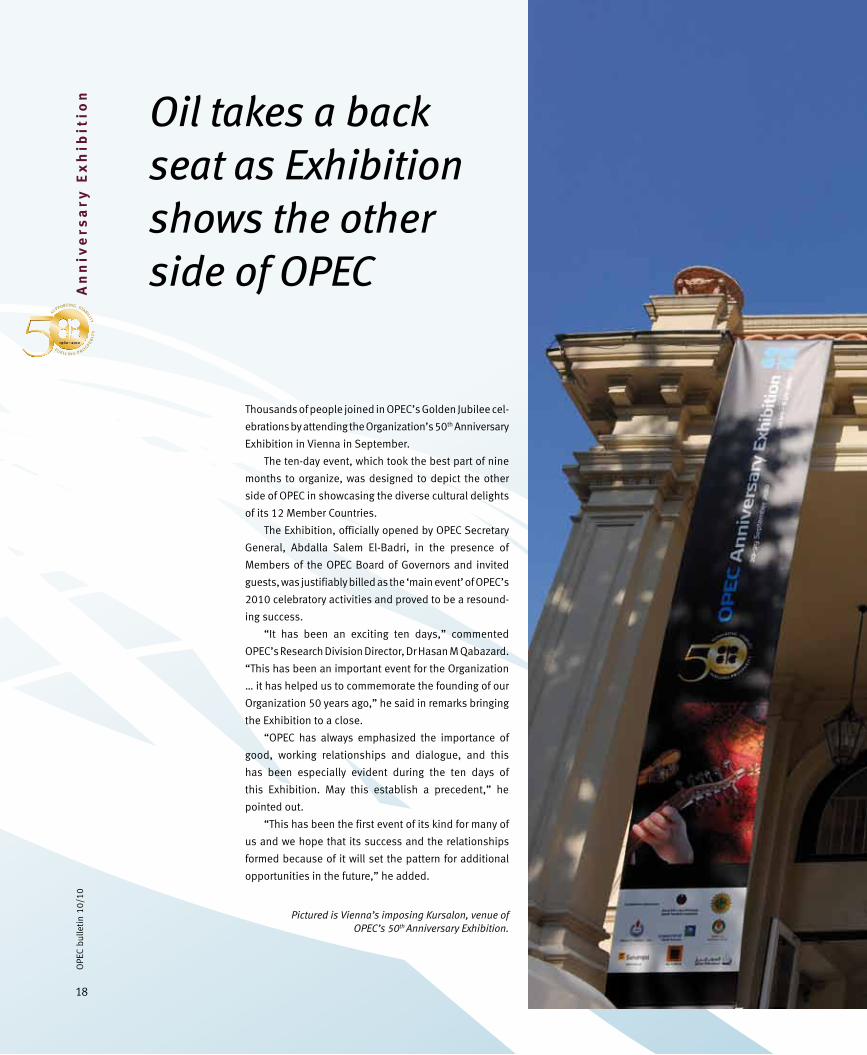
Thousands of people joined in OPEC’s Golden Jubilee cel-
ebrations by attending the Organization’s 50th Anniversary
Exhibition in Vienna in September.
The ten-day event, which took the best part of nine
months to organize, was designed to depict the other
side of OPEC in showcasing the diverse cultural delights
of its 12 Member Countries.
The Exhibition, officially opened by OPEC Secretary
General, Abdalla Salem El-Badri, in the presence of
Members of the OPEC Board of Governors and invited
guests, was justifiably billed as the ‘main event’ of OPEC’s
2010 celebratory activities and proved to be a resound-
ing success.
“It has been an exciting ten days,” commented
OPEC’s Research Division Director, Dr Hasan M Qabazard.
“This has been an important event for the Organization
… it has helped us to commemorate the founding of our
Organization 50 years ago,” he said in remarks bringing
the Exhibition to a close.
“OPEC has always emphasized the importance of
good, working relationships and dialogue, and this
has been especially evident during the ten days of
this Exhibition. May this establish a precedent,” he
pointed out.
“This has been the first event of its kind for many of
us and we hope that its success and the relationships
formed because of it will set the pattern for additional
opportunities in the future,” he added.
Oil takes a back seat as Exhibition shows the other side of OPEC
Pictured is Vienna’s imposing Kursalon, venue of OPEC’s 50th Anniversary Exhibition.
1960–2010
SUPPORTING STABILIT
Y
FUELLING P R OSP
ER
I TY

19
OPE
C bu
lleti
n 10
/10
OPEC’s Anniversary ‘event of the year’ a resounding success
19
OPE
C bu
lleti
n 10
/10

20
OPE
C bu
lleti
n 10
/10
An
niv
ers
ary
Ex
hib
itio
n
The event had given everyone the chance to look at
Member Countries’ photographs and artefacts, to dance
to their music, watch their films and taste their food.
“In so doing, I hope all present were able to learn a
little bit more about our Member Countries,” he affirmed.
Qabazard stressed that the Exhibition had also served
as an excellent opportunity “for us to come together as
friends and colleagues, form new friendships and re-
establish old ones.”
He continued: “It has been a chance for many of us to
get to know other Members of OPEC and meet representa-
tives from countries that we do not often get a chance to
visit.
“We are proud to have been able to share these
friendships with the city of Vienna and its residents,” he
added.
The Exhibition was officially launched on September
20. Its doors were open daily from 10am to 8pm. Apart from
the wealth of information available at individual stands,
the undoubted highlight of the event was the live per-
formances arranged on planned ‘Member Country days’.
Attended by all sections of the public, the Exhibition,
held at the stately Kursalon, located on the edge of
Vienna’s historic Stadtpark, attracted many people —
from high-level dignitaries and ambassadors to tour-
ists and students, all wishing to know more about an
Organization that first made its home in the Austrian
capital 45 years ago.
OPEC Member Countries had colourful displays at the
Exhibition, in addition to stands by the OPEC Secretariat,
the OPEC Fund for International Development (OFID) and
the City of Vienna.
“This Exhibition has not been about oil. Our Member
Countries have a lot of other attractions to offer the world,
which this event was meant to highlight. In doing so, we
hope to have helped the world understand us better,”
commented Qabazard.
He said many different people had visited the
Exhibition — native Viennese, members of the diplo-
matic community, tourists, even Austrian schoolchil-
dren, accompanied by their teachers, as well as family
and friends of OPEC staff.
OPEC Secretary General, Abdalla Salem El-Badri cutting the tape to declare the Exhibition open. On his right are OFID Director-General, Suleiman J Al-Herbish, Algeria’s Ambassador to Austria, Mrs Taous Feroukhi, and Dr Elisabeth Vitouch, President, European Affairs Commission of Vienna City Council, who represented the City of Vienna. On El-Badri’s left are OPEC Governor for Saudi Arabia, Dr Majid A Al-Moneef, OPEC Governor for Kuwait, Ms Siham Abdulrazzak Razzouqi, OPEC Governor for Iraq, Dr Falah J Alamri, and the Ecuadorean Ambassador to Austria, Dr Diego Stacey Moreno.
1960–2010
SUPPORTING STABILIT
Y
FUELLING P R OSP
ER
I TY

21
OPE
C bu
lleti
n 10
/10
The shows, two of which were held each day, com-
prised musical bands, dancers and singers in traditional
costume, as well as colourful fashion shows and many
other artists, which all served to open a fascinating win-
dow into the cultural splendour and history of OPEC
Member Countries.
And not even high winds and torrential rain, which
battered the Kursalon on the sixth day of the event, could
put a stop to proceedings, even though a special bodega
tent, erected to host the performances, had to be hastily
repaired.
In officially opening the Exhibition, El-Badri pointed
out that the event effectively showcased another side of
OPEC’s Member Countries — their cultural, ethnic and
historical richness.
“The photographs, national costumes, music and
food on display will help visitors learn more about each
country and I hope visitors will find the displays here both
educational and enjoyable,” he told assembled guests.
El-Badri’s comments were echoed by special guest
Dr Michael Spindelegger, Austria’s Minister of Foreign
Ahmed Mohamed Elghaber (c), Libyan Governor for OPEC and Chairman of the OPEC Board of Governors; with Dr Oskar Wawra (r), Director, and Regina Wiala-Zimm (l), both of the Chief Executive Office of the City of Vienna.
21
OPE
C bu
lleti
n 10
/10
22
OPE
C bu
lleti
n 10
/10
An
niv
ers
ary
Ex
hib
itio
n Affairs, who said he was full of admiration for the cultural
richness and diversity of the Anniversary Exhibition.
“It clearly shows the different cultural roots and styles
of the distinguished OPEC family. The festival of African,
Latin American and Middle Eastern art, dance, fashion,
food and music which you are launching today will be a
remarkable contribution to Vienna’s cultural offerings
and attract a wide public,” he affirmed.
Others who spoke at the opening ceremony were
SP Libyan AJ OPEC Governor and Chairman of the OPEC
Governing Board, Ahmed M Elghaber, and Dr Elisabeth
Vitouch, President, European Affairs Commission of
Vienna City Council, who represented the City of Vienna.
El-Badri went on to thank all the people who were
responsible for putting the Exhibition together, includ-
ing Member Country Ambassadors, the staff of the OPEC
Secretariat, officials in Member Countries, as well as OFID.
“Their hard work has made this Exhibition possible. I
also thank you all, my dear guests, for being with us today
on this very special occasion. I hope you all enjoy it.”
El-Badri said he could not close the opening ceremony
without recalling that 45 of OPEC’s 50 years had been in
the beautiful city of Vienna.
“I would like to take this opportunity to repeat our
thanks and gratitude to the Government and people of
the Republic of Austria and the City of Vienna for their
warm and generous hospitality over the last four-and-a-
half decades.”
High praise for all concerned
After the dust of a hectic and thoroughly enjoyable ten
days, Qabazard also had high praise for all those asso-
ciated with the Exhibition.
He said he wanted to thank the OPEC Heads of
Delegation, as well as the OPEC Governors, for their
encouragement and support.
“We are also all grateful to the Secretary General of
OPEC, Abdalla Salem El-Badri, for his support and recog-
nize the cooperation extended to us by the Ambassadorial
delegations to Vienna of each of our Member Countries.”
Qabazard pointed out that the generous financial
support for much of the Exhibition was provided by the
National Oil Companies of some OPEC Member Countries.
“We have recognized their sponsorship in the pro-
gramme but, on behalf of OPEC, I would like to also extend
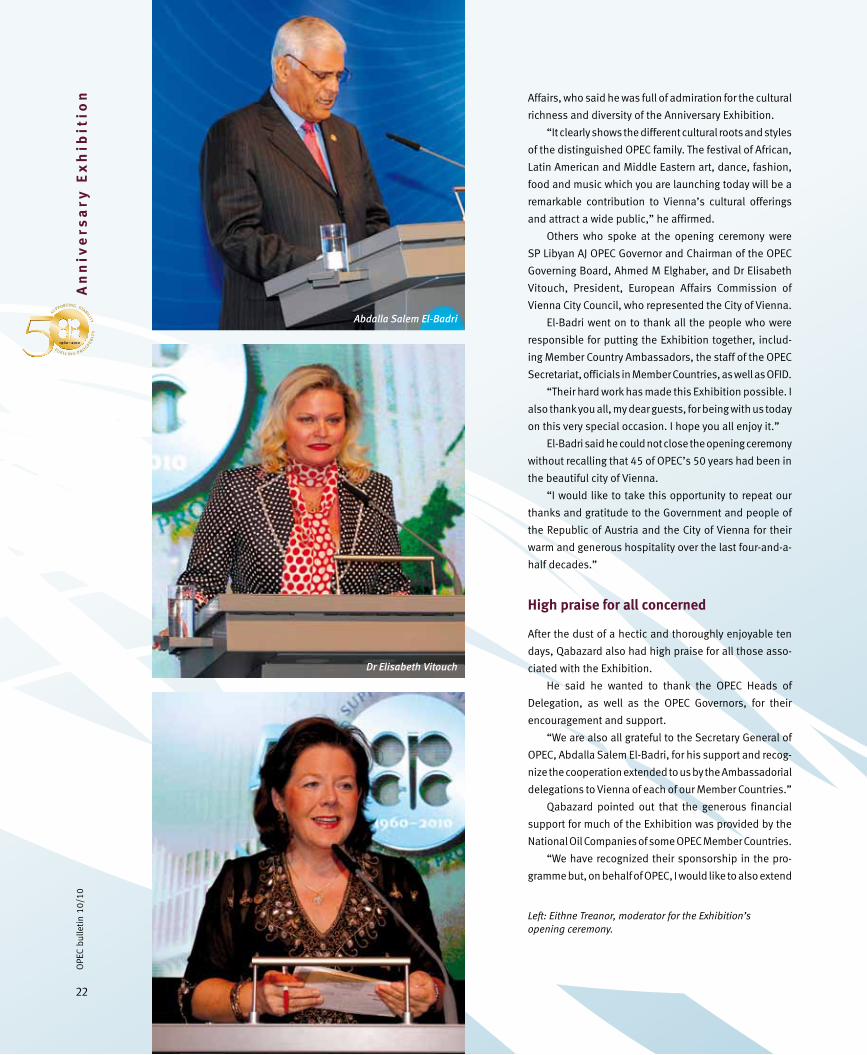
Abdalla Salem El-Badri
Dr Elisabeth Vitouch
Left: Eithne Treanor, moderator for the Exhibition’s opening ceremony.
1960–2010
SUPPORTING STABILIT
Y
FUELLING P R OSP
ER
I TY

23
OPE
C bu
lleti
n 10
/10
to them verbal thanks for everything they have done to
make this possible,” he said.
Qabazard said the idea for the Exhibition, as well as
its organization, staffing and the production of the nec-
essary materials, was the result of the untiring efforts of
OPEC Secretariat staff, in particular the Public Relations
and Information Department (PRID).
“Their hard work and dedication have been invalu-
able. Thank you,” he added.
In addition, he said, the cooperation of OFID had been
invaluable.
He said the Exhibition had benefitted from the over-
all design input of the consultants,
Veech Media Architecture, as well as
the helpful assistance of numerous
audio-visual consultants and the
friendly support of the staff of the
Kursalon.
“Finally, I have to thank the
City of Vienna, both officials at the
Rathaus, as well as the residents
of this beautiful city. Not only have
they shown sincere interest in the
cultural richness of our Member
Countries, but they have also wel-
comed OPEC as part of their city for
the past 45 years. We thank you for
this long relationship.”
During their opening remarks, the
speakers also alluded to the birth of
OPEC and the eventful half century of
its existence.
El-Badri said that when represen-
tatives of the eventual five Founding Members — Iran, Iraq,
Kuwait, Saudi Arabia and Venezuela — met in Baghdad,
Iraq, on September 10–14, they had discussed the chal-
lenges of oil prices and market control by the international
oil companies, known as the ‘Seven Sisters’.
“They concluded with the decision to work together
to achieve greater unity among oil-exporting countries —
and, thus, OPEC was born.”
El-Badri pointed out that many people had been
involved with OPEC’s development and growth. But it was
appropriate to remember the five officials who led the
respective delegations at the Baghdad meeting — Fuad
Above: Angela Agoawike, Head of OPEC’s PR & Information Department, who welcomed everyone to the Exhibition.
Below: OPEC Secretary General, Abdalla Salem El-Badri, with some of the Exhibition’s high-level guests.
Dr Michael Spindelegger Ahmed M Elghaber

24
OPE
C bu
lleti
n 10
/10
An
niv
ers
ary
Ex
hib
itio
n
“It has been an exciting ten days ... this has been an important event for the Organization, it has helped us to commemorate the founding of our Organization 50 years ago.”
Dr Hasan M Qabazard
Rouhani of Iran, Tala‘at al-Shaibani of Iraq, Ahmed Sayed
Omar of Kuwait, Abdullah Tariki of Saudi Arabia and Juan
Pablo Pérez Alfonzo of Venezuela.
“Thanks to their vision, competence and hard work,
an organization was born that could finally stand up to
defend their rights,” he affirmed.
El-Badri said the commitment and contribution of
these and other individuals to the development and sov-
ereignty of oil-producing countries was an important part
of the history of the modern world. But their continuing
legacy was the existence of OPEC.
This legacy, he said, had since grown. The original
Founding Members had since been joined by seven other
countries — Qatar, the SP Libyan AJ, the United Arab
Emirates (UAE), Algeria, Nigeria, Ecuador and Angola.
“Together they have worked to ensure market sta-
bility and fair prices over the years. And in so doing, the
Organization has challenged expectations.
“It has demonstrated that oil-producing countries can
establish sovereignty over their natural resources and
work toward social and economic development for the
benefit of their people and the world at large,” he stated.
OPEC achieves its targets
OPEC Governing Board Chairman, Elghaber, in expressing
gratitude to everybody who had helped the Organization
celebrate its 50th Anniversary, pointed out that OPEC was
born during difficult times, and was required to handle
some very big tasks.
“Over the years, OPEC has managed to achieve its
targets, despite all the problems and difficulties it has
had to encounter. Throughout it all, OPEC has provided
an element of stability to oil prices and to steady supplies
of crude oil, which has been a critical commodity for the
global community,” he said.
“We hope to continue in the same vein in the future.
All the difficult tasks and challenges facing OPEC were met
by the Organization, its Governing Board, its Economic
An OPEC 50th Anniversary stamp unveiled by Georg Pölzl, Director General of the Österreichische Post AG.
Below: Angela Agoawike (l) presented gifts to the Exhibition’s sponsors. Here she is pictured with the Kuwaiti representative.
1960–2010
SUPPORTING STABILIT
Y
FUELLING P R OSP
ER
I TY

25
Commission Board and the Secretariat with its experts,
who have prepared countless studies and reports. We
have always came up with very workable plans,” he stated.
Elghaber said that as Chairman of the Board of
Governors, he would like to congratulate OPEC for “achiev-
ing these 50 years”.
He added: “Advancing in age is not always a good
thing, but when you grow up in such an Organization as
OPEC one becomes more valuable, more resolute. We
hope this will continue for another 50 years.”
In his comments on OPEC, Austrian Minister
Spindelegger praised the Organization for the important
contribution it had made over the years to “energizing the
world, in the literal sense.”
He stated: “We Austrians are very proud that Vienna
has been chosen as your headquarters city as early as
1965. Thus, Austria and Vienna have been privileged
companions of your most memorable itinerary and
offered the venue for important international meetings
on a regular basis.”
OPEC among the main global actors
The Minister said that since its foundation, both OPEC
and the world of energy had undergone important
developments.
The original mission of OPEC’s five Founding Members
back in 1960, which consisted mainly of creating syner-
gies to protect the interests of the petroleum-producing
countries, had since matured.
“Today, your Organization comprises 12 Members
from such diverse parts of the world as the Gulf and the
Middle East, Africa and Latin America, and accounts
for more than three-quarters of the world’s recoverable
crude oil reserves and 60 per cent of the worldwide trade
in oil.
“You are today truly among the main global actors
that effectively work to ensure stable, transparent and
predictable oil markets. This is especially important
at a time of financial turmoil and economic concerns,”
he said.
Spindelegger said OPEC’s relation to Europe was
today one of genuine dialogue and cooperation.
“The European Union, following in its energy policy
the three goals of sustainability, competitiveness and
secure energy, has in you a trusted partner to address
topical challenges, such as improving transparency of
the energy markets, minimizing the risk of excessive oil
price volatility, ensuring supply and demand security,
OPEC Member Country Ambassadors pictured at the opening ceremony of the Exhibition.
Also attending the opening ceremony were (above) Members of the OPEC Board of Governors, and (below) Members of OPEC’s Management.

26
An
niv
ers
ary
Ex
hib
itio
n
Banging the drum for OPEC ... Vienna’s Drumatical Theatre and Domino Blue proved to be one of the highlights of the Exhibition’s opening ceremony.
Look out for a special supplement on OPEC’s 50th Anniversary Exhibition
in the November 2010 issue of the OPEC Bulletin.

27
OPE
C bu
lleti
n 10
/10
whilst working towards enhanced energy efficiency and
addressing environmental challenges, such as improving
the safety of offshore oil drilling,” he said.
“As I am saying that your Organization and its Member
Countries have not limited themselves to pumping out
and selling oil, I would like to underline your firm com-
mitment to spreading the benefits of energy resources in
support of diversifying economic development and pro-
moting social progress, both in helping the populations
in your Member Countries, as well as those in the world’s
poorest communities.
“This mission has been carried forward in particular
through the activities of OFID, which, since its creation in
1975, has extended financial assistance to 127 countries
and cooperated over the years with hundreds of multilat-
eral, national, non-governmental and other organizations
worldwide.”
The Minister said the unveiling of a special OPEC
Anniversary stamp produced by the Austrian Post AG (see
page 30) was a dignified symbol of the fruitful partner-
ship between OPEC and Austria.
“I would like to wish you all success, pleasure and
happiness in your celebrations of the 50-year Anniversary
and even more success and prosperity to come in the next
50 years,” he added.
Beautiful surroundings
Speaking on behalf of the Mayor of Vienna, Dr Michael
Haeupl, Dr Vitouch said she was very proud that OPEC
had held its Exhibition at the Kursalon, which was next
to Vienna’s famous Stadtpark.
She recommended that when families visited the
Exhibition with their children, they also took advantage
of the park and its beautiful surroundings.
Dr Vitouch pointed out that Vienna had changed a
great deal since OPEC first came to the city 45 years ago.
In the last few years, especially, the Austrian capital had
seen many changes.
Vienna, she said, was very proud of the fact that it
had just been voted as the city with the best standard of
living in the world for the second year running.
“I invite you to enjoy my city and to enjoy especially
the surroundings here, the park, the Kursalon, and this
Exhibition of 50 years of OPEC — the best from all OPEC
Member Countries,” she concluded.
Below: OPEC Secretary General, Abdalla Salem El-Badri (c), pictured with members of the ‘Who Am I’ club of the Vienna International School.
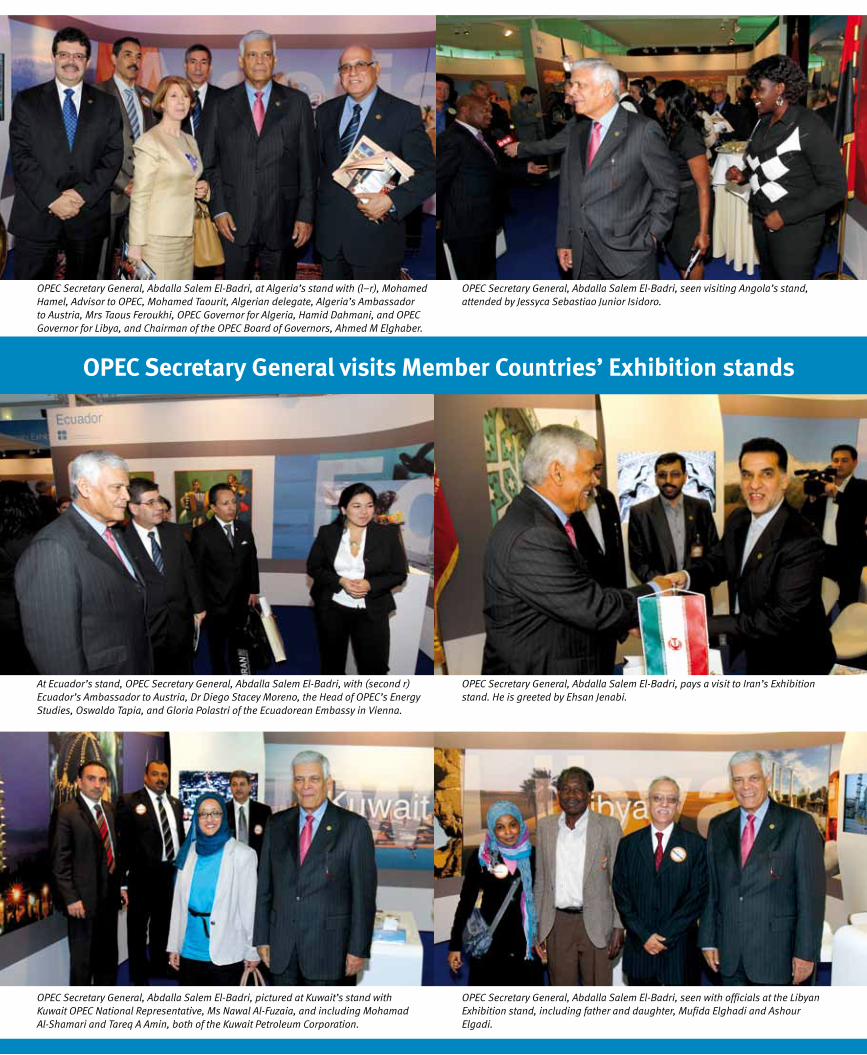
28
OPE
C bu
lleti
n 10
/10
An
niv
ers
ary
Ex
hib
itio
n
OPEC Secretary General visits Member Countries’ Exhibition stands
OPEC Secretary General, Abdalla Salem El-Badri, at Algeria’s stand with (l–r), Mohamed Hamel, Advisor to OPEC, Mohamed Taourit, Algerian delegate, Algeria’s Ambassador to Austria, Mrs Taous Feroukhi, OPEC Governor for Algeria, Hamid Dahmani, and OPEC Governor for Libya, and Chairman of the OPEC Board of Governors, Ahmed M Elghaber.
OPEC Secretary General, Abdalla Salem El-Badri, seen visiting Angola’s stand, attended by Jessyca Sebastiao Junior Isidoro.
OPEC Secretary General, Abdalla Salem El-Badri, seen with officials at the Libyan Exhibition stand, including father and daughter, Mufida Elghadi and Ashour Elgadi.
OPEC Secretary General, Abdalla Salem El-Badri, pictured at Kuwait’s stand with Kuwait OPEC National Representative, Ms Nawal Al-Fuzaia, and including Mohamad Al-Shamari and Tareq A Amin, both of the Kuwait Petroleum Corporation.
At Ecuador’s stand, OPEC Secretary General, Abdalla Salem El-Badri, with (second r) Ecuador’s Ambassador to Austria, Dr Diego Stacey Moreno, the Head of OPEC’s Energy Studies, Oswaldo Tapia, and Gloria Polastri of the Ecuadorean Embassy in Vienna.
OPEC Secretary General, Abdalla Salem El-Badri, pays a visit to Iran’s Exhibition stand. He is greeted by Ehsan Jenabi.

29
OPE
C bu
lleti
n 10
/10
Joined by Ahmed M Elghaber, Libya’s Governor for OPEC, OPEC Secretary General, Abdalla Salem El-Badri, visits Nigeria’s stand. Also pictured are Angela Agoawike, Head of OPEC’s Public Relations and Information Department, and Uzo Ejidoh.
Seen here at Iraq’s stand, OPEC Secretary General, Abdalla Salem El-Badri, smiles for photographers. Also present is Mahid Al-Saigh of the OPEC Public Relations and Information Department.
In visiting the Exhibition stand of the United Arab Emirates (UAE), OPEC Secretary General, Abdalla Salem El-Badri, is pictured with the UAE’s Governor for OPEC, Ali Obaid Al Yabhouni.
Venezuela’s stand is explained by Gabriela Gonzalez. OPEC Secretary General, Abdalla Salem El-Badri, is joined by Saudi Arabia’s OPEC Governor (left), Dr Majid A Al-Moneef, and Libya’s Governor for OPEC, Ahmed M Elghaber (right).
OPEC Secretary General, Abdalla Salem El-Badri, seen at Qatar’s Exhibition stand with, on his right, Qatar’s Governor for OPEC, Issa S Al-Ghanim and, on his left, Qatar’s Ambassador to Austria, Ali Khalfan Al-Mansouri.
Seen at the Saudi Arabian stand are OPEC Secretary General, Abdalla Salem El-Badri (r), with HH Prince Mansour Bin Khalid AlFarhan Al-Saud, Saudi Arabia’s Ambassador to Austria.

30
OPE
C bu
lleti
n 10
/10
An
niv
ers
ary
Ex
hib
itio
n
Austria’s PostunveilsOPEC Anniversarystamp
The Austrian postal service has launched a special stamp commemorating OPEC’s 50th Anniversary.
The stamp was unveiled by Georg Pölzl (above right), Director-General of the Österreichische
Post AG, at the opening ceremony of the 50th Anniversary Exhibition in Vienna, in September.
In presenting the stamp to OPEC Secretary General, Abdalla Salem El-Badri (above left), at
the Kursalon, Pölzl said it was a great honour for him to hand over the commemorative stamp
which the Austrian Post had produced on the occasion of the 50th Anniversary of OPEC.
“For me, it is a very special moment, since, from my youth, I have had an affinity with
OPEC. I actually hold a PhD degree in Petroleum Engineering, which I attained at the Mining
University in Leoben, Styria, Austria,” he said.
The stamp, which was designed by OPEC’s Public Relations and Information Department
(PRID), shows a rosette carrying the national flags of OPEC’s 12 Member Countries. It
has the special Anniversary logo situated in the middle of the display which carries the
slogan ‘Supporting Stability, Fuelling Prosperity’.
The value of the stamp is ¤1.40, which, as Pölzl, pointed out, was enough to
allow people in Vienna to send a letter to anywhere in the world, including all OPEC
Member Countries.
“I hope many of you will do just that,” he added.
1960–2010
SUPPORTING STABILIT
Y
FUELLING P R OSP
ER
I TY
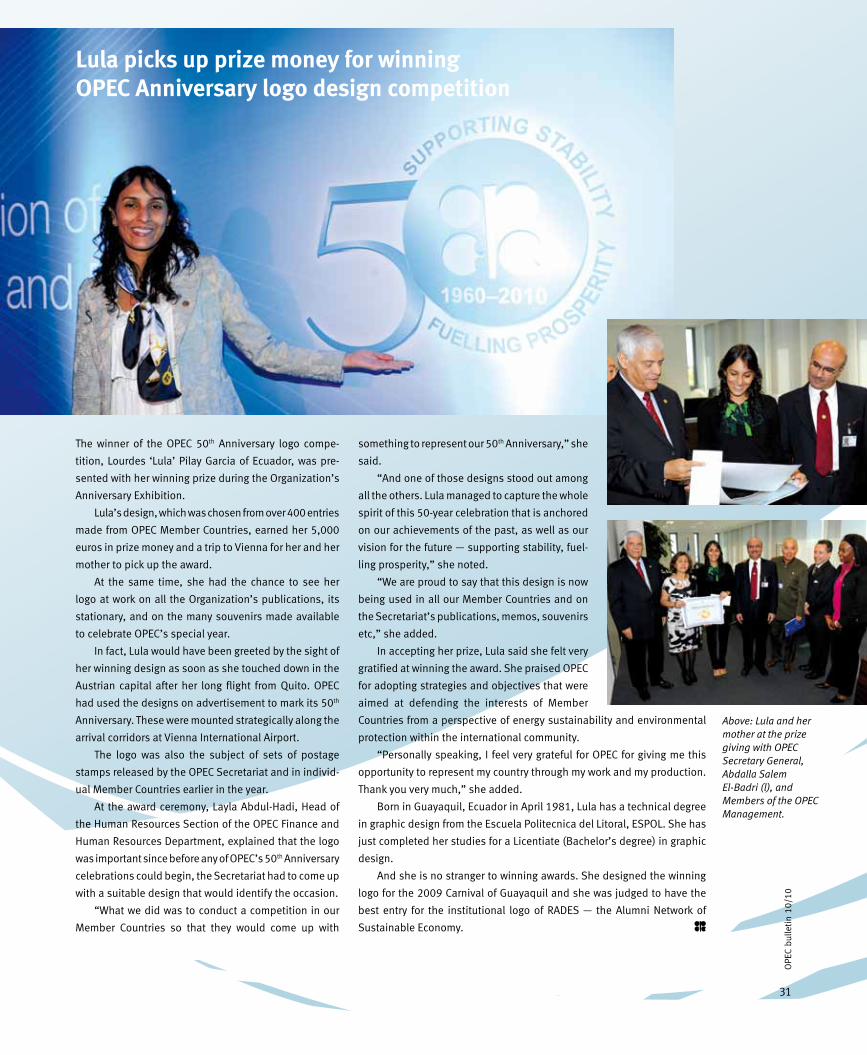
31
OPE
C bu
lleti
n 10
/10
The winner of the OPEC 50th Anniversary logo compe-
tition, Lourdes ‘Lula’ Pilay Garcia of Ecuador, was pre-
sented with her winning prize during the Organization’s
Anniversary Exhibition.
Lula’s design, which was chosen from over 400 entries
made from OPEC Member Countries, earned her 5,000
euros in prize money and a trip to Vienna for her and her
mother to pick up the award.
At the same time, she had the chance to see her
logo at work on all the Organization’s publications, its
stationary, and on the many souvenirs made available
to celebrate OPEC’s special year.
In fact, Lula would have been greeted by the sight of
her winning design as soon as she touched down in the
Austrian capital after her long flight from Quito. OPEC
had used the designs on advertisement to mark its 50th
Anniversary. These were mounted strategically along the
arrival corridors at Vienna International Airport.
The logo was also the subject of sets of postage
stamps released by the OPEC Secretariat and in individ-
ual Member Countries earlier in the year.
At the award ceremony, Layla Abdul-Hadi, Head of
the Human Resources Section of the OPEC Finance and
Human Resources Department, explained that the logo
was important since before any of OPEC’s 50th Anniversary
celebrations could begin, the Secretariat had to come up
with a suitable design that would identify the occasion.
“What we did was to conduct a competition in our
Member Countries so that they would come up with
something to represent our 50th Anniversary,” she
said.
“And one of those designs stood out among
all the others. Lula managed to capture the whole
spirit of this 50-year celebration that is anchored
on our achievements of the past, as well as our
vision for the future — supporting stability, fuel-
ling prosperity,” she noted.
“We are proud to say that this design is now
being used in all our Member Countries and on
the Secretariat’s publications, memos, souvenirs
etc,” she added.
In accepting her prize, Lula said she felt very
gratified at winning the award. She praised OPEC
for adopting strategies and objectives that were
aimed at defending the interests of Member
Countries from a perspective of energy sustainability and environmental
protection within the international community.
“Personally speaking, I feel very grateful for OPEC for giving me this
opportunity to represent my country through my work and my production.
Thank you very much,” she added.
Born in Guayaquil, Ecuador in April 1981, Lula has a technical degree
in graphic design from the Escuela Politecnica del Litoral, ESPOL. She has
just completed her studies for a Licentiate (Bachelor’s degree) in graphic
design.
And she is no stranger to winning awards. She designed the winning
logo for the 2009 Carnival of Guayaquil and she was judged to have the
best entry for the institutional logo of RADES — the Alumni Network of
Sustainable Economy.
Lula picks up prize money for winningOPEC Anniversary logo design competition
Above: Lula and her mother at the prize giving with OPEC Secretary General, Abdalla Salem El-Badri (l), and Members of the OPEC Management.

32
OPE
C bu
lleti
n 10
/10
50
th A
nn
ive
rsa
ry C
on
ce
rt Qatar Orchestrato mark50 years of OPECwith Vienna concert
he Qatar Philharmonic Orchestra will give a spe-
cial performance in Vienna, Austria, on October
14, to mark OPEC’s 50th Anniversary.
Under the capable baton of the orchestra’s music direc-
tor, Nader Abbassi, the performance, which will be held
at Vienna’s world-famous Konzerthaus, will be accom-
panied by a Gala Dinner hosted by the State of Qatar.
On the same day, OPEC is convening the 157th
Ministerial Conference at its Headquarters in the Austrian
capital.
TNader Abbassi, music director, with the Qatar orchestra.
by Siham Alawami
QF

33
OPE
C bu
lleti
n 10
/10
Around 1,400 people are expected to attend the
special one-off performance of the orchestra, including
OPEC’s Oil and Energy Ministers, other representatives
from Member Countries, heads of diplomatic mission,
energy company chief executives and other prominent
figures in the oil industry.
The young and dynamic orchestra, which is based in
the Qatari capital, Doha, comprises 101 musicians of 30
different nationalities.
It was established in 2008 with the objective of
bringing a message of peace to the world via the union
of Eastern and Western music.
The members of the orchestra, which is due to per-
form eight pieces during its Vienna appearance, were
chosen after auditions were held in Berlin, Dortmund,
Munich, Vienna, Zurich, Madrid, London, Moscow and
Cairo in 2007.
The orchestra’s opening performance in 2008, which
was conducted by Lorin Maazel, featured the works of
Beethoven, Ravel and Marcel Khalife.
The orchestra composed two pieces for the opening
— an Arabian Concerto for five Arab solo instruments and
a large orchestra and a Salute for Tabla and orchestra.
Playing for UNESCO
These two works also formed part of the programme
presented at subsequent appearances with Lorin
Maazel in Washington, Paris, London, Palermo, Milan
and Lucca.
In May this year, under the baton of Amine Kouider,
the orchestra was invited to play for the United Nations
Educational, Scientific and Cultural Organization
(UNESCO), in Paris.
It then gave a performance in Damascus, Syria, under
its music director, Nader Abbassi.
During the 2009–10 season, the orchestra has given
29 performances in Doha, with such esteemed soloists
as Placido Domingo and Rudolf Buchbinder and conduc-
tors like Gerd Abrecht, Dmitro Kitajenko, James Gaffigan,
Marc Minkowsky, Emanuel Krevine, Emanuel Kouider and
Ahmed el Saedi.
One important component of the Qatar Philharmonic
Orchestra is its children’s programmes. Children in Qatar
have been encouraged to help in such areas as sketching
designs for clothing and stage scenery.
They have also taken part in special performances,
for example, of Hansel and Gretel from Humperdinck,
in which children in the choir originated from some 15
different nations. A further production featured the chil-
dren in the Magic Flute of Mozart.
Qatar was actually the first country to apply for OPEC
Membership after the five Founding Members set up the
Organization in September 1960. Qatar joined the OPEC
ranks in January 1961.
In February this year, the country released a com-
memorative stamp to mark OPEC’s 50th Anniversary cel-
ebrations. Then, in May, it hosted a forum to mark the
Organization’s landmark year event at the Texas A&M
University.
The Qatar orchestra performing with Placido Domingo in Doha.
The orchestra’s children with their production of Hansel and Gretel.
QF
QF
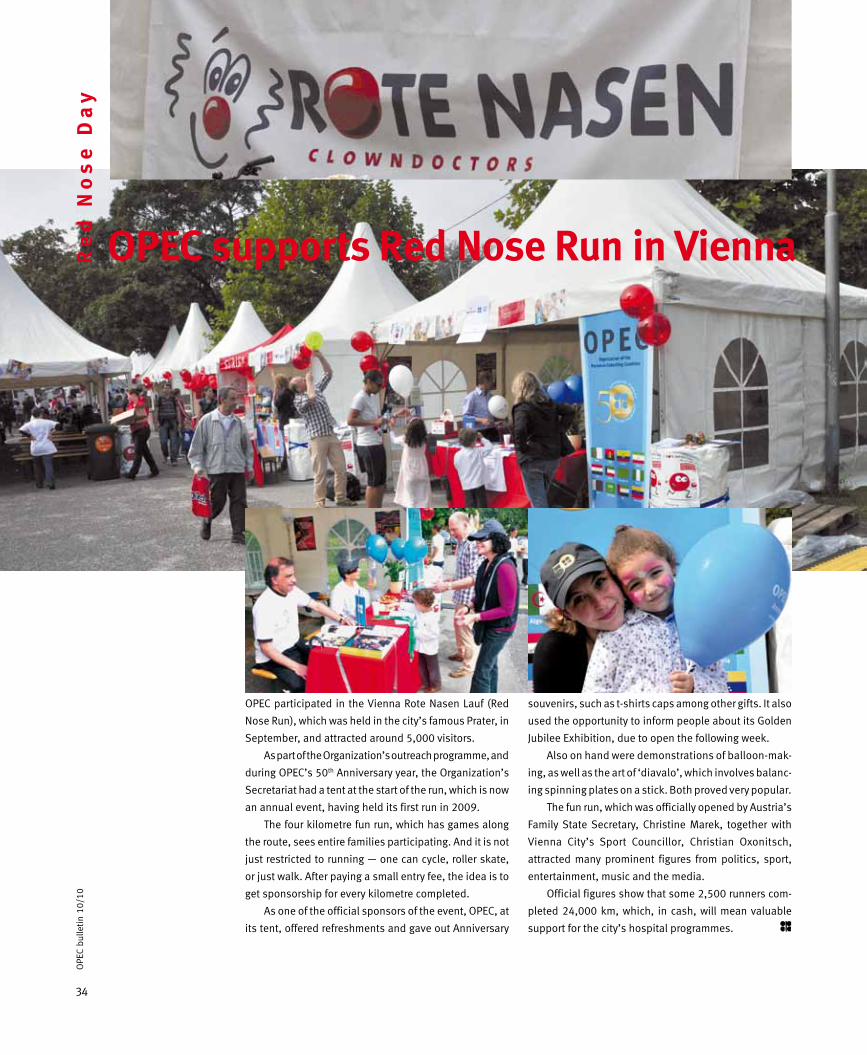
34
OPE
C bu
lleti
n 10
/10
Re
d N
os
e D
ay
OPEC participated in the Vienna Rote Nasen Lauf (Red
Nose Run), which was held in the city’s famous Prater, in
September, and attracted around 5,000 visitors.
As part of the Organization’s outreach programme, and
during OPEC’s 50th Anniversary year, the Organization’s
Secretariat had a tent at the start of the run, which is now
an annual event, having held its first run in 2009.
The four kilometre fun run, which has games along
the route, sees entire families participating. And it is not
just restricted to running — one can cycle, roller skate,
or just walk. After paying a small entry fee, the idea is to
get sponsorship for every kilometre completed.
As one of the official sponsors of the event, OPEC, at
its tent, offered refreshments and gave out Anniversary
OPEC supports Red Nose Run in Vienna
souvenirs, such as t-shirts caps among other gifts. It also
used the opportunity to inform people about its Golden
Jubilee Exhibition, due to open the following week.
Also on hand were demonstrations of balloon-mak-
ing, as well as the art of ‘diavalo’, which involves balanc-
ing spinning plates on a stick. Both proved very popular.
The fun run, which was officially opened by Austria’s
Family State Secretary, Christine Marek, together with
Vienna City’s Sport Councillor, Christian Oxonitsch,
attracted many prominent figures from politics, sport,
entertainment, music and the media.
Official figures show that some 2,500 runners com-
pleted 24,000 km, which, in cash, will mean valuable
support for the city’s hospital programmes.

35
OPE
C bu
lleti
n 10
/10
35
OPE
C bu
lleti
n 10
/1050 Years
Supporting Stability
Fuelling Prosperity
Organization of thePetroleum Exporting Countries
www.opec.org

36
Inte
rvie
w
Italian-headquartered integrated energy company Eni is active in 77 countries and has more than
78,000 employees. It focuses on oil and gas exploration, production, transportation, transformation and
marketing. The OPEC Bulletin’s Steve Hughes caught up with Claudio Descalzi (pictured below), Chief
Operating Officer of Eni Exploration & Production, for his views on the state of the energy industry today.
Oil prices have recently been trading in a more stable range. How important is this relative stability for the oil industry?
In recent years, we have suffered from boom/bust cycles. This has meant enormous dif-
ficulties when managing our business.
While low prices reduce investments, due to insufficient returns, rapid peaks also
impact negatively on growth. During recent years, with prices almost beating new
records on a monthly basis, the capability to grow the upstream industry was slowed
down by unprecedented cost inflation, in particular regarding drilling and construc-
tion. This reduced value and created bottlenecks along the chain. Our industry is more
concerned by the unpredictability and stability of oil prices than their peaks or lows.
Stability of prices is one of the most important factors in planning and executing new
projects. A stable scenario helps in negotiating new contracts (aligning the expectations
among parties), in sanctioning projects with more accuracy and in planning companies’
financial needs and income.
The global economic outlook still appears uncertain. What are your hopes and fears for the months and years ahead in this respect?
In the last couple of decades, we have witnessed the impressive growth of primary energy
demand, mainly driven by the emerging Asian economies. It is true that, in 2009, this
demand has dropped, due to the financial crisis, but consumption is expected to rebound
in the future, in line with the economic recovery. Of course, this recovery is at an early
OPEC a “fundamental player”
in global oil market
Energy mix not expected to change in
short term —
37
OPE
C bu
lleti
n 10
/10
stage and its size, its shape and its sustainability are still
uncertain, but we are quite sure that, in the foreseeable
future, it will be sustained by fossil fuels.
The resuming growth in oil and gas demand will bring
along new challenges to an industry that has already to
add about eight million barrels/day of oil equivalent of
new production every year, just to face the depletion of
existing fields and maintain the present level of output.
In fact, the industry was hardly able to keep up with
the pace of growing demand in the last decade and the
fear of supply side constraints emerged before the crisis;
those fears could surface again in the future.
In the short to medium term, the issue is not that
of discovering new resources, but in the timely and effi-
cient transformation of resources into reserves and pro-
duction. During the last years, major oil companies were
able to discover billions of barrels of new resources, but
only a few major projects were sanctioned. The sector will
have to radically improve its effectiveness and efficiency.
Competencies and technologies must be at the centre of
our strategies if we want to overcome future challenges.
The recent BP oil disaster in the Gulf of Mexico will obviously have repercussions for the oil industry in general. What are some of the changes we are likely to see as a result?
I believe that the Macondo incident will have two main
consequences: one will be imposed by external regu-
lators; the other will come from within the companies.
Externally we will face more stringent regulations and
control, drilling and operational procedures will become
more demanding and minimum standards will be raised.
Access to deep and ultra-deep offshore resources could
become limited to a few operators with sufficient finan-
cial and technical capabilities.
Internally, the accident will encourage an inversion of
the outsourcing trend the industry has been experiencing
in the last few decades. Major companies have passed
through years of severe outsourcing and downsizing. All
the efforts were focused in re-designing the boundaries
of ‘core competencies’, favouring the expansion of the
activity performed by contractors. This policy was posing
a threat to performance and, in the end, to the long-term
sustainability of business.
An oil company is neither a mere financial investor,
nor a service provider. It is responsible for the discovery
and development of new hydrocarbon sources and for
the continuous expansion of the related technologies.
The events that occurred in the Gulf of Mexico could stimulate oil companies to
review their policy and re-start the insourcing of core competencies — in particular, with
respect to geology, reservoir management, well design and maintenance. These are the
main skills that quantify the risk and the success of the upstream and cannot be left to
contractors.
In Eni, we have always understood the importance of maintaining and developing
internal capabilities in those fields to protect our investment from risks and to ensure
full control of our operations.
What do you expect the energy mix to look like in 10 years’ time?
There is a consensus that fossil fuels will keep the lion’s share in the next 20 years.
Renewables, such as wind and solar, as well as nuclear power, will certainly see their
relative share increase, but still they will be able to cover only a smaller part of energy
demand in the near future.
In the short-term, we cannot see real technological breakthroughs capable of sig-
nificantly changing the energy mix, and therefore fossil fuels will have to sustain the
transition to cleaner and renewable sources of energy.
In the longer term, we believe that advanced solar is the most promising energy
source and this is the reason why, at Eni, we have decided to create, jointly with the
MIT, the Solar Frontiers Centre (SFC), a centre dedicated to the research and develop-
ment of solar energy.
In the meantime, the most attractive alternative source of energy is energy efficiency.
What are your views on carbon capture and storage? What potential does this technology offer?
Climate change is at the top of the global agenda and the containment of CO2 emissions
is one of the top priorities in a scenario where, as we have seen, fossil fuels will supply
most of the energy required by present and future growth.
Carbon capture and storage (CCS) can contribute to the mitigation, in the medium
to long term, of the negative impact of fossil fuels by contributing to the containment
of CO2 emissions. At the same time, it can enhance the recovery of hydrocarbons from
reservoirs.
The technology is at an early stage and the economic and technical viability of its
deployment on a large scale has still to be assessed. Eni has the technical capabilities
along the whole CCS chain and is involved in research and development, feasibility
studies and pilot projects that will help identify the full potential of this technological
option.
This year is OPEC’s 50th Anniversary. What do you consider to be the Organization’s major achievements since its foundation?
I believe that the main role of OPEC is to smooth and stabilize the oil market, trying to
manage the cycles related to the demand trends. It is therefore a fundamental player,
helping investors by reducing price volatility.
Moreover, OPEC has been able to highlight the needs and expectations of produc-
ing countries and to introduce the concept of security of demand in the global market,
helping the producer-consumer dialogue.

38
OPE
C bu
lleti
n 10
/10
Ne
ws
lin
e
The fund will be administered by the United Nations
Development Programme (UNDP), which is encouraging
such conservation initiatives, especially with regard to
oil drilling.
Ecuador is making some headway with its plan to conserve for all time an
area of natural beauty and diversity in exchange for half the cost of develop-
ing the oil reserves that are contained within it.
Chile is believed to be the first country willing to contribute $100,000 to
a special fund that will keep the Yasuni National Park free of oil excavation in
the future. Germany and Spain are also said to be interested in signing up.
The Ecuadorean government is appealing for international donors, includ-
ing countries, institutions, and individuals, to contribute a total of $3.6 billion
to the special fund, in return for which the country would guarantee never to
exploit the 850 million or so barrels of oil said to be present in the ground
there.
The contributions would be used for conservation and reforestation efforts
and to fund poverty reduction programmes in the Amazon region. According
to the government, the funds would also help improve fuel efficiency and
support the development of alternative energy sources.
The $3.6bn target, according to the country’s President, Rafael Correa,
was half of what Ecuador would receive in revenue if it went ahead with the
exploitation of the crude resources in question, which are contained in a
200,000 hectare section of the 982,000 hectare park.
The project, first announced in 2007, is seen as a novel way of helping to
promote conservation and preserving the environment. Government officials
have estimated that by not exploiting the area’s oil resources, some 400 mil-
lion tonnes of carbon dioxide would be kept from entering the atmosphere.
The Yasuni National Park is one of the most biodiverse places on the
planet. Scientists have said that within one hectare of Yasuní land, over 640
different species of trees have been identified. In addition, there were as many
different species in the same hectare of Yasuní as there were in the whole of
North America.
The United Nations Educational, Scientific and Cultural Organization
(UNESCO) has declared Yasuni a world biosphere reserve.
The Ecuadorean government plans to issue binding certificates to those
investing in the scheme, guaranteeing that the oil reserves will never be
exploited. In the event any new government changed its stance on the devel-
opment, the monies would be returned to the investors.
Ecuadorean officials have spent September flying around the world try-
ing to garner financial support for the scheme.
The initiative applies to what is known as the ITT section of the park, com-
prising the three fields of Ishpingo, Tambococha and Tiputini. Other areas
of the giant park are already the subject of drilling operations for petroleum
resources.
Ecuador, which resumed its Membership of OPEC in 2007, after suspend-
ing it in 1992 (it initially joined the Organization in 1973), has said that if
it failed to have $100m in place by the end of next year, it would consider
scrapping the plan. The overall goal was to collect the full $3.6bn by 2024.
Ecuador:keeping the oil in the soil
Right: A Quechua Indian woman carries a child near the Tiputini River at the Yasuni National Park.
Ecuador’s President, Rafael Correa.
Reu
ters
Reu
ters
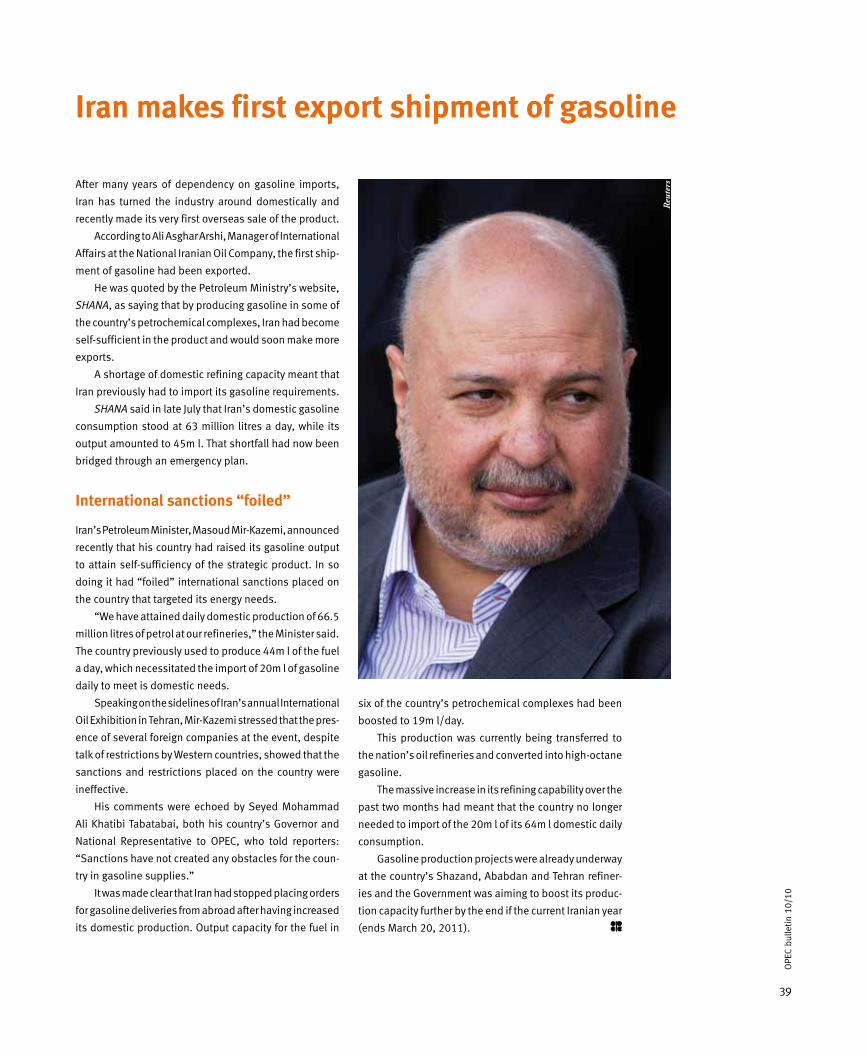
39
OPE
C bu
lleti
n 10
/10
After many years of dependency on gasoline imports,
Iran has turned the industry around domestically and
recently made its very first overseas sale of the product.
According to Ali Asghar Arshi, Manager of International
Affairs at the National Iranian Oil Company, the first ship-
ment of gasoline had been exported.
He was quoted by the Petroleum Ministry’s website,
SHANA, as saying that by producing gasoline in some of
the country’s petrochemical complexes, Iran had become
self-sufficient in the product and would soon make more
exports.
A shortage of domestic refining capacity meant that
Iran previously had to import its gasoline requirements.
SHANA said in late July that Iran’s domestic gasoline
consumption stood at 63 million litres a day, while its
output amounted to 45m l. That shortfall had now been
bridged through an emergency plan.
International sanctions “foiled”
Iran’s Petroleum Minister, Masoud Mir-Kazemi, announced
recently that his country had raised its gasoline output
to attain self-sufficiency of the strategic product. In so
doing it had “foiled” international sanctions placed on
the country that targeted its energy needs.
“We have attained daily domestic production of 66.5
million litres of petrol at our refineries,” the Minister said.
The country previously used to produce 44m l of the fuel
a day, which necessitated the import of 20m l of gasoline
daily to meet is domestic needs.
Speaking on the sidelines of Iran’s annual International
Oil Exhibition in Tehran, Mir-Kazemi stressed that the pres-
ence of several foreign companies at the event, despite
talk of restrictions by Western countries, showed that the
sanctions and restrictions placed on the country were
ineffective.
His comments were echoed by Seyed Mohammad
Ali Khatibi Tabatabai, both his country’s Governor and
National Representative to OPEC, who told reporters:
“Sanctions have not created any obstacles for the coun-
try in gasoline supplies.”
It was made clear that Iran had stopped placing orders
for gasoline deliveries from abroad after having increased
its domestic production. Output capacity for the fuel in
six of the country’s petrochemical complexes had been
boosted to 19m l/day.
This production was currently being transferred to
the nation’s oil refineries and converted into high-octane
gasoline.
The massive increase in its refining capability over the
past two months had meant that the country no longer
needed to import of the 20m l of its 64m l domestic daily
consumption.
Gasoline production projects were already underway
at the country’s Shazand, Ababdan and Tehran refiner-
ies and the Government was aiming to boost its produc-
tion capacity further by the end if the current Iranian year
(ends March 20, 2011).
Iran makes first export shipment of gasoline
Reu
ters

40
OPE
C bu
lleti
n 10
/10
Ne
ws
lin
e
Nigeria is hopeful that its oil production allocation
within OPEC will be reviewed and increased when the
Organization meets for its end-of-year Conference in
December.
The country’s Minister of Petroleum Resources,
Diezani Alison-Madueke, was quoted as saying that she
hoped to get an improvement on the existing output allo-
cation of 1.673m b/d. OPEC’s overall production ceiling,
not including Iraq which is exempt, currently stands at
24.84m b/d.
Speaking to reporters at a Houston energy confer-
ence, the Minister, who was appointed to the position
earlier this year, said Nigeria’s allocation would likely
be looked at in the context of oil production through-
out all 11 OPEC Member Countries that were subject to
quotas.
She said there was justification for the increase since
her country was now able to produce more crude oil fol-
lowing the end of militant attacks in the Niger Delta, the
Nigeria to seek higher production allocation
country’s oil-producing region. For years, production was
affected by the hostilities. Things had improved since an
amnesty was declared in the area last year.
“I am sure we will be able to work out the issue of a
quota with them,” the Minister said.
Ms Alison-Madueke also said she expected Nigeria’s
natural gas operations to expand, following the introduc-
tion of the new Petroleum Industry Bill (PIB) scheduled for
later this year. She said the Nigerian National Assembly
should pass the PIB within two months. “I am hoping it
will be even sooner than that.”
Important gas producer
The Minister pointed out that over the next few years,
Nigeria would make the transition to a gas-producing
country, as opposed to a crude-producing nation, “since
we have a lot more gas reserves than we have crude.”
According to the latest OPEC Annual Statistical Bulletin
(ASB), Nigeria possesses over 37 billion barrels of crude
oil reserves, while its gas deposits amount to 5.3 trillion
cubic metres.
Ms Allison-Madueke, who delivered the keynote
address at the Baker Institute conference, said the ulti-
mate goal was to increase domestic natural gas produc-
tion to 15bn cubic feet/day by 2017 and to eliminate gas
flaring. An estimated 1.5bn cu ft of gas per day, produced
in association with crude oil, was currently flared.
Such a development, she said, would give enough
gas for the Bonny LNG export scheme, the planned Brass
LNG project and the domestic gas master plan.
The Minister said the idea was to use that gas in the
country’s electricity-generating plants, as well as people’s
homes. This was one of the provisions of the PIB.
Development of natural gas infrastructure would also
provide jobs for the country’s young people, as well as
improving the environment.
The Minister told reporters that incentives would
have to be provided to private-sector firms to provide
the investments needed to construct a national gas net-
work. Those incentives would be offered under favour-
able conditions that would also allow smaller compa-
nies to take part.
Diezani Alison-Madueke, Nigeria’s Minister of Petroleum Resources.
Reu
ters
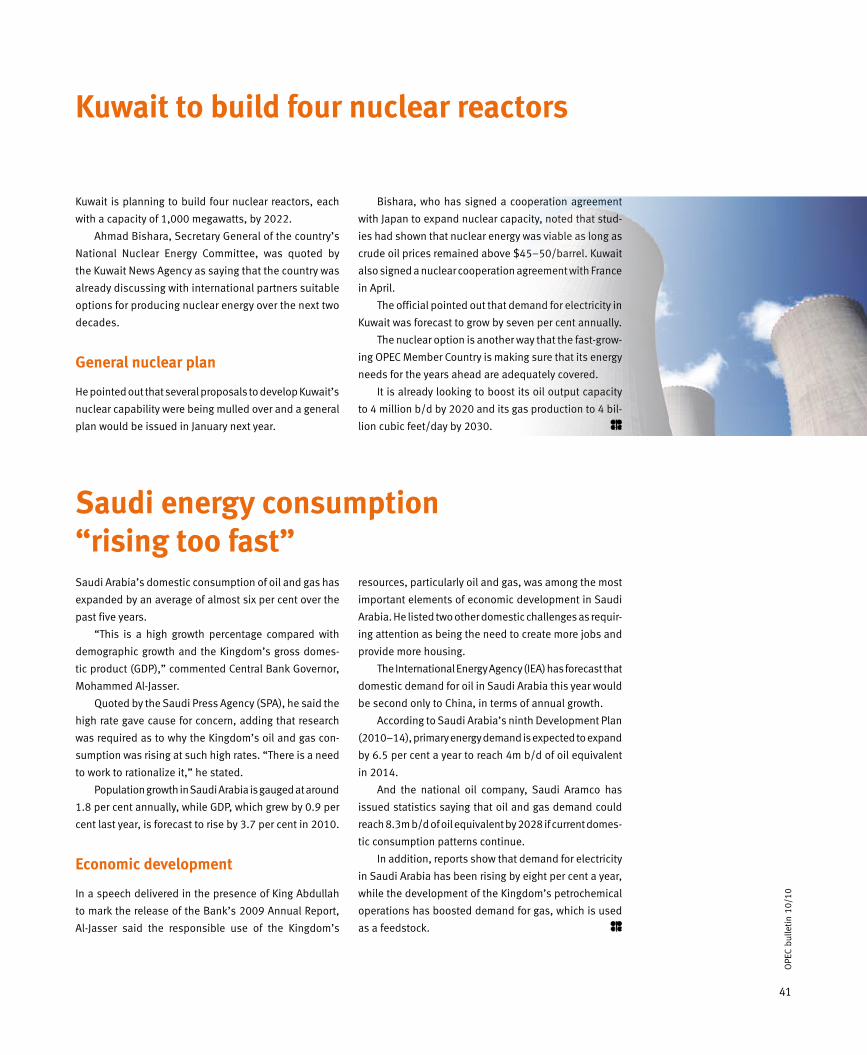
41
OPE
C bu
lleti
n 10
/10
Saudi Arabia’s domestic consumption of oil and gas has
expanded by an average of almost six per cent over the
past five years.
“This is a high growth percentage compared with
demographic growth and the Kingdom’s gross domes-
tic product (GDP),” commented Central Bank Governor,
Mohammed Al-Jasser.
Quoted by the Saudi Press Agency (SPA), he said the
high rate gave cause for concern, adding that research
was required as to why the Kingdom’s oil and gas con-
sumption was rising at such high rates. “There is a need
to work to rationalize it,” he stated.
Population growth in Saudi Arabia is gauged at around
1.8 per cent annually, while GDP, which grew by 0.9 per
cent last year, is forecast to rise by 3.7 per cent in 2010.
Economic development
In a speech delivered in the presence of King Abdullah
to mark the release of the Bank’s 2009 Annual Report,
Al-Jasser said the responsible use of the Kingdom’s
Saudi energy consumption “rising too fast”
Kuwait to build four nuclear reactors
Bishara, who has signed a cooperation agreement
with Japan to expand nuclear capacity, noted that stud-
ies had shown that nuclear energy was viable as long as
crude oil prices remained above $45–50/barrel. Kuwait
also signed a nuclear cooperation agreement with France
in April.
The official pointed out that demand for electricity in
Kuwait was forecast to grow by seven per cent annually.
The nuclear option is another way that the fast-grow-
ing OPEC Member Country is making sure that its energy
needs for the years ahead are adequately covered.
It is already looking to boost its oil output capacity
to 4 million b/d by 2020 and its gas production to 4 bil-
lion cubic feet/day by 2030.
resources, particularly oil and gas, was among the most
important elements of economic development in Saudi
Arabia. He listed two other domestic challenges as requir-
ing attention as being the need to create more jobs and
provide more housing.
The International Energy Agency (IEA) has forecast that
domestic demand for oil in Saudi Arabia this year would
be second only to China, in terms of annual growth.
According to Saudi Arabia’s ninth Development Plan
(2010–14), primary energy demand is expected to expand
by 6.5 per cent a year to reach 4m b/d of oil equivalent
in 2014.
And the national oil company, Saudi Aramco has
issued statistics saying that oil and gas demand could
reach 8.3m b/d of oil equivalent by 2028 if current domes-
tic consumption patterns continue.
In addition, reports show that demand for electricity
in Saudi Arabia has been rising by eight per cent a year,
while the development of the Kingdom’s petrochemical
operations has boosted demand for gas, which is used
as a feedstock.
Kuwait is planning to build four nuclear reactors, each
with a capacity of 1,000 megawatts, by 2022.
Ahmad Bishara, Secretary General of the country’s
National Nuclear Energy Committee, was quoted by
the Kuwait News Agency as saying that the country was
already discussing with international partners suitable
options for producing nuclear energy over the next two
decades.
General nuclear plan
He pointed out that several proposals to develop Kuwait’s
nuclear capability were being mulled over and a general
plan would be issued in January next year.

Co
nfe
ren
ce
No
tes
Se
cre
tary
Ge
ne
ral’
s D
iary
OPE
C bu
lleti
n 10
/10
42
In the course of his official duties, OPEC Secretary General, Abdalla Salem El-Badri, visits, receives and holds talks with numerous dignitaries.
These pages are dedicated to capturing those visits in pictures.
Ambassador Patricia Espinosa Cantellano, Minister of Foreign Affairs of Mexico, visited Abdalla Salem El-Badri, OPEC
Secretary General, on September 1, 2010.
Charles Hendry, UK Energy Minister, visited Abdalla Salem El-Badri, OPEC Secretary General, on September 19, 2010.
Ambassador Sabas Pretelt de la Vega, United National World Food Programme (NWFP) Executive Board President, visited Abdalla Salem El-Badri, OPEC Secretary General, on August 23, 2010.
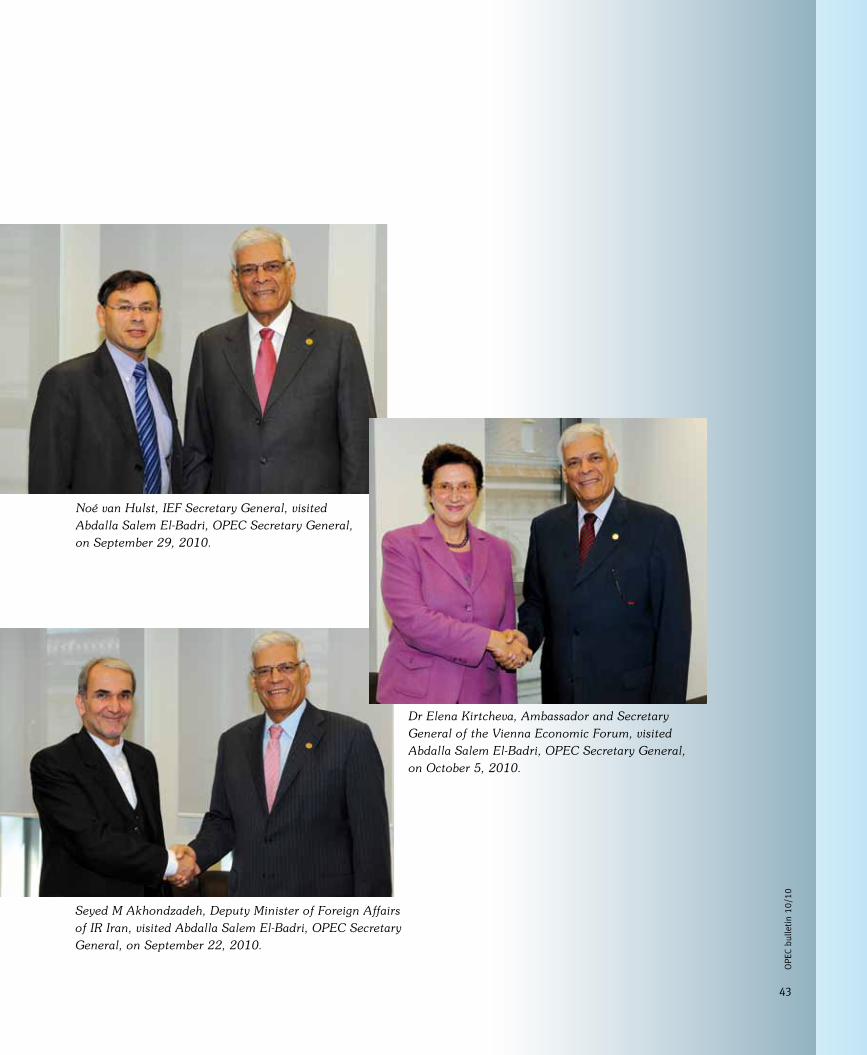
OPE
C bu
lleti
n 10
/10
43
Dr Elena Kirtcheva, Ambassador and Secretary General of the Vienna Economic Forum, visited Abdalla Salem El-Badri, OPEC Secretary General, on October 5, 2010.
Noé van Hulst, IEF Secretary General, visited Abdalla Salem El-Badri, OPEC Secretary General, on September 29, 2010.
Seyed M Akhondzadeh, Deputy Minister of Foreign Affairs of IR Iran, visited Abdalla Salem El-Badri, OPEC Secretary General, on September 22, 2010.
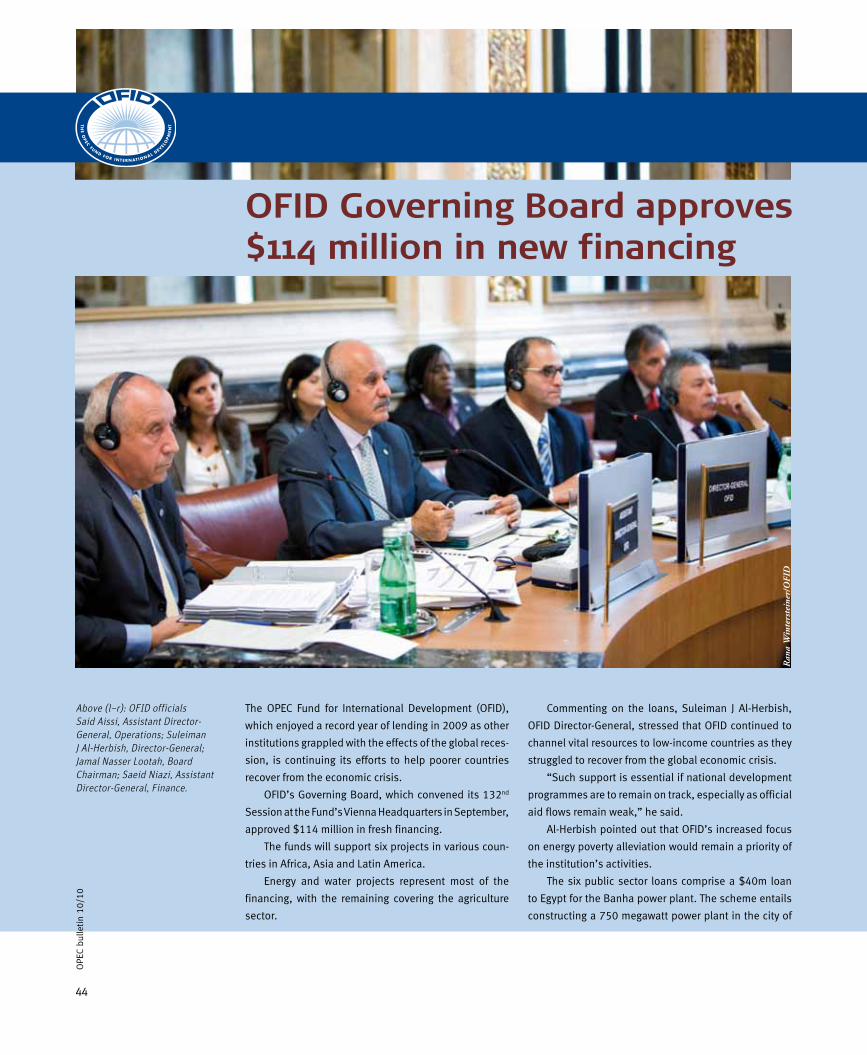
44
OPE
C bu
lleti
n 10
/10
The OPEC Fund for International Development (OFID),
which enjoyed a record year of lending in 2009 as other
institutions grappled with the effects of the global reces-
sion, is continuing its efforts to help poorer countries
recover from the economic crisis.
OFID’s Governing Board, which convened its 132nd
Session at the Fund’s Vienna Headquarters in September,
approved $114 million in fresh financing.
The funds will support six projects in various coun-
tries in Africa, Asia and Latin America.
Energy and water projects represent most of the
financing, with the remaining covering the agriculture
sector.
Above (l–r): OFID officials Said Aissi, Assistant Director-General, Operations; Suleiman J Al-Herbish, Director-General; Jamal Nasser Lootah, Board Chairman; Saeid Niazi, Assistant Director-General, Finance.
Commenting on the loans, Suleiman J Al-Herbish,
OFID Director-General, stressed that OFID continued to
channel vital resources to low-income countries as they
struggled to recover from the global economic crisis.
“Such support is essential if national development
programmes are to remain on track, especially as official
aid flows remain weak,” he said.
Al-Herbish pointed out that OFID’s increased focus
on energy poverty alleviation would remain a priority of
the institution’s activities.
The six public sector loans comprise a $40m loan
to Egypt for the Banha power plant. The scheme entails
constructing a 750 megawatt power plant in the city of
Ran
a W
inte
rste
iner
/OFI
D
OFID Governing Board approves$114 million in new financing

45
OPE
C bu
lleti
n 10
/10
Banha, which will help ensure that households and busi-
nesses receive an adequate and reliable source of elec-
tricity. This, in turn, will help raise living standards and
personal incomes.
Project support
Sierra Leone is to benefit from a $19m loan for its ‘Three
Towns’ water supply and sanitation project. The scheme
aims to boost living standards in Bo, Kenema and Makeni
towns, which have a total population of 500,000, with
fewer than five per cent of the people having access to
safe water supplies.
China will receive a loan of $18m for the Bayin River
management scheme. The project is designed to prevent
the frequent flooding that occurs in Delingha City, regu-
larly placing the lives of the 71,000-strong population at
risk, as well as threatening vital infrastructure.
Guatemala’s $15m loan will be used for a sustain-
able rural development project in the country’s Quiche
region. The scheme will improve living conditions of the
rural and indigenous populations in 20 municipalities in
the region, an impoverished area populated by around
900,000.
Cambodia will benefit from a $12m loan for its water
resource management sector development. Specifically, the mon-
ies will be used to rehabilitate some 15,000 hectares of irrigation
schemes in the Tonle Sap basin, as well as enhance the technical
skills and livelihood opportunities for farmers. The overall aim
is to help boost food security and household incomes.
Tanzania is to get a $10m loan for its Geita district rural
electrification scheme. The project involves connecting 15 rural
villages in Geita town with electricity, thereby enhancing both
living conditions and the livelihoods of the population.
The power projects in Egypt and Tanzania represent part of
OFID’s drive to alleviate energy poverty, a goal which will form
the central pillar of the Fund’s lending programme over the next
three years.
In addition to the loans, the OFID Governing Board approved
four grants totaling $5.35m.
The largest grant, for $2.7m, will help finance the sec-
ond phase of a programme that will provide assistance to 30
Palestinian non-governmental organizations (NGOs).
Additionally, a $2m grant will further an OFID/United Nations Office on
Drugs and Crime (UNODC) project entitled Response to social and livelihood
needs for HIV/AIDS prevention among drug users in East Africa.
Both these large grants will be drawn from the special accounts set up by
OFID in recent years to tackle specific urgent needs — HIV/AIDS and the plight
of Palestinian refugees.
OFID’s HIV/AIDS Account was launched in June 2001, with an initial endow-
ment of $15m, following authorization from the Ministerial Council, OFID’s
highest policy-making body. Subsequent replenishments have boosted the
Account to $80m.
The Ministerial Council also decided in 2002 to establish a Special Grant
Account for Palestine with an initial endowment of $10m.
Subsequent replenishments have boosted the account, which is a special
initiative designed to address the needs of the Palestinian population in the
West Bank and Gaza Strip and accelerate the delivery of social and economic
assistance, to $90m.
Of the smaller OFID grants approved, $350,000 will be extended to the
International University of Africa in Khartoum, the Sudan, to co-finance the
construction of an on-campus hostel for female students.
And a grant of $300,000 will support a scheme of the Austrian NGO,
Hilfswerk International, that will offer technical and vocational training for dis-
advantaged groups in rural areas of the Khatlon region of Tajikistan.
Since its inception, OFID has provided over $12.2bn in much-needed
concessional development financing to 127 developing countries around the
world, with priority given to the poorest amongst them.
Ran
a W
inte
rste
iner
/OFI
D
OPEC Fund for International Development (OFID)
Jamal Nasser Lootah, Chairman of the OFID Governing Board.
46
OPE
C bu
lleti
n 10
/10
Ma
rke
t R
ev
iew This section includes highlights from the OPEC Monthly
Oil Market Report (MOMR) for September 2010,
published by the Petroleum Studies Department of the
Secretariat, with additional graphs and tables. The
publication may be downloaded in PDF format from our
Website (www.opec.org), provided OPEC is credited as
the source for any usage.
Crude oil price movements
During the month of August, the OPEC Reference
Basket moved between $70/barrel and almost
$80/b. Driven by bullish sentiment in the oil
market, the Basket started a three-month high
of around $79/b, before declining to stand
below $70/b on August 24 after market senti-
ment deteriorated.
However, the Basket showed some recovery
in the last week of the month to move above
$72/b and average $74.15/b for the month under
review, up by $1.64/b, or 2.3 per cent, from July
and $2.8 higher than a year ago.
All Basket components strengthened in
August. Iran Heavy and Qatar Marine led the
gains with three per cent and 2.7 per cent,
respectively, higher than the average, followed
by African grades and other Middle Eastern
crudes.
Despite the general increase over the pre-
vious month, the Basket components displayed
different trends within the month.
The Middle East crude market started the
month strong before weakening on the back of
ample supply and poor demand for sour crude
in Asia.
The weakness in Asian demand was exac-
erbated by the closure of China’s Dalian port
after a pipeline explosion and disruption in the
Formosa petrochemical refinery in Taiwan.
West African crudes started the month
strong, supported by a surge in Indian purchases
before they weakened on the back of accumu-
lated supplies, particularly of Nigerian crude.
North African grades — Algerian and Libyan
— were well supported at the beginning of the
month before they weakened amid reduced
buying from European refiners in anticipation
of autumn refinery maintenance. Both West
and North African crudes got some support at
the end of the month.
The Latin American crude Oriente showed
the smallest gain of 55¢, or less than one per
cent, because of low demand for heavy crude
in the US.
On the Nymex, the WTI front-month con-
tract averaged $76.67/b in August, up by 28¢,
or 0.4 per cent, from the previous month.
ICE Brent crude oil futures followed the
same trend as Nymex WTI, but showed a higher
gain of $1.76/b, or 2.3 per cent, to average
$77.12/b.
Commodity markets
Looking at trends in selected commodity mar-
kets, the OPEC report stated that the World
Bank energy commodity price index showed
some recovery on a monthly basis in August,
compared with July, despite macroeconomic
uncertainties that brought volatility to the
markets.
Non-energy commodities went up by 4.6
per cent month-on-month in August, compared
with 5.6 per cent per cent in July, sustained by
food and industrial metals.
Grain prices remained at high levels, fuelled
by the impact of adverse weather conditions
in Eastern Europe, Canada and more recently
Pakistan. Government intervention in the grain
markets, such as the announcement by Russia in
late August of the extension of its grain exports,
also exerted pressure.
Cotton prices were boosted by the supply
tightness in the near term and buoyant demand
from Asia.
Industrial metal prices reported substan-
tial but volatile growth in August on a monthly
basis, despite the inflow of negative macroeco-
nomic data from the US in the second week of
August, which has been associated with sup-
portive fundamentals, but conditions in these
markets are still very fragile and dependent on
the expectations of growth in the US and China.
The World Bank energy commodity price
index increased by 1.1 per cent m-o-m in August,
compared with minus 0.3 per cent m-o-m in
July.
Through August, the price trends in com-
modity markets were diverse and closely linked
to macroeconomic data. Softer-than-expected
1. An average of Saharan Blend (Algeria), Girassol (Angola), Oriente (Ecuador), Iran Heavy (IR Iran), Basra Light (Iraq), Kuwait Export (Kuwait), Es Sider (SP Libyan AJ), Bonny Light (Nigeria), Qatar Marine (Qatar), Arab Light (Saudi Arabia), Murban (UAE) and Merey (Venezuela).
Ma
rke
t R
ev
iew
Septem
ber

47
OPE
C bu
lleti
n 10
/10
US macroeconomic data in August resulted in
a revival of concern about the possibility of
a double-dip recession that exerted pressure
on crude oil and very volatile industrial metal
prices.
The World Bank energy commodity index
(crude oil, natural gas and coal) went up by 1.1
per cent m-o-m in August, compared with a 0.3
per cent drop in July, mainly due to a further
decline in coal prices and Henry Hub natural
gas prices, while WTI remained flat.
HH gas plummeted by seven per cent in
August m-o-m, compared with a 3.6 per cent
fall in July, which reflected poor fundamentals
on both the supply and demand sides.
The World Bank non-fuel commodity price
index rose 4.6 per cent m-o-m in August, com-
pared with 5.6 per cent the previous month,
on the back of food prices, mainly grains and
cotton, as well as industrial metals.
The World Bank industrial metal price
index surged by 8.5 per cent m-o-m in August,
compared with 3.5 per cent in July, with most
of the components having reported consider-
able gains.
Copper prices rose by 8.1 per cent m-o-m
in August, compared with 3.6 per cent in July,
as stocks at the LME kept declining, although
at a moderate pace in August, compared with
the previous month.
Nickel prices jumped by 9.7 per cent m-o-m
in August, supported mainly by inventory draws
at the LME, which fell by 1.5 per cent in August
m-o-m to 117,334 tonnes.
Tin prices jumped by 14.1 per cent m-o-m
in August, prompted by the large draw in stocks
at the LME. These declined by 10.1 per cent in
August to 14,350 t.
Gold prices gained 1.9 per cent m-o-m in
August, reversing the negative trend seen in
July, driven by concerns about the pace of the
economic recovery, as well as low interest rates
and Exchange Traded Fund (ETF) activity.
Highlights of the world economy
In looking at developments in the global
economy, the OPEC report said the US econ-
omy entered a critical stage at a time when
growth is slowing, due to potentially abating
effects from the government-led stimulus that
is coming to an end soon and because of a still
very challenging level of unemployment, which
might continue to put a break on the level of
consumption.
The slowing pace of the recovery can be
easily noticed when analyzing the growth rates
of the previous quarters. While growth was at
a level of five per cent in the fourth quarter of
2009, it was at 3.7 per cent in the first three
months of this year.
The second quarter of 2010 was initially
estimated at 2.4 per cent, only to be revised
down to 1.6 per cent. Expectations are that it
might be revised down further.
Consumption is holding up and still sup-
ported by the fiscal and monetary stimulus, con-
tributing 1.4 points to the 1.6 per cent growth
seen in the second quarter.
Retail sales, which constitute the major por-
tion of consumption, were not as encouraging
in July. They grew by only 0.4 per cent m-o-m
and, excluding auto sales, growth was at only
0.2 per cent. Poor retail sales were accompa-
nied by a weak consumer price index, which
grew by only 0.3 per cent m-o-m, after a 0.1 per
cent decline. The August level is also expected
to be only slightly positive. Core CPI even grew
by only 0.1 per cent.
“These are still dangerously low levels and
while price levels have not yet touched perma-
nently negative areas, the threat of deflation
has not gone away entirely. This, combined
with a labour market that is still fragile, might
not seem to be a very substantial base for the
coming quarters,” the report said.
The US unemployment rate moved up
from 9.5 per cent in June to 9.6 per cent in
July. Weekly jobless claims are hardly improv-
ing and even touched the level of 504,000 in
the third week of August, almost stagnant since
the fourth quarter of 2009.
The fragile state of the US economy was
highlighted by the Chairman of the Federal
Reserve Board. The clear message was that the
Fed will act if the economic situation starts to
deteriorate again, but that it does not consider
this to be the case now.
Activity in the US manufacturing sector
has picked up again, according to the Institute
for Supply Management (ISM) index for man-
ufacturing. This can be considered a positive
development and is much better than previ-
ously expected.
The ISM manufacturing index improved
to 56.3 and remains comfortably above 50.
Furthermore, August shows the highest level
since June this year.
More worrying is the fact that the ISM for
the services sector — which accounts for around
80 per cent of US GDP — is in decline and going
back to levels only slightly above 50. It stood
at 51.5 in August, a significant decline from the
July level of 54.3.
A report by the Congressional Budget Office
(CBO) estimated that the fiscal stimulus that
was enacted by the current administration at
the beginning of 2009 was responsible for as
much as 4.5 per cent growth contribution in the
second quarter and identified the stimulus as
a key contributor for keeping unemployment
below ten per cent.
According to the CBO, the stimulus also
reduced the unemployment rate by between
0.7 and 1.8 percentage points during the same
quarter.
“Considering the above challenges, the
fading impact of the fiscal stimulus package
and the current limits to monetary support in
an economy that is being characterized by de-
leveraging, growth for 2010 now is expected
to stand at 2.6 per cent and at 2.3 per cent for
“The fragile state of the US economy
was highlighted by the Chairman of
the Federal Reserve Board. The clear
message was that the Fed will act
if the economic situation starts to
deteriorate again.”
48
OPE
C bu
lleti
n 10
/10
Ma
rke
t R
ev
iew 2011. This compares with 2.8 per cent and 2.5
per cent, respectively, in the previous OPEC
report,” the OPEC report stated.
In Japan, following the sharp decline of
minus 16.6 per cent in quarterly annualized
growth in the first three months of 2009, the
economy managed to rebound, but still expe-
rienced negative growth in the third quarter of
last year and ended 2009 with a minus 5.2 per
cent yearly decline.
Economic activity in the first quarter of
2010 grew by an impressive 4.4 per cent, only
to recently disappoint expectations of second
quarter growth, which was recorded at only 0.4
per cent.
Expectations for growth in the second half
of this year have been widely lowered. The
Japanese economy is expected to see some
growth, but only on a minor scale. A repetition
of anything like the first quarter growth level
should be considered a surprise at a time when
export growth is decelerating and domestic
demand is likely to suffer from the diminish-
ing effects of the fiscal stimulus.
Exports have been a major force for Japan’s
recovery and experienced strong momentum
in the recent quarter. This dynamic seems to
slow as the growth level of exports declined for
a fifth consecutive month. This development
corresponds to the strong increase of the yen
to a 15-year high.
The country’s exports advanced by 23.5 per
cent y-o-y in July, compared with 27.7 per cent
the previous month, according to the Finance
Ministry.
Imports declined to 15.7 per cent y-o-y in
July, compared with the previous month’s 26.1
per cent, but a big portion of this decline was
attributable to lower prices of landed crude oil,
which was 4.6 per cent lower in July.
On a seasonally-adjusted monthly base,
exports and imports were down by 1.4 per cent
and 3.5 per cent, respectively. This was the third
consecutive monthly decline in exports.
Exports to Asia grew at a rate of 23.8 per
cent y-o-y, slowing from 31.6 per cent in June.
Exports to the US rose by 25.9 per cent y-o-y
and to Europe by 13.3 per cent y-o-y, both of
which were higher than in June and pointing to
a potential continuation in the momentum of
the recovery seen particularly in Europe.
Japan’s labour market — while having
improved slightly — seems to have stagnated
in line with the general economy and not really
to have picked up. The unemployment rate
improved slightly by 0.1 per cent to 5.2 per
cent and the number of employed increased
for the second consecutive month by 0.3 per
cent m-o-m.
Deflation in Japan continued in July. The
consumer price index (CPI) was down by 0.9
per cent y-o-y and the widely watched core
CPI, which excludes food and energy prices,
was down by 1.5 per cent y-o-y in July.
On a monthly basis, the general CPI fell by
0.3 per cent and the core CPI by 0.1 per cent.
At the same time, real household spending
increased by 1.1 per cent m-o-m, after a 0.5
per cent gain a month earlier.
Car sales rose by 32.7 per cent y-o-y in July,
which contributed 0.7 percentage points to the
overall gain. Japanese car sales in August will
again boost household spending, probably for
the last time this year as the stimulus ends.
Domestic sales of new cars, trucks and
buses increased by 46.7 per cent from the same
month a year ago. Supportive to the positive
trend in consumption is certainly the rise in
earnings. July total cash earnings rose by 1.3
per cent y-o-y, marking the fifth consecutive
month of increase.
However, industrial production in Japan
hardly increased in July, rising by 0.3 per cent
m-o-m, after it declined by 1.1 per cent in the
previous month.
According to production index projections,
manufacturing companies are forecasting an
increase in production of 1.6 per cent in August
and by 0.2 per cent in September.
Based on these projections, industrial pro-
duction would increase by 0.7 per cent in the
third quarter of 2010, decelerating slightly from
a 1.5 per cent gain in the second quarter and
seven per cent in the first quarter.
“This should not come as a surprise when
exports are expected to slow down and the
domestic economy is widely supported by a
government-led stimulus that will have to be
extended to avoid a further slowdown over the
coming quarters,” the report noted.
“Based on the above, the next quarters
are expected to post only very meagre growth.
Despite the expectation that the administra-
tion will announce further stimulus measures,
it remains to be seen whether these will be
implemented or successful. Due to the contin-
ued deceleration of the recovery momentum,
the growth forecast for 2010 now stands at
2.5 per cent, compared with 2.7 per cent pre-
viously, while for 2011 the forecast has been
revised down to 1.3 per cent from 1.4 per cent,
previously,” it said.
Expectations for resilient growth in the
Euro-zone in the second quarter of this year
were supported by the recent release of offi-
cial GDP data for the quarter.
“This is a remarkable development, when
taking into account the serious issues the
economy had to deal with, ranging from the
near bankruptcy of Greece to the challenge
of the Euro-zone banking system. Most of the
severe issues of recent months seem to have
been contained at least for now and the Euro-
zone is once again on an expansionary path,”
the report noted.
Driven by the export-led economy of
Germany, the Euro-zone expanded by season-
ally adjusted quarterly growth of one per cent.
In a more common annualized reading, this
translates to 4.1 per cent growth, which com-
pares with second quarter annualized growth
in Japan of 0.4 per cent and in the US at 1.6 per
cent.
Although much improved, it has to be kept
“Japanese car sales in
August will again boost
household spending,
probably for the last
time this year as the
stimulus ends.”
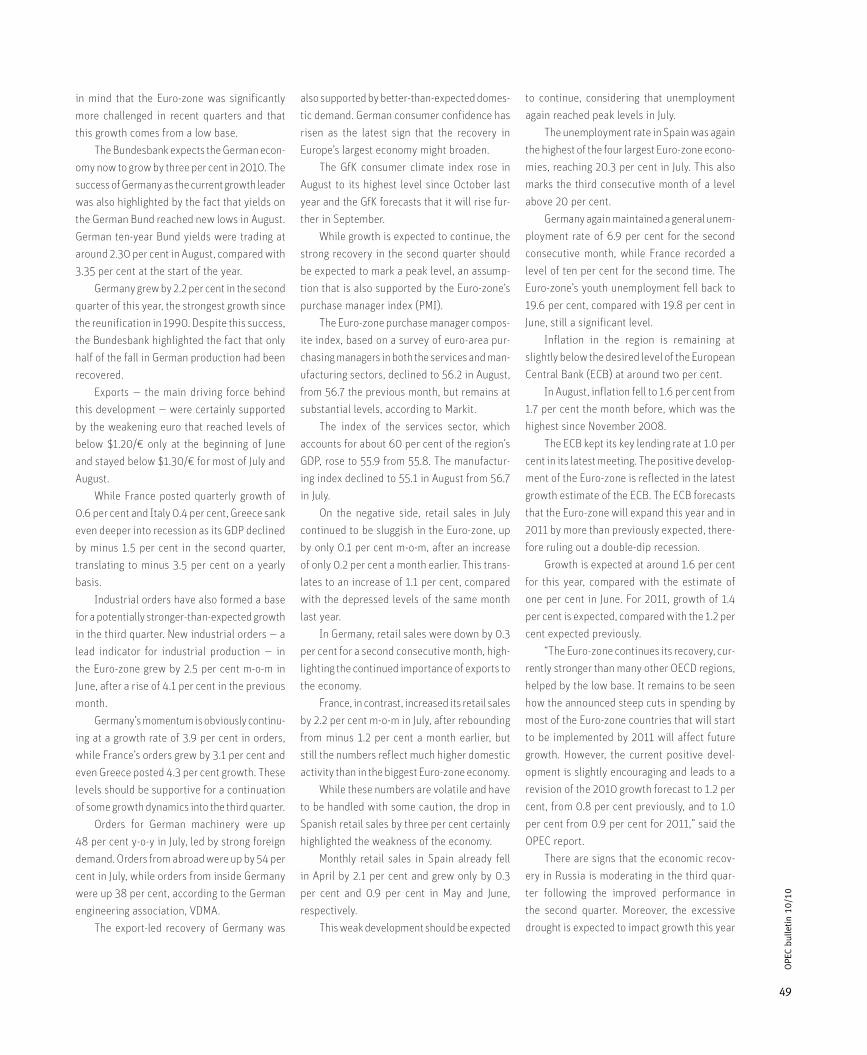
49
OPE
C bu
lleti
n 10
/10
in mind that the Euro-zone was significantly
more challenged in recent quarters and that
this growth comes from a low base.
The Bundesbank expects the German econ-
omy now to grow by three per cent in 2010. The
success of Germany as the current growth leader
was also highlighted by the fact that yields on
the German Bund reached new lows in August.
German ten-year Bund yields were trading at
around 2.30 per cent in August, compared with
3.35 per cent at the start of the year.
Germany grew by 2.2 per cent in the second
quarter of this year, the strongest growth since
the reunification in 1990. Despite this success,
the Bundesbank highlighted the fact that only
half of the fall in German production had been
recovered.
Exports — the main driving force behind
this development — were certainly supported
by the weakening euro that reached levels of
below $1.20/€ only at the beginning of June
and stayed below $1.30/€ for most of July and
August.
While France posted quarterly growth of
0.6 per cent and Italy 0.4 per cent, Greece sank
even deeper into recession as its GDP declined
by minus 1.5 per cent in the second quarter,
translating to minus 3.5 per cent on a yearly
basis.
Industrial orders have also formed a base
for a potentially stronger-than-expected growth
in the third quarter. New industrial orders — a
lead indicator for industrial production — in
the Euro-zone grew by 2.5 per cent m-o-m in
June, after a rise of 4.1 per cent in the previous
month.
Germany’s momentum is obviously continu-
ing at a growth rate of 3.9 per cent in orders,
while France’s orders grew by 3.1 per cent and
even Greece posted 4.3 per cent growth. These
levels should be supportive for a continuation
of some growth dynamics into the third quarter.
Orders for German machinery were up
48 per cent y-o-y in July, led by strong foreign
demand. Orders from abroad were up by 54 per
cent in July, while orders from inside Germany
were up 38 per cent, according to the German
engineering association, VDMA.
The export-led recovery of Germany was
also supported by better-than-expected domes-
tic demand. German consumer confidence has
risen as the latest sign that the recovery in
Europe’s largest economy might broaden.
The GfK consumer climate index rose in
August to its highest level since October last
year and the GfK forecasts that it will rise fur-
ther in September.
While growth is expected to continue, the
strong recovery in the second quarter should
be expected to mark a peak level, an assump-
tion that is also supported by the Euro-zone’s
purchase manager index (PMI).
The Euro-zone purchase manager compos-
ite index, based on a survey of euro-area pur-
chasing managers in both the services and man-
ufacturing sectors, declined to 56.2 in August,
from 56.7 the previous month, but remains at
substantial levels, according to Markit.
The index of the services sector, which
accounts for about 60 per cent of the region’s
GDP, rose to 55.9 from 55.8. The manufactur-
ing index declined to 55.1 in August from 56.7
in July.
On the negative side, retail sales in July
continued to be sluggish in the Euro-zone, up
by only 0.1 per cent m-o-m, after an increase
of only 0.2 per cent a month earlier. This trans-
lates to an increase of 1.1 per cent, compared
with the depressed levels of the same month
last year.
In Germany, retail sales were down by 0.3
per cent for a second consecutive month, high-
lighting the continued importance of exports to
the economy.
France, in contrast, increased its retail sales
by 2.2 per cent m-o-m in July, after rebounding
from minus 1.2 per cent a month earlier, but
still the numbers reflect much higher domestic
activity than in the biggest Euro-zone economy.
While these numbers are volatile and have
to be handled with some caution, the drop in
Spanish retail sales by three per cent certainly
highlighted the weakness of the economy.
Monthly retail sales in Spain already fell
in April by 2.1 per cent and grew only by 0.3
per cent and 0.9 per cent in May and June,
respectively.
This weak development should be expected
to continue, considering that unemployment
again reached peak levels in July.
The unemployment rate in Spain was again
the highest of the four largest Euro-zone econo-
mies, reaching 20.3 per cent in July. This also
marks the third consecutive month of a level
above 20 per cent.
Germany again maintained a general unem-
ployment rate of 6.9 per cent for the second
consecutive month, while France recorded a
level of ten per cent for the second time. The
Euro-zone’s youth unemployment fell back to
19.6 per cent, compared with 19.8 per cent in
June, still a significant level.
Inflation in the region is remaining at
slightly below the desired level of the European
Central Bank (ECB) at around two per cent.
In August, inflation fell to 1.6 per cent from
1.7 per cent the month before, which was the
highest since November 2008.
The ECB kept its key lending rate at 1.0 per
cent in its latest meeting. The positive develop-
ment of the Euro-zone is reflected in the latest
growth estimate of the ECB. The ECB forecasts
that the Euro-zone will expand this year and in
2011 by more than previously expected, there-
fore ruling out a double-dip recession.
Growth is expected at around 1.6 per cent
for this year, compared with the estimate of
one per cent in June. For 2011, growth of 1.4
per cent is expected, compared with the 1.2 per
cent expected previously.
“The Euro-zone continues its recovery, cur-
rently stronger than many other OECD regions,
helped by the low base. It remains to be seen
how the announced steep cuts in spending by
most of the Euro-zone countries that will start
to be implemented by 2011 will affect future
growth. However, the current positive devel-
opment is slightly encouraging and leads to a
revision of the 2010 growth forecast to 1.2 per
cent, from 0.8 per cent previously, and to 1.0
per cent from 0.9 per cent for 2011,” said the
OPEC report.
There are signs that the economic recov-
ery in Russia is moderating in the third quar-
ter following the improved performance in
the second quarter. Moreover, the excessive
drought is expected to impact growth this year
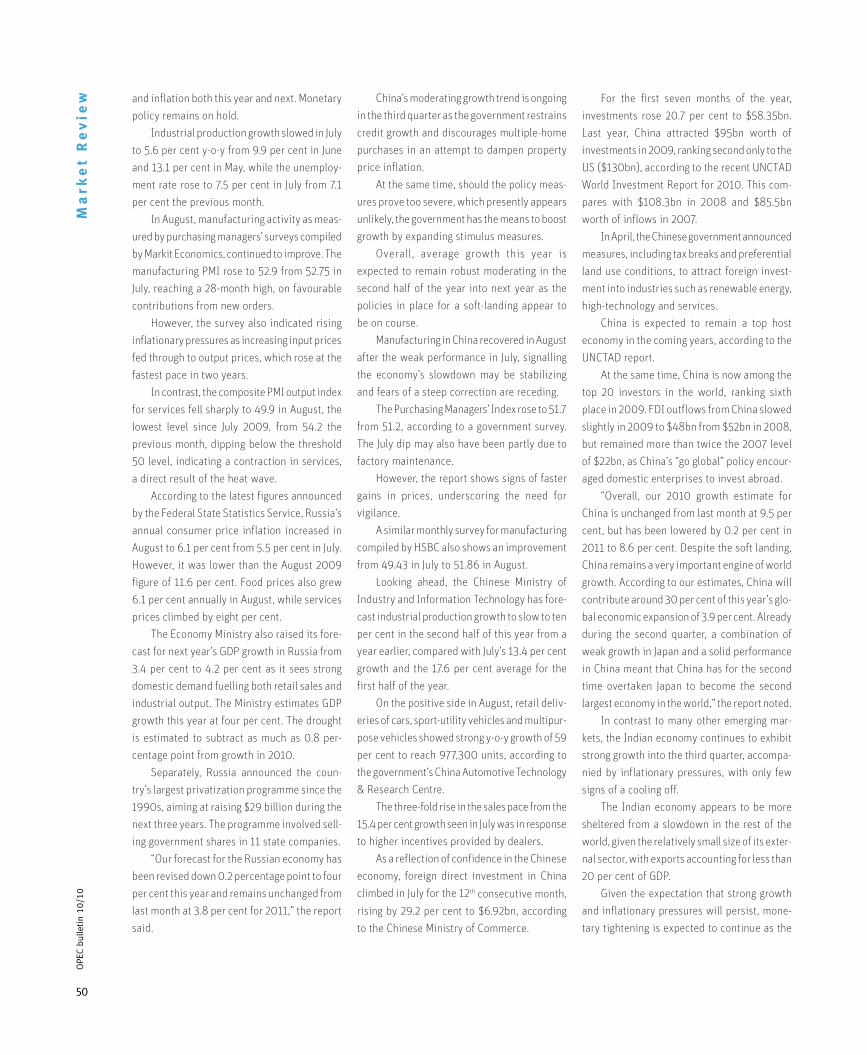
50
OPE
C bu
lleti
n 10
/10
Ma
rke
t R
ev
iew and inflation both this year and next. Monetary
policy remains on hold.
Industrial production growth slowed in July
to 5.6 per cent y-o-y from 9.9 per cent in June
and 13.1 per cent in May, while the unemploy-
ment rate rose to 7.5 per cent in July from 7.1
per cent the previous month.
In August, manufacturing activity as meas-
ured by purchasing managers’ surveys compiled
by Markit Economics, continued to improve. The
manufacturing PMI rose to 52.9 from 52.75 in
July, reaching a 28-month high, on favourable
contributions from new orders.
However, the survey also indicated rising
inflationary pressures as increasing input prices
fed through to output prices, which rose at the
fastest pace in two years.
In contrast, the composite PMI output index
for services fell sharply to 49.9 in August, the
lowest level since July 2009, from 54.2 the
previous month, dipping below the threshold
50 level, indicating a contraction in services,
a direct result of the heat wave.
According to the latest figures announced
by the Federal State Statistics Service, Russia’s
annual consumer price inflation increased in
August to 6.1 per cent from 5.5 per cent in July.
However, it was lower than the August 2009
figure of 11.6 per cent. Food prices also grew
6.1 per cent annually in August, while services
prices climbed by eight per cent.
The Economy Ministry also raised its fore-
cast for next year’s GDP growth in Russia from
3.4 per cent to 4.2 per cent as it sees strong
domestic demand fuelling both retail sales and
industrial output. The Ministry estimates GDP
growth this year at four per cent. The drought
is estimated to subtract as much as 0.8 per-
centage point from growth in 2010.
Separately, Russia announced the coun-
try’s largest privatization programme since the
1990s, aiming at raising $29 billion during the
next three years. The programme involved sell-
ing government shares in 11 state companies.
“Our forecast for the Russian economy has
been revised down 0.2 percentage point to four
per cent this year and remains unchanged from
last month at 3.8 per cent for 2011,” the report
said.
China’s moderating growth trend is ongoing
in the third quarter as the government restrains
credit growth and discourages multiple-home
purchases in an attempt to dampen property
price inflation.
At the same time, should the policy meas-
ures prove too severe, which presently appears
unlikely, the government has the means to boost
growth by expanding stimulus measures.
Overall, average growth this year is
expected to remain robust moderating in the
second half of the year into next year as the
policies in place for a soft-landing appear to
be on course.
Manufacturing in China recovered in August
after the weak performance in July, signalling
the economy’s slowdown may be stabilizing
and fears of a steep correction are receding.
The Purchasing Managers’ Index rose to 51.7
from 51.2, according to a government survey.
The July dip may also have been partly due to
factory maintenance.
However, the report shows signs of faster
gains in prices, underscoring the need for
vigilance.
A similar monthly survey for manufacturing
compiled by HSBC also shows an improvement
from 49.43 in July to 51.86 in August.
Looking ahead, the Chinese Ministry of
Industry and Information Technology has fore-
cast industrial production growth to slow to ten
per cent in the second half of this year from a
year earlier, compared with July’s 13.4 per cent
growth and the 17.6 per cent average for the
first half of the year.
On the positive side in August, retail deliv-
eries of cars, sport-utility vehicles and multipur-
pose vehicles showed strong y-o-y growth of 59
per cent to reach 977,300 units, according to
the government’s China Automotive Technology
& Research Centre.
The three-fold rise in the sales pace from the
15.4 per cent growth seen in July was in response
to higher incentives provided by dealers.
As a reflection of confidence in the Chinese
economy, foreign direct investment in China
climbed in July for the 12th consecutive month,
rising by 29.2 per cent to $6.92bn, according
to the Chinese Ministry of Commerce.
For the first seven months of the year,
investments rose 20.7 per cent to $58.35bn.
Last year, China attracted $95bn worth of
investments in 2009, ranking second only to the
US ($130bn), according to the recent UNCTAD
World Investment Report for 2010. This com-
pares with $108.3bn in 2008 and $85.5bn
worth of inflows in 2007.
In April, the Chinese government announced
measures, including tax breaks and preferential
land use conditions, to attract foreign invest-
ment into industries such as renewable energy,
high-technology and services.
China is expected to remain a top host
economy in the coming years, according to the
UNCTAD report.
At the same time, China is now among the
top 20 investors in the world, ranking sixth
place in 2009. FDI outflows from China slowed
slightly in 2009 to $48bn from $52bn in 2008,
but remained more than twice the 2007 level
of $22bn, as China’s “go global” policy encour-
aged domestic enterprises to invest abroad.
“Overall, our 2010 growth estimate for
China is unchanged from last month at 9.5 per
cent, but has been lowered by 0.2 per cent in
2011 to 8.6 per cent. Despite the soft landing,
China remains a very important engine of world
growth. According to our estimates, China will
contribute around 30 per cent of this year’s glo-
bal economic expansion of 3.9 per cent. Already
during the second quarter, a combination of
weak growth in Japan and a solid performance
in China meant that China has for the second
time overtaken Japan to become the second
largest economy in the world,” the report noted.
In contrast to many other emerging mar-
kets, the Indian economy continues to exhibit
strong growth into the third quarter, accompa-
nied by inflationary pressures, with only few
signs of a cooling off.
The Indian economy appears to be more
sheltered from a slowdown in the rest of the
world, given the relatively small size of its exter-
nal sector, with exports accounting for less than
20 per cent of GDP.
Given the expectation that strong growth
and inflationary pressures will persist, mone-
tary tightening is expected to continue as the

51
OPE
C bu
lleti
n 10
/10
Reserve Bank of India seeks to rein in consumer
prices.
The government reported that GDP had
expanded at the fastest pace in two-and-a-half
years in the second quarter, posting 8.8 per cent
y-o-y growth, following 8.6 per cent in the first
quarter.
Agricultural output rose by 2.8 per cent,
while services, which account for about 55
per cent of the economy, grew by 9.7 per cent,
manufacturing expanded by 12.4 per cent and
mining output rose by 8.9 per cent.
The brisk expansion continued into the
third quarter in both manufacturing and serv-
ices, albeit at a slightly moderating pace in
August.
The latest HSBC Purchasing Managers’
Index for the manufacturing sector posted
57.2 in August, slightly less than the 57.6 figure
for July, indicating that the recovery from the
downturn at the end of 2008 and early 2009
is being uninterrupted.
The HSBC report notes that, despite the
strong rise in output and orders, employment
in the manufacturing sector fell for the second
month in a row.
In the services sector, despite a second
monthly drop in the headline PMI to 59.3 in
August from 61.7 in July and 64 in June, the
numbers continue to indicate sharp growth
in the services sector, accompanied by high
input-price inflation with total new orders ris-
ing slightly.
Inflation remained high, despite some signs
of easing in July. Wholesale price inflation fell
from 10.6 per cent in June to 9.9 per cent in July,
while the consumer price index for industrial
workers was 11.3 per cent in July, down from
13.8 per cent in June.
With rising incomes and increasing wealth
and an expectation of a good monsoon season
(June-September), domestic demand is set to
remain strong.
One indicator is the passenger-car sales
which jumped 38 per cent y-o-y to a record
158,764 in July, as reported by the Society of
Indian Automobile Manufacturers. The group
forecasts annual sales to reach three million
by 2015, twice the rate seen in 2009.
Separately, the UNCTAD World Investment
Report for 2010 reported that India had
attracted $35bn of foreign direct investment in
2009 compared with $40bn in 2008, ranking
third after China and Hong Kong in the South,
East, and South East Asian region and ninth in
the world.
“Our forecast for GDP growth in India this
year has been revised up by 0.4 per cent to 8.2
per cent, while the forecast for next year remains
unchanged at 7.7 per cent,” said the report.
Brazil’s economic growth slowed to 1.2 per
cent in the second quarter of 2010 from 2.7 per
cent the previous quarter, a pace seen by the
Central Bank to be more compatible with long-
term equilibrium.
The drop was less than expected as invest-
ments rose at a record rate reinforcing the view
that the Central Bank may have to resume mon-
etary tightening later on this year, or in early
2011.
Seen on an annual basis, growth in the sec-
ond quarter of this year amounted to 8.7 per
cent, only slightly lower than the nine per cent
registered in the first quarter, when it expanded
at the fastest pace in 15 years, due to record
retail sales growth.
The fastest component of GDP growth in
the second quarter was investment, which
expanded by 2.4 per cent, or 26.5 per cent, from
a year ago, the biggest increase since records
began in 1996.
Consumer expenditure rose by 0.8 per cent
and government expenditure increased by 2.1
per cent.
While imports soared by 38.8 per cent y-o-
y, encouraged by a strong currency, exports rose
by only 7.3 per cent.
The country’s finance minister expects
growth to slow in the second half of the year,
although the Central Bank sees the pace of
growth in the third quarter being somewhat
higher than in the second quarter, but still below
the first quarter.
The bank expects GDP in Brazil to expand
7.3 per cent in 2010, a forecast unchanged since
June, while a survey of 100 economists by the
bank in late August predict a slightly lower pace
of 7.1 per cent.
Industrial output rose by 0.4 per cent in July
from a month earlier, according to the national
statistics agency, compared with a one per cent
fall in June. Output rose 8.7 per cent from a year
earlier.
Consumer prices fell unexpectedly in
August with the annual inflation rate through
mid-August dipping to 4.44 per cent, falling
below the government’s 4.5 per cent target for
the first time since January.
However, a Central Bank survey shows
inflation rising to 5.1 per cent by year-end and
forecasts for next year show inflation averag-
ing 4.87 per cent.
The fall in inflation in August, as well as
the lower-than-expected rebound in indus-
trial output in July, were factors in the Central
Bank’s decision to keep interest rates on-hold
on September 1 at 10.75 per cent after three
increases amounting to 200 basis points.
“Our forecast for GDP growth has been
raised by 0.7 percentage point to 6.6 per cent for
2010, while the forecast for 2011 is unchanged
from the previous report at four per cent,” the
OPEC report said.
Looking at selected OPEC Member
Countries, the report said that the IMF painted
a positive picture of the Saudi Arabian economy
which was seen to have coped well with the
global crisis, given the sizeable fiscal stimulus,
counter-cyclical macro-prudential policy of the
Central Bank and good supervisory and regula-
tory frameworks, which enhanced the financial
sector’s resilience.
This year, the Kingdom’s consumer price
inflation is seen to average 5.2 per cent,
“Our forecast for GDP growth
in India this year has been
revised up by 0.4 per cent
to 8.2 per cent, while the
forecast for next year remains
unchanged at 7.7 per cent.”

52
OPE
C bu
lleti
n 10
/10
Ma
rke
t R
ev
iew reflecting mainly persistent price rises for food
and rent. The latest seasonally adjusted monthly
figures show overall consumer prices rising by
almost six per cent in July y-o-y from 5.6 per
cent in June, with food price increasing by 7.1
per cent from 6.2 per cent in June.
Total GDP is forecast by the IMF to grow by
3.7 per cent in 2010, with non-oil GDP expand-
ing by 4.3 per cent. Non-oil GDP was supported
in 2009 by the fiscal stimulus and grew by 3.8
per cent, only a half a percentage point below
growth in 2008.
Both FDI inflows and outflows fell in West
Asia in 2009 in most of the region’s countries,
according to the UNCTAD World Investment
Report for 2010, but prospects may improve
in 2010.
However, for inflows there were a few
exceptions to the 2009 trend. In Qatar, inflows
rose by 112 per cent to $8.7bn, from $4.1bn in
2008, mainly in liquefied natural gas (LNG),
with two more LNG “super-trains” expected to
come onstream in 2010.
Among the main recipients of FDI, the 71
per cent drop in the UAE from $13.7bn in 2008
to $4bn in 2009 was mainly due to the Dubai
debt crisis.
Saudi Arabia continued to be the region’s
largest recipient of FDI, with total inflows reach-
ing $35.5bn in 2009, only seven per cent below
the previous year.
For FDI outflows from the region the picture
was also varied. Outflows from Kuwait remained
almost unchanged, at $8.7bn in 2009, making
it the region’s largest outward investor in the
year, followed by Saudi Arabia, where outward
FDI increased significantly from $1.5bn in 2008
to $6.5bn last year.
In contrast, outflows from the UAE fell to
$2.7bn from $15.8bn in 2008.
World oil demand
In its review of the market, the report said
demand for OPEC crude for 2010 has been
revised down by 100,000 b/d to currently
stand at 28.6m b/d.
The revision mainly reflects the upward
adjustment in non-OPEC supply as demand
figures remained broadly unchanged.
With the exception of the second quarter,
which saw an upward revision, all other quar-
ters experienced a downward revision.
Demand for OPEC crude represents a
decline of 300,000 b/d from the previous
year. The first quarter of the year is still show-
ing a drop of 1.0m b/d, followed by a decline of
400,000 b/d in the second quarter, while the
third quarter is estimated to remain flat and
the fourth quarter is projected to see growth
of around 200,000 b/d.
Demand for OPEC crude next year is pro-
jected to average 28.8m b/d, showing a down-
ward revision of 100,000 b/d from the previ-
ous assessment.
The required OPEC crude is forecast to
increase by about 200,000 b/d, following three
consecutive annual declines.
The bulk of the growth is expected to be
shown in the first half of the year, indicating
an increase of 500,000 b/d and 400,000 b/d
in the first and second quarters, respectively,
while the second half is forecast to remain
almost unchanged, compared with the previ-
ous year over the same period.
Moving to the industrialized countries,
the report said present economic conditions
in most developed countries is discouraging.
The economic recovery is not only slow, but
is also facing turbulence. The fact that some
OECD countries can no longer afford stimulus
plans is likely to pressure their economies in
the second half of this year, leading to weaker
oil demand compared with the first half.
Earlier forecasts anticipated a lower oil
demand performance in the first half of the
year; however, stimulus plans enacted early
in the year have resulted in higher than antici-
pated oil demand.
Hence, a minor upward revision in the first
half of the year was acknowledged. Depletion of
government funds will leave oil demand fore-
casts for the second half as anticipated. Should
governments manage to provide additional
funding, an upward risk might be a possibility.
Signs of a slower recovery in most of the OECD
countries are becoming more apparent, imposing
the need for considerable caution on world oil
demand projections for the rest of this year.
In fact, the consequence of a weaker eco-
nomic recovery on oil demand is already being
seen, as growth is weakening in some parts of
the world, dipping into the negative. This is
not only affecting OECD oil demand, but also
spreading to non-OECD areas, such as Asia.
Despite recent weekly US data indicat-
ing strong growth in the country’s oil demand
caused by the low base of last year, the OECD
region is not expected to achieve any growth
this year in oil demand, due to a deep decline
in European oil demand.
It is not only US oil demand playing a major
role in total oil consumption this year; China’s
oil demand has been acting as a backup and
offsetting, to a certain degree, the loss in OECD
oil demand. However, this might weaken as the
Chinese government makes efforts to slow down
its overheating economy.
World oil demand in the second half of 2010
is forecast to grow by more than 1.0m b/d, led
by China, the US and the Middle East.
Given the slow pace of the world economic
recovery, global oil demand growth is forecast
at 1.05m b/d, or 1.2 per cent, unchanged from
the previous month.
August US weekly data illustrated a slow-
down in the growth of the country’s oil con-
sumption. The recent deterioration in the US
economy resulted in fewer miles driven, and a
reduction in industrial production.
Despite the low base from last year, there
was only a minor increase in gasoline usage,
especially during the summer driving season
and a moderate improvement in distillates,
which was offset by considerable decreases
in industrial fuels, such as residual fuel oil and
propane/propylene.
Slowing economic activities have been
affecting the country’s total oil consumption,
which forced the US energy administration to
sharply revise down the implied growth for June.
Based on more reliable monthly official
statistics, US oil consumption only showed a
minor increase of 200,000 b/d in the first half
of 2010, compared with 2009, while gasoline
consumption is on the decline.
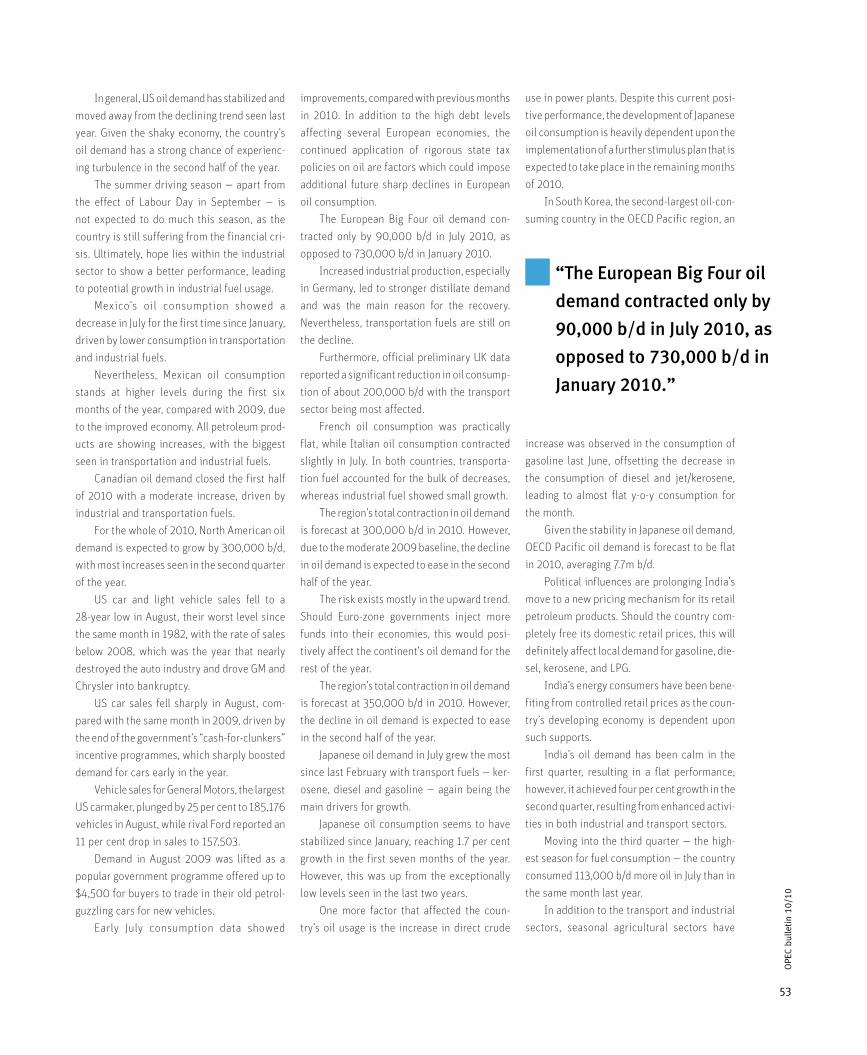
53
OPE
C bu
lleti
n 10
/10
In general, US oil demand has stabilized and
moved away from the declining trend seen last
year. Given the shaky economy, the country’s
oil demand has a strong chance of experienc-
ing turbulence in the second half of the year.
The summer driving season — apart from
the effect of Labour Day in September — is
not expected to do much this season, as the
country is still suffering from the financial cri-
sis. Ultimately, hope lies within the industrial
sector to show a better performance, leading
to potential growth in industrial fuel usage.
Mexico’s oil consumption showed a
decrease in July for the first time since January,
driven by lower consumption in transportation
and industrial fuels.
Nevertheless, Mexican oil consumption
stands at higher levels during the first six
months of the year, compared with 2009, due
to the improved economy. All petroleum prod-
ucts are showing increases, with the biggest
seen in transportation and industrial fuels.
Canadian oil demand closed the first half
of 2010 with a moderate increase, driven by
industrial and transportation fuels.
For the whole of 2010, North American oil
demand is expected to grow by 300,000 b/d,
with most increases seen in the second quarter
of the year.
US car and light vehicle sales fell to a
28-year low in August, their worst level since
the same month in 1982, with the rate of sales
below 2008, which was the year that nearly
destroyed the auto industry and drove GM and
Chrysler into bankruptcy.
US car sales fell sharply in August, com-
pared with the same month in 2009, driven by
the end of the government’s “cash-for-clunkers”
incentive programmes, which sharply boosted
demand for cars early in the year.
Vehicle sales for General Motors, the largest
US carmaker, plunged by 25 per cent to 185,176
vehicles in August, while rival Ford reported an
11 per cent drop in sales to 157,503.
Demand in August 2009 was lifted as a
popular government programme offered up to
$4,500 for buyers to trade in their old petrol-
guzzling cars for new vehicles.
Early July consumption data showed
improvements, compared with previous months
in 2010. In addition to the high debt levels
affecting several European economies, the
continued application of rigorous state tax
policies on oil are factors which could impose
additional future sharp declines in European
oil consumption.
The European Big Four oil demand con-
tracted only by 90,000 b/d in July 2010, as
opposed to 730,000 b/d in January 2010.
Increased industrial production, especially
in Germany, led to stronger distillate demand
and was the main reason for the recovery.
Nevertheless, transportation fuels are still on
the decline.
Furthermore, official preliminary UK data
reported a significant reduction in oil consump-
tion of about 200,000 b/d with the transport
sector being most affected.
French oil consumption was practically
flat, while Italian oil consumption contracted
slightly in July. In both countries, transporta-
tion fuel accounted for the bulk of decreases,
whereas industrial fuel showed small growth.
The region’s total contraction in oil demand
is forecast at 300,000 b/d in 2010. However,
due to the moderate 2009 baseline, the decline
in oil demand is expected to ease in the second
half of the year.
The risk exists mostly in the upward trend.
Should Euro-zone governments inject more
funds into their economies, this would posi-
tively affect the continent’s oil demand for the
rest of the year.
The region’s total contraction in oil demand
is forecast at 350,000 b/d in 2010. However,
the decline in oil demand is expected to ease
in the second half of the year.
Japanese oil demand in July grew the most
since last February with transport fuels — ker-
osene, diesel and gasoline — again being the
main drivers for growth.
Japanese oil consumption seems to have
stabilized since January, reaching 1.7 per cent
growth in the first seven months of the year.
However, this was up from the exceptionally
low levels seen in the last two years.
One more factor that affected the coun-
try’s oil usage is the increase in direct crude
use in power plants. Despite this current posi-
tive performance, the development of Japanese
oil consumption is heavily dependent upon the
implementation of a further stimulus plan that is
expected to take place in the remaining months
of 2010.
In South Korea, the second-largest oil-con-
suming country in the OECD Pacific region, an
increase was observed in the consumption of
gasoline last June, offsetting the decrease in
the consumption of diesel and jet/kerosene,
leading to almost flat y-o-y consumption for
the month.
Given the stability in Japanese oil demand,
OECD Pacific oil demand is forecast to be flat
in 2010, averaging 7.7m b/d.
Political influences are prolonging India’s
move to a new pricing mechanism for its retail
petroleum products. Should the country com-
pletely free its domestic retail prices, this will
definitely affect local demand for gasoline, die-
sel, kerosene, and LPG.
India’s energy consumers have been bene-
fiting from controlled retail prices as the coun-
try’s developing economy is dependent upon
such supports.
India’s oil demand has been calm in the
first quarter, resulting in a flat performance;
however, it achieved four per cent growth in the
second quarter, resulting from enhanced activi-
ties in both industrial and transport sectors.
Moving into the third quarter — the high-
est season for fuel consumption — the country
consumed 113,000 b/d more oil in July than in
the same month last year.
In addition to the transport and industrial
sectors, seasonal agricultural sectors have
“The European Big Four oil
demand contracted only by
90,000 b/d in July 2010, as
opposed to 730,000 b/d in
January 2010.”

54
OPE
C bu
lleti
n 10
/10
Ma
rke
t R
ev
iew pushed for more diesel usage in the summer.
Diesel that was used in the transport, indus-
trial and agricultural sectors contributed most
to the increase in July oil demand, amounting
to 75,000 b/d of total growth.
With the strong increase in new car sales,
gasoline demand grew by almost 15 per cent in
July y-o-y. Other industries, such as petrochemi-
cals, increased LPG use by eight per cent over
the same period.
A healthy Indian economy in the past
few years has increased demand for energy.
Although Indian oil demand has been perform-
ing below forecast growth by 35,000 b/d, it is
expected, to a certain degree, to balance itself
in the second half of 2010.
However, given the weak demand in the first
quarter, India’s oil demand for the year is not
expected to be as strong as last year, achieving
growth of a little less than four per cent y-o-y.
India’s auto industry has been on the move
for the past two years. It is not only strong eco-
nomic activities that are boosting the county’s
new vehicle sales, but also controlled gasoline
and diesel prices, along with government incen-
tive programmes.
Given the low base of oil demand last
year and also its growing economy, Taiwan oil
demand has grown in the first six months of
the year, exceeding eight per cent.
Almost all of this growth is attributed to
the industrial sector; however, transport fuel
showed some minor decrease as the country
diversified its transportation energy use to
electricity via intra-city trains.
This movement is also seen in some of Asia’s
economic tigers. Hong Kong oil usage experi-
enced growth in the first quarter; nevertheless,
it plunged to a contraction mode, ending the
first half of the year with a 16 per cent y-o-y
decline.
Given the strength of India’s oil consump-
tion, Other Asia oil demand growth for the total
year is forecast at 23,000 b/d, or 2.3 per cent,
y-o-y, averaging 10m b/d.
Other Asia oil demand exceeded 10m b/d
for the first time in the second quarter of 2010.
Saudi Arabian oil demand is back on track
after a weak performance in the second quar-
ter. Declining oil demand in June was the first
to be seen for the past four years on a monthly
basis; however, the second quarter has a low
seasonality by nature in Saudi oil consumption.
July data indicated a strong increase in
demand for diesel by the transport, industrial,
and agricultural sectors. Saudi diesel demand
grew by 19 per cent in July y-o-y, followed by
fuel oil exceeding 13 per cent growth.
Given the high summer seasonality, Saudi
oil demand is expected to grow by 157,000 b/d
in the third quarter y-o-y, ending the year with
5.8 per cent growth.
Unlike Saudi oil demand, Iran’s oil con-
sumption has been on the decline since the
beginning of the year. Diesel consumption
showed most of the decline, totalling 25,000
b/d in the first half of 2010 y-o-y.
As the region’s economies show steady
growth, the region’s long-term projects are
keeping Middle East oil demand on the rise.
With the effect of weak Iranian oil demand,
the initial Middle East oil demand forecast was
reduced by 25,000 b/d to show total growth of
200,000 b/d y-o-y, averaging 7.3m b/d.
Brazilian oil demand has been showing
growth exceeding 100,000 b/d on a monthly
basis since the beginning of the year. July data
indicated strong consumption caused by strong
demand in the transportation sector.
Gasoline and diesel oil demand inched up
by 19 per cent and 12 per cent y-o-y. Due to the
healthy growth in both Brazilian and Venezuelan
oil consumption, Latin America’s oil demand
is expected to grow by 2.7 per cent, averaging
6.0m b/d in 2010.
Developing Countries’ oil demand growth
is forecast at 600,000 b/d y-o-y in 2010, aver-
aging 26.6m b/d.
Among other economic factors that might
affect China’s oil demand is the appreciation
of the country’s yuan currency. The yuan has
appreciated against the dollar since Beijing
announced on June 19 that it was freeing the
yuan from its two-year de facto peg to the US
dollar. Nevertheless, the IMF still sees the cur-
rency as needing more flexibility and being
undervalued in the market.
Chinese oil demand seems to have cooled
down as a result of economic and political fac-
tors. July oil demand growth was the lowest in
the last 12 months. The country’s oil consump-
tion grew by 3.4 per cent in July y-o-y, averag-
ing 9m b/d.
This weak performance came despite the
high seasonality of agriculture and the high
demand for electricity. However, this tempo-
rary slowdown in oil demand is not expected
to affect total year oil consumption.
China’s over-heating economy has kept
the country’s oil demand on a sharp incline.
The country has used another 514,000 b/d of
oil in the first seven months of the year and
oil imports exceeded 1m b/d for two months
to reach 1.6m b/d in February.
However, a large portion of the oil imports
seen during the first half of this year wound up
in the country’s oil storage. China is keen on a
programme to build massive strategic oil stor-
age within the country. The initial filling com-
menced in the third quarter of 2006, reaching
120m b in the third quarter of 2010. China’s oil
imports are structured based on international
oil prices.
Almost all of China’s economic indica-
tors exceeded expectations, pushing not only
the country’s GDP to 9.5 per cent growth,
but also the country’s oil usage to approach
growth of 5.6 per cent in 2010 to average
8.7m b/d.
Looking at world oil demand in 2011, the
OPEC report said the global economic recov-
ery that started during the second half of 2010
is projected to continue throughout next year,
however at a slow pace.
“Given the high summer
seasonality, Saudi oil
demand is expected to grow
by 157,000 b/d in the third
quarter y-o-y, ending the year
with 5.8 per cent growth.”
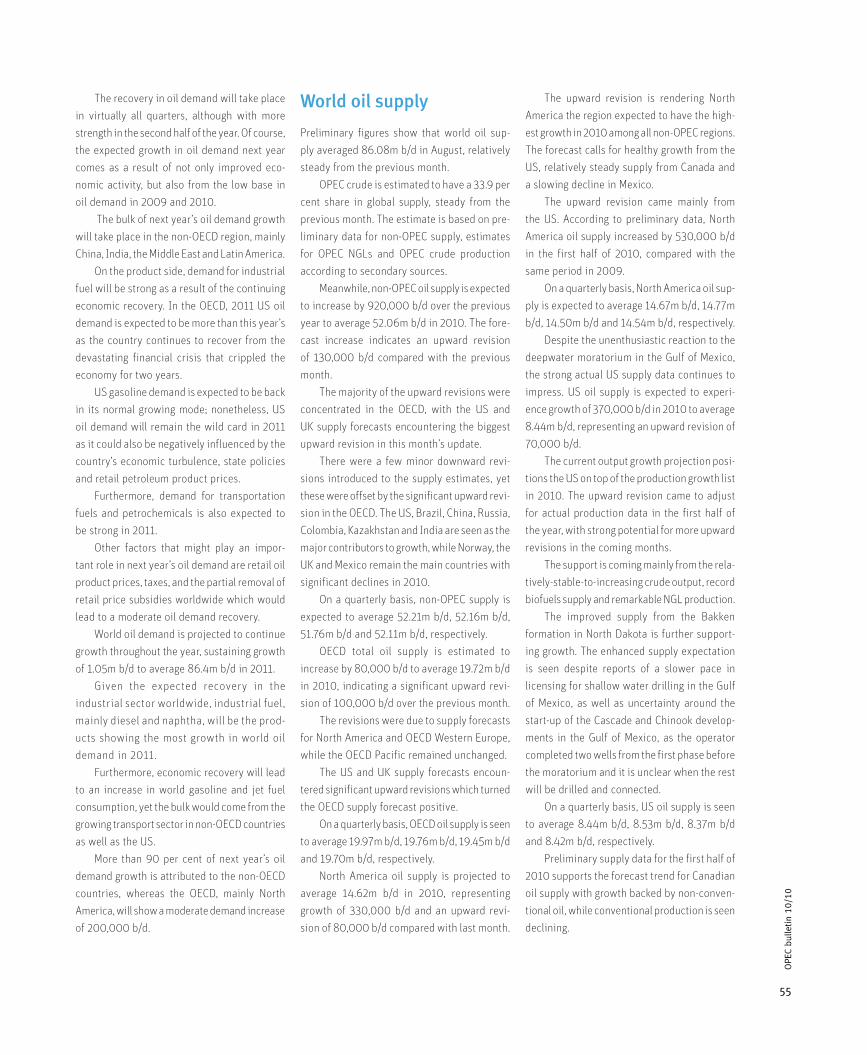
55
OPE
C bu
lleti
n 10
/10
The recovery in oil demand will take place
in virtually all quarters, although with more
strength in the second half of the year. Of course,
the expected growth in oil demand next year
comes as a result of not only improved eco-
nomic activity, but also from the low base in
oil demand in 2009 and 2010.
The bulk of next year’s oil demand growth
will take place in the non-OECD region, mainly
China, India, the Middle East and Latin America.
On the product side, demand for industrial
fuel will be strong as a result of the continuing
economic recovery. In the OECD, 2011 US oil
demand is expected to be more than this year’s
as the country continues to recover from the
devastating financial crisis that crippled the
economy for two years.
US gasoline demand is expected to be back
in its normal growing mode; nonetheless, US
oil demand will remain the wild card in 2011
as it could also be negatively influenced by the
country’s economic turbulence, state policies
and retail petroleum product prices.
Furthermore, demand for transportation
fuels and petrochemicals is also expected to
be strong in 2011.
Other factors that might play an impor-
tant role in next year’s oil demand are retail oil
product prices, taxes, and the partial removal of
retail price subsidies worldwide which would
lead to a moderate oil demand recovery.
World oil demand is projected to continue
growth throughout the year, sustaining growth
of 1.05m b/d to average 86.4m b/d in 2011.
Given the expected recovery in the
industrial sector worldwide, industrial fuel,
mainly diesel and naphtha, will be the prod-
ucts showing the most growth in world oil
demand in 2011.
Furthermore, economic recovery will lead
to an increase in world gasoline and jet fuel
consumption, yet the bulk would come from the
growing transport sector in non-OECD countries
as well as the US.
More than 90 per cent of next year’s oil
demand growth is attributed to the non-OECD
countries, whereas the OECD, mainly North
America, will show a moderate demand increase
of 200,000 b/d.
World oil supply
Preliminary figures show that world oil sup-
ply averaged 86.08m b/d in August, relatively
steady from the previous month.
OPEC crude is estimated to have a 33.9 per
cent share in global supply, steady from the
previous month. The estimate is based on pre-
liminary data for non-OPEC supply, estimates
for OPEC NGLs and OPEC crude production
according to secondary sources.
Meanwhile, non-OPEC oil supply is expected
to increase by 920,000 b/d over the previous
year to average 52.06m b/d in 2010. The fore-
cast increase indicates an upward revision
of 130,000 b/d compared with the previous
month.
The majority of the upward revisions were
concentrated in the OECD, with the US and
UK supply forecasts encountering the biggest
upward revision in this month’s update.
There were a few minor downward revi-
sions introduced to the supply estimates, yet
these were offset by the significant upward revi-
sion in the OECD. The US, Brazil, China, Russia,
Colombia, Kazakhstan and India are seen as the
major contributors to growth, while Norway, the
UK and Mexico remain the main countries with
significant declines in 2010.
On a quarterly basis, non-OPEC supply is
expected to average 52.21m b/d, 52.16m b/d,
51.76m b/d and 52.11m b/d, respectively.
OECD total oil supply is estimated to
increase by 80,000 b/d to average 19.72m b/d
in 2010, indicating a significant upward revi-
sion of 100,000 b/d over the previous month.
The revisions were due to supply forecasts
for North America and OECD Western Europe,
while the OECD Pacific remained unchanged.
The US and UK supply forecasts encoun-
tered significant upward revisions which turned
the OECD supply forecast positive.
On a quarterly basis, OECD oil supply is seen
to average 19.97m b/d, 19.76m b/d, 19.45m b/d
and 19.70m b/d, respectively.
North America oil supply is projected to
average 14.62m b/d in 2010, representing
growth of 330,000 b/d and an upward revi-
sion of 80,000 b/d compared with last month.
The upward revision is rendering North
America the region expected to have the high-
est growth in 2010 among all non-OPEC regions.
The forecast calls for healthy growth from the
US, relatively steady supply from Canada and
a slowing decline in Mexico.
The upward revision came mainly from
the US. According to preliminary data, North
America oil supply increased by 530,000 b/d
in the first half of 2010, compared with the
same period in 2009.
On a quarterly basis, North America oil sup-
ply is expected to average 14.67m b/d, 14.77m
b/d, 14.50m b/d and 14.54m b/d, respectively.
Despite the unenthusiastic reaction to the
deepwater moratorium in the Gulf of Mexico,
the strong actual US supply data continues to
impress. US oil supply is expected to experi-
ence growth of 370,000 b/d in 2010 to average
8.44m b/d, representing an upward revision of
70,000 b/d.
The current output growth projection posi-
tions the US on top of the production growth list
in 2010. The upward revision came to adjust
for actual production data in the first half of
the year, with strong potential for more upward
revisions in the coming months.
The support is coming mainly from the rela-
tively-stable-to-increasing crude output, record
biofuels supply and remarkable NGL production.
The improved supply from the Bakken
formation in North Dakota is further support-
ing growth. The enhanced supply expectation
is seen despite reports of a slower pace in
licensing for shallow water drilling in the Gulf
of Mexico, as well as uncertainty around the
start-up of the Cascade and Chinook develop-
ments in the Gulf of Mexico, as the operator
completed two wells from the first phase before
the moratorium and it is unclear when the rest
will be drilled and connected.
On a quarterly basis, US oil supply is seen
to average 8.44m b/d, 8.53m b/d, 8.37m b/d
and 8.42m b/d, respectively.
Preliminary supply data for the first half of
2010 supports the forecast trend for Canadian
oil supply with growth backed by non-conven-
tional oil, while conventional production is seen
declining.

56
OPE
C bu
lleti
n 10
/10
Ma
rke
t R
ev
iew However, the various operational setbacks
seen during the first half of the year hindered
the materialization of the earlier anticipated
growth.
Canada’s oil supply is expected to average
3.26m b/d in 2010, minor growth of 20,000 b/d
over 2009 and representing a minor upward
revision of less than 10,000 b/d from the pre-
vious month.
The revision was experienced in the first
quarter, mainly to adjust for updated produc-
tion data. The other quarters’ supply estimates
remained relatively unchanged, as the percep-
tion of a better performance demonstrated by
the data offsets the anticipated lower output
by the Long Lake projected, due to the upgrader
shutdown of more than a week in August.
During the first half of 2010, the data indi-
cates that only non-conventional oil produc-
tion experienced an increase of 80,000 b/d,
while crude oil and NGL production declined
by 30,000 b/d and 40,000 b/d, respectively.
On a quarterly basis, Canada’s supply is
forecast to average 3.24m b/d, 3.27m b/d, 3.24m
b/d and 3.30m b/d, respectively.
According to actual production data, oil
output from Mexico in the first half of 2010
strongly indicated stabilization of supply.
Compared with the same period in 2009,
production in the first half of 2010 experi-
enced a decline of less than one per cent, or
30,000 b/d. However, reports that production
declined in the first half of August, compared
with a month earlier, cast some doubts regard-
ing the endurance of the output steadiness in
the coming period, especially as the decline
is coming from Mexico’s two major producing
projects, ie Ku-Maloob-Zaap and Cantarell.
Experts are voicing apprehensions whether
KMZ was developed too quickly, in an approach
that would hinder the project’s lasting output
level, which increases the risk associated with
the forecast for 2010.
Mexico’s oil supply is anticipated to decline
by 60,000 b/d in 2010 to average 2.92m b/d,
flat from the previous month. On a quarterly
basis, Mexico’s oil supply is seen to stand at
2.99m b/d, 2.97m b/d, 2.88m b/d and 2.82m
b/d, respectively.
According to preliminary data, Mexico’s
oil supply averaged 2.96m b/d in July, slightly
higher than in the previous month.
OECD Western Europe total oil supply is
predicted to decline 250,000 b/d and average
4.46m b/d in 2010, indicating an upward revi-
sion of 20,000 b/d, compared with the previ-
ous month.
The upward revision was supported mainly
by the upward revision of the UK forecast. The
supply situation remains relatively unchanged
with declines expected by all of the major pro-
ducers in the region.
On a quarterly basis, supply is forecast to
average 4.68m b/d, 4.39m b/d, 4.30m b/d and
4.49m b/d, respectively.
Preliminary data indicates that OECD
Western Europe supply stood at 4.53m b/d in
the first half of 2010, a decline of 320,000 b/d
compared with the same period in 2009.
Output from Ekofisk, Statfjord and Gullfaks
improved in July compared with a month earlier,
according to preliminary production data, as
the heavy maintenance work comes to an end.
Despite the return from maintenance, espe-
cially of the Ekofisk, which in July increased by
200,000 b/d from the previous month, July total
oil supply indicated a decline of 310,000 b/d,
or 13 per cent, compared with the same month
in 2009.
Norway’s oil supply is forecast to decline
by 140,000 b/d in 2010 to average 2.20m b/d,
indicating a minor upward revision of less than
10,000 b/d, compared with a month earlier.
Adjustment to updated production data,
as well as expectation of the start-up of the
Gjoa and Vega developments, supported the
upward revision, while reduced output from
the Oseberg and Heidrun fields on technical
grounds partially offset the upward revision.
On a quarterly basis, Norway’s supply is
seen to average 2.31m b/d, 2.10m b/d, 2.13m
b/d and 2.27m b/d, respectively.
Better-than-expected production data from
the UK in the second quarter, supported by a
better performance by small fields, such as
Thistle and Don, required an upward revision
of 40,000 b/d to the forecast compared with
the previous month.
Oil supply from the UK is predicted to aver-
age 1.41m b/d in 2010, a decline of 70,000 b/d
over 2009.
In addition to the healthy supply data in
the second quarter, the new well at the Ettrick
field, as well as the successful testing of the
Blackbird development that will be tied back
to Ettrick to maintain peak production, is sup-
porting the upward revision.
According to preliminary data, supply in the
UK in the first half of 2010 indicated a decline
of 140,000 b/d, compared with the same period
last year.
On a quarterly basis, UK oil supply is seen
to average 1.51m b/d, 1.41m b/d, 1.35m b/d and
1.39m b/d, respectively.
Preliminary supply data indicated lower out-
put from the Danish Underground Consortium in
July from a month earlier, mainly due to mainte-
nance work, with fields like Valdemar indicating
a relatively heavy decline.
Hence, Denmark’s oil supply forecast was
revised down by 10,000 b/d compared with
the previous month to average of 240,000 b/d
in 2010, a decline of 30,000 b/d over 2009.
Similarly, the projection for Other Western
Europe supply was revised down on anticipa-
tion of lower biodiesel output as production
was pressured by margins being affected by
imports.
Total OECD Pacific oil supply is expected
to remain relatively flat from the previous year
to average 630,000 b/d in 2010, unchanged
from the month before.
OECD Pacific supply is anticipated to increase
in the second half of 2010 supported mainly
by Australia. Oil production in the first quarter
indicated a decline of 20,000 b/d compared
with a year ago, according to preliminary data.
On a quarterly basis, total OECD Pacific
supply is seen to average 610,000 b/d,
600,000 b/d, 640,000 b/d and 670,000 b/d,
respectively.
Recently established fields, such as the Van
Gogh and Pyrenees, are expected to ramp up
and improve supply in the second half of 2010.
In late August, the Ravensworth developments,
part of the Pyrenees projected, started up and
is expected to peak at 30,000 b/d.
57
OPE
C bu
lleti
n 10
/10
Australian oil production is foreseen to
remain relatively steady in 2010 over 2009
and average 530,000 b/d, unchanged from the
previous month.
Despite the steady state, there was a minor
downward revision to second quarter supply on
adjustment to production data, yet the revision
did not affect the annual figure.
Australia’s oil supply is expected to increase
in the second half of 2010, as the production
in the first half indicated a decline of 30,000
b/d, compared with the same period last year.
The various operational set-ups delayed
any growth in the first half; however, output is
expected to improve in the second half of the
year.
On a quarterly basis, Australian oil supply is
forecast to average 510,000 b/d, 500,000 b/d,
540,000 b/d and 570,000 b/d, respectively.
Developing Countries’ oil supply is pro-
jected to increase by 300,000 b/d in 2010 to
average 12.86m b/d, relatively steady from the
previous month with only a minor downward
revision of 10,000 b/d.
Overall supply conditions within the group
remain unchanged with growth in 2010 coming
from Latin America and the Middle East, while
Other Asia and Africa supply are expected to
remain flat.
Brazil, Colombia, India and Oman are the
main contributors to anticipated Developing
Country supply growth.
On a quarterly basis, Developing Countries’
supply is estimated to average 12.88m b/d,
12.91m b/d, 12.81m b/d and 12.85m b/d,
respectively.
According to preliminary data, Developing
Countries’ first half oil supply indicated growth
of 410,000 b/d, compared with the same period
last year.
Preliminary data indicates that output from
Other Asia achieved minor growth of 40,000
b/d in the first half of 2010, compared with the
same period in 2009.
Among the group, only India is expected
to show oil supply growth in 2010, while other
countries’ supply forecasts are ranging between
steady and declining in 2010.
The East Belumut field in Malaysia resumed
operation after four weeks of shutdown on a
pipeline leak incident. Malaysia’s oil supply is
forecast to decline by 40,000 b/d in 2010 and
average 690,000 b/d, unchanged from a month
earlier.
The anticipated decline is projected despite
the start-up of the biofuels plant at Kuantan. In
Thailand, the start-up of the Prachinburi biofu-
els project is expected in the fourth quarter of
2010, yet supply is anticipated to drop 30,000
b/d in 2010 to average 340,000 b/d.
Indonesia’s supply was reported lower in
July compared with the previous month on tech-
nical issues at different fields, with oil supply
expected to average 1.03m b/d in 2010, flat
from the previous year.
Oil supply from Other Asia is believed to
decline by 10,000 b/d in 2010 to average 3.69m
b/d, indicating a minor downward revision of
less than 10,000 b/d compared with a month
ago.
On a quarterly basis, Other Asia oil supply
is seen to stand at 3.73m b/d, 3.70m b/d, 3.67m
b/d and 3.66m b/d, respectively.
Despite the safety upsets, whereby the
Brazilian government ordered the shutdown of
P-33, Brazil’s oil supply is forecast to continue
to experience strong growth with 210,000 b/d
in 2010 for an average of 2.71m b/d, broadly
unchanged from the previous month.
The projected growth is supported by
healthy production in July, as well as the return
of P-43 to operation from maintenance and the
start-up of production from new wells as the
FPSO Cidade de Santos.
According to preliminary data, Argentina’s
oil supply increased by 20,000 b/d in the first
half of 2010 compared with the same period
in 2009. However, Argentina’s supply is fore-
cast to decline annually by 10,000 b/d, where
second-half supply is estimated to drop, due to
mature area decline.
Colombia’s oil supply is expected to
increase by 110,000 b/d in 2010 to aver-
age 790,000 b/d, representing a minor
upward revision, mainly on strong production
figures.
Latin America’s oil supply is foreseen to
increase by 300,000 b/d in 2010 to average
4.71m b/d, indicating a slight upward revision
over the previous month.
On a quarterly basis, Latin America’s oil sup-
ply is predicted to stand at 4.64m b/d, 4.71m
b/d, 4.72m b/d and 4.78m b/d, respectively.
Middle East oil supply remained relatively
unchanged compared with last month, with
minor changes to the second quarter on updated
production data that offset each other.
Oil supply from the Middle East is seen to
average 1.76m b/d in 2010, representing growth
of 30,000 b/d.
The anticipated growth is supported only
by Oman, while other countries’ supply is seen
to either remain flat, or decline.
Oman’s oil supply is expected to increase by
50,000 b/d in 2010 to average 860,000 b/d,
further supported by the projected start-up in
the second half of 2010 of the Farha develop-
ment in block-3.
Preliminary data indicates that oil supply
in the first half of 2010 increased by 30,000
b/d from the same period a year earlier.
On a quarterly basis, Middle East oil supply
is expected to average 1.77m b/d, 1.77m b/d,
1.75m b/d and 1.73m b/d, respectively.
According to preliminary data, Africa’s
oil supply in the first half of 2010 remained
unchanged compared with a year ago.
Compared with the previous assessment,
Africa’s oil supply forecast experienced a minor
downward revision of less than 10,000 b/d,
mainly on the back of adjustments to updated
production data.
Egypt and Sudan’s supply forecasts saw
minor downward revisions on updated data.
“Developing Countries’
oil supply is projected
to increase by 300,000
b/d in 2010 to average
12.86m b/d ...”

58
OPE
C bu
lleti
n 10
/10
Ma
rke
t R
ev
iew Sudan’s output is expected to drop by 10,000
b/d in 2010 to average 460,000 b/d. The down-
ward revision came despite reports of the start-
up of a new field at Block 6.
Congo’s oil supply experienced the only
upward revision within the region, mainly on
the expectation of new wells at the Azurite
development.
Congo’s oil supply is estimated to increase
by 20,000 b/d in 2010 to average 300,000 b/d.
Growth is anticipated despite the encountered
technical problems.
Africa’s oil supply is expected to average
2.70m b/d in 2010, representing a minor decline
of 10,000 b/d over last year.
On a quarterly basis, Africa’s oil supply is
seen to average 2.74m b/d, 2.72m b/d, 2.68m
b/d and 2.68m b/d, respectively.
Former Soviet Union total oil supply is
expected to grow by 280,000 b/d in 2010 to
average 13.24m b/d, indicating an upward revi-
sion of 30,000 b/d compared with the previous
month.
The upward revision came from all the
major producers in the region with Russia con-
tributing the largest share. There was a down-
ward revision to the FSU Others forecast that
was offset by other upward revisions in the
region.
In terms of regional growth, total FSU sup-
ply in 2010 comes behind only North America
and Latin America.
During the first half of 2010, FSU oil pro-
duction increased by 450,000 b/d over the
same period in 2009.
On a quarterly basis, total oil supply in the
FSU is estimated to average 13.12m b/d, 13.18m
b/d, 13.28m b/d and 13.37m b/d, respectively.
Separately, Other Europe supply is antic-
ipated to remain flat from 2009 to average
140,000 b/d in 2010.
Russia’s oil supply fell in August from the
record-high level seen in July, according to pre-
liminary data, marking the lowest output level
since January.
The lower supply came on the back of
maintenance at the Sakhalin-1 project, as well
as other areas.
However, oil supply is projected to increase
in September as the major maintenance work
has been completed.
Russia’s oil supply is expected to increase
by 170,000 b/d in 2010 to average 10.09m b/d,
representing an upward revision of 20,000 b/d,
compared with the previous month.
The continuing healthy production level
supported the upward revision as well as the
start-up of the small volume field of Lineynoye
and the anticipated increase in production of
Yuzhno-Khylchuyskoye.
Vankor field production, which has fuelled
Russia’s oil supply growth since it started up in
August 2009, is reported to be stabilizing close
to the June production level.
On a quarterly basis, Russia’s oil supply is
expected to average 10.09m b/d, 10.12m b/d,
10.10m b/d and 10.06m b/d, respectively.
Russia’s oil supply stood at 10.07m b/d
in August, lower by 80,000 b/d from a month
earlier.
Tengiz oil field output was curtailed on the
back of maintenance; however, maintenance
has ended and the export programme is sug-
gesting higher output in September.
However, maintenance at Karachaganak
is expected to reduce Kazakhstan’s output in
September.
Kazakh oil supply is estimated to increase
by 80,000 b/d in 2010 to average 1.67m b/d,
indicating a minor upward revision of 10,000
b/d compared with last month.
The healthy level of production, along with
reports that the government expects output to
exceed initial targets, is further supporting the
upward revision. Oil supply in the first half of
2010 indicated growth of 90,000 b/d, com-
pared with a year ago, according to the avail-
able data.
On a quarterly basis, Kazakhstan’s oil sup-
ply is estimated to average 1.61m b/d, 1.56m
b/d, 1.62m b/d and 1.67m b/d, respectively.
Oil supply from Azerbaijan in the first half
of 2010 experienced only a minor increase of
10,000 b/d, compared with a year ago.
However, both the Gunashli and East Azeri
fields at the Azeri-Chirag-Gunashli are produc-
ing less than the 2010 target; hence, the poten-
tial for supply growth remains strong.
Azeri oil supply is projected to increase by
50,000 b/d to average 1.10m b/d in 2010, rep-
resenting a minor upward revision of 10,000
b/d. compared with the previous month.
The revision in the second quarter was to
adjust for updated production data. Quarterly
supply stands at 1.01m b/d, 1.09m b/d, 1.13m
b/d and 1.19m b/d, respectively.
According to preliminary data, FSU Others
oil supply declined by 30,000 b/d in the first
half of 2010, compared with the same period
the previous year.
The drop required a downward revision
that affected the supply in the second half of
the year to remain below expectation.
FSU Other oil supply is foreseen to aver-
age 430,000 b/d, a minor downward revision
of 10,000 b/d from the previous month.
During the first half of 2010, China’s oil
supply increased by 230,000 b/d over 2009.
Despite the expectation of lower output in
the second half of the year, the healthy level of
growth, as well as preliminary production fig-
ures for July, necessitated the upward revision.
Oil supply from China is projected to grow
by 180,000 b/d in 2010 to average 4.03m b/d,
an upward revision of 10,000 b/d over the pre-
vious month.
The start-up of the shallow water Bozhong
19-4 field in Bohai Bay, with an expected peak
of 200,000 b/d within 2010, is supporting
growth. Additionally, the resumption of produc-
tion from 12 per cent of the wells in the Liaohe
field, which had been shut down due to flood-
ing is further supporting the upward revision.
Moreover, reports of the expected start-up
of the small Hainan Yuedong project has added
to this growth.
On a quarterly basis, China’s oil supply is
seen to average 4.02m b/d, 4.09m b/d, 4.01m
b/d and 3.98m b/d, respectively.
Turning to 2011, the OPEC report said non-
OPEC oil supply next year is forecast to increase
by 360,000 b/d to average 52.42m b/d.
Although growth remained relatively
unchanged, the total level was revised up by
150,000 b/d over the previous month. The
majority of this revision came due to changes
to 2010 supply estimates.

59
OPE
C bu
lleti
n 10
/10
Brazil, Canada, Azerbaijan, Colombia and
Kazakhstan are seen to be major contributors
to growth in 2011, while Norway, Mexico and
the UK are seen to continue to decline.
Risks to the forecast remain high, partially
due to the effect of the Gulf of Mexico deep
water moratorium, natural decline, as well as
technical, political and environmental factors.
On a quarterly basis, non-OPEC sup-
ply in 2011 is anticipated to average 52.31m
b/d, 52.19m b/d, 52.27m b/d and 52.91m b/d,
respectively.
The non-OPEC supply forecast in 2011 expe-
rienced a relatively minor upward revision, with
projected growth revised by 20,000 b/d, com-
pared with the previous month.
While the supply estimates for many coun-
tries in 2011 changed, growth for only a few
countries has changed, as the majority of the
revisions were done to the base.
Mexico, Oman and Equatorial Guinea
encountered minor upward revisions, while
supply forecasts for Norway and Sudan expe-
rienced minor downward revisions.
Mexico’s oil supply was revised up slightly
on production stabilization. Equatorial Guinea
supply projections showed an upward revision,
supported by the expected start-up of the Aseng
and Alen fields.
Norway and Sudan’s oil supply forecasts
were revised slightly down following a re-eval-
uation of the anticipated decline rate in 2011.
OPEC oil production
Total OPEC crude oil production averaged
29.15m b/d in August, down by 40,000 b/d
from the previous month, according to sec-
ondary sources.
OPEC production in the month, not includ-
ing Iraq, stood at 26.80m b/d, down by 40,000
b/d from the previous month.
Crude oil production from Angola, Saudi
Arabia, and Venezuela increase by more than
10,000 b/d in August, while crude output from
Iran, Kuwait, Nigeria, and the UAE decreased
by more than 10,000 b/d.
OPEC output of NGLs and non-conventional
oils are forecast to grow by 450,000 b/d in
2010 to average 4.80m b/d, representing a
downward revision of 30,000 b/d from the
previous month.
In 2011, output of OPEC NGLs and non-
conventional oils are expected to increase by
500,000 b/d over the previous year to average
5.30m b/d.
Downstream activity
Looking downstream, the OPEC report said
uncertainties about the pace of economic
growth and product stocks considerably above
historical levels at the end of the driving sea-
son kept pressure on product markets, mainly
in the Atlantic basin.
The oversupply was concentrated in the
gasoline market, as distillates resisted inven-
tory pressure, due to stronger demand across
the board.
Fuel oil kept the previous month’s gains,
driven by Singapore bunker demand. The sup-
port gained from distillates and fuel oil avoided
a deeper drop in refining margins.
As the cut in refinery runs is not likely to
offset the pressure of the stock overhang, the
persisting situation in the product markets could
continue into the coming season, if economic
growth indicators are insufficient to support
demand sentiment.
Refining margins for WTI crude oil on the
US Gulf Coast fell further in August, dropping
from $5.25/b to $4.12/b.
In Europe, the refining industry continued
restraining crude runs in an effort to protect
margins; however, the bearish gasoline market
caused a slight drop, with the margin for Brent
crude in Rotterdam falling slightly from $2.4/b
to $2/b in August.
In Asia, the very bearish naphtha sentiment
from July changed in mid-August on the back of
stronger demand from the petrochemical sector
and expectations of short supply in the coming
months.
Refining margins for Dubai crude oil in
Singapore fell slightly from $1.7/b in July to
$1.4/b in August.
US refiners cut runs in a failed effort for
recovering the margins lost in July, but this
could not change the bearish perception amid
an overhang of counter-seasonal stocks.
European refiners kept throughputs moder-
ate, considering the risk of a saturated market.
Asian refiners have finished the maintenance
period and utilization rates are on the rise.
Refinery utilization rates in the US dropped
to 88 per cent, the lowest level in two months.
The product overhang and the limited arbitrage
to other regions generated bearish sentiment,
mainly in gasoline at the end of the season,
impacting margins.
European refiners have kept moderate uti-
lization rates, in an effort to protect margins.
According to preliminary data, European refin-
ery utilization rates have remained in line with
the previous month at around 85 per cent.
In Asia, after seasonal maintenance fin-
ished, refinery throughputs are on the rise.
Looking ahead, the seasonal maintenance
of some refineries could not offset high spare
refining capacity around the world. In an over-
supplied market characterized by depressed
demand, refining operational levels are not
expected to rise significantly in the coming
months.
The approaching end of the peak driving
season and the growing overhang in inven-
tories made refiners reduce throughputs in a
failed effort to recover margins lost in July.
According to the Energy Information
Administration, US gasoline demand remained
relatively high in August with growth of 62,000
b/d y-o-y.
However, the pressure exerted by oversup-
ply across the Atlantic Basin, due to a surplus in
Europe, as well as the very bearish sentiment in
the market during the second week of August,
due to bad economic news, caused the gasoline
crack spread on the US Gulf Coast to continue
falling from a five-month low of $12.8/b in July
to $9.4/b in August.
Middle distillate demand in the US rose
slightly, mainly to store heating oil for the
winter season, taking into account the market
contango structure and export opportunities to
Latin America, Africa and Europe.

60
OPE
C bu
lleti
n 10
/10
Ma
rke
t R
ev
iew Despite the record-high stock levels, this
gave sufficient support to the gasoil market to
recover ground lost in July and the US gasoil
crack at the Gulf Coast rose to $10/b at the end
of August, representing a sharp improvement
from the $6/b seen in the latter part of July.
Oil trade
According to preliminary data, US crude oil
imports averaged 9.65m b/d in August, down by
3.23 per cent from July and 9.5 per cent higher
than in the same month last year.
The decline in monthly imports reflects
the end of the driving season which has been
reflected in lower refining runs.
Year-to-date, US crude oil imports averaged
9.45m b/d, up by 2.9 per cent from the same
period last year.
Crude oil imports in the US have experi-
enced mixed patterns during 2010, with drops
during January–March resulting in a moderate
annual increase reflecting the modest economic
recovery.
US product imports grew by 11.87 per cent
m-o-m to 2.86m b/d in August. Almost all prod-
ucts saw gains in imports, except for jet fuel
imports, which declined by 4.5 per cent from
the previous month to stand at 77,500 b/d.
Gasoline saw the highest imports in August
with 1.15m b/d, an increase of 1.9 per cent over
the previous month, followed by fuel oil with
604,000 b/d.
The increase in gasoline imports is also
reflected in the increase in motor gasoline
stocks.
On the exports side, US oil product exports
remained broadly unchanged since the previ-
ous month, down slightly by 16,000 b/d.
Product exports in August reached 2.04m
b/d. The small decline mirrors the cut in refin-
ing runs.
Fuel oil exports are responsible for most of
product exports cuts with 1.08m b/d in August,
down by 2.3 per cent from the previous month.
Gasoline exports, on the other hand, expe-
rienced an increase of 21.6 per cent.
Year-to-date, US product exports averaged
2.11m b/d, up by 8.1 per cent from the same
period last year, mostly due to higher refin-
ing run rates, as well as the global oil demand
recovery.
As a result, US crude oil and total product
net imports averaged 10.43m b/d in August,
almost the same as in the previous month.
Net crude oil imports were 322,000 b/d
lower than in July, averaging 9.62m b/d, while
net product imports reached 817,000 b/d, or
64.19 per cent more than a month earlier.
According to the latest official data, US
crude oil imports from OPEC averaged 5.19m
b/d in June, up by 10.7 per cent from May and
20.7 per cent higher than the same month a
year ago.
Canada continued to be the top supplier
of crude to the US during June, reaching 2.2m
b/d, or ten per cent more than in the previous
month.
Saudi Arabian deliveries of crude to the
US rose by 23.3 per cent to 1.35m b/d, reach-
ing second place among top suppliers of crude
to the US.
US crude imports from Nigeria grew 6.2 per
cent to 1.06m b/d, reaching the same level as
Mexico, which experienced a significant decline
of 17.4 per cent. Venezuela and Iraq were next
in line with 850,000 b/d and 630,000 b/d,
respectively.
On the product exports side, Mexico prod-
uct imports from the US reached 432,000 b/d
in June, becoming the best purchaser of US
products.
The Netherlands product imports from the
US grew by 59.8 per cent to 195,000 b/d, thus
jumping to second place. Canada came third in
the product importers list with 164,000 b/d,
just 15,000 b/d over Brazil which experienced
an increase of 79.5 per cent.
OPEC product imports from the US reached
105,000 b/d. Ecuador imported 91,000 b/d,
followed by Nigeria with 12,000 b/d.
US deliveries of products to Venezuela were
only 2,000 b/d, reaching third place among
OPEC product importers from US.
US product imports from OPEC Countries
dropped by 10.4 per cent. Algerian product
exports to the US increased by 5.4 per cent in
June to 175,000 b/d, while Venezuelan deliver-
ies of products reached 48,000 b/d and Nigeria
43,000 b/d.
Canada also remained the top oil product
supplier to the US in June, averaging 535,000
b/d, up 5,000 b/d on the month.
Russian product exports to the US decreased
by 10.5 per cent to 323,000 b/d, while Virgin
Island product supplies grew by 26.4 per cent
to 244,000 b/d.
According to preliminary data, Japan’s crude
oil imports increased by 12.3 per cent m-o-m
during July to 3.58m b/d.
Crude imports increased by 1.3 per cent
over the same month last year. The monthly
increase is attributed to higher refining runs
at the end of the heavy maintenance season.
During the first seven months of the year,
Japanese crude oil imports averaged 3.71m b/d,
an increase of 1.3 per cent over the same period
last year. Import declines in February and June
offset the increase seen during the rest of the
year.
OPEC crude oil deliveries to Japan increased
by 14.3 per cent m-o-m in July to 3.0m b/d, com-
pared with the same month last year.
Japanese crude oil imports from OPEC
declined by 1.1 per cent. Despite the reduc-
tion of 11.9 per cent in Saudi Arabia’s deliver-
ies of crude oil to Japan, the Kingdom remained
Japan’s top crude supplier, accounting for 24.2
per cent with 864,600 b/d.
Imports from the UAE, Japan’s second-larg-
est crude supplier in July, rose by 22.8 per cent
m-o-m and 2.3 per cent y-o-y to 755,700 b/d,
while imports from Iran were up 50.1 per cent
m-o-m to 460,100 b/d, making it the country’s
third-largest supplier for the month.
Qatar’s crude oil deliveries also declined
on a monthly basis by 1.9 per cent to 429,000
b/d, thus being the fourth-largest crude supplier
to Japan.
Russia is the only non-OPEC country among
the five top suppliers of oil to Japan, and with
313,000 b/d experienced an increase of 41.4
per cent on its deliveries in July.
On a yearly basis, Russian crude oil deliv-
eries to Japan more than doubled the volume
of a year ago, mainly to increased imports of
61
OPE
C bu
lleti
n 10
/10
ESPO crude. Japan’s ESPO crude import vol-
ume in July was the highest since the country
recorded its first imports of ESPO.
Japan’s product imports dropped by 4.1
per cent in the month to 940,000 b/d, up by
five per cent from the same month last year.
The monthly decline is partly a consequence
of higher domestic refining runs, which is also
reflected in higher product exports.
In the period January to July, Japanese prod-
uct imports averaged 945,800 b/d, up by 14.5
per cent from the same period last year.
Gasoline imports decreased in the month
by 40.9 per cent to 13,000 b/d as exports
increased by 15.2 per cent to 34,000 b/d,
reflecting the increasing refining activity seen
during the month.
Diesel imports increased by 3,100 b/d to
14,000 b/d and exports grew by 44.1 per cent
to 249,000 b/d as a result of the increasing
demand in Asia, as well as remaining high inter-
national prices.
In July, naphtha imports increased to
509,000 b/d from the 430,000 b/d seen in
June, mostly due too higher refining runs. Fuel
oil imports increased by 31.5 per cent m-o-m
and exports decreased by 7.1 per cent, due to
high refining activity.
Increasing nuclear activities continue
impacting fuel oil imports, which on a yearly
basis showed a 30.8 per cent decline.
LPG imports dropped by 26.9 per cent in
the month to 345,000 b/d as result of high
refining activity.
Japan’s oil product exports increased by
16.7 per cent in July to 605,000 b/d. The
increase is the consequence of higher refin-
ing activity, combined with fragile domestic
demand and high international prices of gaso-
line and diesel, which strongly contributed to
the total product export increase.
As result, Japan’s net oil imports in July
stood at 3.91m b/d, representing an increase
of 265,000 b/d, or 7.3 per cent, from June, and
78,000 b/d, or two per cent, higher than in the
same month last year.
Year-to-date, Japanese net oil imports aver-
aged 4.14m b/d, 4.8 per cent higher than in the
same period last year.
China’s crude oil imports fell in July for the
first time in 16 months. Crude imports averaged
4.49m b/d, down by 3.2 per cent y-o-y.
Imports in July were 17.4 per cent, down
from the record high 5.44m b/d imported by
China during June.
The decline was mainly due to lower crude
throughput on the closure of Dalian Xingang
port, caused by a crude pipeline blast and inten-
sive turnarounds of major refineries in the third
quarter.
During the first seven months of the year,
China imported 4.74m b/d on average, up by
24.1 per cent compared with the same period
in 2009.
The country boosted crude imports as
domestic refining capacity was expanding and
crude reserve storages increased.
Nevertheless, it is expected that crude
imports are likely to fall during the second half of
this year because of the Chinese government’s
policies on eliminating real estate speculation.
China imported 881,000 b/d of oil products
in July, down by 23.3 per cent from the same
month last year, and down 19.1 per cent from June.
Product exports reached 742,000 b/d, an
increase of 24.7 per cent over a year ago.
On year-to-date basis, China’s product
imports decreased by 11.6 per cent to an aver-
age of 968,000 b/d, as result of higher refin-
ing runs.
Fuel oil imports declined by 25 per cent in
July to 425,000 b/d, with most of the decline
noticed in South China, where the significant
drop was attributed to the popularity of a feed-
stock cutback of bitumen among Guangdong
minor refineries which was used as a substi-
tute for straight-run fuel oil. Exports of fuel
oil increased significantly by 41 per cent to
250,000 b/d.
Gasoline exports averaged 87,000 b/d dur-
ing July, a sharp decline of 24 per cent from June,
while up six per cent y-o-y.
Gasoline exports declined as refiners
retained more gasoline for the domestic mar-
ket in the summer high season.
China exported 262,000 b/d of diesel in
July, almost four times the amount of diesel
exported a month earlier.
Chinese refiners boosted gasoil exports in
July to ease inventory pressure, as domestic
sales were sluggish. Imports of diesel grew 44
per cent m-o-m to almost 30,000 b/d.
China’s naphtha exports sharply declined
by 53 per cent in July from the previous month
to 16,000 b/d. Naphtha exports declined
as chemical plants reduced operation rates
on gloomy crude and chemical markets.
Naphtha exports declined by 23 per cent to
48,000 b/d.
Jet fuel exports dropped by 13 per cent in
July from the previous month to 140,000 b/d.
China trimmed jet fuel exports in the month
as refiners in East China needed to meet robust
demand around the World Expo in Shanghai,
also due to the impact of the pipeline explo-
sion in Dalian.
China’s crude oil imports from OPEC
decreased by 13.15 per cent in July on a monthly
basis, reflecting the cut in crude oil imports.
OPEC deliveries of crude oil to China
averaged 2.83m b/d during July. Saudi Arabia
became the biggest crude supplier to China
again in July, hiking crude exports by 7.7 per
cent m-o-m to 965,000 b/d.
Angola remained in second place with
536,000 b/d of crude oil deliveries to China,
dropping by 41 per cent from a month earlier.
China also experienced a significant
decrease in its imports from Venezuela, Kuwait,
Iraq and Nigeria, while imports from Iran and
Libya showed positive growth.
Non-OPEC countries contributed only 37
per cent of total China crude oil imports in July.
Russian exports to China decreased by 16 per
“China’s crude oil imports
fell in July for the first
time in 16 months. Crude
imports averaged 4.49m
b/d, down by 3.2 per cent
y-o-y.”

62
OPE
C bu
lleti
n 10
/10
Ma
rke
t R
ev
iew cent from June, while Oman experienced an
increase of 18 per cent.
China’s net oil imports in June stood at
4.59m b/d, indicating a decrease of 1.28m b/d,
or 22 per cent, from the previous month.
On a yearly basis, China’s net oil imports
decreased 502,000 b/d, or by 9.9 per cent.
From January to July, net oil imports in China
averaged 4.98m b/d for a gain of 16.6 per cent
over the same period last year.
India’s crude oil imports rose to 3.12m b/d
during July, up 31.6 per cent from the same
month last year and 1.9 per cent higher than a
month earlier.
The increasing demand for crude oil was
attributed to higher refining runs, which are
also reflected in the increasing exports of oil
products.
Despite private refineries experiencing a
drop in refining runs, state refineries increased
refining activity, offsetting the private sector
cuts.
Year-to-date, India’s crude oil imports aver-
aged 3.02m b/d, up by 12 per cent from the
same period last year.
The rise is partly attributed to increasing
domestic refining activity, as well as to stronger
demand for products on a national level.
Oil product imports grew by 68.5 per cent
m-o-m during July. Most of the increase was seen
in gasoline imports, which rose by 42,000 b/d
over June, reflecting the increasing car fleet in
the country.
Naphtha imports increased by 41,000 b/d
as feedstock for refineries, while diesel imports
decreased by 43.7 per cent as Indian state refin-
eries increased the amount of local production
of diesel.
During the first seven months of the year,
India’s product imports averaged 336,000 b/d,
4.5 per cent less than in the same period in
2009.
The drop in product imports is the result
of higher domestic refining activities.
India’s oil product exports, including
Reliance Industries’ exports, averaged 1.18m
b/d during July, up 13.3 per cent compared
with June. The increase in state refinery prod-
uct exports offset the reduction from private
refineries.
Fuel oil exports increased by 42.1 per cent
and became the biggest contributor to product
export growth.
Naphtha exports increased by 23.4 per cent,
while gasoline exports remained almost at the
same level with a slight increase.
Diesel exports decreased insignificantly by
0.7 per cent as jet fuel exports dropped by 11.8
per cent in July.
India’s net oil imports rose to 2.41m b/d in
July, up 4.8 per cent from the previous month
and 5.3 per cent higher than a year ago.
Net product imports increased 6.9 per
cent m-o-m, reflecting the increase in product
exports.
FSU crude oil exports in July increased by
4.7 per cent over the previous month to 6.99m
b/d, just 27,000 b/d lower than May’s record
high of 7.01m b/d.
The growth reflects a large increase in
shipments along the Transneft system to Black
Sea ports and Druzhba destinations and a hike
in Kazakh exports on the Caspian Pipeline
Consortium (CPC) route and by rail to Georgian
and Ukrainian ports.
Russian pipeline crude oil exports rose by
8.5 per cent m-o-m to 4.26m b/d, reflecting
the cut in export duty by $30/t to $248.80/t.
A large rise in Novorossiysk–Black Sea exports
was offset by lower loadings at Baltic ports and
Kozmino.
The increase at Novorossiysk reflected the
release of stored crude, which was stocked
up during the previous month by exporters.
Primorsk—Baltic exports were limited by main-
tenance along pipelines that lead to the port,
triggering higher loadings at Pivdenne, the most
expensive route for Russian crude exporters.
Tengizchevroil (TCO) increased Russian
rail exports of Tengiz to the Black Sea ports of
Odessa, Feodosiya and Batumi, as maintenance
ended at the field in western Kazakhstan. This
also accounted for the rise in deliveries through
the CPC pipeline.
Exports to the Iranian port of Neka stopped,
as supplies of Turkmen crude were pumped
through the BTC pipeline instead. A number
of Turkmen crude cargoes continue to load at
Georgian ports.
Exports from Russia’s Sakhalin Island
dropped mostly due to the fall in shipments
of Sokol and Vityaz grades. YK Blend exports
from Russia’s Barents Sea port of Varandey
decreased by 6,000 b/d.
Year-to-date crude oil exports averaged
6.82m b/d, an increase of 2.9 per cent over a
year ago. Most of the yearly increase is attrib-
uted to the rise in Vityaz exports from Russia’s
Sakhalin Island, and the launch of ESPO Blend
exports from the Pacific port of Kozmino.
Russian seaborne crude exports were
expected to grow by 3.5 per cent in August
to 2.83m b/d and then decline in September
because of maintenance at Primorsk, the coun-
try’s biggest Baltic port, and with zero shipments
out of the Ukrainian Black Sea port of Yuzhny.
This would result in expectations for similar
levels of FSU crude oil exports during August
and lower crude oil exports during September.
Overall product exports from FSU increased
in July by 6.9 per cent over the previous month
to 3.0m b/d.
Exports of all products were up except naph-
tha which experienced a decline. Most of the
increase was due to the reduction in Russian
export duties at the beginning of the month, as
exporters stored up products in June in prepa-
ration for the cut in taxes.
Gasoline exports in July grew by only 1.5
per cent m-o-m, remaining at low levels, as
the modest export of gasoline is attributed to
strong domestic demand.
FSU fuel oil and gasoil exports rose in July
after a fall in Russian export duties. Fuel oil
exports rose compared with a year ago because
of the new Novoshakhtinsk refinery and the
expansion of the Antipinsky plant.
Higher output at several smaller refineries
“India’s crude oil imports rose
to 3.12m b/d during July, up
31.6 per cent from the same
month last year ...”

63
OPE
C bu
lleti
n 10
/10
also boosted exports. Gasoil exports rose in July,
mostly due to the cut in clear product export
duties.
Year–to-date, overall product exports from
the FSU averaged 3.14m b/d, an increase of 3.5
per cent compared with a year ago.
The increase partly reflects improved navi-
gation conditions as a consequence of higher
water levels in rivers. Fuel oil shipments rose
substantially in the Baltic, particularly through
Estonia’s Tallinn.
Stock movements
Concerning stock movements, at the end of
August, US commercial oil inventories contin-
ued their upward trend for the fifth consecu-
tive month, increasing by 18.4m b and adding
almost 80m b to stocks over this period.
At 1,143.3m b, US commercial stocks are
at their highest level since January 1993. With
this build, the surplus has widened with the
five-year average to 122.5m b, or 12 per cent,
from ten per cent a month earlier.
This build has also reversed the deficit with
a year ago, which has been holding since the
beginning of this year, to now show a surplus
of 33.7m b, or three per cent.
The bulk of the build in total commercial
oil stocks came from products, which increased
by 14.7m b, followed by crude, which rose by
3.7m b.
At 361.7m b, US crude oil stocks continued
their contra-seasonal build to reach the high-
est level since April 2009 and representing an
overhang of 53m b, or 17 per cent, above the
five-year average and 26m b, or 7.8 per cent,
higher than a year ago.
This build is driven by the fall in crude oil
input to refineries by almost 700,000 b/d to
14.8m b/d, which corresponds to a refinery uti-
lization rate of 87 per cent.
Crude refinery input ended August at the
lowest level since 1996. This indicates that
refiners are taking into account that the peak
of the driving season is coming to an end and
that the huge product oversupply is starting to
impact the refinery industry.
Lower runs have contributed to the relative
recovery in cracking margins.
The build in crude came despite the
170,000 b/d drop in crude oil imports to
average 9.6m b/d. Crude stocks at Cushing,
Oklahoma, fell 500,000 b at the end of August.
Although this figure is below that of early
August, the level of stocks still remained within
historical records.
On the product side, US product stocks rose
significantly in August for the fifth consecutive
month to stand at 781.6m b, the highest since
September 2009.
With this build, the overhang with the five-
year average widened to around 70m b, or 9.8
per cent, from 8.4 per cent a month earlier.
Product stocks at the end of August are
7.6m b, or one per cent, above a year ago.
Gasoline and distillates rose by 2.4m b
and 5.5m b, respectively, while fuel oil and jet
fuel stocks fell by 500,000 b and 400,000 b,
respectively.
The build in gasoline stocks to 225.4m b
came on the back of higher imports, keeping
total volumes above 1.1m b/d.
Gasoline demand remained almost
unchanged at 9.4m b/d, but the end of the
summer season is likely to undermine gasoline
demand in the coming weeks.
Gasoline stocks stood 8.5 per cent above a
year ago and 12.9 per cent above the five-year
average.
Distillate stocks continued to rise, ending
the month of August at 175.2m b, leaving them
at a very comfortable level of 3.9 per cent above
the previous year and 28.4 per cent higher than
the historical average. Higher distillate produc-
tion averaging 4.4m b/d was behind this build.
Demand saw a surprising spike, rising more
than 4.0m b/d in August, in line with the ISM
manufacturing index, which was much better
than expected.
Residual fuel and jet fuel oil stocks stood
at 39.7m b and 48.3m b, respectively, both well
above the seasonal norm.
Looking forward and with the continually
increasing oversupply in both crude and prod-
ucts, the market will likely struggle to find bull-
ish news to support crude prices.
Commercial oil inventories in Japan
reversed the slight stock-draw observed last
month and increased 2.5m b to 178.0m b, the
highest level since July 2009.
With the exception of the small decline in
June of 200,000 b, Japanese oil stocks have
increased since March, accumulating more than
22m b.
Despite this build, Japanese commercial
stocks remained slightly lower by 500,000 b,
or 0.3 per cent, than a year ago and 8m b, or
4.3 per cent, below the five-year average.
The build was divided between crude and
products as they increased by 1.5m b and 1.1m
b, respectively.
At 106m b, Japanese crude oil inventories
stood at their highest level since February 2009
to show a build of five consecutive months,
accumulating around 20m b over this period.
This build has pushed the surplus with a
year ago to 1.6 per cent; however, the deficit
with the historical average remained at seven
per cent.
The build in commercial crude stocks came
on the back of higher crude oil imports of 12.3
per cent versus the previous month, to average
3.6m b/d.
Crude oil imports were also higher by 1.3
per cent, compared with the previous year at the
same time. This build came despite an increase
of crude throughput of about 400,000 b/d to
average 3.45m b/d.
This corresponds to a refinery utilization
rate of 74.4 per cent, an increase of 10.6 per
cent versus the previous month. The rise in
refinery runs came as seasonal maintenance
ended.
In coming months, Japanese crude oil stocks
could see a further build as some refiners are
expended to process less crude as a gloomy
economic picture is having a negative impact
on oil demand growth.
On the products side, Japanese product
inventories in July reversed the downward trend
observed last month to increase by 1.1m b to
stand at 71.9m b.
Despite this build, product stocks remained
at 2.2m b, or three per cent, below a year ago,
but remained in line with the seasonal average.

64
OPE
C bu
lleti
n 10
/10
Ma
rke
t R
ev
iew The build in products came despite an
increase of total oil product sales, which rose
by 5.3 per cent versus the previous month and
4.6 per cent above a year ago in the same
month.
The rise in oil sales in July was partly due
to the strong rise of 11.4 per cent in gasoline
sales. Within products, the picture was mixed;
distillates and naphtha stocks saw a build, while
gasoline and fuel oil stocks declined.
Distillate stocks rose by 2.4m b to 29.9m b,
but remained 13.6 per cent below a year ago and
9.4 per cent lower than the five-year average.
All the components of distillates rose.
Indeed, Jet fuel oil stocks went up by 7.6 per
cent on the back of higher production, which
increased by 13 per cent.
Gasoil stocks rose by 2.8 per cent, driven
by higher output and imports as they increased
by 26 per cent and 33 per cent, respectively.
Kerosene stocks rose by 15.2 per cent on
the back of lower domestic sales, declining by
5.2 per cent, combined with higher production
of 14 per cent.
Naphtha stocks increased by 2.1m b
to 14.2m b. This build could be attributed
to healthy imports and production as they
increased by 22 per cent and 12 per cent,
respectively.
Naphtha stocks stood at almost 30 per cent
above a year ago at the same time.
Gasoline stocks fell by 2.0m b to 12.4m b,
driven by strong domestic gasoline demand,
which increased by 15.1 per cent versus the
previous month.
The strong rise in domestic gasoline sales
is attributed to the hot summer. Gasoline stocks
remained in line with the historical norm, but
still 5.2 per cent below a year ago.
Fuel oil stocks declined by 1.3m b to 15.5m
b, pushing the deficit with the five-year aver-
age to 20.5 per cent, while remaining only 0.8
per cent below a year ago in the same period.
Fuel oil A and fuel oil BC declined by 6.1 per
cent and 9.6 per cent, respectively. The drop
in fuel oil A stocks could be attributed to the
2.5 per cent decline in production, combined
with a 16.5 per cent increase in exports, while
the 33 per cent increase in domestic sales was
behind the drop in fuel oil BC inventories.
Preliminary data from PAJ showed Japanese
total commercial oil stocks declined by 4.7m b
to 173.3m b at the end of August, reversing the
upward trend observed last month.
With this stock-draw, the deficit with a year
ago widened to 4.6 per cent from 0.5 per cent
a month earlier, while the gap with the histori-
cal norm stood at 9.8 per cent.
The drop was driven by a substantial 8.8m
b fall in crude oil stocks, while product inven-
tories abated this draw as they increased by
4.1m b.
The drop in crude oil stocks to 97.3m b put
them at the lowest level since April. This drop
could be attributed to the rise in refinery runs
as utilization rates rose by 1.2 per cent to 82.1
per cent and stood at 6.8 per cent above a year
earlier in the same period.
The drop has widened the deficit with the
historical norm to 12.4 per cent from 6.9 per
cent a month ago.
Total products rose to 76.0m b, with the
exception of a 2.0m b fall in naphtha. The bulk
of the build in product stocks came from fuel
oil and distillate inventories as they increased
by 3.0m b and 2.6m b, respectively, while gaso-
line stocks saw a slight build of 500,000 b.
Despite this build, total product stocks
remained at 4.6 per cent below a year ago and
6.2 per cent lower than the seasonal norm.
At the end of July, product stocks held in
Singapore reversed the upward trend observed
in the previous month and declined by 1.31m b
to 46.92m b, leaving them 6m b, or nearly 15
per cent, above a year ago.
Light distillate and fuel oil stocks saw a
decline of 1.1m b and 700,000 b, respectively,
while middle distillates rose by 560,000 b.
Light distillate stocks fell to 10.3m b, the low-
est level since February 2010.
This drop was mainly due to lower
imports from China on the back of strong
demand. It was reported that Chinese exports
have fallen to around 403,000 tons from
nearly 700,000 tons in April, the peak of this
year.
Light distillate stocks dropped to 21.2m b,
but remained well above a year ago, indicating
a surplus of 5.6m b. The drop could be attrib-
uted to lower exports from the Middle East, due
to a tighter domestic market.
In contrast, middle distillates rose to 15.5m
b, indicating a surplus of 1.3m b, or nine per
cent, with the previous year. This build is driven
by a sharp increase in post-supply mainte-
nance, which outweighed imports to India and
Indonesia.
Product stocks in Amsterdam-Rotterdam-
Antwerp ARA at the end of July reversed the
trend observed the previous month and declined
by almost 2m b to 35.9m b.
Despite this drop, product stocks in ARA
remained a slight 400,000 b, or 1.2 per cent,
above a year ago.
With the exception of gasoil, all other prod-
ucts fell. The bulk of this decline came from
fuel oil, which declined by 1.48m b to 3.9m b,
mainly due to higher exports.
Fuel oil stocks remained well above a year
ago, showing a surplus of 1.6 per cent.
The fall in gasoline was relatively small to
stand at 7.7m b, but remained 26 per cent higher
than a year ago.
Jet fuel and naphtha stocks declined by
600,000 b and 200,000 b, respectively, to
5.9m b and 300,000 b. However, they rose
compared with a year ago.
In fact, jet fuel stocks showed a surplus of
9.5 per cent, while naphtha stocks indicated a
deficit of almost 40 per cent.
Gasoil stocks went up slightly by 270,000
b to 18.05m b on the back of higher imports
from Russia and the US. Gasoil oil stocks stood
at ten per cent below a year ago.
“Japanese total commercial
oil stocks declined by 4.7m
b to 173.3m b at the end
of August, reversing the
upward trend observed
last month.”
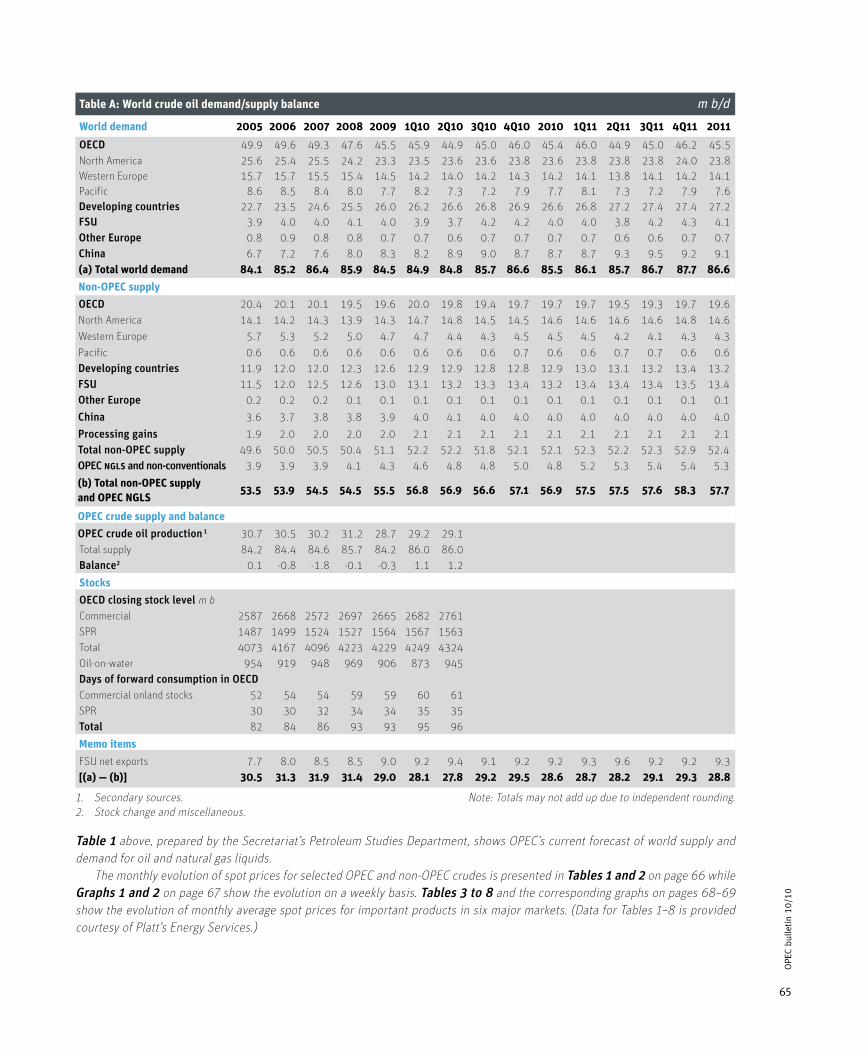
65
OPE
C bu
lleti
n 10
/10
1. Secondary sources. Note: Totals may not add up due to independent rounding.2. Stock change and miscellaneous.
Table 1 above, prepared by the Secretariat’s Petroleum Studies Department, shows OPEC’s current forecast of world supply and demand for oil and natural gas liquids. The monthly evolution of spot prices for selected OPEC and non-OPEC crudes is presented in Tables 1 and 2 on page 66 while Graphs 1 and 2 on page 67 show the evolution on a weekly basis. Tables 3 to 8 and the corresponding graphs on pages 68–69 show the evolution of monthly average spot prices for important products in six major markets. (Data for Tables 1–8 is provided courtesy of Platt’s Energy Services.)
World demand 2005 2006 2007 2008 2009 1Q10 2Q10 3Q10 4Q10 2010 1Q11 2Q11 3Q11 4Q11 2011
OECD 49.9 49.6 49.3 47.6 45.5 45.9 44.9 45.0 46.0 45.4 46.0 44.9 45.0 46.2 45.5North America 25.6 25.4 25.5 24.2 23.3 23.5 23.6 23.6 23.8 23.6 23.8 23.8 23.8 24.0 23.8Western Europe 15.7 15.7 15.5 15.4 14.5 14.2 14.0 14.2 14.3 14.2 14.1 13.8 14.1 14.2 14.1Pacific 8.6 8.5 8.4 8.0 7.7 8.2 7.3 7.2 7.9 7.7 8.1 7.3 7.2 7.9 7.6Developing countries 22.7 23.5 24.6 25.5 26.0 26.2 26.6 26.8 26.9 26.6 26.8 27.2 27.4 27.4 27.2FSU 3.9 4.0 4.0 4.1 4.0 3.9 3.7 4.2 4.2 4.0 4.0 3.8 4.2 4.3 4.1Other Europe 0.8 0.9 0.8 0.8 0.7 0.7 0.6 0.7 0.7 0.7 0.7 0.6 0.6 0.7 0.7China 6.7 7.2 7.6 8.0 8.3 8.2 8.9 9.0 8.7 8.7 8.7 9.3 9.5 9.2 9.1(a) Total world demand 84.1 85.2 86.4 85.9 84.5 84.9 84.8 85.7 86.6 85.5 86.1 85.7 86.7 87.7 86.6
Non-OPEC supply
OECD 20.4 20.1 20.1 19.5 19.6 20.0 19.8 19.4 19.7 19.7 19.7 19.5 19.3 19.7 19.6North America 14.1 14.2 14.3 13.9 14.3 14.7 14.8 14.5 14.5 14.6 14.6 14.6 14.6 14.8 14.6Western Europe 5.7 5.3 5.2 5.0 4.7 4.7 4.4 4.3 4.5 4.5 4.5 4.2 4.1 4.3 4.3Pacific 0.6 0.6 0.6 0.6 0.6 0.6 0.6 0.6 0.7 0.6 0.6 0.7 0.7 0.6 0.6Developing countries 11.9 12.0 12.0 12.3 12.6 12.9 12.9 12.8 12.8 12.9 13.0 13.1 13.2 13.4 13.2FSU 11.5 12.0 12.5 12.6 13.0 13.1 13.2 13.3 13.4 13.2 13.4 13.4 13.4 13.5 13.4Other Europe 0.2 0.2 0.2 0.1 0.1 0.1 0.1 0.1 0.1 0.1 0.1 0.1 0.1 0.1 0.1China 3.6 3.7 3.8 3.8 3.9 4.0 4.1 4.0 4.0 4.0 4.0 4.0 4.0 4.0 4.0Processing gains 1.9 2.0 2.0 2.0 2.0 2.1 2.1 2.1 2.1 2.1 2.1 2.1 2.1 2.1 2.1Total non-OPEC supply 49.6 50.0 50.5 50.4 51.1 52.2 52.2 51.8 52.1 52.1 52.3 52.2 52.3 52.9 52.4OPEC ngls and non-conventionals 3.9 3.9 3.9 4.1 4.3 4.6 4.8 4.8 5.0 4.8 5.2 5.3 5.4 5.4 5.3
(b) Total non-OPEC supply and OPEC Ngls
53.5 53.9 54.5 54.5 55.5 56.8 56.9 56.6 57.1 56.9 57.5 57.5 57.6 58.3 57.7
OPEC crude supply and balance
OPEC crude oil production 1 30.7 30.5 30.2 31.2 28.7 29.2 29.1 Total supply 84.2 84.4 84.6 85.7 84.2 86.0 86.0 Balance2 0.1 -0.8 -1.8 -0.1 -0.3 1.1 1.2
stocks
OECD closing stock level m bCommercial 2587 2668 2572 2697 2665 2682 2761SPR 1487 1499 1524 1527 1564 1567 1563Total 4073 4167 4096 4223 4229 4249 4324Oil-on-water 954 919 948 969 906 873 945Days of forward consumption in OECDCommercial onland stocks 52 54 54 59 59 60 61SPR 30 30 32 34 34 35 35Total 82 84 86 93 93 95 96
Memo items
FSU net exports 7.7 8.0 8.5 8.5 9.0 9.2 9.4 9.1 9.2 9.2 9.3 9.6 9.2 9.2 9.3[(a) — (b)] 30.5 31.3 31.9 31.4 29.0 28.1 27.8 29.2 29.5 28.6 28.7 28.2 29.1 29.3 28.8
Table A: World crude oil demand/supply balance m b/d
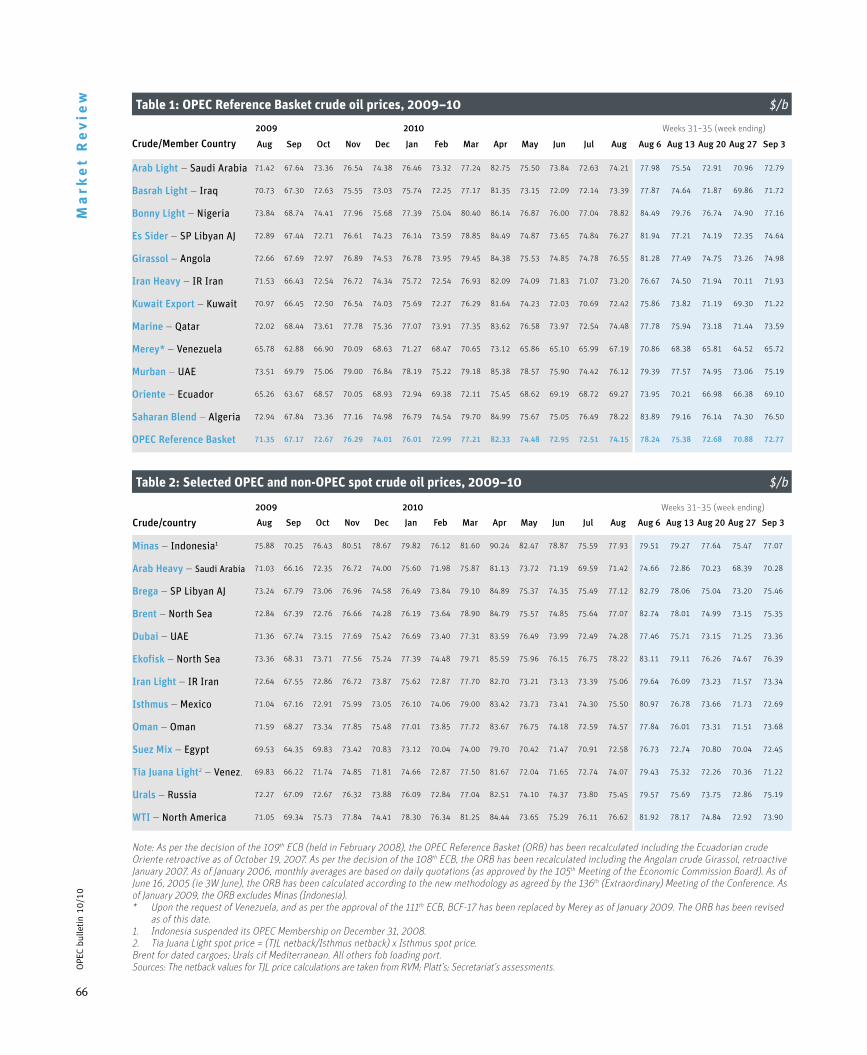
66
OPE
C bu
lleti
n 10
/10
Ma
rke
t R
ev
iew
2009 2010 Weeks 31–35 (week ending)
Crude/country Aug Sep Oct Nov Dec Jan Feb Mar Apr May Jun Jul Aug Aug 6 Aug 13 Aug 20 Aug 27 Sep 3
Minas — Indonesia1 75.88 70.25 76.43 80.51 78.67 79.82 76.12 81.60 90.24 82.47 78.87 75.59 77.93 79.51 79.27 77.64 75.47 77.07
Arab Heavy — Saudi Arabia 71.03 66.16 72.35 76.72 74.00 75.60 71.98 75.87 81.13 73.72 71.19 69.59 71.42 74.66 72.86 70.23 68.39 70.28
Brega — SP Libyan AJ 73.24 67.79 73.06 76.96 74.58 76.49 73.84 79.10 84.89 75.37 74.35 75.49 77.12 82.79 78.06 75.04 73.20 75.46
Brent — North Sea 72.84 67.39 72.76 76.66 74.28 76.19 73.64 78.90 84.79 75.57 74.85 75.64 77.07 82.74 78.01 74.99 73.15 75.35
Dubai — UAE 71.36 67.74 73.15 77.69 75.42 76.69 73.40 77.31 83.59 76.49 73.99 72.49 74.28 77.46 75.71 73.15 71.25 73.36
Ekofisk — North Sea 73.36 68.31 73.71 77.56 75.24 77.39 74.48 79.71 85.59 75.96 76.15 76.75 78.22 83.11 79.11 76.26 74.67 76.39
Iran Light — IR Iran 72.64 67.55 72.86 76.72 73.87 75.62 72.87 77.70 82.70 73.21 73.13 73.39 75.06 79.64 76.09 73.23 71.57 73.34
Isthmus — Mexico 71.04 67.16 72.91 75.99 73.05 76.10 74.06 79.00 83.42 73.73 73.41 74.30 75.50 80.97 76.78 73.66 71.73 72.69
Oman — Oman 71.59 68.27 73.34 77.85 75.48 77.01 73.85 77.72 83.67 76.75 74.18 72.59 74.57 77.84 76.01 73.31 71.51 73.68
Suez Mix — Egypt 69.53 64.35 69.83 73.42 70.83 73.12 70.04 74.00 79.70 70.42 71.47 70.91 72.58 76.73 72.74 70.80 70.04 72.45
Tia Juana Light2 — Venez. 69.83 66.22 71.74 74.85 71.81 74.66 72.87 77.50 81.67 72.04 71.65 72.74 74.07 79.43 75.32 72.26 70.36 71.22
Urals — Russia 72.27 67.09 72.67 76.32 73.88 76.09 72.84 77.04 82.51 74.10 74.37 73.80 75.45 79.57 75.69 73.75 72.86 75.19
WTI — North America 71.05 69.34 75.73 77.84 74.41 78.30 76.34 81.25 84.44 73.65 75.29 76.11 76.62 81.92 78.17 74.84 72.92 73.90
2009 2010 Weeks 31–35 (week ending)
Crude/Member Country Aug Sep Oct Nov Dec Jan Feb Mar Apr May Jun Jul Aug Aug 6 Aug 13 Aug 20 Aug 27 Sep 3
Arab Light — Saudi Arabia 71.42 67.64 73.36 76.54 74.38 76.46 73.32 77.24 82.75 75.50 73.84 72.63 74.21 77.98 75.54 72.91 70.96 72.79
Basrah Light — Iraq 70.73 67.30 72.63 75.55 73.03 75.74 72.25 77.17 81.35 73.15 72.09 72.14 73.39 77.87 74.64 71.87 69.86 71.72
Bonny Light — Nigeria 73.84 68.74 74.41 77.96 75.68 77.39 75.04 80.40 86.14 76.87 76.00 77.04 78.82 84.49 79.76 76.74 74.90 77.16
Es Sider — SP Libyan AJ 72.89 67.44 72.71 76.61 74.23 76.14 73.59 78.85 84.49 74.87 73.65 74.84 76.27 81.94 77.21 74.19 72.35 74.64
Girassol — Angola 72.66 67.69 72.97 76.89 74.53 76.78 73.95 79.45 84.38 75.53 74.85 74.78 76.55 81.28 77.49 74.75 73.26 74.98
Iran Heavy — IR Iran 71.53 66.43 72.54 76.72 74.34 75.72 72.54 76.93 82.09 74.09 71.83 71.07 73.20 76.67 74.50 71.94 70.11 71.93
Kuwait Export — Kuwait 70.97 66.45 72.50 76.54 74.03 75.69 72.27 76.29 81.64 74.23 72.03 70.69 72.42 75.86 73.82 71.19 69.30 71.22
Marine — Qatar 72.02 68.44 73.61 77.78 75.36 77.07 73.91 77.35 83.62 76.58 73.97 72.54 74.48 77.78 75.94 73.18 71.44 73.59
Merey* — Venezuela 65.78 62.88 66.90 70.09 68.63 71.27 68.47 70.65 73.12 65.86 65.10 65.99 67.19 70.86 68.38 65.81 64.52 65.72
Murban — UAE 73.51 69.79 75.06 79.00 76.84 78.19 75.22 79.18 85.38 78.57 75.90 74.42 76.12 79.39 77.57 74.95 73.06 75.19
Oriente — Ecuador 65.26 63.67 68.57 70.05 68.93 72.94 69.38 72.11 75.45 68.62 69.19 68.72 69.27 73.95 70.21 66.98 66.38 69.10
Saharan Blend — Algeria 72.94 67.84 73.36 77.16 74.98 76.79 74.54 79.70 84.99 75.67 75.05 76.49 78.22 83.89 79.16 76.14 74.30 76.50
OPEC Reference Basket 71.35 67.17 72.67 76.29 74.01 76.01 72.99 77.21 82.33 74.48 72.95 72.51 74.15 78.24 75.38 72.68 70.88 72.77
Table 2: selected OPEC and non-OPEC spot crude oil prices, 2009–10 $/b
Table 1: OPEC Reference Basket crude oil prices, 2009–10 $/b
Note: As per the decision of the 109th ECB (held in February 2008), the OPEC Reference Basket (ORB) has been recalculated including the Ecuadorian crude Oriente retroactive as of October 19, 2007. As per the decision of the 108th ECB, the ORB has been recalculated including the Angolan crude Girassol, retroactive January 2007. As of January 2006, monthly averages are based on daily quotations (as approved by the 105th Meeting of the Economic Commission Board). As of June 16, 2005 (ie 3W June), the ORB has been calculated according to the new methodology as agreed by the 136th (Extraordinary) Meeting of the Conference. As of January 2009, the ORB excludes Minas (Indonesia).* Upon the request of Venezuela, and as per the approval of the 111th ECB, BCF-17 has been replaced by Merey as of January 2009. The ORB has been revised
as of this date.1. Indonesia suspended its OPEC Membership on December 31, 2008.2. Tia Juana Light spot price = (TJL netback/Isthmus netback) x Isthmus spot price.Brent for dated cargoes; Urals cif Mediterranean. All others fob loading port.Sources: The netback values for TJL price calculations are taken from RVM; Platt’s; Secretariat’s assessments.
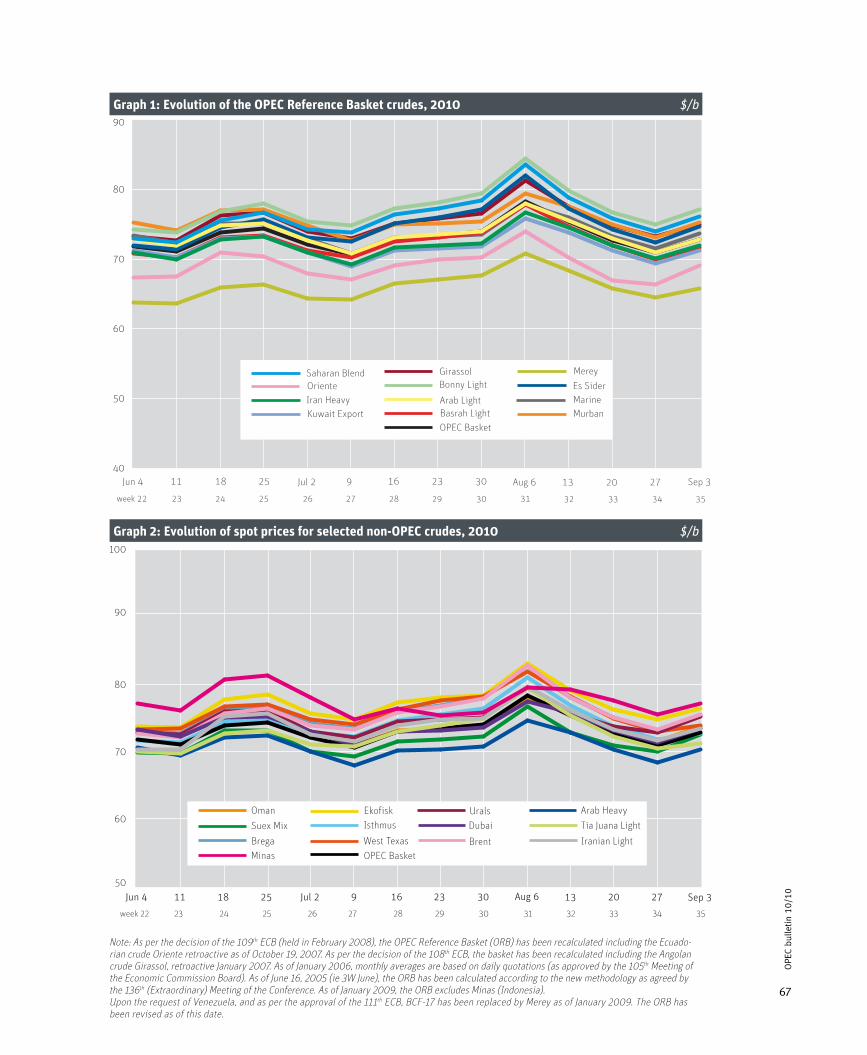
67
OPE
C bu
lleti
n 10
/10
40
50
60
70
80
90
Oriente
OPEC Basket
Girassol
MurbanMarineEs SiderMerey
Basrah LightArab Light
Bonny Light
Kuwait ExportIran Heavy
Saharan Blend
35 343332313029282726252423week 22
Sep 313 27Jun 4 11 202518 Jul 2 9 16 23 30 Aug 6
50
60
70
80
90
100
35343332313029282726252423week 22
Minas
Iranian Light
Tia Juana LightDubai
Brega
Arab Heavy
OPEC Basket
Urals
West Texas
Isthmus
Ekofisk
Brent
Suex Mix
Oman
Jun 4 3023 Aug 6 13 2720 Sep 311 2518 Jul 2 169
graph 1: Evolution of the OPEC Reference Basket crudes, 2010 $/b
graph 2: Evolution of spot prices for selected non-OPEC crudes, 2010 $/b
Note: As per the decision of the 109th ECB (held in February 2008), the OPEC Reference Basket (ORB) has been recalculated including the Ecuado-rian crude Oriente retroactive as of October 19, 2007. As per the decision of the 108th ECB, the basket has been recalculated including the Angolan crude Girassol, retroactive January 2007. As of January 2006, monthly averages are based on daily quotations (as approved by the 105th Meeting of the Economic Commission Board). As of June 16, 2005 (ie 3W June), the ORB has been calculated according to the new methodology as agreed by the 136th (Extraordinary) Meeting of the Conference. As of January 2009, the ORB excludes Minas (Indonesia).Upon the request of Venezuela, and as per the approval of the 111th ECB, BCF-17 has been replaced by Merey as of January 2009. The ORB has been revised as of this date.

68
naphtharegular
gasolineunleaded
premium gasoline 50ppm
dieselultra light jet kero fuel oil
1%Sfuel oil3.5%S
2009 August 70.85 72.78 83.06 79.99 79.89 67.78 66.21
September 65.82 65.55 74.81 74.77 76.57 64.52 62.96
October 69.17 68.89 79.16 81.60 82.53 68.35 66.93
November 74.60 72.67 83.50 83.25 85.40 73.68 71.03
December 75.35 70.59 79.68 81.62 83.56 69.02 68.36
2010 January 79.05 71.54 84.65 84.11 86.46 72.55 71.29
February 75.07 72.19 83.11 81.53 83.38 69.94 67.51
March 80.82 71.87 92.38 88.75 89.50 73.25 70.47
April 81.43 71.29 94.75 95.83 96.16 76.70 73.31
May 75.25 72.22 85.03 87.79 88.68 70.16 67.44
June 72.81 72.97 86.01 70.03 64.66 70.33 66.24
July 69.33 73.31 86.85 69.10 64.77 71.28 66.74
August 73.29 73.65 86.77 71.10 69.01 72.50 68.62
naphtha
premium gasoline50ppm
diesel ultra light
fuel oil1%S
fuel oil3.5%S
2009 August 69.32 24.55 31.98 68.04 66.86
September 64.30 22.77 29.66 64.92 63.10
October 67.57 24.32 31.68 68.18 67.11
November 72.83 26.21 34.15 72.97 71.00
December 73.04 26.29 34.25 69.92 68.20
2010 January 76.30 27.10 35.18 72.10 70.82
February 72.61 28.00 35.31 69.58 67.38
March 78.63 27.55 35.24 72.39 68.79
April 79.52 26.58 34.30 76.90 73.02
May 73.26 89.27 89.27 69.78 66.58
June 70.99 89.95 90.04 68.04 65.99
July 66.56 89.97 90.70 70.62 65.61
August 71.39 89.97 90.70 71.80 68.87
naphtha
regular gasoline
unleaded 87 gasoil jet kerofuel oil0.3%S
fuel oil2.2%S
2009 August 75.27 86.58 78.49 80.62 69.05 37.71
September 68.97 76.22 72.67 73.89 64.55 35.63
October 75.66 79.71 81.17 82.95 73.56 39.80
November 78.12 82.30 83.42 84.31 78.34 42.29
December 76.81 80.13 82.73 84.44 75.70 43.29
2010 January 77.68 85.54 86.11 88.23 76.17 42.67
February 78.10 83.34 83.05 84.96 76.68 42.74
March 77.27 89.13 87.63 90.51 77.38 42.16
April 76.76 94.96 92.79 95.13 79.53 42.63
May 75.77 88.39 85.69 88.03 80.00 42.95
June 76.62 84.12 85.41 89.91 72.06 46.84
July 75.19 83.78 83.14 86.31 73.83 67.26
August 76.05 81.74 84.83 88.71 77.47 68.63
Source: Platts. Prices are average of available days.
0
10
20
30
40
50
60
70
80
90
100
110
AugJulJunMayAprMarFebJanDecNovOctSepAug
fuel oil 3.5%Sfuel oil 1%S
jet kerodiesel
prem 100ppmreg unl 87
naphtha
Graph 3 Rotterdam
2009 2010
0
10
20
30
40
50
60
70
80
90
100
110
AugJulJunMayAprMarFebJanDecNovOctSepAug
fuel oil 3.5%Sfuel oil 1.0%S
dieselprem 50ppm
naphtha
Graph 4 South European Market
2009 2010
20102010
0
10
20
30
40
50
60
70
80
90
100
110
AugJulJunMayAprMarFebJanDecNovOctSepAug
fuel oil 2.2%Sfuel oil 0.3%S LPjet kero
gasoilreg unl 87
Graph 5 US East Coast Market
20092009
naphtha
Note: Prices of premium gasoline and diesel from January 1, 2008, are with 10 ppm sulphur content.
Table and graph 5: Us East Coast market — spot cargoes, New York $/b, duties and fees included
Table and graph 3: North European market — spot barges, fob Rotterdam $/b
Table and graph 4: south European market — spot cargoes, fob Italy $/b

69
naphtha gasoil jet kerofuel oil
2%Sfuel oil2.8%S
2009 August 74.51 24.93 80.47 64.29 62.76
September 68.22 23.20 74.72 60.96 59.45
October 74.90 25.78 82.99 65.50 63.97
November 77.85 26.46 84.70 70.04 66.96
December 78.45 26.18 84.67 68.60 66.96
2010 January 82.37 27.12 87.67 70.31 68.83
February 80.25 26.18 84.94 71.75 70.57
March 85.40 27.63 89.96 74.99 73.99
April 88.59 29.41 96.02 77.41 76.40
May 81.08 27.03 88.07 70.78 69.65
June 81.67 26.93 87.77 70.14 68.99
July 79.60 26.29 86.41 70.51 69.36
August 77.25 27.07 89.08 71.88 70.80
naphtha
premium gasoline unl 95
premium gasoline unl 92
dieselultra light jet kero
fuel oil180 Cst
fuel oil380 Cst
2009 August 70.37 82.13 80.13 80.34 78.67 68.23 68.03
September 66.80 75.63 73.84 75.80 74.58 66.36 66.30
October 69.20 77.71 76.05 81.95 80.07 68.85 68.86
November 76.21 81.89 79.88 85.29 83.24 72.84 72.90
December 78.28 81.85 78.95 82.69 83.24 72.79 72.65
2010 January 80.66 88.01 84.87 85.89 85.87 75.55 75.11
February 75.76 86.49 83.55 83.30 82.23 71.88 71.15
March 80.84 90.86 88.48 88.63 87.49 73.04 71.89
April 83.13 94.06 95.24 95.91 94.82 76.33 75.57
May 77.43 85.12 88.30 89.24 88.12 71.10 71.15
June 72.42 83.26 81.54 87.36 86.64 71.45 68.31
July 68.57 82.42 81.99 86.32 85.32 69.68 68.46
August 73.31 82.52 80.83 88.10 87.23 71.32 69.58
naphtha gasoil jet kerofuel oil180 Cst
2009 August 71.30 76.83 52.83 73.11
September 66.26 72.14 49.61 69.12
October 69.61 77.04 52.97 73.24
November 75.04 81.66 56.15 77.20
December 75.80 78.51 53.99 74.57
2010 January 79.49 81.77 54.45 78.10
February 75.51 80.07 54.73 74.31
March 81.27 85.71 54.59 75.66
April 81.87 93.51 54.48 79.88
May 75.69 86.17 89.27 74.46
June 73.25 66.40 89.31 65.72
July 69.77 66.77 90.26 66.69
August 73.73 68.03 91.20 68.10
Source: Platts. Prices are average of available days.
20092009
0
10
20
30
40
50
60
70
80
90
100
110
AugJulJunMayAprMarFebJanDecNovOctSepAug
fuel oil 2.0%Sfuel oil 2.8%S
gasoiljet keronaphtha
Graph 6 Caribbean Market
20102010
20102010
0
10
20
30
40
50
60
70
80
90
100
110
AugJulJunMayJunMayAprMarFebJanDecNovOctSepAug
fuel oil 380 Cstfuel oil 180 Cst
jet kerodiesel
prem unl 92prem unl 95
naphtha
Graph 7 Singapore
20092009
2009
0
10
20
30
40
50
60
70
80
90
100
110
AugJulJunMayAprMarFebJanDecNovOctSepAug
fuel oil 180 Cstjet keronaphtha gasoil
Graph 8 Middle East Gulf Market
2010
Table and graph 6: Caribbean market — spot cargoes, fob $/b
Table and graph 7: singapore market — spot cargoes, fob $/b
Table and graph 8: Middle East gulf market — spot cargoes, fob $/b

70
OPE
C bu
lleti
n 10
/10
No
tic
eb
oa
rdN
oti
ce
bo
ard Forthcoming events
Canadian unconventional resources and international petroleum conference, October 19–21, 2010, Calgary, AB, Canada. Details: Society of Petroleum Engineers, PO Box 833836, Richardson, TX 75083-3836, USA. Tel: +1 972 952 393; fax: +1 972 952 9435; e-mail: [email protected]; website: www.spe.org.
European future energy forum 2010, October 19–21, 2010, London, UK. Details: ExCeL London, One Western Gateway, Royal Victoria Dock, London E16 1XL, UK. Tel: +44 20 7069 5000; email: [email protected]; website: www.europeanfutureenergyforum.com.
Planning and economics of refinery operations, October 19–22, 2010, London, UK. Details: Energy Institute, 61 New Cavendish Street, London W1G 7AR, UK. Tel: +44 207 467 7116; fax: +44 207 580 2230; e-mail: [email protected]; website: www.energyinst.org.uk.
International exhibition electric and power infrastructure of the south of Russia, October 20–22, 2010, Krasnodar, Russia. Details: ITE Group plc, Oil and Gas Division, 105 Salusbury Road, London NW6 6RG, UK. Tel: +44 207 596 5233; fax: +44 207 596 5106; e-mail: [email protected]; website: ite-exhibitions.com.
5th lPg trade summit, October 25–26, 2010, Abu Dhabi, UAE. Details: Centre for Management Technology, 80 Marine Parade Road #13–02, Parkway Parade, 449269 Singapore. Tel: +65 6345 7322/6346 9132; fax: +65 6345 5928; e-mail: [email protected]; website: www.cmtevents.com.
Crude to bunkers, October 25–26, 2010, Singapore. Details: Conference Connection Administrators Pte Ltd, 105 Cecil Street #07–02, The Octagon, 069534 Singapore. Tel: +65 6222 0230; fax: +65 6222 0121; e-mail: [email protected]; website: www.cconnection.org.
ERTC hydrocracking training course, October 25–27, 2010, London, UK. Details: Global Technology Forum, Highview House, Tattenham Crescent, Epsom Downs, Surrey KT18 5QJ, UK. Tel: +44 1737 365100; fax: +44 1737 365101; e-mail: [email protected]; website: www.gtforum.com.
Overcoming petrophysical challenges in the Middle East reser-voirs, October 25–27, 2010, Dubai, UAE. Details: Society of Petroleum Engineers, Dubai Knowledge Village, Block 17, Offices S07-S09, PO Box 502217, Dubai, UAE. Tel: +971 4 390 3540; fax: +971 4 366 4648; e-mail: [email protected]; website: www.spe.org.
The 10th Annual energy Caribbean 2010, October 25–27, 2010, London, UK. Details: IBC Global Conferences, The Bookings Department, Informa UK Ltd, PO Box 406, West Byfleet KT14 6WL UK; Tel: +44 207 017 55 18; fax: +44 207 017 47 15; e-mail: [email protected]; website: www.ibcenergy.com.
Arctic oil and gas conference, October 26–28, 2010, Oslo, Norway. Details: IBC Global Conferences, The Bookings Department, Informa UK Ltd, PO Box 406, West Byfleet KT14 6WL UK; Tel: +44 207 017 55 18; fax: +44 207 017 47 15; e-mail: [email protected]; website: www.ibcenergy.com.
CIs oil and gas transportation, October 26–28, 2010, Istanbul, Turkey. Details: The Exchange Ltd, 5th Floor, 86 Hatton Garden, London EC1N 8QQ, UK. Tel: +44 207 067 1800; fax: +44 207 242 2673; e-mail:
[email protected]; website: www.theenergyex-change.co.uk.
Iraq mega projects, October 26–28, 2010, Istanbul, Turkey. Details: CWC Associates Ltd, Regent House, Oyster Wharf, 16–18 Lombard Road, London SW11 3RF, UK. Tel: +44 207 978 000; fax: +44 207 978 0099; e-mail: [email protected]; website: www.thecwcgroup.com.
Next-generation biofuels, October 26–28, 2010, Chicago, Il, USA. Details: Platts, 20 Canada Square, Canary Wharf, London E14 5LH, UK. Tel: +44 207 1766142; fax: +44 207 176 8512; e-mail: [email protected]; website: www.events.platts.com.
Russian oil and gas technical conference and exhibition, October 26–28, 2010, Moscow, Russia. Details: Society of Petroleum Engineers, Part Third Floor East, Portland House, 4 Great Portland Street, London W1W 8QJ, UK. Tel: +44 207 299 3300; fax: +44 207 299 3309; e-mail: [email protected]; website: www.spe.org.
strategic management of oil and gas assets and companies, October 26–28, 2010, London, UK. Details: Energy Institute, 61 New Cavendish Street, London W1G 7AR, UK. Tel: +44 207 467 7116; fax: +44 207 580 2230; e-mail: [email protected]; website: www.energyinst.org.uk.
Developing European gas supply infrastructure, October 27–28, 2010, Brussels, Belgium. Details: Platts, 20 Canada Square, Canary Wharf, London E14 5LH, UK. Tel: +44 207 1766142; fax: +44 207 176 8512; e-mail: [email protected]; website: www.events.platts.com.
gas to liquids 2010, October 27–28, 2010, London, UK. Details: SMi Group Ltd, Unit 122, Great Guildford Business Square, 30 Great Guildford Street, London SE1 0HS, UK. Tel: +44 207 827 6000; fax: +44 207 827 6001; e-mail: [email protected]; website: www.smi-online.co.uk.
singapore international energy week, October 27–November 4, 2010, Singapore. Details: Platts, 20 Canada Square, Canary Wharf, London E14 5LH, UK. Tel: +44 207 1766142; fax: +44 207 176 8512; e-mail: [email protected]; website: www.events.platts.com.
Appalachian gas, October 28–29, 2010, Pittsburgh, PA, USA. Details: Platts, 20 Canada Square, Canary Wharf, London E14 5LH, UK. Tel: +44 207 1766142; fax: +44 207 176 8512; e-mail: [email protected].
Financing Us power, October 28–29, 2010, New York, NY, USA. Details: Platts, 20 Canada Square, Canary Wharf, London E14 5LH, UK. Tel: +44 207 1766142; fax: +44 207 176 8512; e-mail: [email protected]; website: www.events.platts.com.
Natural gas dynamics, October 28–29, 2010, Singapore. Details: Conference Connection Administrators Pte Ltd, 105 Cecil Street #07–02, The Octagon, 069534 Singapore. Tel: +65 6222 0230; fax: +65 6222 0121; e-mail: [email protected]; website: www.cconnection.org.
Vietnam oil, gas and power, October 28–29, 2010, Hanoi, SR of Vietnam. Details: Centre for Management Technology, 80 Marine Parade Road #13–02, Parkway Parade, 449269 Singapore. Tel: +65 6345 7322/6346 9132; fax: +65 6345 5928; e-mail: [email protected]; website: www.cmtevents.com.

71
OPE
C bu
lleti
n 10
/10
V a c a n c y a n n o u n c e m e n t
Va
ca
nc
ies
Finance OfficerDeadline: October 19, 2010
Job dimensions:
Within the Finance & Human Resources Department, the Finance Section is responsible for all finan-cial matters and financial control functions at the Secretariat and ensuring financial integrity of the Organization as stipulated in the Financial Regulations.
The Finance Officer is responsible for financial matters and financial control functions at the Secretariat, ensuring financial integrity of the Organization in accordance with the objectives of the Section. He plans and manages financial resources of the Secretariat efficiently. Furthermore, he manages the work programme of the Finance Section and supervises and guides its staff.
Required competencies and qualifications:
— University degree (advanced degree preferred) in Accounting/Finance — A minimum of eight years (six years in case of an advanced degree) in accounting, finance and
budgeting — Training/specialization in accounting (managerial/financial accounting), finance (financial man-
agement preferred), cost and benefit analysis/budgeting and computer accounting systems — Analytical, communication and presentation skills
Status and benefits:
Members of the Secretariat are international employees whose responsibilities are not national but exclusively international. In carrying out their functions, they have to demonstrate the personal quali-ties expected of international employees such as integrity, independence and impartiality.
The post is at grade E, reporting to the Head of Finance & Human Resources Department. The com-pensation package, including expatriate benefits, is commensurate with the level of the post.
Applications:
Applicants must be nationals of Member Countries of OPEC and should not be older than 58 years. OPEC has a policy of non-discrimination.
Applicants are requested to fill in a résumé and an application form which can be received from their Country’s Governor for OPEC.
In order for applications to be considered, they must reach the OPEC Secretariat through the relevant Governor not later than October 19, 2010.

72
Ord
er
Fo
rmO
PEC
bulle
tin
10/1
0
OPEC Bulletinis published ten times/year and a subscription costs $70. Subscription commences with the current issue (unless otherwise requested) after receipt of
payment.
I wish to subscribe to the OPEC Bulletin for a one-year period
OPEC Monthly Oil Market ReportPublished monthly, this source of key information about OPEC Member Country output also contains the Secretariat’s analyses of oil and product
price movements, futures markets, the energy supply/demand balance, stock movements and global economic trends. $525 for an annual subscription
of 12 issues.
I wish to subscribe to the MOMR for a one-year period Please send me a sample copy
OPEC Annual Statistical Bulletin 2009This 144-page book, including colour graphs and tables, comes with a CD-ROM featuring all the data in the book and more (for Microsoft Windows only).
The book with CD-ROM package costs $85.
Please send me ................. copies of the OPEC Annual Statistical Bulletin 2009 (book plus CD-ROM)
OPEC Energy Reviewcontains research papers by international experts on energy, the oil market, economic development and the environment.
Available quarterly only from the commercial publisher.
For details contact: Blackwell Publishing Ltd, 9600 Garsington Road, Oxford OX4 2DQ, UK. Tel: +44 (0)1865 776868; fax: +44 (0)1865 714591;
e-mail: [email protected]; www.blackwellpublishing.com. Subscription rates for 2009: UK/Europe: individual £143, institutional £350;
The Americas: individual $159, institutional $589; Rest of world: individual £95, institutional £350.
Shipping address (please print in block letters): Invoicing address (if different from shipping address):
Name: Name:Address: Address:
How to pay:Invoice me Credit card (Visa, Eurocard/MasterCard and Diners Club)Credit card company: Credit card no: Expiry date:
Holder: Signature:
Please mail this form to:PR & Information Department or telefax to:OPEC Secretariat PR & Information DepartmentHelferstorferstrasse 17, A-1010 Vienna, Austria +43 1 211 12/5081
All prices include airmail delivery.
73
OPE
C bu
lleti
n 7–
8/10
To order, please fill in the form
OPEC BulletinAnnual subscription $70
Annual Report 2009Free of charge
World Oil Outlook 2009Free of charge
(published quarterly) annual sub-scription rates for 2009:UK/Europe: individual €143 institutional £350The Americas: individual $159 institutional $589Rest of world: individual £95 institutional £350Orders and enquiries: Blackwell Publishing Journals, 9600 Garsington Road, Oxford OX4 2DQ, UK.Tel: +44 (0)1865 776868Fax: +44 (0)1865 714591E-mail: jnlinfo@ blackwellpublishers.co.ukwww.blackwellpublishing.com
144-page book with CDSingle issue $85The CD (for MicrosoftWindows only) contains all the data in the book and much more.• Easy to install and display• Easy to manipulate and
query• Easy to export to spread-
sheets such as Excel
• Crude oil and product prices analysis
• Member Country output figures
• Stocks and supply/ demand analysis
Annual subscription $525 (12 issues)
OPEC offers a range of publications that reflect its activities. Single copies and subscriptions can be obtained by contacting this Department, which regular readers should also notify in the event of a change of address:
PR & Information Department, OPEC SecretariatHelferstorferstrasse 17, A-1010 Vienna, Austria
Tel: +43 1 211 12-0; fax: +43 1 211 12/5081; e-mail: [email protected]
OP
EC
Pu
bli
ca
tio
ns
OPEC Energy ReviewOPEC Monthly Oil Market Report
OPEC Annual statisticalBulletin 2009
Algeria
Iraq
Kuwait SP Libya
n AJ
Saudi Arabia
United Arab Emirates
VenezuelaOPEC
OPEC OPEC
OPEC
Total world
Total world
Total world
Total world
Algeria IR Iran Iraq
SP Libyan
AJ
Nigeria Qatar
Saudi Ara
bia
United Arab Emirates 1963 1971
1995
1965
2000
1963
1985
1963
2005
1975
OPEC
1976
b/dm$dwt GDP
%
miles%%
Organization of the Petroleum Exporting Countries
Annual Statistical Bulletin
2 0 0 9
FUELLING PROSPERIT
Y
SUPPORTING STABILITY
1960 2010
Iraq
September 2010
Feature Article:Forecasting oil demand in an uncertain economic environment
Oil market highlights
Feature article
Crude oil price movements
Commodity markets
World economy
World oil demand
World oil supply
Product markets and refinery operations
Tanker market
Oil trade
Stock movements
Balance of supply and demand
1
3
5
11
16
24
34
41
45
48
57
61
OPECOrganization of the Petroleum Exporting Countries
Monthly Oil Market Report
Tel +43 1 21112 Fax +43 1 2164320 E-mail: [email protected] Web site: www.opec.orgHelferstorferstrasse 17, A-1010 Vienna, Austria
OPEC Energy Review
Vol. XXXIV, No. 1 March 2010
The relationship between oil revenues and economic
growth, using threshold methods (the case of Iran)
Energy consumption and economic growth: causality
relationship for Nigeria
Econometric modelling for short-term oil price
forecasting
World aviation fuel demand outlook
Mohsen Mehrara, Majid Maki and Hossein Tavakolian
Suleiman Sa’ad
Antonio Merino and Rebeca Albacete
Mohammad Mazraati
Organization of the Petroleum Exporting Countries
Published and distributed on behalf of the Organization of the Petroleum Exporting Countries, Vienna
Printed in Singapore by Markono Print Media Pte Ltd.
OP
EC
Energy R
eview
Vol. X
XX
IV, N
o. 1 M
arch 2010
opec_v34_i1_cover_3.3mm.indd 1 4/7/2010 3:56:32 PM