Embed Size (px)
Citation preview
December 2009
Feature Article:Review of 2009, outlook for 2010
Oil market highlights
Feature article
Crude oil price movements
Commodity markets
Highlights of the world economy
World oil demand
World oil supply
Product markets and refinery operations
The tanker market
Oil trade
Stock movements
Balance of supply and demand
1
3
5
9
15
21
32
39
43
47
56
60
OPECOrganization of the Petroleum Exporting Countries
Monthly Oil Market Report
Tel +43 1 21112 Fax +43 1 2164320 E-mail: [email protected] Web site: www.opec.org
Data Summary OPECOrganization of the Petroleum Exporting Countries
Monthly Oil Market Report
Tel +43 1 21112 Fax +43 1 2164320 E-mail: [email protected] Web site: www.opec.org
Data Summary
Helferstorferstrasse 17, A-1010 Vienna, Austria

OPEC Monthly Oil Market Report
Publishing Schedule for 2010
Tuesday, 19 JanuaryWednesday, 10 FebruaryWednesday, 10 MarchWednesday, 14 April
Tuesday, 11 MayWednesday, 9 June
Thursday, 15 JulyFriday, 13 August
Thursday, 9 SeptemberTuesday, 12 October
Thursday, 11 NovemberFriday, 10 December
_________________________________________________________________________________________________________________________________________Monthly Oil Market Report
December 2009 1
Oil Market Highlights Crude oil prices rose in November supported by expectations for economic growth in the coming year and the positive impact on demand, as well as US dollar depreciation. The OPEC Reference Basket soared by $3.62/b or 5% to average $76.29/b in November. However, this bullish sentiment has been undermined in recent weeks, due to counterseasonal stock builds as well as the stronger US dollar. The Basket stood at $70.64/b on 14 December. The slow recovery in demand and increasing the risk of further stockbuilds due to the widening of contango is likely to continue to impact market sentiment in December.
The world economy is forecast to grow at a pace of 2.9% in 2010, following a contraction of 1.1% in 2009. Government support has helped to cushion the downturn this year and is expected to remain a main driver in 2010. However, this has come at a price of unprecedented debt to GDP ratios. While the OECD is expected to now grow at 1.3% in 2010, the bulk of growth next year will be contributed by non-OECD with China and India expected to grow at 8.5% and 6.5% respectively. The main challenges for 2010 will be the extent of the recovery in household consumption within the OECD as well as the health of the banking sector which still appears to need government support.
The year 2009 was one of the worst years for world oil demand. Consumption has recovered in the fourth quarter as a result of an improvement in economic activities worldwide, however, the forecast for global oil demand still shows a contraction of 1.4 mb/d in 2009, unchanged from the previous report. Following two years of sharp declines, world oil demand is expected to return to growth in 2010, with an increase of 0.8 mb/d following an upward revision of around 70 tb/d from the last assessment. Non-OECD countries will account for all of the increase. Downward risk factors that may put pressure on next year’s oil demand include the pace of the economic recovery in the OECD, especially in the US.
Non-OPEC oil supply is forecast to grow by 0.5 mb/d in 2009 following an upward revision of 0.1 mb/d from last month’s assessment. The main contributors to the revision are the USA, Canada, Russia, Azerbaijan and Kazakhstan. In 2010, non-OPEC oil supply is expected to increase by 0.3 mb/d over the current year, the bulk of which comes from Brazil, Azerbaijan, Kazakhstan, Colombia, and the USA. OPEC NGLs and non-conventional oils are expected to add 0.5 mb/d in 2010 following an increase of 0.4 mb/d in 2009. In November, OPEC crude production averaged 29.1 mb/d, according to secondary sources, an increase of 47 tb/d over the previous month.
Due to sluggish demand and high product inventories, refining economics remained weak in November, encouraging refiners to trim operation levels, especially in the Atlantic Basin. Cold weather in the coming months may provide some support for product markets and refining margins, but given the overhang in middle distillate inventories and the slow recovery in products demand, product market circumstances are not expected to support crude fundamentals.
OPEC spot fixtures and sailings from OPEC were relatively steady in November compared to October. Freight rates in the crude oil tanker market increased on average by 17% in November with the VLCC sector increasing by 13% and Suezmax by 22%. Volumes of both crude oil and petroleum products in floating storage were higher by the end of November. Clean spot freight rates were almost steady in November with a weaker East of Suez market.
OECD commercial oil inventories dropped 36 mb in October; the largest draw since February 2008 but remained around 80 mb above the five-year average. Preliminary data for November shows stocks remained almost unchanged, representing around 59 days of forward cover. US commercial oil stocks fell 1.4 mb for an overhang of 67 mb or 7%. Crude oil stocks added a further 1.3 mb and gasoline 5.8 mb while distillates fell slightly. Driven by crude oil, EU-16 total oil inventories rose 0.3 mb/d widening the overhang to 20 mb. Japan’s commercial oil stocks rose 3 mb in October before dropping in November to remain below the lower end of the five-year range.
The demand for OPEC crude in 2009 is estimated to average 28.6 mb/d, following a downward revision of 70 tb/d from the previous assessment to show a decline of 2.3 mb/d from last year. In 2010, demand for OPEC crude is expected to average 28.6 mb/d, an upward revision of around 100 tb/d from the previous month and representing a slight increase of 30 tb/d.

Monthly Oil Market Report______________________________________________________________________
December 2009 2
_______________________________________________________________________________________________________________________________________________Monthly Oil Market Report
December 2009 3
Review of 2009, outlook for 2010
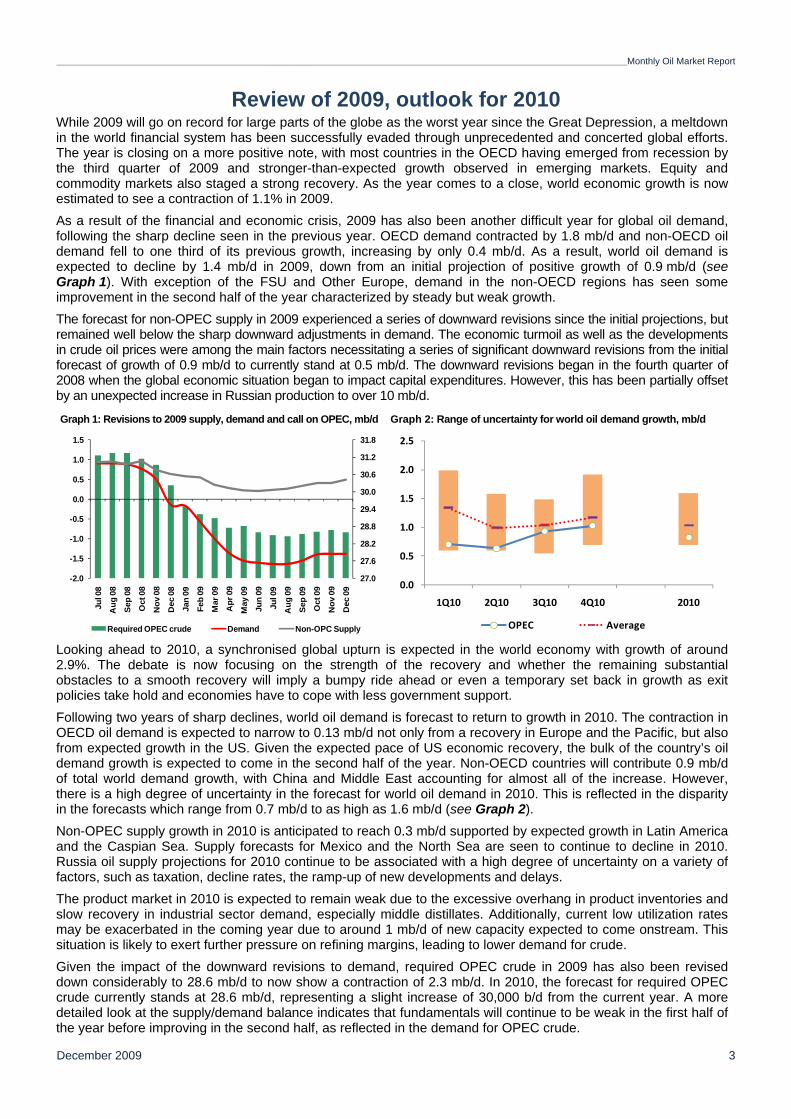
While 2009 will go on record for large parts of the globe as the worst year since the Great Depression, a meltdown in the world financial system has been successfully evaded through unprecedented and concerted global efforts. The year is closing on a more positive note, with most countries in the OECD having emerged from recession by the third quarter of 2009 and stronger-than-expected growth observed in emerging markets. Equity and commodity markets also staged a strong recovery. As the year comes to a close, world economic growth is now estimated to see a contraction of 1.1% in 2009. As a result of the financial and economic crisis, 2009 has also been another difficult year for global oil demand, following the sharp decline seen in the previous year. OECD demand contracted by 1.8 mb/d and non-OECD oil demand fell to one third of its previous growth, increasing by only 0.4 mb/d. As a result, world oil demand is expected to decline by 1.4 mb/d in 2009, down from an initial projection of positive growth of 0.9 mb/d (see Graph 1). With exception of the FSU and Other Europe, demand in the non-OECD regions has seen some improvement in the second half of the year characterized by steady but weak growth. The forecast for non-OPEC supply in 2009 experienced a series of downward revisions since the initial projections, but remained well below the sharp downward adjustments in demand. The economic turmoil as well as the developments in crude oil prices were among the main factors necessitating a series of significant downward revisions from the initial forecast of growth of 0.9 mb/d to currently stand at 0.5 mb/d. The downward revisions began in the fourth quarter of 2008 when the global economic situation began to impact capital expenditures. However, this has been partially offset by an unexpected increase in Russian production to over 10 mb/d.
Graph 1: Revisions to 2009 supply, demand and call on OPEC, mb/d Graph 2: Range of uncertainty for world oil demand growth, mb/d
Looking ahead to 2010, a synchronised global upturn is expected in the world economy with growth of around 2.9%. The debate is now focusing on the strength of the recovery and whether the remaining substantial obstacles to a smooth recovery will imply a bumpy ride ahead or even a temporary set back in growth as exit policies take hold and economies have to cope with less government support. Following two years of sharp declines, world oil demand is forecast to return to growth in 2010. The contraction in OECD oil demand is expected to narrow to 0.13 mb/d not only from a recovery in Europe and the Pacific, but also from expected growth in the US. Given the expected pace of US economic recovery, the bulk of the country’s oil demand growth is expected to come in the second half of the year. Non-OECD countries will contribute 0.9 mb/d of total world demand growth, with China and Middle East accounting for almost all of the increase. However, there is a high degree of uncertainty in the forecast for world oil demand in 2010. This is reflected in the disparity in the forecasts which range from 0.7 mb/d to as high as 1.6 mb/d (see Graph 2). Non-OPEC supply growth in 2010 is anticipated to reach 0.3 mb/d supported by expected growth in Latin America and the Caspian Sea. Supply forecasts for Mexico and the North Sea are seen to continue to decline in 2010. Russia oil supply projections for 2010 continue to be associated with a high degree of uncertainty on a variety of factors, such as taxation, decline rates, the ramp-up of new developments and delays. The product market in 2010 is expected to remain weak due to the excessive overhang in product inventories and slow recovery in industrial sector demand, especially middle distillates. Additionally, current low utilization rates may be exacerbated in the coming year due to around 1 mb/d of new capacity expected to come onstream. This situation is likely to exert further pressure on refining margins, leading to lower demand for crude. Given the impact of the downward revisions to demand, required OPEC crude in 2009 has also been revised down considerably to 28.6 mb/d to now show a contraction of 2.3 mb/d. In 2010, the forecast for required OPEC crude currently stands at 28.6 mb/d, representing a slight increase of 30,000 b/d from the current year. A more detailed look at the supply/demand balance indicates that fundamentals will continue to be weak in the first half of the year before improving in the second half, as reflected in the demand for OPEC crude.
27.0
27.6
28.2
28.8
29.4
30.0
30.6
31.2
31.8
-2.0
-1.5
-1.0
-0.5
0.0
0.5
1.0
1.5
Jul 0
8
Aug
08
Sep
08
Oct
08
Nov
08
Dec
08
Jan
09
Feb
09
Mar
09
Apr
09
May
09
Jun
09
Jul 0
9
Aug
09
Sep
09
Oct
09
Nov
09
Dec
09
Required OPEC crude Demand Non-OPC Supply
0.0
0.5
1.0
1.5
2.0
2.5
1Q10 2Q10 3Q10 4Q10 2010
OPEC Average

Monthly Oil Market Report__________________________________________________________________________________________________________________________________________
4 December 2009
_________________________________________________________________________________________________________________________________________Monthly Oil Market Report
December 2009 5
Crude Oil Price Movements
OPEC Reference Basket Market sentiment was relatively strong in November, providing support for crude prices
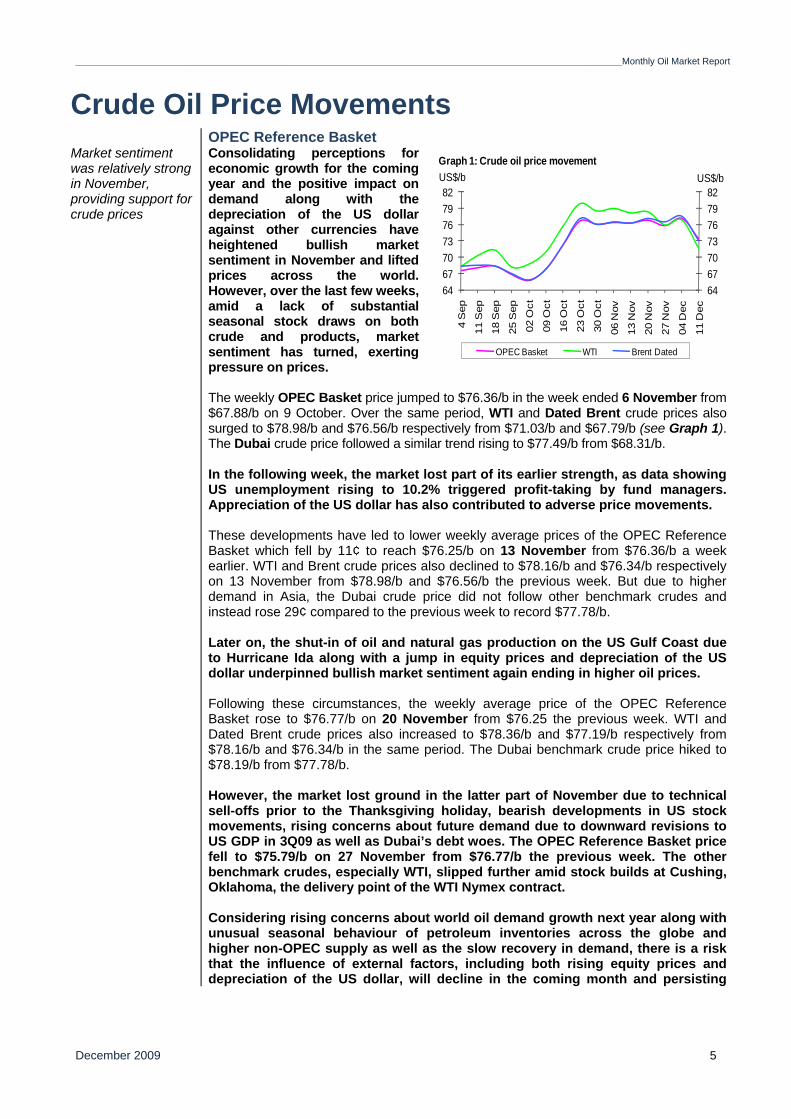
Consolidating perceptions for economic growth for the coming year and the positive impact on demand along with the depreciation of the US dollar against other currencies have heightened bullish market sentiment in November and lifted prices across the world. However, over the last few weeks, amid a lack of substantial seasonal stock draws on both crude and products, market sentiment has turned, exerting pressure on prices. The weekly OPEC Basket price jumped to $76.36/b in the week ended 6 November from $67.88/b on 9 October. Over the same period, WTI and Dated Brent crude prices also surged to $78.98/b and $76.56/b respectively from $71.03/b and $67.79/b (see Graph 1). The Dubai crude price followed a similar trend rising to $77.49/b from $68.31/b. In the following week, the market lost part of its earlier strength, as data showing US unemployment rising to 10.2% triggered profit-taking by fund managers. Appreciation of the US dollar has also contributed to adverse price movements. These developments have led to lower weekly average prices of the OPEC Reference Basket which fell by 11¢ to reach $76.25/b on 13 November from $76.36/b a week earlier. WTI and Brent crude prices also declined to $78.16/b and $76.34/b respectively on 13 November from $78.98/b and $76.56/b the previous week. But due to higher demand in Asia, the Dubai crude price did not follow other benchmark crudes and instead rose 29¢ compared to the previous week to record $77.78/b. Later on, the shut-in of oil and natural gas production on the US Gulf Coast due to Hurricane Ida along with a jump in equity prices and depreciation of the US dollar underpinned bullish market sentiment again ending in higher oil prices. Following these circumstances, the weekly average price of the OPEC Reference Basket rose to $76.77/b on 20 November from $76.25 the previous week. WTI and Dated Brent crude prices also increased to $78.36/b and $77.19/b respectively from $78.16/b and $76.34/b in the same period. The Dubai benchmark crude price hiked to $78.19/b from $77.78/b. However, the market lost ground in the latter part of November due to technical sell-offs prior to the Thanksgiving holiday, bearish developments in US stock movements, rising concerns about future demand due to downward revisions to US GDP in 3Q09 as well as Dubai’s debt woes. The OPEC Reference Basket price fell to $75.79/b on 27 November from $76.77/b the previous week. The other benchmark crudes, especially WTI, slipped further amid stock builds at Cushing, Oklahoma, the delivery point of the WTI Nymex contract. Considering rising concerns about world oil demand growth next year along with unusual seasonal behaviour of petroleum inventories across the globe and higher non-OPEC supply as well as the slow recovery in demand, there is a risk that the influence of external factors, including both rising equity prices and depreciation of the US dollar, will decline in the coming month and persisting
64677073767982
64677073767982
4 S
ep
11 S
ep
18 S
ep
25 S
ep
02 O
ct
09 O
ct
16 O
ct
23 O
ct
30 O
ct
06 N
ov
13 N
ov
20 N
ov
27 N
ov
04 D
ec
11 D
ec
US$/bUS$/b
OPEC Basket WTI Brent Dated
Graph 1: Crude oil price movement
Monthly Oil Market Report_________________________________________________________________________________________________________________________________________
December 2009 6
bearish fundamentals weigh further on the market and prices. In light of these developments, the OPEC Basket lost momentum and decreased by more than $7 since the beginning of December to average $70.69/b on 14 December. In the spot market, US crude differentials for both light sweet and medium sour grades surged significantly compare to last month. This was mainly attributed to a distortion in WTI front month prices and fewer arbitrage cargoes from the other side of the Atlantic. Light Louisiana Sweet crude differentials, which were around $1/b in early November, rose further to reach more than $2/b on WTI later that month. Mars sour crude differentials, which also traded at minus $3/b versus WTI in early November, rose almost to parity with WTI by the end of the month. Furthermore, due to a crude stock build in crude at Cushing, Oklahoma, the WTI crude price slid below Brent with the North Sea benchmark trading at more than $2/b against WTI (see Graph 1). These developments are likely to have an adverse impact on West African crude differentials in the cash market amid fewer arbitrage cargo movements from Europe to the US. With regard to West African crude, differentials for various grades have declined amid increasing supplies from Nigeria and reduced interest from American refiners for West African crude. Nigerian Benchmark crude Qua Iboe differentials against Dated BFOE recently fell to around $1/b from about $1.50/b in the latter part of October. Middle East crude market sentiment weakened in November amid higher supplies from major suppliers, including Saudi Arabia, lower refining runs and margins as well as less demand for spot cargoes. A cargo of Murban crude for loading in January was sold at a discount to ADNOC late November, whereas seasonally it should be at a premium at this time of year. The front-month Brent/Dubai exchange for swaps (EFS) for January also narrowed significantly leading to increasing West African supplies to Asia. Meanwhile, rising naphtha demand and cracks provided support for light sweet grades, especially for Asian crudes.
The sour/sweet crude spread Increasing Iraqi exports from
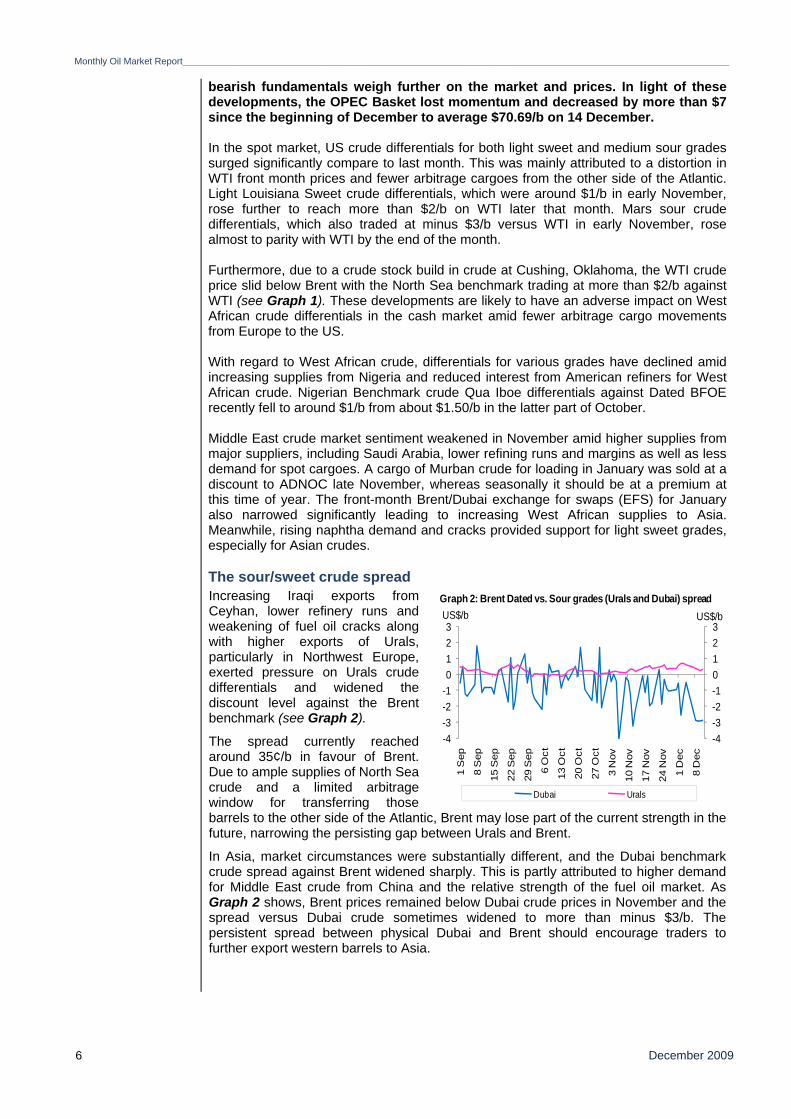
Ceyhan, lower refinery runs and weakening of fuel oil cracks along with higher exports of Urals, particularly in Northwest Europe, exerted pressure on Urals crude differentials and widened the discount level against the Brent benchmark (see Graph 2).
The spread currently reached around 35¢/b in favour of Brent. Due to ample supplies of North Sea crude and a limited arbitrage window for transferring those barrels to the other side of the Atlantic, Brent may lose part of the current strength in the future, narrowing the persisting gap between Urals and Brent.
In Asia, market circumstances were substantially different, and the Dubai benchmark crude spread against Brent widened sharply. This is partly attributed to higher demand for Middle East crude from China and the relative strength of the fuel oil market. As Graph 2 shows, Brent prices remained below Dubai crude prices in November and the spread versus Dubai crude sometimes widened to more than minus $3/b. The persistent spread between physical Dubai and Brent should encourage traders to further export western barrels to Asia.
-4-3-2-10123
-4-3-2-10123
1 S
ep
8 S
ep
15 S
ep
22 S
ep
29 S
ep
6 O
ct
13 O
ct
20 O
ct
27 O
ct
3 N
ov
10 N
ov
17 N
ov
24 N
ov
1 D
ec
8 D
ec
US$/bUS$/b
Dubai Urals
Graph 2: Brent Dated vs. Sour grades (Urals and Dubai) spread
_________________________________________________________________________________________________________________________________________Monthly Oil Market Report
December 2009 7
The oil futures market Sentiment weakened in the crude oil futures market in November
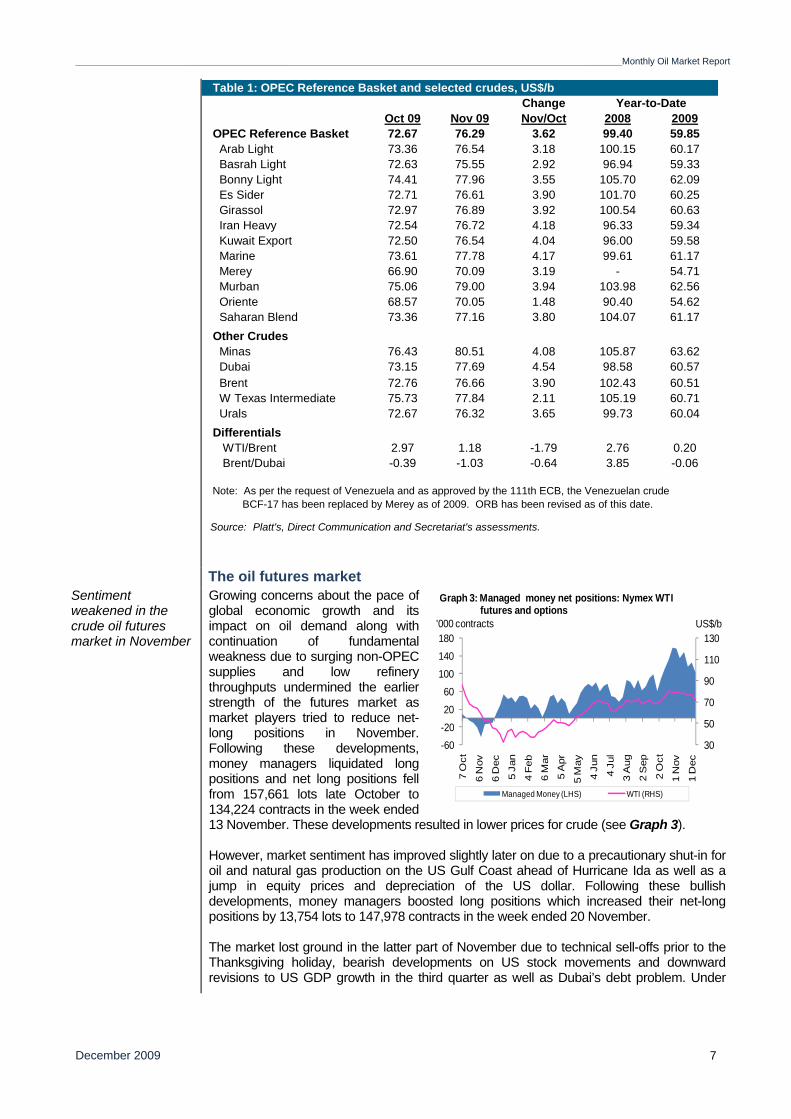
Growing concerns about the pace of global economic growth and its impact on oil demand along with continuation of fundamental weakness due to surging non-OPEC supplies and low refinery throughputs undermined the earlier strength of the futures market as market players tried to reduce net-long positions in November. Following these developments, money managers liquidated long positions and net long positions fell from 157,661 lots late October to 134,224 contracts in the week ended 13 November. These developments resulted in lower prices for crude (see Graph 3). However, market sentiment has improved slightly later on due to a precautionary shut-in for oil and natural gas production on the US Gulf Coast ahead of Hurricane Ida as well as a jump in equity prices and depreciation of the US dollar. Following these bullish developments, money managers boosted long positions which increased their net-long positions by 13,754 lots to 147,978 contracts in the week ended 20 November. The market lost ground in the latter part of November due to technical sell-offs prior to the Thanksgiving holiday, bearish developments on US stock movements and downward revisions to US GDP growth in the third quarter as well as Dubai’s debt problem. Under
Table 1: OPEC Reference Basket and selected crudes, US$/bChange
Oct 09 Nov 09 Nov/Oct 2008 200972.67 76.29 3.62 99.40 59.85
Arab Light 73.36 76.54 3.18 100.15 60.17 Basrah Light 72.63 75.55 2.92 96.94 59.33 Bonny Light 74.41 77.96 3.55 105.70 62.09 Es Sider 72.71 76.61 3.90 101.70 60.25 Girassol 72.97 76.89 3.92 100.54 60.63 Iran Heavy 72.54 76.72 4.18 96.33 59.34 Kuwait Export 72.50 76.54 4.04 96.00 59.58 Marine 73.61 77.78 4.17 99.61 61.17 Merey 66.90 70.09 3.19 - 54.71 Murban 75.06 79.00 3.94 103.98 62.56 Oriente 68.57 70.05 1.48 90.40 54.62 Saharan Blend 73.36 77.16 3.80 104.07 61.17
Minas 76.43 80.51 4.08 105.87 63.6273.15 77.69 4.54 98.58 60.5772.76 76.66 3.90 102.43 60.5175.73 77.84 2.11 105.19 60.7172.67 76.32 3.65 99.73 60.04
Differentials WTI/Brent 2.97 1.18 -1.79 2.76 0.20
-0.39 -1.03 -0.64 3.85 -0.06
Source: Platt's, Direct Communication and Secretariat's assessments.
Year-to-Date
OPEC Reference Basket
Brent/Dubai
Brent
Other Crudes
Dubai
W Texas Intermediate Urals
Note: As per the request of Venezuela and as approved by the 111th ECB, the Venezuelan crude BCF-17 has been replaced by Merey as of 2009. ORB has been revised as of this date.
30
50
70
90
110
130
-60-202060
100140180
7 O
ct
6 N
ov
6 D
ec
5 Ja
n
4 F
eb
6 M
ar
5 A
pr
5 M
ay
4 Ju
n
4 Ju
l
3 A
ug
2 S
ep
2 O
ct
1 N
ov
1 D
ec
US$/b'000 contracts
Managed Money (LHS) WTI (RHS)
Graph 3: Managed money net positions: Nymex WTI futures and options
Monthly Oil Market Report_________________________________________________________________________________________________________________________________________
December 2009 8
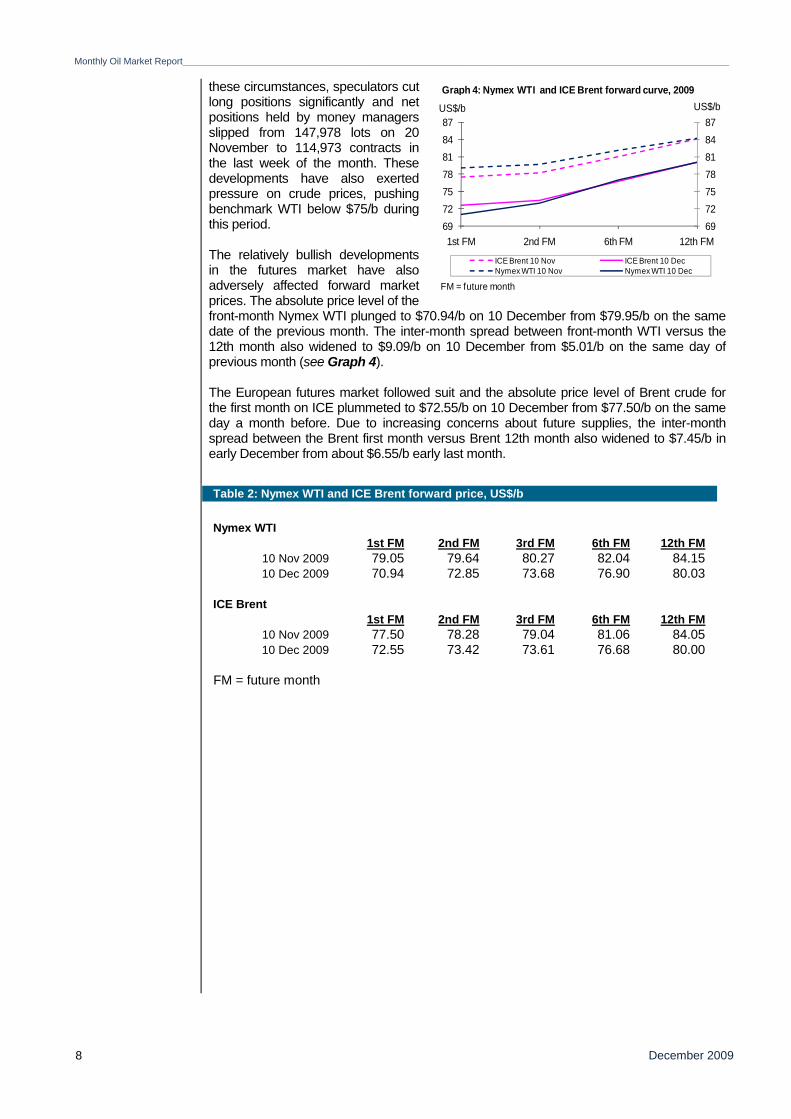
these circumstances, speculators cut long positions significantly and net positions held by money managers slipped from 147,978 lots on 20 November to 114,973 contracts in the last week of the month. These developments have also exerted pressure on crude prices, pushing benchmark WTI below $75/b during this period. The relatively bullish developments in the futures market have also adversely affected forward market prices. The absolute price level of the front-month Nymex WTI plunged to $70.94/b on 10 December from $79.95/b on the same date of the previous month. The inter-month spread between front-month WTI versus the 12th month also widened to $9.09/b on 10 December from $5.01/b on the same day of previous month (see Graph 4). The European futures market followed suit and the absolute price level of Brent crude for the first month on ICE plummeted to $72.55/b on 10 December from $77.50/b on the same day a month before. Due to increasing concerns about future supplies, the inter-month spread between the Brent first month versus Brent 12th month also widened to $7.45/b in early December from about $6.55/b early last month.
Table 2: Nymex WTI and ICE Brent forward price, US$/b
Nymex WTI 1st FM 2nd FM 3rd FM 6th FM 12th FM
10 Nov 2009 79.05 79.64 80.27 82.04 84.1510 Dec 2009 70.94 72.85 73.68 76.90 80.03
ICE Brent1st FM 2nd FM 3rd FM 6th FM 12th FM
10 Nov 2009 77.50 78.28 79.04 81.06 84.0510 Dec 2009 72.55 73.42 73.61 76.68 80.00
FM = future month
69727578818487
69727578818487
1st FM 2nd FM 6th FM 12th FM
US$/bUS$/b
ICE Brent 10 Nov ICE Brent 10 DecNymex WTI 10 Nov Nymex WTI 10 Dec
FM = future month
Graph 4: Nymex WTI and ICE Brent forward curve, 2009
_________________________________________________________________________________________________________________________________________Monthly Oil Market Report
December 2009 9
Commodity Markets Trends in selected commodity markets Commodity prices grew at a slower pace in November due to lower energy prices
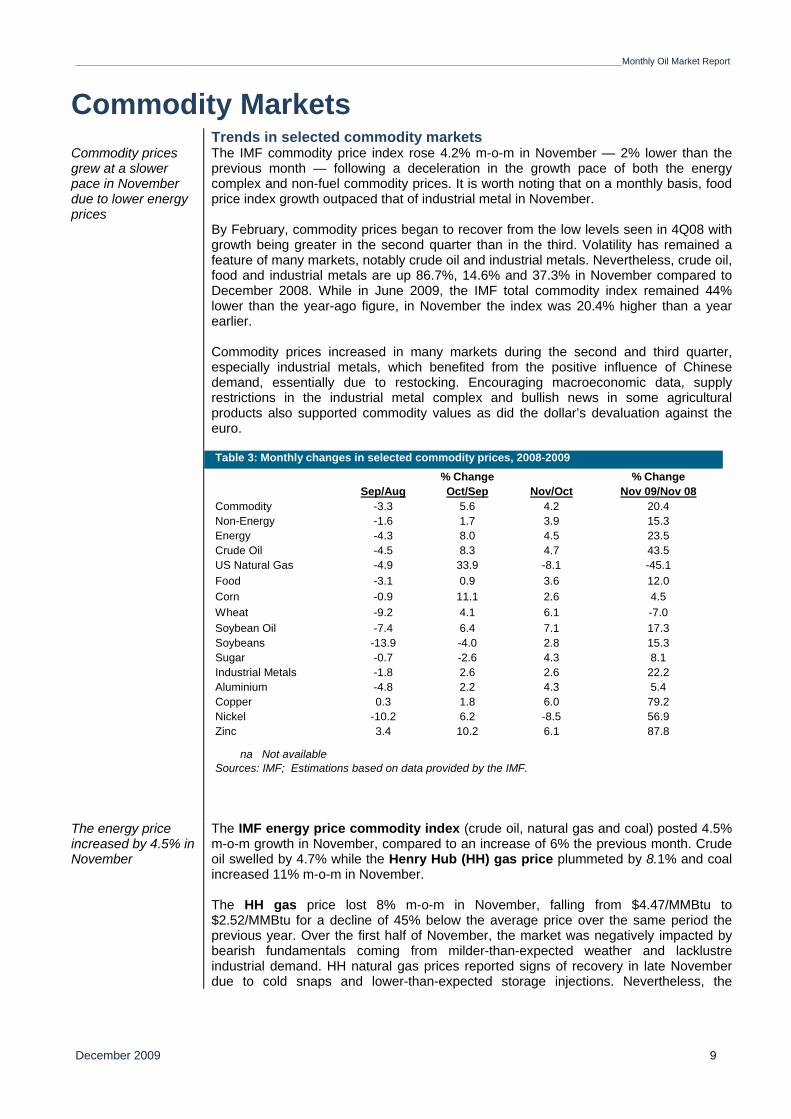
The IMF commodity price index rose 4.2% m-o-m in November — 2% lower than the previous month — following a deceleration in the growth pace of both the energy complex and non-fuel commodity prices. It is worth noting that on a monthly basis, food price index growth outpaced that of industrial metal in November. By February, commodity prices began to recover from the low levels seen in 4Q08 with growth being greater in the second quarter than in the third. Volatility has remained a feature of many markets, notably crude oil and industrial metals. Nevertheless, crude oil, food and industrial metals are up 86.7%, 14.6% and 37.3% in November compared to December 2008. While in June 2009, the IMF total commodity index remained 44% lower than the year-ago figure, in November the index was 20.4% higher than a year earlier. Commodity prices increased in many markets during the second and third quarter, especially industrial metals, which benefited from the positive influence of Chinese demand, essentially due to restocking. Encouraging macroeconomic data, supply restrictions in the industrial metal complex and bullish news in some agricultural products also supported commodity values as did the dollar’s devaluation against the euro.
The energy price increased by 4.5% in November
The IMF energy price commodity index (crude oil, natural gas and coal) posted 4.5% m-o-m growth in November, compared to an increase of 6% the previous month. Crude oil swelled by 4.7% while the Henry Hub (HH) gas price plummeted by 8.1% and coal increased 11% m-o-m in November. The HH gas price lost 8% m-o-m in November, falling from $4.47/MMBtu to $2.52/MMBtu for a decline of 45% below the average price over the same period the previous year. Over the first half of November, the market was negatively impacted by bearish fundamentals coming from milder-than-expected weather and lacklustre industrial demand. HH natural gas prices reported signs of recovery in late November due to cold snaps and lower-than-expected storage injections. Nevertheless, the
% ChangeSep/Aug Oct/Sep Nov/Oct Nov 09/Nov 08
Commodity -3.3 5.6 4.2 20.4Non-Energy -1.6 1.7 3.9 15.3Energy -4.3 8.0 4.5 23.5Crude Oil -4.5 8.3 4.7 43.5US Natural Gas -4.9 33.9 -8.1 -45.1Food -3.1 0.9 3.6 12.0Corn -0.9 11.1 2.6 4.5Wheat -9.2 4.1 6.1 -7.0Soybean Oil -7.4 6.4 7.1 17.3Soybeans -13.9 -4.0 2.8 15.3Sugar -0.7 -2.6 4.3 8.1Industrial Metals -1.8 2.6 2.6 22.2Aluminium -4.8 2.2 4.3 5.4Copper 0.3 1.8 6.0 79.2Nickel -10.2 6.2 -8.5 56.9Zinc 3.4 10.2 6.1 87.8
Table 3: Monthly changes in selected commodity prices, 2008-2009% Change
na Not availableSources: IMF; Estimations based on data provided by the IMF. * World Bank Index
Monthly Oil Market Report_________________________________________________________________________________________________________________________________________
December 2009 10
flatness in crude oil prices resulted in the WTI/HH spread losing 4% in November.
The non-fuel commodity price index rose further in November driven by food prices
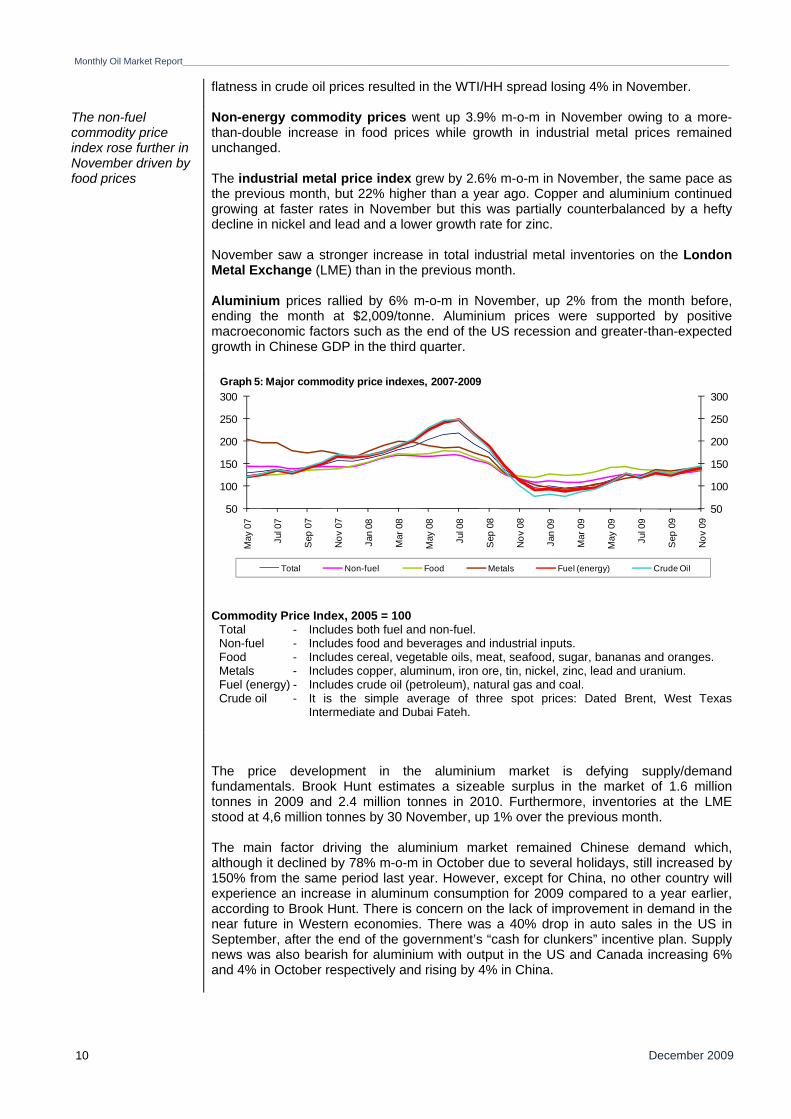
Non-energy commodity prices went up 3.9% m-o-m in November owing to a more-than-double increase in food prices while growth in industrial metal prices remained unchanged. The industrial metal price index grew by 2.6% m-o-m in November, the same pace as the previous month, but 22% higher than a year ago. Copper and aluminium continued growing at faster rates in November but this was partially counterbalanced by a hefty decline in nickel and lead and a lower growth rate for zinc. November saw a stronger increase in total industrial metal inventories on the London Metal Exchange (LME) than in the previous month. Aluminium prices rallied by 6% m-o-m in November, up 2% from the month before, ending the month at $2,009/tonne. Aluminium prices were supported by positive macroeconomic factors such as the end of the US recession and greater-than-expected growth in Chinese GDP in the third quarter.
Commodity Price Index, 2005 = 100Total - Includes both fuel and non-fuel. Non-fuel - Includes food and beverages and industrial inputs. Food - Includes cereal, vegetable oils, meat, seafood, sugar, bananas and oranges. Metals - Includes copper, aluminum, iron ore, tin, nickel, zinc, lead and uranium. Fuel (energy) - Includes crude oil (petroleum), natural gas and coal. Crude oil - It is the simple average of three spot prices: Dated Brent, West Texas
Intermediate and Dubai Fateh.
The price development in the aluminium market is defying supply/demand fundamentals. Brook Hunt estimates a sizeable surplus in the market of 1.6 million tonnes in 2009 and 2.4 million tonnes in 2010. Furthermore, inventories at the LME stood at 4,6 million tonnes by 30 November, up 1% over the previous month. The main factor driving the aluminium market remained Chinese demand which, although it declined by 78% m-o-m in October due to several holidays, still increased by 150% from the same period last year. However, except for China, no other country will experience an increase in aluminum consumption for 2009 compared to a year earlier, according to Brook Hunt. There is concern on the lack of improvement in demand in the near future in Western economies. There was a 40% drop in auto sales in the US in September, after the end of the government’s “cash for clunkers” incentive plan. Supply news was also bearish for aluminium with output in the US and Canada increasing 6% and 4% in October respectively and rising by 4% in China.
50
100
150
200
250
300
50
100
150
200
250
300
May
07
Jul 0
7
Sep
07
Nov
07
Jan
08
Mar
08
May
08
Jul 0
8
Sep
08
Nov
08
Jan
09
Mar
09
May
09
Jul 0
9
Sep
09
Nov
09
Total Non-fuel Food Metals Fuel (energy) Crude Oil
Graph 5: Major commodity price indexes, 2007-2009
_________________________________________________________________________________________________________________________________________Monthly Oil Market Report
December 2009 11
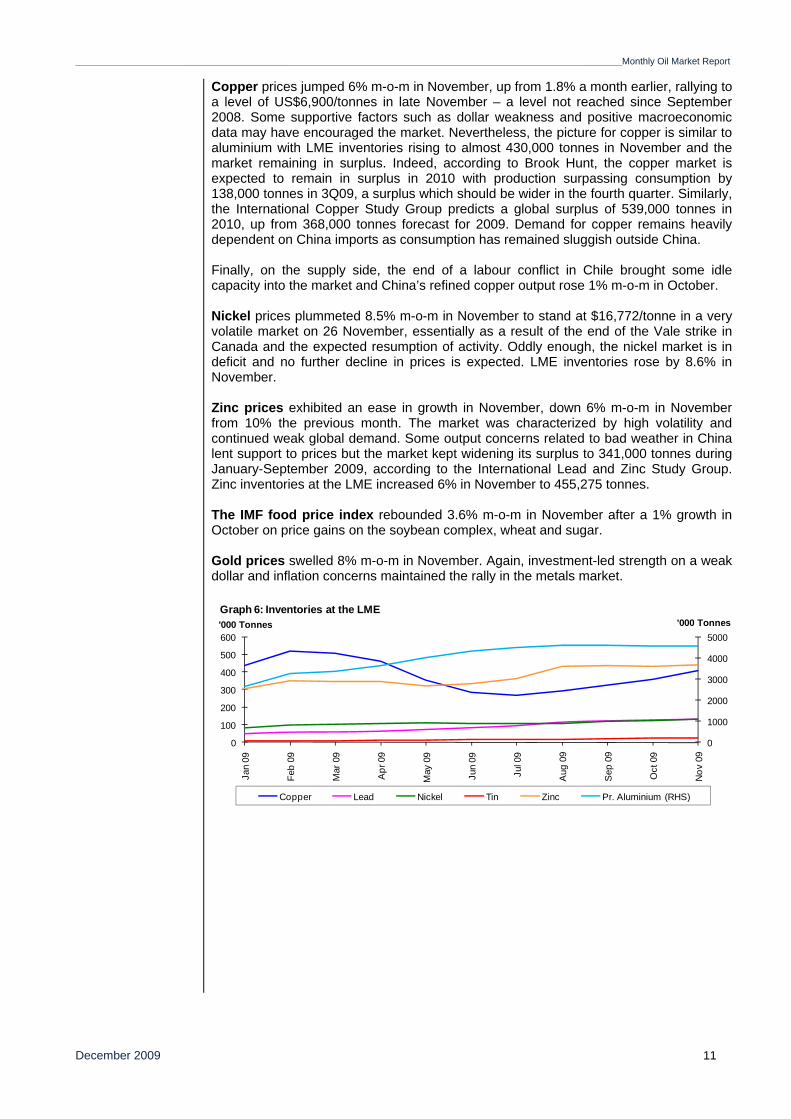
Copper prices jumped 6% m-o-m in November, up from 1.8% a month earlier, rallying to a level of US$6,900/tonnes in late November – a level not reached since September 2008. Some supportive factors such as dollar weakness and positive macroeconomic data may have encouraged the market. Nevertheless, the picture for copper is similar to aluminium with LME inventories rising to almost 430,000 tonnes in November and the market remaining in surplus. Indeed, according to Brook Hunt, the copper market is expected to remain in surplus in 2010 with production surpassing consumption by 138,000 tonnes in 3Q09, a surplus which should be wider in the fourth quarter. Similarly, the International Copper Study Group predicts a global surplus of 539,000 tonnes in 2010, up from 368,000 tonnes forecast for 2009. Demand for copper remains heavily dependent on China imports as consumption has remained sluggish outside China. Finally, on the supply side, the end of a labour conflict in Chile brought some idle capacity into the market and China’s refined copper output rose 1% m-o-m in October. Nickel prices plummeted 8.5% m-o-m in November to stand at $16,772/tonne in a very volatile market on 26 November, essentially as a result of the end of the Vale strike in Canada and the expected resumption of activity. Oddly enough, the nickel market is in deficit and no further decline in prices is expected. LME inventories rose by 8.6% in November. Zinc prices exhibited an ease in growth in November, down 6% m-o-m in November from 10% the previous month. The market was characterized by high volatility and continued weak global demand. Some output concerns related to bad weather in China lent support to prices but the market kept widening its surplus to 341,000 tonnes during January-September 2009, according to the International Lead and Zinc Study Group. Zinc inventories at the LME increased 6% in November to 455,275 tonnes. The IMF food price index rebounded 3.6% m-o-m in November after a 1% growth in October on price gains on the soybean complex, wheat and sugar. Gold prices swelled 8% m-o-m in November. Again, investment-led strength on a weak dollar and inflation concerns maintained the rally in the metals market.
0
1000
2000
3000
4000
5000
0
100
200
300
400
500
600
Jan
09
Feb
09
Mar
09
Apr
09
May
09
Jun
09
Jul 0
9
Aug
09
Sep
09
Oct
09
Nov
09
'000 Tonnes'000 Tonnes
Copper Lead Nickel Tin Zinc Pr. Aluminium (RHS)
Graph 6: Inventories at the LME
Monthly Oil Market Report_________________________________________________________________________________________________________________________________________
December 2009 12
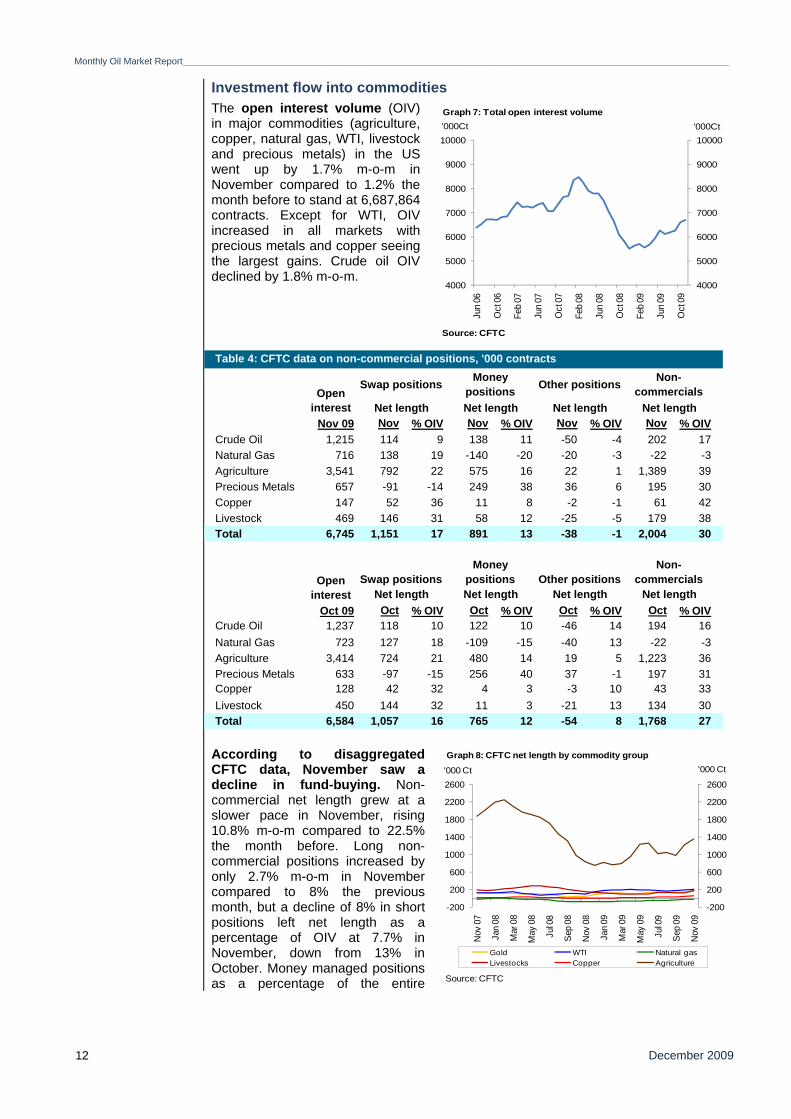
Investment flow into commodities The open interest volume (OIV)
in major commodities (agriculture, copper, natural gas, WTI, livestock and precious metals) in the US went up by 1.7% m-o-m in November compared to 1.2% the month before to stand at 6,687,864 contracts. Except for WTI, OIV increased in all markets with precious metals and copper seeing the largest gains. Crude oil OIV declined by 1.8% m-o-m.
According to disaggregated CFTC data, November saw a decline in fund-buying. Non-commercial net length grew at a slower pace in November, rising 10.8% m-o-m compared to 22.5% the month before. Long non-commercial positions increased by only 2.7% m-o-m in November compared to 8% the previous month, but a decline of 8% in short positions left net length as a percentage of OIV at 7.7% in November, down from 13% in October. Money managed positions as a percentage of the entire
Nov 09 Nov % OIV Nov % OIV Nov % OIV Nov % OIVCrude Oil 1,215 114 9 138 11 -50 -4 202 17Natural Gas 716 138 19 -140 -20 -20 -3 -22 -3Agriculture 3,541 792 22 575 16 22 1 1,389 39Precious Metals 657 -91 -14 249 38 36 6 195 30Copper 147 52 36 11 8 -2 -1 61 42Livestock 469 146 31 58 12 -25 -5 179 38Total 6,745 1,151 17 891 13 -38 -1 2,004 30
Oct 09 Oct % OIV Oct % OIV Oct % OIV Oct % OIVCrude Oil 1,237 118 10 122 10 -46 14 194 16Natural Gas 723 127 18 -109 -15 -40 13 -22 -3Agriculture 3,414 724 21 480 14 19 5 1,223 36Precious Metals 633 -97 -15 256 40 37 -1 197 31Copper 128 42 32 4 3 -3 10 43 33Livestock 450 144 32 11 3 -21 13 134 30Total 6,584 1,057 16 765 12 -54 8 1,768 27
Open interest
Swap positionsMoney
positions Other positionsNon-
commercialsNet length Net length Net length Net length
Open interest
Table 4: CFTC data on non-commercial positions, '000 contracts
Swap positions Money positions Other positions Non-
commercialsNet length Net length Net length Net length
-200
200
600
1000
1400
1800
2200
2600
-200
200
600
1000
1400
1800
2200
2600
Nov
07
Jan
08
Mar
08
May
08
Jul 0
8
Sep
08
Nov
08
Jan
09
Mar
09
May
09
Jul 0
9
Sep
09
Nov
09
'000 Ct'000 Ct
Gold WTI Natural gasLivestocks Copper Agriculture
Graph 8: CFTC net length by commodity group
Source: CFTC
4000
5000
6000
7000
8000
9000
10000
4000
5000
6000
7000
8000
9000
10000
Jun
06
Oct
06
Feb
07
Jun
07
Oct
07
Feb
08
Jun
08
Oct
08
Feb
09
Jun
09
Oct
09
Graph 7: Total open interest volume'000Ct '000Ct
Source: CFTC
_________________________________________________________________________________________________________________________________________Monthly Oil Market Report
December 2009 13
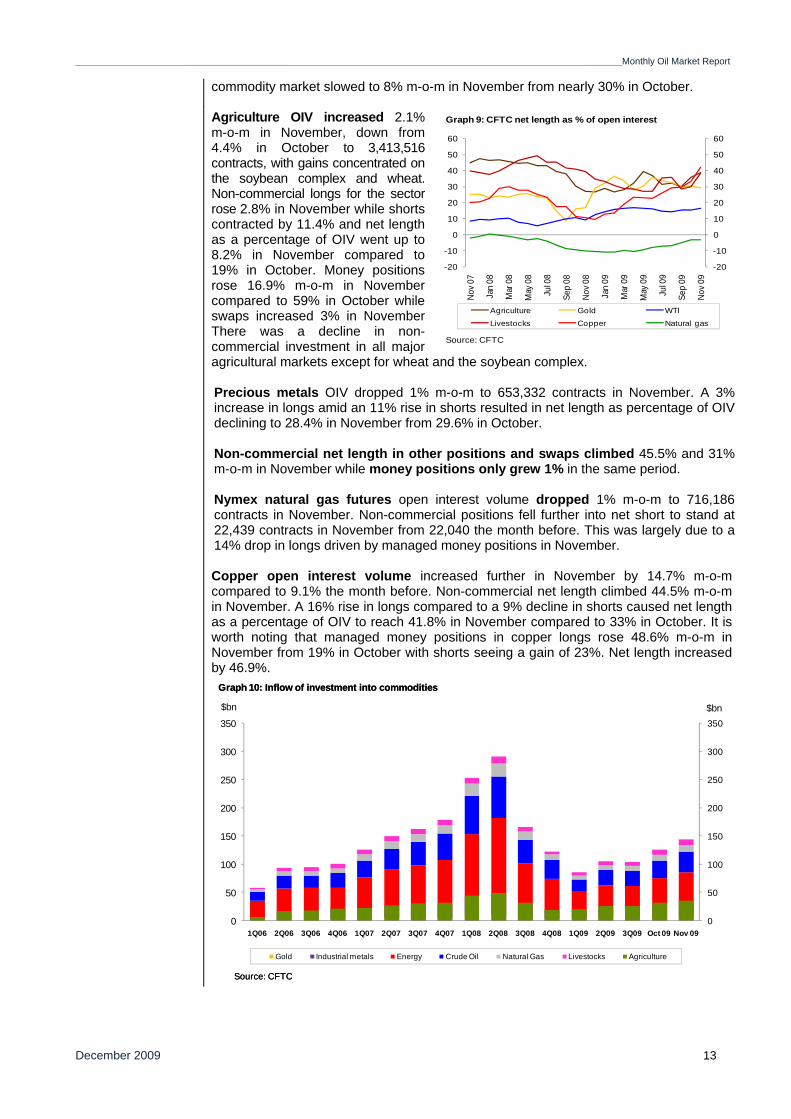
commodity market slowed to 8% m-o-m in November from nearly 30% in October.
Agriculture OIV increased 2.1% m-o-m in November, down from 4.4% in October to 3,413,516 contracts, with gains concentrated on the soybean complex and wheat. Non-commercial longs for the sector rose 2.8% in November while shorts contracted by 11.4% and net length as a percentage of OIV went up to 8.2% in November compared to 19% in October. Money positions rose 16.9% m-o-m in November compared to 59% in October while swaps increased 3% in November There was a decline in non-commercial investment in all major agricultural markets except for wheat and the soybean complex. Precious metals OIV dropped 1% m-o-m to 653,332 contracts in November. A 3% increase in longs amid an 11% rise in shorts resulted in net length as percentage of OIV declining to 28.4% in November from 29.6% in October. Non-commercial net length in other positions and swaps climbed 45.5% and 31% m-o-m in November while money positions only grew 1% in the same period. Nymex natural gas futures open interest volume dropped 1% m-o-m to 716,186 contracts in November. Non-commercial positions fell further into net short to stand at 22,439 contracts in November from 22,040 the month before. This was largely due to a 14% drop in longs driven by managed money positions in November. Copper open interest volume increased further in November by 14.7% m-o-m compared to 9.1% the month before. Non-commercial net length climbed 44.5% m-o-m in November. A 16% rise in longs compared to a 9% decline in shorts caused net length as a percentage of OIV to reach 41.8% in November compared to 33% in October. It is worth noting that managed money positions in copper longs rose 48.6% m-o-m in November from 19% in October with shorts seeing a gain of 23%. Net length increased by 46.9%.
0
50
100
150
200
250
300
350
0
50
100
150
200
250
300
350
1Q06 2Q06 3Q06 4Q06 1Q07 2Q07 3Q07 4Q07 1Q08 2Q08 3Q08 4Q08 1Q09 2Q09 3Q09 Oct 09 Nov 09
$bn$bn
Gold Industrial metals Energy Crude Oil Natural Gas Livestocks Agriculture
Graph 10: Inflow of investment into commodities
Source: CFTC
Graph 10: Inflow of investment into commodities
Source: CFTC
-20
-10
0
10
20
30
40
50
60
-20
-10
0
10
20
30
40
50
60
Nov 0
7
Jan
08
Mar
08
May
08
Jul 0
8
Sep
08
Nov 0
8
Jan
09
Mar
09
May
09
Jul 0
9
Sep
09
Nov 0
9
Agriculture Gold WTI
Livestocks Copper Natural gas
Graph 9: CFTC net length as % of open interest
Source: CFTC
Monthly Oil Market Report_________________________________________________________________________________________________________________________________________
December 2009 14
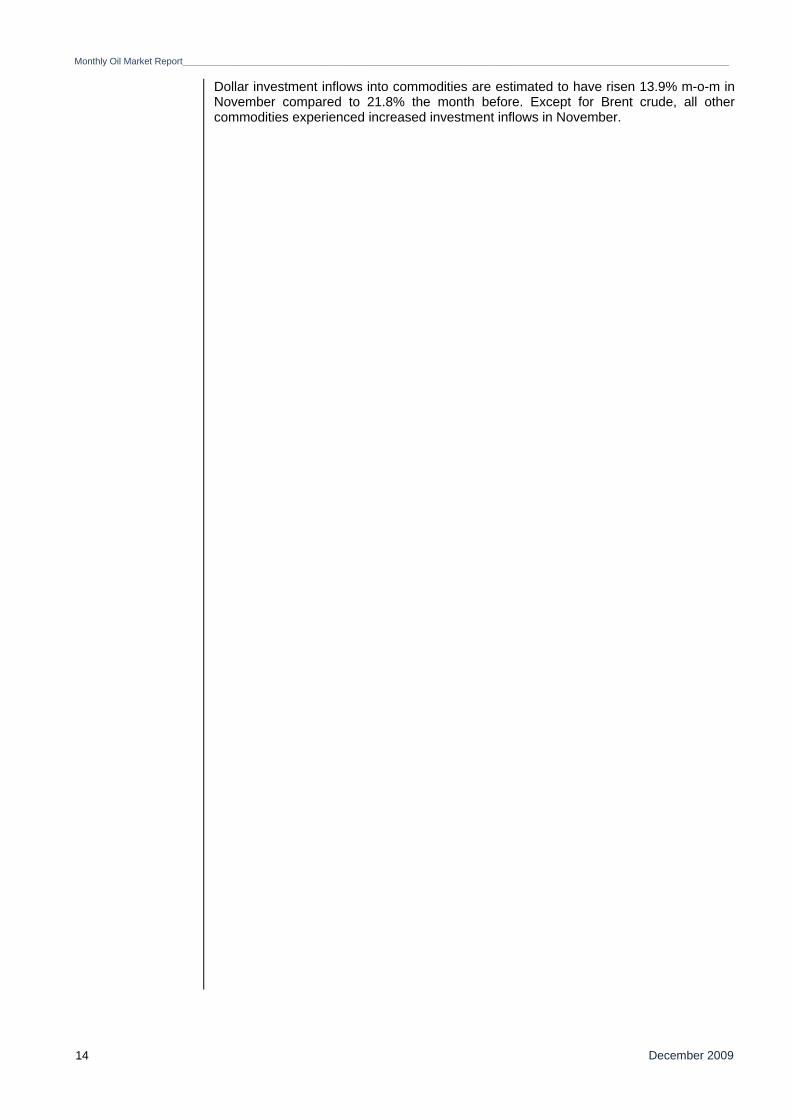
Dollar investment inflows into commodities are estimated to have risen 13.9% m-o-m in November compared to 21.8% the month before. Except for Brent crude, all other commodities experienced increased investment inflows in November.
_________________________________________________________________________________________________________________________________________Monthly Oil Market Report
December 2009 15
Highlights of the World Economy Economic growth rates 2009-2010, % World OECD USA Japan Euro-
zone China India
2009 -1.1 -3.4 -2.5 -5.3 -3.9 8.0 5.6 2010 2.9 1.3 1.6 1.1 0.6 8.5 6.5
Industrialised countries United States of America Some promising signs in the US economy with higher- than-expected retail sales and improved labour markets but challenges lie ahead
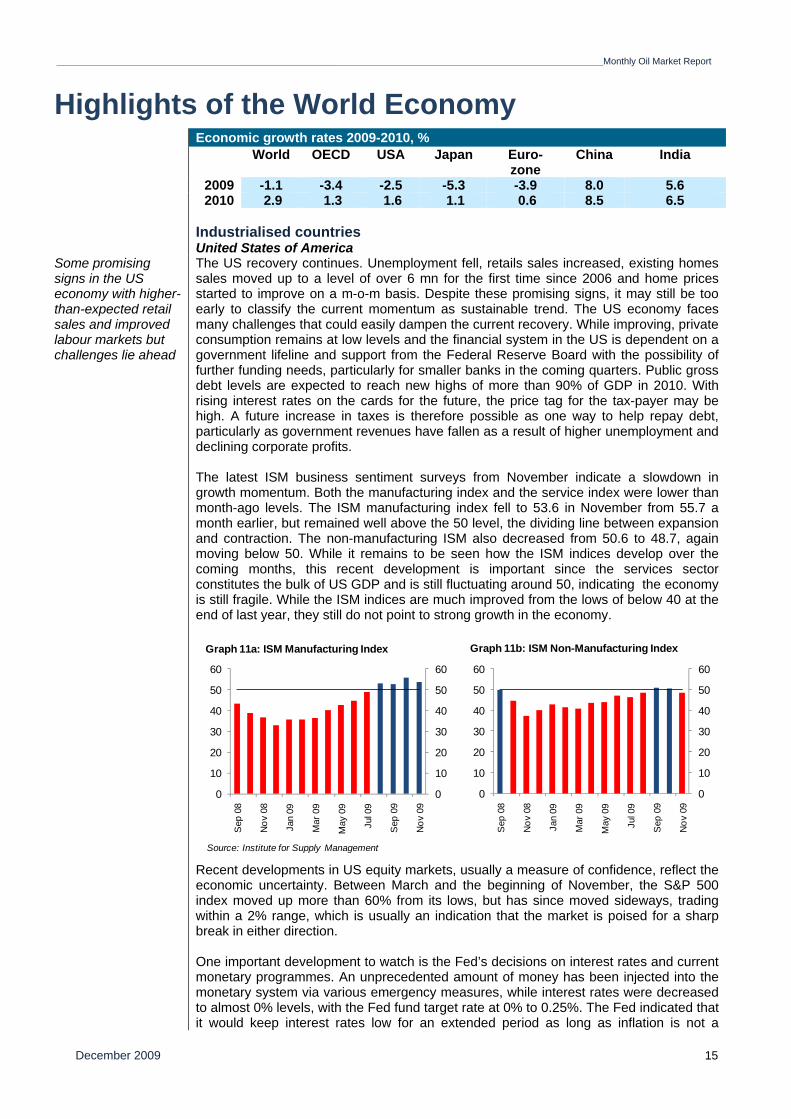
The US recovery continues. Unemployment fell, retails sales increased, existing homes sales moved up to a level of over 6 mn for the first time since 2006 and home prices started to improve on a m-o-m basis. Despite these promising signs, it may still be too early to classify the current momentum as sustainable trend. The US economy faces many challenges that could easily dampen the current recovery. While improving, private consumption remains at low levels and the financial system in the US is dependent on a government lifeline and support from the Federal Reserve Board with the possibility of further funding needs, particularly for smaller banks in the coming quarters. Public gross debt levels are expected to reach new highs of more than 90% of GDP in 2010. With rising interest rates on the cards for the future, the price tag for the tax-payer may be high. A future increase in taxes is therefore possible as one way to help repay debt, particularly as government revenues have fallen as a result of higher unemployment and declining corporate profits. The latest ISM business sentiment surveys from November indicate a slowdown in growth momentum. Both the manufacturing index and the service index were lower than month-ago levels. The ISM manufacturing index fell to 53.6 in November from 55.7 a month earlier, but remained well above the 50 level, the dividing line between expansion and contraction. The non-manufacturing ISM also decreased from 50.6 to 48.7, again moving below 50. While it remains to be seen how the ISM indices develop over the coming months, this recent development is important since the services sector constitutes the bulk of US GDP and is still fluctuating around 50, indicating the economy is still fragile. While the ISM indices are much improved from the lows of below 40 at the end of last year, they still do not point to strong growth in the economy.
Recent developments in US equity markets, usually a measure of confidence, reflect the economic uncertainty. Between March and the beginning of November, the S&P 500 index moved up more than 60% from its lows, but has since moved sideways, trading within a 2% range, which is usually an indication that the market is poised for a sharp break in either direction. One important development to watch is the Fed’s decisions on interest rates and current monetary programmes. An unprecedented amount of money has been injected into the monetary system via various emergency measures, while interest rates were decreased to almost 0% levels, with the Fed fund target rate at 0% to 0.25%. The Fed indicated that it would keep interest rates low for an extended period as long as inflation is not a
0
10
20
30
40
50
60
0
10
20
30
40
50
60
Sep
08
Nov
08
Jan
09
Mar
09
May
09
Jul 0
9
Sep
09
Nov
09
0
10
20
30
40
50
60
0
10
20
30
40
50
60
Sep
08
Nov
08
Jan
09
Mar
09
May
09
Jul 0
9
Sep
09
Nov
09
Source: Institute for Supply Management
Graph 11a: ISM Manufacturing Index Graph 11b: ISM Non-Manufacturing Index
Monthly Oil Market Report_________________________________________________________________________________________________________________________________________
December 2009 16
concern and unemployment is not improving. In this respect, it will be important to see what the Fed will signal concerning exit policies when it meets in mid-December for the last time this year. Any signal for a rate increase further down the line would have negative implications for equity markets and could also impact the real economy. Unemployment, while improving in November for the first time in many months, remains to be an area of concern at a level of 10% compared to 10.2% in October. This might have been a positive effect from the various stimulus measures, such as the “cash for clunkers” program. But as this is now finished, it remains to be seen whether the underlying trend is strong enough to push unemployment down further. In addition, a positive note is seen in the growth in retail sales which were up 1.3% in November, after an increase of 1.1% in October. Even excluding auto-sales, sales rose by 1.2%. This fuels hopes that the current sales season might turn out to be better than expected. The slight improvement of the economy is reflected in the 2010 GDP forecast, with growth expected to reach 1.6%, compared to last month’s estimate of 1.4%. For 2009, the decline is unchanged at 2.5%.
Japan Japan still facing challenges of growing public debt, deflation, a weakening economy and no possibility for quick exit policies
The Japanese economy reached a trough in 1Q09. Since then, GDP has been expanding. After a record decline of 11.9% q-o-q seasonally adjusted annualized rate (saar), GDP grew at a pace of 2.7% in 2Q09. However, in the most recent third quarter, growth disappointed falling to a revised pace of only 1.3%. This demonstrates the fragility of the Japanese economy as the initial published estimate was for much higher growth of 4.8%. These uncertainties were probably the main reason the new government issued an additional stimulus package of ¥24.4 trn ($270 bn) which includes ¥7.2 trn ($80 bn) contribution from the central government. This should be put into perspective with regard to two important aspects. Since the onset of the financial crisis, Japan has issued around ¥121.2 trn ($1350 bn) in various stimulus packages. This is almost twice the amount the US has provided for their fiscal stimulus. While it is very difficult to compare the US and the Japanese stimulus initiatives as the Japanese aid packages include a major portion of support for the financial system – which constitutes a much smaller part within the US-stimulus package – the Japanese monetary support was quite large, and most of it appears to have already been spent. This is discouraging as recent developments in the economy do not reflect the impact of such a huge amount of money. So far the stimulus in Japan amounts to around 20% of Japanese GDP. While the US – including their measures for the financial system – might have spent around the same proportion, the effect there seems to be more visible. The second point that should be considered is that the gross debt level of Japan has already reached almost 200% of GDP in 2008. In 2014 it is expected to reach a level of almost 250%, according to the IMF. These numbers compare with debt/GDP ratios in the major OECD countries of around 70% for 2008 and expectations of around 100% by 2014. Such high levels in Japan will challenge the economy’s ability to service and repay its debt. Furthermore, it remains to be seen whether the Japanese household will be able and willing to function as the main source of funding in the future, given that the savings rate in Japan, which has historically been the main source of funding for the government, is in decline. The recent Tankan survey showed that business confidence improved the least since the emergence of the current crisis. Sentiment among large manufacturers, such as producers of cars and electronics, climbed 9 points to minus 24 in December, according to the Bank of Japan (BoJ). This is still better than the consensus, which expected a level of minus 27. While this is a positive trend, the report also showed that large companies are planning deeper spending cuts to protect their earnings threatened by the strength of the yen which climbed to a 14-year high against the US dollar in November. Large enterprises plan to cut capital spending by 13.8% this fiscal year, the worst reading for a December survey, deeper than the 10.8% decline the Tankan showed three months ago.
_________________________________________________________________________________________________________________________________________Monthly Oil Market Report
December 2009 17
Exports offer some support to the economy. While still in decline in October by 23.2% y-o-y, this is the third straight month of improvement, up from a September level of minus 30.6% y-o-y. Exports to Asia recovered the most and were almost positive on a y-o-y basis at minus 1.9%. On the other hand, industrial production is again trending lower with an increase of only 0.5% m-o-m in October. Most important was a decline of 0.2% m-o-m in consumer goods production which highlights still weak private consumption. Thanks to the large support of the government, the unemployment rate fell to 5.1% in October, the third consecutive month of improvement, but as in the previous month it was mainly a decline in the employment force that caused this improvement as the number of unemployed has not changed dramatically. All in all, the recent numbers can be read more as a sign of stagnation rather than improvement. The job-offers-to-applicant ratio has improved again only very slightly from 0.43 to 0.44. The cautious mood of the Japanese consumer is being reflected in a drop in consumer prices. The CPI index fell for the fourth consecutive month by 2.5% y-o-y in October, following a drop of 2.2% in September. Taking all the challenges into consideration, the GDP growth forecast for next year for the Japanese economy remains unchanged at 1.1%. For 2009, the forecast improved slightly to minus 5.3% from minus 5.6%.
Euro-zone Uneven developments within the Euro-zone, with Germany and France leading the recovery while clouds gather in Greece, Ireland and Spain
The Euro-zone economy continues to show signs of improvement. Germany and France, which constitute more than half of the Euro-zone economy, are mainly responsible for the upward trend while countries such as Greece and Spain are becoming areas of concern. Germany, Italy and France managed to grow in the 3Q at 0.7%, 0.6% and 0.3% q-o-q seasonally adjusted (saar) respectively. Greece and Spain both declined by 0.3%. A recent collapse in Greek bonds further demonstrated the perceived weakness of the country. The Greek government two-year bond yield has risen 1.3 percentage points in the second week of December. This marks an unprecedented move that highlights the shattered confidence of investors in the Greek economy. This again might fuel speculation about the safety of the Euro as was the case in the first quarter. Consequently, the bond markets of other weaker Euro-zone economies – such as Spain, Ireland and Portugal – have come under pressure as investors consider these markets to be vulnerable. This is of growing concern to the European Central Bank (ECB) which has alerted these countries to very carefully manage their budgetary situation. Greece has become the weak spot of the Euro-zone, as most of the key economic statistics point to an economy that is severely challenged by the current crisis. It is expected to become the economy with the highest gross debt-to-GDP ratio in the Euro-zone next year of 124.9%, according to estimates made by the European Commission in it its latest European Economic Forecast. This is forecast to be followed by Italy with 116.7% and Belgium at 101.2%. Spain as another major weak economy – particularly because of its size – has an expected debt/GDP ratio of only 66.3%. All these numbers compare with a Euro-zone average of 84.0% next year. The cost to insure Greek bonds against default has risen above Vietnam and Hungary recently. As is well known, Hungary was forced to turn to the IMF for financial support in early 2009, showcasing the weakening confidence in its ability to tackle its growing mountain of debt. As the cost of the crisis continues to weigh on Euro-zone’s budget discipline, the debt concern is certainly an area that investors will continue to challenge, most probably with higher interest rates as insurance for the higher risk they are taking. This may then have an impact on the strength of the Euro and the monetary policy of the ECB in the coming months. The ECB has signaled that it will not wait with a tightening of its monetary policy until unemployment is declining or inflation is in full swing, but act ahead of any such prospect. As inflation in November is up again at a level of 0.6% y-o-y, the ECB may consider such steps sooner rather than later. The ECB has indicated that it will begin to unwind its emergency credit measures, having distributed around 200 bn euros to the system, which has already added concerns that cheap funding of public deficits in the weaker economies might come to an end. Those emergency facilities, combined with very low interest rates made financing of public debt at low cost very easy. While bankruptcy of a Euro-zone economy still seems relatively
Monthly Oil Market Report_________________________________________________________________________________________________________________________________________
December 2009 18
remote, funding costs are possibly moving higher and governments will be obliged to cut costs, increase taxes and implement other unpleasant alternatives at a time when deficit spending would be needed. As this can hardly be afforded, growth in the coming quarters should be progressively less reliant on government funding.. A further worrying sign is the still high unemployment rate that remained at 9.8% in October, the same level as in September. Although this has stabilized, labour markets have witnessed strong support in the Euro-zone and it remains to be seen here as well whether, when this support is withdrawn – as part of it has been already, like in Germany the cash-for-clunkers and other supportive programmes – the unemployment level does not rise again. With the exception of mainly Germany, Ireland and Malta, all countries have recorded higher unemployment rates in October. Youth unemployment increased again by 0.3% to now stand at 20.6%. Again Spain had the highest ratio of 42.9%, 1% higher than in September. Retail sales in October were unchanged compared to a month earlier. The pattern over the last 6 months is still leaning towards the negative with three months unchanged and three months having posted negative sales-numbers. The industrial order numbers were more encouraging – they can be considered a front-running indicator - rising in September by 1.5% m-o-m, after an increase of 0.6% m-o-m the previous month. Exports improved in the main Euro-zone economy, Germany, in October, up 2.5% from the previous month, when they rose 3.6% m-o-m. In France, the second biggest Euro-zone economy, exports declined by 1.3% adding to the mixed picture that the Euro-zone is currently witnessing. The Euro-zone purchasing managers’ index (PMI) reflects a slightly positive momentum. PMI showed private sector activity expanding in October. The composite index, covering the Euro-zone services and manufacturing sector, rose to 53.7 in November, which compares to 53.0 in October, making this the fourth consecutive month of expansion. Taking into consideration the current positive development of the Euro-zone, but also the remaining challenges the economy will have to manage, the forecast was revised slightly higher with a growth expectation of minus 3.9% for 2009 and 0.6% for 2010.
Former Soviet Union Slowing inflation and desire to reduce speculative inflows to keep Russian interest rates low
Russian industrial production barely grew in October, data from the Federal Statistics Service showed, as a lack of bank lending stymied demand in key sectors of the economy. Industrial production for October grew by 0.8% from the previous month. Production was down by 13.3% in the period from January to October, and fell in October by 11.2% in comparison to a year ago.. Vital economic sectors like cement and brick production as well as automobiles showed only negligible growth or were down m-o-m, as consumers were unable to make major purchases due to a lack of bank lending.
The annual rate of consumer price inflation in Russia eased to 9.1% in November, from 9.7% in October. Inflation is now at its lowest level since August 2007. The central bank has cut key rates by 350 basis points this year to 9.5% –– partially in an effort to stimulate bank lending, which ground to a halt during Russia's first recession in a decade. But data for September showed that retail lending fell by 1.1% in October, the figure's eighth consecutive decline. Russia's economy returned to growth in the third quarter from the previous quarter, prompting government officials to declare that the country had emerged from its first recession in a decade. However, the government expects a 6.8% contraction in GDP for the second half and a 8.5% contraction for 2009 as a whole, after growth of 5.6% in 2008 and 8.1% the year before. Moreover, the Russian central bank will keep cutting interest rates as policy makers try to prevent speculative capital from flowing in and destabilizing the currency. The Finance Ministry said the country’s budget deficit rose to 4.9% of GDP from January to November 2009 compared to 4.7% from September to October. The Ministry said the federal budget deficit was estimated at 7.9% in November 2009.
_________________________________________________________________________________________________________________________________________Monthly Oil Market Report
December 2009 19
Ukraine will not receive latest installment by the IMF until after election
The International Monetary Fund (IMF) has decided to withhold the latest installment of a $16.8 billion loan to the Ukraine until after the presidential election next month. The installment, $3.5 billion, would be the fourth since last year to be paid to the Ukraine, which is facing its worst economic crisis in nearly two decades. The fund had already disbursed almost $11 billion to the country by July. The IMF has forecast that Ukraine’s economy will contract 15% this year, with inflation running above 16%.
Developing Countries China consumer prices rose 0.6% in November y-o-y; government support for the economy to continue in 2010
China's consumer prices rose for the first time in 10 months in November, as the stimulus-driven economic recovery fueled inflation. Official data released earlier this month showed the nation's consumer price index gained 0.6% in November from a year ago, although producer prices declined 2.1% during the month. Data also showed acceleration in other economic indicators, with monthly industrial production rising a better-than-expected 19.2% and retail sales climbing 15.8%. Urban fixed-asset investment, meanwhile, rose 32.1% in the first eleven months of the year. New loans topped forecasts and money supply expanded by a record, extending a credit boom that may fuel asset bubbles and inflation and has prompted plans by lenders, including Bank of China Ltd., to replenish capital. The government is adjusting its stimulus policies to curb property speculation, while extending subsidies for rural purchases of consumer goods and pledging a “moderately loose” monetary policy in 2010. The government will continue to tap into the domestic market for stable and relatively rapid economic growth next year. Policies to help rural households buy electric appliances will be kept, while subsidies to buy cars will be extended until the end of 2010. Financial assistance for those buying agricultural equipment would also be continued, along with policies to reduce sales tax on passenger cars. Spurred by China's fiscal stimulus, and some well-targeted tax cuts, auto sales in what is now the world's largest car market could well have risen 45% y-o-y by the end of 2009.
India’s economy expanded by 7.9% y-o-y in 3Q09, up from 6.1% in the previous quarter
India’s economy expanded by 7.9% y-o-y at factor cost in the July-September quarter of 2009, accelerating from the 6.1% growth rate of the preceding quarter. India's industrial sector maintained a robust pace of output growth in September – firms increased production by 9.1% y-o-y, following an 11% increase in August. Over the third quarter as a whole, industrial output growth averaged 9.1% y-o-y, compared to 3.8% in the second quarter. India's merchandise trade deficit narrowed to $8.8bn in October, from $11.7bn a month earlier, as the rate of decline in export revenue decelerated to a ten-month low. The value of exports dropped by 6.6%, less than half the 13.8% rate of contraction posted in September. The rate of decline in exports has been gradually falling since plummeting by 33.3% y-o-y in March.
OPEC Member Countries Strong economic performance in Nigeria in 3Q09
According to the National Bureau of Statistics in Nigeria, the economy expanded 7.07% in the third quarter of this year compared to 6.13% in the same quarter a year ago as the contribution of the oil sector rose. The contribution of oil to GDP rose to 16.52% compared to 15.54% a year earlier. In the third quarter, agriculture expanded 5.99% and telecommunications expanded an annual 34.7%.
IMF to reduce non-oil sector growth rate for UAE
The IMF could reduce its 2010 growth forecast for the UAE because of the recent debt crisis in Dubai. It is expected that that there will be a significant reduction in the non-oilsectoral growth rate, down from 3%, probably somewhere between 1% and 2%. The debt problems of Dubai World have dented confidence in the city and could lead to higher credit borrowing costs. Nevertheless, the UAE as a whole is expected to still register positive growth in 2010, albeit below the pre-crisis forecast, the IMF predicts.
Monthly Oil Market Report_________________________________________________________________________________________________________________________________________
December 2009 20
Oil prices, the US dollar and inflation The US dollar continued its decline against all major currencies, breaking the 1.50 level against the euro for the first time since August 2008
The US dollar continued its decline against the major currencies. It now fell for the ninth consecutive month against the euro and reached this year’s low just recently, when at the beginning of December it was breaking the 1.50-level to reach $1.5120/€. On a monthly level it declined by 0.7% to close at $1.4914/€ in November. Against the pound sterling it fell by 2.5%, versus the yen it declined by 1.20% and against the Swiss franc it fell by 0.9%. The continued weakness of the US dollar seems to be fuelled by rising carry trade as the appetite for risk rises. This could also reflect concerns regarding the pace of the economic recovery in the US and state of public finances. The latter concern might fade to a certain extent as the major currencies, i.e. the yen and the euro might come under more pressure due to the same weaknesses in their economies, as public debt in these regions increases sharply. The concerns of investors might pressure the euro and the yen against the US dollar. In November, the OPEC Reference Basket rose by $3.62/b or 5.0% to $76.29/b from $72.67/b in October. In real terms (base June 2001=100), after accounting for inflation and currency fluctuations, the Basket price increased by $1.84/b or 4.1% to $46.87/b from $45.03/b. The dollar declined by 0.8%, as measured against the import-weighted modified Geneva I + US dollar basket, while inflation remained almost flat with a rise of 0.1%.*
* The ‘modified Geneva I+US$ basket’ includes the euro, the Japanese yen, the US dollar, the pound sterling and the Swiss franc, weighted
according to the merchandise imports of OPEC Member Countries from the countries in the basket.
_________________________________________________________________________________________________________________________________________Monthly Oil Market Report
December 2009 21
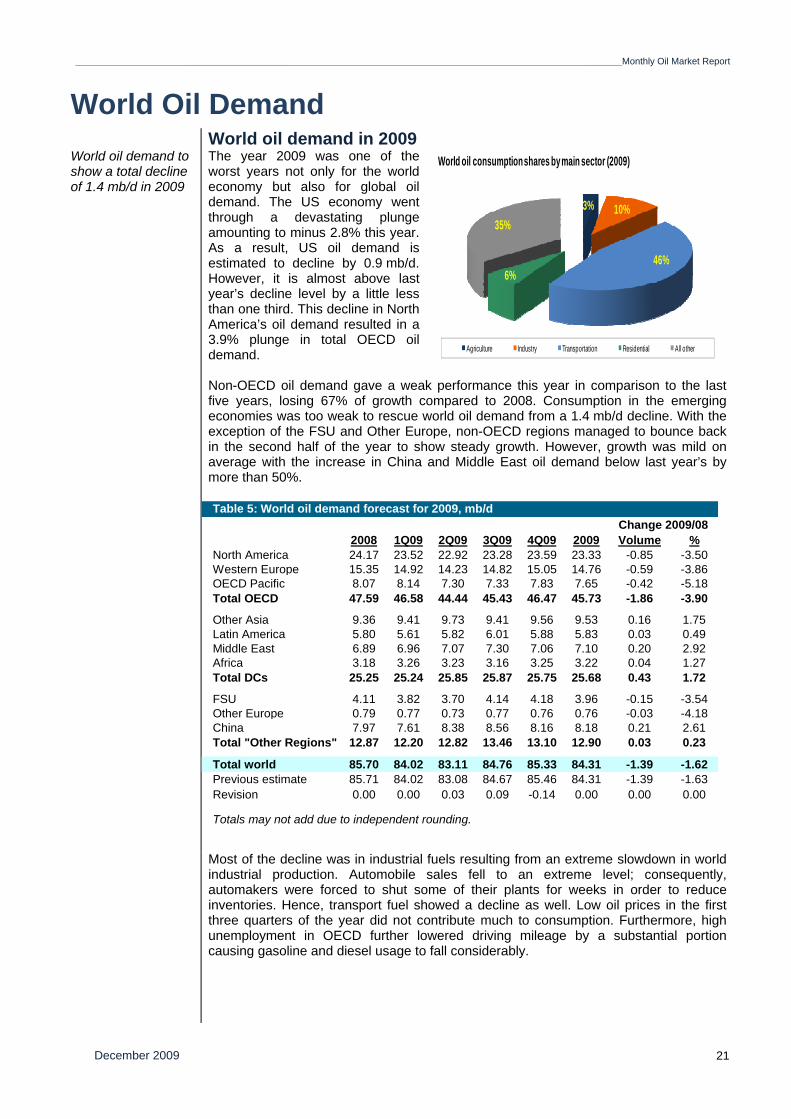
World Oil Demand World oil demand in 2009 World oil demand to show a total decline of 1.4 mb/d in 2009
The year 2009 was one of the worst years not only for the world economy but also for global oil demand. The US economy went through a devastating plunge amounting to minus 2.8% this year. As a result, US oil demand is estimated to decline by 0.9 mb/d. However, it is almost above last year’s decline level by a little less than one third. This decline in North America’s oil demand resulted in a 3.9% plunge in total OECD oil demand. Non-OECD oil demand gave a weak performance this year in comparison to the last five years, losing 67% of growth compared to 2008. Consumption in the emerging economies was too weak to rescue world oil demand from a 1.4 mb/d decline. With the exception of the FSU and Other Europe, non-OECD regions managed to bounce back in the second half of the year to show steady growth. However, growth was mild on average with the increase in China and Middle East oil demand below last year’s by more than 50%.
Most of the decline was in industrial fuels resulting from an extreme slowdown in world industrial production. Automobile sales fell to an extreme level; consequently, automakers were forced to shut some of their plants for weeks in order to reduce inventories. Hence, transport fuel showed a decline as well. Low oil prices in the first three quarters of the year did not contribute much to consumption. Furthermore, high unemployment in OECD further lowered driving mileage by a substantial portion causing gasoline and diesel usage to fall considerably.
2008 1Q09 2Q09 3Q09 4Q09 2009 Volume %North America 24.17 23.52 22.92 23.28 23.59 23.33 -0.85 -3.50Western Europe 15.35 14.92 14.23 14.82 15.05 14.76 -0.59 -3.86OECD Pacific 8.07 8.14 7.30 7.33 7.83 7.65 -0.42 -5.18Total OECD 47.59 46.58 44.44 45.43 46.47 45.73 -1.86 -3.90
Other Asia 9.36 9.41 9.73 9.41 9.56 9.53 0.16 1.75Latin America 5.80 5.61 5.82 6.01 5.88 5.83 0.03 0.49Middle East 6.89 6.96 7.07 7.30 7.06 7.10 0.20 2.92Africa 3.18 3.26 3.23 3.16 3.25 3.22 0.04 1.27Total DCs 25.25 25.24 25.85 25.87 25.75 25.68 0.43 1.72
FSU 4.11 3.82 3.70 4.14 4.18 3.96 -0.15 -3.54Other Europe 0.79 0.77 0.73 0.77 0.76 0.76 -0.03 -4.18China 7.97 7.61 8.38 8.56 8.16 8.18 0.21 2.61Total "Other Regions" 12.87 12.20 12.82 13.46 13.10 12.90 0.03 0.23
Total world 85.70 84.02 83.11 84.76 85.33 84.31 -1.39 -1.62Previous estimate 85.71 84.02 83.08 84.67 85.46 84.31 -1.39 -1.63Revision 0.00 0.00 0.03 0.09 -0.14 0.00 0.00 0.00
Totals may not add due to independent rounding.
Change 2009/08Table 5: World oil demand forecast for 2009, mb/d
3% 10%
46%6%
35%
Agriculture Industry Transportation Residential All other
World oil consumption shares by main sector (2009)
Monthly Oil Market Report_________________________________________________________________________________________________________________________________________
December 2009 22
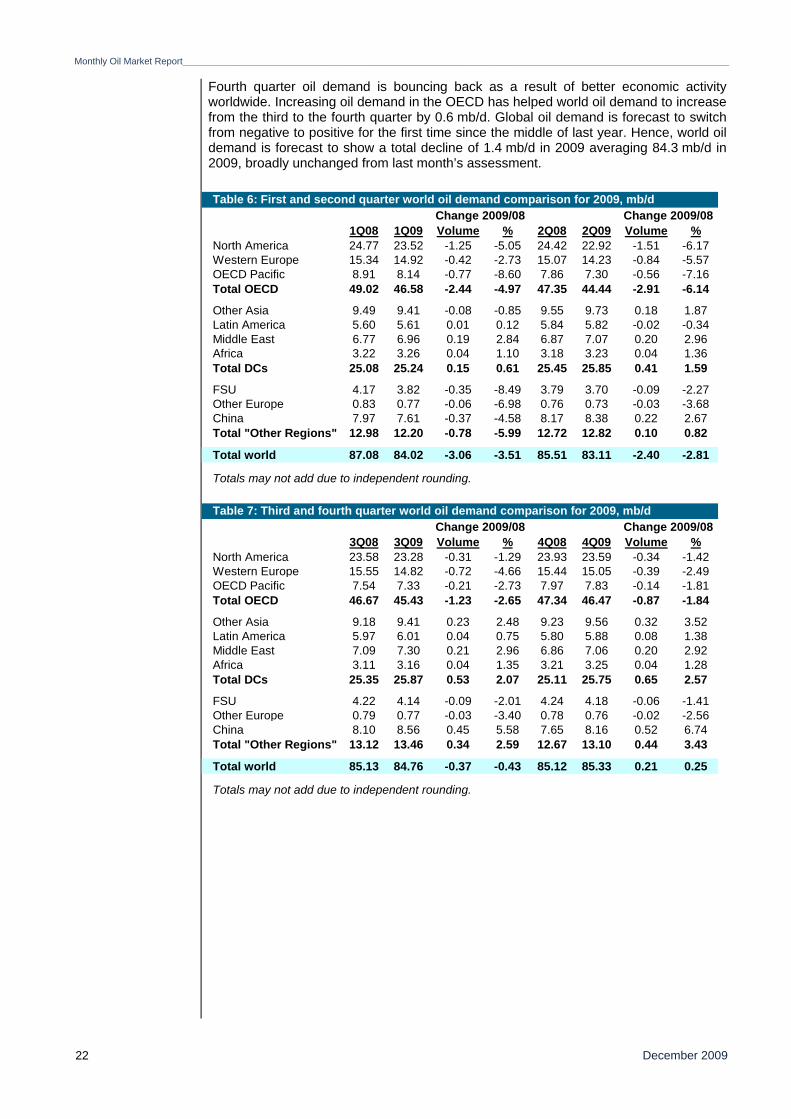
Fourth quarter oil demand is bouncing back as a result of better economic activity worldwide. Increasing oil demand in the OECD has helped world oil demand to increase from the third to the fourth quarter by 0.6 mb/d. Global oil demand is forecast to switch from negative to positive for the first time since the middle of last year. Hence, world oil demand is forecast to show a total decline of 1.4 mb/d in 2009 averaging 84.3 mb/d in 2009, broadly unchanged from last month’s assessment.
1Q08 1Q09 Volume % 2Q08 2Q09 Volume %North America 24.77 23.52 -1.25 -5.05 24.42 22.92 -1.51 -6.17Western Europe 15.34 14.92 -0.42 -2.73 15.07 14.23 -0.84 -5.57OECD Pacific 8.91 8.14 -0.77 -8.60 7.86 7.30 -0.56 -7.16Total OECD 49.02 46.58 -2.44 -4.97 47.35 44.44 -2.91 -6.14
Other Asia 9.49 9.41 -0.08 -0.85 9.55 9.73 0.18 1.87Latin America 5.60 5.61 0.01 0.12 5.84 5.82 -0.02 -0.34Middle East 6.77 6.96 0.19 2.84 6.87 7.07 0.20 2.96Africa 3.22 3.26 0.04 1.10 3.18 3.23 0.04 1.36Total DCs 25.08 25.24 0.15 0.61 25.45 25.85 0.41 1.59
FSU 4.17 3.82 -0.35 -8.49 3.79 3.70 -0.09 -2.27Other Europe 0.83 0.77 -0.06 -6.98 0.76 0.73 -0.03 -3.68China 7.97 7.61 -0.37 -4.58 8.17 8.38 0.22 2.67Total "Other Regions" 12.98 12.20 -0.78 -5.99 12.72 12.82 0.10 0.82
Total world 87.08 84.02 -3.06 -3.51 85.51 83.11 -2.40 -2.81
Totals may not add due to independent rounding.
Change 2009/08 Change 2009/08Table 6: First and second quarter world oil demand comparison for 2009, mb/d
3Q08 3Q09 Volume % 4Q08 4Q09 Volume %North America 23.58 23.28 -0.31 -1.29 23.93 23.59 -0.34 -1.42Western Europe 15.55 14.82 -0.72 -4.66 15.44 15.05 -0.39 -2.49OECD Pacific 7.54 7.33 -0.21 -2.73 7.97 7.83 -0.14 -1.81Total OECD 46.67 45.43 -1.23 -2.65 47.34 46.47 -0.87 -1.84
Other Asia 9.18 9.41 0.23 2.48 9.23 9.56 0.32 3.52Latin America 5.97 6.01 0.04 0.75 5.80 5.88 0.08 1.38Middle East 7.09 7.30 0.21 2.96 6.86 7.06 0.20 2.92Africa 3.11 3.16 0.04 1.35 3.21 3.25 0.04 1.28Total DCs 25.35 25.87 0.53 2.07 25.11 25.75 0.65 2.57
FSU 4.22 4.14 -0.09 -2.01 4.24 4.18 -0.06 -1.41Other Europe 0.79 0.77 -0.03 -3.40 0.78 0.76 -0.02 -2.56China 8.10 8.56 0.45 5.58 7.65 8.16 0.52 6.74Total "Other Regions" 13.12 13.46 0.34 2.59 12.67 13.10 0.44 3.43
Total world 85.13 84.76 -0.37 -0.43 85.12 85.33 0.21 0.25
Totals may not add due to independent rounding.
Change 2009/08Change 2009/08Table 7: Third and fourth quarter world oil demand comparison for 2009, mb/d
_________________________________________________________________________________________________________________________________________Monthly Oil Market Report
December 2009 23
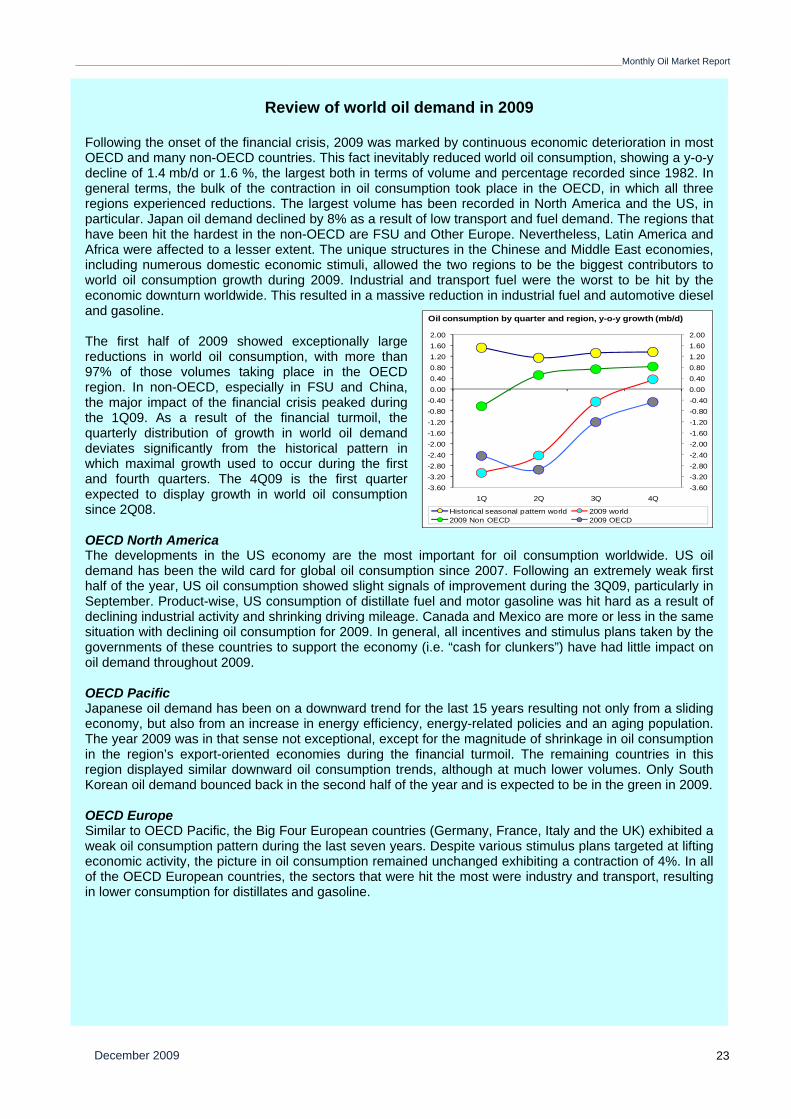
Review of world oil demand in 2009 Following the onset of the financial crisis, 2009 was marked by continuous economic deterioration in most OECD and many non-OECD countries. This fact inevitably reduced world oil consumption, showing a y-o-y decline of 1.4 mb/d or 1.6 %, the largest both in terms of volume and percentage recorded since 1982. In general terms, the bulk of the contraction in oil consumption took place in the OECD, in which all three regions experienced reductions. The largest volume has been recorded in North America and the US, in particular. Japan oil demand declined by 8% as a result of low transport and fuel demand. The regions that have been hit the hardest in the non-OECD are FSU and Other Europe. Nevertheless, Latin America and Africa were affected to a lesser extent. The unique structures in the Chinese and Middle East economies, including numerous domestic economic stimuli, allowed the two regions to be the biggest contributors to world oil consumption growth during 2009. Industrial and transport fuel were the worst to be hit by the economic downturn worldwide. This resulted in a massive reduction in industrial fuel and automotive diesel and gasoline. The first half of 2009 showed exceptionally large reductions in world oil consumption, with more than 97% of those volumes taking place in the OECD region. In non-OECD, especially in FSU and China, the major impact of the financial crisis peaked during the 1Q09. As a result of the financial turmoil, the quarterly distribution of growth in world oil demand deviates significantly from the historical pattern in which maximal growth used to occur during the first and fourth quarters. The 4Q09 is the first quarter expected to display growth in world oil consumption since 2Q08. OECD North America The developments in the US economy are the most important for oil consumption worldwide. US oil demand has been the wild card for global oil consumption since 2007. Following an extremely weak first half of the year, US oil consumption showed slight signals of improvement during the 3Q09, particularly in September. Product-wise, US consumption of distillate fuel and motor gasoline was hit hard as a result of declining industrial activity and shrinking driving mileage. Canada and Mexico are more or less in the same situation with declining oil consumption for 2009. In general, all incentives and stimulus plans taken by the governments of these countries to support the economy (i.e. “cash for clunkers”) have had little impact on oil demand throughout 2009. OECD Pacific Japanese oil demand has been on a downward trend for the last 15 years resulting not only from a sliding economy, but also from an increase in energy efficiency, energy-related policies and an aging population. The year 2009 was in that sense not exceptional, except for the magnitude of shrinkage in oil consumption in the region’s export-oriented economies during the financial turmoil. The remaining countries in this region displayed similar downward oil consumption trends, although at much lower volumes. Only South Korean oil demand bounced back in the second half of the year and is expected to be in the green in 2009. OECD Europe Similar to OECD Pacific, the Big Four European countries (Germany, France, Italy and the UK) exhibited a weak oil consumption pattern during the last seven years. Despite various stimulus plans targeted at lifting economic activity, the picture in oil consumption remained unchanged exhibiting a contraction of 4%. In all of the OECD European countries, the sectors that were hit the most were industry and transport, resulting in lower consumption for distillates and gasoline.
-3.60-3.20-2.80-2.40-2.00-1.60-1.20-0.80-0.400.000.400.801.201.602.00
-3.60-3.20-2.80-2.40-2.00-1.60-1.20-0.80-0.400.000.400.801.201.602.00
1Q 2Q 3Q 4Q
Historical seasonal pattern world 2009 world2009 Non OECD 2009 OECD
Oil consumption by quarter and region, y-o-y growth (mb/d)
Monthly Oil Market Report_________________________________________________________________________________________________________________________________________
December 2009 24
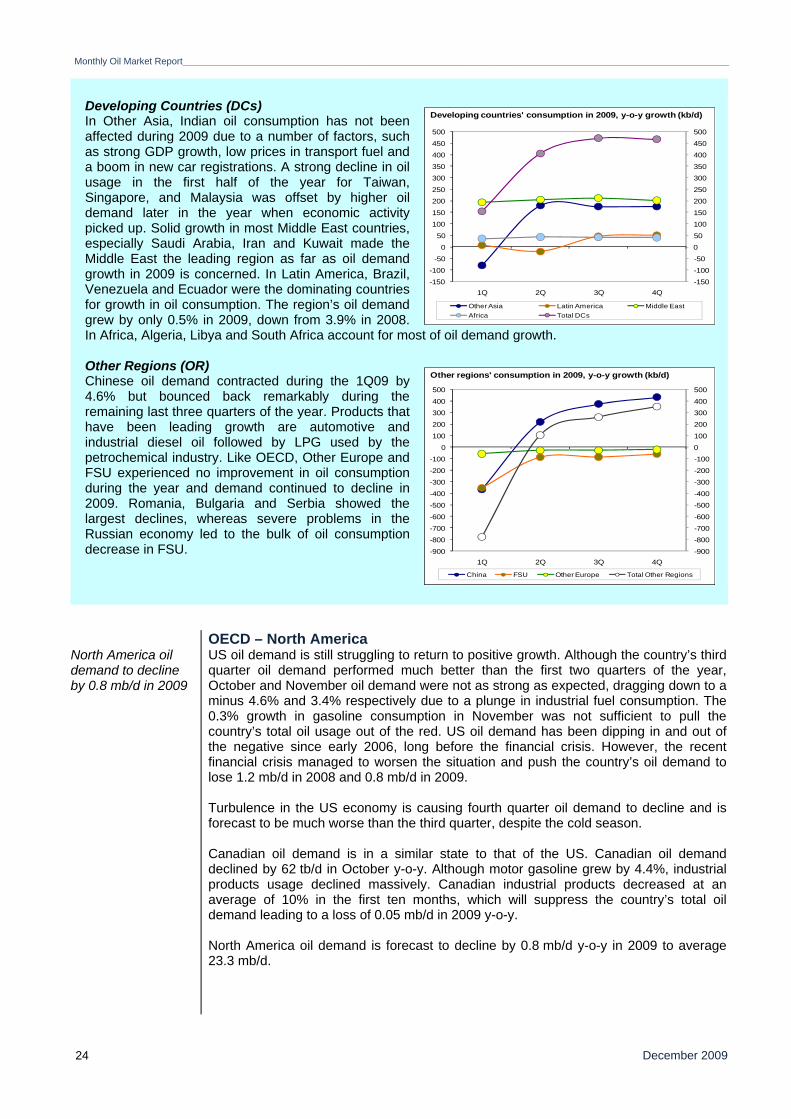
Developing Countries (DCs) In Other Asia, Indian oil consumption has not been affected during 2009 due to a number of factors, such as strong GDP growth, low prices in transport fuel and a boom in new car registrations. A strong decline in oil usage in the first half of the year for Taiwan, Singapore, and Malaysia was offset by higher oil demand later in the year when economic activity picked up. Solid growth in most Middle East countries, especially Saudi Arabia, Iran and Kuwait made the Middle East the leading region as far as oil demand growth in 2009 is concerned. In Latin America, Brazil, Venezuela and Ecuador were the dominating countries for growth in oil consumption. The region’s oil demand grew by only 0.5% in 2009, down from 3.9% in 2008. In Africa, Algeria, Libya and South Africa account for most of oil demand growth. Other Regions (OR) Chinese oil demand contracted during the 1Q09 by 4.6% but bounced back remarkably during the remaining last three quarters of the year. Products that have been leading growth are automotive and industrial diesel oil followed by LPG used by the petrochemical industry. Like OECD, Other Europe and FSU experienced no improvement in oil consumption during the year and demand continued to decline in 2009. Romania, Bulgaria and Serbia showed the largest declines, whereas severe problems in the Russian economy led to the bulk of oil consumption decrease in FSU.
OECD – North AmericaNorth America oil demand to decline by 0.8 mb/d in 2009
US oil demand is still struggling to return to positive growth. Although the country’s third quarter oil demand performed much better than the first two quarters of the year, October and November oil demand were not as strong as expected, dragging down to a minus 4.6% and 3.4% respectively due to a plunge in industrial fuel consumption. The 0.3% growth in gasoline consumption in November was not sufficient to pull the country’s total oil usage out of the red. US oil demand has been dipping in and out of the negative since early 2006, long before the financial crisis. However, the recent financial crisis managed to worsen the situation and push the country’s oil demand to lose 1.2 mb/d in 2008 and 0.8 mb/d in 2009. Turbulence in the US economy is causing fourth quarter oil demand to decline and is forecast to be much worse than the third quarter, despite the cold season. Canadian oil demand is in a similar state to that of the US. Canadian oil demand declined by 62 tb/d in October y-o-y. Although motor gasoline grew by 4.4%, industrial products usage declined massively. Canadian industrial products decreased at an average of 10% in the first ten months, which will suppress the country’s total oil demand leading to a loss of 0.05 mb/d in 2009 y-o-y. North America oil demand is forecast to decline by 0.8 mb/d y-o-y in 2009 to average 23.3 mb/d.
-150
-100
-50
0
50
100
150
200
250
300
350
400
450
500
-150
-100
-50
0
50
100
150
200
250
300
350
400
450
500
1Q 2Q 3Q 4Q
Other Asia Latin America Middle EastAfrica Total DCs
Developing countries' consumption in 2009, y-o-y growth (kb/d)
-900
-800
-700
-600
-500
-400
-300
-200
-100
0
100
200
300
400
500
-900
-800
-700
-600
-500
-400
-300
-200
-100
0
100
200
300
400
500
1Q 2Q 3Q 4Q
China FSU Other Europe Total Other Regions
Other regions' consumption in 2009, y-o-y growth (kb/d)
_________________________________________________________________________________________________________________________________________Monthly Oil Market Report
December 2009 25
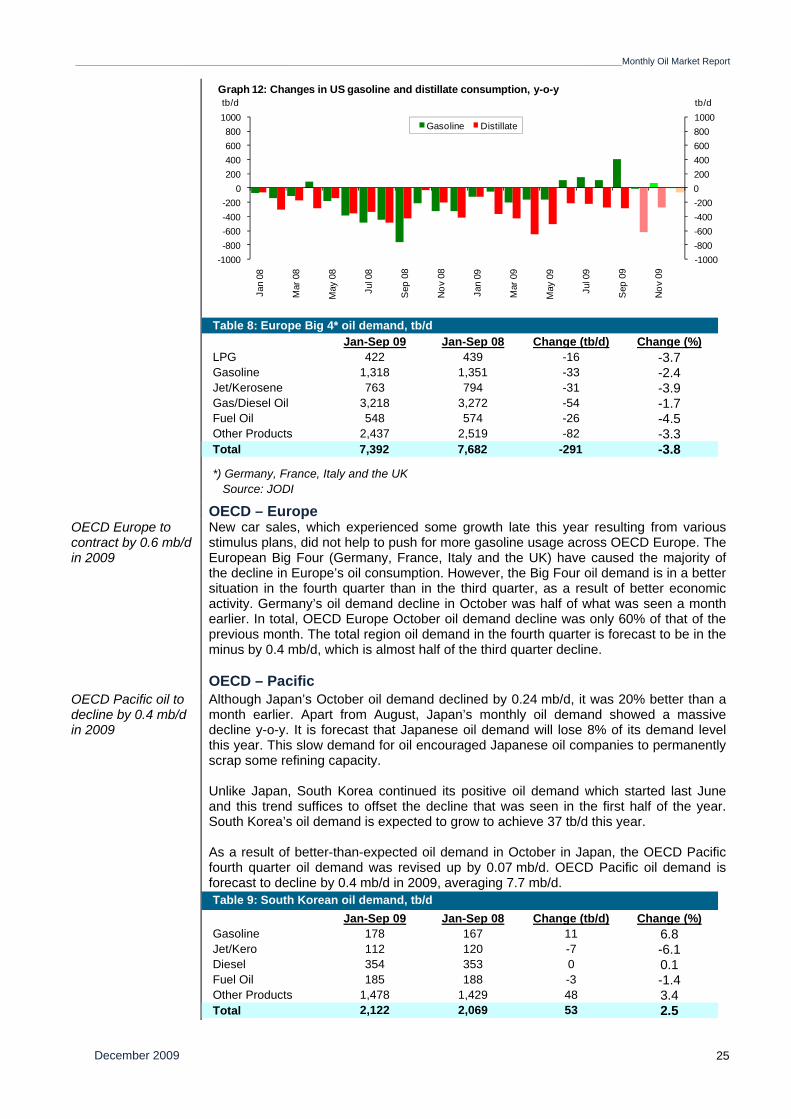
OECD – Europe OECD Europe to contract by 0.6 mb/d in 2009
New car sales, which experienced some growth late this year resulting from various stimulus plans, did not help to push for more gasoline usage across OECD Europe. The European Big Four (Germany, France, Italy and the UK) have caused the majority of the decline in Europe’s oil consumption. However, the Big Four oil demand is in a better situation in the fourth quarter than in the third quarter, as a result of better economic activity. Germany’s oil demand decline in October was half of what was seen a month earlier. In total, OECD Europe October oil demand decline was only 60% of that of the previous month. The total region oil demand in the fourth quarter is forecast to be in the minus by 0.4 mb/d, which is almost half of the third quarter decline.
OECD – Pacific OECD Pacific oil to decline by 0.4 mb/d in 2009
Although Japan’s October oil demand declined by 0.24 mb/d, it was 20% better than a month earlier. Apart from August, Japan’s monthly oil demand showed a massive decline y-o-y. It is forecast that Japanese oil demand will lose 8% of its demand level this year. This slow demand for oil encouraged Japanese oil companies to permanently scrap some refining capacity. Unlike Japan, South Korea continued its positive oil demand which started last June and this trend suffices to offset the decline that was seen in the first half of the year. South Korea’s oil demand is expected to grow to achieve 37 tb/d this year. As a result of better-than-expected oil demand in October in Japan, the OECD Pacific fourth quarter oil demand was revised up by 0.07 mb/d. OECD Pacific oil demand is forecast to decline by 0.4 mb/d in 2009, averaging 7.7 mb/d.
-1000-800-600-400-20002004006008001000
-1000-800-600-400-200
0200400600800
1000
Jan
08
Mar
08
May
08
Jul 0
8
Sep
08
Nov
08
Jan
09
Mar
09
May
09
Jul 0
9
Sep
09
Nov
09
tb/dtb/d
Gasoline Distillate
Graph 12: Changes in US gasoline and distillate consumption, y-o-y
Jan-Sep 09 Jan-Sep 08 Change (tb/d) Change (%)LPG 422 439 -16 -3.7Gasoline 1,318 1,351 -33 -2.4Jet/Kerosene 763 794 -31 -3.9Gas/Diesel Oil 3,218 3,272 -54 -1.7Fuel Oil 548 574 -26 -4.5Other Products 2,437 2,519 -82 -3.3Total 7,392 7,682 -291 -3.8
*) Germany, France, Italy and the UK Source: JODI
Table 8: Europe Big 4* oil demand, tb/d
Jan-Sep 09 Jan-Sep 08 Change (tb/d) Change (%)Gasoline 178 167 11 6.8Jet/Kero 112 120 -7 -6.1Diesel 354 353 0 0.1Fuel Oil 185 188 -3 -1.4Other Products 1,478 1,429 48 3.4Total 2,122 2,069 53 2.5
Table 9: South Korean oil demand, tb/d
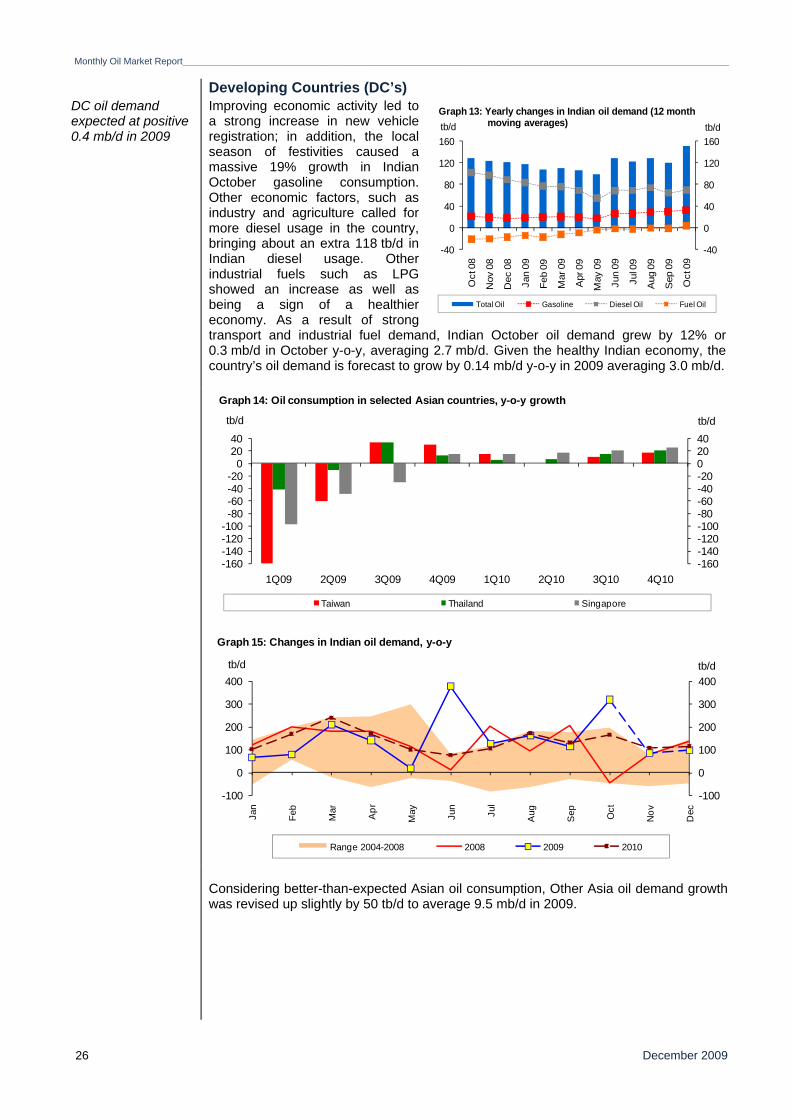
Monthly Oil Market Report_________________________________________________________________________________________________________________________________________
December 2009 26
Developing Countries (DC’s) DC oil demand expected at positive 0.4 mb/d in 2009
Improving economic activity led to a strong increase in new vehicle registration; in addition, the local season of festivities caused a massive 19% growth in Indian October gasoline consumption. Other economic factors, such as industry and agriculture called for more diesel usage in the country, bringing about an extra 118 tb/d in Indian diesel usage. Other industrial fuels such as LPG showed an increase as well as being a sign of a healthier economy. As a result of strong transport and industrial fuel demand, Indian October oil demand grew by 12% or 0.3 mb/d in October y-o-y, averaging 2.7 mb/d. Given the healthy Indian economy, the country’s oil demand is forecast to grow by 0.14 mb/d y-o-y in 2009 averaging 3.0 mb/d.
Considering better-than-expected Asian oil consumption, Other Asia oil demand growth was revised up slightly by 50 tb/d to average 9.5 mb/d in 2009.
-160-140-120-100-80-60-40-2002040
-160-140-120-100-80-60-40-20
02040
1Q09 2Q09 3Q09 4Q09 1Q10 2Q10 3Q10 4Q10
tb/dtb/d
Graph 14: Oil consumption in selected Asian countries, y-o-y growth
Taiwan Thailand Singapore
-100
0
100
200
300
400
-100
0
100
200
300
400
Jan
Feb
Mar
Apr
May Jun
Jul
Aug
Sep Oct
Nov
Dec
tb/dtb/d
Range 2004-2008 2008 2009 2010
Graph 15: Changes in Indian oil demand, y-o-y
-40
0
40
80
120
160
-40
0
40
80
120
160
Oct
08
Nov
08
Dec
08
Jan
09
Feb
09
Mar
09
Apr
09
May
09
Jun
09
Jul 0
9
Aug
09
Sep
09
Oct
09
tb/dtb/d
Total Oil Gasoline Diesel Oil Fuel Oil
Graph 13: Yearly changes in Indian oil demand (12 monthmoving averages)
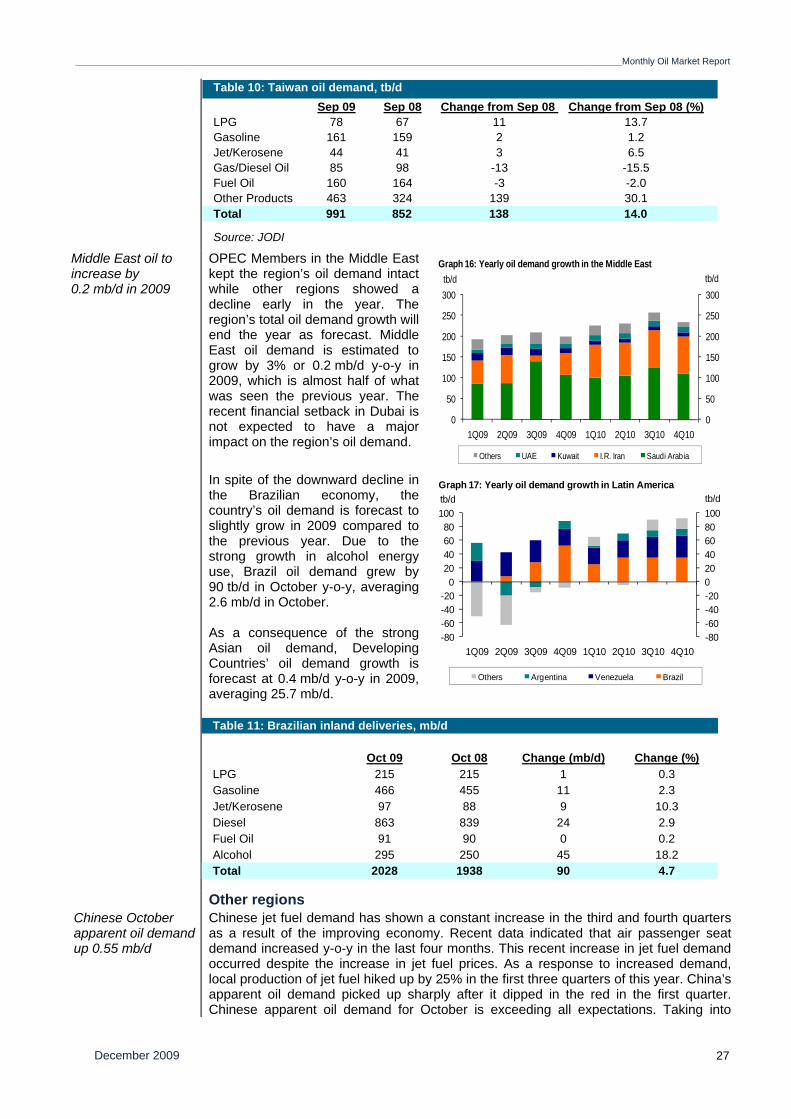
_________________________________________________________________________________________________________________________________________Monthly Oil Market Report
December 2009 27
Middle East oil to increase by 0.2 mb/d in 2009
OPEC Members in the Middle East kept the region’s oil demand intact while other regions showed a decline early in the year. The region’s total oil demand growth will end the year as forecast. Middle East oil demand is estimated to grow by 3% or 0.2 mb/d y-o-y in 2009, which is almost half of what was seen the previous year. The recent financial setback in Dubai is not expected to have a major impact on the region’s oil demand.
In spite of the downward decline in the Brazilian economy, the country’s oil demand is forecast to slightly grow in 2009 compared to the previous year. Due to the strong growth in alcohol energy use, Brazil oil demand grew by 90 tb/d in October y-o-y, averaging 2.6 mb/d in October. As a consequence of the strong Asian oil demand, Developing Countries’ oil demand growth is forecast at 0.4 mb/d y-o-y in 2009, averaging 25.7 mb/d.
Other regions Chinese October apparent oil demand up 0.55 mb/d
Chinese jet fuel demand has shown a constant increase in the third and fourth quarters as a result of the improving economy. Recent data indicated that air passenger seat demand increased y-o-y in the last four months. This recent increase in jet fuel demand occurred despite the increase in jet fuel prices. As a response to increased demand, local production of jet fuel hiked up by 25% in the first three quarters of this year. China’s apparent oil demand picked up sharply after it dipped in the red in the first quarter. Chinese apparent oil demand for October is exceeding all expectations. Taking into
Sep 09 Sep 08 Change from Sep 08 Change from Sep 08 (%)LPG 78 67 11 13.7Gasoline 161 159 2 1.2Jet/Kerosene 44 41 3 6.5Gas/Diesel Oil 85 98 -13 -15.5Fuel Oil 160 164 -3 -2.0Other Products 463 324 139 30.1Total 991 852 138 14.0
Source: JODI
Table 10: Taiwan oil demand, tb/d
Table 11: Brazilian inland deliveries, mb/d
Oct 09 Oct 08 Change (mb/d) Change (%)LPG 215 215 1 0.3Gasoline 466 455 11 2.3Jet/Kerosene 97 88 9 10.3Diesel 863 839 24 2.9Fuel Oil 91 90 0 0.2Alcohol 295 250 45 18.2Total 2028 1938 90 4.7
0
50
100
150
200
250
300
0
50
100
150
200
250
300
1Q09 2Q09 3Q09 4Q09 1Q10 2Q10 3Q10 4Q10
tb/dtb/d
Others UAE Kuwait I.R. Iran Saudi Arabia
Graph 16: Yearly oil demand growth in the Middle East
-80-60-40-20020406080100
-80-60-40-20
020406080
100
1Q09 2Q09 3Q09 4Q09 1Q10 2Q10 3Q10 4Q10
tb/dtb/d
Others Argentina Venezuela Brazil
Graph 17: Yearly oil demand growth in Latin America
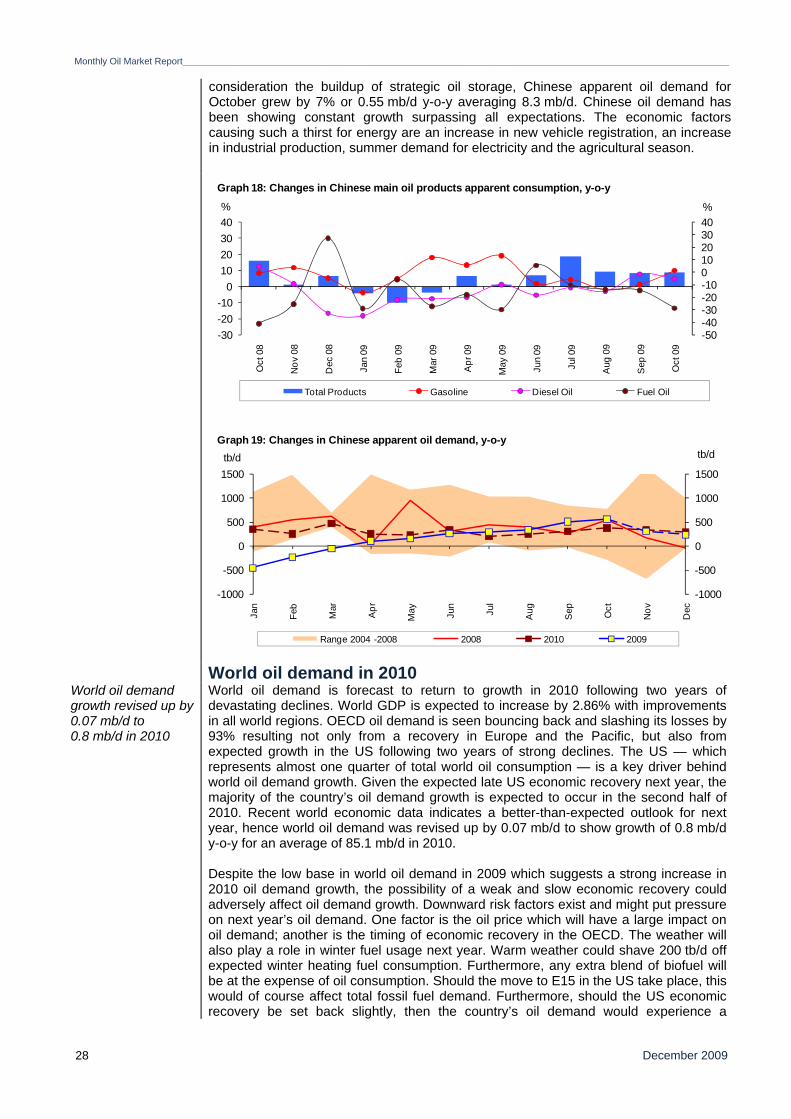
Monthly Oil Market Report_________________________________________________________________________________________________________________________________________
December 2009 28
consideration the buildup of strategic oil storage, Chinese apparent oil demand for October grew by 7% or 0.55 mb/d y-o-y averaging 8.3 mb/d. Chinese oil demand has been showing constant growth surpassing all expectations. The economic factors causing such a thirst for energy are an increase in new vehicle registration, an increase in industrial production, summer demand for electricity and the agricultural season.
World oil demand in 2010 World oil demand growth revised up by 0.07 mb/d to 0.8 mb/d in 2010
World oil demand is forecast to return to growth in 2010 following two years of devastating declines. World GDP is expected to increase by 2.86% with improvements in all world regions. OECD oil demand is seen bouncing back and slashing its losses by 93% resulting not only from a recovery in Europe and the Pacific, but also from expected growth in the US following two years of strong declines. The US — which represents almost one quarter of total world oil consumption — is a key driver behind world oil demand growth. Given the expected late US economic recovery next year, the majority of the country’s oil demand growth is expected to occur in the second half of 2010. Recent world economic data indicates a better-than-expected outlook for next year, hence world oil demand was revised up by 0.07 mb/d to show growth of 0.8 mb/d y-o-y for an average of 85.1 mb/d in 2010. Despite the low base in world oil demand in 2009 which suggests a strong increase in 2010 oil demand growth, the possibility of a weak and slow economic recovery could adversely affect oil demand growth. Downward risk factors exist and might put pressure on next year’s oil demand. One factor is the oil price which will have a large impact on oil demand; another is the timing of economic recovery in the OECD. The weather will also play a role in winter fuel usage next year. Warm weather could shave 200 tb/d off expected winter heating fuel consumption. Furthermore, any extra blend of biofuel will be at the expense of oil consumption. Should the move to E15 in the US take place, this would of course affect total fossil fuel demand. Furthermore, should the US economic recovery be set back slightly, then the country’s oil demand would experience a
-50-40-30-20-10010203040
-30-20-10
010203040
Oct
08
Nov
08
Dec
08
Jan
09
Feb
09
Mar
09
Apr
09
May
09
Jun
09
Jul 0
9
Aug
09
Sep
09
Oct
09
%%
Total Products Gasoline Diesel Oil Fuel Oil
Graph 18: Changes in Chinese main oil products apparent consumption, y-o-y
-1000
-500
0
500
1000
1500
-1000
-500
0
500
1000
1500
Jan
Feb
Mar
Apr
May Jun
Jul
Aug
Sep Oct
Nov
Dec
tb/dtb/d
Range 2004 -2008 2008 2010 2009
Graph 19: Changes in Chinese apparent oil demand, y-o-y
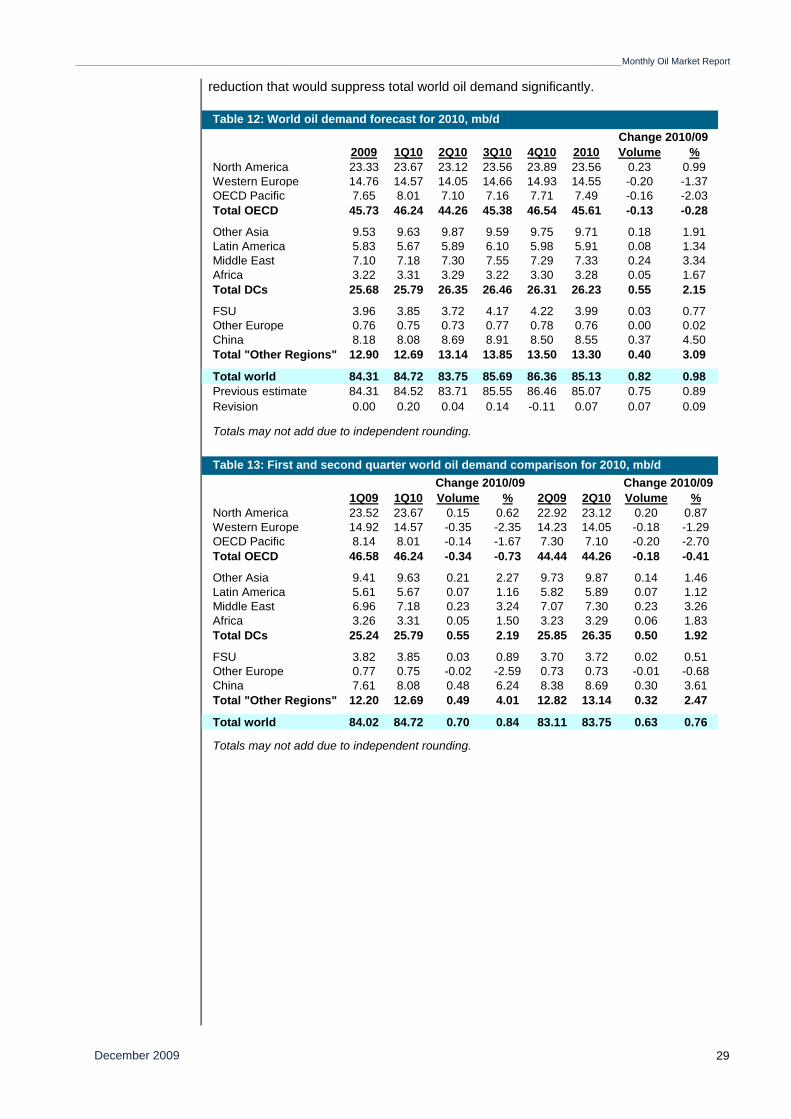
_________________________________________________________________________________________________________________________________________Monthly Oil Market Report
December 2009 29
reduction that would suppress total world oil demand significantly.
2009 1Q10 2Q10 3Q10 4Q10 2010 Volume %North America 23.33 23.67 23.12 23.56 23.89 23.56 0.23 0.99Western Europe 14.76 14.57 14.05 14.66 14.93 14.55 -0.20 -1.37OECD Pacific 7.65 8.01 7.10 7.16 7.71 7.49 -0.16 -2.03Total OECD 45.73 46.24 44.26 45.38 46.54 45.61 -0.13 -0.28
Other Asia 9.53 9.63 9.87 9.59 9.75 9.71 0.18 1.91Latin America 5.83 5.67 5.89 6.10 5.98 5.91 0.08 1.34Middle East 7.10 7.18 7.30 7.55 7.29 7.33 0.24 3.34Africa 3.22 3.31 3.29 3.22 3.30 3.28 0.05 1.67Total DCs 25.68 25.79 26.35 26.46 26.31 26.23 0.55 2.15
FSU 3.96 3.85 3.72 4.17 4.22 3.99 0.03 0.77Other Europe 0.76 0.75 0.73 0.77 0.78 0.76 0.00 0.02China 8.18 8.08 8.69 8.91 8.50 8.55 0.37 4.50Total "Other Regions" 12.90 12.69 13.14 13.85 13.50 13.30 0.40 3.09
Total world 84.31 84.72 83.75 85.69 86.36 85.13 0.82 0.98Previous estimate 84.31 84.52 83.71 85.55 86.46 85.07 0.75 0.89Revision 0.00 0.20 0.04 0.14 -0.11 0.07 0.07 0.09
Table 12: World oil demand forecast for 2010, mb/dChange 2010/09
Totals may not add due to independent rounding.
1Q09 1Q10 Volume % 2Q09 2Q10 Volume %North America 23.52 23.67 0.15 0.62 22.92 23.12 0.20 0.87Western Europe 14.92 14.57 -0.35 -2.35 14.23 14.05 -0.18 -1.29OECD Pacific 8.14 8.01 -0.14 -1.67 7.30 7.10 -0.20 -2.70Total OECD 46.58 46.24 -0.34 -0.73 44.44 44.26 -0.18 -0.41
Other Asia 9.41 9.63 0.21 2.27 9.73 9.87 0.14 1.46Latin America 5.61 5.67 0.07 1.16 5.82 5.89 0.07 1.12Middle East 6.96 7.18 0.23 3.24 7.07 7.30 0.23 3.26Africa 3.26 3.31 0.05 1.50 3.23 3.29 0.06 1.83Total DCs 25.24 25.79 0.55 2.19 25.85 26.35 0.50 1.92
FSU 3.82 3.85 0.03 0.89 3.70 3.72 0.02 0.51Other Europe 0.77 0.75 -0.02 -2.59 0.73 0.73 -0.01 -0.68China 7.61 8.08 0.48 6.24 8.38 8.69 0.30 3.61Total "Other Regions" 12.20 12.69 0.49 4.01 12.82 13.14 0.32 2.47
Total world 84.02 84.72 0.70 0.84 83.11 83.75 0.63 0.76
Totals may not add due to independent rounding.
Table 13: First and second quarter world oil demand comparison for 2010, mb/dChange 2010/09 Change 2010/09
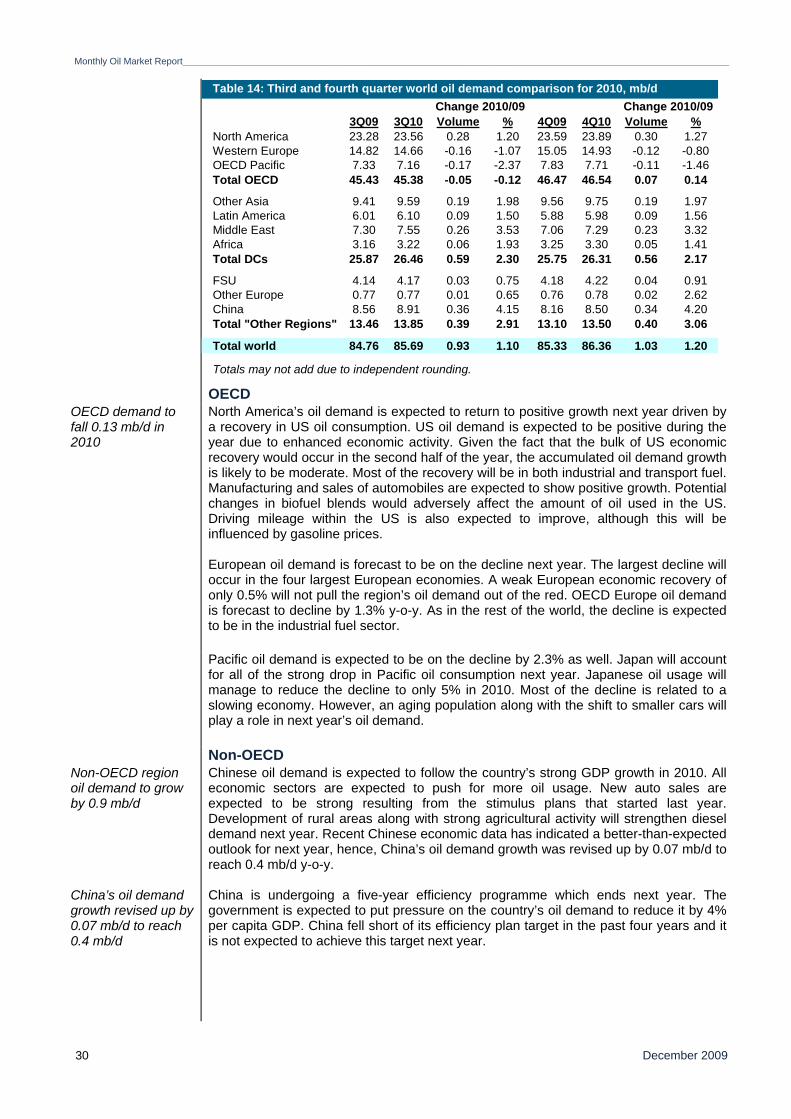
Monthly Oil Market Report_________________________________________________________________________________________________________________________________________
December 2009 30
OECD OECD demand to fall 0.13 mb/d in 2010
North America’s oil demand is expected to return to positive growth next year driven by a recovery in US oil consumption. US oil demand is expected to be positive during the year due to enhanced economic activity. Given the fact that the bulk of US economic recovery would occur in the second half of the year, the accumulated oil demand growth is likely to be moderate. Most of the recovery will be in both industrial and transport fuel. Manufacturing and sales of automobiles are expected to show positive growth. Potential changes in biofuel blends would adversely affect the amount of oil used in the US. Driving mileage within the US is also expected to improve, although this will be influenced by gasoline prices. European oil demand is forecast to be on the decline next year. The largest decline will occur in the four largest European economies. A weak European economic recovery of only 0.5% will not pull the region’s oil demand out of the red. OECD Europe oil demand is forecast to decline by 1.3% y-o-y. As in the rest of the world, the decline is expected to be in the industrial fuel sector.
Pacific oil demand is expected to be on the decline by 2.3% as well. Japan will account for all of the strong drop in Pacific oil consumption next year. Japanese oil usage will manage to reduce the decline to only 5% in 2010. Most of the decline is related to a slowing economy. However, an aging population along with the shift to smaller cars will play a role in next year’s oil demand.
Non-OECD Non-OECD region oil demand to grow by 0.9 mb/d
Chinese oil demand is expected to follow the country’s strong GDP growth in 2010. All economic sectors are expected to push for more oil usage. New auto sales are expected to be strong resulting from the stimulus plans that started last year. Development of rural areas along with strong agricultural activity will strengthen diesel demand next year. Recent Chinese economic data has indicated a better-than-expected outlook for next year, hence, China’s oil demand growth was revised up by 0.07 mb/d to reach 0.4 mb/d y-o-y.
China’s oil demand growth revised up by 0.07 mb/d to reach 0.4 mb/d
China is undergoing a five-year efficiency programme which ends next year. The government is expected to put pressure on the country’s oil demand to reduce it by 4% per capita GDP. China fell short of its efficiency plan target in the past four years and it is not expected to achieve this target next year.
3Q09 3Q10 Volume % 4Q09 4Q10 Volume %North America 23.28 23.56 0.28 1.20 23.59 23.89 0.30 1.27Western Europe 14.82 14.66 -0.16 -1.07 15.05 14.93 -0.12 -0.80OECD Pacific 7.33 7.16 -0.17 -2.37 7.83 7.71 -0.11 -1.46Total OECD 45.43 45.38 -0.05 -0.12 46.47 46.54 0.07 0.14
Other Asia 9.41 9.59 0.19 1.98 9.56 9.75 0.19 1.97Latin America 6.01 6.10 0.09 1.50 5.88 5.98 0.09 1.56Middle East 7.30 7.55 0.26 3.53 7.06 7.29 0.23 3.32Africa 3.16 3.22 0.06 1.93 3.25 3.30 0.05 1.41Total DCs 25.87 26.46 0.59 2.30 25.75 26.31 0.56 2.17
FSU 4.14 4.17 0.03 0.75 4.18 4.22 0.04 0.91Other Europe 0.77 0.77 0.01 0.65 0.76 0.78 0.02 2.62China 8.56 8.91 0.36 4.15 8.16 8.50 0.34 4.20Total "Other Regions" 13.46 13.85 0.39 2.91 13.10 13.50 0.40 3.06
Total world 84.76 85.69 0.93 1.10 85.33 86.36 1.03 1.20
Totals may not add due to independent rounding.
Table 14: Third and fourth quarter world oil demand comparison for 2010, mb/dChange 2010/09 Change 2010/09
_________________________________________________________________________________________________________________________________________Monthly Oil Market Report
December 2009 31
Middle East forecast to grow 0.24 mb/d in 2010
Middle East long-term energy-intensive projects along with subsidized transport fuel will keep the region’s oil demand growth within the range of 3.3%, slightly higher than 2009; however far less than the 6% growth of 2008. Given the fact that the region’s economy is expected to triple its strength, this will add an upward risk to the region’s oil demand. There is a higher chance that Middle East oil demand might be greater than existing forecasts by a third. Middle East oil demand growth is the second largest worldwide after China and has been on the sturdy side for years. The region’s oil demand is forecast to grow by 0.24 mb/d to average 7.3 mb/d. An increase in India’s GDP is likely to lead to increased oil consumption next year. India oil demand was not affected by the economic crisis in 2009; hence, next year’s oil usage is forecast to be in growth mode. All economic sectors are calling for more energy. New vehicle registrations are expected to continue the fast growth of 2009 and cause gasoline demand to grow by 15%, making it, percentagewise, the largest growing product of all. Total Other Asia region is estimated to use 0.18 mb/d more oil than in 2009. Given the high demand for oil in most of the non-OECD region, oil demand is expected to grow by 0.9 mb/d y-o-y in 2010.
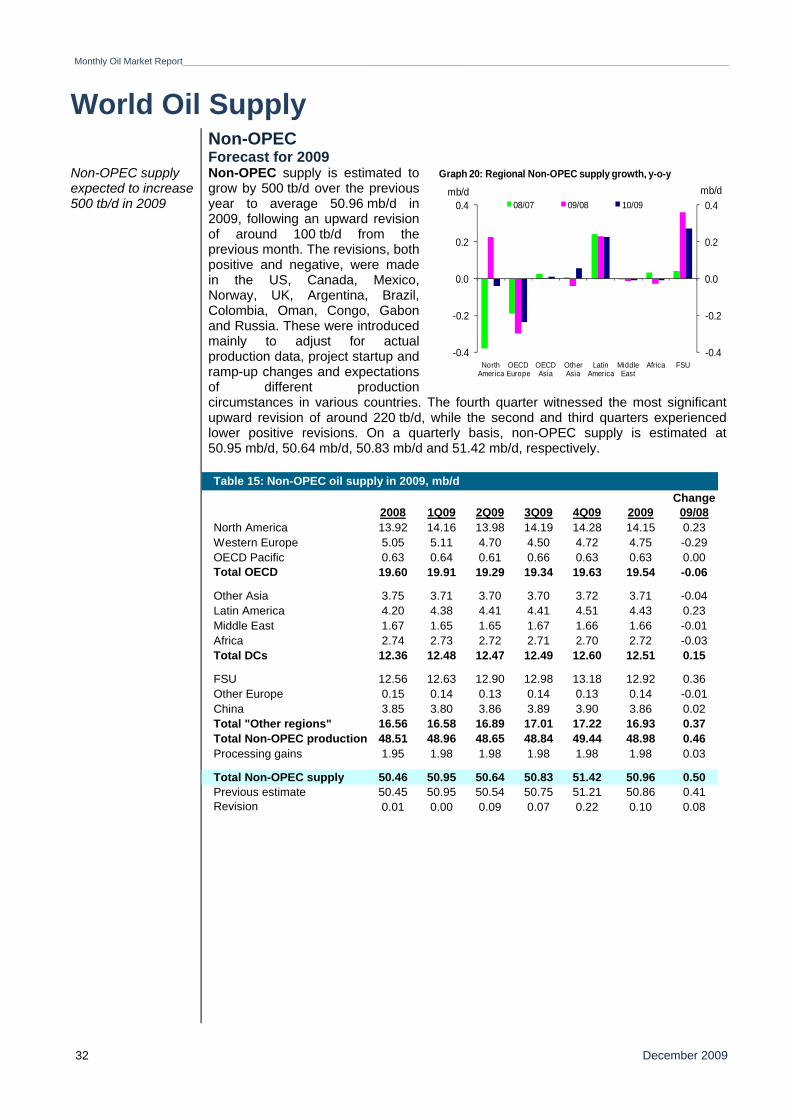
Monthly Oil Market Report_________________________________________________________________________________________________________________________________________
December 2009 32
World Oil Supply Non-OPEC Forecast for 2009Non-OPEC supply expected to increase 500 tb/d in 2009
Non-OPEC supply is estimated to grow by 500 tb/d over the previous year to average 50.96 mb/d in 2009, following an upward revision of around 100 tb/d from the previous month. The revisions, both positive and negative, were made in the US, Canada, Mexico, Norway, UK, Argentina, Brazil, Colombia, Oman, Congo, Gabon and Russia. These were introduced mainly to adjust for actual production data, project startup and ramp-up changes and expectations of different production circumstances in various countries. The fourth quarter witnessed the most significant upward revision of around 220 tb/d, while the second and third quarters experienced lower positive revisions. On a quarterly basis, non-OPEC supply is estimated at 50.95 mb/d, 50.64 mb/d, 50.83 mb/d and 51.42 mb/d, respectively.
Table 15: Non-OPEC oil supply in 2009, mb/dChange
2008 1Q09 2Q09 3Q09 4Q09 2009 09/08North America 13.92 14.16 13.98 14.19 14.28 14.15 0.23Western Europe 5.05 5.11 4.70 4.50 4.72 4.75 -0.29OECD Pacific 0.63 0.64 0.61 0.66 0.63 0.63 0.00Total OECD 19.60 19.91 19.29 19.34 19.63 19.54 -0.06
Other Asia 3.75 3.71 3.70 3.70 3.72 3.71 -0.04Latin America 4.20 4.38 4.41 4.41 4.51 4.43 0.23Middle East 1.67 1.65 1.65 1.67 1.66 1.66 -0.01Africa 2.74 2.73 2.72 2.71 2.70 2.72 -0.03Total DCs 12.36 12.48 12.47 12.49 12.60 12.51 0.15
FSU 12.56 12.63 12.90 12.98 13.18 12.92 0.36Other Europe 0.15 0.14 0.13 0.14 0.13 0.14 -0.01China 3.85 3.80 3.86 3.89 3.90 3.86 0.02Total "Other regions" 16.56 16.58 16.89 17.01 17.22 16.93 0.37Total Non-OPEC production 48.51 48.96 48.65 48.84 49.44 48.98 0.46Processing gains 1.95 1.98 1.98 1.98 1.98 1.98 0.03
Total Non-OPEC supply 50.46 50.95 50.64 50.83 51.42 50.96 0.50Previous estimate 50.45 50.95 50.54 50.75 51.21 50.86 0.41Revision 0.01 0.00 0.09 0.07 0.22 0.10 0.08
-0.4
-0.2
0.0
0.2
0.4
-0.4
-0.2
0.0
0.2
0.4
North America
OECD Europe
OECD Asia
Other Asia
Latin America
Middle East
Africa FSU
mb/dmb/d08/07 09/08 10/09
Graph 20: Regional Non-OPEC supply growth, y-o-y
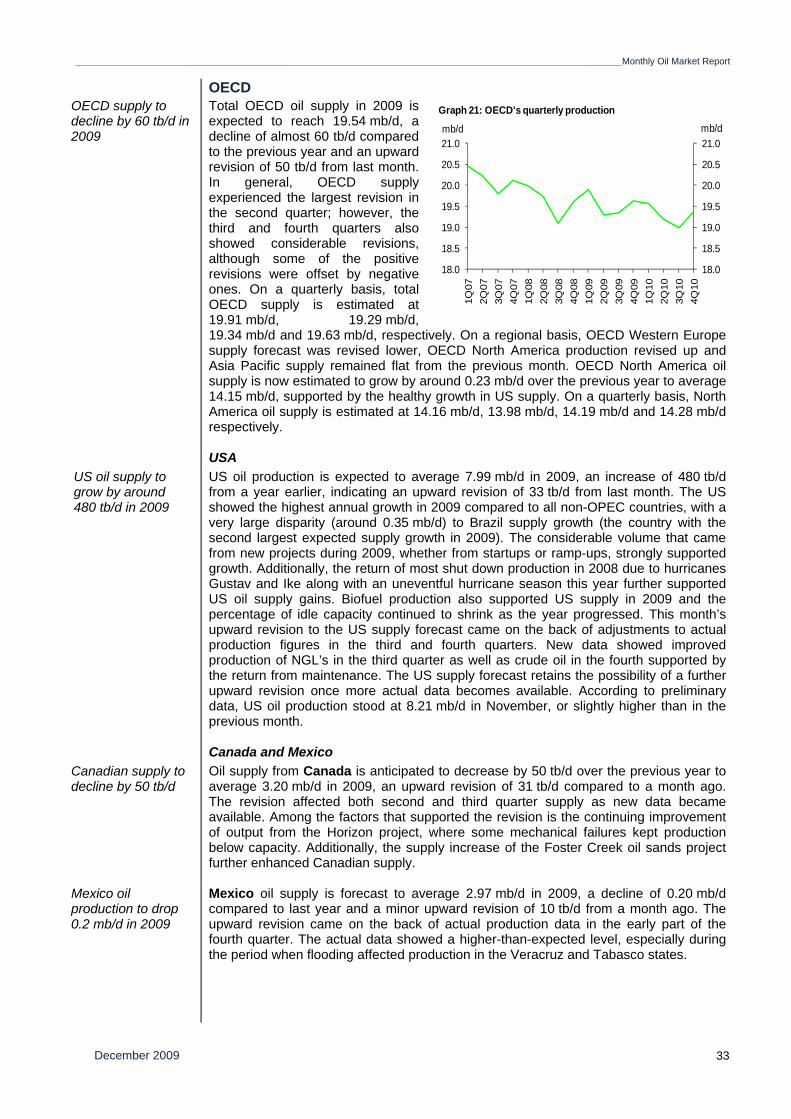
_________________________________________________________________________________________________________________________________________Monthly Oil Market Report
December 2009 33
OECD OECD supply to decline by 60 tb/d in 2009
Total OECD oil supply in 2009 is expected to reach 19.54 mb/d, a decline of almost 60 tb/d compared to the previous year and an upward revision of 50 tb/d from last month. In general, OECD supply experienced the largest revision in the second quarter; however, the third and fourth quarters also showed considerable revisions, although some of the positive revisions were offset by negative ones. On a quarterly basis, total OECD supply is estimated at 19.91 mb/d, 19.29 mb/d, 19.34 mb/d and 19.63 mb/d, respectively. On a regional basis, OECD Western Europe supply forecast was revised lower, OECD North America production revised up and Asia Pacific supply remained flat from the previous month. OECD North America oil supply is now estimated to grow by around 0.23 mb/d over the previous year to average 14.15 mb/d, supported by the healthy growth in US supply. On a quarterly basis, North America oil supply is estimated at 14.16 mb/d, 13.98 mb/d, 14.19 mb/d and 14.28 mb/d respectively.
USA US oil supply to grow by around 480 tb/d in 2009
US oil production is expected to average 7.99 mb/d in 2009, an increase of 480 tb/d from a year earlier, indicating an upward revision of 33 tb/d from last month. The US showed the highest annual growth in 2009 compared to all non-OPEC countries, with a very large disparity (around 0.35 mb/d) to Brazil supply growth (the country with the second largest expected supply growth in 2009). The considerable volume that came from new projects during 2009, whether from startups or ramp-ups, strongly supported growth. Additionally, the return of most shut down production in 2008 due to hurricanes Gustav and Ike along with an uneventful hurricane season this year further supported US oil supply gains. Biofuel production also supported US supply in 2009 and the percentage of idle capacity continued to shrink as the year progressed. This month’s upward revision to the US supply forecast came on the back of adjustments to actual production figures in the third and fourth quarters. New data showed improved production of NGL’s in the third quarter as well as crude oil in the fourth supported by the return from maintenance. The US supply forecast retains the possibility of a further upward revision once more actual data becomes available. According to preliminary data, US oil production stood at 8.21 mb/d in November, or slightly higher than in the previous month.
Canada and Mexico Canadian supply to decline by 50 tb/d
Oil supply from Canada is anticipated to decrease by 50 tb/d over the previous year to average 3.20 mb/d in 2009, an upward revision of 31 tb/d compared to a month ago. The revision affected both second and third quarter supply as new data became available. Among the factors that supported the revision is the continuing improvement of output from the Horizon project, where some mechanical failures kept production below capacity. Additionally, the supply increase of the Foster Creek oil sands project further enhanced Canadian supply.
Mexico oil production to drop 0.2 mb/d in 2009
Mexico oil supply is forecast to average 2.97 mb/d in 2009, a decline of 0.20 mb/d compared to last year and a minor upward revision of 10 tb/d from a month ago. The upward revision came on the back of actual production data in the early part of the fourth quarter. The actual data showed a higher-than-expected level, especially during the period when flooding affected production in the Veracruz and Tabasco states.
18.0
18.5
19.0
19.5
20.0
20.5
21.0
18.0
18.5
19.0
19.5
20.0
20.5
21.0
1Q07
2Q07
3Q07
4Q07
1Q08
2Q08
3Q08
4Q08
1Q09
2Q09
3Q09
4Q09
1Q10
2Q10
3Q10
4Q10
mb/dmb/d
Graph 21: OECD's quarterly production
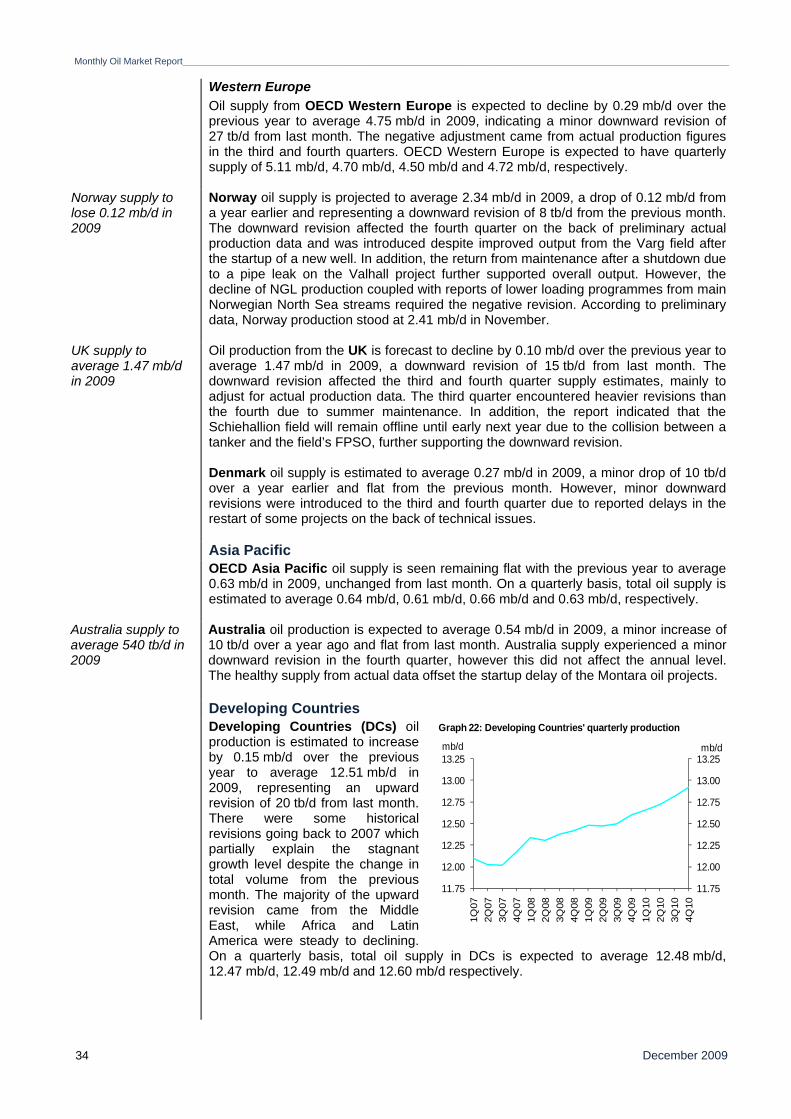
Monthly Oil Market Report_________________________________________________________________________________________________________________________________________
December 2009 34
Western Europe Oil supply from OECD Western Europe is expected to decline by 0.29 mb/d over the
previous year to average 4.75 mb/d in 2009, indicating a minor downward revision of 27 tb/d from last month. The negative adjustment came from actual production figures in the third and fourth quarters. OECD Western Europe is expected to have quarterly supply of 5.11 mb/d, 4.70 mb/d, 4.50 mb/d and 4.72 mb/d, respectively.
Norway supply to lose 0.12 mb/d in 2009
Norway oil supply is projected to average 2.34 mb/d in 2009, a drop of 0.12 mb/d from a year earlier and representing a downward revision of 8 tb/d from the previous month. The downward revision affected the fourth quarter on the back of preliminary actual production data and was introduced despite improved output from the Varg field after the startup of a new well. In addition, the return from maintenance after a shutdown due to a pipe leak on the Valhall project further supported overall output. However, the decline of NGL production coupled with reports of lower loading programmes from main Norwegian North Sea streams required the negative revision. According to preliminary data, Norway production stood at 2.41 mb/d in November.
UK supply to average 1.47 mb/d in 2009
Oil production from the UK is forecast to decline by 0.10 mb/d over the previous year to average 1.47 mb/d in 2009, a downward revision of 15 tb/d from last month. The downward revision affected the third and fourth quarter supply estimates, mainly to adjust for actual production data. The third quarter encountered heavier revisions than the fourth due to summer maintenance. In addition, the report indicated that the Schiehallion field will remain offline until early next year due to the collision between a tanker and the field’s FPSO, further supporting the downward revision. Denmark oil supply is estimated to average 0.27 mb/d in 2009, a minor drop of 10 tb/d over a year earlier and flat from the previous month. However, minor downward revisions were introduced to the third and fourth quarter due to reported delays in the restart of some projects on the back of technical issues.
Asia Pacific
OECD Asia Pacific oil supply is seen remaining flat with the previous year to average 0.63 mb/d in 2009, unchanged from last month. On a quarterly basis, total oil supply is estimated to average 0.64 mb/d, 0.61 mb/d, 0.66 mb/d and 0.63 mb/d, respectively.
Australia supply to average 540 tb/d in 2009
Australia oil production is expected to average 0.54 mb/d in 2009, a minor increase of 10 tb/d over a year ago and flat from last month. Australia supply experienced a minor downward revision in the fourth quarter, however this did not affect the annual level. The healthy supply from actual data offset the startup delay of the Montara oil projects.
Developing Countries Developing Countries (DCs) oil
production is estimated to increase by 0.15 mb/d over the previous year to average 12.51 mb/d in 2009, representing an upward revision of 20 tb/d from last month. There were some historical revisions going back to 2007 which partially explain the stagnant growth level despite the change in total volume from the previous month. The majority of the upward revision came from the Middle East, while Africa and Latin America were steady to declining. On a quarterly basis, total oil supply in DCs is expected to average 12.48 mb/d, 12.47 mb/d, 12.49 mb/d and 12.60 mb/d respectively.
11.75
12.00
12.25
12.50
12.75
13.00
13.25
11.75
12.00
12.25
12.50
12.75
13.00
13.25
1Q07
2Q07
3Q07
4Q07
1Q08
2Q08
3Q08
4Q08
1Q09
2Q09
3Q09
4Q09
1Q10
2Q10
3Q10
4Q10
mb/dmb/d
Graph 22: Developing Countries' quarterly production
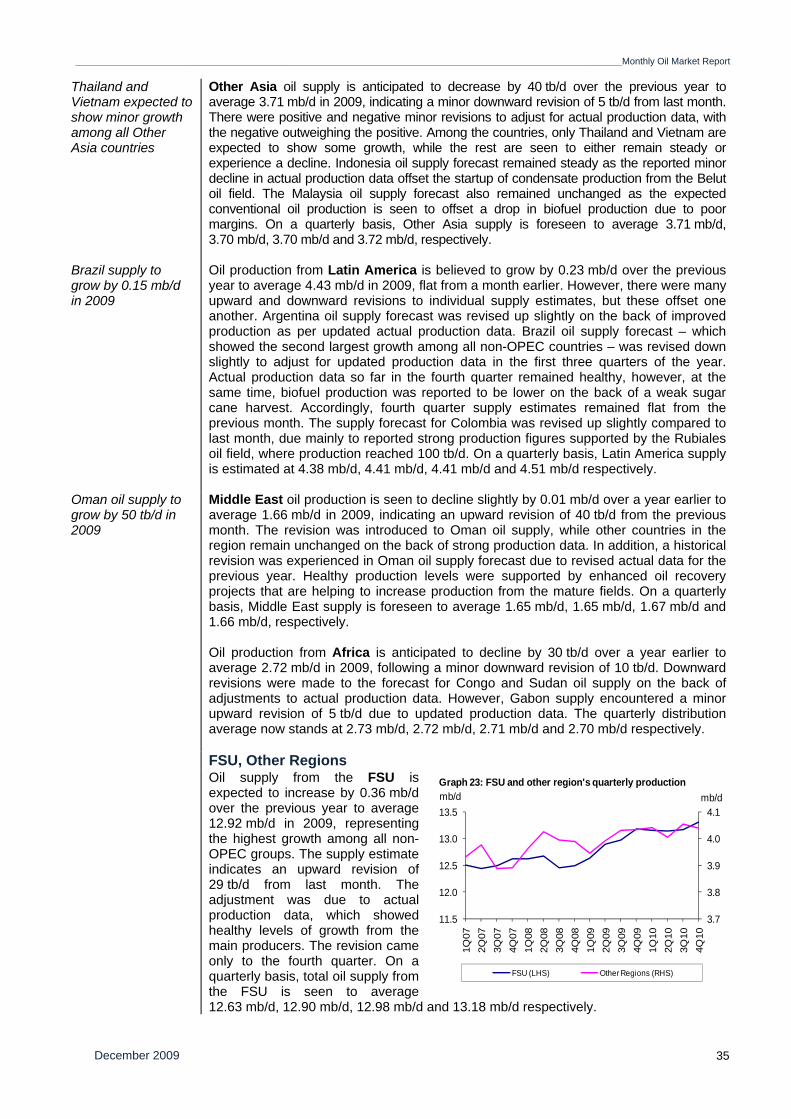
_________________________________________________________________________________________________________________________________________Monthly Oil Market Report
December 2009 35
Thailand and Vietnam expected to show minor growth among all Other Asia countries
Other Asia oil supply is anticipated to decrease by 40 tb/d over the previous year to average 3.71 mb/d in 2009, indicating a minor downward revision of 5 tb/d from last month. There were positive and negative minor revisions to adjust for actual production data, with the negative outweighing the positive. Among the countries, only Thailand and Vietnam are expected to show some growth, while the rest are seen to either remain steady or experience a decline. Indonesia oil supply forecast remained steady as the reported minor decline in actual production data offset the startup of condensate production from the Belut oil field. The Malaysia oil supply forecast also remained unchanged as the expected conventional oil production is seen to offset a drop in biofuel production due to poor margins. On a quarterly basis, Other Asia supply is foreseen to average 3.71 mb/d, 3.70 mb/d, 3.70 mb/d and 3.72 mb/d, respectively.
Brazil supply to grow by 0.15 mb/d in 2009
Oil production from Latin America is believed to grow by 0.23 mb/d over the previous year to average 4.43 mb/d in 2009, flat from a month earlier. However, there were many upward and downward revisions to individual supply estimates, but these offset one another. Argentina oil supply forecast was revised up slightly on the back of improved production as per updated actual production data. Brazil oil supply forecast – which showed the second largest growth among all non-OPEC countries – was revised down slightly to adjust for updated production data in the first three quarters of the year. Actual production data so far in the fourth quarter remained healthy, however, at the same time, biofuel production was reported to be lower on the back of a weak sugar cane harvest. Accordingly, fourth quarter supply estimates remained flat from the previous month. The supply forecast for Colombia was revised up slightly compared to last month, due mainly to reported strong production figures supported by the Rubiales oil field, where production reached 100 tb/d. On a quarterly basis, Latin America supply is estimated at 4.38 mb/d, 4.41 mb/d, 4.41 mb/d and 4.51 mb/d respectively.
Oman oil supply to grow by 50 tb/d in 2009
Middle East oil production is seen to decline slightly by 0.01 mb/d over a year earlier to average 1.66 mb/d in 2009, indicating an upward revision of 40 tb/d from the previous month. The revision was introduced to Oman oil supply, while other countries in the region remain unchanged on the back of strong production data. In addition, a historical revision was experienced in Oman oil supply forecast due to revised actual data for the previous year. Healthy production levels were supported by enhanced oil recovery projects that are helping to increase production from the mature fields. On a quarterly basis, Middle East supply is foreseen to average 1.65 mb/d, 1.65 mb/d, 1.67 mb/d and 1.66 mb/d, respectively. Oil production from Africa is anticipated to decline by 30 tb/d over a year earlier to average 2.72 mb/d in 2009, following a minor downward revision of 10 tb/d. Downward revisions were made to the forecast for Congo and Sudan oil supply on the back of adjustments to actual production data. However, Gabon supply encountered a minor upward revision of 5 tb/d due to updated production data. The quarterly distribution average now stands at 2.73 mb/d, 2.72 mb/d, 2.71 mb/d and 2.70 mb/d respectively.
FSU, Other Regions
Oil supply from the FSU is expected to increase by 0.36 mb/d over the previous year to average 12.92 mb/d in 2009, representing the highest growth among all non-OPEC groups. The supply estimate indicates an upward revision of 29 tb/d from last month. The adjustment was due to actual production data, which showed healthy levels of growth from the main producers. The revision came only to the fourth quarter. On a quarterly basis, total oil supply from the FSU is seen to average 12.63 mb/d, 12.90 mb/d, 12.98 mb/d and 13.18 mb/d respectively.
3.7
3.8
3.9
4.0
4.1
11.5
12.0
12.5
13.0
13.5
1Q07
2Q07
3Q07
4Q07
1Q08
2Q08
3Q08
4Q08
1Q09
2Q09
3Q09
4Q09
1Q10
2Q10
3Q10
4Q10
mb/dmb/d
FSU (LHS) Other Regions (RHS)
Graph 23: FSU and other region's quarterly production
Monthly Oil Market Report_________________________________________________________________________________________________________________________________________
December 2009 36
China oil supply is anticipated to grow slightly by 20 tb/d in 2009 to average 3.86 mb/d and Other Europe supply is believed to decline slightly by 10 tb/d to average 0.14 mb/d in 2009.
Russia Russia supply forecast to increase by 0.14 mb/d in 2009
Oil supply from Russia is expected to average 9.92 mb/d in 2009, an increase of 0.14 mb/d over the previous year, representing an upward revision of 25 tb/d from a month ago. The revision was introduced to adjust for actual production data that showed a further increase in production and created a new post-Soviet record. The revision came only to the fourth quarter supply estimate that is supported by the healthy production levels reported in October and November, as per preliminary data. Additionally, the export tax break, applicable to 13 fields and starting from December 2009, is encouraging producers to add more volume to take advantage of the tax break. The Vankor and Uvat fields were the main supporters of Russian oil production in 2009, and whether they will continue to offset the decline rate in other mature producing areas in the coming period with new fields, remains to be seen. On a quarterly basis, Russian oil supply is seen to average 9.78 mb/d, 9.88 mb/d, 9.97 mb/d and 10.05 mb/d respectively. Preliminary figures indicate that Russia oil production stood at 10.10 mb/d in November, higher than in the previous month.
Caspian Kazakh supply to average 1.54 mb/d in 2009, representing growth of 0.12 mb/d
Kazakhstan oil supply is projected to grow by 0.12 mb/d over the previous year to average 1.54 mb/d in 2009, relatively steady from a month earlier. Preliminary actual production data indicates a further increase in the fourth quarter; however, more details should be available before updating the estimate at this stage. Yet, a potential upward revision in the near future is more likely than a downward one, if no major production disruptions occur. November preliminary production data shows Kazakhstan supply at 1.63 mb/d, higher than a month earlier. Oil production from Azerbaijan is expected to grow by 0.12 mb/d over a year earlier to average 1.03 mb/d in 2009, unchanged from the previous month. The ACG field continues to add volume to Azerbaijan supply, while further export route capacities are becoming available. The quarterly breakdown now stands at 0.94 mb/d, 1.08 mb/d, 1.02 mb/d and 1.07 mb/d respectively.
China China supply forecast to average 3.86 mb/d in 2009
China oil production is seen to average 3.86 mb/d in 2009, an increase of 0.2 mb/d over a year ago, unchanged from the previous forecast. Actual production data remains supportive of the forecast, despite bad weather affecting production at the Huizhou area. The quarterly figures are seen to average 3.80 mb/d, 3.86 mb/d, 3.89 mb/d and 3.90 mb/d respectively.
Forecast for 2010Non-OPEC supply forecast to grow by 0.31 mb/d in 2010
Non-OPEC supply is expected to increase by 310 tb/d over the previous year to average 51.27 mb/d in 2010, indicating a minor upward revision of 42 tb/d from a month ago. The upward revision to total non-OPEC supply came with lower growth compared to last month’s estimates. There were various upward and downward revisions introduced to the 2010 supply forecast, with a considerable portion coming from the changes to the 2009 estimates. On a quarterly basis, non-OPEC supply is believed to average 51.39 mb/d, 51.05 mb/d, 51.02 mb/d and 51.62 respectively.
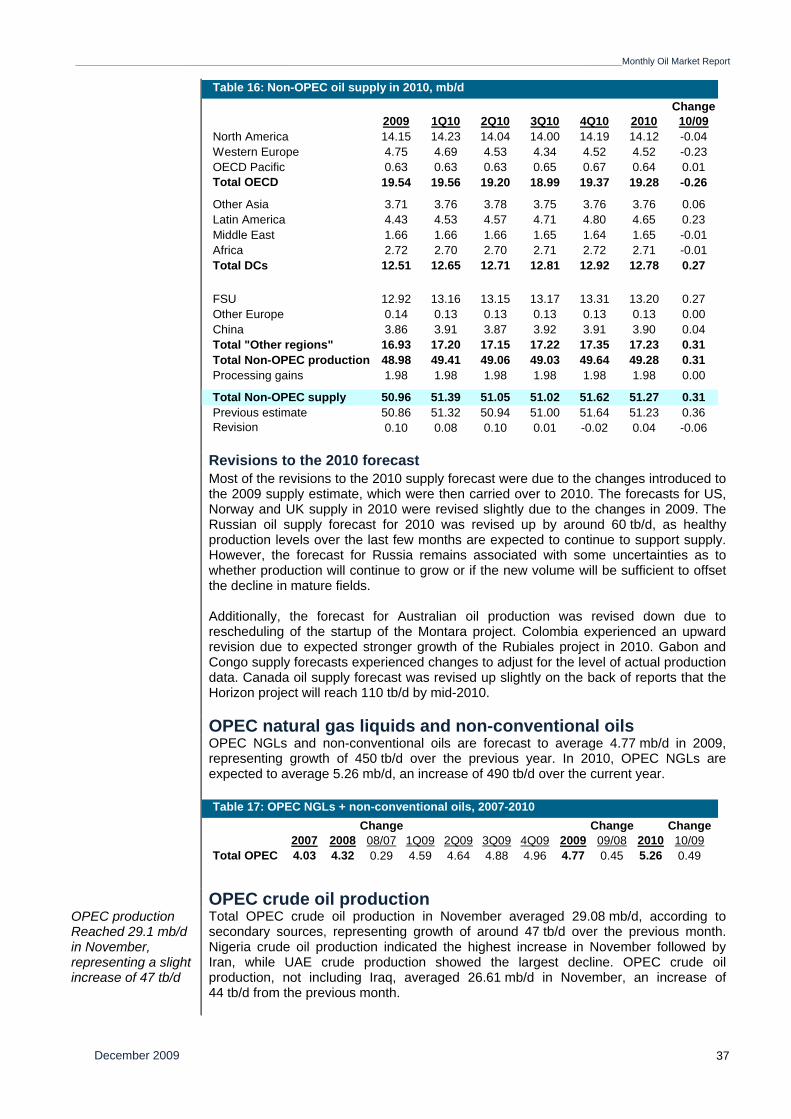
_________________________________________________________________________________________________________________________________________Monthly Oil Market Report
December 2009 37
Revisions to the 2010 forecast Most of the revisions to the 2010 supply forecast were due to the changes introduced to
the 2009 supply estimate, which were then carried over to 2010. The forecasts for US, Norway and UK supply in 2010 were revised slightly due to the changes in 2009. The Russian oil supply forecast for 2010 was revised up by around 60 tb/d, as healthy production levels over the last few months are expected to continue to support supply. However, the forecast for Russia remains associated with some uncertainties as to whether production will continue to grow or if the new volume will be sufficient to offset the decline in mature fields. Additionally, the forecast for Australian oil production was revised down due to rescheduling of the startup of the Montara project. Colombia experienced an upward revision due to expected stronger growth of the Rubiales project in 2010. Gabon and Congo supply forecasts experienced changes to adjust for the level of actual production data. Canada oil supply forecast was revised up slightly on the back of reports that the Horizon project will reach 110 tb/d by mid-2010.
OPEC natural gas liquids and non-conventional oils OPEC NGLs and non-conventional oils are forecast to average 4.77 mb/d in 2009,
representing growth of 450 tb/d over the previous year. In 2010, OPEC NGLs are expected to average 5.26 mb/d, an increase of 490 tb/d over the current year.
OPEC crude oil production OPEC production Reached 29.1 mb/d in November, representing a slight increase of 47 tb/d
Total OPEC crude oil production in November averaged 29.08 mb/d, according to secondary sources, representing growth of around 47 tb/d over the previous month. Nigeria crude oil production indicated the highest increase in November followed by Iran, while UAE crude production showed the largest decline. OPEC crude oil production, not including Iraq, averaged 26.61 mb/d in November, an increase of 44 tb/d from the previous month.
Table 16: Non-OPEC oil supply in 2010, mb/dChange
2009 1Q10 2Q10 3Q10 4Q10 2010 10/09North America 14.15 14.23 14.04 14.00 14.19 14.12 -0.04Western Europe 4.75 4.69 4.53 4.34 4.52 4.52 -0.23OECD Pacific 0.63 0.63 0.63 0.65 0.67 0.64 0.01Total OECD 19.54 19.56 19.20 18.99 19.37 19.28 -0.26
Other Asia 3.71 3.76 3.78 3.75 3.76 3.76 0.06Latin America 4.43 4.53 4.57 4.71 4.80 4.65 0.23Middle East 1.66 1.66 1.66 1.65 1.64 1.65 -0.01Africa 2.72 2.70 2.70 2.71 2.72 2.71 -0.01Total DCs 12.51 12.65 12.71 12.81 12.92 12.78 0.27
FSU 12.92 13.16 13.15 13.17 13.31 13.20 0.27Other Europe 0.14 0.13 0.13 0.13 0.13 0.13 0.00China 3.86 3.91 3.87 3.92 3.91 3.90 0.04Total "Other regions" 16.93 17.20 17.15 17.22 17.35 17.23 0.31Total Non-OPEC production 48.98 49.41 49.06 49.03 49.64 49.28 0.31Processing gains 1.98 1.98 1.98 1.98 1.98 1.98 0.00
Total Non-OPEC supply 50.96 51.39 51.05 51.02 51.62 51.27 0.31Previous estimate 50.86 51.32 50.94 51.00 51.64 51.23 0.36Revision 0.10 0.08 0.10 0.01 -0.02 0.04 -0.06
Change Change Change2007 2008 08/07 1Q09 2Q09 3Q09 4Q09 2009 09/08 2010 10/09
Total OPEC 4.03 4.32 0.29 4.59 4.64 4.88 4.96 4.77 0.45 5.26 0.49
Table 17: OPEC NGLs + non-conventional oils, 2007-2010
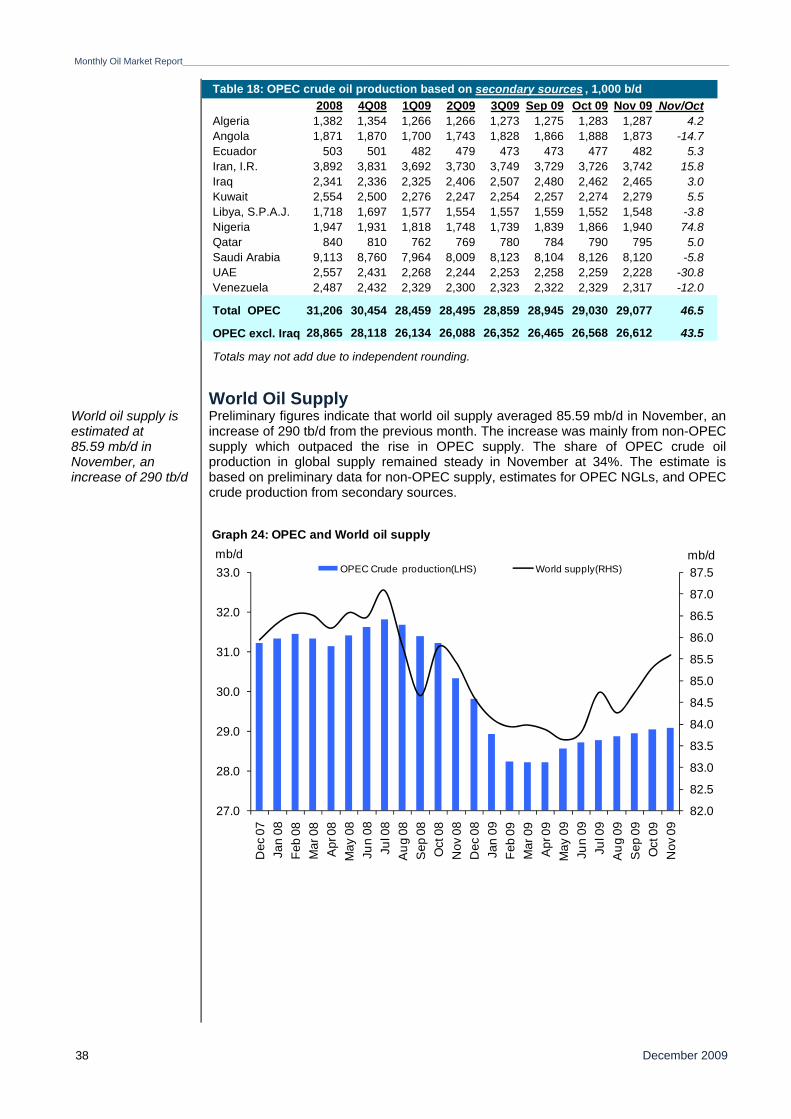
Monthly Oil Market Report_________________________________________________________________________________________________________________________________________
December 2009 38
World Oil Supply World oil supply is estimated at 85.59 mb/d in November, an increase of 290 tb/d
Preliminary figures indicate that world oil supply averaged 85.59 mb/d in November, an increase of 290 tb/d from the previous month. The increase was mainly from non-OPEC supply which outpaced the rise in OPEC supply. The share of OPEC crude oil production in global supply remained steady in November at 34%. The estimate is based on preliminary data for non-OPEC supply, estimates for OPEC NGLs, and OPEC crude production from secondary sources.
Table 18: OPEC crude oil production based on secondary sources , 1,000 b/d2008 4Q08 1Q09 2Q09 3Q09 Sep 09 Oct 09 Nov 09 Nov/Oct
Algeria 1,382 1,354 1,266 1,266 1,273 1,275 1,283 1,287 4.2Angola 1,871 1,870 1,700 1,743 1,828 1,866 1,888 1,873 -14.7Ecuador 503 501 482 479 473 473 477 482 5.3Iran, I.R. 3,892 3,831 3,692 3,730 3,749 3,729 3,726 3,742 15.8Iraq 2,341 2,336 2,325 2,406 2,507 2,480 2,462 2,465 3.0Kuwait 2,554 2,500 2,276 2,247 2,254 2,257 2,274 2,279 5.5Libya, S.P.A.J. 1,718 1,697 1,577 1,554 1,557 1,559 1,552 1,548 -3.8Nigeria 1,947 1,931 1,818 1,748 1,739 1,839 1,866 1,940 74.8Qatar 840 810 762 769 780 784 790 795 5.0Saudi Arabia 9,113 8,760 7,964 8,009 8,123 8,104 8,126 8,120 -5.8UAE 2,557 2,431 2,268 2,244 2,253 2,258 2,259 2,228 -30.8Venezuela 2,487 2,432 2,329 2,300 2,323 2,322 2,329 2,317 -12.0
Total OPEC 31,206 30,454 28,459 28,495 28,859 28,945 29,030 29,077 46.5
OPEC excl. Iraq 28,865 28,118 26,134 26,088 26,352 26,465 26,568 26,612 43.5
Totals may not add due to independent rounding.
82.0
82.5
83.0
83.5
84.0
84.5
85.0
85.5
86.0
86.5
87.0
87.5
27.0
28.0
29.0
30.0
31.0
32.0
33.0
Dec
07
Jan
08Fe
b 08
Mar
08
Apr
08
May
08
Jun
08Ju
l 08
Aug
08
Sep
08
Oct
08
Nov
08
Dec
08
Jan
09Fe
b 09
Mar
09
Apr
09
May
09
Jun
09Ju
l 09
Aug
09
Sep
09
Oct
09
Nov
09
mb/dmb/dOPEC Crude production(LHS) World supply(RHS)
Graph 24: OPEC and World oil supply
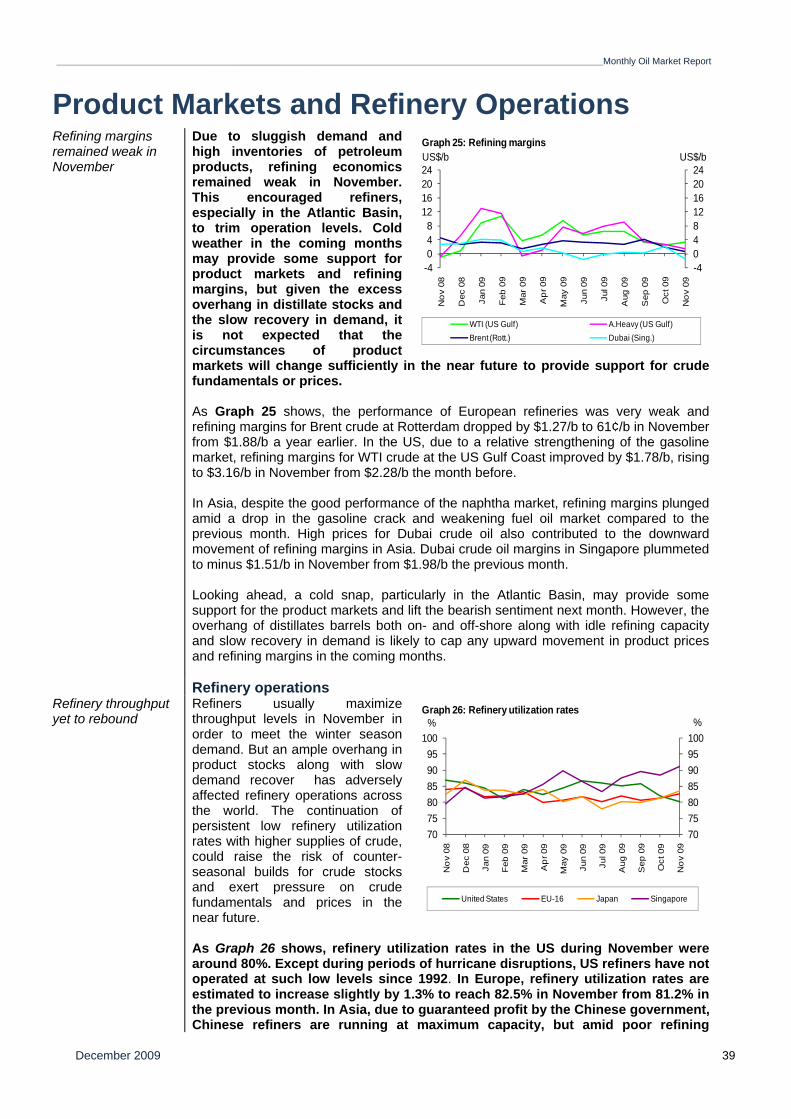
_________________________________________________________________________________________________________________________________________Monthly Oil Market Report
December 2009 39
Product Markets and Refinery Operations Refining margins remained weak in November
Due to sluggish demand and high inventories of petroleum products, refining economics remained weak in November. This encouraged refiners, especially in the Atlantic Basin, to trim operation levels. Cold weather in the coming months may provide some support for product markets and refining margins, but given the excess overhang in distillate stocks and the slow recovery in demand, it is not expected that the circumstances of product markets will change sufficiently in the near future to provide support for crude fundamentals or prices. As Graph 25 shows, the performance of European refineries was very weak and refining margins for Brent crude at Rotterdam dropped by $1.27/b to 61¢/b in November from $1.88/b a year earlier. In the US, due to a relative strengthening of the gasoline market, refining margins for WTI crude at the US Gulf Coast improved by $1.78/b, rising to $3.16/b in November from $2.28/b the month before. In Asia, despite the good performance of the naphtha market, refining margins plunged amid a drop in the gasoline crack and weakening fuel oil market compared to the previous month. High prices for Dubai crude oil also contributed to the downward movement of refining margins in Asia. Dubai crude oil margins in Singapore plummeted to minus $1.51/b in November from $1.98/b the previous month. Looking ahead, a cold snap, particularly in the Atlantic Basin, may provide some support for the product markets and lift the bearish sentiment next month. However, the overhang of distillates barrels both on- and off-shore along with idle refining capacity and slow recovery in demand is likely to cap any upward movement in product prices and refining margins in the coming months.
Refinery operationsRefinery throughput yet to rebound
Refiners usually maximize throughput levels in November in order to meet the winter season demand. But an ample overhang in product stocks along with slow demand recover has adversely affected refinery operations across the world. The continuation of persistent low refinery utilization rates with higher supplies of crude, could raise the risk of counter-seasonal builds for crude stocks and exert pressure on crude fundamentals and prices in the near future. As Graph 26 shows, refinery utilization rates in the US during November were around 80%. Except during periods of hurricane disruptions, US refiners have not operated at such low levels since 1992. In Europe, refinery utilization rates are estimated to increase slightly by 1.3% to reach 82.5% in November from 81.2% in the previous month. In Asia, due to guaranteed profit by the Chinese government, Chinese refiners are running at maximum capacity, but amid poor refining
-404812162024
-4048
12162024
No
v 08
Dec
08
Jan
09
Feb
09
Mar
09
Ap
r 09
May
09
Jun
09
Jul 0
9
Aug
09
Sep
09
Oct
09
No
v 09
US$/bUS$/b
WTI (US Gulf) A.Heavy (US Gulf)Brent (Rott.) Dubai (Sing.)
Graph 25: Refining margins
707580859095100
707580859095
100
No
v 08
Dec
08
Jan
09
Feb
09
Mar
09
Ap
r 09
May
09
Jun
09
Jul 0
9
Aug
09
Sep
09
Oct
09
No
v 09
%%
United States EU-16 Japan Singapore
Graph 26: Refinery utilization rates
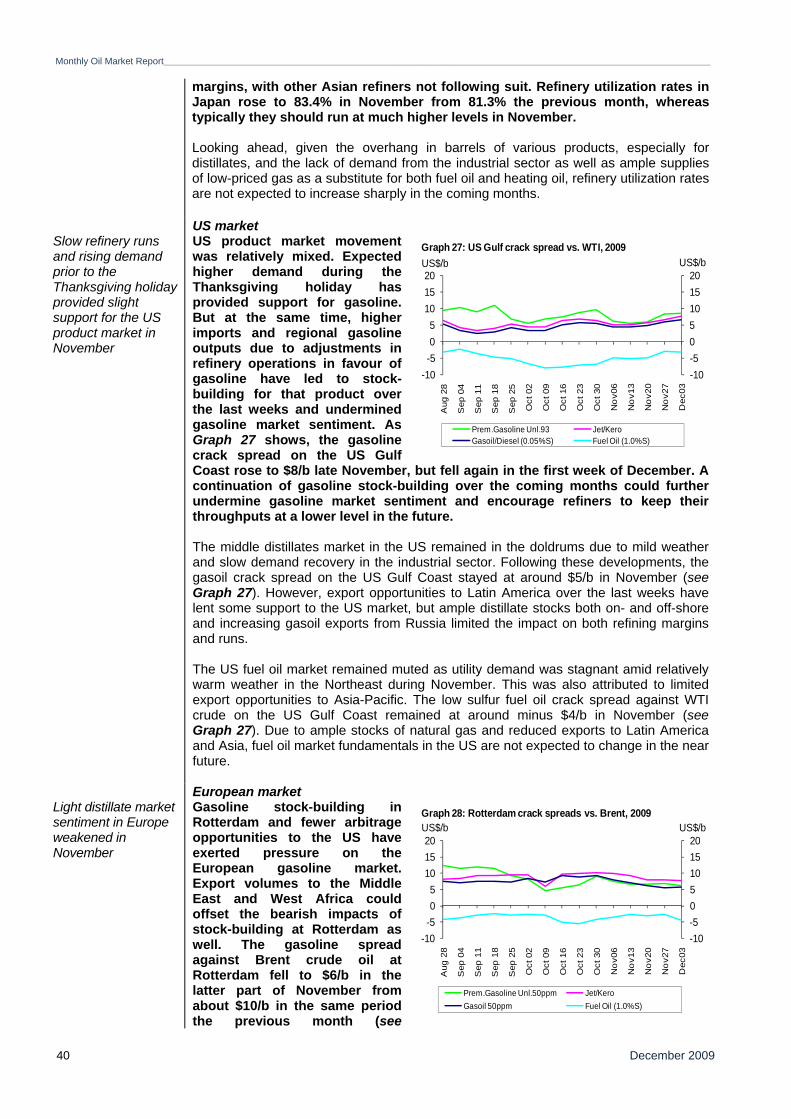
Monthly Oil Market Report_________________________________________________________________________________________________________________________________________
December 2009 40
margins, with other Asian refiners not following suit. Refinery utilization rates in Japan rose to 83.4% in November from 81.3% the previous month, whereas typically they should run at much higher levels in November. Looking ahead, given the overhang in barrels of various products, especially for distillates, and the lack of demand from the industrial sector as well as ample supplies of low-priced gas as a substitute for both fuel oil and heating oil, refinery utilization rates are not expected to increase sharply in the coming months.
US market Slow refinery runs and rising demand prior to the Thanksgiving holiday provided slight support for the US product market in November
US product market movement was relatively mixed. Expected higher demand during the Thanksgiving holiday has provided support for gasoline. But at the same time, higher imports and regional gasoline outputs due to adjustments in refinery operations in favour of gasoline have led to stock-building for that product over the last weeks and undermined gasoline market sentiment. As Graph 27 shows, the gasoline crack spread on the US Gulf Coast rose to $8/b late November, but fell again in the first week of December. A continuation of gasoline stock-building over the coming months could further undermine gasoline market sentiment and encourage refiners to keep their throughputs at a lower level in the future. The middle distillates market in the US remained in the doldrums due to mild weather and slow demand recovery in the industrial sector. Following these developments, the gasoil crack spread on the US Gulf Coast stayed at around $5/b in November (see Graph 27). However, export opportunities to Latin America over the last weeks have lent some support to the US market, but ample distillate stocks both on- and off-shore and increasing gasoil exports from Russia limited the impact on both refining margins and runs. The US fuel oil market remained muted as utility demand was stagnant amid relatively warm weather in the Northeast during November. This was also attributed to limited export opportunities to Asia-Pacific. The low sulfur fuel oil crack spread against WTI crude on the US Gulf Coast remained at around minus $4/b in November (see Graph 27). Due to ample stocks of natural gas and reduced exports to Latin America and Asia, fuel oil market fundamentals in the US are not expected to change in the near future.
European market Light distillate market sentiment in Europe weakened in November
Gasoline stock-building in Rotterdam and fewer arbitrage opportunities to the US have exerted pressure on the European gasoline market. Export volumes to the Middle East and West Africa could offset the bearish impacts of stock-building at Rotterdam as well. The gasoline spread against Brent crude oil at Rotterdam fell to $6/b in the latter part of November from about $10/b in the same period the previous month (see
-10-505101520
-10-505
101520
Aug
28
Sep
04
Sep
11
Sep
18
Sep
25
Oct
02
Oct
09
Oct
16
Oct
23
Oct
30
No
v06
No
v13
No
v20
No
v27
Dec
03
US$/bUS$/b
Prem.Gasoline Unl.93 Jet/KeroGasoil/Diesel (0.05%S) Fuel Oil (1.0%S)
Graph 27: US Gulf crack spread vs. WTI, 2009
-10-505101520
-10-505
101520
Aug
28
Sep
04
Sep
11
Sep
18
Sep
25
Oct
02
Oct
09
Oct
16
Oct
23
Oct
30
No
v06
No
v13
No
v20
No
v27
Dec
03
US$/bUS$/b
Prem.Gasoline Unl.50ppm Jet/KeroGasoil 50ppm Fuel Oil (1.0%S)
Graph 28: Rotterdam crack spreads vs. Brent, 2009
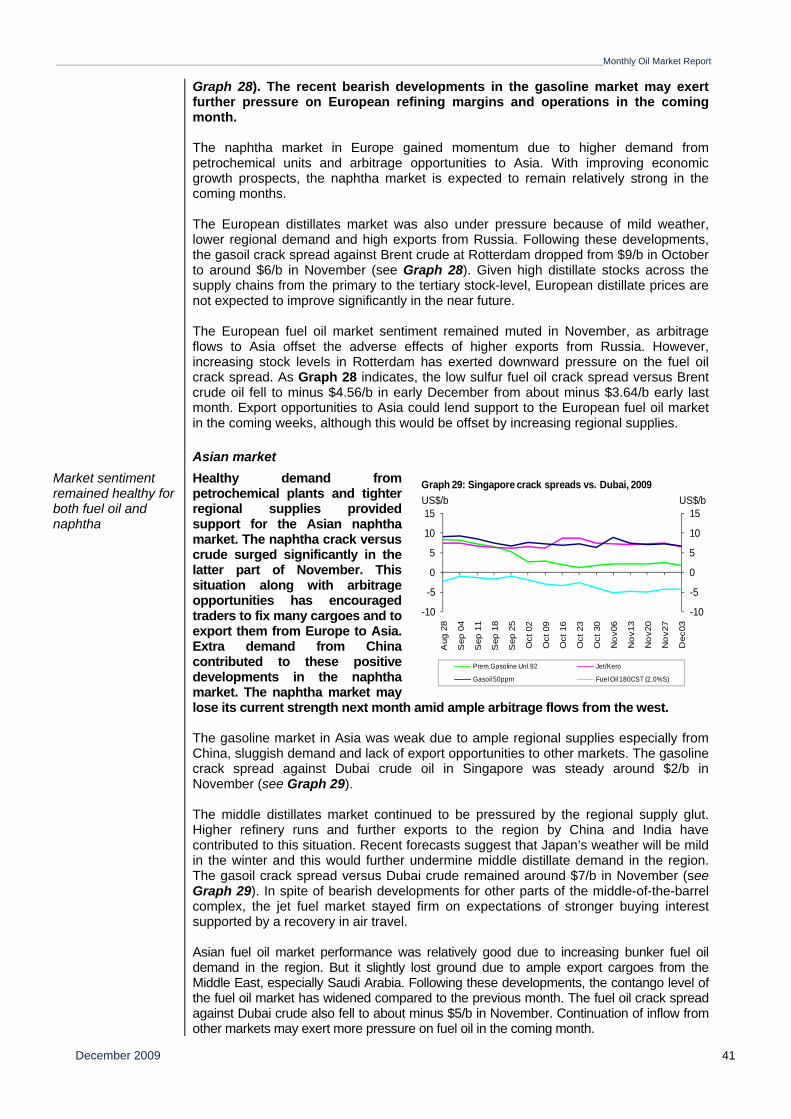
_________________________________________________________________________________________________________________________________________Monthly Oil Market Report
December 2009 41
Graph 28). The recent bearish developments in the gasoline market may exert further pressure on European refining margins and operations in the coming month. The naphtha market in Europe gained momentum due to higher demand from petrochemical units and arbitrage opportunities to Asia. With improving economic growth prospects, the naphtha market is expected to remain relatively strong in the coming months. The European distillates market was also under pressure because of mild weather, lower regional demand and high exports from Russia. Following these developments, the gasoil crack spread against Brent crude at Rotterdam dropped from $9/b in October to around $6/b in November (see Graph 28). Given high distillate stocks across the supply chains from the primary to the tertiary stock-level, European distillate prices are not expected to improve significantly in the near future. The European fuel oil market sentiment remained muted in November, as arbitrage flows to Asia offset the adverse effects of higher exports from Russia. However, increasing stock levels in Rotterdam has exerted downward pressure on the fuel oil crack spread. As Graph 28 indicates, the low sulfur fuel oil crack spread versus Brent crude oil fell to minus $4.56/b in early December from about minus $3.64/b early last month. Export opportunities to Asia could lend support to the European fuel oil market in the coming weeks, although this would be offset by increasing regional supplies.
Asian market Market sentiment remained healthy for both fuel oil and naphtha
Healthy demand from petrochemical plants and tighter regional supplies provided support for the Asian naphtha market. The naphtha crack versus crude surged significantly in the latter part of November. This situation along with arbitrage opportunities has encouraged traders to fix many cargoes and to export them from Europe to Asia. Extra demand from China contributed to these positive developments in the naphtha market. The naphtha market may lose its current strength next month amid ample arbitrage flows from the west. The gasoline market in Asia was weak due to ample regional supplies especially from China, sluggish demand and lack of export opportunities to other markets. The gasoline crack spread against Dubai crude oil in Singapore was steady around $2/b in November (see Graph 29). The middle distillates market continued to be pressured by the regional supply glut. Higher refinery runs and further exports to the region by China and India have contributed to this situation. Recent forecasts suggest that Japan’s weather will be mild in the winter and this would further undermine middle distillate demand in the region. The gasoil crack spread versus Dubai crude remained around $7/b in November (see Graph 29). In spite of bearish developments for other parts of the middle-of-the-barrel complex, the jet fuel market stayed firm on expectations of stronger buying interest supported by a recovery in air travel. Asian fuel oil market performance was relatively good due to increasing bunker fuel oil demand in the region. But it slightly lost ground due to ample export cargoes from the Middle East, especially Saudi Arabia. Following these developments, the contango level of the fuel oil market has widened compared to the previous month. The fuel oil crack spread against Dubai crude also fell to about minus $5/b in November. Continuation of inflow from other markets may exert more pressure on fuel oil in the coming month.
-10
-5
0
5
10
15
-10
-5
0
5
10
15
Aug
28
Sep
04
Sep
11
Sep
18
Sep
25
Oct
02
Oct
09
Oct
16
Oct
23
Oct
30
No
v06
No
v13
No
v20
No
v27
Dec
03
US$/bUS$/b
Prem.Gasoline Unl.92 Jet/Kero
Gasoil 50ppm Fuel Oil 180CST (2.0%S)
Graph 29: Singapore crack spreads vs. Dubai, 2009
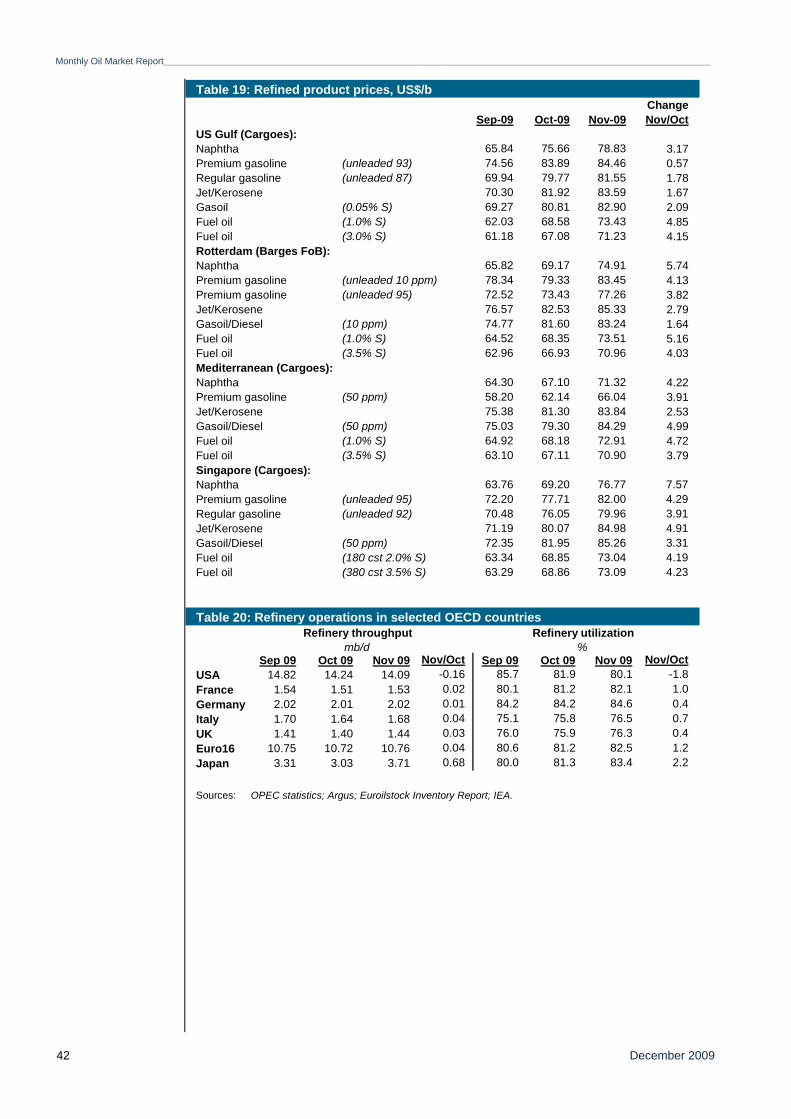
Monthly Oil Market Report_________________________________________________________________________________________________________________________________________
December 2009 42
Table 19: Refined product prices, US$/bChange
Sep-09 Oct-09 Nov-09 Nov/OctUS Gulf (Cargoes):Naphtha 65.84 75.66 78.83 3.17Premium gasoline (unleaded 93) 74.56 83.89 84.46 0.57Regular gasoline (unleaded 87) 69.94 79.77 81.55 1.78Jet/Kerosene 70.30 81.92 83.59 1.67Gasoil (0.05% S) 69.27 80.81 82.90 2.09Fuel oil (1.0% S) 62.03 68.58 73.43 4.85Fuel oil (3.0% S) 61.18 67.08 71.23 4.15Rotterdam (Barges FoB):Naphtha 65.82 69.17 74.91 5.74Premium gasoline (unleaded 10 ppm) 78.34 79.33 83.45 4.13Premium gasoline (unleaded 95) 72.52 73.43 77.26 3.82Jet/Kerosene 76.57 82.53 85.33 2.79Gasoil/Diesel (10 ppm) 74.77 81.60 83.24 1.64Fuel oil (1.0% S) 64.52 68.35 73.51 5.16Fuel oil (3.5% S) 62.96 66.93 70.96 4.03Mediterranean (Cargoes):Naphtha 64.30 67.10 71.32 4.22Premium gasoline (50 ppm) 58.20 62.14 66.04 3.91Jet/Kerosene 75.38 81.30 83.84 2.53Gasoil/Diesel (50 ppm) 75.03 79.30 84.29 4.99Fuel oil (1.0% S) 64.92 68.18 72.91 4.72Fuel oil (3.5% S) 63.10 67.11 70.90 3.79Singapore (Cargoes):Naphtha 63.76 69.20 76.77 7.57Premium gasoline (unleaded 95) 72.20 77.71 82.00 4.29Regular gasoline (unleaded 92) 70.48 76.05 79.96 3.91Jet/Kerosene 71.19 80.07 84.98 4.91Gasoil/Diesel (50 ppm) 72.35 81.95 85.26 3.31Fuel oil (180 cst 2.0% S) 63.34 68.85 73.04 4.19Fuel oil (380 cst 3.5% S) 63.29 68.86 73.09 4.23
Table 20: Refinery operations in selected OECD countries
Sep 09 Oct 09 Nov 09 Nov/Oct Sep 09 Oct 09 Nov 09 Nov/OctUSA 14.82 14.24 14.09 -0.16 85.7 81.9 80.1 -1.8France 1.54 1.51 1.53 0.02 80.1 81.2 82.1 1.0Germany 2.02 2.01 2.02 0.01 84.2 84.2 84.6 0.4Italy 1.70 1.64 1.68 0.04 75.1 75.8 76.5 0.7UK 1.41 1.40 1.44 0.03 76.0 75.9 76.3 0.4Euro16 10.75 10.72 10.76 0.04 80.6 81.2 82.5 1.2Japan 3.31 3.03 3.71 0.68 80.0 81.3 83.4 2.2RSources:
Refinery throughputmb/d
OPEC statistics; Argus; Euroilstock Inventory Report; IEA.Revised since last issue.
Refinery utilization%
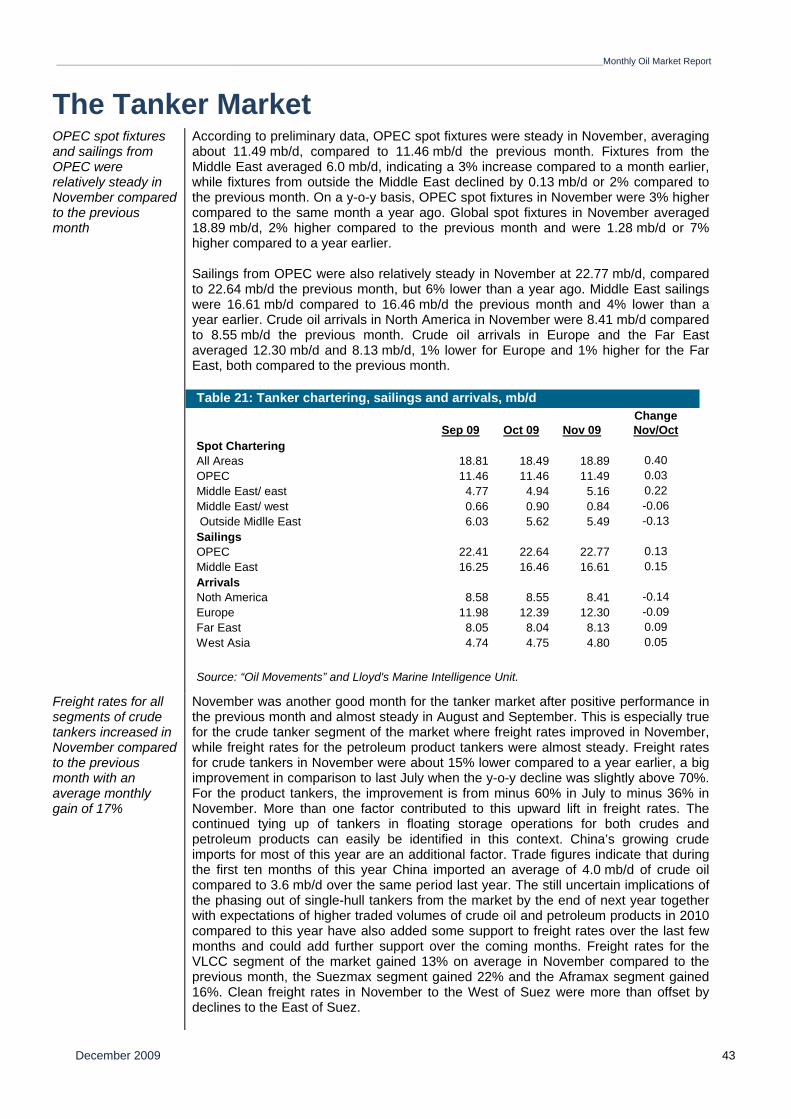
_________________________________________________________________________________________________________________________________________Monthly Oil Market Report
December 2009 43
The Tanker Market
OPEC spot fixtures and sailings from OPEC were relatively steady in November compared to the previous month
According to preliminary data, OPEC spot fixtures were steady in November, averaging about 11.49 mb/d, compared to 11.46 mb/d the previous month. Fixtures from the Middle East averaged 6.0 mb/d, indicating a 3% increase compared to a month earlier, while fixtures from outside the Middle East declined by 0.13 mb/d or 2% compared to the previous month. On a y-o-y basis, OPEC spot fixtures in November were 3% higher compared to the same month a year ago. Global spot fixtures in November averaged 18.89 mb/d, 2% higher compared to the previous month and were 1.28 mb/d or 7% higher compared to a year earlier. Sailings from OPEC were also relatively steady in November at 22.77 mb/d, compared to 22.64 mb/d the previous month, but 6% lower than a year ago. Middle East sailings were 16.61 mb/d compared to 16.46 mb/d the previous month and 4% lower than a year earlier. Crude oil arrivals in North America in November were 8.41 mb/d compared to 8.55 mb/d the previous month. Crude oil arrivals in Europe and the Far East averaged 12.30 mb/d and 8.13 mb/d, 1% lower for Europe and 1% higher for the Far East, both compared to the previous month.
Freight rates for all segments of crude tankers increased in November compared to the previous month with an average monthly gain of 17%
November was another good month for the tanker market after positive performance in the previous month and almost steady in August and September. This is especially true for the crude tanker segment of the market where freight rates improved in November, while freight rates for the petroleum product tankers were almost steady. Freight rates for crude tankers in November were about 15% lower compared to a year earlier, a big improvement in comparison to last July when the y-o-y decline was slightly above 70%. For the product tankers, the improvement is from minus 60% in July to minus 36% in November. More than one factor contributed to this upward lift in freight rates. The continued tying up of tankers in floating storage operations for both crudes and petroleum products can easily be identified in this context. China’s growing crude imports for most of this year are an additional factor. Trade figures indicate that during the first ten months of this year China imported an average of 4.0 mb/d of crude oil compared to 3.6 mb/d over the same period last year. The still uncertain implications of the phasing out of single-hull tankers from the market by the end of next year together with expectations of higher traded volumes of crude oil and petroleum products in 2010 compared to this year have also added some support to freight rates over the last few months and could add further support over the coming months. Freight rates for the VLCC segment of the market gained 13% on average in November compared to the previous month, the Suezmax segment gained 22% and the Aframax segment gained 16%. Clean freight rates in November to the West of Suez were more than offset by declines to the East of Suez.
ChangeSep 09 Oct 09 Nov 09 Nov/Oct
Spot CharteringAll Areas 18.81 18.49 18.89 0.40OPEC 11.46 11.46 11.49 0.03Middle East/ east 4.77 4.94 5.16 0.22Middle East/ west 0.66 0.90 0.84 -0.06 Outside Midlle East 6.03 5.62 5.49 -0.13SailingsOPEC 22.41 22.64 22.77 0.13Middle East 16.25 16.46 16.61 0.15ArrivalsNoth America 8.58 8.55 8.41 -0.14Europe 11.98 12.39 12.30 -0.09Far East 8.05 8.04 8.13 0.09West Asia 4.74 4.75 4.80 0.05
Table 21: Tanker chartering, sailings and arrivals, mb/d
Source: “Oil Movements” and Lloyd's Marine Intelligence Unit.
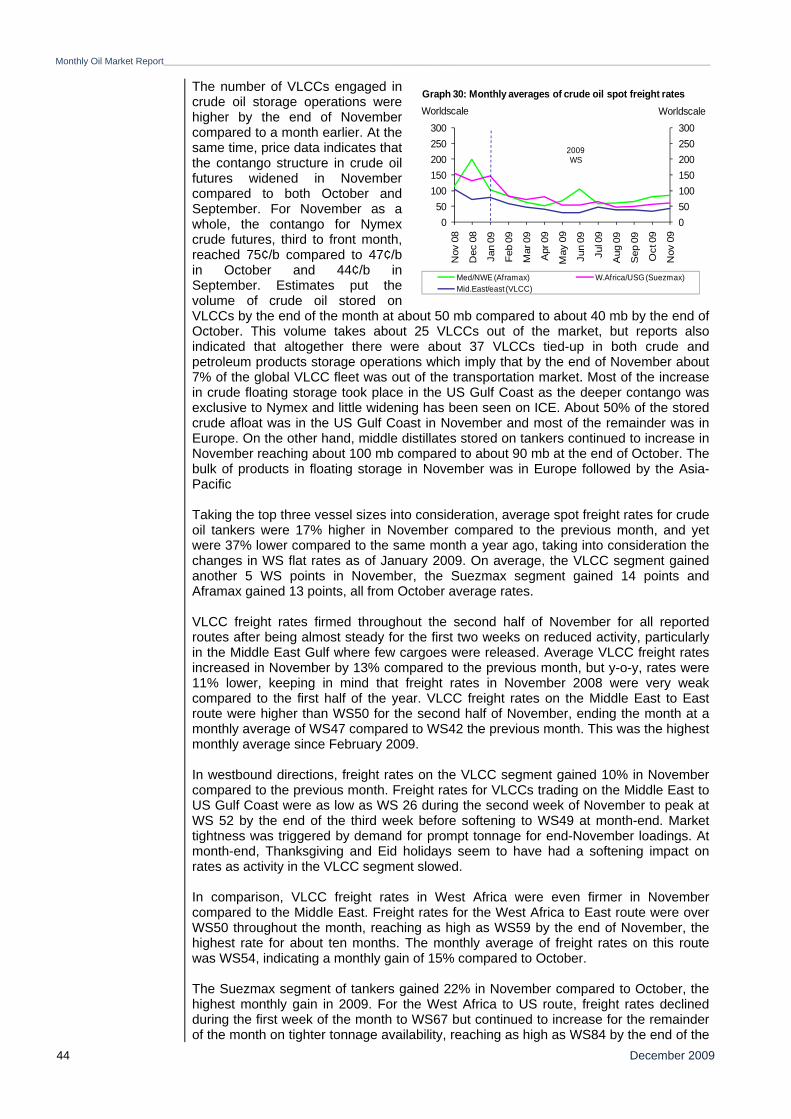
Monthly Oil Market Report_________________________________________________________________________________________________________________________________________
December 2009 44
The number of VLCCs engaged in crude oil storage operations were higher by the end of November compared to a month earlier. At the same time, price data indicates that the contango structure in crude oil futures widened in November compared to both October and September. For November as a whole, the contango for Nymex crude futures, third to front month, reached 75¢/b compared to 47¢/b in October and 44¢/b in September. Estimates put the volume of crude oil stored on VLCCs by the end of the month at about 50 mb compared to about 40 mb by the end of October. This volume takes about 25 VLCCs out of the market, but reports also indicated that altogether there were about 37 VLCCs tied-up in both crude and petroleum products storage operations which imply that by the end of November about 7% of the global VLCC fleet was out of the transportation market. Most of the increase in crude floating storage took place in the US Gulf Coast as the deeper contango was exclusive to Nymex and little widening has been seen on ICE. About 50% of the stored crude afloat was in the US Gulf Coast in November and most of the remainder was in Europe. On the other hand, middle distillates stored on tankers continued to increase in November reaching about 100 mb compared to about 90 mb at the end of October. The bulk of products in floating storage in November was in Europe followed by the Asia-Pacific
Taking the top three vessel sizes into consideration, average spot freight rates for crude oil tankers were 17% higher in November compared to the previous month, and yet were 37% lower compared to the same month a year ago, taking into consideration the changes in WS flat rates as of January 2009. On average, the VLCC segment gained another 5 WS points in November, the Suezmax segment gained 14 points and Aframax gained 13 points, all from October average rates. VLCC freight rates firmed throughout the second half of November for all reported routes after being almost steady for the first two weeks on reduced activity, particularly in the Middle East Gulf where few cargoes were released. Average VLCC freight rates increased in November by 13% compared to the previous month, but y-o-y, rates were 11% lower, keeping in mind that freight rates in November 2008 were very weak compared to the first half of the year. VLCC freight rates on the Middle East to East route were higher than WS50 for the second half of November, ending the month at a monthly average of WS47 compared to WS42 the previous month. This was the highest monthly average since February 2009. In westbound directions, freight rates on the VLCC segment gained 10% in November compared to the previous month. Freight rates for VLCCs trading on the Middle East to US Gulf Coast were as low as WS 26 during the second week of November to peak at WS 52 by the end of the third week before softening to WS49 at month-end. Market tightness was triggered by demand for prompt tonnage for end-November loadings. At month-end, Thanksgiving and Eid holidays seem to have had a softening impact on rates as activity in the VLCC segment slowed. In comparison, VLCC freight rates in West Africa were even firmer in November compared to the Middle East. Freight rates for the West Africa to East route were over WS50 throughout the month, reaching as high as WS59 by the end of November, the highest rate for about ten months. The monthly average of freight rates on this route was WS54, indicating a monthly gain of 15% compared to October. The Suezmax segment of tankers gained 22% in November compared to October, the highest monthly gain in 2009. For the West Africa to US route, freight rates declined during the first week of the month to WS67 but continued to increase for the remainder of the month on tighter tonnage availability, reaching as high as WS84 by the end of the
050100150200250300
050
100150200250300
Nov
08
Dec
08
Jan
09
Feb
09
Mar
09
Apr
09
May
09
Jun
09
Jul 0
9
Aug
09
Sep
09
Oct
09
Nov
09
WorldscaleWorldscale
Med/NWE (Aframax) W.Africa/USG (Suezmax)Mid.East/east (VLCC)
Graph 30: Monthly averages of crude oil spot freight rates
2009WS
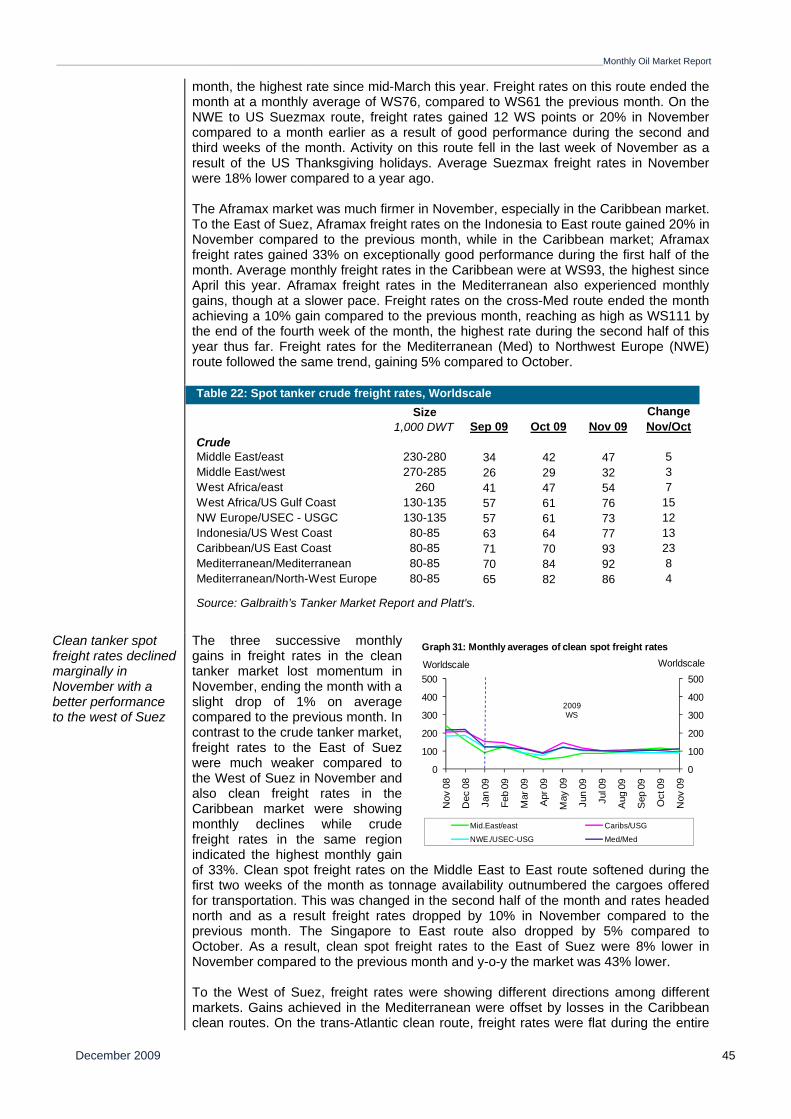
_________________________________________________________________________________________________________________________________________Monthly Oil Market Report
December 2009 45
month, the highest rate since mid-March this year. Freight rates on this route ended the month at a monthly average of WS76, compared to WS61 the previous month. On the NWE to US Suezmax route, freight rates gained 12 WS points or 20% in November compared to a month earlier as a result of good performance during the second and third weeks of the month. Activity on this route fell in the last week of November as a result of the US Thanksgiving holidays. Average Suezmax freight rates in November were 18% lower compared to a year ago. The Aframax market was much firmer in November, especially in the Caribbean market. To the East of Suez, Aframax freight rates on the Indonesia to East route gained 20% in November compared to the previous month, while in the Caribbean market; Aframax freight rates gained 33% on exceptionally good performance during the first half of the month. Average monthly freight rates in the Caribbean were at WS93, the highest since April this year. Aframax freight rates in the Mediterranean also experienced monthly gains, though at a slower pace. Freight rates on the cross-Med route ended the month achieving a 10% gain compared to the previous month, reaching as high as WS111 by the end of the fourth week of the month, the highest rate during the second half of this year thus far. Freight rates for the Mediterranean (Med) to Northwest Europe (NWE) route followed the same trend, gaining 5% compared to October.
Clean tanker spot freight rates declined marginally in November with a better performance to the west of Suez
The three successive monthly gains in freight rates in the clean tanker market lost momentum in November, ending the month with a slight drop of 1% on average compared to the previous month. In contrast to the crude tanker market, freight rates to the East of Suez were much weaker compared to the West of Suez in November and also clean freight rates in the Caribbean market were showing monthly declines while crude freight rates in the same region indicated the highest monthly gain of 33%. Clean spot freight rates on the Middle East to East route softened during the first two weeks of the month as tonnage availability outnumbered the cargoes offered for transportation. This was changed in the second half of the month and rates headed north and as a result freight rates dropped by 10% in November compared to the previous month. The Singapore to East route also dropped by 5% compared to October. As a result, clean spot freight rates to the East of Suez were 8% lower in November compared to the previous month and y-o-y the market was 43% lower. To the West of Suez, freight rates were showing different directions among different markets. Gains achieved in the Mediterranean were offset by losses in the Caribbean clean routes. On the trans-Atlantic clean route, freight rates were flat during the entire
Size Change1,000 DWT Sep 09 Oct 09 Nov 09 Nov/Oct
CrudeMiddle East/east 230-280 34 42 47 5Middle East/west 270-285 26 29 32 3West Africa/east 260 41 47 54 7West Africa/US Gulf Coast 130-135 57 61 76 15NW Europe/USEC - USGC 130-135 57 61 73 12Indonesia/US West Coast 80-85 63 64 77 13Caribbean/US East Coast 80-85 71 70 93 23Mediterranean/Mediterranean 80-85 70 84 92 8Mediterranean/North-West Europe 80-85 65 82 86 4
Table 22: Spot tanker crude freight rates, Worldscale
Source: Galbraith’s Tanker Market Report and Platt's.
0
100
200
300
400
500
0
100
200
300
400
500
Nov
08
Dec
08
Jan
09
Feb
09
Mar
09
Apr
09
May
09
Jun
09
Jul 0
9
Aug
09
Sep
09
Oct
09
Nov
09
WorldscaleWorldscale
Mid.East/east Caribs/USG
NWE./USEC-USG Med/Med
Graph 31: Monthly averages of clean spot freight rates
2009WS
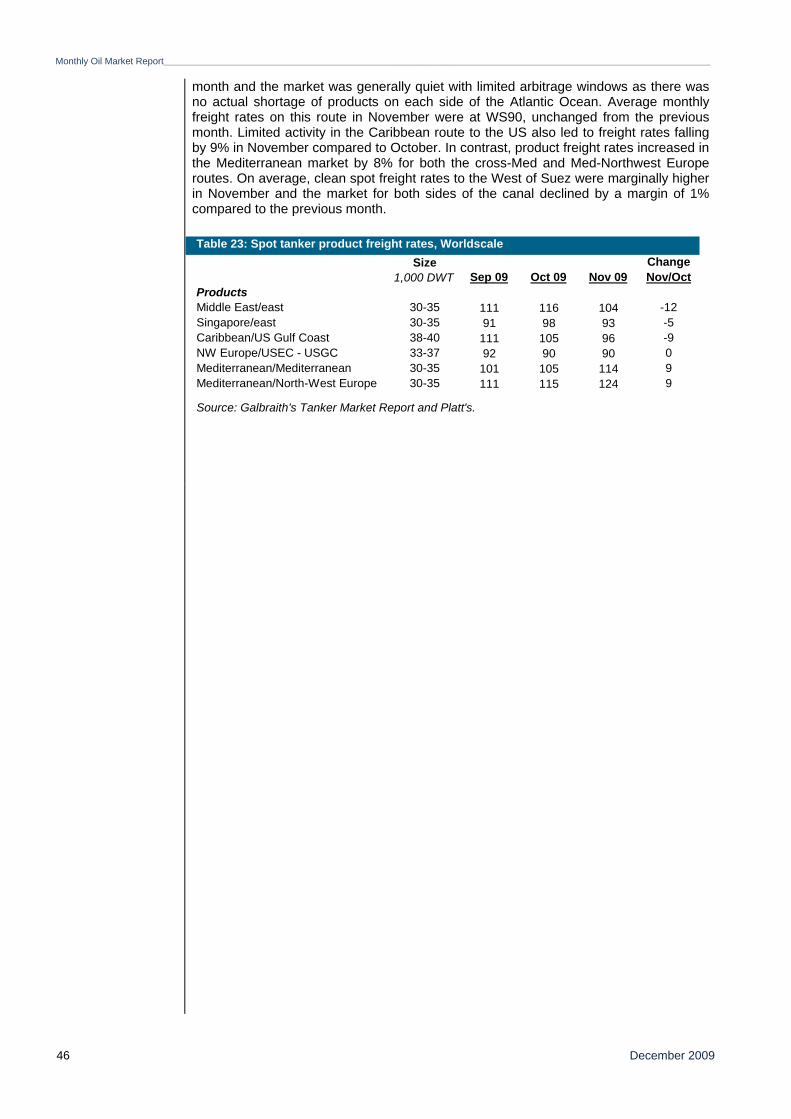
Monthly Oil Market Report_________________________________________________________________________________________________________________________________________
December 2009 46
month and the market was generally quiet with limited arbitrage windows as there was no actual shortage of products on each side of the Atlantic Ocean. Average monthly freight rates on this route in November were at WS90, unchanged from the previous month. Limited activity in the Caribbean route to the US also led to freight rates falling by 9% in November compared to October. In contrast, product freight rates increased in the Mediterranean market by 8% for both the cross-Med and Med-Northwest Europe routes. On average, clean spot freight rates to the West of Suez were marginally higher in November and the market for both sides of the canal declined by a margin of 1% compared to the previous month.
Size Change1,000 DWT Sep 09 Oct 09 Nov 09 Nov/Oct
ProductsMiddle East/east 30-35 111 116 104 -12Singapore/east 30-35 91 98 93 -5Caribbean/US Gulf Coast 38-40 111 105 96 -9NW Europe/USEC - USGC 33-37 92 90 90 0Mediterranean/Mediterranean 30-35 101 105 114 9Mediterranean/North-West Europe 30-35 111 115 124 9
Source: Galbraith’s Tanker Market Report and Platt's.
Table 23: Spot tanker product freight rates, Worldscale
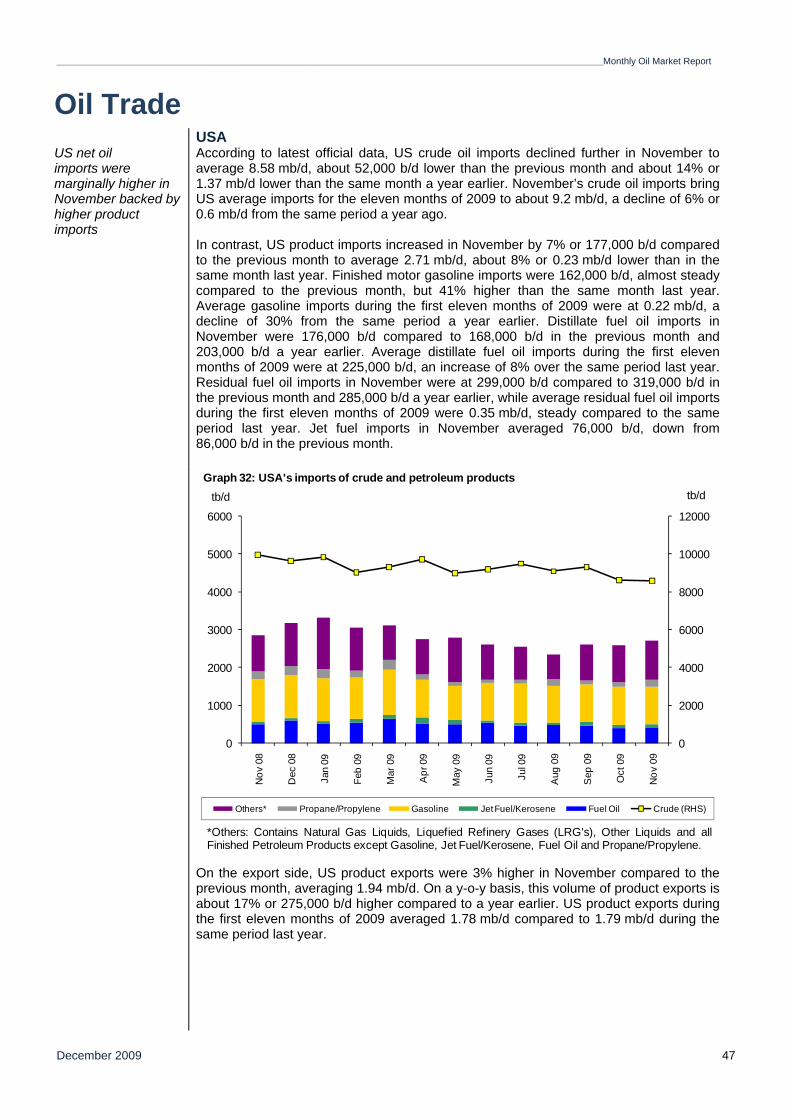
_________________________________________________________________________________________________________________________________________Monthly Oil Market Report
December 2009 47
Oil Trade USA US net oil imports were marginally higher in November backed by higher product imports
According to latest official data, US crude oil imports declined further in November to average 8.58 mb/d, about 52,000 b/d lower than the previous month and about 14% or 1.37 mb/d lower than the same month a year earlier. November’s crude oil imports bring US average imports for the eleven months of 2009 to about 9.2 mb/d, a decline of 6% or 0.6 mb/d from the same period a year ago. In contrast, US product imports increased in November by 7% or 177,000 b/d compared to the previous month to average 2.71 mb/d, about 8% or 0.23 mb/d lower than in the same month last year. Finished motor gasoline imports were 162,000 b/d, almost steady compared to the previous month, but 41% higher than the same month last year. Average gasoline imports during the first eleven months of 2009 were at 0.22 mb/d, a decline of 30% from the same period a year earlier. Distillate fuel oil imports in November were 176,000 b/d compared to 168,000 b/d in the previous month and 203,000 b/d a year earlier. Average distillate fuel oil imports during the first eleven months of 2009 were at 225,000 b/d, an increase of 8% over the same period last year. Residual fuel oil imports in November were at 299,000 b/d compared to 319,000 b/d in the previous month and 285,000 b/d a year earlier, while average residual fuel oil imports during the first eleven months of 2009 were 0.35 mb/d, steady compared to the same period last year. Jet fuel imports in November averaged 76,000 b/d, down from 86,000 b/d in the previous month.
On the export side, US product exports were 3% higher in November compared to the previous month, averaging 1.94 mb/d. On a y-o-y basis, this volume of product exports is about 17% or 275,000 b/d higher compared to a year earlier. US product exports during the first eleven months of 2009 averaged 1.78 mb/d compared to 1.79 mb/d during the same period last year.
0
2000
4000
6000
8000
10000
12000
0
1000
2000
3000
4000
5000
6000
Nov
08
Dec
08
Jan
09
Feb
09
Mar
09
Apr
09
May
09
Jun
09
Jul 0
9
Aug
09
Sep
09
Oct
09
Nov
09
tb/dtb/d
Others* Propane/Propylene Gasoline Jet Fuel/Kerosene Fuel Oil Crude (RHS)
Graph 32: USA's imports of crude and petroleum products
*Others: Contains Natural Gas Liquids, Liquefied Refinery Gases (LRG's), Other Liquids and allFinished Petroleum Products except Gasoline, Jet Fuel/Kerosene, Fuel Oil and Propane/Propylene.
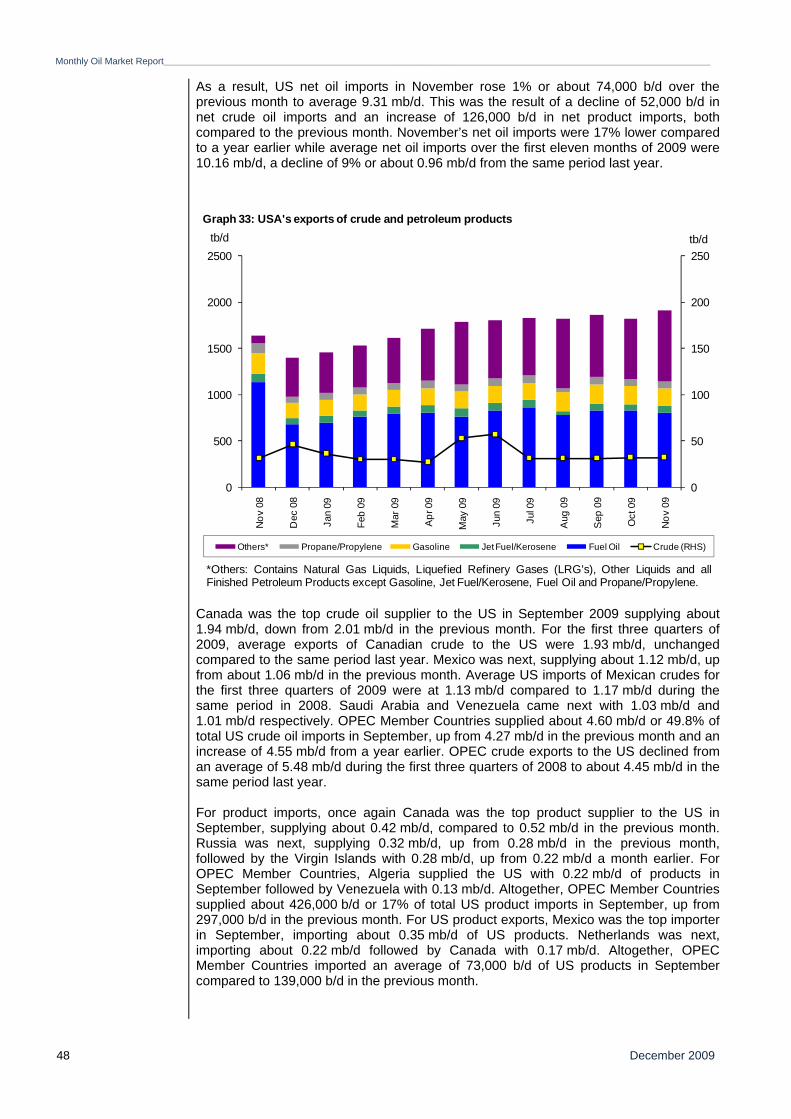
Monthly Oil Market Report_________________________________________________________________________________________________________________________________________
December 2009 48
As a result, US net oil imports in November rose 1% or about 74,000 b/d over the previous month to average 9.31 mb/d. This was the result of a decline of 52,000 b/d in net crude oil imports and an increase of 126,000 b/d in net product imports, both compared to the previous month. November’s net oil imports were 17% lower compared to a year earlier while average net oil imports over the first eleven months of 2009 were 10.16 mb/d, a decline of 9% or about 0.96 mb/d from the same period last year.
Canada was the top crude oil supplier to the US in September 2009 supplying about 1.94 mb/d, down from 2.01 mb/d in the previous month. For the first three quarters of 2009, average exports of Canadian crude to the US were 1.93 mb/d, unchanged compared to the same period last year. Mexico was next, supplying about 1.12 mb/d, up from about 1.06 mb/d in the previous month. Average US imports of Mexican crudes for the first three quarters of 2009 were at 1.13 mb/d compared to 1.17 mb/d during the same period in 2008. Saudi Arabia and Venezuela came next with 1.03 mb/d and 1.01 mb/d respectively. OPEC Member Countries supplied about 4.60 mb/d or 49.8% of total US crude oil imports in September, up from 4.27 mb/d in the previous month and an increase of 4.55 mb/d from a year earlier. OPEC crude exports to the US declined from an average of 5.48 mb/d during the first three quarters of 2008 to about 4.45 mb/d in the same period last year. For product imports, once again Canada was the top product supplier to the US in September, supplying about 0.42 mb/d, compared to 0.52 mb/d in the previous month. Russia was next, supplying 0.32 mb/d, up from 0.28 mb/d in the previous month, followed by the Virgin Islands with 0.28 mb/d, up from 0.22 mb/d a month earlier. For OPEC Member Countries, Algeria supplied the US with 0.22 mb/d of products in September followed by Venezuela with 0.13 mb/d. Altogether, OPEC Member Countries supplied about 426,000 b/d or 17% of total US product imports in September, up from 297,000 b/d in the previous month. For US product exports, Mexico was the top importer in September, importing about 0.35 mb/d of US products. Netherlands was next, importing about 0.22 mb/d followed by Canada with 0.17 mb/d. Altogether, OPEC Member Countries imported an average of 73,000 b/d of US products in September compared to 139,000 b/d in the previous month.
0
50
100
150
200
250
0
500
1000
1500
2000
2500N
ov 0
8
Dec
08
Jan
09
Feb
09
Mar
09
Apr
09
May
09
Jun
09
Jul 0
9
Aug
09
Sep
09
Oct
09
Nov
09
tb/dtb/d
Others* Propane/Propylene Gasoline Jet Fuel/Kerosene Fuel Oil Crude (RHS)
*Others: Contains Natural Gas Liquids, Liquefied Refinery Gases (LRG's), Other Liquids and allFinished Petroleum Products except Gasoline, Jet Fuel/Kerosene, Fuel Oil and Propane/Propylene.
Graph 33: USA's exports of crude and petroleum products
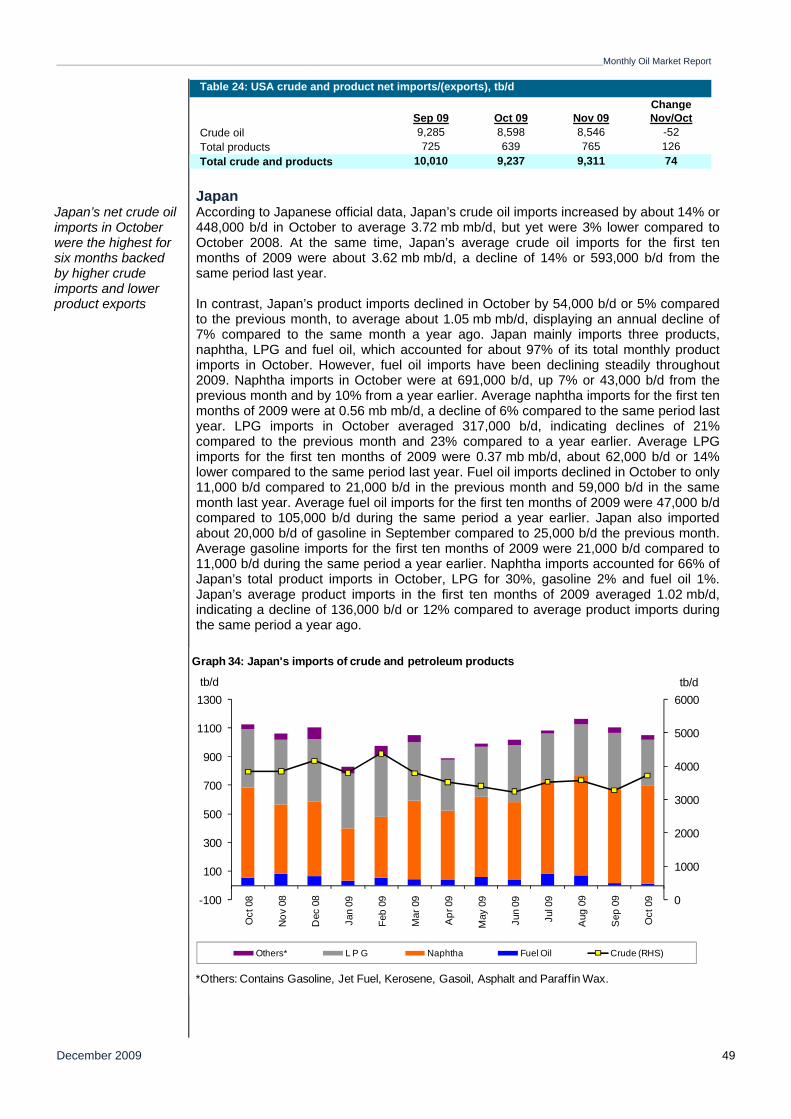
_________________________________________________________________________________________________________________________________________Monthly Oil Market Report
December 2009 49
Japan Japan’s net crude oil imports in October were the highest for six months backed by higher crude imports and lower product exports
According to Japanese official data, Japan’s crude oil imports increased by about 14% or 448,000 b/d in October to average 3.72 mb mb/d, but yet were 3% lower compared to October 2008. At the same time, Japan’s average crude oil imports for the first ten months of 2009 were about 3.62 mb mb/d, a decline of 14% or 593,000 b/d from the same period last year. In contrast, Japan’s product imports declined in October by 54,000 b/d or 5% compared to the previous month, to average about 1.05 mb mb/d, displaying an annual decline of 7% compared to the same month a year ago. Japan mainly imports three products, naphtha, LPG and fuel oil, which accounted for about 97% of its total monthly product imports in October. However, fuel oil imports have been declining steadily throughout 2009. Naphtha imports in October were at 691,000 b/d, up 7% or 43,000 b/d from the previous month and by 10% from a year earlier. Average naphtha imports for the first ten months of 2009 were at 0.56 mb mb/d, a decline of 6% compared to the same period last year. LPG imports in October averaged 317,000 b/d, indicating declines of 21% compared to the previous month and 23% compared to a year earlier. Average LPG imports for the first ten months of 2009 were 0.37 mb mb/d, about 62,000 b/d or 14% lower compared to the same period last year. Fuel oil imports declined in October to only 11,000 b/d compared to 21,000 b/d in the previous month and 59,000 b/d in the same month last year. Average fuel oil imports for the first ten months of 2009 were 47,000 b/d compared to 105,000 b/d during the same period a year earlier. Japan also imported about 20,000 b/d of gasoline in September compared to 25,000 b/d the previous month. Average gasoline imports for the first ten months of 2009 were 21,000 b/d compared to 11,000 b/d during the same period a year earlier. Naphtha imports accounted for 66% of Japan’s total product imports in October, LPG for 30%, gasoline 2% and fuel oil 1%. Japan’s average product imports in the first ten months of 2009 averaged 1.02 mb/d, indicating a decline of 136,000 b/d or 12% compared to average product imports during the same period a year ago.
ChangeSep 09 Oct 09 Nov 09 Nov/Oct
Crude oil 9,285 8,598 8,546 -52Total products 725 639 765 126Total crude and products 10,010 9,237 9,311 74
Table 24: USA crude and product net imports/(exports), tb/d
0
1000
2000
3000
4000
5000
6000
-100
100
300
500
700
900
1100
1300
Oct
08
Nov
08
Dec
08
Jan
09
Feb
09
Mar
09
Apr
09
May
09
Jun
09
Jul 0
9
Aug
09
Sep
09
Oct
09
tb/dtb/d
Others* L P G Naphtha Fuel Oil Crude (RHS)
Graph 34: Japan's imports of crude and petroleum products
*Others: Contains Gasoline, Jet Fuel, Kerosene, Gasoil, Asphalt and Paraffin Wax.
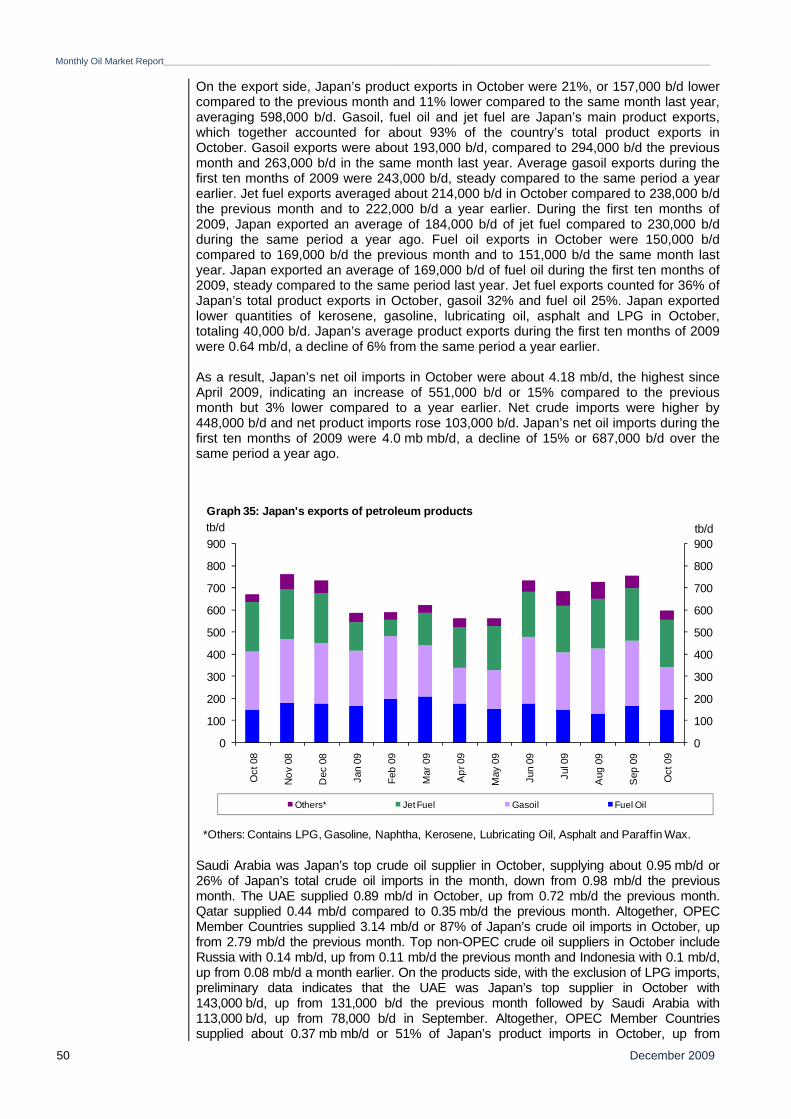
Monthly Oil Market Report_________________________________________________________________________________________________________________________________________
December 2009 50
On the export side, Japan’s product exports in October were 21%, or 157,000 b/d lower compared to the previous month and 11% lower compared to the same month last year, averaging 598,000 b/d. Gasoil, fuel oil and jet fuel are Japan’s main product exports, which together accounted for about 93% of the country’s total product exports in October. Gasoil exports were about 193,000 b/d, compared to 294,000 b/d the previous month and 263,000 b/d in the same month last year. Average gasoil exports during the first ten months of 2009 were 243,000 b/d, steady compared to the same period a year earlier. Jet fuel exports averaged about 214,000 b/d in October compared to 238,000 b/d the previous month and to 222,000 b/d a year earlier. During the first ten months of 2009, Japan exported an average of 184,000 b/d of jet fuel compared to 230,000 b/d during the same period a year ago. Fuel oil exports in October were 150,000 b/d compared to 169,000 b/d the previous month and to 151,000 b/d the same month last year. Japan exported an average of 169,000 b/d of fuel oil during the first ten months of 2009, steady compared to the same period last year. Jet fuel exports counted for 36% of Japan’s total product exports in October, gasoil 32% and fuel oil 25%. Japan exported lower quantities of kerosene, gasoline, lubricating oil, asphalt and LPG in October, totaling 40,000 b/d. Japan’s average product exports during the first ten months of 2009 were 0.64 mb/d, a decline of 6% from the same period a year earlier. As a result, Japan’s net oil imports in October were about 4.18 mb/d, the highest since April 2009, indicating an increase of 551,000 b/d or 15% compared to the previous month but 3% lower compared to a year earlier. Net crude imports were higher by 448,000 b/d and net product imports rose 103,000 b/d. Japan’s net oil imports during the first ten months of 2009 were 4.0 mb mb/d, a decline of 15% or 687,000 b/d over the same period a year ago.
Saudi Arabia was Japan’s top crude oil supplier in October, supplying about 0.95 mb/d or 26% of Japan’s total crude oil imports in the month, down from 0.98 mb/d the previous month. The UAE supplied 0.89 mb/d in October, up from 0.72 mb/d the previous month. Qatar supplied 0.44 mb/d compared to 0.35 mb/d the previous month. Altogether, OPEC Member Countries supplied 3.14 mb/d or 87% of Japan’s crude oil imports in October, up from 2.79 mb/d the previous month. Top non-OPEC crude oil suppliers in October include Russia with 0.14 mb/d, up from 0.11 mb/d the previous month and Indonesia with 0.1 mb/d, up from 0.08 mb/d a month earlier. On the products side, with the exclusion of LPG imports, preliminary data indicates that the UAE was Japan’s top supplier in October with 143,000 b/d, up from 131,000 b/d the previous month followed by Saudi Arabia with 113,000 b/d, up from 78,000 b/d in September. Altogether, OPEC Member Countries supplied about 0.37 mb mb/d or 51% of Japan’s product imports in October, up from
0
100
200
300
400
500
600
700
800
900
0
100
200
300
400
500
600
700
800
900
Oct
08
Nov
08
Dec
08
Jan
09
Feb
09
Mar
09
Apr
09
May
09
Jun
09
Jul 0
9
Aug
09
Sep
09
Oct
09
tb/dtb/d
Others* Jet Fuel Gasoil Fuel Oil
Graph 35: Japan's exports of petroleum products
*Others: Contains LPG, Gasoline, Naphtha, Kerosene, Lubricating Oil, Asphalt and Paraffin Wax.
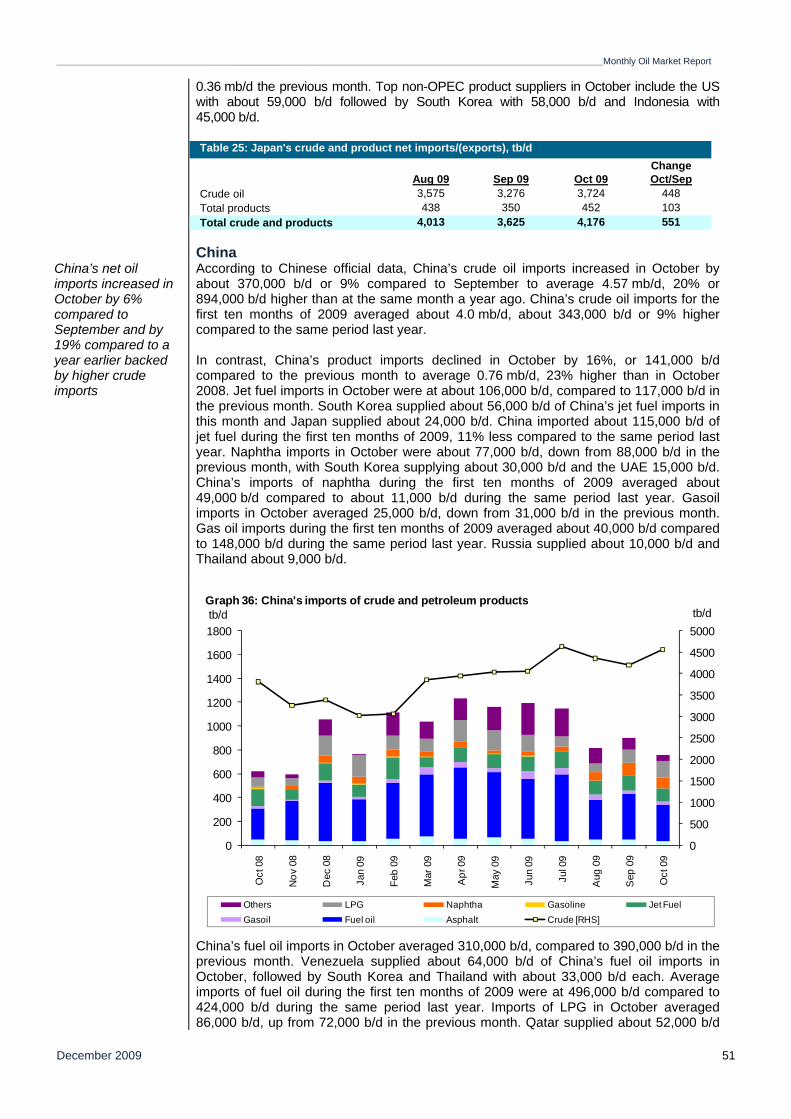
_________________________________________________________________________________________________________________________________________Monthly Oil Market Report
December 2009 51
0.36 mb/d the previous month. Top non-OPEC product suppliers in October include the US with about 59,000 b/d followed by South Korea with 58,000 b/d and Indonesia with 45,000 b/d.
ChinaChina’s net oil imports increased in October by 6% compared to September and by 19% compared to a year earlier backed by higher crude imports
According to Chinese official data, China’s crude oil imports increased in October by about 370,000 b/d or 9% compared to September to average 4.57 mb/d, 20% or 894,000 b/d higher than at the same month a year ago. China’s crude oil imports for the first ten months of 2009 averaged about 4.0 mb/d, about 343,000 b/d or 9% higher compared to the same period last year. In contrast, China’s product imports declined in October by 16%, or 141,000 b/d compared to the previous month to average 0.76 mb/d, 23% higher than in October 2008. Jet fuel imports in October were at about 106,000 b/d, compared to 117,000 b/d in the previous month. South Korea supplied about 56,000 b/d of China’s jet fuel imports in this month and Japan supplied about 24,000 b/d. China imported about 115,000 b/d of jet fuel during the first ten months of 2009, 11% less compared to the same period last year. Naphtha imports in October were about 77,000 b/d, down from 88,000 b/d in the previous month, with South Korea supplying about 30,000 b/d and the UAE 15,000 b/d. China’s imports of naphtha during the first ten months of 2009 averaged about 49,000 b/d compared to about 11,000 b/d during the same period last year. Gasoil imports in October averaged 25,000 b/d, down from 31,000 b/d in the previous month. Gas oil imports during the first ten months of 2009 averaged about 40,000 b/d compared to 148,000 b/d during the same period last year. Russia supplied about 10,000 b/d and Thailand about 9,000 b/d.
China’s fuel oil imports in October averaged 310,000 b/d, compared to 390,000 b/d in the previous month. Venezuela supplied about 64,000 b/d of China’s fuel oil imports in October, followed by South Korea and Thailand with about 33,000 b/d each. Average imports of fuel oil during the first ten months of 2009 were at 496,000 b/d compared to 424,000 b/d during the same period last year. Imports of LPG in October averaged 86,000 b/d, up from 72,000 b/d in the previous month. Qatar supplied about 52,000 b/d
ChangeAug 09 Sep 09 Oct 09 Oct/Sep
Crude oil 3,575 3,276 3,724 448Total products 438 350 452 103Total crude and products 4,013 3,625 4,176 551
Table 25: Japan's crude and product net imports/(exports), tb/d
0
500
1000
1500
2000
2500
3000
3500
4000
4500
5000
0
200
400
600
800
1000
1200
1400
1600
1800
Oct
08
Nov
08
Dec
08
Jan
09
Feb
09
Mar
09
Apr
09
May
09
Jun
09
Jul 0
9
Aug
09
Sep
09
Oct
09
tb/dtb/d
Others LPG Naphtha Gasoline Jet FuelGasoil Fuel oil Asphalt Crude [RHS]
Graph 36: China's imports of crude and petroleum products
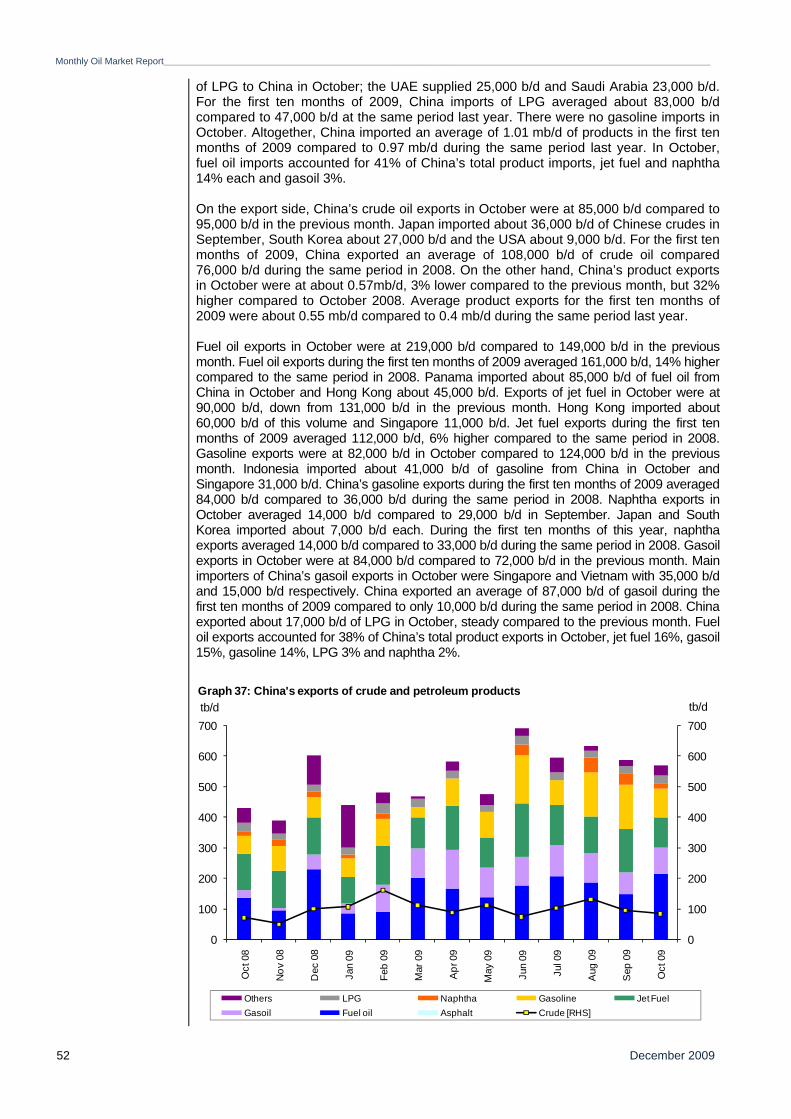
Monthly Oil Market Report_________________________________________________________________________________________________________________________________________
December 2009 52
of LPG to China in October; the UAE supplied 25,000 b/d and Saudi Arabia 23,000 b/d. For the first ten months of 2009, China imports of LPG averaged about 83,000 b/d compared to 47,000 b/d at the same period last year. There were no gasoline imports in October. Altogether, China imported an average of 1.01 mb/d of products in the first ten months of 2009 compared to 0.97 mb/d during the same period last year. In October, fuel oil imports accounted for 41% of China’s total product imports, jet fuel and naphtha 14% each and gasoil 3%.
On the export side, China’s crude oil exports in October were at 85,000 b/d compared to 95,000 b/d in the previous month. Japan imported about 36,000 b/d of Chinese crudes in September, South Korea about 27,000 b/d and the USA about 9,000 b/d. For the first ten months of 2009, China exported an average of 108,000 b/d of crude oil compared 76,000 b/d during the same period in 2008. On the other hand, China’s product exports in October were at about 0.57mb/d, 3% lower compared to the previous month, but 32% higher compared to October 2008. Average product exports for the first ten months of 2009 were about 0.55 mb/d compared to 0.4 mb/d during the same period last year. Fuel oil exports in October were at 219,000 b/d compared to 149,000 b/d in the previous month. Fuel oil exports during the first ten months of 2009 averaged 161,000 b/d, 14% higher compared to the same period in 2008. Panama imported about 85,000 b/d of fuel oil from China in October and Hong Kong about 45,000 b/d. Exports of jet fuel in October were at 90,000 b/d, down from 131,000 b/d in the previous month. Hong Kong imported about 60,000 b/d of this volume and Singapore 11,000 b/d. Jet fuel exports during the first ten months of 2009 averaged 112,000 b/d, 6% higher compared to the same period in 2008. Gasoline exports were at 82,000 b/d in October compared to 124,000 b/d in the previous month. Indonesia imported about 41,000 b/d of gasoline from China in October and Singapore 31,000 b/d. China’s gasoline exports during the first ten months of 2009 averaged 84,000 b/d compared to 36,000 b/d during the same period in 2008. Naphtha exports in October averaged 14,000 b/d compared to 29,000 b/d in September. Japan and South Korea imported about 7,000 b/d each. During the first ten months of this year, naphtha exports averaged 14,000 b/d compared to 33,000 b/d during the same period in 2008. Gasoil exports in October were at 84,000 b/d compared to 72,000 b/d in the previous month. Main importers of China’s gasoil exports in October were Singapore and Vietnam with 35,000 b/d and 15,000 b/d respectively. China exported an average of 87,000 b/d of gasoil during the first ten months of 2009 compared to only 10,000 b/d during the same period in 2008. China exported about 17,000 b/d of LPG in October, steady compared to the previous month. Fuel oil exports accounted for 38% of China’s total product exports in October, jet fuel 16%, gasoil 15%, gasoline 14%, LPG 3% and naphtha 2%.
0
100
200
300
400
500
600
700
0
100
200
300
400
500
600
700
Oct
08
Nov
08
Dec
08
Jan
09
Feb
09
Mar
09
Apr
09
May
09
Jun
09
Jul 0
9
Aug
09
Sep
09
Oct
09
tb/dtb/d
Others LPG Naphtha Gasoline Jet FuelGasoil Fuel oil Asphalt Crude [RHS]
Graph 37: China's exports of crude and petroleum products
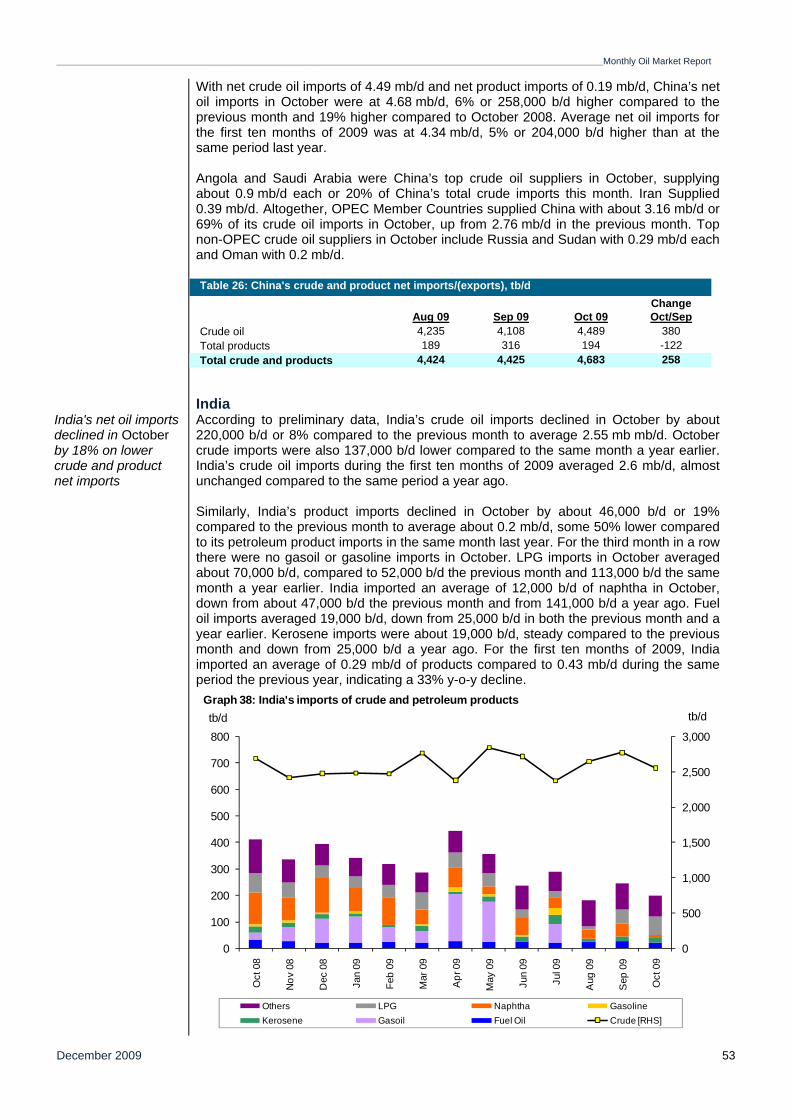
_________________________________________________________________________________________________________________________________________Monthly Oil Market Report
December 2009 53
With net crude oil imports of 4.49 mb/d and net product imports of 0.19 mb/d, China’s net oil imports in October were at 4.68 mb/d, 6% or 258,000 b/d higher compared to the previous month and 19% higher compared to October 2008. Average net oil imports for the first ten months of 2009 was at 4.34 mb/d, 5% or 204,000 b/d higher than at the same period last year. Angola and Saudi Arabia were China’s top crude oil suppliers in October, supplying about 0.9 mb/d each or 20% of China’s total crude imports this month. Iran Supplied 0.39 mb/d. Altogether, OPEC Member Countries supplied China with about 3.16 mb/d or 69% of its crude oil imports in October, up from 2.76 mb/d in the previous month. Top non-OPEC crude oil suppliers in October include Russia and Sudan with 0.29 mb/d each and Oman with 0.2 mb/d.
India India's net oil imports declined in October by 18% on lower crude and product net imports
According to preliminary data, India’s crude oil imports declined in October by about 220,000 b/d or 8% compared to the previous month to average 2.55 mb mb/d. October crude imports were also 137,000 b/d lower compared to the same month a year earlier. India’s crude oil imports during the first ten months of 2009 averaged 2.6 mb/d, almost unchanged compared to the same period a year ago. Similarly, India’s product imports declined in October by about 46,000 b/d or 19% compared to the previous month to average about 0.2 mb/d, some 50% lower compared to its petroleum product imports in the same month last year. For the third month in a row there were no gasoil or gasoline imports in October. LPG imports in October averaged about 70,000 b/d, compared to 52,000 b/d the previous month and 113,000 b/d the same month a year earlier. India imported an average of 12,000 b/d of naphtha in October, down from about 47,000 b/d the previous month and from 141,000 b/d a year ago. Fuel oil imports averaged 19,000 b/d, down from 25,000 b/d in both the previous month and a year earlier. Kerosene imports were about 19,000 b/d, steady compared to the previous month and down from 25,000 b/d a year ago. For the first ten months of 2009, India imported an average of 0.29 mb/d of products compared to 0.43 mb/d during the same period the previous year, indicating a 33% y-o-y decline.
ChangeAug 09 Sep 09 Oct 09 Oct/Sep
Crude oil 4,235 4,108 4,489 380Total products 189 316 194 -122Total crude and products 4,424 4,425 4,683 258
Table 26: China's crude and product net imports/(exports), tb/d
0
500
1,000
1,500
2,000
2,500
3,000
0
100
200
300
400
500
600
700
800
Oct
08
Nov
08
Dec
08
Jan
09
Feb
09
Mar
09
Apr
09
May
09
Jun
09
Jul 0
9
Aug
09
Sep
09
Oct
09
tb/dtb/d
Others LPG Naphtha GasolineKerosene Gasoil Fuel Oil Crude [RHS]
Graph 38: India's imports of crude and petroleum products
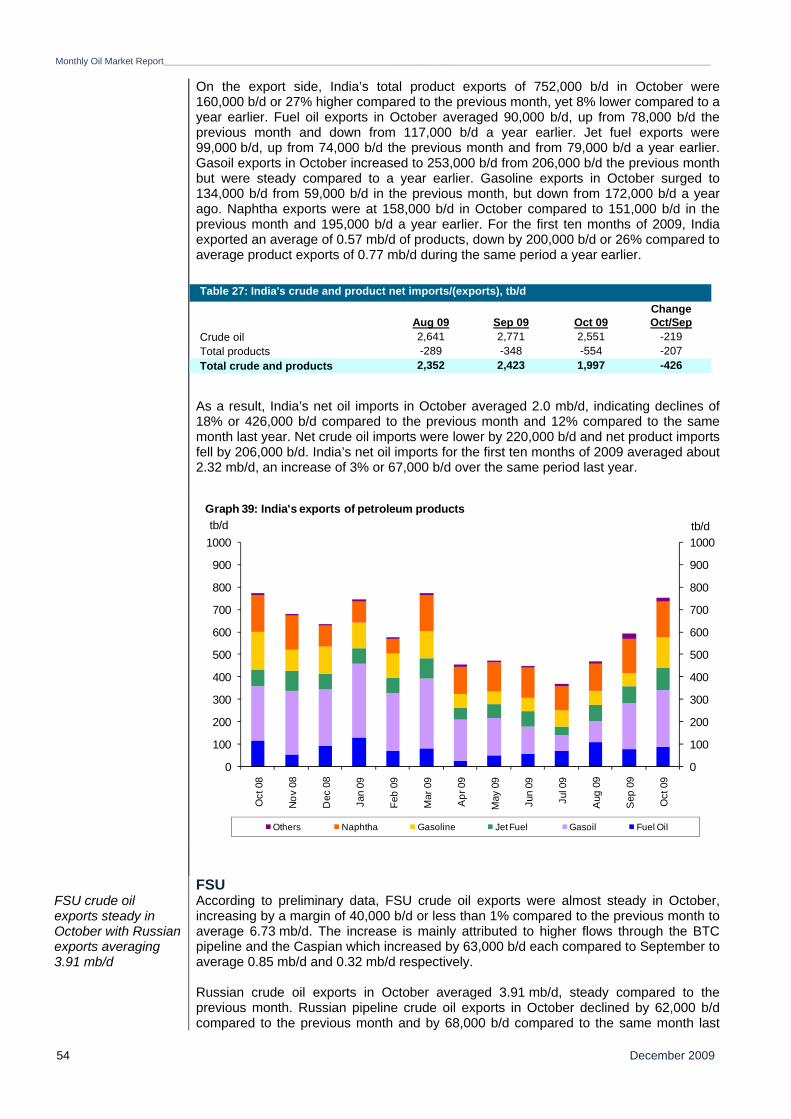
Monthly Oil Market Report_________________________________________________________________________________________________________________________________________
December 2009 54
On the export side, India’s total product exports of 752,000 b/d in October were 160,000 b/d or 27% higher compared to the previous month, yet 8% lower compared to a year earlier. Fuel oil exports in October averaged 90,000 b/d, up from 78,000 b/d the previous month and down from 117,000 b/d a year earlier. Jet fuel exports were 99,000 b/d, up from 74,000 b/d the previous month and from 79,000 b/d a year earlier. Gasoil exports in October increased to 253,000 b/d from 206,000 b/d the previous month but were steady compared to a year earlier. Gasoline exports in October surged to 134,000 b/d from 59,000 b/d in the previous month, but down from 172,000 b/d a year ago. Naphtha exports were at 158,000 b/d in October compared to 151,000 b/d in the previous month and 195,000 b/d a year earlier. For the first ten months of 2009, India exported an average of 0.57 mb/d of products, down by 200,000 b/d or 26% compared to average product exports of 0.77 mb/d during the same period a year earlier.
As a result, India’s net oil imports in October averaged 2.0 mb/d, indicating declines of 18% or 426,000 b/d compared to the previous month and 12% compared to the same month last year. Net crude oil imports were lower by 220,000 b/d and net product imports fell by 206,000 b/d. India’s net oil imports for the first ten months of 2009 averaged about 2.32 mb/d, an increase of 3% or 67,000 b/d over the same period last year.
FSU
FSU crude oil exports steady in October with Russian exports averaging 3.91 mb/d
According to preliminary data, FSU crude oil exports were almost steady in October, increasing by a margin of 40,000 b/d or less than 1% compared to the previous month to average 6.73 mb/d. The increase is mainly attributed to higher flows through the BTC pipeline and the Caspian which increased by 63,000 b/d each compared to September to average 0.85 mb/d and 0.32 mb/d respectively. Russian crude oil exports in October averaged 3.91 mb/d, steady compared to the previous month. Russian pipeline crude oil exports in October declined by 62,000 b/d compared to the previous month and by 68,000 b/d compared to the same month last
ChangeAug 09 Sep 09 Oct 09 Oct/Sep
Crude oil 2,641 2,771 2,551 -219Total products -289 -348 -554 -207Total crude and products 2,352 2,423 1,997 -426
Table 27: India's crude and product net imports/(exports), tb/d
0
100
200
300
400
500
600
700
800
900
1000
0
100
200
300
400
500
600
700
800
900
1000
Oct
08
Nov
08
Dec
08
Jan
09
Feb
09
Mar
09
Apr
09
May
09
Jun
09
Jul 0
9
Aug
09
Sep
09
Oct
09
tb/dtb/d
Others Naphtha Gasoline Jet Fuel Gasoil Fuel Oil
Graph 39: India's exports of petroleum products
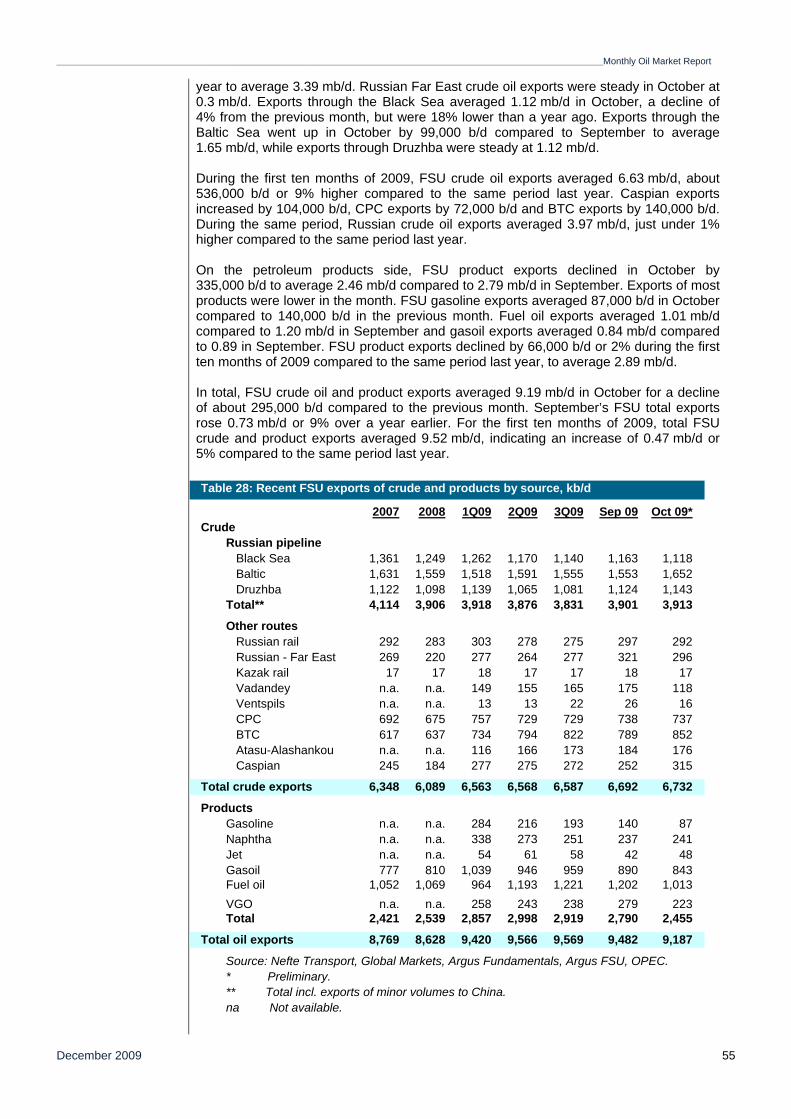
_________________________________________________________________________________________________________________________________________Monthly Oil Market Report
December 2009 55
year to average 3.39 mb/d. Russian Far East crude oil exports were steady in October at 0.3 mb/d. Exports through the Black Sea averaged 1.12 mb/d in October, a decline of 4% from the previous month, but were 18% lower than a year ago. Exports through the Baltic Sea went up in October by 99,000 b/d compared to September to average 1.65 mb/d, while exports through Druzhba were steady at 1.12 mb/d. During the first ten months of 2009, FSU crude oil exports averaged 6.63 mb/d, about 536,000 b/d or 9% higher compared to the same period last year. Caspian exports increased by 104,000 b/d, CPC exports by 72,000 b/d and BTC exports by 140,000 b/d. During the same period, Russian crude oil exports averaged 3.97 mb/d, just under 1% higher compared to the same period last year. On the petroleum products side, FSU product exports declined in October by 335,000 b/d to average 2.46 mb/d compared to 2.79 mb/d in September. Exports of most products were lower in the month. FSU gasoline exports averaged 87,000 b/d in October compared to 140,000 b/d in the previous month. Fuel oil exports averaged 1.01 mb/d compared to 1.20 mb/d in September and gasoil exports averaged 0.84 mb/d compared to 0.89 in September. FSU product exports declined by 66,000 b/d or 2% during the first ten months of 2009 compared to the same period last year, to average 2.89 mb/d. In total, FSU crude oil and product exports averaged 9.19 mb/d in October for a decline of about 295,000 b/d compared to the previous month. September’s FSU total exports rose 0.73 mb/d or 9% over a year earlier. For the first ten months of 2009, total FSU crude and product exports averaged 9.52 mb/d, indicating an increase of 0.47 mb/d or 5% compared to the same period last year.
2007 2008 1Q09 2Q09 3Q09 Sep 09 Oct 09*Crude
Russian pipeline Black Sea 1,361 1,249 1,262 1,170 1,140 1,163 1,118 Baltic 1,631 1,559 1,518 1,591 1,555 1,553 1,652 Druzhba 1,122 1,098 1,139 1,065 1,081 1,124 1,143Total** 4,114 3,906 3,918 3,876 3,831 3,901 3,913
Other routes Russian rail 292 283 303 278 275 297 292 Russian - Far East 269 220 277 264 277 321 296 Kazak rail 17 17 18 17 17 18 17 Vadandey n.a. n.a. 149 155 165 175 118 Ventspils n.a. n.a. 13 13 22 26 16 CPC 692 675 757 729 729 738 737 BTC 617 637 734 794 822 789 852 Atasu-Alashankou n.a. n.a. 116 166 173 184 176 Caspian 245 184 277 275 272 252 315
6,348 6,089 6,563 6,568 6,587 6,692 6,732
ProductsGasoline n.a. n.a. 284 216 193 140 87Naphtha n.a. n.a. 338 273 251 237 241Jet n.a. n.a. 54 61 58 42 48Gasoil 777 810 1,039 946 959 890 843Fuel oil 1,052 1,069 964 1,193 1,221 1,202 1,013VGO n.a. n.a. 258 243 238 279 223Total 2,421 2,539 2,857 2,998 2,919 2,790 2,455
8,769 8,628 9,420 9,566 9,569 9,482 9,187
Source: Nefte Transport, Global Markets, Argus Fundamentals, Argus FSU, OPEC.* Preliminary.** Total incl. exports of minor volumes to China.na Not available.
Table 28: Recent FSU exports of crude and products by source, kb/d
Total crude exports
Total oil exports
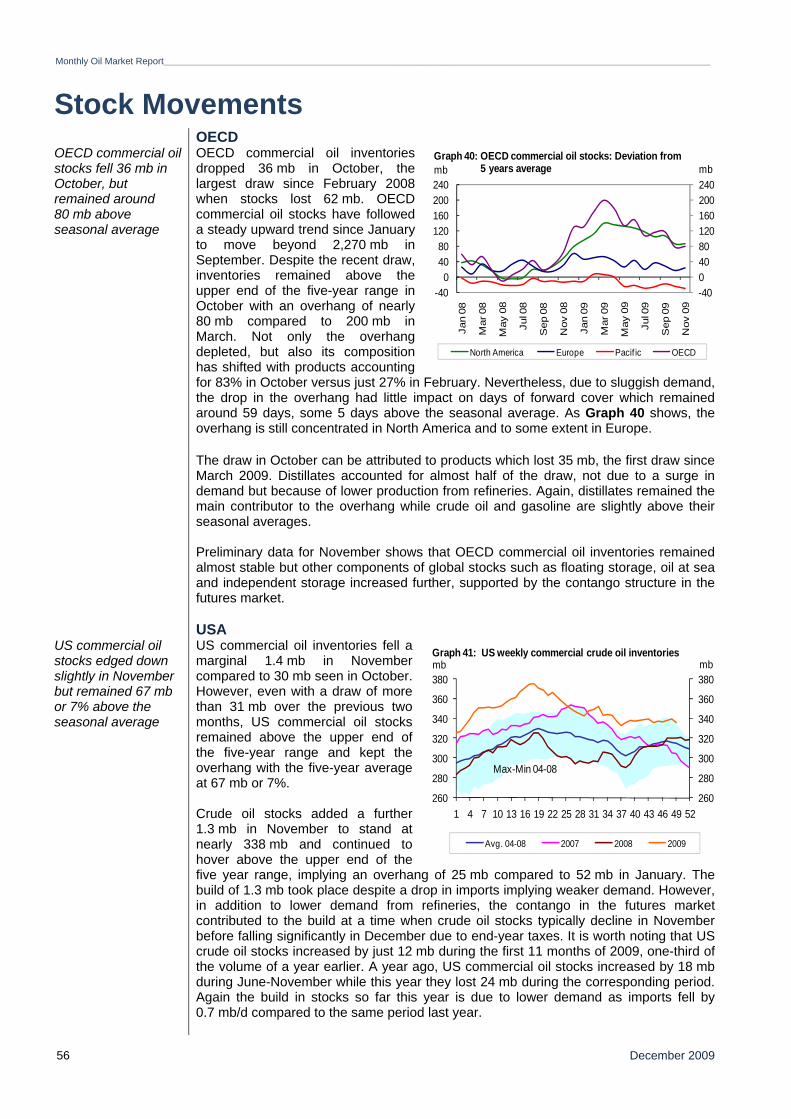
Monthly Oil Market Report_________________________________________________________________________________________________________________________________________
December 2009 56
Stock Movements
OECD OECD commercial oil stocks fell 36 mb in October, but remained around 80 mb above seasonal average
OECD commercial oil inventories dropped 36 mb in October, the largest draw since February 2008 when stocks lost 62 mb. OECD commercial oil stocks have followed a steady upward trend since January to move beyond 2,270 mb in September. Despite the recent draw, inventories remained above the upper end of the five-year range in October with an overhang of nearly 80 mb compared to 200 mb in March. Not only the overhang depleted, but also its composition has shifted with products accounting for 83% in October versus just 27% in February. Nevertheless, due to sluggish demand, the drop in the overhang had little impact on days of forward cover which remained around 59 days, some 5 days above the seasonal average. As Graph 40 shows, the overhang is still concentrated in North America and to some extent in Europe.
The draw in October can be attributed to products which lost 35 mb, the first draw since March 2009. Distillates accounted for almost half of the draw, not due to a surge in demand but because of lower production from refineries. Again, distillates remained the main contributor to the overhang while crude oil and gasoline are slightly above their seasonal averages. Preliminary data for November shows that OECD commercial oil inventories remained almost stable but other components of global stocks such as floating storage, oil at sea and independent storage increased further, supported by the contango structure in the futures market.
USA US commercial oil stocks edged down slightly in November but remained 67 mb or 7% above the seasonal average
US commercial oil inventories fell a marginal 1.4 mb in November compared to 30 mb seen in October. However, even with a draw of more than 31 mb over the previous two months, US commercial oil stocks remained above the upper end of the five-year range and kept the overhang with the five-year average at 67 mb or 7%. Crude oil stocks added a further 1.3 mb in November to stand at nearly 338 mb and continued to hover above the upper end of the five year range, implying an overhang of 25 mb compared to 52 mb in January. The build of 1.3 mb took place despite a drop in imports implying weaker demand. However, in addition to lower demand from refineries, the contango in the futures market contributed to the build at a time when crude oil stocks typically decline in November before falling significantly in December due to end-year taxes. It is worth noting that US crude oil stocks increased by just 12 mb during the first 11 months of 2009, one-third of the volume of a year earlier. A year ago, US commercial oil stocks increased by 18 mb during June-November while this year they lost 24 mb during the corresponding period. Again the build in stocks so far this year is due to lower demand as imports fell by 0.7 mb/d compared to the same period last year.
260
280
300
320
340
360
380
260
280
300
320
340
360
380
1 4 7 10 13 16 19 22 25 28 31 34 37 40 43 46 49 52
mbmb
Avg. 04-08 2007 2008 2009
Graph 41: US weekly commercial crude oil inventories
Max-Min 04-08
-4004080120160200240
-400
4080
120160200240
Jan
08
Mar
08
May
08
Jul 0
8
Sep
08
Nov
08
Jan
09
Mar
09
May
09
Jul 0
9
Sep
09
Nov
09
mbmb
North America Europe Pacif ic OECD
Graph 40: OECD commercial oil stocks: Deviation from 5 years average
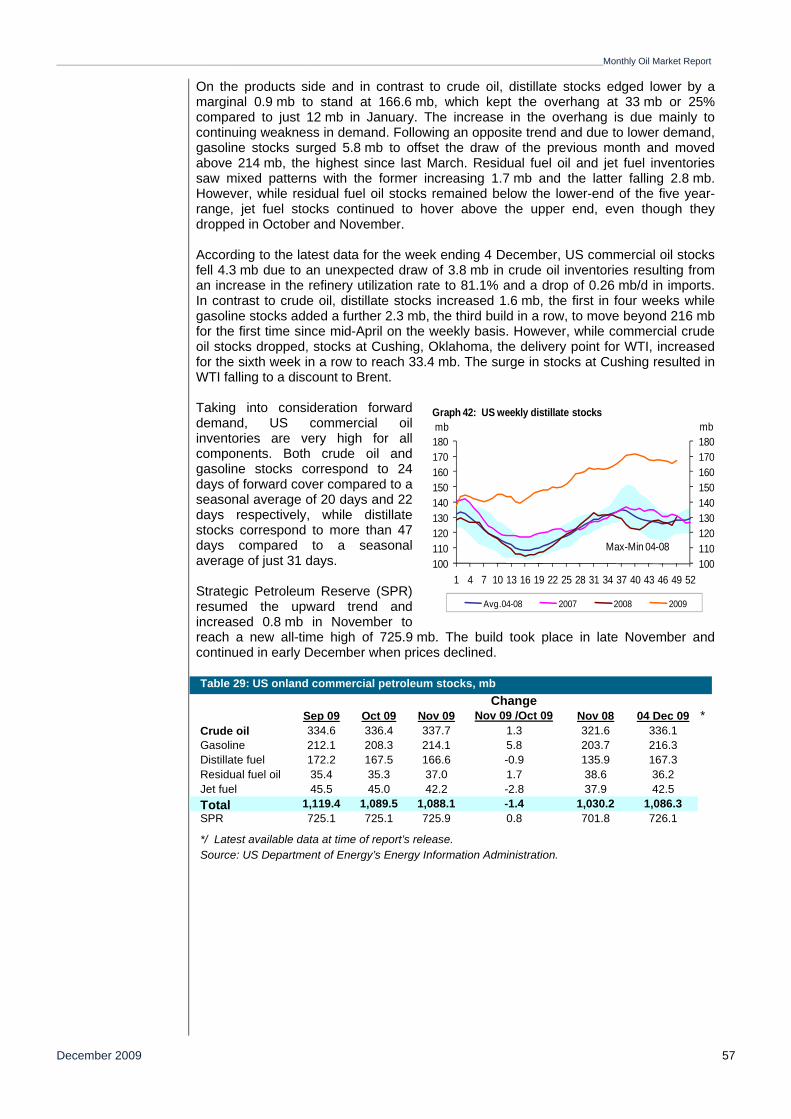
_________________________________________________________________________________________________________________________________________Monthly Oil Market Report
December 2009 57
On the products side and in contrast to crude oil, distillate stocks edged lower by a marginal 0.9 mb to stand at 166.6 mb, which kept the overhang at 33 mb or 25% compared to just 12 mb in January. The increase in the overhang is due mainly to continuing weakness in demand. Following an opposite trend and due to lower demand, gasoline stocks surged 5.8 mb to offset the draw of the previous month and moved above 214 mb, the highest since last March. Residual fuel oil and jet fuel inventories saw mixed patterns with the former increasing 1.7 mb and the latter falling 2.8 mb. However, while residual fuel oil stocks remained below the lower-end of the five year-range, jet fuel stocks continued to hover above the upper end, even though they dropped in October and November. According to the latest data for the week ending 4 December, US commercial oil stocks fell 4.3 mb due to an unexpected draw of 3.8 mb in crude oil inventories resulting from an increase in the refinery utilization rate to 81.1% and a drop of 0.26 mb/d in imports. In contrast to crude oil, distillate stocks increased 1.6 mb, the first in four weeks while gasoline stocks added a further 2.3 mb, the third build in a row, to move beyond 216 mb for the first time since mid-April on the weekly basis. However, while commercial crude oil stocks dropped, stocks at Cushing, Oklahoma, the delivery point for WTI, increased for the sixth week in a row to reach 33.4 mb. The surge in stocks at Cushing resulted in WTI falling to a discount to Brent.
Taking into consideration forward demand, US commercial oil inventories are very high for all components. Both crude oil and gasoline stocks correspond to 24 days of forward cover compared to a seasonal average of 20 days and 22 days respectively, while distillate stocks correspond to more than 47 days compared to a seasonal average of just 31 days. Strategic Petroleum Reserve (SPR) resumed the upward trend and increased 0.8 mb in November to reach a new all-time high of 725.9 mb. The build took place in late November and continued in early December when prices declined.
ChangeSep 09 Oct 09 Nov 09 Nov 09 /Oct 09 Nov 08 04 Dec 09 *
Crude oil 334.6 336.4 337.7 1.3 321.6 336.1Gasoline 212.1 208.3 214.1 5.8 203.7 216.3Distillate fuel 172.2 167.5 166.6 -0.9 135.9 167.3Residual fuel oil 35.4 35.3 37.0 1.7 38.6 36.2Jet fuel 45.5 45.0 42.2 -2.8 37.9 42.5Total 1,119.4 1,089.5 1,088.1 -1.4 1,030.2 1,086.3SPR 725.1 725.1 725.9 0.8 701.8 726.1
Table 29: US onland commercial petroleum stocks, mb
Source: US Department of Energy’s Energy Information Administration.*/ Latest available data at time of report’s release.
100110120130140150160170180
100110120130140150160170180
1 4 7 10 13 16 19 22 25 28 31 34 37 40 43 46 49 52
mbmb
Avg.04-08 2007 2008 2009
Graph 42: US weekly distillate stocks
Max-Min 04-08
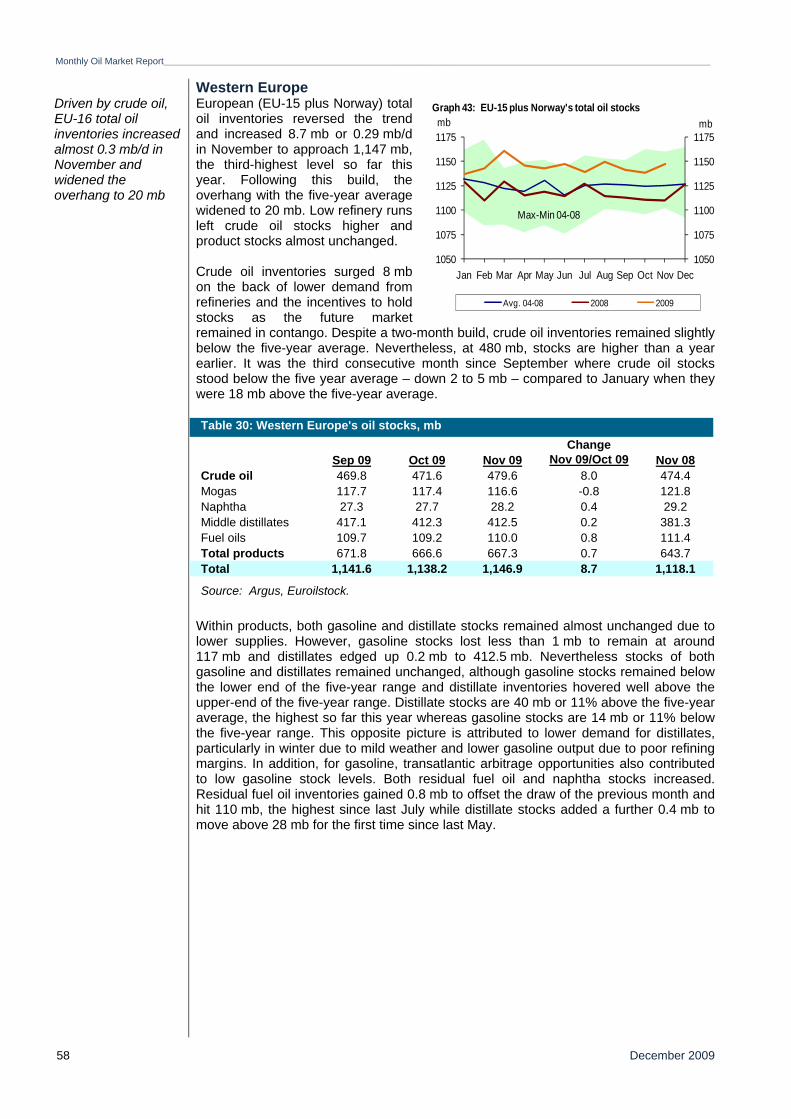
Monthly Oil Market Report_________________________________________________________________________________________________________________________________________
December 2009 58
Western Europe Driven by crude oil, EU-16 total oil inventories increased almost 0.3 mb/d in November and widened the overhang to 20 mb
European (EU-15 plus Norway) total oil inventories reversed the trend and increased 8.7 mb or 0.29 mb/d in November to approach 1,147 mb, the third-highest level so far this year. Following this build, the overhang with the five-year average widened to 20 mb. Low refinery runs left crude oil stocks higher and product stocks almost unchanged. Crude oil inventories surged 8 mb on the back of lower demand from refineries and the incentives to hold stocks as the future market remained in contango. Despite a two-month build, crude oil inventories remained slightly below the five-year average. Nevertheless, at 480 mb, stocks are higher than a year earlier. It was the third consecutive month since September where crude oil stocks stood below the five year average – down 2 to 5 mb – compared to January when they were 18 mb above the five-year average.
Within products, both gasoline and distillate stocks remained almost unchanged due to lower supplies. However, gasoline stocks lost less than 1 mb to remain at around 117 mb and distillates edged up 0.2 mb to 412.5 mb. Nevertheless stocks of both gasoline and distillates remained unchanged, although gasoline stocks remained below the lower end of the five-year range and distillate inventories hovered well above the upper-end of the five-year range. Distillate stocks are 40 mb or 11% above the five-year average, the highest so far this year whereas gasoline stocks are 14 mb or 11% below the five-year range. This opposite picture is attributed to lower demand for distillates, particularly in winter due to mild weather and lower gasoline output due to poor refining margins. In addition, for gasoline, transatlantic arbitrage opportunities also contributed to low gasoline stock levels. Both residual fuel oil and naphtha stocks increased. Residual fuel oil inventories gained 0.8 mb to offset the draw of the previous month and hit 110 mb, the highest since last July while distillate stocks added a further 0.4 mb to move above 28 mb for the first time since last May.
ChangeSep 09 Oct 09 Nov 09 Nov 09/Oct 09 Nov 08
Crude oil 469.8 471.6 479.6 8.0 474.4Mogas 117.7 117.4 116.6 -0.8 121.8Naphtha 27.3 27.7 28.2 0.4 29.2Middle distillates 417.1 412.3 412.5 0.2 381.3Fuel oils 109.7 109.2 110.0 0.8 111.4Total products 671.8 666.6 667.3 0.7 643.7Total 1,141.6 1,138.2 1,146.9 8.7 1,118.1
Source: Argus, Euroilstock.
Table 30: Western Europe's oil stocks, mb
1050
1075
1100
1125
1150
1175
1050
1075
1100
1125
1150
1175
Jan Feb Mar Apr May Jun Jul Aug Sep Oct Nov Dec
mbmb
Avg. 04-08 2008 2009
Graph 43: EU-15 plus Norway's total oil stocks
Max-Min 04-08
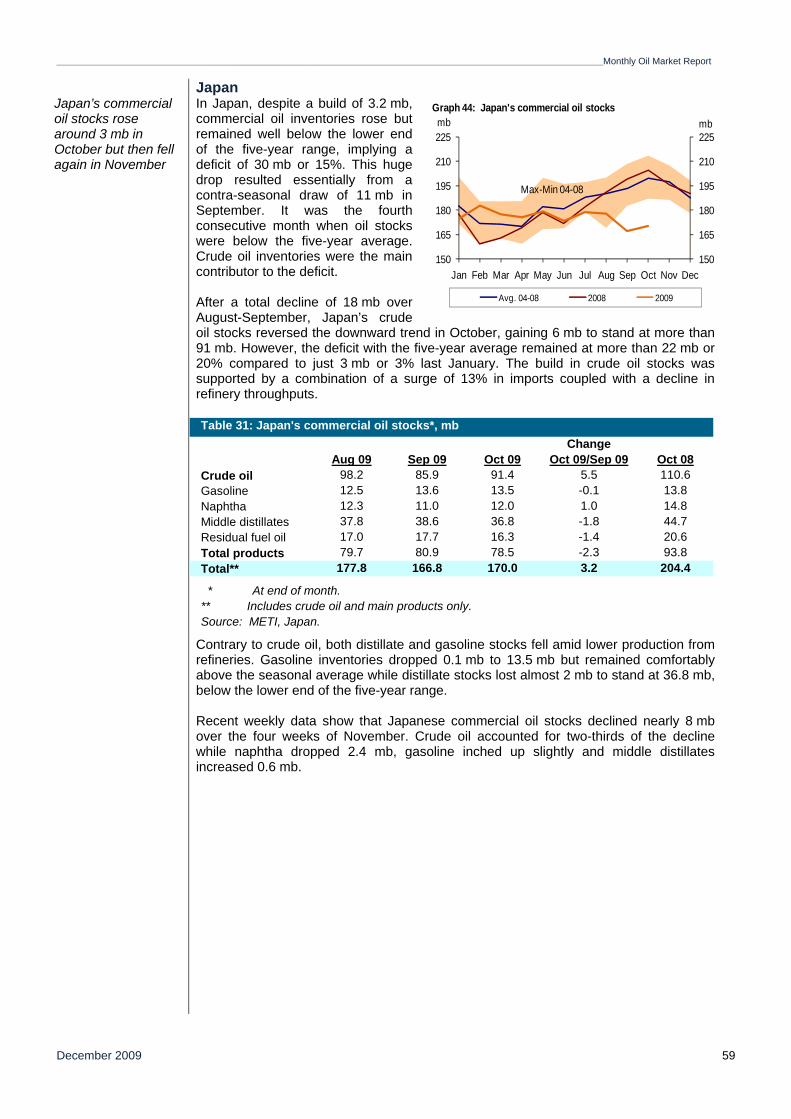
_________________________________________________________________________________________________________________________________________Monthly Oil Market Report
December 2009 59
Japan Japan’s commercial oil stocks rose around 3 mb in October but then fell again in November
In Japan, despite a build of 3.2 mb, commercial oil inventories rose but remained well below the lower end of the five-year range, implying a deficit of 30 mb or 15%. This huge drop resulted essentially from a contra-seasonal draw of 11 mb in September. It was the fourth consecutive month when oil stocks were below the five-year average. Crude oil inventories were the main contributor to the deficit. After a total decline of 18 mb over August-September, Japan’s crude oil stocks reversed the downward trend in October, gaining 6 mb to stand at more than 91 mb. However, the deficit with the five-year average remained at more than 22 mb or 20% compared to just 3 mb or 3% last January. The build in crude oil stocks was supported by a combination of a surge of 13% in imports coupled with a decline in refinery throughputs.
Contrary to crude oil, both distillate and gasoline stocks fell amid lower production from
refineries. Gasoline inventories dropped 0.1 mb to 13.5 mb but remained comfortably above the seasonal average while distillate stocks lost almost 2 mb to stand at 36.8 mb, below the lower end of the five-year range. Recent weekly data show that Japanese commercial oil stocks declined nearly 8 mb over the four weeks of November. Crude oil accounted for two-thirds of the decline while naphtha dropped 2.4 mb, gasoline inched up slightly and middle distillates increased 0.6 mb.
ChangeAug 09 Sep 09 Oct 09 Oct 09/Sep 09 Oct 08
Crude oil 98.2 85.9 91.4 5.5 110.6Gasoline 12.5 13.6 13.5 -0.1 13.8Naphtha 12.3 11.0 12.0 1.0 14.8Middle distillates 37.8 38.6 36.8 -1.8 44.7Residual fuel oil 17.0 17.7 16.3 -1.4 20.6Total products 79.7 80.9 78.5 -2.3 93.8Total** 177.8 166.8 170.0 3.2 204.4
Table 31: Japan's commercial oil stocks*, mb
Source: METI, Japan.
* At end of month.** Includes crude oil and main products only.
150
165
180
195
210
225
150
165
180
195
210
225
Jan Feb Mar Apr May Jun Jul Aug Sep Oct Nov Dec
mbmb
Avg. 04-08 2008 2009
Graph 44: Japan's commercial oil stocks
Max-Min 04-08
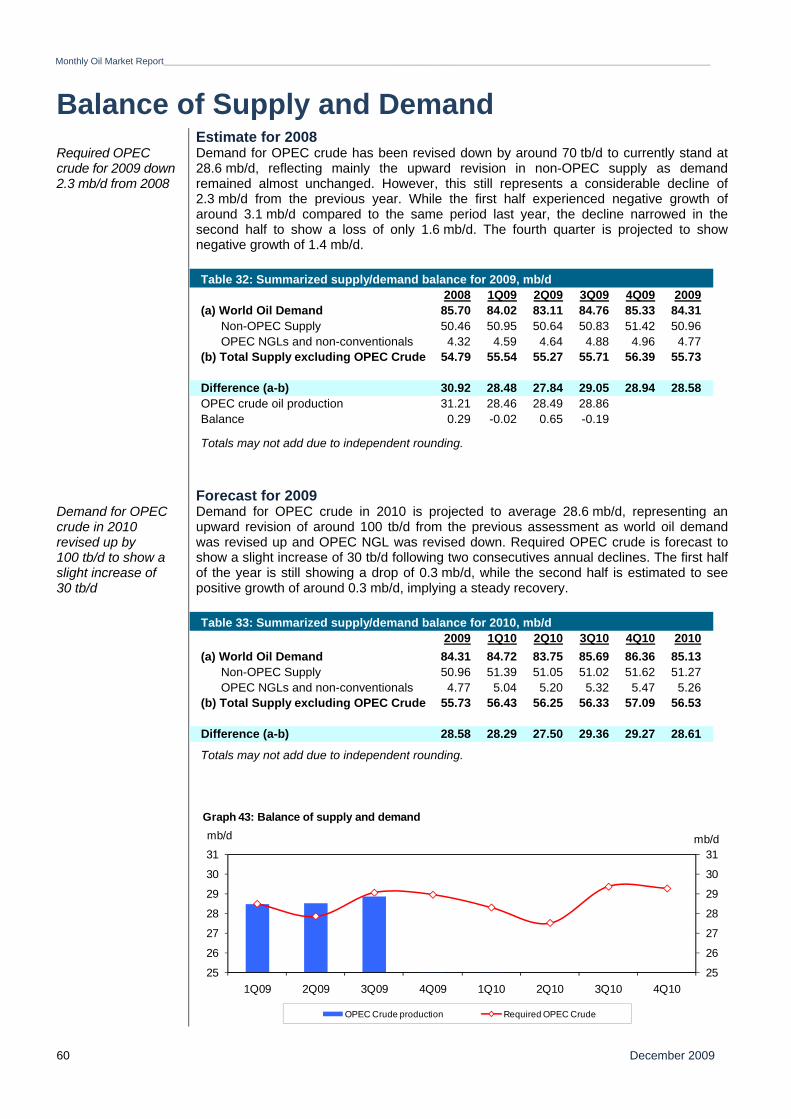
Monthly Oil Market Report_________________________________________________________________________________________________________________________________________
December 2009 60
Balance of Supply and Demand Estimate for 2008 Required OPEC crude for 2009 down 2.3 mb/d from 2008
Demand for OPEC crude has been revised down by around 70 tb/d to currently stand at 28.6 mb/d, reflecting mainly the upward revision in non-OPEC supply as demand remained almost unchanged. However, this still represents a considerable decline of 2.3 mb/d from the previous year. While the first half experienced negative growth of around 3.1 mb/d compared to the same period last year, the decline narrowed in the second half to show a loss of only 1.6 mb/d. The fourth quarter is projected to show negative growth of 1.4 mb/d.
Forecast for 2009 Demand for OPEC crude in 2010 revised up by 100 tb/d to show a slight increase of 30 tb/d
Demand for OPEC crude in 2010 is projected to average 28.6 mb/d, representing an upward revision of around 100 tb/d from the previous assessment as world oil demand was revised up and OPEC NGL was revised down. Required OPEC crude is forecast to show a slight increase of 30 tb/d following two consecutives annual declines. The first half of the year is still showing a drop of 0.3 mb/d, while the second half is estimated to see positive growth of around 0.3 mb/d, implying a steady recovery.
2008 1Q09 2Q09 3Q09 4Q09 2009(a) World Oil Demand 85.70 84.02 83.11 84.76 85.33 84.31 Non-OPEC Supply 50.46 50.95 50.64 50.83 51.42 50.96 OPEC NGLs and non-conventionals 4.32 4.59 4.64 4.88 4.96 4.77(b) Total Supply excluding OPEC Crude 54.79 55.54 55.27 55.71 56.39 55.73
Difference (a-b) 30.92 28.48 27.84 29.05 28.94 28.58OPEC crude oil production 31.21 28.46 28.49 28.86Balance 0.29 -0.02 0.65 -0.19
Totals may not add due to independent rounding.
Table 32: Summarized supply/demand balance for 2009, mb/d
2009 1Q10 2Q10 3Q10 4Q10 2010(a) World Oil Demand 84.31 84.72 83.75 85.69 86.36 85.13 Non-OPEC Supply 50.96 51.39 51.05 51.02 51.62 51.27 OPEC NGLs and non-conventionals 4.77 5.04 5.20 5.32 5.47 5.26(b) Total Supply excluding OPEC Crude 55.73 56.43 56.25 56.33 57.09 56.53
Difference (a-b) 28.58 28.29 27.50 29.36 29.27 28.61
Totals may not add due to independent rounding.
Table 33: Summarized supply/demand balance for 2010, mb/d
25
26
27
28
29
30
31
25
26
27
28
29
30
31
1Q09 2Q09 3Q09 4Q09 1Q10 2Q10 3Q10 4Q10
mb/dmb/d
OPEC Crude production Required OPEC Crude
Graph 43: Balance of supply and demand
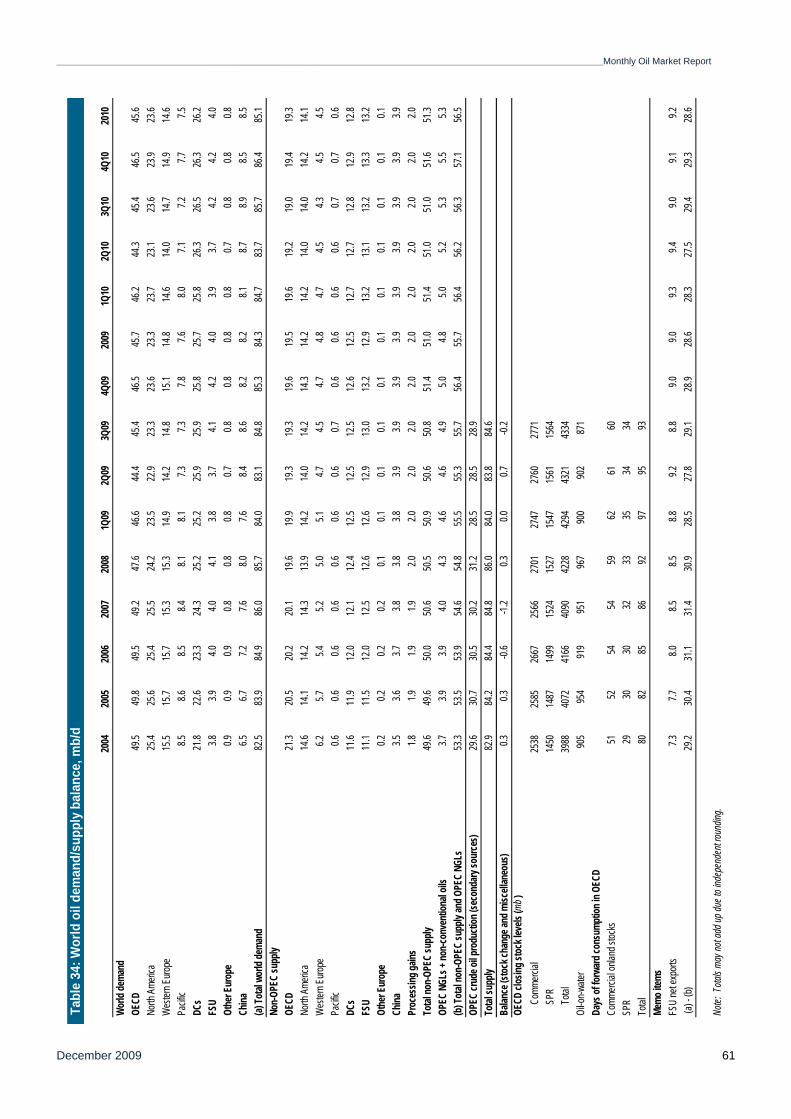
_________________________________________________________________________________________________________________________________________Monthly Oil Market Report
December 2009 61
2004
2005
2006
2007
2008
1Q09
2Q09
3Q09
4Q09
2009
1Q10
2Q10
3Q10
4Q10
2010
World
dema
ndOE
CD49
.549
.849
.549
.247
.646
.644
.445
.446
.545
.746
.244
.345
.446
.545
.6No
rth A
meric
a25
.425
.625
.425
.524
.223
.522
.923
.323
.623
.323
.723
.123
.623
.923
.6W
ester
n Euro
pe15
.515
.715
.715
.315
.314
.914
.214
.815
.114
.814
.614
.014
.714
.914
.6Pa
cific
8.58.6
8.58.4
8.18.1
7.37.3
7.87.6
8.07.1
7.27.7
7.5DC
s21
.822
.623
.324
.325
.225
.225
.925
.925
.825
.725
.826
.326
.526
.326
.2FS
U3.8
3.94.0
4.04.1
3.83.7
4.14.2
4.03.9
3.74.2
4.24.0
Othe
r Eur
ope
0.90.9
0.90.8
0.80.8
0.70.8
0.80.8
0.80.7
0.80.8
0.8Ch
ina6.5
6.77.2
7.68.0
7.68.4
8.68.2
8.28.1
8.78.9
8.58.5
(a) To
tal w
orld
dema
nd82
.583
.984
.986
.085
.784
.083
.184
.885
.384
.384
.783
.785
.786
.485
.1No
n-OPE
C su
pply
OECD
21.3
20.5
20.2
20.1
19.6
19.9
19.3
19.3
19.6
19.5
19.6
19.2
19.0
19.4
19.3
North
Ame
rica
14.6
14.1
14.2
14.3
13.9
14.2
14.0
14.2
14.3
14.2
14.2
14.0
14.0
14.2
14.1
Wes
tern E
urope
6.25.7
5.45.2
5.05.1
4.74.5
4.74.8
4.74.5
4.34.5
4.5Pa
cific
0.60.6
0.60.6
0.60.6
0.60.7
0.60.6
0.60.6
0.70.7
0.6DC
s11
.611
.912
.012
.112
.412
.512
.512
.512
.612
.512
.712
.712
.812
.912
.8FS
U11
.111
.512
.012
.512
.612
.612
.913
.013
.212
.913
.213
.113
.213
.313
.2Ot
her E
urop
e0.2
0.20.2
0.20.1
0.10.1
0.10.1
0.10.1
0.10.1
0.10.1
China
3.53.6
3.73.8
3.83.8
3.93.9
3.93.9
3.93.9
3.93.9
3.9Pr
oces
sing g
ains
1.81.9
1.91.9
2.02.0
2.02.0
2.02.0
2.02.0
2.02.0
2.0To
tal no
n-OPE
C su
pply
49.6
49.6
50.0
50.6
50.5
50.9
50.6
50.8
51.4
51.0
51.4
51.0
51.0
51.6
51.3
OPEC
NGL
s + no
n-con
venti
onal
oils
3.73.9
3.94.0
4.34.6
4.64.9
5.04.8
5.05.2
5.35.5
5.3(b)
Total
non-O
PEC
supp
ly an
d OPE
C NG
Ls53
.353
.553
.954
.654
.855
.555
.355
.756
.455
.756
.456
.256
.357
.156
.5OP
EC cr
ude o
il pro
ducti
on (s
econ
dary
sour
ces)
29.6
30.7
30.5
30.2
31.2
28.5
28.5
28.9
Total
supp
ly82
.984
.284
.484
.886
.084
.083
.884
.6Ba
lance
(stoc
k cha
nge a
nd m
iscell
aneo
us)
0.30.3
-0.6
-1.2
0.30.0
0.7-0.
2OE
CD cl
osing
stoc
k lev
els (m
b )
Com
merci
al25
3825
8526
6725
6627
0127
4727
6027
71
SPR
1450
1487
1499
1524
1527
1547
1561
1564
To
tal39
8840
7241
6640
9042
2842
9443
2143
34Oi
l-on-w
ater
905
954
919
951
967
900
902
871
Days
of fo
rward
cons
umpti
on in
OEC
DCo
mmerc
ial on
land s
tocks
5152
5454
5962
6160
SPR
2930
3032
3335
3434
Total
8082
8586
9297
9593
Memo
items
FSU
net e
xport
s7.3
7.78.0
8.58.5
8.89.2
8.89.0
9.09.3
9.49.0
9.19.2
(a) -
(b)
29
.230
.431
.131
.430
.928
.527
.829
.128
.928
.628
.327
.529
.429
.328
.6
Note:
Tota
ls ma
y not
add u
p due
to in
depe
nden
t roun
ding.
Tabl
e 34
: Wor
ld o
il de
man
d/su
pply
bal
ance
, mb/
d
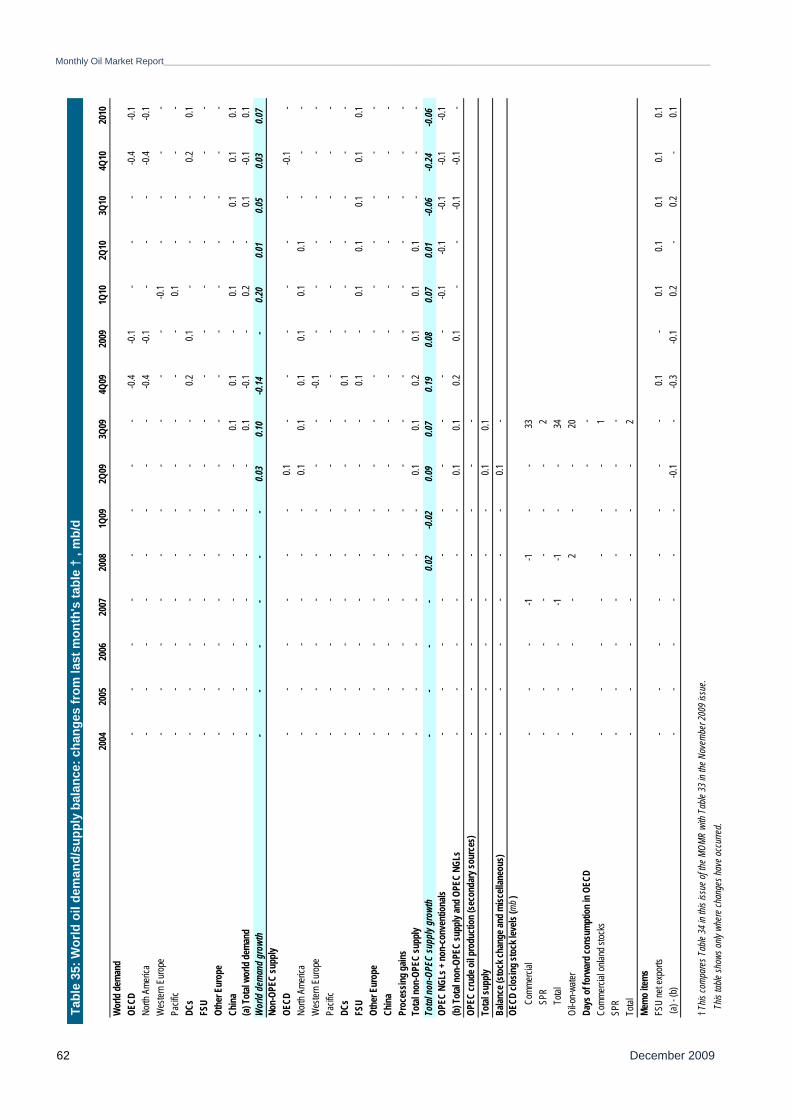
Monthly Oil Market Report_________________________________________________________________________________________________________________________________________
December 2009 62
Tabl
e 35
: Wor
ld o
il de
man
d/su
pply
bal
ance
: cha
nges
from
last
mon
th's
tabl
e †
, mb/
d
2004
2005
2006
2007
2008
1Q09
2Q09
3Q09
4Q09
2009
1Q10
2Q10
3Q10
4Q10
2010
Wor
ld de
mand
OECD
--
--
--
--
-0.4
-0.1
--
--0
.4-0
.1No
rth A
meric
a-
--
--
--
--0
.4-0
.1-
--
-0.4
-0.1
Wes
tern E
urop
e-
--
--
--
--
--0
.1-
--
-Pa
cific
--
--
--
--
--
0.1-
--
-DC
s-
--
--
--
-0.2
0.1-
--
0.20.1
FSU
--
--
--
--
--
--
--
-Ot
her E
urop
e-
--
--
--
--
--
--
--
China
--
--
--
-0.1
0.1-
0.1-
0.10.1
0.1(a)
Total
wor
ld de
mand
--
--
--
-0.1
-0.1
-0.2
-0.1
-0.1
0.1W
orld
dema
nd gr
owth
--
--
--
0.03
0.10
-0.14
-0.2
00.0
10.0
50.0
30.0
7No
n-OP
EC su
pply
OECD
--
--
--
0.1-
--
--
--0
.1-
North
Ame
rica
--
--
--
0.10.1
0.10.1
0.10.1
--
-W
ester
n Eur
ope
--
--
--
--
-0.1
--
--
--
Pacif
ic-
--
--
--
--
--
--
--
DCs
--
--
--
--
0.1-
--
--
-FS
U-
--
--
--
-0.1
-0.1
0.10.1
0.10.1
Othe
r Eur
ope
--
--
--
--
--
--
--
-Ch
ina-
--
--
--
--
--
--
--
Proc
essin
g gain
s-
--
--
--
--
--
--
--
Total
non-
OPEC
supp
ly-
--
--
-0.1
0.10.2
0.10.1
0.1-
--
Total
non-
OPEC
supp
ly gr
owth
--
--
0.02
-0.02
0.09
0.07
0.19
0.08
0.07
0.01
-0.06
-0.24
-0.06
OPEC
NGL
s + no
n-co
nven
tiona
ls-
--
--
--
--
--0
.1-0
.1-0
.1-0
.1-0
.1(b
) Tot
al no
n-OP
EC su
pply
and O
PEC
NGLs
--
--
--
0.10.1
0.20.1
--
-0.1
-0.1
-OP
EC cr
ude o
il pro
ducti
on (s
econ
dary
sour
ces)
--
--
--
--
Total
supp
ly-
--
--
-0.1
0.1Ba
lance
(sto
ck ch
ange
and m
iscell
aneo
us)
--
--
--
0.1-
OECD
clos
ing st
ock l
evels
(mb )
C
omme
rcial
--
--1
-1-
-33
S
PR-
--
--
--
2
Tota
l-
--
-1-1
--
34Oi
l-on-
water
--
--
2-
-20
Days
of fo
rwar
d con
sump
tion i
n OEC
D-
-Co
mmer
cial o
nland
stoc
ks-
--
--
--
1SP
R-
--
--
--
-To
tal-
--
--
--
2Me
mo ite
msFS
U ne
t exp
orts
--
--
--
--
0.1-
0.10.1
0.10.1
0.1 (a
) - (b
)
-
--
--
--0
.1-
-0.3
-0.1
0.2-
0.2-
0.1
† This
comp
ares
Tab
le 34
in th
is iss
ue of
the M
OMR
with
Table
33 in
the N
ovem
ber 2
009 i
ssue
. T
his ta
ble sh
ows o
nly w
here
chan
ges h
ave o
ccur
red.
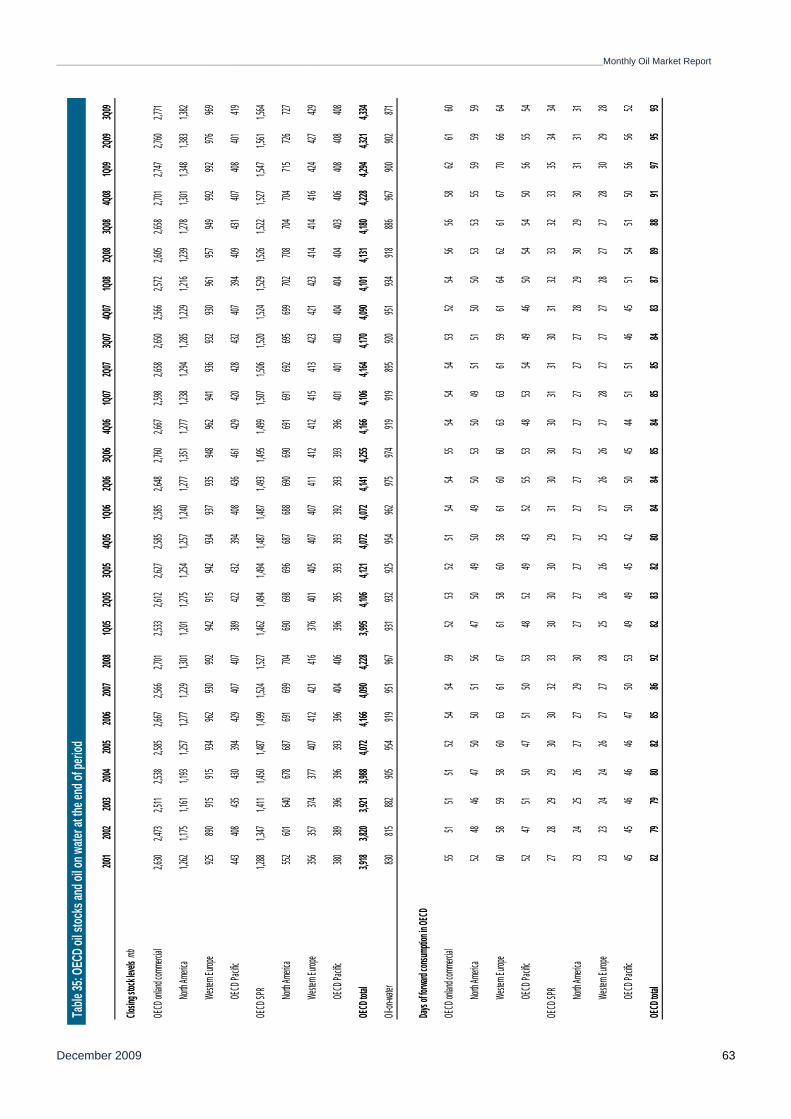
_________________________________________________________________________________________________________________________________________Monthly Oil Market Report
December 2009 63
2001
2002
2003
2004
2005
2006
2007
2008
1Q05
2Q05
3Q05
4Q05
1Q06
2Q06
3Q06
4Q06
1Q07
2Q07
3Q07
4Q07
1Q08
2Q08
3Q08
4Q08
1Q09
2Q09
3Q09
Closin
g stoc
k level
s mb
OECD
onlan
d com
mercia
l2,6
302,4
732,5
112,5
382,5
852,6
672,5
662,7
012,5
332,6
122,6
272,5
852,5
852,6
482,7
602,6
672,5
982,6
582,6
502,5
662,5
722,6
052,6
582,7
012,7
472,7
602,7
71
North A
merica
1,262
1,175
1,161
1,193
1,257
1,277
1,229
1,301
1,201
1,275
1,254
1,257
1,240
1,277
1,351
1,277
1,238
1,294
1,285
1,229
1,216
1,239
1,278
1,301
1,348
1,383
1,382
Weste
rn Euro
pe925
890915
915934
962930
992942
915942
934937
935948
962941
936932
930961
957949
992992
976969
OECD
Pacific
443408
435430
394429
407407
389422
432394
408436
461429
420428
432407
394409
431407
408401
419
OECD
SPR
1,288
1,347
1,411
1,450
1,487
1,499
1,524
1,527
1,462
1,494
1,494
1,487
1,487
1,493
1,495
1,499
1,507
1,506
1,520
1,524
1,529
1,526
1,522
1,527
1,547
1,561
1,564
North A
merica
552601
640678
687691
699704
690698
696687
688690
690691
691692
695699
702708
704704
715726
727
Weste
rn Euro
pe356
357374
377407
412421
416376
401405
407407
411412
412415
413423
421423
414414
416424
427429
OECD
Pacific
380389
396396
393396
404406
396395
393393
392393
393396
401401
403404
404404
403406
408408
408
OECD
total
3,918
3,820
3,921
3,988
4,072
4,166
4,090
4,228
3,995
4,106
4,121
4,072
4,072
4,141
4,255
4,166
4,106
4,164
4,170
4,090
4,101
4,131
4,180
4,228
4,294
4,321
4,334
Oil-on-
water
830815
882905
954919
951967
931932
925954
962975
974919
919895
920951
934918
886967
900902
871
Days o
f forwa
rd cons
umptio
n in OE
CD
OECD
onlan
d com
mercia
l55
5151
5152
5454
5952
5352
5154
5455
5454
5453
5254
5656
5862
6160
North A
merica
5248
4647
5050
5156
4750
4950
4950
5350
4951
5150
5053
5355
5959
59
Weste
rn Euro
pe60
5859
5860
6361
6761
5860
5861
6060
6363
6159
6164
6261
6770
6664
OECD
Pacific
5247
5150
4751
5053
4852
4943
5255
5348
5354
4946
5054
5450
5655
54
OECD
SPR
2728
2929
3030
3233
3030
3029
3130
3030
3131
3031
3233
3233
3534
34
North A
merica
2324
2526
2727
2930
2727
2727
2727
2727
2727
2728
2930
2930
3131
31
Weste
rn Euro
pe23
2324
2426
2727
2825
2626
2527
2626
2728
2727
2728
2727
2830
2928
OECD
Pacific
4545
4646
4647
5053
4949
4542
5050
4544
5151
4645
5154
5150
5656
52
OECD
total
8279
7980
8285
8692
8283
8280
8484
8584
8585
8483
8789
8891
9795
93
n.a. No
t availa
ble.
Table
35: O
ECD o
il stoc
ks an
d oil o
n wate
r at th
e end
of pe
riod
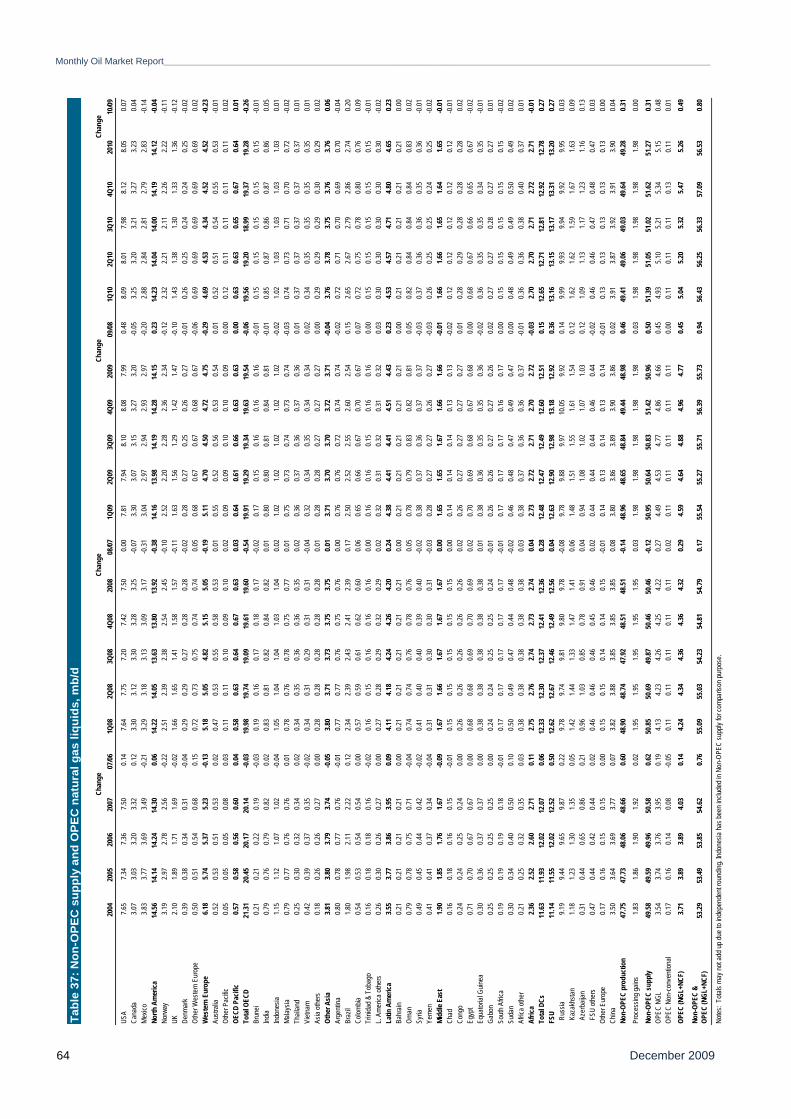
Monthly Oil Market Report_________________________________________________________________________________________________________________________________________
December 2009 64
Ch
ange
Chan
geCh
ange
Chan
ge20
0420
0520
0620
0707
/061Q
082Q
083Q
084Q
0820
0808
/07
1Q09
2Q09
3Q09
4Q09
2009
09/08
1Q10
2Q10
3Q10
4Q10
2010
10/0
9
USA
7.65
7.34
7.36
7.50
0.14
7.64
7.75
7.20
7.42
7.50
0.00
7.81
7.94
8.10
8.08
7.99
0.48
8.09
8.01
7.98
8.12
8.05
0.07
Cana
da3.
073.
033.
203.
320.
123.
303.
123.
303.
283.
25-0
.07
3.30
3.07
3.15
3.27
3.20
-0.0
53.
253.
203.
213.
273.
230.
04M
exico
3.83
3.77
3.69
3.49
-0.2
13.
293.
183.
133.
093.
17-0
.31
3.04
2.97
2.94
2.93
2.97
-0.2
02.
882.
842.
812.
792.
83-0
.14
North
Am
erica
14.5
614
.1414
.24
14.3
00.
0614
.22
14.0
513
.6313
.80
13.92
-0.3
814
.1613
.98
14.1
914
.2814
.15
0.23
14.2
314
.0414
.00
14.1
914
.12-0
.04
Norw
ay3.
192.
972.
782.
56-0
.22
2.51
2.39
2.38
2.54
2.45
-0.1
02.
522.
202.
282.
362.
34-0
.12
2.32
2.21
2.11
2.26
2.22
-0.1
1UK
2.10
1.89
1.71
1.69
-0.0
21.
661.
651.
411.
581.
57-0
.11
1.63
1.56
1.29
1.42
1.47
-0.1
01.
431.
381.
301.
331.
36-0
.12
Denm
ark
0.39
0.38
0.34
0.31
-0.0
40.
290.
290.
270.
280.
28-0
.02
0.28
0.27
0.25
0.26
0.27
-0.0
10.
260.
250.
240.
240.
25-0
.02
Othe
r Wes
tern
Eur
ope
0.50
0.51
0.54
0.68
0.15
0.72
0.73
0.75
0.74
0.74
0.05
0.68
0.67
0.67
0.68
0.67
-0.0
60.
690.
690.
690.
690.
690.
02W
este
rn E
urop
e6.
185.
745.
375.
23-0
.135.
185.
054.8
25.
155.
05-0
.19
5.11
4.70
4.50
4.72
4.75
-0.29
4.69
4.53
4.34
4.52
4.52
-0.2
3Au
strali
a0.
520.
530.
510.
530.
020.
470.
530.
550.
580.
530.
010.
550.
520.
560.
530.
540.
010.
520.
510.
540.
550.
53-0
.01
Othe
r Pac
ific0.
050.
050.
050.
080.
030.
110.
110.
100.
090.
100.
020.
090.
090.
100.
100.
090.
000.
120.
110.
110.
110.
110.
02OE
CD P
acifi
c0.5
70.
580.5
60.6
00.
040.5
80.6
30.
640.6
70.6
30.0
30.6
40.6
10.6
60.
630.6
30.
000.6
30.6
30.
650.6
70.
640.0
1To
tal O
ECD
21.3
120
.4520
.17
20.1
4-0
.0319
.98
19.7
419
.0919
.61
19.60
-0.5
419
.9119
.29
19.3
419
.6319
.54
-0.06
19.5
619
.2018
.99
19.3
719
.28-0
.26
Brun
ei0.
210.
210.
220.
19-0
.03
0.19
0.16
0.17
0.18
0.17
-0.0
20.
170.
150.
160.
160.
16-0
.01
0.15
0.15
0.15
0.15
0.15
-0.0
1In
dia0.
790.
760.
790.
820.
020.
830.
810.
820.
840.
820.
010.
800.8
00.
810.
840.
81-0
.01
0.85
0.87
0.86
0.87
0.86
0.05
Indo
nesia
1.15
1.12
1.07
1.02
-0.0
41.
051.
041.
041.
031.
040.
021.
021.
021.
021.
021.
02-0
.02
1.02
1.03
1.03
1.03
1.03
0.01
Mala
ysia
0.79
0.77
0.76
0.76
0.01
0.78
0.76
0.78
0.75
0.77
0.01
0.75
0.73
0.74
0.73
0.74
-0.0
30.
740.
730.
710.
700.
72-0
.02
Thail
and
0.25
0.30
0.32
0.34
0.02
0.34
0.35
0.36
0.36
0.35
0.02
0.36
0.37
0.36
0.37
0.36
0.01
0.37
0.37
0.37
0.37
0.37
0.01
Viet
nam
0.42
0.39
0.37
0.35
-0.0
20.
340.
310.
290.
310.
31-0
.04
0.32
0.34
0.35
0.34
0.34
0.02
0.34
0.35
0.35
0.35
0.35
0.01
Asia
othe
rs0.
180.
260.
260.
270.
000.
280.
280.
280.
280.
280.
010.
280.
280.
270.
270.
270.
000.
290.
290.
290.
300.
290.
02Ot
her A
sia3.
813.
803.
793.
74-0
.053.
803.
713.7
33.
753.
750.
013.
713.7
03.
703.7
23.
71-0
.04
3.76
3.78
3.75
3.76
3.76
0.06
Arge
ntina
0.80
0.78
0.77
0.76
-0.0
10.
770.
770.
760.
750.
760.
000.
760.
760.
720.
740.
74-0
.02
0.72
0.71
0.70
0.69
0.70
-0.0
4Br
azil
1.80
1.98
2.11
2.22
0.12
2.34
2.39
2.43
2.41
2.39
0.17
2.50
2.52
2.55
2.60
2.54
0.15
2.65
2.67
2.79
2.86
2.74
0.20
Colom
bia0.
540.
530.
540.
540.
000.
570.
590.
610.
620.
600.
060.
650.
660.
670.
700.
670.
070.
720.
750.
780.
800.
760.
09Tr
inida
d &
Toba
go0.
160.
180.
180.
16-0
.02
0.16
0.15
0.16
0.16
0.16
0.00
0.16
0.16
0.15
0.16
0.16
0.00
0.15
0.15
0.15
0.15
0.15
-0.0
1L.
Am
erica
oth
ers
0.26
0.30
0.26
0.27
0.00
0.27
0.28
0.29
0.32
0.29
0.02
0.32
0.31
0.32
0.31
0.32
0.03
0.30
0.30
0.30
0.30
0.30
-0.0
2La
tin A
mer
ica
3.55
3.77
3.86
3.95
0.09
4.11
4.18
4.24
4.26
4.20
0.24
4.38
4.41
4.41
4.51
4.43
0.23
4.53
4.57
4.71
4.80
4.65
0.23
Bahr
ain0.
210.
210.
210.
210.
000.
210.
210.
210.
210.
210.
000.
210.
210.
210.
210.
210.
000.
210.
210.
210.
210.
210.
00Om
an0.
790.
780.
750.
71-0
.04
0.74
0.74
0.76
0.78
0.76
0.05
0.78
0.79
0.83
0.82
0.81
0.05
0.82
0.84
0.84
0.84
0.83
0.02
Syria
0.49
0.45
0.44
0.42
-0.0
20.
410.
400.
400.
390.
40-0
.02
0.38
0.37
0.36
0.37
0.37
-0.0
30.
370.
360.
360.
350.
36-0
.01
Yem
en0.
410.
410.
370.
34-0
.04
0.31
0.31
0.30
0.30
0.31
-0.0
30.
280.
270.
270.
260.
27-0
.03
0.26
0.25
0.25
0.24
0.25
-0.0
2M
iddl
e Eas
t1.
901.
851.
761.
67-0
.091.
671.
661.6
71.
671.
670.
001.
651.6
51.
671.6
61.
66-0
.01
1.66
1.66
1.65
1.64
1.65
-0.0
1Ch
ad0.
160.
180.
160.
15-0
.01
0.15
0.15
0.15
0.15
0.15
0.00
0.14
0.14
0.14
0.13
0.13
-0.0
20.
120.
120.
120.
120.
12-0
.01
Cong
o0.
240.
240.
250.
240.
000.
260.
260.
260.
260.
260.
020.
260.
270.
270.
270.
270.
010.
280.
290.
280.
280.
280.
02Eg
ypt
0.71
0.70
0.67
0.67
0.00
0.68
0.68
0.69
0.70
0.69
0.02
0.70
0.69
0.68
0.67
0.68
0.00
0.68
0.67
0.66
0.65
0.67
-0.0
2Eq
uato
rial G
uinea
0.30
0.36
0.37
0.37
0.00
0.38
0.38
0.38
0.38
0.38
0.01
0.38
0.36
0.35
0.35
0.36
-0.0
20.
360.
350.
350.
340.
35-0
.01
Gabo
n0.
250.
250.
250.
250.
000.
240.
240.
250.
250.
24-0
.01
0.26
0.26
0.27
0.27
0.26
0.02
0.27
0.27
0.28
0.27
0.27
0.01
Sout
h Af
rica
0.19
0.19
0.19
0.18
-0.0
10.
170.
170.
170.
170.
17-0
.01
0.17
0.17
0.17
0.16
0.17
0.00
0.15
0.15
0.15
0.15
0.15
-0.0
2Su
dan
0.30
0.34
0.40
0.50
0.10
0.50
0.49
0.47
0.44
0.48
-0.0
20.
460.
480.
470.
490.
470.
000.
480.
490.
490.
500.
490.
02Af
rica
othe
r0.
210.
250.
320.
350.
030.
380.
380.
380.
380.
380.
030.
380.3
70.
360.
360.
37-0
.01
0.36
0.36
0.38
0.40
0.37
0.01
Afric
a2.
362.
522.
602.
710.
112.
752.
762.
742.
732.
740.
042.
732.7
22.
712.
702.
72-0
.032.
702.
702.7
12.
722.7
1-0
.01
Tota
l DCs
11.6
311
.9312
.02
12.0
70.
0612
.33
12.3
012
.3712
.41
12.36
0.28
12.48
12.4
712
.49
12.60
12.5
10.
1512
.65
12.71
12.8
112
.92
12.78
0.27
FSU
11.1
411
.5512
.02
12.5
20.
5012
.62
12.6
712
.4612
.49
12.56
0.04
12.63
12.9
012
.98
13.18
12.9
20.
3613
.16
13.15
13.1
713
.31
13.20
0.27
Rus
sia9.
199.
449.
659.
870.
229.
789.
749.
819.
809.
78-0
.08
9.78
9.88
9.97
10.0
59.
920.
149.
999.
939.
949.
929.
950.
03 K
azak
hsta
n1.
181.
231.
301.
350.
051.
421.
441.
331.
471.
410.
061.
481.
511.
551.
611.
540.
121.
621.
621.
591.
671.
630.
09 A
zerb
aijan
0.31
0.44
0.65
0.86
0.21
0.96
1.03
0.85
0.78
0.91
0.04
0.94
1.08
1.02
1.07
1.03
0.12
1.09
1.13
1.17
1.23
1.16
0.13
FSU
oth
ers
0.47
0.44
0.42
0.44
0.02
0.46
0.46
0.46
0.45
0.46
0.02
0.44
0.44
0.44
0.46
0.44
-0.0
20.
460.
460.
470.
480.
470.
03Ot
her E
urop
e0.
170.
160.
150.
150.
000.
150.
150.
140.
140.
15-0
.01
0.14
0.13
0.14
0.13
0.14
-0.0
10.
130.
130.
130.
130.
130.
00Ch
ina3.
503.
643.
693.
770.
073.
823.
883.
853.
853.
850.
083.
803.
863.
893.
903.
860.
023.
913.
873.
923.
913.
900.
04No
n-OP
EC p
rodu
ctio
n47
.75
47.73
48.0
648
.66
0.60
48.9
048
.74
47.92
48.5
148
.51-0
.14
48.96
48.6
548
.84
49.44
48.9
80.
4649
.41
49.06
49.0
349
.64
49.28
0.31
Proc
essin
g ga
ins1.
831.
861.
901.
920.
021.
951.
951.
951.
951.
950.
031.
981.
981.
981.
981.
980.
031.
981.
981.
981.
981.
980.
00
Non-
OPEC
sup
ply
49.5
849
.5949
.96
50.5
80.
6250
.85
50.6
949
.8750
.46
50.46
-0.1
250
.9550
.64
50.8
351
.4250
.96
0.50
51.3
951
.0551
.02
51.6
251
.270.
31OP
EC N
GL3.
543.
743.
763.
950.
194.
134.
234.
264.
254.
220.
274.
494.
534.
774.
864.
660.
454.
935.
105.
215.
345.
150.
48OP
EC N
on-c
onve
ntion
al0.
170.
160.
140.
08-0
.05
0.11
0.11
0.11
0.11
0.11
0.02
0.11
0.11
0.11
0.11
0.11
0.00
0.11
0.11
0.11
0.13
0.11
0.01
OPEC
(NGL
+NCF
)3.
713.
893.
894.
030.
144.
244.
344.
364.
364.
320.
294.
594.6
44.
884.
964.
770.
455.
045.
205.
325.
475.
260.
49
Non-
OPEC
&
OPEC
(NGL
+NCF
)53
.29
53.49
53.8
554
.62
0.76
55.0
955
.03
54.23
54.8
154
.790.
1755
.5455
.27
55.7
156
.3955
.73
0.94
56.4
356
.2556
.33
57.0
956
.530.
80
Note
s: T
otals
may
not
add
up
due
to in
depe
nden
t rou
nding
. Ind
ones
ia ha
s bee
n inc
luded
in N
on-O
PEC
supp
ly fo
r com
paris
on p
urpo
se.
Tabl
e 37
: Non
-OP
EC
sup
ply
and
OP
EC
nat
ural
gas
liqu
ids,
mb/
d
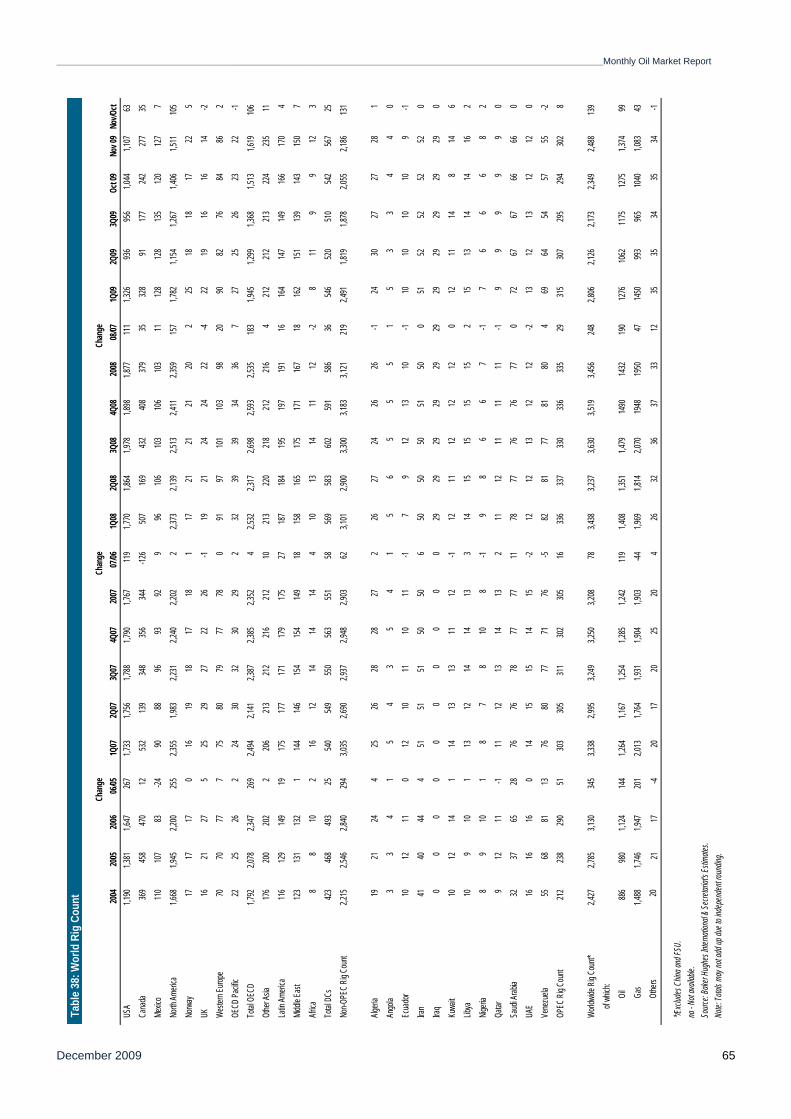
_________________________________________________________________________________________________________________________________________Monthly Oil Market Report
December 2009 65
Chan
geCh
ange
Chan
ge20
0420
0520
0606
/051Q
072Q
073Q
074Q
0720
0707
/061Q
082Q
083Q
084Q
0820
0808
/071Q
092Q
093Q
09 O
ct 09
Nov 0
9No
v/Oct
USA
1,190
1,381
1,647
267
1,733
1,756
1,788
1,790
1,767
119
1,770
1,864
1,978
1,898
1,877
111
1,326
936
956
1,044
1,107
63Ca
nada
369
458
470
1253
213
934
835
634
4-12
650
716
943
240
837
935
328
9117
724
227
735
Mexic
o11
010
783
-2490
8896
9392
996
106
103
106
103
1112
812
813
512
012
77
North
Ameri
ca1,6
681,9
452,2
0025
52,3
551,9
832,2
312,2
402,2
022
2,373
2,139
2,513
2,411
2,359
157
1,782
1,154
1,267
1,406
1,511
105
Norw
ay17
1717
016
1918
1718
117
2121
2120
225
1818
1722
5UK
1621
275
2529
2722
26-1
1921
2424
22-4
2219
1616
14-2
Weste
rn Eu
rope
7070
777
7580
7977
780
9197
101
103
9820
9082
7684
862
OECD
Pacifi
c22
2526
224
3032
3029
232
3939
3436
727
2526
2322
-1To
tal O
ECD
1,792
2,078
2,347
269
2,494
2,141
2,387
2,385
2,352
42,5
322,3
172,6
982,5
932,5
3518
31,9
451,2
991,3
681,5
131,6
1910
6Ot
her A
sia17
620
020
22
206
213
212
216
212
1021
322
021
821
221
64
212
212
213
224
235
11La
tin Am
erica
116
129
149
1917
517
717
117
917
527
187
184
195
197
191
1616
414
714
916
617
04
Midd
le Ea
st12
313
113
21
144
146
154
154
149
1815
816
517
517
116
718
162
151
139
143
150
7Afr
ica8
810
216
1214
1414
410
1314
1112
-28
119
912
3To
tal DC
s42
346
849
325
540
549
550
563
551
5856
958
360
259
158
636
546
520
510
542
567
25No
n-OPE
C Rig
Coun
t2,2
152,5
462,8
4029
43,0
352,6
902,9
372,9
482,9
0362
3,101
2,900
3,300
3,183
3,121
219
2,491
1,819
1,878
2,055
2,186
131
Algeri
a19
2124
425
2628
2827
226
2724
2626
-124
3027
2728
1An
gola
33
41
54
35
41
56
55
51
53
34
40
Ecua
dor
1012
110
1210
1110
11-1
79
1213
10-1
1010
1010
9-1
Iran
4140
444
5151
5150
506
5050
5051
500
5152
5252
520
Iraq
00
00
00
00
00
2929
2929
2929
2929
2929
290
Kuwa
it10
1214
114
1313
1112
-112
1112
1212
012
1114
814
6Lib
ya10
910
113
1214
1413
314
1515
1515
215
1314
1416
2Nig
eria
89
101
87
810
8-1
98
66
7-1
76
66
82
Qatar
912
11-1
1112
1314
132
1112
1111
11-1
99
99
90
Saud
i Arab
ia32
3765
2876
7678
7777
1178
7776
7677
072
6767
6666
0UA
E16
1616
014
1515
1415
-212
1213
1212
-213
1213
1212
0Ve
nezu
ela55
6881
1376
8077
7176
-582
8177
8180
469
6454
5755
-2OP
EC Ri
g Cou
nt21
223
829
051
303
305
311
302
305
1633
633
733
033
633
529
315
307
295
294
302
8
World
wide R
ig Co
unt*
2,427
2,785
3,130
345
3,338
2,995
3,249
3,250
3,208
783,4
383,2
373,6
303,5
193,4
5624
82,8
062,1
262,1
732,3
492,4
8813
9
of wh
ich:
Oil
886
980
1,124
144
1,264
1,167
1,254
1,285
1,242
119
1,408
1,351
1,479
1490
1432
190
1276
1062
1175
1275
1,374
99
G
as1,4
881,7
461,9
4720
12,0
131,7
641,9
311,9
041,9
03-44
1,969
1,814
2,070
1948
1950
4714
5099
396
510
401,0
8343
Othe
rs
2021
17-4
2017
2025
204
2632
3637
3312
3535
3435
34-1
*/Exc
ludes
Chin
a and
FSU.
na - N
ot av
ailab
le.So
urce:
Bake
r Hug
hes I
nterna
tiona
l & Se
cretar
iat's E
stima
tes.
Note:
Total
s may
not a
dd up
due t
o ind
epen
dent
round
ing.
Tabl
e 38
: Wor
ld R
ig C
ount
Monthly Oil Market Report_________________________________________________________________________________________________________________________________________
December 2009 66
Contributors to the OPEC Monthly Oil Market Report
Editor-in-Chief Hasan M. Qabazard, Director, Research Division email: [email protected] Editor Mohammad Alipour-Jeddi, Head, Petroleum Studies Department email: [email protected] Analysts Crude Oil Price Movements
Safar Keramati email: [email protected]
Commodity Markets Dr. O. López-Gonzalez e-mail:[email protected]
Highlights of the World Economy Mohamed El-Shahati email: [email protected]
Claude Clemenz email: [email protected]
Joerg Spitzy email: [email protected]
World Oil Demand Esam Al-Khalifa email: [email protected]
World Oil Supply Haidar Khadadeh email: [email protected]
Product Markets and Refinery Operations
Safar Keramati email: [email protected]
The Tanker Market and Oil Trade Osam Abdul-Aziz email: [email protected]
Stock Movements Brahim Aklil email: [email protected]
Technical and editorial team Aziz Yahyai email: [email protected] Douglas Linton email: [email protected]
Data services Fuad Al-Zayer, Head Data Services Department ([email protected]) Puguh Irawan ([email protected]), Ramadan Janan ([email protected]) Monika Psenner (World Economy), Hannes Windholz (Oil Trade, Product & Refinery), Pantelis Christodoulides (World Oil Demand, Stock Movements), Mouhamad Moudassir (Tanker Market), Klaus Stoeger (World Oil Supply), Sheela Kriz (Crude Oil Prices) Production, design and circulation Viveca Hameder, Jennett Paulich, Hataichanok Leimlehner, Andrea Birnbach, Gabriele Berger, Evelyn Oduro-Kwateng Unless separately credited, material may be reproduced without permission, but kindly mention OPEC as source.

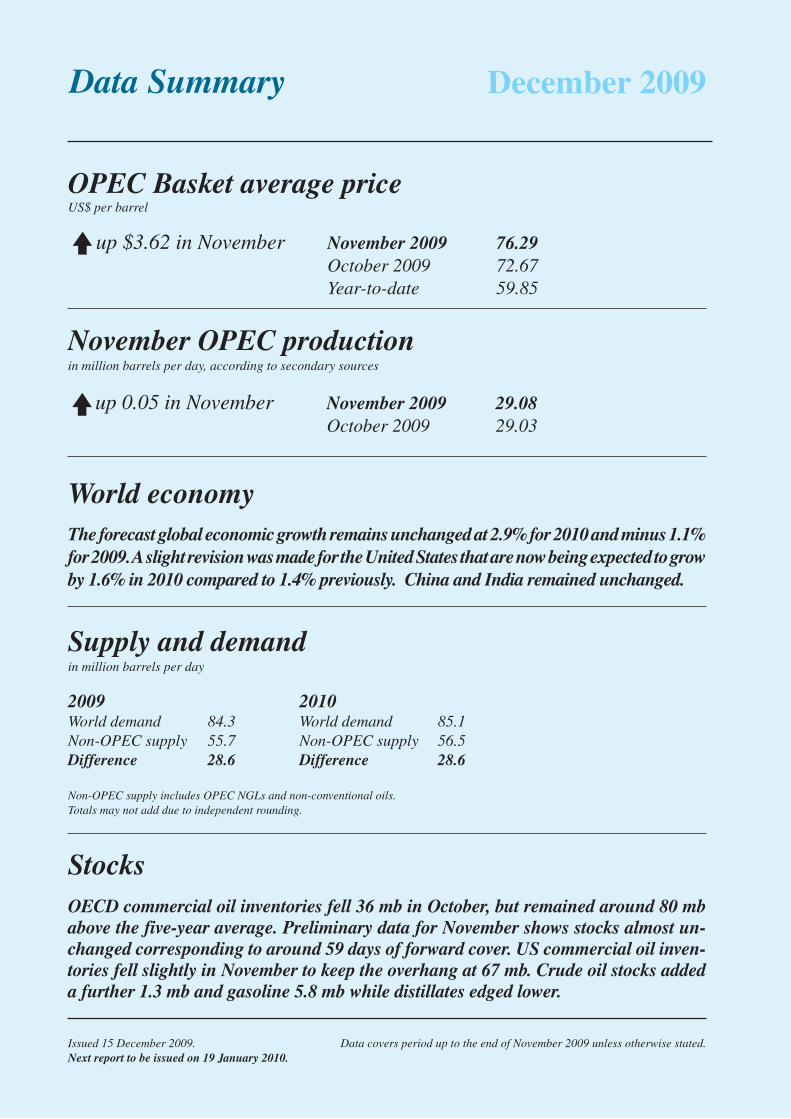
December 2009
OPEC Basket average priceUS$ per barrel
up $3.62 in November November 2009 76.29 October 2009 72.67 Year-to-date 59.85
up 0.05 in November November 2009 29.08 October 2009 29.03
November OPEC productionin million barrels per day, according to secondary sources
Supply and demandin million barrels per day
2009 2010World demand 84.3 World demand 85.1Non-OPEC supply 55.7 Non-OPEC supply 56.5Difference 28.6 Difference 28.6
Non-OPEC supply includes OPEC NGLs and non-conventional oils.Totals may not add due to independent rounding.
StocksOECD commercial oil inventories fell 36 mb in October, but remained around 80 mb above the five-year average. Preliminary data for November shows stocks almost un-changed corresponding to around 59 days of forward cover. US commercial oil inven-tories fell slightly in November to keep the overhang at 67 mb. Crude oil stocks added a further 1.3 mb and gasoline 5.8 mb while distillates edged lower.
World economyThe forecast global economic growth remains unchanged at 2.9% for 2010 and minus 1.1% for 2009. A slight revision was made for the United States that are now being expected to grow by 1.6% in 2010 compared to 1.4% previously. China and India remained unchanged.
Issued 15 December 2009. Data covers period up to the end of November 2009 unless otherwise stated.Next report to be issued on 19 January 2010.
OPECOrganization of the Petroleum Exporting Countries
Monthly Oil Market Report
Obere Donaustrasse 93, A-1020 Vienna, AustriaTel +43 1 21112 Fax +43 1 2164320 E-mail: [email protected] Web site: www.opec.org
Data Summary