Embed Size (px)
Citation preview

This is a photographic template – your
photograph should fit precisely within this rectangle.
HD Diesel Supercharger
© 2011 Eaton Corporation. All rights reserved.
HD Diesel SuperchargerDownspeeding with Performance
Philip Wetzel
Eaton Corporation, Supercharger Division
September 28, 2011

Agenda
• Market Drivers for Downspeeding
• HD Diesel Supercharger Overview
• Application Specific Approaches
• Supercharged Demonstrator Vehicle
2© 2011 Eaton Corporation. All rights reserved.
• Supercharged Demonstrator Vehicle
• Hardware
• Test Results
• Future Development Effort
Business OpportunityMarket Drivers
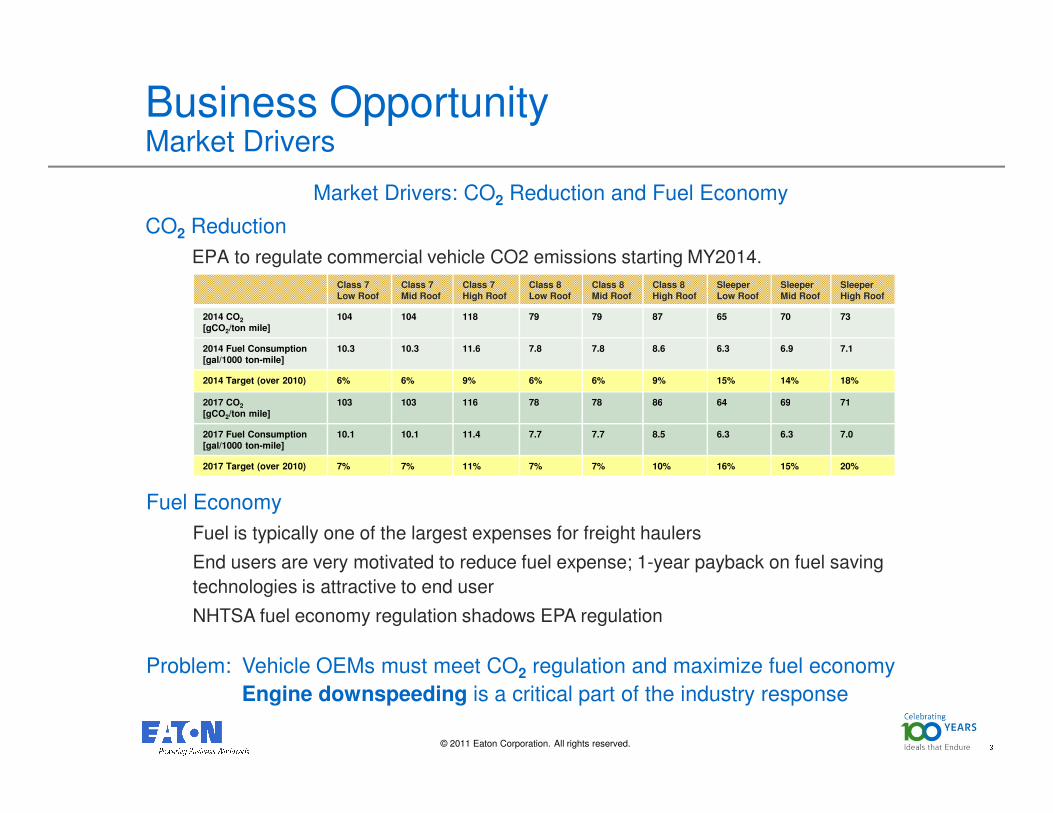
Market Drivers: CO2 Reduction and Fuel Economy
CO2 Reduction
EPA to regulate commercial vehicle CO2 emissions starting MY2014.
Class 7
Low Roof
Class 7
Mid Roof
Class 7
High Roof
Class 8
Low Roof
Class 8
Mid Roof
Class 8
High Roof
Sleeper
Low Roof
Sleeper
Mid Roof
Sleeper
High Roof
2014 CO2
[gCO2/ton mile]
104 104 118 79 79 87 65 70 73
2014 Fuel Consumption
[gal/1000 ton-mile]
10.3 10.3 11.6 7.8 7.8 8.6 6.3 6.9 7.1
2014 Target (over 2010) 6% 6% 9% 6% 6% 9% 15% 14% 18%
2017 CO2 103 103 116 78 78 86 64 69 71
3© 2011 Eaton Corporation. All rights reserved.
Fuel Economy
Fuel is typically one of the largest expenses for freight haulers
End users are very motivated to reduce fuel expense; 1-year payback on fuel saving
technologies is attractive to end user
NHTSA fuel economy regulation shadows EPA regulation
Problem: Vehicle OEMs must meet CO2 regulation and maximize fuel economy
Engine downspeeding is a critical part of the industry response
2017 CO2
[gCO2/ton mile]
103 103 116 78 78 86 64 69 71
2017 Fuel Consumption
[gal/1000 ton-mile]
10.1 10.1 11.4 7.7 7.7 8.5 6.3 6.3 7.0
2017 Target (over 2010) 7% 7% 11% 7% 7% 10% 16% 15% 20%

HD Diesel SuperchargerSystem Description
Engine Downspeeding with Super-Turbo (or Turbo-Super) Boosting System
Downspeeding reduces CO2 and saves fuel
Supercharger enables better downspeeding
• Instantaneous boost during low-rpm and transient events improves performance and enables more downspeeding
• Allows turbo to be optimized for steady-state cruise efficiency
Supercharger Bypass Valve
4© 2011 Eaton Corporation. All rights reserved.
Supercharger Bypass Valve
• Manages SC boost
• Controlled by ECU
Supercharger Clutch
• Couples SC to crankshaft
• Controlled by ECU
• May be unnecessary in some applications
Supercharger
• Provides boost when turbo lags
• Allows turbo to boost at
steady-state for peak efficiency
Supercharged Kenworth T800
Demonstration Vehicle
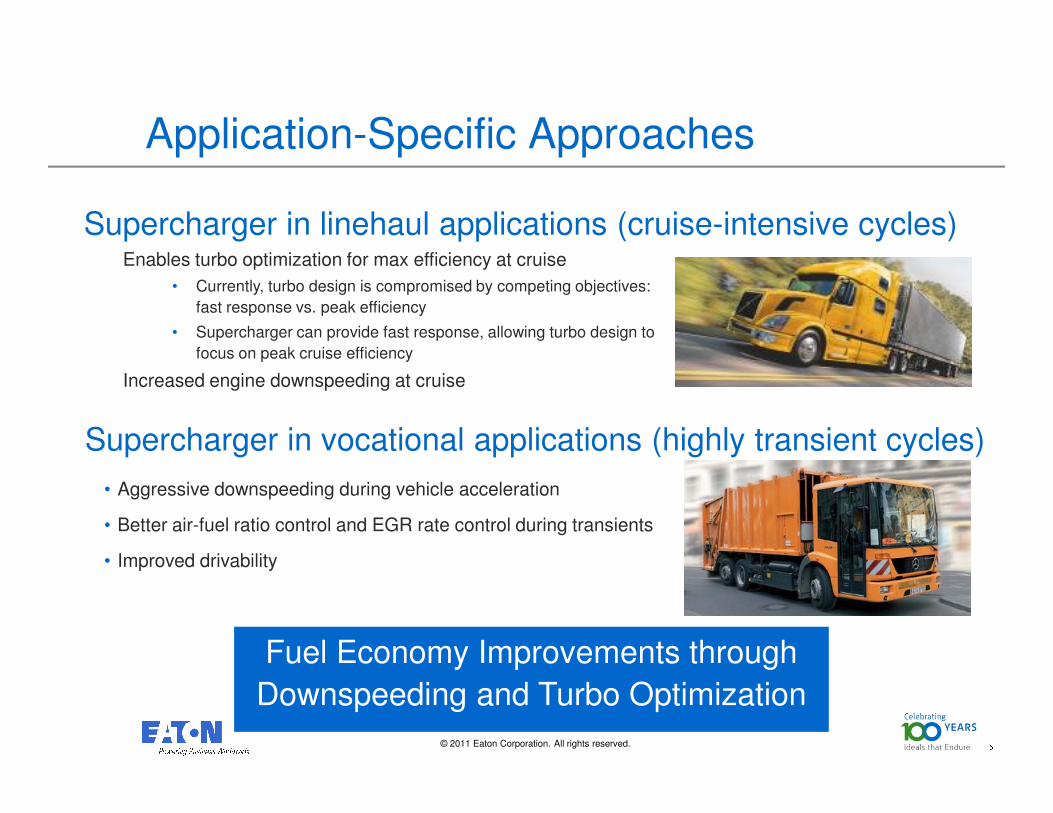
Application-Specific Approaches
Enables turbo optimization for max efficiency at cruise
• Currently, turbo design is compromised by competing objectives:
fast response vs. peak efficiency
• Supercharger can provide fast response, allowing turbo design to
focus on peak cruise efficiency
Increased engine downspeeding at cruise
Supercharger in linehaul applications (cruise-intensive cycles)
5© 2011 Eaton Corporation. All rights reserved.
• Aggressive downspeeding during vehicle acceleration
• Better air-fuel ratio control and EGR rate control during transients
• Improved drivability
Fuel Economy Improvements through
Downspeeding and Turbo Optimization
Supercharger in vocational applications (highly transient cycles)

Supercharged Diesel DemonstratorEngine Downspeeding with Performance
Objective
Demonstrate engine downspeeding with good performance
• Supercharger’s instantaneous boost compensates for turbo lag
• Downspeeding is achieved while meeting customers’ expectations for pedal response
Kenworth T800 Demonstration Vehicle
Demonstration Vehicle Hardware
6© 2011 Eaton Corporation. All rights reserved.
Eaton TVS® Supercharger
• High efficiency
• High pressure ratio
• Paccar MX-455 engine
• Eaton UltraShift PLUS VCS
• Dana D46 4.30:1
• Test GVW 57,000 lb
• GVWR 64,000 lb
• GCWR 80,000 lb

Supercharged Diesel DemonstratorPrototype Installation
• Super-Turbo architecture
• SC bypass valve manages boost
• SC clutch manages drive system
• Recalibrated transmission provides
downspeeding
7© 2011 Eaton Corporation. All rights reserved.

Downspeeding with PerformancePreliminary Data – Boost Response
High-Load Step Response: 9th gear, 1000 rpm
Faster boost response
Faster turbo spool-up
Acceleration event: 2nd gear
(Negative slope caused by sub-
optimal SC boost control algorithm)
8© 2011 Eaton Corporation. All rights reserved.

Downspeeding with Performance350 RPM Downspeeding Event
Test data from T800
0-35 mph acceleration
8 repetitions of each case at
Marshall track
350 rpm downspeeding
results:800
1000
1200
1400
1600
1800
2000
2200Engine Speed (RPM)
Engin
e S
peed (
RP
M)
800
1000
1200
1400
1600
1800Avg Engine Speed
Avg E
ngin
e S
peed (
RP
M)
Downsped, Super-Turbo PR 2.5
Baseline, Turbo Only
Downsped, Super-Turbo PR 2.5
Baseline, Turbo Only
350 rpm downspeeding
9© 2011 Eaton Corporation. All rights reserved.
results:
Faster acceleration:
4% improvement
Better fuel economy:
12% increase in MPG
0 5 10 15 20 25 30600
time (sec)
0 5 10 15 20 25 30
600
time (sec)
0 5 10 15 20 25 300
5
10
15
20
25
30
35Vehicle Speed
time (sec)
Vehic
le S
peed (
mph)
0 5 10 15 20 25 300
0.2
0.4
0.6
0.8
1
1.2
1.4
1.6
1.8
time (sec)
Avg F
uel E
conom
y (
MP
G)
Avg Fuel Economy (MPG)
Downsped, Super-Turbo PR 2.5
Baseline, Turbo Only
Downsped, Super-Turbo PR 2.5
Baseline, Turbo Only
J1939 Fuel Flow Data

Downspeeding with Performance450 RPM Downspeeding Event
450 rpm downspeeding
Test data from T800
0-35 mph acceleration
2 repetitions of each case at
Marshall track
450 rpm downspeeding
results:
10© 2011 Eaton Corporation. All rights reserved.
results:
Faster acceleration:
2.5% improvement
Better fuel economy:
21% increase in MPG
J1939 Fuel Flow Data

Downspeeding with PerformanceLinehaul Application
Downspeeding
Eaton J1939 test data @ constant 45 mph:
5
10
15
20
25
30
35
40
45
Fu
el
Rate
(L
/h)
T700 Tractor Trailer - Fuel Rate Comparison
8th Gear (45 mph)
8th Gear (45 mph)
9th Gear (45 mph)
9th Gear (45 mph)
Gear RPM MPG MPG Improvement
KW T800
Dump*
9th 1602 8.49 -- --
10th 1193 9.90 16.6% 4% / 100rpm
KW T700
Tractor-
Trailer
8th 1744 8.54 -- --
9th 1267 9.87 15.7% 3.3% / 100rpm
11© 2011 Eaton Corporation. All rights reserved.
0 50 100 150 200 250 300 350 4000
5
Time (sec)
Eaton has data to support part of the linehaul value story
Turbo optimization
Eaton / FEV simulations show 1-2% MPG improvement by changing VGT to FGT
Industry experts suggest additional 1-2% MPG from new FGT optimized for this application
Eaton GT Power simulations indicate approx. 2.4% / 100rpm at highway cruise conditions
* Supercharger clutch disengaged

Downspeeding with Performance
The Super-Turbo system in this vehicle is not optimized – better results are possible
Turbo-Super is probably a better architecture
• Allows a smaller supercharger to be used (less power consumption)
• Enables mid-loop EGR (potential to reduce pumping loss)
Turbocharger should be redesigned for peak device efficiency and BSFC
Supercharger control algorithms should be improved for peak fuel economy and better
“handoff” to turbo
12© 2011 Eaton Corporation. All rights reserved.
Future Plans –
Controls tuning and track testing
Confirm the value story with engine dyno data:
Fuel economy and CO2
Performance
Emissions
Turbo-Super System
Architecture Example

13© 2011 Eaton Corporation. All rights reserved.