Embed Size (px)
Citation preview
- 1 -
HCL TECHNOLOGIES THIRD QUARTER - FY 2018 RESULTS7
INVESTOR RELEASE
Noida, India, Jan 19th, 2018
Q3 FY’18 RESULTS
Revenue at ` 12,808 crores; up 3.0% QoQ & 8.4% YoY Net Income at ` 2,194 crores; up 0.3% QoQ & 6.0% YoY
Revenue at US$ 1,988 mn; up 3.1% QoQ & 13.9% YoY Revenue in Constant Currency up 3.3% QoQ & 11.2% YoY Net Income at US$ 340 mn; up 0.3% QoQ & 11.2% YoY
TABLE OF CONTENTS
Financial Highlights 2
Corporate Overview 3
Performance Highlights 4
Financials in US$ 14
Revenue Analysis at Company Level 17
Constant Currency Reporting 18
Client Metrics 19
Headcount & Utilization 20
Facilities 20
Cash and Cash Equivalents, Investments & Borrowings 20
Financials in ` 21

- 2 -
HIGHLIGHTS FOR THE QUARTER ENDED 31st DECEMBER, 2017
PARTICULARS Q3 FY’18 GROWTH
QoQ YoY
REVENUE 12,808 3.0% 8.4%
EARNINGS BEFORE INTEREST & TAX (EBIT) 2,510 2.4% 4.2%
NET INCOME 2,194 0.3% 6.0%
PARTICULARS Q3 FY’18 GROWTH
QoQ YoY
REVENUE 1,988 3.1% 13.9%
REVENUE GROWTH (CONSTANT CURRENCY) 3.3% 11.2%
EARNINGS BEFORE INTEREST & TAX (EBIT) 389 2.5% 9.4%
NET INCOME 340 0.3% 11.2%
Key Highlights
This quarter, Mode 2 & Mode 3 revenues exceeded 25% of total revenue.
Financial Services vertical delivered an industry leading growth of 2.8% QoQ in constant currency, driven by new logos and Mode 2 services.
Engineering and R&D Services, enabled by ‘GeometricPLM’ and IP partnerships, delivered 13.6% QoQ growth in constant currency.
Application Services posted robust growth of 2.6% QoQ in constant currency, driven by Mode 1 and Mode 2 services.
Announces dividend of ` 2 per share, 60th consecutive quarter of dividend payout.
Return on Equity at 27.3%, on last 12 months basis.
(Amount in US $ Million)
(Amount in ` Crores)

- 3 -
FY’18 Guidance
• Revenue: FY'18 Revenues are expected to grow between 10.5% to 12.5% in Constant Currency
* Revenue Guidance is based on FY’17 (April to March) average exchange rates.
The above constant currency guidance translates to 12.1% to 14.1% in USD terms based on December 31,
2017 rates.
• Operating Margin (EBIT): FY’18 expected Operating Margin (EBIT) range is from 19.5% to 20.5%.
* The Operating Margin guidance assumes USD-INR currency rate of $1 = Rs. 65.5 and other currencies at
FY’17 average exchange rates.

- 4 -
CORPORATE OVERVIEW
“As world leaders drive a shared vision for sustained and inclusive global development, HCL continues to deliver
lasting socio–economic value for its diverse stakeholders. We remain focused on promoting diversity, localizing
footprints and developing sustainable business models”, said Shiv Nadar, Chairman & Chief Strategy Officer, HCL Technologies Ltd.
“We finished last quarter on a strong note, with a growth of 3.3% sequentially and 11.2% year on year in constant
currency terms. Our Mode 1–2–3 strategy and success of our client partner program for top accounts, continued
to drive industry leading growth. Over 25% of our revenues this quarter came from Mode 2 and Mode 3 services,
which strongly validates the success of our next–gen offerings in the market. This was a strong quarter in terms of
deal signings where we signed twenty transformational deals across services”, said C. Vijayakumar, President & CEO, HCL Technologies Ltd.
“We had a strong quarter marked by 11.2% year on year industry leading revenue growth in constant currency
terms. The value addition we are delivering, backed by our investment strategy, is reflected in our EBITDA margin
which has increased to 23.1% this quarter. Our focused investment in Mode 2 and Mode 3 offerings is reflected in
our robust growth across mature geographies and key verticals like Financial services and Manufacturing. We have
posted healthy Return on Equity at 27.3% during last 12 months”, said Anil Chanana, CFO, HCL Technologies Ltd.

- 5 -
PERFORMANCE HIGHLIGHTS
Overall Company: Performance Trends (last five years for 12 months ended December)
5,0105,692 6,139
6,7467,617
DEC'13 DEC'14 DEC'15 DEC'16 DEC'17
88,332100,240 103,696 111,092 119,291
DEC'13 DEC'14 DEC'15 DEC'16 DEC'17
1,1041,373
1,2391,380
1,512
DEC'13 DEC'14 DEC'15 DEC'16 DEC'17
868
1,184 1,103 1,1981,366
DEC'13 DEC'14 DEC'15 DEC'16 DEC'17
53.7%
56.1% 56.4%
60.6% 60.7%
DEC'13 DEC'14 DEC'15 DEC'16 DEC'17
Revenues
In U
SD M
n
Headcount
Num
ber o
f Em
ploy
ees
Earnings Before Interest & Tax
In U
SD M
n
Net Income
In U
SD M
n
Managed Services & Fixed Price Projects
In %
Client Category
Num
ber o
f Clie
nts
DEC’13
100Mn Dollar+ 50Mn Dollar+ 40Mn Dollar+ 10Mn Dollar+ 5Mn Dollar+
DEC’14 DEC’15 DEC’16 DEC’17

- 6 -
KEY CATALYSTS FOR GROWTH Revenue Growth (Last 12 months ended December’17) in Constant Currency
• Revenue grew by 14.1%. • Broad based growth across all revenue segments:
− Americas, Europe and RoW grew by 15.6%, 11.1% and 13.4% respectively − Driven by Engineering and R&D Services at 37.7%, Infrastructure Services at 11.5% and Application
Services at 7.3%. − Vertical growth led by Manufacturing at 23.1%, Financial Services at 16.8%, Retail & CPG at 11.2%, Public
Services at 10.1%, and Lifesciences & Healthcare at 7.6%.
Revenue Growth (in Constant Currency)
PARTICLUARS SEGMENTS 31-December-17
QoQ YoY LTM YoY
Consolidated For the Company 3.3% 11.2% 14.1%
Geography
Americas 4.9% 16.6% 15.6%
Europe 1.9% 2.5% 11.1%
Rest of the World (RoW) -3.9% 2.5% 13.4%
Services
Application Services 1.6%* 4.4% 7.3%
Infrastructure Services -1.2% 1.6% 11.5%
Business Services 5.0% 1.2% -2.3%
Engineering and R&D Services 13.6% 47.7% 37.7%
Verticals
Financial Services 1.4%* 10.6% 16.8%
Manufacturing 6.6% 21.0% 23.1%
Lifesciences & Healthcare 2.4% 9.7% 7.6%
Public Services# 0.2% 1.0% 10.1%
Retail & CPG 6.6% 13.1% 11.2%
Telecommunications, Media, Publishing & Entertainment -3.8% -6.8% -4.0%
Note:
* Outside of IP partnership with DXC, Application services and Financial services revenue has grown by 2.6 % and 2.8% respectively on QoQ Constant currency basis.
# Public Services include Oil & Gas, Energy & Utilities, Travel - Transport - Logistics and Government.

- 7 -
TRANSFORMATIONAL AND BLUE CHIP CUSTOMER ACQUISITION HCL signed twenty transformational deals this quarter across Mode 1–2–3 services, with several of them representing next–generation offerings of Autonomics & A.I, Digital & Analytics, Internet of Things, Cloud Native Services, CyberSecurity & GRC, Products and Platforms.
CORPORATE EXCELLENCE HCL continues to create sustained positive impact on the socio–economic ecosystem, driving unmatched business value for all its stakeholders.
• HCL’s Red Ladder Initiative was recognized as the finalist at the 14th Annual Stevie Awards for Women in Business in the category – ‘Women Helping Women’. The ‘Red Ladder’ initiative helps women at the workplace, identifying high performing leaders and supporting them towards effective leadership roles.
• HCL Foundation, the CSR arm of HCL Technologies, continues to create sustained social impact through its flagship programs – HCL Grant, HCL Samuday, Power of One and Urban Community Development. This quarter:
− Hon’ble Chief Minister of Uttar Pradesh Shri Yogi Adityanath unveiled ‘Samuday’, HCL Foundation’s biggest CSR project to create model villages in Uttar Pradesh. Since its commencement in 2015, Project Samuday has impacted around six lac lives in 90,000 households across 720 villages in the fields of education, agriculture, livelihood, health, infrastructure, water and sanitation.
− Urban Community Development: HCL Foundation continues to reach out to the urban poor, migratory and displaced communities through various initiatives in the areas of education, health, environment and livelihood. Currently, the Foundation is working in 11 cities across India with various initiatives such as early childcare, reading & writing skills, health camps, community healthcare programs, sanitation, relief, rehabilitation and restoration programs. The Foundation benefited more than 100,000 people in calendar year 2017: 54,108 people through education; 37,356 through healthcare, 2250 through livelihood programs, and 12,817 people through humanitarian relief and rehabilitation programs.
• HCL Foundation continued to impact lives globally. In South Africa, HCL is working with The Nelson Mandela Foundation for creating e–libraries for disadvantaged students as well as the University of Johannesburg for developing their IT facilities and computer lab. In the US, HCL is engaged with the United Ways of America, for ‘Youth Success Program’ to empower and enable youth. In UK, HCL continues to impact lives through ‘Get Started with Technology’ program, in partnership with the ‘Prince’s Trust’.
• Key Events and activities conducted by HCL Foundation this quarter:
− First National Sports Meet, ‘Sports for Change’ in Noida where 350 participants competed in the finals and scholarships were awarded to winners under ‘My Scholar’ program.
− Mega plantation drive in Noida, which aims to plant over 10,000 saplings by the end current financial year, making cities greener and healthier.
− ‘Young Kalam Science Fest’ in Madurai, Chennai and Bangalore, where the best scientific models across health, environment, energy and innovation were selected and awarded by HCL Foundation.
− HCL Foundation provided support for rebuilding and renovation of houses in Chennai and dedicated 100 completed houses to the villagers of Irula Tribes in Chennai.
− As part of disaster relief and restoration, HCL Foundation supported the infrastructure and electrification of Chennai campuses of Blue Cross of India and held the dedication ceremony for the same.

- 8 -
• HCL was conferred with ‘The key to the Heart of Gothenburg’ award by Business Region Göteborg, Sweden, for being one of the most important international businesses established in 2016/2017 and undertaking significant investments, including launch of new delivery centre and acquisition of Volvo’s external IT business.
• The IT Services Marketing Association (ITSMA) felicitated HCL among 2017 Marketing Excellence Awards Winners for:
− ‘Best-in-class’ in ‘Transforming Marketing for Digital Leadership’ by creating an agile, data–driven marketing organization through frugal digital transformation.
− Executing a 360–degree integrated campaign for ‘Driving business with Thought Leadership’ by leveraging HCL’s first global survey on IoT Adopters and a thought paper with MIT Sloan Management Review.
• At the Kapost Customer Awards 2017, which recognize ‘The Best of the Best in B2B Content Operations’, HCL was awarded the ‘Biggest Transformation of 2017’ for automating the content and digital marketing operations across the business.
MARKET LEADERSHIP MODE 1: CORE SERVICES
As part of Mode 1 services, HCL delivers core services in areas of Applications, Infrastructure, Engineering & R&D and Business Services, leveraging DRYiCETM Autonomics to transform clients' business and IT landscape, making them 'lean' and 'agile'. Applications, Infrastructure and Business Services
• This quarter, the 2017–18 edition of Volvo Ocean Race was flagged off at Alicante, Spain with HCL as the strategic IT services provider. HCL is providing end–to–end infrastructure support as well as connectivity between the Race Village and the Command Centre in Alicante, further connecting them to 12 Host Cities on the race route globally.
• A leading US–based global life sciences provider of innovative haematology products and solutions chose HCL as its ‘IT Partner of Choice’ for delivering integrated applications, infrastructure and BPO services across all its enterprise functions, through an integrated services delivery model. Leveraging DRYiCETM Autonomics and Orchestration platform, HCL will deliver agility, flexibility and business efficiencies for the client.
• HCL renewed its engagement by entering into a comprehensive five–year MSA with an Australia–based Global 2000 banking organization for end–to–end applications outsourcing services as part of its vendor consolidation exercise. The enhanced scope encompasses user experience and new ways of working, including distributed agile, as well as expansion of current ODCs in India to a global delivery centre (GDC).
• HCL entered into a multi–year applications transformation engagement with a leading US–based insurance company. The scope encompasses environmental support, applications testing and automation services, aligning HCL’s delivery model to the agile methodology adopted by the customer.
• A leading Global 2000 Europe–based provider of workforce solutions, staffing and talent development services engaged HCL as its strategic global partner for delivering data centre and cloud services over the next five years. HCL will drive standardization and modernization of IT infrastructure and leverage DRYiCE™ platform to drive automation–led benefits. The infrastructure utility model, involving public cloud environment and HCL data centres, will drive efficiencies through a hybrid cloud solution.
• HCL renewed its applications transformation, applications development and maintenance agreement with an American Fortune 500 diversified media and entertainment conglomerate. The key success factors were ongoing efficiencies delivered by HCL as a trusted partner, leveraging DRYiCETM Autonomics platform and utility–based commercial models for driving business outcomes.

- 9 -
• HCL won a deal with an international pharmaceutical company headquartered in Europe to provide 24x7 service desk support from Poland delivery center in multiple languages as well as workplace & onsite end–user support services, data center operations, applications operations and cross functional services.
• A Fortune 500 American telecommunications and media corporation extended its SAP applications transformation engagement with HCL, testifying HCL’s strengths as a trusted partner and its ongoing commitment towards long–term business success of the client.
• HCL extended its engagement with a leading US–based Fortune 500 hi–tech manufacturing company to provide managed services for infrastructure support. HCL will provide automation–led solutions leveraging DRYiCETM platform, providing further optimization and business value.
• A leading US–based insurance and investment management company renewed its partnership with HCL to provide solutions in the areas of mobility, digital channels, advanced analytics, user experience, business operations support and management of business–critical systems, including corporate and investment management systems for driving business efficiencies.
• HCL was chosen by a Fortune 500 global media, news and entertainment corporation for independent quality assurance operations, including automation, high performance testing, multi–channel and cloud–based testing, for driving efficiencies and quicker time–to–market.
• A leading US–based CRO provider renewed its engagement with HCL for delivering service desk, end–user computing, security, network & datacenter services, with an aim to standardize and modernize IT infrastructure. Leveraging DRYiCE™ platform, HCL will drive automation–led benefits and shift towards an infrastructure utility model.
Engineering and R&D Services
• HCL expanded its engagement with a leading US–based Fortune 500 medical technology major for providing sustenance engineering, product engineering, product development and support. HCL will also help the client meet its regulatory requirements, leveraging HCL’s medical regulatory expertise and in–house medical quality management system.
• HCL has been engaged by a global diversified industrial technology major in Japan for the development and implementation of common scalable modular architecture for residential, packaged and commercial air–conditioner systems, driving business innovation in these areas.
• ‘GeometricPLM’ by HCL continues to drive product innovation and business goals for clients:
− A Global 2000 automobile major chose HCL to move towards next–generation PLM, realizing overall increase in R&D throughput and driving innovation in its various divisions.
− A leading global shipbuilding corporation engaged HCL to implement PLM for its heavy engine business, towards driving engineering innovation into supply chain and manufacturing.
− A European Global 2000 automotive major extended its engagement with HCL for PLM and R&D application development, in a global delivery model based on agile software lifecycle methodology.

- 10 -
MODE 2: NEXT–GENERATION SERVICES
As part of Mode 2 services, HCL delivers experience–centric and outcome–oriented integrated offerings across Digital & Analytics, IoT WoRKS™, Cloud Native Services and Cybersecurity & GRC services. Digital and Analytics
• HCL renewed and expanded its digital transformation, automation and modernization engagement with a leading US–based railroad company, for driving customer experience, service and revenue modernization programs of the company. The deal leverages key tenets of design thinking, agile, devops, quality engineering, robotic process automation, mobile and cloud to drive digital transformation.
• A US–based Fortune 500 electronics, IT hardware and storage major expanded its transformation engagement with HCL as digital marketing partner across the business. As part of the extension, HCL will transform digital commerce applications by building a reusable, component–based digital engagement platform, hosting multiple brand sites, integrating commerce applications and driving user experience.
• HCL has partnered with a leading Global 2000 pharmaceuticals and healthcare company headquartered in Japan for the deployment of HCL’s Enterprise Intelligence Hub. The system will help in aggregating & harmonizing quality data from disparate systems across global manufacturing sites for continuous improvement, external FDA reporting, efficient data measurement and data analytics.
• HCL has signed a deal with a European Global 2000 automotive major for building data lake solution, as an integral component of the cloud–based data lake & integrated data warehouse of the client, driving business insights and innovation.
• HCL has been selected as a strategic partner by a leading global bio–pharmaceutical company on its digital and analytics journey. HCL will be implementing a data governance process for big data lake, developing an operating model for the common global information management platform and enabling data analysis and insights for business decisions.
• HCL has been chosen by a US–based telecommunications services provider to co–create a 21st century enterprise by transforming next–generation mobile virtual network operator (MVNO) applications, based on modern application development frameworks.
• HCL has been chosen by a Fortune 500 telecommunications company for driving real–time network analytics, leveraging HCL’s big data framework for ensuring high predictability and quality of telecom network services to enhance end–user experience.
IoT WoRKSTM
• HCL has been chosen by a leading US–based provider of supply chain communications solutions as a consulting partner for enhancing business operations with IoT and transforming digitally. As part of the consulting engagement, IoT WoRKSTM will define IoT roadmap for the client, enabling new age technologies for select business use cases. IoT WoRKSTM will also drive efficiencies through inventory management, improvements in inventory visibility and minimization of slow moving inventory.
• IoT WoRKSTM has been chosen by a leading Global 2000 pharmaceuticals and healthcare company headquartered in Japan for developing smartphone–based passive sensing platform. The platform will create predictive models by integrating various wearables with the data platform to understand patients’ responses digitally and drive patient experience through enhanced therapies and behavioural interventions.
• A Fortune 500 medical devices company has engaged IoT WoRKSTM for cloud–based IoT solutions for diabetes products. The solution will connect to a range of medical devices, pulling data to generate advanced analytics, providing visibility into diabetic patients and suggesting measures for improving patient outcomes.
• IoT WoRKSTM and Indra have entered into a partnership to deliver Indra’s ‘Active Grid Management’ (AGM) solution to North American utilities. The solution is designed for utilities that are responding to significant and rapid changes in the way electricity is being generated. It consists of software and edge device components and is built on top of a powerful IoT platform (iSPEED) that supports M2M technology, data filtering, big data

- 11 -
management, and power analytics. HCL IoT WoRKS is the first to offer Indra’s AGM solution to the North American utilities market.
Cloud Native Services
• A leading UK–based gas distribution utility selected HCL for ‘All In’ public cloud solutions, wherein HCL will help migrate, modernize and manage the entire IT landscape, driving agility & flexibility.
• HCL has been engaged by a Global 2000 airline for strategic IT planning and execution of cloud first objectives, with an aim to bring about flexibility, agility and elastic cost structure.
• A leading Europe–based provider of housing and support services chose HCL for planning, design, implementation and integration of enterprise cloud solutions, together with support and maintenance post systems implementation to drive business efficiencies.
• A US–based global financial organization chose HCL for an Oracle ERP cloud services engagement, involving the design and rollout of cloud–based accounting and management solutions across five lines of business, to enhance revenue collection visibility, minimize revenue leakage and drive automation–led efficiencies.
• A US–based telecom services provider chose HCL for strategic IT planning and migration into a multi–cloud environment, in order to enhance application performance consistency and drive higher availability of services.
• HCL has partnered with a US–based Fortune 500 global pharmaceuticals and healthcare company to migrate its commercial (sales & marketing) data warehouse to AWS Redshift, enabling data replication, downstream remediation and connectivity from the dependent BI tools to the new AWS source.
Cyber–Security & GRC
• A leading US–based healthcare provider chose HCL as its strategic partner for delivering network and security services, standardizing & modernizing the network. Leveraging DRYiCE™ platform, HCL will drive automation–led benefits, and the shift towards a software defined network to deliver efficiencies.
• A leading US–based global life sciences provider of innovative haematology products and solutions selected HCL to enhance its security posture by efficiently managing its security infrastructure. HCL will leverage its mature security operations methodology and extensive experience to deliver the services from its Cybersecurity Fusion Centres.
• A Fortune 500 US–based diversified financial services and insurance group selected HCL for risk and compliance process automation. Through this implementation, the company would benefit from a common foundation for managing policies, controls and risk assessments across the company.

- 12 -
MODE 3: PRODUCTS & PLATFORMS
HCL continues to invest in internal IP creation as well as enter into innovative IP partnerships.
• This quarter, HCL added an IP partnership with a leading global technology major. The partnership includes areas of remote management and provisioning software, accelerating innovation and extending these solutions to hybrid cloud.
• HCL also expanded its existing IP partnership in the areas of software solutions for application release automation & governance, endpoint lifecycle management and forms development applications for web and mobile. These solutions align well with HCL’s strategy of helping customers accelerate application development processes and streamline IT operations.
• HCL entered into a large professional services engagement with a top global technology major for providing digital experience, customer insight, collaboration, omni–channel order management & fulfillment, supply chain, continuous engineering and asset management solutions.
• This quarter, HCL filed patents in various next–generation technologies such as automation, data analytics, Blockchain applications, predictive analytics and aircraft data systems, among others.
• HCL DRYiCETM Autonomics & Orchestration leverages the power of A.I to transform entire IT landscapes, business processes and application engineering processes, driving business outcomes and efficiencies.
− An American global investment management company chose DRYiCETM (Cognitive Orchestrated Process Autonomics) platform to transform back–office business processes, leveraging the power of A.I.
− DRYiCE™ launches XSM (XaaS Service Management) product, a cloud–native solution designed to manage the lifecycle of XaaS (everything–as–a–service) delivery models and aggregating multiple catalogues to provide a single unified interface.
− DRYiCETM SX (ServiceXchange), a XaaS marketplace automation & orchestration platform has reimagined the services management landscape at HCL, consolidating multiple services catalogues, optimizing the service desk, improving user experience and driving productivity through self–service.
− DRYiCETM SX & XSM together form the first XaaS service management system that is backward compatible with legacy ITIL–based ITSM systems.
AWARDS AND RECOGNITIONS • HCL positioned in the ‘Leadership Zone’ as part of ‘Zinnov Zones: Digital Services 2017’ in the overall ratings
as well as all nine service line categories. The Zinnov report highlights ‘HCL is one of the front runners in digital services market with solutions across the digital spectrum and strengths in digital Infrastructure, operations and security’.
• HCL has been recognized with the 2017 Partner Excellence Award for Digital Transformation Solutions & Services by TIBCO. As a result of the internet protocols, accelerators and frameworks developed by HCL, many global enterprises have benefited from a quicker, more stable, and wider adoption of TIBCO's digital platform solutions.
• HCL won the Denodo Award for ‘emerging winning partnerships’ across both US & EMEA regions and winning the Denodo License deal with a major banking organization.
• HCL positioned as Leader in ‘Everest Group PEAK MatrixTM for Application Modernisation Services Providers’, Nov 2017. The report highlights that ‘HCL has fairly balanced service portfolio across the modernisation landscape aided by its investments in IP to automate delivery’.

- 13 -
• HCL positioned as a Leader in ‘Everest Group IoT Services PEAK Matrix™ Assessment and Market Trends 2017’. The research presents an assessment and detailed profiles of 18 IoT service providers featured on the IoT services PEAK Matrix.
• Everest Group identified HCL a Leader in its report ‘Service Provider Landscape with PEAK Matrix™ Assessment 2018 for Digital Services in Consumer Banking’. In the study, HCL secured high scores for both ‘vision and capabilities’ as well as ‘market impact’.
• HCL positioned as leader in ‘Everest PEAK MatrixTM for Cloud Enablement Services’ Dec 2017. According to the report ‘HCL continues to focus on bolstering its well–established cloud services portfolio by investing in capabilities and thought leadership around next generation themes such as SDI, PaaS and multi cloud orchestration’.
• HCL positioned amongst leaders in 'Zinnov Zones 2017 - Product Engineering Services', an analysis of the Global Engineering R&D landscape, evolving customer preferences, and assessment of service providers in this space.
• HCL positioned as a Leader in ‘Everest PEAK MatrixTM for Software Product Engineering Services, Dec 2017’. As per the report, robust IP asset portfolio across the value chain, strong delivery footprint, differentiated capabilities in areas such as DevOps and microservices, and success with innovative engagement models have helped HCL emerge as a leader.
• HCL positioned as a Leader in ‘Everest Group PEAK MatrixTM for Automotive Engineering Services, Dec 2017’. The report highlights HCL’s dedicated investments in new technologies, development of capabilities across the value chain, key acquisitions to gain domain and functional expertise, and strong client retention.
• HCL positioned as leader in ‘Gartner Magic Quadrant for Managed Workplace Services, Europe*’, January 2018 authored by David Groombridge, Claudio Da Rold, Federica Troni and Nikos Drakos.
• HCL positioned as a leader in ‘The Forrester Wave™: Next-Generation Infrastructure Outsourcing, Q4 2017’ by Bill Martorelli. The report highlighted that ‘HCL has emerged as the single Indian pure-play company most associated with the infrastructure management opportunity’.
• HCL Business Services has been conferred with ‘NASSCOM Customer Excellence Awards 2017’ in ‘Return on Investment’ category for driving digital transformation for a leading UK–based banking organization. HCL showcased how it deployed the three lever BPM for digital transformation roadmap of the bank, enabling faster service delivery, greater visibility across teams and transparency of volumes and productivity.
* Gartner does not endorse any vendor, product or service depicted in its research publications, and does not advise technology users to select only those vendors with the highest ratings or other designation. Gartner research publications consist of the opinions of Gartner's research organization and should not be construed as statements of fact. Gartner disclaims all warranties, expressed or implied, with respect to this research, including any warranties of merchantability or fitness for a particular purpose.

- 14 -
FINANCIALS IN US$ FOR THE QUARTER ENDED 31st DECEMBER, 2017 (US GAAP)
CONSOLIDATED INCOME STATEMENT
INCOME STATEMENT QUARTER ENDED GROWTH
31-Dec-16 30-Sep-17 31-Dec-17 YoY QoQ
Revenues 1,745.3 1,928.0 1,987.5 13.9% 3.1% Direct Costs 1,153.6 1,272.6 1,305.4
Gross Profits 591.7 655.4 682.2 15.3% 4.1% SG & A 203.4 227.6 222.3
EBITDA 388.3 427.8 459.9 18.4% 7.5%
Depreciation & Amortisation 32.5 47.8 70.6
EBIT 355.8 380.0 389.3 9.4% 2.5%
Foreign Exchange Gains 6.4 22.3 20.0
Other Income, net 27.7 23.8 20.9
Provision for Tax 83.8 87.0 89.9
Net Income 306.0 339.2 340.3 11.2% 0.3% Gross Margin 33.9% 34.0% 34.3%
EBITDA Margin 22.3% 22.2% 23.1%
EBIT Margin 20.4% 19.7% 19.6%
Net Income Margin 17.5% 17.6% 17.1%
Earnings Per Share Annualized in `
Basic 58.7 62.8 63.0
Diluted 58.6 62.7 63.0
WEIGHTED AVERAGE NUMBER OF SHARES 31-Dec-16 30-Sep-17 31-Dec-17
Basic 1,411,067,882 1,394,280,991 1,392,070,357
Diluted 1,412,280,784 1,395,252,560 1,393,040,238
OUTSTANDING OPTIONS (in equivalent number of shares) 31-Dec-16 30-Sep-17 31-Dec-17
Options at less than market price 1,493,320 1,209,080 1,111,080
Out of outstanding options as on December 31st, 2017, 38,400 shares are yet to vest which will vest in tranches till 2018.
(Amount in US $ Million)

- 15 -
CONSOLIDATED BALANCE SHEET
PARTICULARS AS ON
31-Mar-17 31-Dec-17
Assets
Cash and Cash Equivalents 202.9 208.2
Accounts Receivables, net 1,279.5 1,463.1
Unbilled Receivables 385.5 362.9
Fixed Deposits 1,575.2 953.7
Investment Securities, available for sale 176.6 138.7
Other Current Assets 459.8 455.5
Total Current Assets 4,079.6 3,582.1
Property and Equipments, net 721.4 798.2
Intangible Assets, net 1,761.1 2,255.7
Investment Securities, available for sale - 9.1
Fixed Deposits - 31.3
Investments in Equity Investee 22.9 3.9
Other Assets 572.1 564.9
Total Assets 7,157.2 7,245.2
Liabilities & Stockholders Equity
Current Liabilities 1,718.3 1,533.4
Borrowings 83.5 79.9
Other Liabilities 193.1 194.1
Total Liabilities 1,994.8 1,807.4
Total Stockholders Equity 5,162.3 5,437.8
Total Liabilities and Stockholders Equity 7,157.2 7,245.2
(Amount in US $ Million)

- 16 -
CONSOLIDATED CASH FLOW STATEMENT
PARTICULARS FOR YEAR ENDED Mar-17
FOR QUARTER ENDED Dec-17
CASH FLOWS FROM OPERATING ACTIVITIES
Net Income 1,262.5 340.3
Adjustments to Reconcile Net Income to Net Cash provided by Operating Activities
Depreciation and Amortization 124.6 70.6
Others 16.9 (6.8)
Changes in Assets and Liabilities, net
Accounts Receivable (33.2) (49.9)
Other Assets 8.9 (6.2)
Current Liabilities 27.9 (97.6)
Net Cash provided by Operating Activities 1,407.6 250.4
CASH FLOWS FROM INVESTING ACTIVITIES
Purchase of Property & Equipment (197.1) (49.3)
Proceeds from sale of property and equipment (including advance) 16.8 0.3
Purchase of Licensed IPRs (387.2) (310.5)
(Purchase) / Sale of Investments (62.9) 285.4
Purchase of other Investments (1.8) -
Fixed Deposits (increase) / decrease 57.8 (116.2)
Investment in equity affiliate (3.1) (0.1)
Payments for business acquisitions, net of cash acquired (72.1) (0.5)
Net Cash used in Investing Activities (649.6) (191.0)
CASH FLOWS FROM FINANCING ACTIVITIES
Buy Back of Equity Shares - (0.3)
Payment for Deferred consideration on Business Acquisition (4.9) (2.5)
Dividend (607.3) (51.6)
Loans (56.9) (33.3)
Others 4.1 4.4
Net Cash used in Financing Activities (665.0) (83.3)
Effect of Exchange Rate on Cash and Cash Equivalents (0.2) 13.8
Net increase/(decrease) in Cash and Cash Equivalents 92.8 (10.2)
CASH AND CASH EQUIVALENTS
Beginning of the Period 110.1 218.4
End of the Period 202.9 208.2
(Amount in US $ Million)

- 17 -
REVENUE ANALYSIS AT COMPANY LEVEL (QUARTER ENDED)
GEOGRAPHIC MIX 31-Dec-16 30-Sep-17 31-Dec-17 LTM Mix
Americas 61.9% 62.4% 63.5% 62.8%
Europe 29.6% 29.1% 28.7% 28.2%
RoW 8.5% 8.5% 7.9% 8.9%
SERVICE MIX 31-Dec-16 30-Sep-17 31-Dec-17 LTM Mix
Application Services 37.5% 35.9% 35.3% 36.1%
Infrastructure Services 39.8% 38.5% 36.7% 38.1%
Business Services 4.0% 3.6% 3.7% 3.7%
Engineering and R&D Services 18.6% 22.0% 24.2% 22.1%
REVENUE BY VERTICAL 31-Dec-16 30-Sep-17 31-Dec-17 LTM Mix
Financial Services 24.3% 25.0% 24.6% 24.7%
Manufacturing 33.9% 35.4% 36.5% 35.4%
Lifesciences & Healthcare 12.0% 11.7% 11.7% 11.7%
Public Services 11.2% 10.6% 10.2% 10.9%
Retail & CPG 9.4% 9.3% 9.6% 9.4%
Telecommunications, Media, Publishing & Entertainment 8.9% 7.9% 7.4% 7.9%
Others 0.4% - - 0.1%
Note: Public Services include Oil & Gas, Energy & Utilities, Travel - Transport - Logistics and Government.
REVENUE BY CONTRACT TYPE 31-Dec-16 30-Sep-17 31-Dec-17 LTM Mix
Managed Services & Fixed Price Projects 63.2% 60.4% 60.8% 60.7%
Time & Material 36.8% 39.6% 39.2% 39.3%

- 18 -
CONSTANT CURRENCY REPORTING
REPORTED 31-Dec-16 31-Mar-17 30-Jun-17 30-Sep-17 31-Dec-17
Revenue ($ Mn) 1,745.3 1,816.8 1,884.2 1,928.0 1,987.5
Growth QoQ 1.3% 4.1% 3.7% 2.3% 3.1%
Growth YoY 11.4% 14.5% 11.4% 11.9% 13.9%
CONSTANT CURRENCY (QoQ) 31-Dec-16 31-Mar-17 30-Jun-17 30-Sep-17 31-Dec-17
Revenue ($ Mn) 1,773.8 1,810.8 1,864.0 1,902.0 1,991.7
Growth QoQ 3.0% 3.8% 2.6% 0.9% 3.3%
CONSTANT CURRENCY (YoY) 31-Dec-16 31-Mar-17 30-Jun-17 30-Sep-17 31-Dec-17
Revenue ($ Mn) 1,782.7 1,843.1 1,896.6 1,904.4 1,941.2
Growth YoY 13.8% 16.1% 12.2% 10.6% 11.2%
AVERAGE RATES FOR QUARTER 31-Dec-16 31-Mar-17 30-Jun-17 30-Sep-17 31-Dec-17
USD - INR 67.8 66.3 64.5 64.5 64.4
GBP - USD 1.23 1.24 1.29 1.31 1.33
EUR - USD 1.07 1.07 1.12 1.18 1.18
SEK - USD 0.11 0.11 0.12 0.12 0.12
AUD - USD 0.74 0.76 0.76 0.79 0.77
REVENUE GROWTH IN CONSTANT CURRENCY
PARTICLUARS SEGMENTS QUARTER ENDED (QoQ) LTM (YoY)
30-Sep-17 31-Dec-17 31-Dec-17
Consolidated For the Company 0.9% 3.3% 14.1%
Geography
Americas 1.5% 4.9% 15.6%
Europe 4.4% 1.9% 11.1%
RoW -12.0% -3.9% 13.4%
Services
Application Services 0.0% 1.6%* 7.3%
Infrastructure Services -0.2% -1.2% 11.5%
Business Services 2.9% 5.0% -2.3%
Engineering and R&D Services 4.4% 13.6% 37.7%
Verticals
Financial Services 1.2% 1.4%* 16.8%
Manufacturing 2.4% 6.6% 23.1%
Lifesciences & Healthcare 1.8% 2.4% 7.6%
Public Services# -4.6% 0.2% 10.1%
Retail & CPG -0.5% 6.6% 11.2%
Telecommunications, Media, Publishing & Entertainment 1.7% -3.8% -4.0%
Note: * Outside of IP partnership with DXC, Application services and Financial services revenue has grown by 2.6 % and 2.8% respectively on QoQ Constant currency basis. # Public Services include Oil & Gas, Energy & Utilities, Travel - Transport - Logistics and Government.

- 19 -
CLIENT METRICS
NUMBER OF MILLION DOLLAR CLIENTS (LTM) 31-Dec-16 30-Sep-17 31-Dec-17 QoQ
CHANGE YoY
CHANGE
100 Million dollar + 8 9 9 - 1
50 Million dollar + 24 25 25 - 1
40 Million dollar + 35 37 40 3 5
30 Million dollar + 48 52 56 4 8
20 Million dollar + 87 84 85 1 -2
10 Million dollar + 148 157 156 -1 8
5 Million dollar + 241 259 261 2 20
1 Million dollar + 496 536 552 16 56
CLIENT CONTRIBUTION TO REVENUE (LTM) 31-Dec-16 30-Sep-17 31-Dec-17
Top 5 Clients 14.2% 15.1% 15.8%
Top 10 Clients 21.7% 22.9% 23.5%
Top 20 Clients 31.9% 33.2% 33.5%
CLIENT BUSINESS 31-Dec-16 30-Sep-17 31-Dec-17
New Clients 6.8% 2.6% 3.1%
Existing Clients 93.2% 97.4% 96.9%
Days Sales Outstanding - excluding unbilled receivables 61 64 66
- 20 -
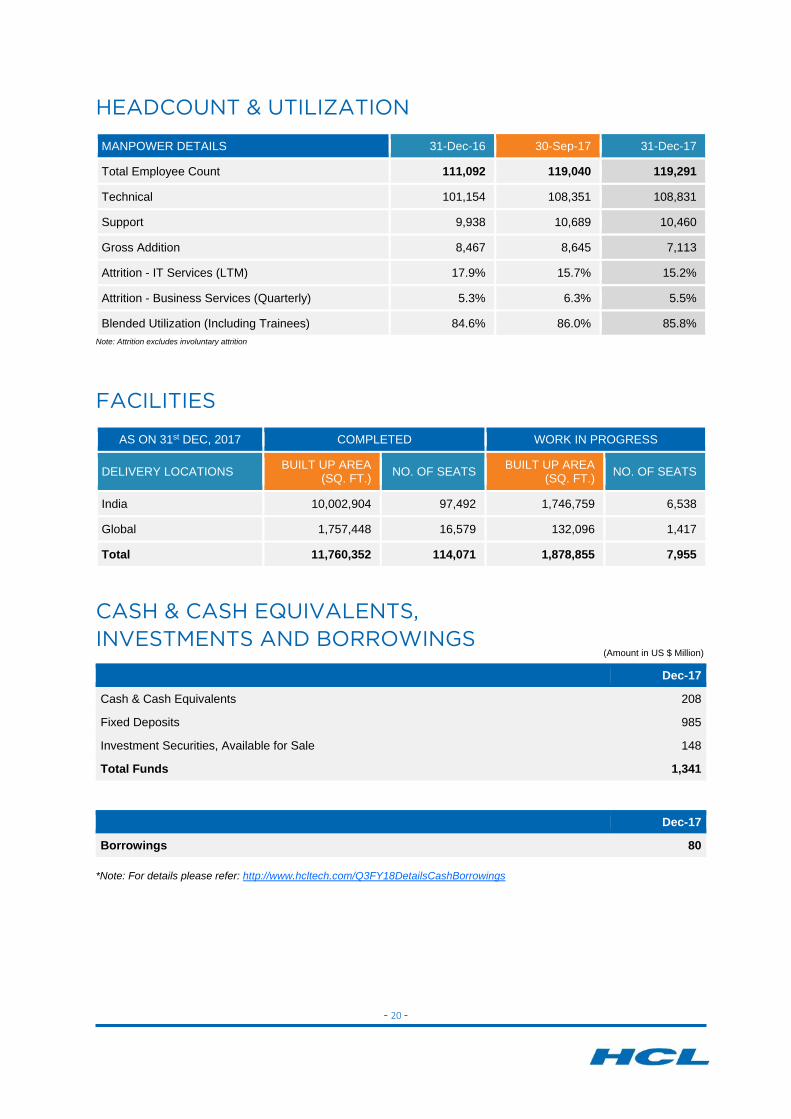
HEADCOUNT & UTILIZATION
MANPOWER DETAILS 31-Dec-16 30-Sep-17 31-Dec-17
Total Employee Count 111,092 119,040 119,291
Technical 101,154 108,351 108,831
Support 9,938 10,689 10,460
Gross Addition 8,467 8,645 7,113
Attrition - IT Services (LTM) 17.9% 15.7% 15.2%
Attrition - Business Services (Quarterly) 5.3% 6.3% 5.5%
Blended Utilization (Including Trainees) 84.6% 86.0% 85.8% Note: Attrition excludes involuntary attrition
FACILITIES
AS ON 31st DEC, 2017 COMPLETED WORK IN PROGRESS
DELIVERY LOCATIONS BUILT UP AREA (SQ. FT.) NO. OF SEATS BUILT UP AREA
(SQ. FT.) NO. OF SEATS
India 10,002,904 97,492 1,746,759 6,538
Global 1,757,448 16,579 132,096 1,417
Total 11,760,352 114,071 1,878,855 7,955
CASH & CASH EQUIVALENTS, INVESTMENTS AND BORROWINGS
Dec-17
Cash & Cash Equivalents 208
Fixed Deposits 985
Investment Securities, Available for Sale 148
Total Funds 1,341
Dec-17
Borrowings 80
*Note: For details please refer: http://www.hcltech.com/Q3FY18DetailsCashBorrowings
(Amount in US $ Million)

- 21 -
FINANCIALS IN ` FOR THE QUARTER ENDED 31st DECEMBER, 2017 (US GAAP)
CONSOLIDATED INCOME STATEMENT
INCOME STATEMENT QUARTER ENDED GROWTH
31-Dec-16 30-Sep-17 31-Dec-17 YoY QoQ
Revenues 11,814 12,434 12,808 8.4% 3.0% Direct Costs 7,809 8,208 8,412
Gross Profits 4,005 4,226 4,397 9.8% 4.0% SG & A 1,377 1,467 1,432
EBITDA 2,628 2,759 2,964 12.8% 7.5%
Depreciation & Amortisation 220 308 455
EBIT 2,408 2,451 2,510 4.2% 2.4%
Foreign Exchange Gains 43 144 129
Other Income, net 188 154 135
Provision for Tax 568 561 579
Net Income 2,070 2,188 2,194 6.0% 0.3% Gross Margin 33.9% 34.0% 34.3%
EBITDA Margin 22.2% 22.2% 23.1%
EBIT Margin 20.4% 19.7% 19.6%
Net Income Margin 17.5% 17.6% 17.1%
Earnings Per Share Annualized in `
Basic 58.7 62.8 63.0
Diluted 58.6 62.7 63.0
WEIGHTED AVERAGE NUMBER OF SHARES 31-Dec-16 30-Sep-17 31-Dec-17
Basic 1,411,067,882 1,394,280,991 1,392,070,357
Diluted 1,412,280,784 1,395,252,560 1,393,040,238
OUTSTANDING OPTIONS (in equivalent number of shares) 31-Dec-16 30-Sep-17 31-Dec-17
Options at less than market price 1,493,320 1,209,080 1,111,080
Out of outstanding options as on December 31st, 2017, 38,400 shares are yet to vest which will vest in tranches till 2018.
(Amount in ` Crores)
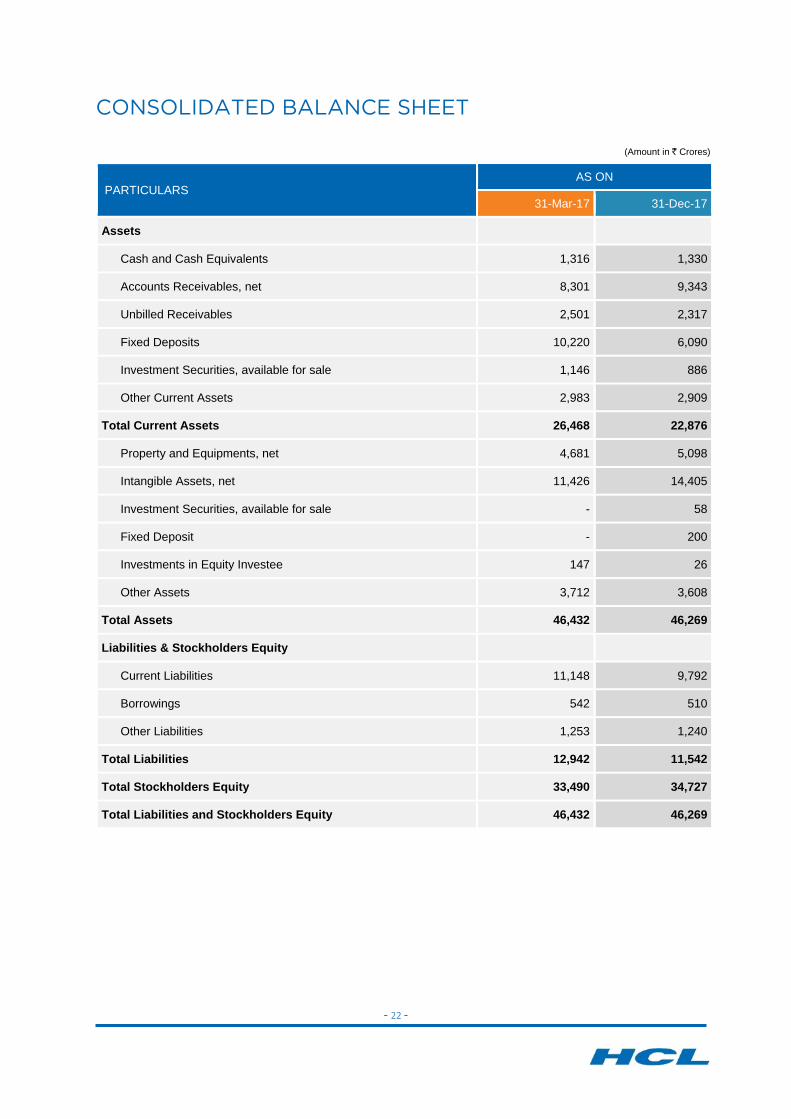
- 22 -
CONSOLIDATED BALANCE SHEET
PARTICULARS AS ON
31-Mar-17 31-Dec-17
Assets
Cash and Cash Equivalents 1,316 1,330
Accounts Receivables, net 8,301 9,343
Unbilled Receivables 2,501 2,317
Fixed Deposits 10,220 6,090
Investment Securities, available for sale 1,146 886
Other Current Assets 2,983 2,909
Total Current Assets 26,468 22,876
Property and Equipments, net 4,681 5,098
Intangible Assets, net 11,426 14,405
Investment Securities, available for sale - 58
Fixed Deposit - 200
Investments in Equity Investee 147 26
Other Assets 3,712 3,608
Total Assets 46,432 46,269
Liabilities & Stockholders Equity
Current Liabilities 11,148 9,792
Borrowings 542 510
Other Liabilities 1,253 1,240
Total Liabilities 12,942 11,542
Total Stockholders Equity 33,490 34,727
Total Liabilities and Stockholders Equity 46,432 46,269
(Amount in ` Crores)

- 23 -
ABOUT HCL TECHNOLOGIES HCL Technologies (HCL) is a leading global IT services company that helps global enterprises re–imagine and transform their businesses through digital technology transformation. HCL operates out of 32 countries and has consolidated revenues of US$ 7.6 billion, for 12 Months ended 31st December, 2017. HCL focuses on providing an integrated portfolio of services underlined by its Mode 1–2–3 growth strategy. Mode 1 encompasses the core services in the areas of Applications, Infrastructure, BPO and Engineering & R&D services, leveraging DRYiCETM Autonomics to transform clients' business and IT landscape, making them 'lean' and 'agile'. Mode 2 focuses on experience–centric and outcome–oriented integrated offerings of Digital & Analytics, IoT WoRKS™, Cloud Native Services and Cybersecurity & GRC services to drive business outcomes and enable enterprise digitalization. Mode 3 strategy is ecosystem–driven, creating innovative IP–partnerships to build products and platforms business. HCL leverages its global network of integrated co-innovation labs and global delivery capabilities to provide holistic multi–service delivery in key industry verticals including Financial Services, Manufacturing, Telecommunications, Media, Publishing, Entertainment, Retail & CPG, Life Sciences & Healthcare, Oil & Gas, Energy & Utilities, Travel, Transportation & Logistics and Government. With 119,291 professionals from diverse nationalities, HCL focuses on creating real value for customers by taking 'Relationships Beyond the Contract'. For more information, please visit www.hcltech.com
SAFE HARBOR STATEMENT Certain statements in this release are forward-looking statements, which involve a number of risks, uncertainties, assumptions and other factors that could cause actual results to differ materially from those in such forward-looking statements. All statements, other than statements of historical fact are statements that could be deemed forward looking statements, including but not limited to the statements containing the words 'planned', 'expects', 'believes', 'strategy', 'opportunity', 'anticipates', 'hopes' or other similar words. The risks and uncertainties relating to these statements include, but are not limited to, risks and uncertainties regarding impact of pending regulatory proceedings, fluctuations in earnings, our ability to manage growth, intense competition in IT services, Business Process Outsourcing and consulting services including those factors which may affect our cost advantage, wage increases in India, customer acceptances of our services, products and fee structures, our ability to attract and retain highly skilled professionals, our ability to integrate acquired assets in a cost effective and timely manner, time and cost overruns on fixed-price, fixed-time frame contracts, client concentration, restrictions on immigration, our ability to manage our international operations, reduced demand for technology in our key focus areas, disruptions in telecommunication networks, our ability to successfully complete and integrate potential acquisitions, the success of our brand development efforts, liability for damages on our service contracts, the success of the companies / entities in which we have made strategic investments, withdrawal of governmental fiscal incentives, political instability, legal restrictions on raising capital or acquiring companies outside India, and unauthorized use of our intellectual property, other risks, uncertainties and general economic conditions affecting our industry. There can be no assurance that the forward looking statements made herein will prove to be accurate, and issuance of such forward looking statements should not be regarded as a representation by the Company, or any other person, that the objective and plans of the Company will be achieved. All forward looking statements made herein are based on information presently available to the management of the Company and the Company does not undertake to update any forward-looking statement that may be made from time to time by or on behalf of the Company.

- 24 -
For details, contact:
INVESTOR RELATIONS CORPORATE COMMUNICATIONS
Sanjay Mendiratta [email protected] +91-120-6126335
Ajay Davessar Global Head [email protected] +91-120-6126000
Devneeta Pahuja India [email protected] +91-120-6126000
HCL Technologies Ltd., Technology Hub, SEZ, Plot No. 3A, Sec-126, Noida - 201304, India. www.hcltech.com
Hello there! I am an Ideapreneur. I believe that sustainable business outcomes are driven by relationships nurtured through values like trust, transparency and flexibility. I respect the contract, but believe in going beyond through collaboration, applied innovation and new generation partnership models that put your interest above everything else. Right now over 119,000 Ideapreneurs are in a Relationship Beyond the ContractTM with customers in 32 countries. How can I help you?
TALK TO ME