Embed Size (px)
Citation preview

We examine the useof auditory displayfor ubiquitouscomputing to extendthe boundaries ofhuman–computerinteraction (HCI).Our design process isbased on listeningtests, gathering free-text identificationresponses fromparticipants. Theresponses and theirclassificationsindicate howaccurately soundsare identified andhelp us identifypossible metaphorsand mappings ofsound to humanaction and/or systemstatus.
With the emergence of ubiqui-tous and wearable computers,we need to explore alterna-tives to visual displays, as users
sometimes need to focus their visual attention onthe surrounding environment rather than on thecomputer. For example, using a GUI on a hand-held computer while walking is extremely diffi-cult, and indeed dangerous when standing onscaffolding on a building site high above ground.
On the other hand, we can use other kinds ofequipment in such situations, such as walkie-talkies, mobile phones, and various forms of elec-tronic instruments (for example, Geiger counters,metal detectors, and personal entertainment sys-tems). Such devices usually have a few fixed but-tons or controls (which can be attached to theuser’s clothing) that the user can operate withfingers. The user then learns to use the deviceover time with practice.
In this article, we report on the auditory dis-plays that we devised and tested with users. Wefocus on two issues that we feel are importantwhen designing interaction with auditory display:
❚ A method to inform the choice of suitablesounds for auditory icons, based on the analy-sis of listening tests.
❚ The design of soft buttons using auditory dis-play to provide users with a pseudohapticexperience.
For background information on otherresearchers who are exploring sound, as well asbasic information on some of the issues we’veconsidered, please see the sidebar, “Considerationsfor Designing Auditory Displays.”
Exploring what people hearWhile it’s assumed that everyday sounds
have inherent meaning, learned from oureveryday activities, hearing such sounds inisolation without context can be quite con-fusing. The sound of a single isolated footstepcan, for example, be heard as a book beingdropped on a table. Interestingly, this prob-lem is somewhat similar to how linguistichomonyms work (words of the same spellingor sound can have different meanings depend-ing on context).1
To further develop our understanding of peo-ple’s perception of auditory events, we conduct-ed listening tests, an approach also used by otherresearchers.2,3 We made high-quality (44.1-kilo-herz, 16-bit) recordings of 104 everyday sounds(durations between 0.4 and 18.2 seconds) andhad 14 postgraduate students listen to the record-ed sounds in random order using headphones,responding in free-text format to what eachsound was. In most cases the descriptions theygave were quite rich. For example, the followingresponses (for three different recordings) describethe events quite accurately:
❚ “A person walking on a carpet with theirhands in their pockets hence the clanging ofkeys or coins, taking five steps and turning toretrace their footsteps.”
❚ “A metal spoon in stirring motion in an emptyceramic cup, tapping the cup as if to displacethe liquid from the spoon and then placingthe spoon onto a table.”
❚ “Breaking of a cup (not really a glass soundmore ceramic I think).”
Several ways exist to analyze the responsesfrom such listening tests. The most obvious waywould be to count how many responses couldbe deemed correct for each sound by linkingthe sound to the participants’ reported under-standing of the objects and actions involved inproducing the sound. A somewhat more inter-esting measure is Ballas’ method of causaluncertainty.4 Ballas et al.5 found that identifi-
36 1070-986X/05/$20.00 © 2005 IEEE Published by the IEEE Computer Society
HCI Design andInteractiveSonification forFingers and Ears
Mikael Fernström, Eoin Brazil, and Liam BannonUniversity of Limerick
Interactive Sonification
cation time for everyday nonspeech sounds wasa function of the logarithm of the number ofalternative interpretations of a sound. This ledthem to suggest using an information measureH to quantify the causal uncertainty of a sound,as Equation 1 shows:
(1)
HCU is a measure of causal uncertainty for soundi, pij is the proportion of all responses for sound i
H p pCU ij ijj
n
= ∑ log2
37
Ap
ril–June
In novel human–computer interaction (HCI) paradigms,1-3
such as ubiquitous, pervasive, wearable, and disappearing com-puting, interactive sonification might offer useful alternatives tothe otherwise dominant visual displays, freeing up our eyes tosee the surrounding world or do what small visual displays don’tdo so well. In brief, using sound for display in interaction designis useful for attracting attention to events or locations, for non-visual communication in general (including speech), alarms,notification, and feedback. Sound is less useful for continuousdisplay of objects, for absolute readings (most people perceiveauditory dimensions such as pitch, loudness, and timbre asbeing relative), and for fine-detail spatial display. Sound is alsoproblematic in noisy or noise-sensitive environments.
Designing interactive sonifications for HCI requires that weaddress numerous issues. We have to consider where and howsonification is appropriate. As designers, we also need to takeinto account the users’ capabilities while carrying out tasks inreal environments, and consider that surrounding noise levelsmight mask the system’s sounds. If the sound will enhance theinteraction, we need to explore ways of creating and testingauditory metaphors. We should also investigate to what extentthe use of sound contributes to the users’ performance and sub-jective quality of use.
To be able to design with sound, we need a high-levelunderstanding of what and how we hear (for example, seeGaver’s research4,5). While an extensive catalogue of studiesexists on the perception of musical sounds and speech,researchers know relatively little about other kinds of nonspeechsounds—in particular everyday sounds (such as footsteps, creak-ing doors, water filling a container, bouncing, and breaking).
In the new HCI paradigms, we can explore new conceptsof interaction and human activity. In previous work on audito-ry interfaces, ranging from Gaver’s Sonic Finder6 to Brewster’shierarchical earcons,7 human action has to a large extent beenthought of in a discrete way—like kicking a football, where auser action starts a process that then completes without anyfurther user control. This view might be appropriate when typ-ing, clicking, or flicking switches. An alternative view is actionas a continuous flow, such as a pen stroke, where we continu-ously move a pencil on a surface, relying on our learned ges-ture through proprioception, as well as haptic, visual, andauditory feedback. This latter view is becoming important, nowthat several input devices (such as pens, digitizers, and cam-eras) are capable of detecting complex human actions.
Still, at the core of our design space, a fundamental prob-lem is how to classify and select suitable sounds for a particularinteraction design. Depending on our intended users, tasks, andcontext, initially a broad continuum exists in this design space,ranging from concrete to abstract displays (that is, from audi-tory icons to earcons).8,9 If we’re designing for casual everydayuse, we probably need to consider concrete forms. If we’redesigning for highly specialized domains (such as cockpit orprocess-control applications) where our users will be selectedand trained for high-performance requirements, we might needto focus on psychoacoustic issues such as detection accuracy ortime and perceived urgency. In the latter case the design spacecan be more abstract.10
References1. E. Bergman, Information Appliances and Beyond, Morgan
Kaufmann, 2000, p. 385.
2. B. Shneiderman, Leonardo’s Laptop: Human Needs and the New
Computing Technologies, MIT Press, 2002.
3. H. Rheingold, Smart Mobs: The Next Social Revolution, Perseus
Books, 2003.
4. W.W. Gaver, “How Do We Hear in the World? Explorations of
Ecological Acoustics,” Ecological Psychology, vol. 5, no. 4, 1993,
pp. 285-313.
5. W.W. Gaver, “What in the World Do We Hear? An Ecological
Approach to Auditory Source Perception,” Ecological Psychology,
vol. 5, no. 1, 1993, pp. 1-29.
6. W.W. Gaver, “The Sonic Finder: An Interface that Uses Auditory
Icons,” Proc. Assoc. for Computing and Machinery Computer–
Human Interaction (ACM CHI), ACM Press, 1989, pp. 67-94.
7. S.A. Brewster, P.C. Wright, and A.D.N. Edwards, “A Detailed
Investigation into the Effectiveness of Earcons,” Auditory Display:
Sonification, Audification, and Auditory interfaces, G. Kramer, ed.,
Addison-Wesley, 1994, pp. 471-498.
8. S.A. Brewster, “Non-Speech Auditory Output,” The
Human–Computer Interaction Handbook, J. Jacko and A. Sears,
eds., Lawrence Erlbaum Associates, 2002, pp. 220-239.
9. W.W. Gaver, “Auditory Interfaces,” Handbook of Human–Com-
puter Interaction, M.G. Helander, T.K. Landauer, and P. Prabhu,
eds., 2nd ed., Elsevier Science, 1997.
10. R.D. Patterson and A.J. Datta, “Extending the Domain of Auditory
Warning Sounds: Creative Use of High Frequencies and Temporal
Asymmetry,” Human Factors in Auditory Warnings, N.A. Stanton
and J. Edworthy, eds., Ashgate, 1999, pp. 73-90.
Considerations for Designing Auditory Displays

sorted into event category j, and n is the numberof categories for responses to sound i. Applying thisequation implies that if all participants in a listen-ing test give the same response, the causal uncer-tainty is 0 (all participants agree). For example,with 14 participants if the responses are distributed50/50 between two alternatives, the causal uncer-tainty is 1.0. If the distribution of responses isskewed—such as 13 of the 14 responses are thesame but one response is different—the causaluncertainty is 0.37. If all 14 responses are different,the causal uncertainty is 3.8. From this we can seethat calculating causal uncertainty according toBallas’ method gives a good measure of how easyit is for users to identify everyday sounds.
With our collected data (responses from 14participants listening to 104 different sounds) theresponses were sorted and categorized, as well asevaluated for correctness, by two of the authorsand a research assistant. The reliability betweenthe evaluators was significant (weakest r = 0.78, p < 0.0016). From the responses, we extracted andcategorized action and object segments of thetexts, such as how the objects/materials interact-ed and what objects/materials were used. Wefound that in general 32 percent of the soundswere identified correctly, while for action seg-ments it was 38 percent and for object segmentsit was 25 percent.
The collected data set with all responses, cat-egorizations, and measurements of causal uncer-tainty can also be used for suggesting the possibleuse of sounds in interaction design, somewhatsimilar to Barrass’ method of collecting storiesabout when sound is useful in everyday life.6
From a designer’s point of view it’s interesting tonote that the responses from the listening testscontain information about how people describeeveryday sounds as well as measurements ofcausal uncertainty.
Sounding objectsWith the results of the listening tests, we can
begin to suggest possible auditory displays andmetaphors for interaction design. Based onBarrass’ TaDa approach,6 we can do a task anddata analysis that lets us select sounds that cancommunicate the dimensions and directions thatgive users adequate feedback about their actionsin relation to the system as well as the system’sstatus and events. We then need to create waysso that the system can produce the selectedsounds and finally evaluate the resulting designwith users.7 If we were to just play sound files asfeedback to user actions, it would always soundthe same and never (or seldom) be expressive (forexample, to be mapped to the user’s effort or thesize of the data objects involved).
This was one of the issues addressed by theEuropean Union’s Sounding Object project (seehttp://www.soundobject.org), where new meth-ods for physically inspired modeling of soundsfor sound synthesis were explored. Our work wasinitially largely informed by ecological acousticsand Gaver’s work on auditory icons.8
We also worked toward cartoonification ofsound models—that is, simplifying the modelswhile retaining perceptual invariants. We imple-mented the models in Pure Data (commonlyknown as PD; see http://www.puredata.org) andtested them in a number of ways, ranging fromperceptual experiments to artistic performance.Compared to ordinary sound files, sound objectscan provide “live” sound models that we canparametrically control in real time with reason-able computational power.
Being able to parametrically control soundmodels in real time can also, potentially, helpmake sonifications less annoying. With prerecord-ed sound files, sounds used in an auditory interfacealways sound exactly the same. In contrast, withsound objects and parametric control we can varyproperties of the sounds—for example, mappingthe size of objects or the effort of actions—so thatsmall objects or actions make small sounds andlarge objects or actions make large sounds.
Revisiting the overall results from the SoundingObject project,9 it’s interesting to note that all thesound models developed throughout the projectpoint toward an epistemology that differs fromGaver’s trichotomy of primitives of solids, liquids,and gases. An alternative emerging view indicatesthat the primitive classes might be better under-stood if we think of the world of sound-producingevents as composed of impacts, frictions, and
38
IEEE
Mul
tiM
edia
Being able to parametrically
control sound models in real
time can also, potentially,
help make sonifications
less annoying.
deformations. The simulated material propertiesof the objects involved in such interactions arecontrollable through parameters passed on to oursound models. The analysis of listening tests, aspreviously described, also suggests that actions arebetter identified than objects. This might suggestthat interaction design using auditory displayshould focus on mapping human activity toactions rather than objects.
Example: Auditory soft buttons The idea of software-defined buttons—soft but-
tons—emerged from research on direct manipu-lation and GUIs (from early work in XeroxPARC—Palo Alto Research Center10) and is nowan important part of all GUI widget libraries.Most GUIs use soft buttons extensively, rangingfrom desktop personal computers and laptops(see, for example, Figure 1), to personal digitalassistants (see Figure 2). With soft buttons thedesigner—and sometimes also the user—can eas-ily modify, add, or remove a software applica-tion’s interactive controls.
The ways that users can activate soft buttonsvary. On desktop computers the most commonway is to move a pointing device, such as amouse, that in turn indirectly moves a visiblecursor on screen into the rectangle surroundingthe soft button. The user then activates it byclicking with the pointing device. Visual soft but-tons are often animated to improve feedback tothe user—for example, when the user clicks, thevisual button displayed temporarily changes itsappearance so that the graphical symbol lookslike it’s moving inwards, into the display surface.On other kinds of computers, such as handheldcomputers, the user can point directly to a visualsoft button, either with a handheld stylus or sim-ply with a finger.
User interface widgets such as these make thedesign of GUIs highly malleable and flexible, asthe designer can display and represent highlycomplex underlying functionality with simplegraphical symbols that, ideally, look like conceptsor entities in the user’s task domain. Because it’susually the software rather than the hardwarethat defines such widgets, the same physical dis-play surface can be used for different widgets atdifferent times, supporting the varying needs forthe user to carry out different tasks. These featuresmake soft buttons attractive components of userinterfaces, both for designers and users. Alongthese lines, our interest is in using forms of dis-play other than vision to create similar affor-
dances, in this particular case through auditoryfeedback mimicking what it would sound like totouch differently structured surfaces.
Pseudohaptic soft buttons usingauditory display
In three experiments we investigated the useof auditory display to create a pseudohaptic expe-rience of soft buttons.
Pilot 1: Real hapticsFirst, we conducted a pilot experiment, based
on Gibson’s11 cookie-cutter study. With four dif-ferent paper shapes glued on paper, a participantfound it easy to feel the shapes and then draw animage of them, picking up the shape of theobjects through haptic perception and visualiz-ing the shapes.
Pilot 2: Pseudohaptics using auditory displayBased on the first pilot experiment, we
designed a second study of a soft-button proto-
39
Ap
ril–June 2005
Figure 1. Visual soft buttons, such as in this
Microsoft GUI example, are currently one of the
most common widgets used by interaction designers.
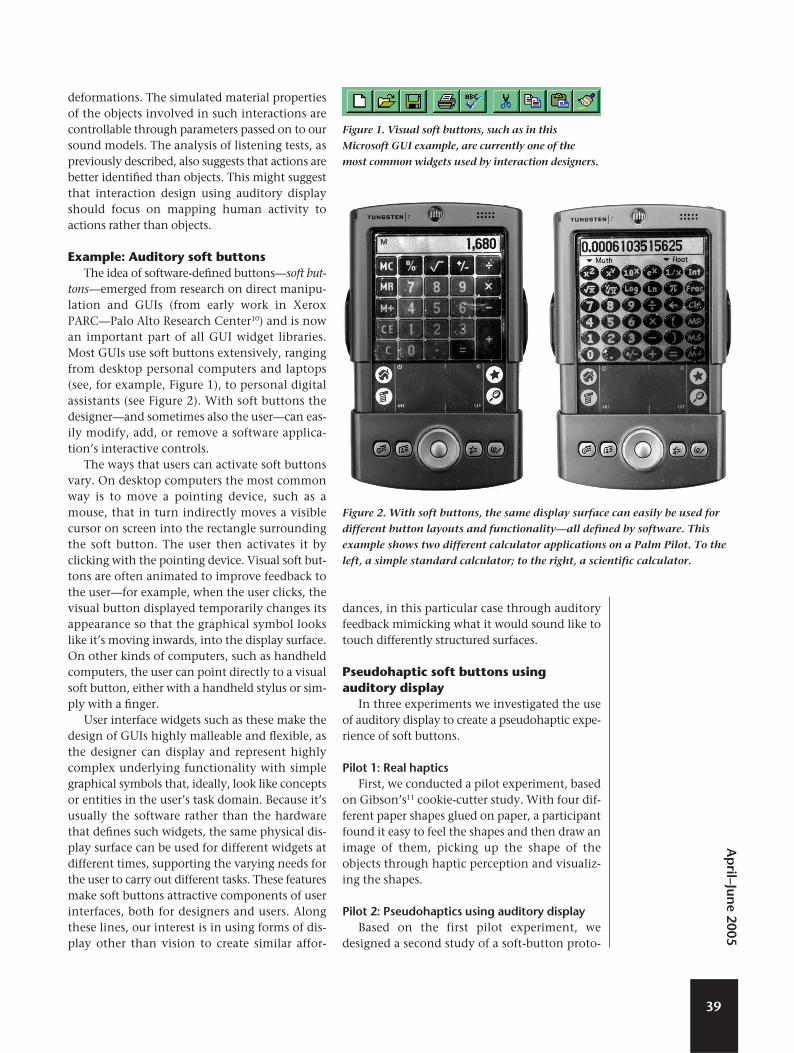
Figure 2. With soft buttons, the same display surface can easily be used for
different button layouts and functionality—all defined by software. This
example shows two different calculator applications on a Palm Pilot. To the
left, a simple standard calculator; to the right, a scientific calculator.
type, testing the idea of having soft buttons dis-played by audio instead of graphics. We askedthree users to make drawings of three different
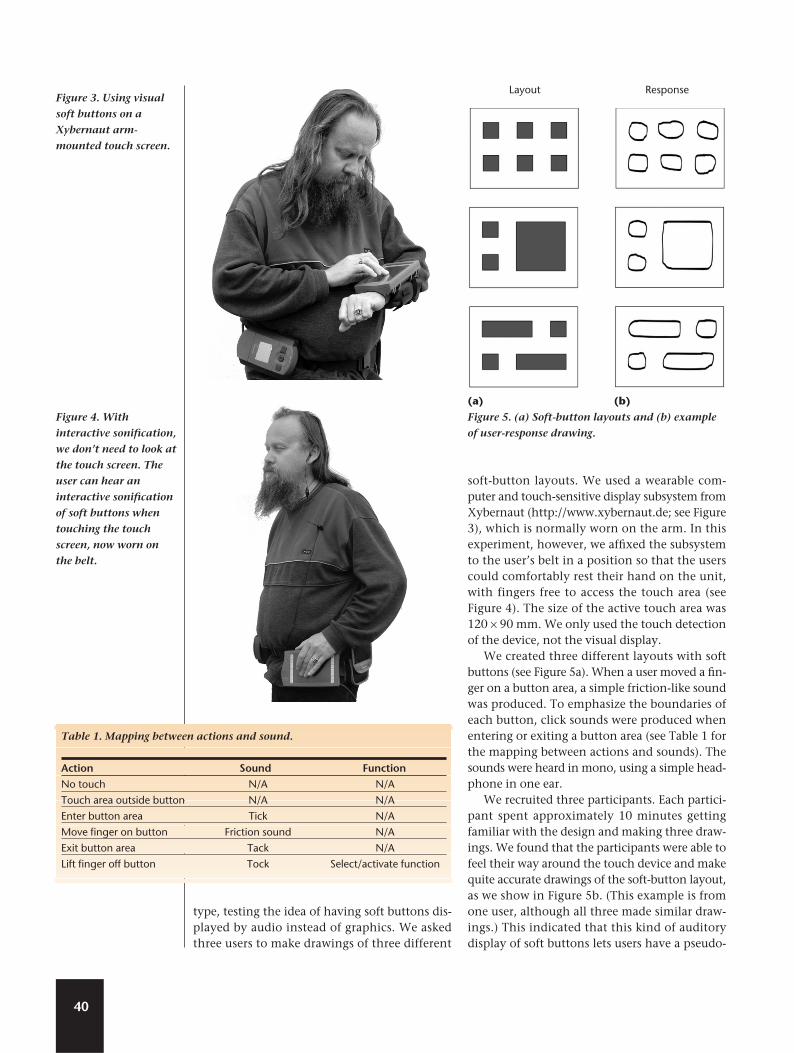
soft-button layouts. We used a wearable com-puter and touch-sensitive display subsystem fromXybernaut (http://www.xybernaut.de; see Figure3), which is normally worn on the arm. In thisexperiment, however, we affixed the subsystemto the user’s belt in a position so that the userscould comfortably rest their hand on the unit,with fingers free to access the touch area (seeFigure 4). The size of the active touch area was120 × 90 mm. We only used the touch detectionof the device, not the visual display.
We created three different layouts with softbuttons (see Figure 5a). When a user moved a fin-ger on a button area, a simple friction-like soundwas produced. To emphasize the boundaries ofeach button, click sounds were produced whenentering or exiting a button area (see Table 1 forthe mapping between actions and sounds). Thesounds were heard in mono, using a simple head-phone in one ear.
We recruited three participants. Each partici-pant spent approximately 10 minutes gettingfamiliar with the design and making three draw-ings. We found that the participants were able tofeel their way around the touch device and makequite accurate drawings of the soft-button layout,as we show in Figure 5b. (This example is fromone user, although all three made similar draw-ings.) This indicated that this kind of auditorydisplay of soft buttons lets users have a pseudo-
40
IEEE
Figure 3. Using visual
soft buttons on a
Xybernaut arm-
mounted touch screen.
Figure 4. With
interactive sonification,
we don’t need to look at
the touch screen. The
user can hear an
interactive sonification
of soft buttons when
touching the touch
screen, now worn on
the belt.
Layout Response
(a) (b)
Figure 5. (a) Soft-button layouts and (b) example
of user-response drawing.
Table 1. Mapping between actions and sound.
Action Sound FunctionNo touch N/A N/A
Touch area outside button N/A N/A
Enter button area Tick N/A
Move finger on button Friction sound N/A
Exit button area Tack N/A
Lift finger off button Tock Select/activate function

haptic experience, giving them a mental modelof the device’s layout.
Pilot 3: Haptics and pseudohapticsThe focus in our final experiment was the user
detection of and interaction with soft buttonsusing an auditory display. We refined our exper-iment by first selecting a different touch device—a Tactex touch tablet called MTC Express (seeFigure 6)—that differs from the previously usedXybernaut device in that the MTC Express devicedoesn’t have a visual display.
The interactive area of the Tactex devicematches the size of a human hand quite well.The active touch area is 145 × 95 mm. The pointof contact where the hand rests is a spatial andhaptic reference point for finger movements onthe device. We also redesigned our software tominimize any latency and implemented six dif-ferent soft-button layouts (see Figure 7).
Procedure. We recruited 10 participantsamong our postgraduates. We tested all six lay-outs both as paper shapes on cardboard and withthe Tactex touch tablet connected to a WindowsPC. Each stimulus was tested twice, resulting in24 drawings per participant (12 haptic, 12 audi-tory/pseudohaptic). The order between stimuliwas randomized. Users had headphones to listento the sounds (in mono) while interacting withthe system. They were allowed to use either theirleft or right hand to explore the layouts and todraw their understanding of the layouts.
To prevent our participants from seeing wherethey were moving their fingers on the Tactextablet, we covered it with a cardboard box with acut-out for the user’s hand to reach the activetouch area. On top of the box, a video camera wasfitted for recording the participants’ hand and fin-ger movements (see Figure 8). The same box wasused for both haptic and pseudohaptic stimuli.The participants were given 3 minutes of explo-
41
Figure 6. Tactex touch tablet.
Figure 7. Six different soft-button
layouts used in the final experiment.
S1 and S2 are simple symmetrical
layouts with buttons of the same size;
S3–S5 have buttons of different sizes
and also introduce different degrees of
asymmetry; S6 challenges the user as
buttons are packed closely together.
S1
S2
S3
S4
S5
S6
Figure 8. Experimental
setup of the touch area.
We wanted to make
sure that the users
didn’t pick up visual
clues from seeing where
they moved their hand
while exploring the
haptic and
pseudohaptic soft
buttons. A video
camera was positioned
on top of the box so
that we could record
the user’s hand
movements.
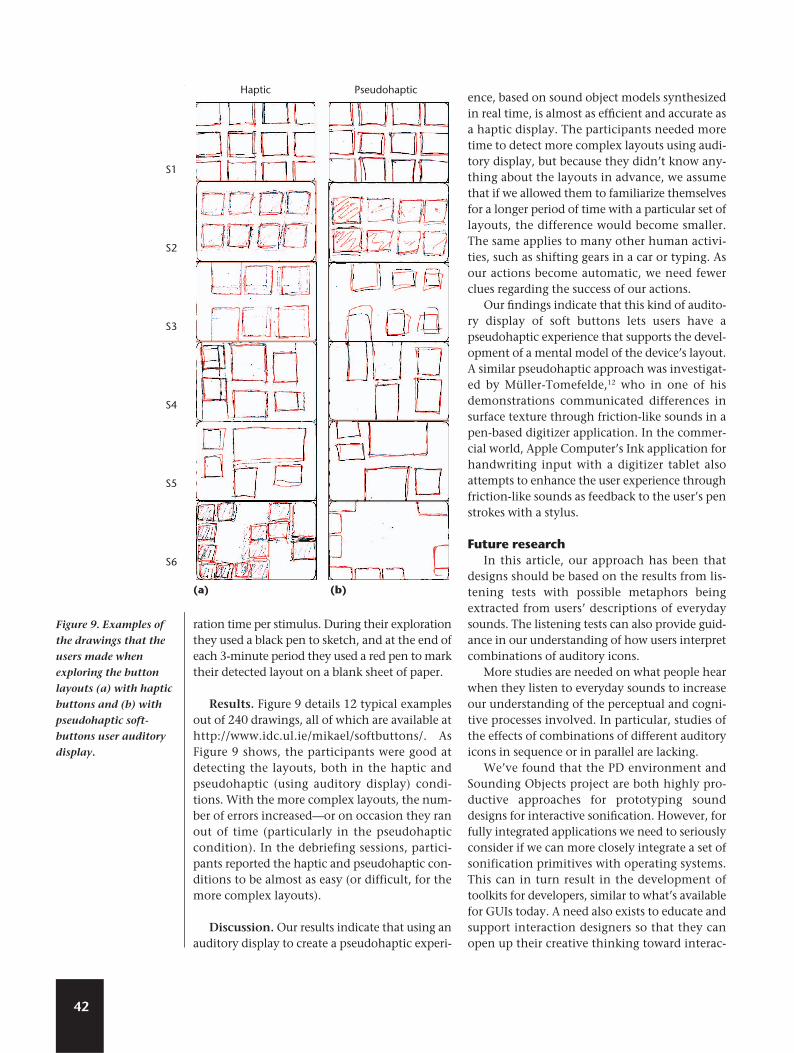
ration time per stimulus. During their explorationthey used a black pen to sketch, and at the end ofeach 3-minute period they used a red pen to marktheir detected layout on a blank sheet of paper.
Results. Figure 9 details 12 typical examplesout of 240 drawings, all of which are available athttp://www.idc.ul.ie/mikael/softbuttons/. AsFigure 9 shows, the participants were good atdetecting the layouts, both in the haptic andpseudohaptic (using auditory display) condi-tions. With the more complex layouts, the num-ber of errors increased—or on occasion they ranout of time (particularly in the pseudohapticcondition). In the debriefing sessions, partici-pants reported the haptic and pseudohaptic con-ditions to be almost as easy (or difficult, for themore complex layouts).
Discussion. Our results indicate that using anauditory display to create a pseudohaptic experi-
ence, based on sound object models synthesizedin real time, is almost as efficient and accurate asa haptic display. The participants needed moretime to detect more complex layouts using audi-tory display, but because they didn’t know any-thing about the layouts in advance, we assumethat if we allowed them to familiarize themselvesfor a longer period of time with a particular set oflayouts, the difference would become smaller.The same applies to many other human activi-ties, such as shifting gears in a car or typing. Asour actions become automatic, we need fewerclues regarding the success of our actions.
Our findings indicate that this kind of audito-ry display of soft buttons lets users have apseudohaptic experience that supports the devel-opment of a mental model of the device’s layout.A similar pseudohaptic approach was investigat-ed by Müller-Tomefelde,12 who in one of hisdemonstrations communicated differences insurface texture through friction-like sounds in apen-based digitizer application. In the commer-cial world, Apple Computer’s Ink application forhandwriting input with a digitizer tablet alsoattempts to enhance the user experience throughfriction-like sounds as feedback to the user’s penstrokes with a stylus.
Future researchIn this article, our approach has been that
designs should be based on the results from lis-tening tests with possible metaphors beingextracted from users’ descriptions of everydaysounds. The listening tests can also provide guid-ance in our understanding of how users interpretcombinations of auditory icons.
More studies are needed on what people hearwhen they listen to everyday sounds to increaseour understanding of the perceptual and cogni-tive processes involved. In particular, studies ofthe effects of combinations of different auditoryicons in sequence or in parallel are lacking.
We’ve found that the PD environment andSounding Objects project are both highly pro-ductive approaches for prototyping sounddesigns for interactive sonification. However, forfully integrated applications we need to seriouslyconsider if we can more closely integrate a set ofsonification primitives with operating systems.This can in turn result in the development oftoolkits for developers, similar to what’s availablefor GUIs today. A need also exists to educate andsupport interaction designers so that they canopen up their creative thinking toward interac-
42
S1
S2
S3
S4
S5
S6
Figure 9. Examples of
the drawings that the
users made when
exploring the button
layouts (a) with haptic
buttons and (b) with
pseudohaptic soft-
buttons user auditory
display.
(a) (b)
Haptic Pseudohaptic
tive sonification, and realize that it’s possible toprovide continuous feedback in real time for ges-ture-based devices.
All components in HCI also have aestheticproperties. It’s probably possible to design soni-fications that are psychoacoustically correct andquite efficient but unpleasant to listen to (just asit’s possible to design visual interfaces that usersfind unpleasant to view). As Somers13 has sug-gested, we need to draw upon the knowledge andideas of Foley artists (sound design for film, radio,and television) as well as lessons learned fromvarious theories of acousmatic music. MM
AcknowledgmentsWe would like to express our thanks to all the
postgraduate students at the University of Limerickwho participated in our experiments. We thankXybernaut for giving us access to their wearablecomputers and Tactex for giving us access to theirdevice driver source code. We’re indebted to all ourcolleagues in the Sounding Object project for anongoing and engaging dialogue. Finally, we thankour colleagues Annette Aboulafia, ThomasWaldmann, and Michael Cooke for their com-ments on earlier versions of this article; StephenShirley for software development for the Tactexdevice; and the anonymous reviewers for their cre-ative and encouraging comments. This work waspartly financed by the European Union Future andEmerging Technologies program; the DisappearingComputer/Sounding Object project IST-2000-25287; the Irish Research Council for Science,Engineering and Technology/Multimodal Systemsproject SC-02-302; and the Science FoundationIreland: Shared Worlds Project, 2003–2007.
The research in this article was originally pub-lished in the Proceedings of the InternationalWorkshop on Interactive Sonification in January2004. The article has been revised and updatedto fit with IEEE MultiMedia’s standards.
References1. J.A. Ballas and R.T. Mullins, “Effects of Context on
the Identification of Everyday Sounds,” Human Per-
formance, vol. 4, no.3, 1991, pp. 199-219.
2. N.J. Vanderveer, “Ecological Acoustics: Human Per-
ception of Environmental Sounds,” Dissertation
Abstracts Int’l, PhD dissertation, Cornell Univ.,
40/09B, 4543 (Univ. Microfilms no. 8004002),
1979.
3. W.W. Gaver, Everyday Listening and Auditory Icons,
PhD dissertation, Univ. of California, San Diego,
1988.
4. J.A. Ballas, “Common Factors in the Identification of
an Assortment of Brief Everyday Sounds,”
Experimental Psychology: Human Perception and Per-
formance, vol. 19, no. 2, 1993, pp. 250-267.
5. J.A. Ballas, M.J. Sliwinsky, and J.P. Harding, “Uncer-
tainty and Response Time in Identifying Non-
Speech Sounds,” J. Acoustical Soc. of Am., vol. 79,
no. 47, 1986.
6. S. Barrass, “Auditory Information Design,” PhD dis-
sertation, Australian National Univ., 1997.
7. B. Walker and G. Kramer, “Mappings and Meta-
phors in Auditory Displays: An Experimental Assess-
ment,” Proc. 3rd Int’l Conf. Auditory Display (ICAD
96), Int’l Community for Auditory Display, 1996.
8. W.W. Gaver, “Using and Creating Auditory Icons,”
Auditory Display: Sonification, Audification and Audi-
tory interfaces, G. Kramer, ed., Addison-Wesley,
1994, pp. 417-446.
9. D. Rocchesso, R. Bresin, and M. Fernström,
“Sounding Objects,” IEEE MultiMedia, vol. 10, no.
2, Apr.–June 2003, pp. 42-52.
10. A. Kay and A. Goldberg, “Personal Dynamic
Media,” Computer, vol. 10, 1977, pp. 31-44.
11. J.J. Gibson and S. Stanely, “The Accuracy of Form
Discrimination with Three Types of Tactual Input:
Passive, Moving, and Active,” Purple Perils, Aug.
1961; http://www.trincoll.edu/depts/ecopsyc/
perils/folder1/accuracy.html.
12. C. Müller-Tomefelde, “Sounds@Work—Akustishe
Repräsentationen für die Mensch-Computer Inter-
aktion in kooperativen und Hybriden Arbeitsumge-
bungen [Sounds@Work—Auditory Displays for
Interaction in Cooperative and Hybrid Environ-
ments],” Elektrotechnik und Informationstechnik,
PhD dissertation, Technical Univ. Darmstadt, 2003;
http://elib.tu-darmstadt.de/dis/000313/.
13. E. Somers, “Abstract Sound Objects to Expand the
Vocabulary of Sound Design for Visual and Theatri-
cal Media,” Proc. Int’l Conf. Auditory Display (ICAD
2000), Int’l Community for Auditory Display, 2000.
Mikael Fernström is the director
of the master’s program in Inter-
active Media at the University of
Limerick, Ireland. His main
research interests are interaction
design, sound, music, and elec-
tronics. Fernström studied elec-
tronic engineering and telecommunications at the
Kattegatt technical college in Halmstad, Sweden, and has
an MSc in human–computer interaction from the Uni-
versity of Limerick.
43
Ap
ril–June 2005

Eoin Brazil is a research assistant
in the Interaction Design Centre
at the University of Limerick, Ire-
land. His main research interests
are interaction design, sound,
software visualization, and music
retrieval. Brazil has a BSc and MSc
in computer science from the University of Limerick.
Liam Bannon is the director of
the Interaction Design Centre and
professor of computer science in
the Department of Computer Sci-
ence and Information Systems at
the University of Limerick. He’s
interested in improving the
usability and desirability of computational artifacts. He
also examines alternative conceptual and methodolog-
ical frameworks for understanding human activities
(and their mediation by various technologies). Bannon
has an MSc in computer science from Trinity College in
Dublin, Ireland, and a PhD in experimental psycholo-
gy from the University of Western Ontario, Canada.
Readers may contact Mikael Fernström at the Inter-
action Design Centre, Computer Science Dept., Univ.
of Limerick, Limerick, Ireland; [email protected].
For further information on this or any other computing
topic, please visit our Digital Library at http://www.
computer.org/publications/dlib.
44
Stay on top of the exploding fields of computational biology andbioinformatics with the latest peer-reviewed research.
This new journal will emphasize the algorithmic, mathematical,statistical and computational methods that are central inbioinformatics and computational biology including…
• Computer programs in bioinformatics• Biological databases• Proteomics• Functional genomics• Computational problems in genetics
Learn more about this new publication and become a subscriber today.
www.computer.org/tcbb
IEEE/ACM TRANSACTIONS ON COMPUTATIONAL BIOLOGY ANDBIOINFORMATICS
Publishing quarterly Member rate:
$35 print issues$28 online access$46 print and online
Institutional rate: $375
Figure courtesy of Matthias Höchsmann, Björn Voss, and Robert Giegerich.