Embed Size (px)
Citation preview
2012-2013 HCEA Job Satisfaction Survey
1
HCEA JOB SATISFACTION SURVEY
2012-2013 OVERVIEW
Respondents (88%) feel successful in their work, and want to be involved in decision-making at their
schools/worksites (90%). In a significant upward shift from last year, 90% of respondents agree
administrators respect their negotiated contracts and their work is evaluated fairly (88%). They also believe
their work environment is conducive to success (84%), are treated as professionals (84%).
LEADERSHIP: Confidence in the Superintendent of schools has risen (74%, up from 67%), but remained
flat for the Howard County Board of Education (60%). A large majority of respondents are confident in the
leadership exhibited by the Howard County Education Association (89%, up from 84%).
HARASSMENT: Harassment numbers have decreased to 2010-11 levels. In the last 12 months, 28%
(down from 32%) of respondents reported experiencing harassing behavior from parents, 14% (down from
18%) of respondents reported experiencing harassing behavior from colleagues, and 9% (down from 13%)
of respondents reported experiencing harassing behavior from administrators/supervisors.
MIDDLE SCHOOLS: The survey reflects marked differences between the school levels. Respondents in
middle schools were far less apt to agree to positive statements about their work site. For the first time, a
majority (53%) disagreed with the statement “Overall, morale in my school/work site is good.” Their
morale was nearly 30% lower than counterparts in elementary and high schools, and only 67% had
confidence in the Superintendent, with 46% reporting confidence in the Board of Education.
MORALE: In a well documented trend, educator morale is decreasing nationally and in Howard County.
Agreement with the statement “Overall, morale in my school/work site is good” was only 68%. Increased
workload is contributing to a decline in morale (59%, up from 56% in 2012 and 53% in 2011).
Most respondents agree Howard County Public School System (HCPSS) offer the possibility of
opportunities for advancement (73%) and receive appropriate and adequate support and training (79%).
Most respondents (77%) also agree that administrators/ supervisors support them in enforcing discipline,
their planning time is respected by administrators/supervisors (83%), and they have adequate work and
storage space to prepare and do their jobs (82%). Most agree there is good teamwork among staff (78%),
non- instructional duties are equitably assigned (78%), there is open communication and trust (66%) and
they can speak openly about important issues without fear of repercussions (66%).
Respondents are divided on whether their professional development experiences are meaningful and
worthwhile (53%), student misbehavior interferes with learning (52%), and they are paid fairly (52%).
Most agree there is too much instructional time spent on administering assessments (59%), they have
adequate time during the workday to plan, prepare, and do the job (55%), and believe they are involved in
decision-making (57%).
2012-2013 HCEA Job Satisfaction Survey
2
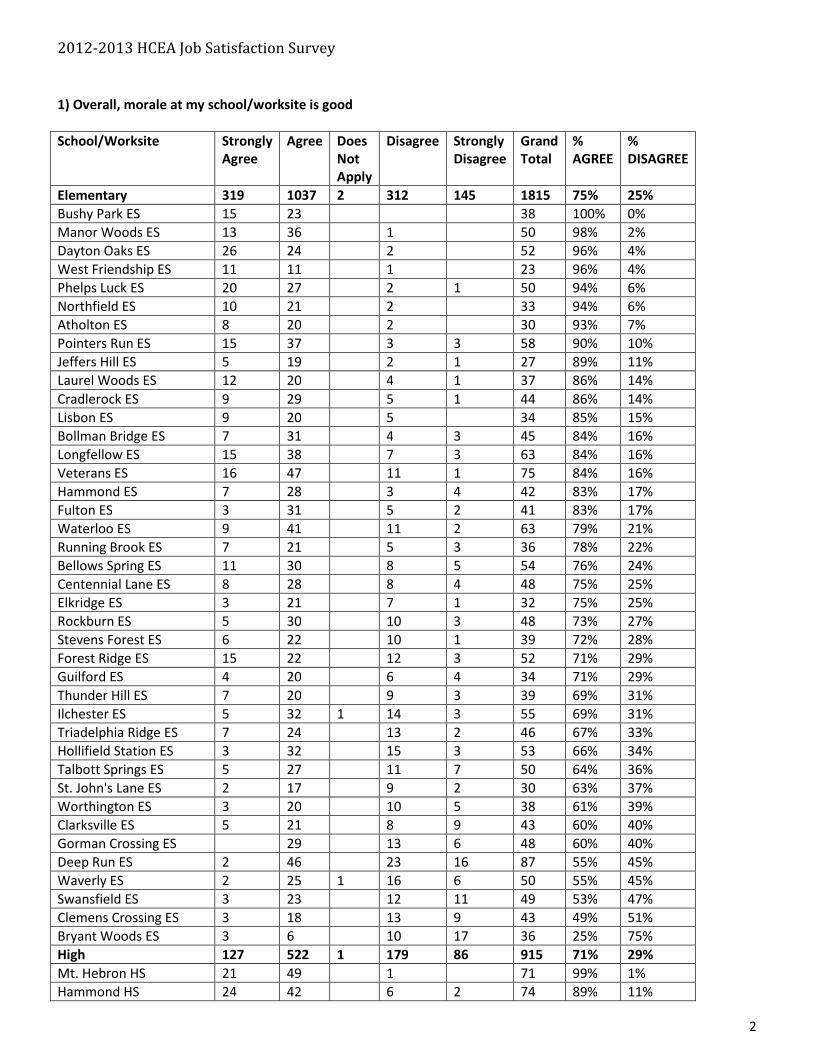
1) Overall, morale at my school/worksite is good
School/Worksite Strongly
Agree
Agree Does
Not
Apply
Disagree Strongly
Disagree
Grand
Total
%
AGREE
%
DISAGREE
Elementary 319 1037 2 312 145 1815 75% 25%
Bushy Park ES 15 23 38 100% 0%
Manor Woods ES 13 36 1 50 98% 2%
Dayton Oaks ES 26 24 2 52 96% 4%
West Friendship ES 11 11 1 23 96% 4%
Phelps Luck ES 20 27 2 1 50 94% 6%
Northfield ES 10 21 2 33 94% 6%
Atholton ES 8 20 2 30 93% 7%
Pointers Run ES 15 37 3 3 58 90% 10%
Jeffers Hill ES 5 19 2 1 27 89% 11%
Laurel Woods ES 12 20 4 1 37 86% 14%
Cradlerock ES 9 29 5 1 44 86% 14%
Lisbon ES 9 20 5 34 85% 15%
Bollman Bridge ES 7 31 4 3 45 84% 16%
Longfellow ES 15 38 7 3 63 84% 16%
Veterans ES 16 47 11 1 75 84% 16%
Hammond ES 7 28 3 4 42 83% 17%
Fulton ES 3 31 5 2 41 83% 17%
Waterloo ES 9 41 11 2 63 79% 21%
Running Brook ES 7 21 5 3 36 78% 22%
Bellows Spring ES 11 30 8 5 54 76% 24%
Centennial Lane ES 8 28 8 4 48 75% 25%
Elkridge ES 3 21 7 1 32 75% 25%
Rockburn ES 5 30 10 3 48 73% 27%
Stevens Forest ES 6 22 10 1 39 72% 28%
Forest Ridge ES 15 22 12 3 52 71% 29%
Guilford ES 4 20 6 4 34 71% 29%
Thunder Hill ES 7 20 9 3 39 69% 31%
Ilchester ES 5 32 1 14 3 55 69% 31%
Triadelphia Ridge ES 7 24 13 2 46 67% 33%
Hollifield Station ES 3 32 15 3 53 66% 34%
Talbott Springs ES 5 27 11 7 50 64% 36%
St. John's Lane ES 2 17 9 2 30 63% 37%
Worthington ES 3 20 10 5 38 61% 39%
Clarksville ES 5 21 8 9 43 60% 40%
Gorman Crossing ES 29 13 6 48 60% 40%
Deep Run ES 2 46 23 16 87 55% 45%
Waverly ES 2 25 1 16 6 50 55% 45%
Swansfield ES 3 23 12 11 49 53% 47%
Clemens Crossing ES 3 18 13 9 43 49% 51%
Bryant Woods ES 3 6 10 17 36 25% 75%
High 127 522 1 179 86 915 71% 29%
Mt. Hebron HS 21 49 1 71 99% 1%
Hammond HS 24 42 6 2 74 89% 11%
2012-2013 HCEA Job Satisfaction Survey
3
School/Worksite Strongly
Agree
Agree Does
Not
Apply
Disagree Strongly
Disagree
Grand
Total
%
AGREE
%
DISAGREE
Marriotts Ridge HS 10 41 1 6 1 59 88% 12%
Reservoir HS 13 64 11 1 89 87% 13%
Wilde Lake HS 19 48 11 3 81 83% 17%
Glenelg HS 6 36 5 5 52 81% 19%
Atholton HS 11 39 14 3 67 75% 25%
Oakland Mills HS 7 31 18 5 61 62% 38%
Howard HS 6 58 23 18 105 61% 39%
Long Reach HS 48 29 8 85 56% 44%
Centennial HS 3 38 24 19 84 49% 51%
River Hill HS 7 28 31 21 87 40% 60%
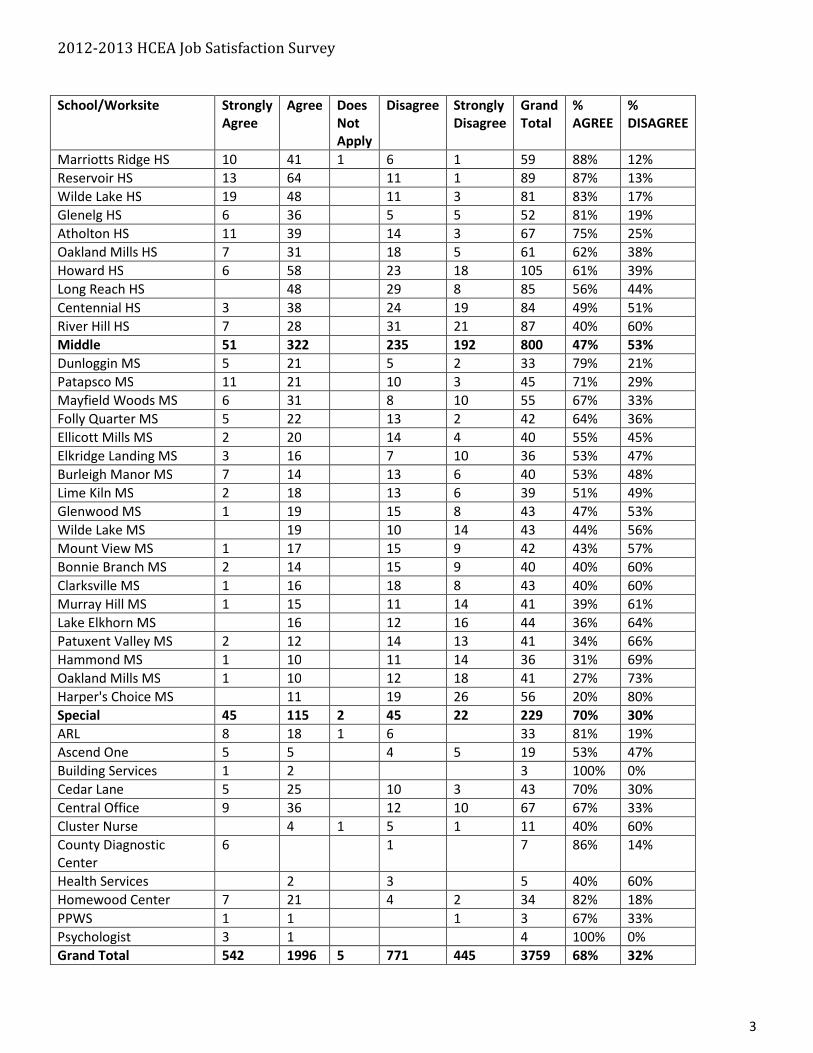
Middle 51 322 235 192 800 47% 53%
Dunloggin MS 5 21 5 2 33 79% 21%
Patapsco MS 11 21 10 3 45 71% 29%
Mayfield Woods MS 6 31 8 10 55 67% 33%
Folly Quarter MS 5 22 13 2 42 64% 36%
Ellicott Mills MS 2 20 14 4 40 55% 45%
Elkridge Landing MS 3 16 7 10 36 53% 47%
Burleigh Manor MS 7 14 13 6 40 53% 48%
Lime Kiln MS 2 18 13 6 39 51% 49%
Glenwood MS 1 19 15 8 43 47% 53%
Wilde Lake MS 19 10 14 43 44% 56%
Mount View MS 1 17 15 9 42 43% 57%
Bonnie Branch MS 2 14 15 9 40 40% 60%
Clarksville MS 1 16 18 8 43 40% 60%
Murray Hill MS 1 15 11 14 41 39% 61%
Lake Elkhorn MS 16 12 16 44 36% 64%
Patuxent Valley MS 2 12 14 13 41 34% 66%
Hammond MS 1 10 11 14 36 31% 69%
Oakland Mills MS 1 10 12 18 41 27% 73%
Harper's Choice MS 11 19 26 56 20% 80%
Special 45 115 2 45 22 229 70% 30%
ARL 8 18 1 6 33 81% 19%
Ascend One 5 5 4 5 19 53% 47%
Building Services 1 2 3 100% 0%
Cedar Lane 5 25 10 3 43 70% 30%
Central Office 9 36 12 10 67 67% 33%
Cluster Nurse 4 1 5 1 11 40% 60%
County Diagnostic
Center
6 1 7 86% 14%
Health Services 2 3 5 40% 60%
Homewood Center 7 21 4 2 34 82% 18%
PPWS 1 1 1 3 67% 33%
Psychologist 3 1 4 100% 0%
Grand Total 542 1996 5 771 445 3759 68% 32%
2012-2013 HCEA Job Satisfaction Survey
4
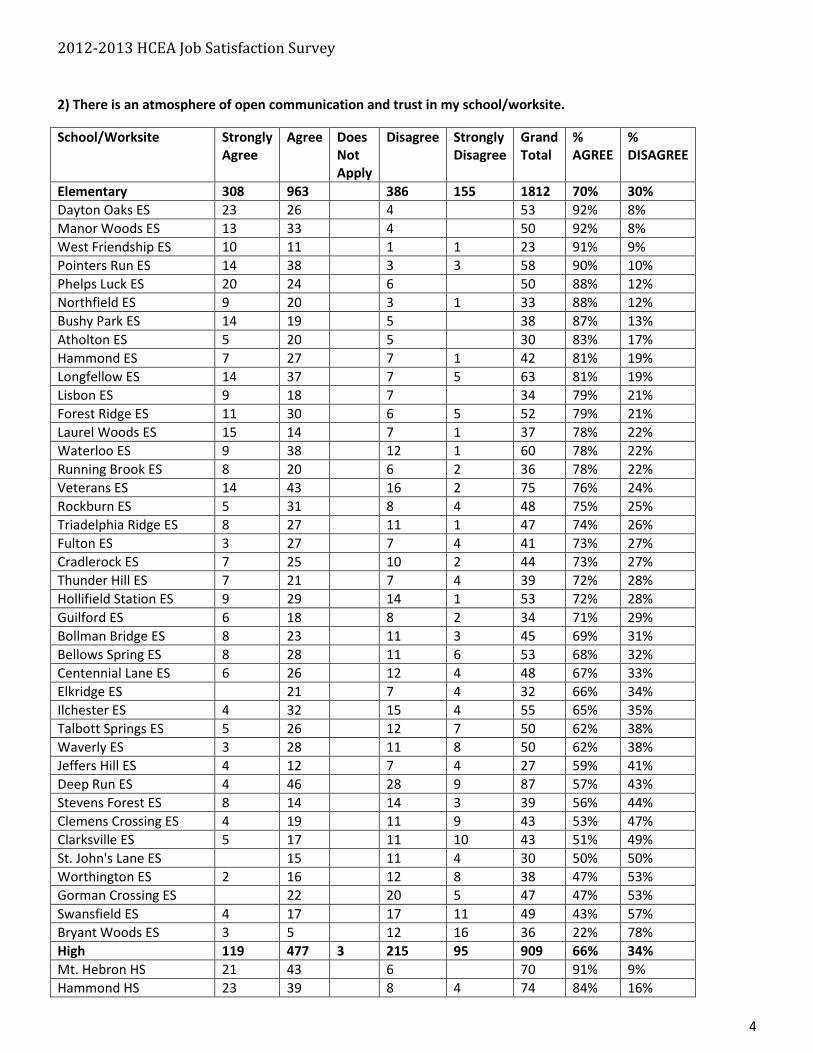
2) There is an atmosphere of open communication and trust in my school/worksite.
School/Worksite Strongly
Agree
Agree Does
Not
Apply
Disagree Strongly
Disagree
Grand
Total
%
AGREE
%
DISAGREE
Elementary 308 963 386 155 1812 70% 30%
Dayton Oaks ES 23 26 4 53 92% 8%
Manor Woods ES 13 33 4 50 92% 8%
West Friendship ES 10 11 1 1 23 91% 9%
Pointers Run ES 14 38 3 3 58 90% 10%
Phelps Luck ES 20 24 6 50 88% 12%
Northfield ES 9 20 3 1 33 88% 12%
Bushy Park ES 14 19 5 38 87% 13%
Atholton ES 5 20 5 30 83% 17%
Hammond ES 7 27 7 1 42 81% 19%
Longfellow ES 14 37 7 5 63 81% 19%
Lisbon ES 9 18 7 34 79% 21%
Forest Ridge ES 11 30 6 5 52 79% 21%
Laurel Woods ES 15 14 7 1 37 78% 22%
Waterloo ES 9 38 12 1 60 78% 22%
Running Brook ES 8 20 6 2 36 78% 22%
Veterans ES 14 43 16 2 75 76% 24%
Rockburn ES 5 31 8 4 48 75% 25%
Triadelphia Ridge ES 8 27 11 1 47 74% 26%
Fulton ES 3 27 7 4 41 73% 27%
Cradlerock ES 7 25 10 2 44 73% 27%
Thunder Hill ES 7 21 7 4 39 72% 28%
Hollifield Station ES 9 29 14 1 53 72% 28%
Guilford ES 6 18 8 2 34 71% 29%
Bollman Bridge ES 8 23 11 3 45 69% 31%
Bellows Spring ES 8 28 11 6 53 68% 32%
Centennial Lane ES 6 26 12 4 48 67% 33%
Elkridge ES 21 7 4 32 66% 34%
Ilchester ES 4 32 15 4 55 65% 35%
Talbott Springs ES 5 26 12 7 50 62% 38%
Waverly ES 3 28 11 8 50 62% 38%
Jeffers Hill ES 4 12 7 4 27 59% 41%
Deep Run ES 4 46 28 9 87 57% 43%
Stevens Forest ES 8 14 14 3 39 56% 44%
Clemens Crossing ES 4 19 11 9 43 53% 47%
Clarksville ES 5 17 11 10 43 51% 49%
St. John's Lane ES 15 11 4 30 50% 50%
Worthington ES 2 16 12 8 38 47% 53%
Gorman Crossing ES 22 20 5 47 47% 53%
Swansfield ES 4 17 17 11 49 43% 57%
Bryant Woods ES 3 5 12 16 36 22% 78%
High 119 477 3 215 95 909 66% 34%
Mt. Hebron HS 21 43 6 70 91% 9%
Hammond HS 23 39 8 4 74 84% 16%

2012-2013 HCEA Job Satisfaction Survey
5
School/Worksite Strongly
Agree
Agree Does
Not
Apply
Disagree Strongly
Disagree
Grand
Total
%
AGREE
%
DISAGREE
Marriotts Ridge HS 11 37 1 10 59 83% 17%
Glenelg HS 7 34 7 4 52 79% 21%
Wilde Lake HS 16 46 13 6 81 77% 23%
Atholton HS 9 39 16 3 67 72% 28%
Oakland Mills HS 8 36 14 4 62 71% 29%
Reservoir HS 12 46 23 6 87 67% 33%
Long Reach HS 2 46 1 24 11 84 58% 42%
Howard HS 3 46 1 34 19 103 48% 52%
River Hill HS 6 33 31 17 87 45% 55%
Centennial HS 1 32 29 21 83 40% 60%
Middle 77 353 2 234 131 797 54% 46%
Folly Quarter MS 10 27 5 42 88% 12%
Burleigh Manor MS 10 20 9 1 40 75% 25%
Dunloggin MS 4 18 9 2 33 67% 33%
Hammond MS 7 17 9 3 36 67% 33%
Patapsco MS 10 19 8 8 45 64% 36%
Elkridge Landing MS 4 18 12 2 36 61% 39%
Mayfield Woods MS 7 26 16 6 55 60% 40%
Mount View MS 6 19 11 6 42 60% 40%
Clarksville MS 2 22 10 8 42 57% 43%
Lake Elkhorn MS 4 21 13 6 44 57% 43%
Lime Kiln MS 3 18 14 3 38 55% 45%
Ellicott Mills MS 22 13 5 40 55% 45%
Glenwood MS 1 22 15 5 43 53% 47%
Wilde Lake MS 1 19 16 7 43 47% 53%
Bonnie Branch MS 4 14 14 8 40 45% 55%
Patuxent Valley MS 1 16 13 11 41 41% 59%
Oakland Mills MS 1 12 1 14 13 41 33% 68%
Murray Hill MS 1 11 1 12 15 40 31% 69%
Harper's Choice MS 1 12 21 22 56 23% 77%
Special 40 116 3 42 27 228 69% 31%
ARL 6 19 1 6 32 81% 19%
Ascend One 5 4 1 3 6 19 50% 50%
Building Services 1 2 3 100% 0%
Cedar Lane 6 23 8 6 43 67% 33%
Central Office 8 38 10 11 67 69% 31%
Cluster Nurse 1 3 1 5 1 11 40% 60%
County Diagnostic
Center
5 2 7 100% 0%
Health Services 1 4 5 20% 80%
Homewood Center 6 20 6 2 34 76% 24%
PPWS 1 1 1 3 67% 33%
Psychologist 1 3 4 100% 0%
Grand Total 544 1909 8 877 408 3746 66% 34%
2012-2013 HCEA Job Satisfaction Survey
6
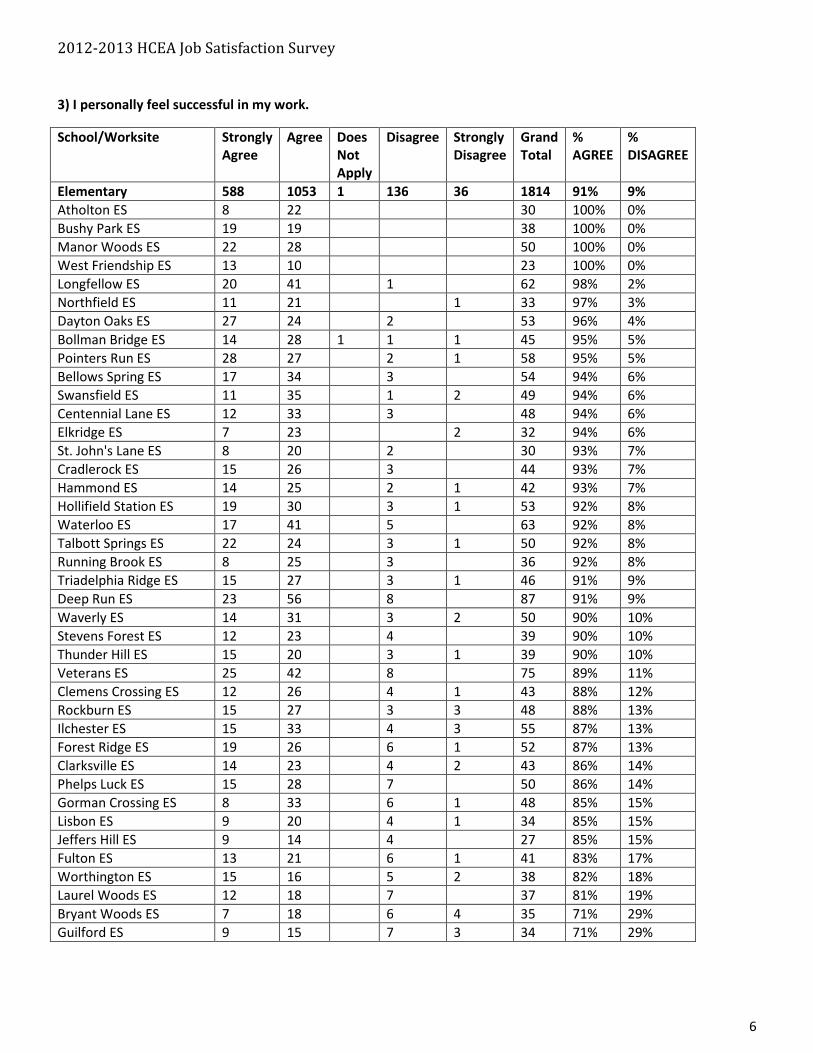
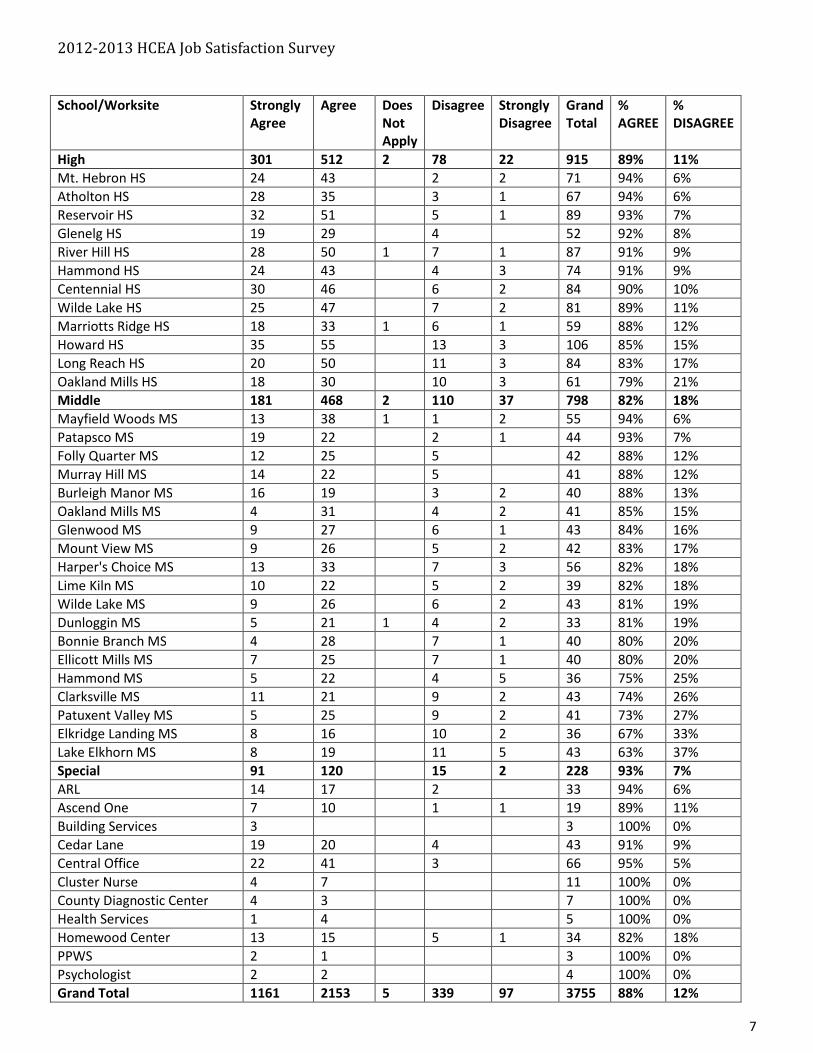
3) I personally feel successful in my work.
School/Worksite Strongly
Agree
Agree Does
Not
Apply
Disagree Strongly
Disagree
Grand
Total
%
AGREE
%
DISAGREE
Elementary 588 1053 1 136 36 1814 91% 9%
Atholton ES 8 22 30 100% 0%
Bushy Park ES 19 19 38 100% 0%
Manor Woods ES 22 28 50 100% 0%
West Friendship ES 13 10 23 100% 0%
Longfellow ES 20 41 1 62 98% 2%
Northfield ES 11 21 1 33 97% 3%
Dayton Oaks ES 27 24 2 53 96% 4%
Bollman Bridge ES 14 28 1 1 1 45 95% 5%
Pointers Run ES 28 27 2 1 58 95% 5%
Bellows Spring ES 17 34 3 54 94% 6%
Swansfield ES 11 35 1 2 49 94% 6%
Centennial Lane ES 12 33 3 48 94% 6%
Elkridge ES 7 23 2 32 94% 6%
St. John's Lane ES 8 20 2 30 93% 7%
Cradlerock ES 15 26 3 44 93% 7%
Hammond ES 14 25 2 1 42 93% 7%
Hollifield Station ES 19 30 3 1 53 92% 8%
Waterloo ES 17 41 5 63 92% 8%
Talbott Springs ES 22 24 3 1 50 92% 8%
Running Brook ES 8 25 3 36 92% 8%
Triadelphia Ridge ES 15 27 3 1 46 91% 9%
Deep Run ES 23 56 8 87 91% 9%
Waverly ES 14 31 3 2 50 90% 10%
Stevens Forest ES 12 23 4 39 90% 10%
Thunder Hill ES 15 20 3 1 39 90% 10%
Veterans ES 25 42 8 75 89% 11%
Clemens Crossing ES 12 26 4 1 43 88% 12%
Rockburn ES 15 27 3 3 48 88% 13%
Ilchester ES 15 33 4 3 55 87% 13%
Forest Ridge ES 19 26 6 1 52 87% 13%
Clarksville ES 14 23 4 2 43 86% 14%
Phelps Luck ES 15 28 7 50 86% 14%
Gorman Crossing ES 8 33 6 1 48 85% 15%
Lisbon ES 9 20 4 1 34 85% 15%
Jeffers Hill ES 9 14 4 27 85% 15%
Fulton ES 13 21 6 1 41 83% 17%
Worthington ES 15 16 5 2 38 82% 18%
Laurel Woods ES 12 18 7 37 81% 19%
Bryant Woods ES 7 18 6 4 35 71% 29%
Guilford ES 9 15 7 3 34 71% 29%
2012-2013 HCEA Job Satisfaction Survey
7
School/Worksite Strongly
Agree
Agree Does
Not
Apply
Disagree Strongly
Disagree
Grand
Total
%
AGREE
%
DISAGREE
High 301 512 2 78 22 915 89% 11%
Mt. Hebron HS 24 43 2 2 71 94% 6%
Atholton HS 28 35 3 1 67 94% 6%
Reservoir HS 32 51 5 1 89 93% 7%
Glenelg HS 19 29 4 52 92% 8%
River Hill HS 28 50 1 7 1 87 91% 9%
Hammond HS 24 43 4 3 74 91% 9%
Centennial HS 30 46 6 2 84 90% 10%
Wilde Lake HS 25 47 7 2 81 89% 11%
Marriotts Ridge HS 18 33 1 6 1 59 88% 12%
Howard HS 35 55 13 3 106 85% 15%
Long Reach HS 20 50 11 3 84 83% 17%
Oakland Mills HS 18 30 10 3 61 79% 21%
Middle 181 468 2 110 37 798 82% 18%
Mayfield Woods MS 13 38 1 1 2 55 94% 6%
Patapsco MS 19 22 2 1 44 93% 7%
Folly Quarter MS 12 25 5 42 88% 12%
Murray Hill MS 14 22 5 41 88% 12%
Burleigh Manor MS 16 19 3 2 40 88% 13%
Oakland Mills MS 4 31 4 2 41 85% 15%
Glenwood MS 9 27 6 1 43 84% 16%
Mount View MS 9 26 5 2 42 83% 17%
Harper's Choice MS 13 33 7 3 56 82% 18%
Lime Kiln MS 10 22 5 2 39 82% 18%
Wilde Lake MS 9 26 6 2 43 81% 19%
Dunloggin MS 5 21 1 4 2 33 81% 19%
Bonnie Branch MS 4 28 7 1 40 80% 20%
Ellicott Mills MS 7 25 7 1 40 80% 20%
Hammond MS 5 22 4 5 36 75% 25%
Clarksville MS 11 21 9 2 43 74% 26%
Patuxent Valley MS 5 25 9 2 41 73% 27%
Elkridge Landing MS 8 16 10 2 36 67% 33%
Lake Elkhorn MS 8 19 11 5 43 63% 37%
Special 91 120 15 2 228 93% 7%
ARL 14 17 2 33 94% 6%
Ascend One 7 10 1 1 19 89% 11%
Building Services 3 3 100% 0%
Cedar Lane 19 20 4 43 91% 9%
Central Office 22 41 3 66 95% 5%
Cluster Nurse 4 7 11 100% 0%
County Diagnostic Center 4 3 7 100% 0%
Health Services 1 4 5 100% 0%
Homewood Center 13 15 5 1 34 82% 18%
PPWS 2 1 3 100% 0%
Psychologist 2 2 4 100% 0%
Grand Total 1161 2153 5 339 97 3755 88% 12%
2012-2013 HCEA Job Satisfaction Survey
8
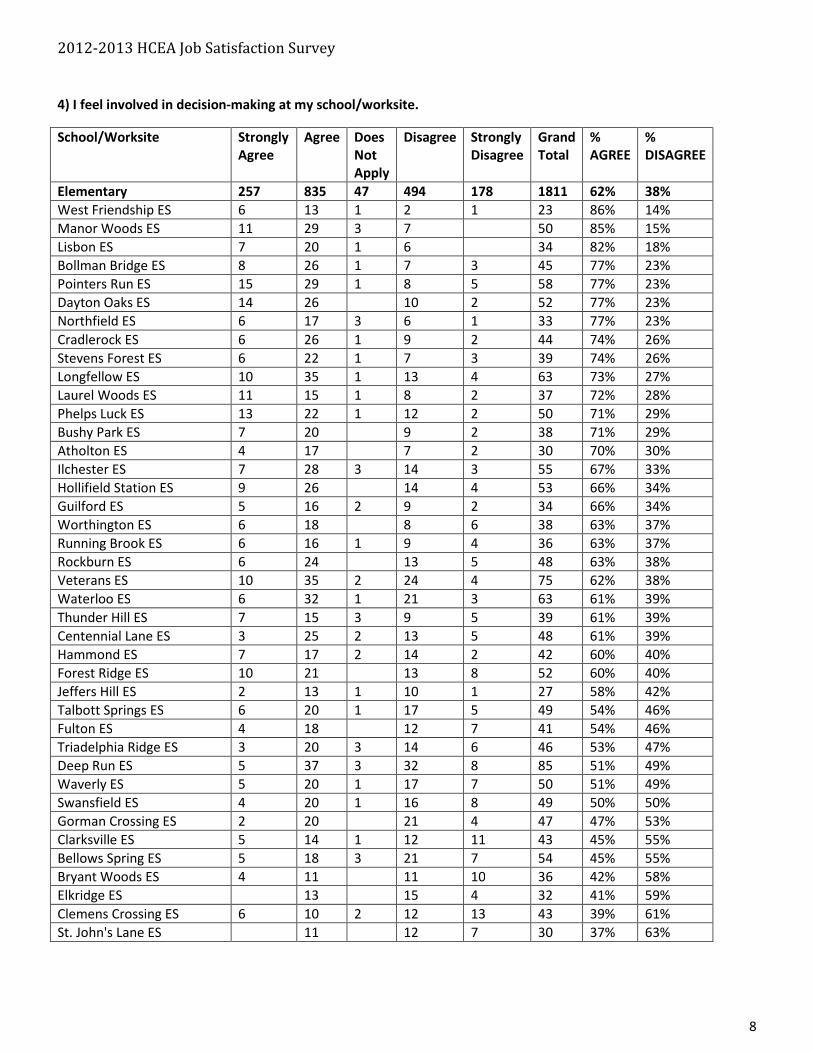
4) I feel involved in decision-making at my school/worksite.
School/Worksite Strongly
Agree
Agree Does
Not
Apply
Disagree Strongly
Disagree
Grand
Total
%
AGREE
%
DISAGREE
Elementary 257 835 47 494 178 1811 62% 38%
West Friendship ES 6 13 1 2 1 23 86% 14%
Manor Woods ES 11 29 3 7 50 85% 15%
Lisbon ES 7 20 1 6 34 82% 18%
Bollman Bridge ES 8 26 1 7 3 45 77% 23%
Pointers Run ES 15 29 1 8 5 58 77% 23%
Dayton Oaks ES 14 26 10 2 52 77% 23%
Northfield ES 6 17 3 6 1 33 77% 23%
Cradlerock ES 6 26 1 9 2 44 74% 26%
Stevens Forest ES 6 22 1 7 3 39 74% 26%
Longfellow ES 10 35 1 13 4 63 73% 27%
Laurel Woods ES 11 15 1 8 2 37 72% 28%
Phelps Luck ES 13 22 1 12 2 50 71% 29%
Bushy Park ES 7 20 9 2 38 71% 29%
Atholton ES 4 17 7 2 30 70% 30%
Ilchester ES 7 28 3 14 3 55 67% 33%
Hollifield Station ES 9 26 14 4 53 66% 34%
Guilford ES 5 16 2 9 2 34 66% 34%
Worthington ES 6 18 8 6 38 63% 37%
Running Brook ES 6 16 1 9 4 36 63% 37%
Rockburn ES 6 24 13 5 48 63% 38%
Veterans ES 10 35 2 24 4 75 62% 38%
Waterloo ES 6 32 1 21 3 63 61% 39%
Thunder Hill ES 7 15 3 9 5 39 61% 39%
Centennial Lane ES 3 25 2 13 5 48 61% 39%
Hammond ES 7 17 2 14 2 42 60% 40%
Forest Ridge ES 10 21 13 8 52 60% 40%
Jeffers Hill ES 2 13 1 10 1 27 58% 42%
Talbott Springs ES 6 20 1 17 5 49 54% 46%
Fulton ES 4 18 12 7 41 54% 46%
Triadelphia Ridge ES 3 20 3 14 6 46 53% 47%
Deep Run ES 5 37 3 32 8 85 51% 49%
Waverly ES 5 20 1 17 7 50 51% 49%
Swansfield ES 4 20 1 16 8 49 50% 50%
Gorman Crossing ES 2 20 21 4 47 47% 53%
Clarksville ES 5 14 1 12 11 43 45% 55%
Bellows Spring ES 5 18 3 21 7 54 45% 55%
Bryant Woods ES 4 11 11 10 36 42% 58%
Elkridge ES 13 15 4 32 41% 59%
Clemens Crossing ES 6 10 2 12 13 43 39% 61%
St. John's Lane ES 11 12 7 30 37% 63%
2012-2013 HCEA Job Satisfaction Survey
9
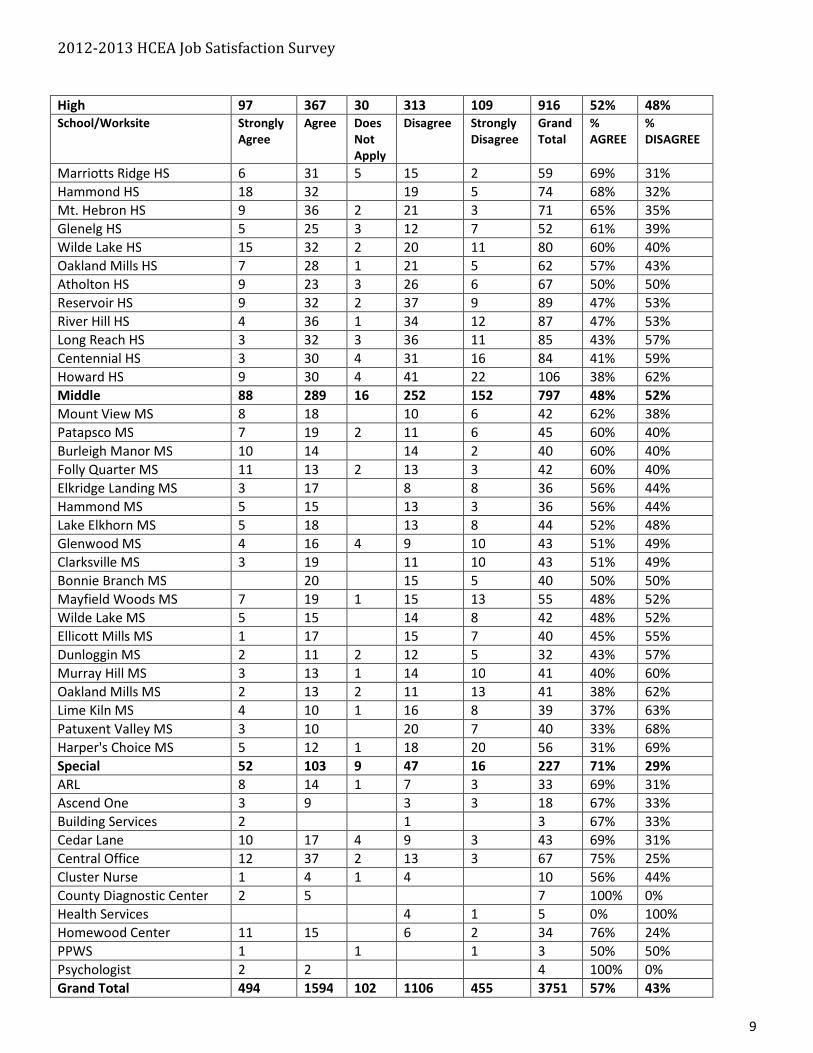
High 97 367 30 313 109 916 52% 48%
School/Worksite Strongly
Agree
Agree Does
Not
Apply
Disagree Strongly
Disagree
Grand
Total
%
AGREE
%
DISAGREE
Marriotts Ridge HS 6 31 5 15 2 59 69% 31%
Hammond HS 18 32 19 5 74 68% 32%
Mt. Hebron HS 9 36 2 21 3 71 65% 35%
Glenelg HS 5 25 3 12 7 52 61% 39%
Wilde Lake HS 15 32 2 20 11 80 60% 40%
Oakland Mills HS 7 28 1 21 5 62 57% 43%
Atholton HS 9 23 3 26 6 67 50% 50%
Reservoir HS 9 32 2 37 9 89 47% 53%
River Hill HS 4 36 1 34 12 87 47% 53%
Long Reach HS 3 32 3 36 11 85 43% 57%
Centennial HS 3 30 4 31 16 84 41% 59%
Howard HS 9 30 4 41 22 106 38% 62%
Middle 88 289 16 252 152 797 48% 52%
Mount View MS 8 18 10 6 42 62% 38%
Patapsco MS 7 19 2 11 6 45 60% 40%
Burleigh Manor MS 10 14 14 2 40 60% 40%
Folly Quarter MS 11 13 2 13 3 42 60% 40%
Elkridge Landing MS 3 17 8 8 36 56% 44%
Hammond MS 5 15 13 3 36 56% 44%
Lake Elkhorn MS 5 18 13 8 44 52% 48%
Glenwood MS 4 16 4 9 10 43 51% 49%
Clarksville MS 3 19 11 10 43 51% 49%
Bonnie Branch MS 20 15 5 40 50% 50%
Mayfield Woods MS 7 19 1 15 13 55 48% 52%
Wilde Lake MS 5 15 14 8 42 48% 52%
Ellicott Mills MS 1 17 15 7 40 45% 55%
Dunloggin MS 2 11 2 12 5 32 43% 57%
Murray Hill MS 3 13 1 14 10 41 40% 60%
Oakland Mills MS 2 13 2 11 13 41 38% 62%
Lime Kiln MS 4 10 1 16 8 39 37% 63%
Patuxent Valley MS 3 10 20 7 40 33% 68%
Harper's Choice MS 5 12 1 18 20 56 31% 69%
Special 52 103 9 47 16 227 71% 29%
ARL 8 14 1 7 3 33 69% 31%
Ascend One 3 9 3 3 18 67% 33%
Building Services 2 1 3 67% 33%
Cedar Lane 10 17 4 9 3 43 69% 31%
Central Office 12 37 2 13 3 67 75% 25%
Cluster Nurse 1 4 1 4 10 56% 44%
County Diagnostic Center 2 5 7 100% 0%
Health Services 4 1 5 0% 100%
Homewood Center 11 15 6 2 34 76% 24%
PPWS 1 1 1 3 50% 50%
Psychologist 2 2 4 100% 0%
Grand Total 494 1594 102 1106 455 3751 57% 43%
2012-2013 HCEA Job Satisfaction Survey
10
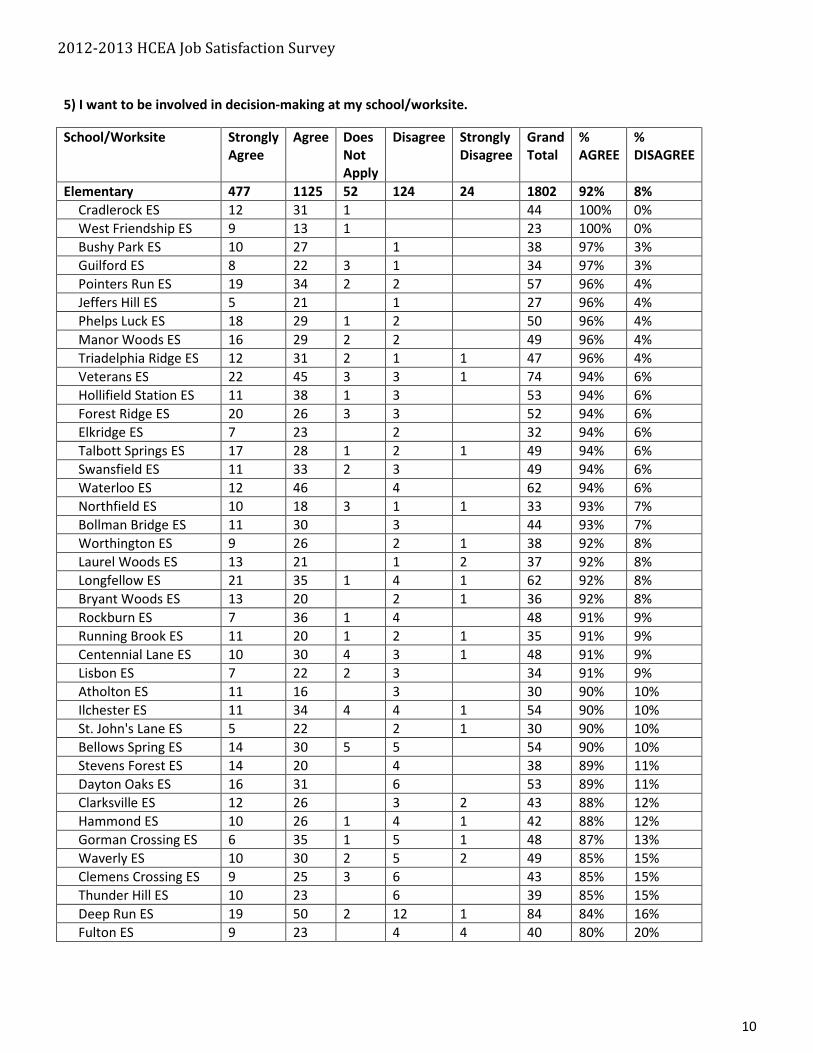
5) I want to be involved in decision-making at my school/worksite.
School/Worksite Strongly
Agree
Agree Does
Not
Apply
Disagree Strongly
Disagree
Grand
Total
%
AGREE
%
DISAGREE
Elementary 477 1125 52 124 24 1802 92% 8%
Cradlerock ES 12 31 1 44 100% 0%
West Friendship ES 9 13 1 23 100% 0%
Bushy Park ES 10 27 1 38 97% 3%
Guilford ES 8 22 3 1 34 97% 3%
Pointers Run ES 19 34 2 2 57 96% 4%
Jeffers Hill ES 5 21 1 27 96% 4%
Phelps Luck ES 18 29 1 2 50 96% 4%
Manor Woods ES 16 29 2 2 49 96% 4%
Triadelphia Ridge ES 12 31 2 1 1 47 96% 4%
Veterans ES 22 45 3 3 1 74 94% 6%
Hollifield Station ES 11 38 1 3 53 94% 6%
Forest Ridge ES 20 26 3 3 52 94% 6%
Elkridge ES 7 23 2 32 94% 6%
Talbott Springs ES 17 28 1 2 1 49 94% 6%
Swansfield ES 11 33 2 3 49 94% 6%
Waterloo ES 12 46 4 62 94% 6%
Northfield ES 10 18 3 1 1 33 93% 7%
Bollman Bridge ES 11 30 3 44 93% 7%
Worthington ES 9 26 2 1 38 92% 8%
Laurel Woods ES 13 21 1 2 37 92% 8%
Longfellow ES 21 35 1 4 1 62 92% 8%
Bryant Woods ES 13 20 2 1 36 92% 8%
Rockburn ES 7 36 1 4 48 91% 9%
Running Brook ES 11 20 1 2 1 35 91% 9%
Centennial Lane ES 10 30 4 3 1 48 91% 9%
Lisbon ES 7 22 2 3 34 91% 9%
Atholton ES 11 16 3 30 90% 10%
Ilchester ES 11 34 4 4 1 54 90% 10%
St. John's Lane ES 5 22 2 1 30 90% 10%
Bellows Spring ES 14 30 5 5 54 90% 10%
Stevens Forest ES 14 20 4 38 89% 11%
Dayton Oaks ES 16 31 6 53 89% 11%
Clarksville ES 12 26 3 2 43 88% 12%
Hammond ES 10 26 1 4 1 42 88% 12%
Gorman Crossing ES 6 35 1 5 1 48 87% 13%
Waverly ES 10 30 2 5 2 49 85% 15%
Clemens Crossing ES 9 25 3 6 43 85% 15%
Thunder Hill ES 10 23 6 39 85% 15%
Deep Run ES 19 50 2 12 1 84 84% 16%
Fulton ES 9 23 4 4 40 80% 20%

2012-2013 HCEA Job Satisfaction Survey
11
School/Worksite Strongly
Agree
Agree Does
Not
Apply
Disagree Strongly
Disagree
Grand
Total
%
AGREE
%
DISAGREE
High 202 563 32 92 22 911 87% 13%
Centennial HS 22 53 2 6 83 93% 7%
Oakland Mills HS 13 43 3 2 61 92% 8%
Mt. Hebron HS 17 44 3 5 1 70 91% 9%
Wilde Lake HS 21 48 3 7 1 80 90% 10%
Atholton HS 14 46 6 1 67 90% 10%
Hammond HS 22 41 7 3 73 86% 14%
Howard HS 25 62 5 11 3 106 86% 14%
Marriotts Ridge HS 11 34 6 7 1 59 85% 15%
Reservoir HS 18 55 3 9 4 89 85% 15%
Long Reach HS 15 53 3 10 4 85 83% 17%
River Hill HS 12 56 4 13 1 86 83% 17%
Glenelg HS 12 28 3 8 1 52 82% 18%
Middle 192 493 27 70 13 795 89% 11%
Harper's Choice MS 16 38 2 56 96% 4%
Mayfield Woods MS 8 43 2 2 55 96% 4%
Folly Quarter MS 13 25 2 2 42 95% 5%
Burleigh Manor MS 13 23 2 2 40 95% 5%
Elkridge Landing MS 13 21 1 1 36 94% 6%
Hammond MS 8 25 2 35 94% 6%
Clarksville MS 11 29 2 1 43 93% 7%
Lake Elkhorn MS 9 30 2 3 44 93% 7%
Oakland Mills MS 9 27 2 2 1 41 92% 8%
Dunloggin MS 9 18 3 2 1 33 90% 10%
Glenwood MS 10 26 2 5 43 88% 12%
Ellicott Mills MS 11 24 5 40 88% 13%
Mount View MS 8 26 2 3 2 41 87% 13%
Patuxent Valley MS 6 28 4 1 39 87% 13%
Murray Hill MS 12 21 3 4 1 41 87% 13%
Bonnie Branch MS 8 24 1 6 1 40 82% 18%
Lime Kiln MS 7 24 1 7 39 82% 18%
Patapsco MS 11 22 3 7 2 45 79% 21%
Wilde Lake MS 10 19 2 9 2 42 73% 28%
Special 88 117 9 14 1 229 93% 7%
ARL 11 20 2 33 94% 6%
Ascend One 8 9 2 19 89% 11%
Building Services 3 3 100% 0%
Cedar Lane 18 20 3 1 1 43 95% 5%
Central Office 23 36 4 4 67 94% 6%
Cluster Nurse 4 4 1 2 11 80% 20%
County Diagnostic Center 4 3 7 100% 0%
Health Services 1 4 5 100% 0%
Homewood Center 12 18 1 3 34 91% 9%
PPWS 2 1 3 100% 0%
Psychologist 2 2 4 100% 0%
Grand Total 959 2298 120 300 60 3737 90% 10%
2012-2013 HCEA Job Satisfaction Survey
12
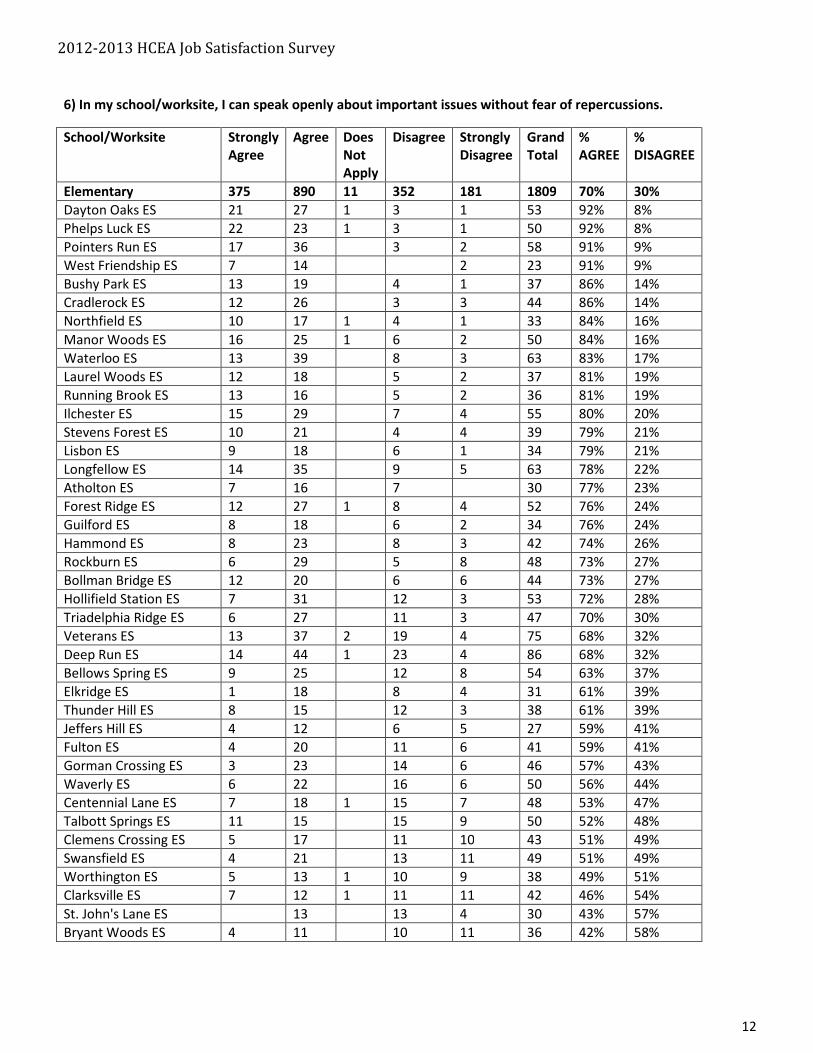
6) In my school/worksite, I can speak openly about important issues without fear of repercussions.
School/Worksite Strongly
Agree
Agree Does
Not
Apply
Disagree Strongly
Disagree
Grand
Total
%
AGREE
%
DISAGREE
Elementary 375 890 11 352 181 1809 70% 30%
Dayton Oaks ES 21 27 1 3 1 53 92% 8%
Phelps Luck ES 22 23 1 3 1 50 92% 8%
Pointers Run ES 17 36 3 2 58 91% 9%
West Friendship ES 7 14 2 23 91% 9%
Bushy Park ES 13 19 4 1 37 86% 14%
Cradlerock ES 12 26 3 3 44 86% 14%
Northfield ES 10 17 1 4 1 33 84% 16%
Manor Woods ES 16 25 1 6 2 50 84% 16%
Waterloo ES 13 39 8 3 63 83% 17%
Laurel Woods ES 12 18 5 2 37 81% 19%
Running Brook ES 13 16 5 2 36 81% 19%
Ilchester ES 15 29 7 4 55 80% 20%
Stevens Forest ES 10 21 4 4 39 79% 21%
Lisbon ES 9 18 6 1 34 79% 21%
Longfellow ES 14 35 9 5 63 78% 22%
Atholton ES 7 16 7 30 77% 23%
Forest Ridge ES 12 27 1 8 4 52 76% 24%
Guilford ES 8 18 6 2 34 76% 24%
Hammond ES 8 23 8 3 42 74% 26%
Rockburn ES 6 29 5 8 48 73% 27%
Bollman Bridge ES 12 20 6 6 44 73% 27%
Hollifield Station ES 7 31 12 3 53 72% 28%
Triadelphia Ridge ES 6 27 11 3 47 70% 30%
Veterans ES 13 37 2 19 4 75 68% 32%
Deep Run ES 14 44 1 23 4 86 68% 32%
Bellows Spring ES 9 25 12 8 54 63% 37%
Elkridge ES 1 18 8 4 31 61% 39%
Thunder Hill ES 8 15 12 3 38 61% 39%
Jeffers Hill ES 4 12 6 5 27 59% 41%
Fulton ES 4 20 11 6 41 59% 41%
Gorman Crossing ES 3 23 14 6 46 57% 43%
Waverly ES 6 22 16 6 50 56% 44%
Centennial Lane ES 7 18 1 15 7 48 53% 47%
Talbott Springs ES 11 15 15 9 50 52% 48%
Clemens Crossing ES 5 17 11 10 43 51% 49%
Swansfield ES 4 21 13 11 49 51% 49%
Worthington ES 5 13 1 10 9 38 49% 51%
Clarksville ES 7 12 1 11 11 42 46% 54%
St. John's Lane ES 13 13 4 30 43% 57%
Bryant Woods ES 4 11 10 11 36 42% 58%
2012-2013 HCEA Job Satisfaction Survey
13
School/Worksite Strongly
Agree
Agree Does
Not
Apply
Disagree Strongly
Disagree
Grand
Total
%
AGREE
%
DISAGREE
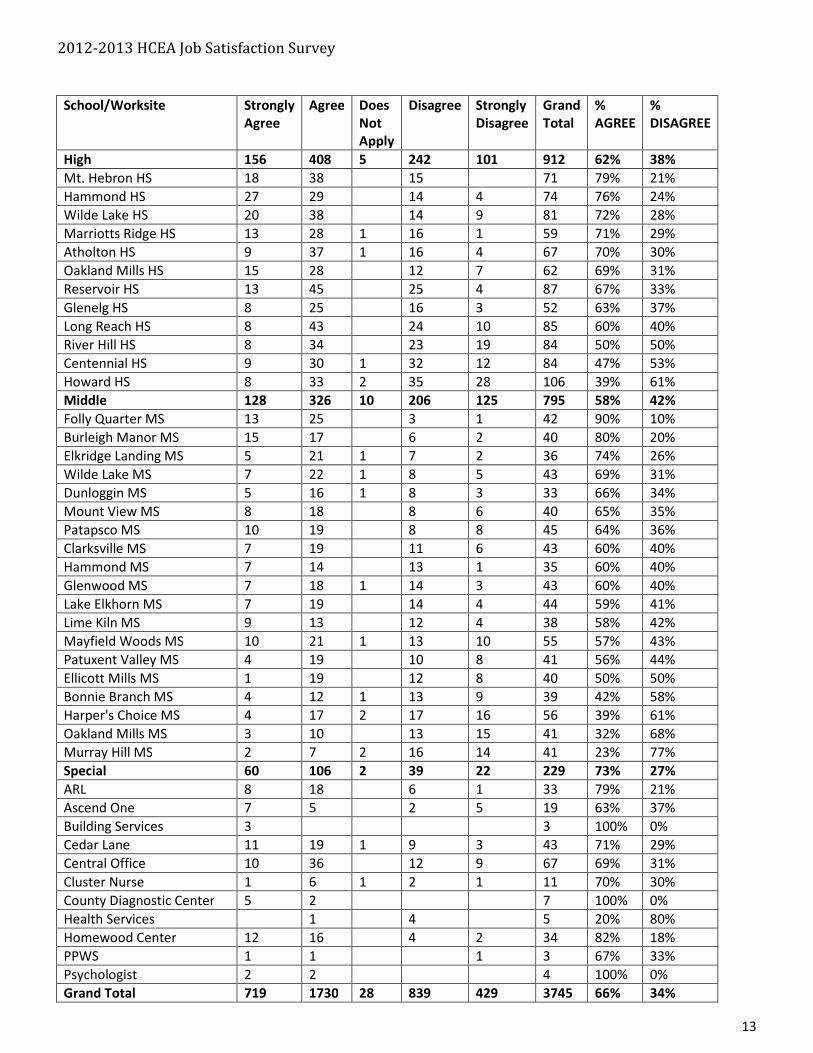
High 156 408 5 242 101 912 62% 38%
Mt. Hebron HS 18 38 15 71 79% 21%
Hammond HS 27 29 14 4 74 76% 24%
Wilde Lake HS 20 38 14 9 81 72% 28%
Marriotts Ridge HS 13 28 1 16 1 59 71% 29%
Atholton HS 9 37 1 16 4 67 70% 30%
Oakland Mills HS 15 28 12 7 62 69% 31%
Reservoir HS 13 45 25 4 87 67% 33%
Glenelg HS 8 25 16 3 52 63% 37%
Long Reach HS 8 43 24 10 85 60% 40%
River Hill HS 8 34 23 19 84 50% 50%
Centennial HS 9 30 1 32 12 84 47% 53%
Howard HS 8 33 2 35 28 106 39% 61%
Middle 128 326 10 206 125 795 58% 42%
Folly Quarter MS 13 25 3 1 42 90% 10%
Burleigh Manor MS 15 17 6 2 40 80% 20%
Elkridge Landing MS 5 21 1 7 2 36 74% 26%
Wilde Lake MS 7 22 1 8 5 43 69% 31%
Dunloggin MS 5 16 1 8 3 33 66% 34%
Mount View MS 8 18 8 6 40 65% 35%
Patapsco MS 10 19 8 8 45 64% 36%
Clarksville MS 7 19 11 6 43 60% 40%
Hammond MS 7 14 13 1 35 60% 40%
Glenwood MS 7 18 1 14 3 43 60% 40%
Lake Elkhorn MS 7 19 14 4 44 59% 41%
Lime Kiln MS 9 13 12 4 38 58% 42%
Mayfield Woods MS 10 21 1 13 10 55 57% 43%
Patuxent Valley MS 4 19 10 8 41 56% 44%
Ellicott Mills MS 1 19 12 8 40 50% 50%
Bonnie Branch MS 4 12 1 13 9 39 42% 58%
Harper's Choice MS 4 17 2 17 16 56 39% 61%
Oakland Mills MS 3 10 13 15 41 32% 68%
Murray Hill MS 2 7 2 16 14 41 23% 77%
Special 60 106 2 39 22 229 73% 27%
ARL 8 18 6 1 33 79% 21%
Ascend One 7 5 2 5 19 63% 37%
Building Services 3 3 100% 0%
Cedar Lane 11 19 1 9 3 43 71% 29%
Central Office 10 36 12 9 67 69% 31%
Cluster Nurse 1 6 1 2 1 11 70% 30%
County Diagnostic Center 5 2 7 100% 0%
Health Services 1 4 5 20% 80%
Homewood Center 12 16 4 2 34 82% 18%
PPWS 1 1 1 3 67% 33%
Psychologist 2 2 4 100% 0%
Grand Total 719 1730 28 839 429 3745 66% 34%
2012-2013 HCEA Job Satisfaction Survey
14
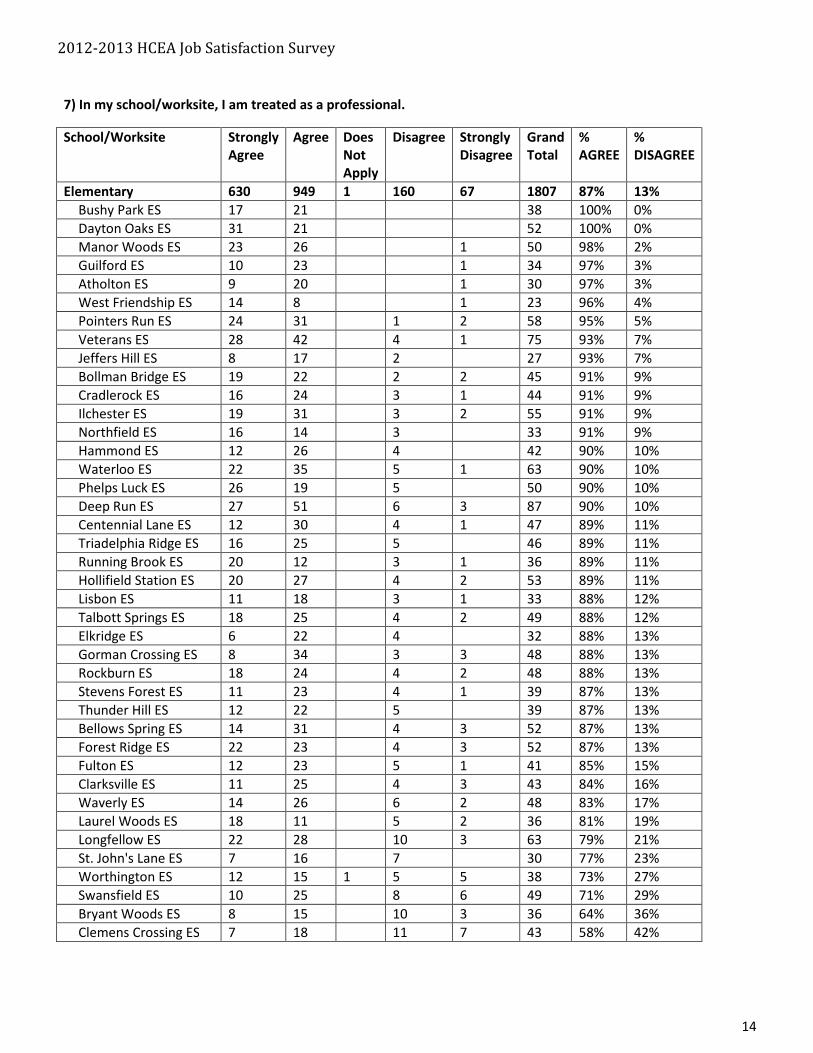
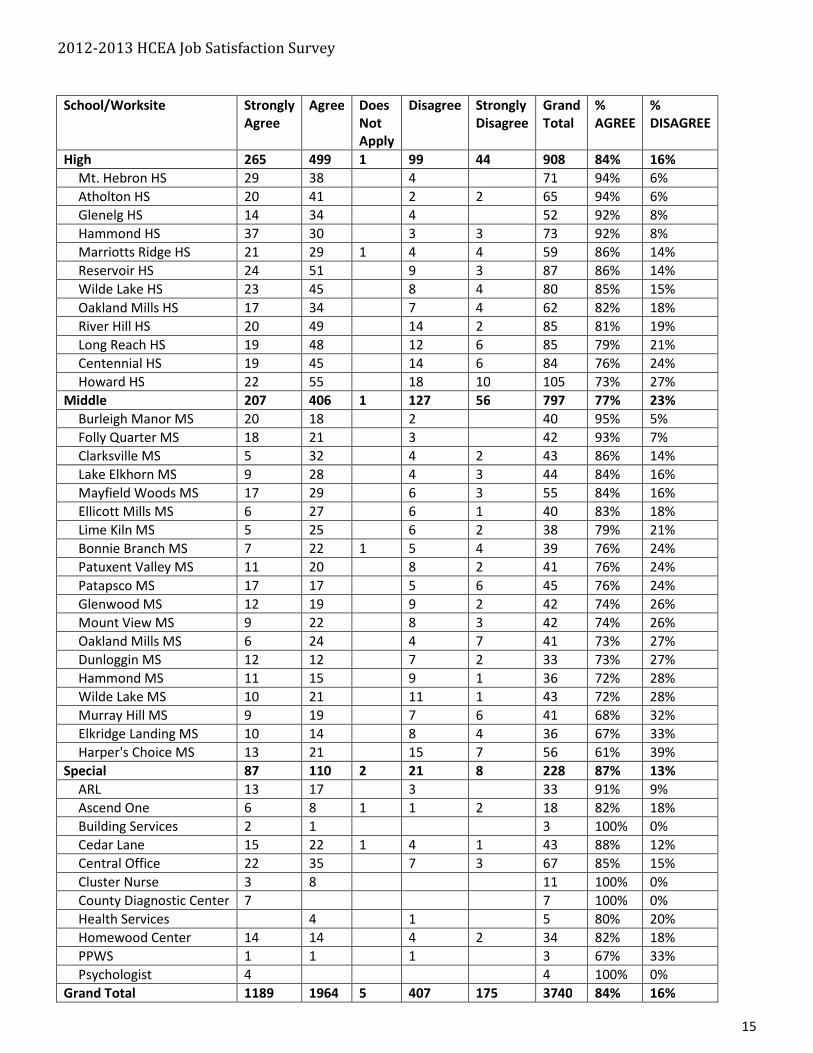
7) In my school/worksite, I am treated as a professional.
School/Worksite Strongly
Agree
Agree Does
Not
Apply
Disagree Strongly
Disagree
Grand
Total
%
AGREE
%
DISAGREE
Elementary 630 949 1 160 67 1807 87% 13%
Bushy Park ES 17 21 38 100% 0%
Dayton Oaks ES 31 21 52 100% 0%
Manor Woods ES 23 26 1 50 98% 2%
Guilford ES 10 23 1 34 97% 3%
Atholton ES 9 20 1 30 97% 3%
West Friendship ES 14 8 1 23 96% 4%
Pointers Run ES 24 31 1 2 58 95% 5%
Veterans ES 28 42 4 1 75 93% 7%
Jeffers Hill ES 8 17 2 27 93% 7%
Bollman Bridge ES 19 22 2 2 45 91% 9%
Cradlerock ES 16 24 3 1 44 91% 9%
Ilchester ES 19 31 3 2 55 91% 9%
Northfield ES 16 14 3 33 91% 9%
Hammond ES 12 26 4 42 90% 10%
Waterloo ES 22 35 5 1 63 90% 10%
Phelps Luck ES 26 19 5 50 90% 10%
Deep Run ES 27 51 6 3 87 90% 10%
Centennial Lane ES 12 30 4 1 47 89% 11%
Triadelphia Ridge ES 16 25 5 46 89% 11%
Running Brook ES 20 12 3 1 36 89% 11%
Hollifield Station ES 20 27 4 2 53 89% 11%
Lisbon ES 11 18 3 1 33 88% 12%
Talbott Springs ES 18 25 4 2 49 88% 12%
Elkridge ES 6 22 4 32 88% 13%
Gorman Crossing ES 8 34 3 3 48 88% 13%
Rockburn ES 18 24 4 2 48 88% 13%
Stevens Forest ES 11 23 4 1 39 87% 13%
Thunder Hill ES 12 22 5 39 87% 13%
Bellows Spring ES 14 31 4 3 52 87% 13%
Forest Ridge ES 22 23 4 3 52 87% 13%
Fulton ES 12 23 5 1 41 85% 15%
Clarksville ES 11 25 4 3 43 84% 16%
Waverly ES 14 26 6 2 48 83% 17%
Laurel Woods ES 18 11 5 2 36 81% 19%
Longfellow ES 22 28 10 3 63 79% 21%
St. John's Lane ES 7 16 7 30 77% 23%
Worthington ES 12 15 1 5 5 38 73% 27%
Swansfield ES 10 25 8 6 49 71% 29%
Bryant Woods ES 8 15 10 3 36 64% 36%
Clemens Crossing ES 7 18 11 7 43 58% 42%
2012-2013 HCEA Job Satisfaction Survey
15
School/Worksite Strongly
Agree
Agree Does
Not
Apply
Disagree Strongly
Disagree
Grand
Total
%
AGREE
%
DISAGREE
High 265 499 1 99 44 908 84% 16%
Mt. Hebron HS 29 38 4 71 94% 6%
Atholton HS 20 41 2 2 65 94% 6%
Glenelg HS 14 34 4 52 92% 8%
Hammond HS 37 30 3 3 73 92% 8%
Marriotts Ridge HS 21 29 1 4 4 59 86% 14%
Reservoir HS 24 51 9 3 87 86% 14%
Wilde Lake HS 23 45 8 4 80 85% 15%
Oakland Mills HS 17 34 7 4 62 82% 18%
River Hill HS 20 49 14 2 85 81% 19%
Long Reach HS 19 48 12 6 85 79% 21%
Centennial HS 19 45 14 6 84 76% 24%
Howard HS 22 55 18 10 105 73% 27%
Middle 207 406 1 127 56 797 77% 23%
Burleigh Manor MS 20 18 2 40 95% 5%
Folly Quarter MS 18 21 3 42 93% 7%
Clarksville MS 5 32 4 2 43 86% 14%
Lake Elkhorn MS 9 28 4 3 44 84% 16%
Mayfield Woods MS 17 29 6 3 55 84% 16%
Ellicott Mills MS 6 27 6 1 40 83% 18%
Lime Kiln MS 5 25 6 2 38 79% 21%
Bonnie Branch MS 7 22 1 5 4 39 76% 24%
Patuxent Valley MS 11 20 8 2 41 76% 24%
Patapsco MS 17 17 5 6 45 76% 24%
Glenwood MS 12 19 9 2 42 74% 26%
Mount View MS 9 22 8 3 42 74% 26%
Oakland Mills MS 6 24 4 7 41 73% 27%
Dunloggin MS 12 12 7 2 33 73% 27%
Hammond MS 11 15 9 1 36 72% 28%
Wilde Lake MS 10 21 11 1 43 72% 28%
Murray Hill MS 9 19 7 6 41 68% 32%
Elkridge Landing MS 10 14 8 4 36 67% 33%
Harper's Choice MS 13 21 15 7 56 61% 39%
Special 87 110 2 21 8 228 87% 13%
ARL 13 17 3 33 91% 9%
Ascend One 6 8 1 1 2 18 82% 18%
Building Services 2 1 3 100% 0%
Cedar Lane 15 22 1 4 1 43 88% 12%
Central Office 22 35 7 3 67 85% 15%
Cluster Nurse 3 8 11 100% 0%
County Diagnostic Center 7 7 100% 0%
Health Services 4 1 5 80% 20%
Homewood Center 14 14 4 2 34 82% 18%
PPWS 1 1 1 3 67% 33%
Psychologist 4 4 100% 0%
Grand Total 1189 1964 5 407 175 3740 84% 16%
2012-2013 HCEA Job Satisfaction Survey
16
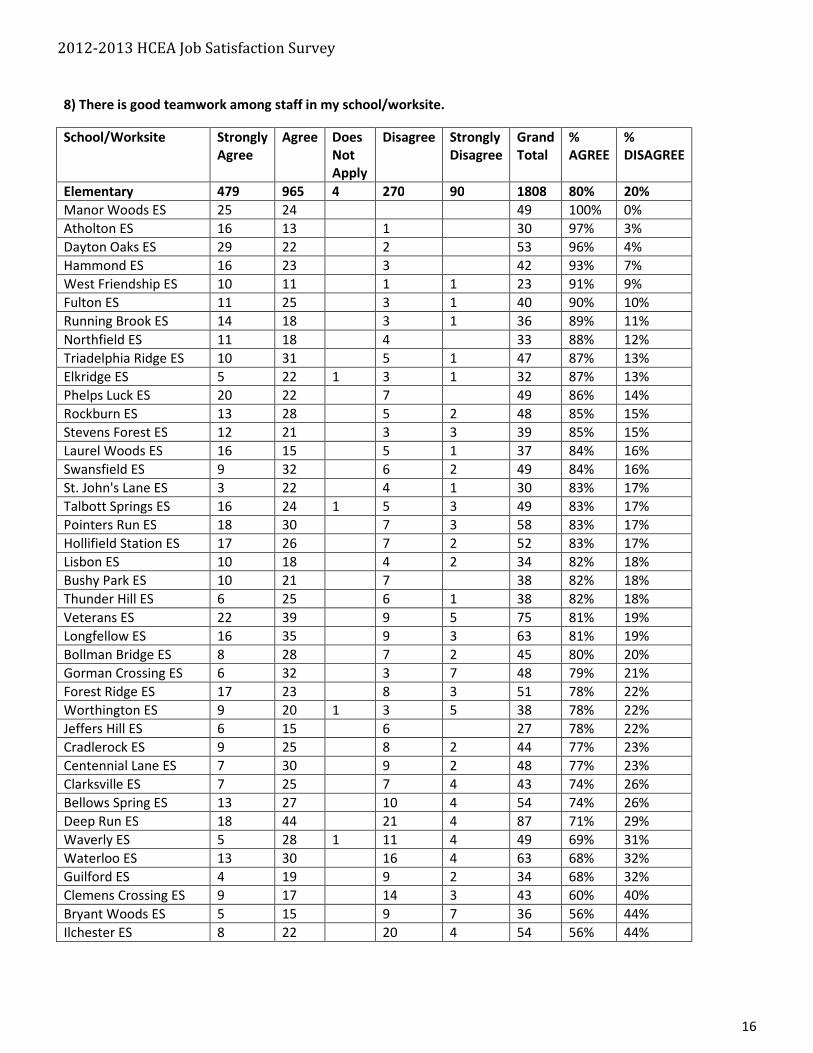
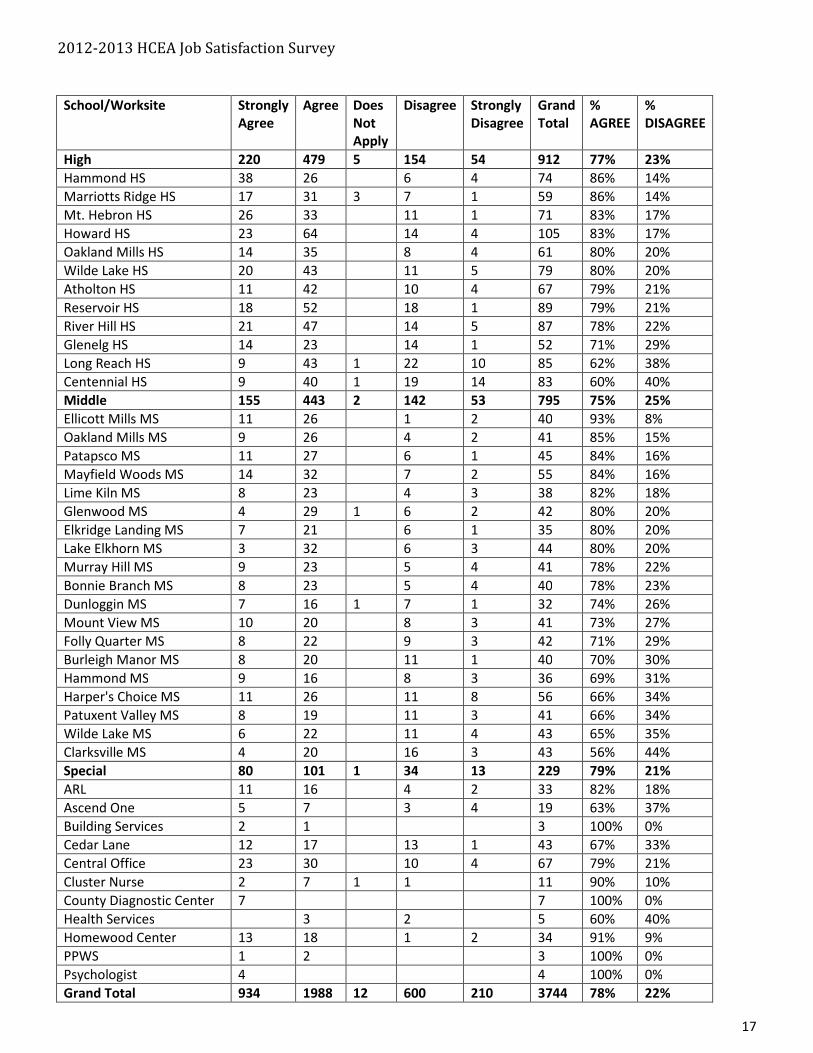
8) There is good teamwork among staff in my school/worksite.
School/Worksite Strongly
Agree
Agree Does
Not
Apply
Disagree Strongly
Disagree
Grand
Total
%
AGREE
%
DISAGREE
Elementary 479 965 4 270 90 1808 80% 20%
Manor Woods ES 25 24 49 100% 0%
Atholton ES 16 13 1 30 97% 3%
Dayton Oaks ES 29 22 2 53 96% 4%
Hammond ES 16 23 3 42 93% 7%
West Friendship ES 10 11 1 1 23 91% 9%
Fulton ES 11 25 3 1 40 90% 10%
Running Brook ES 14 18 3 1 36 89% 11%
Northfield ES 11 18 4 33 88% 12%
Triadelphia Ridge ES 10 31 5 1 47 87% 13%
Elkridge ES 5 22 1 3 1 32 87% 13%
Phelps Luck ES 20 22 7 49 86% 14%
Rockburn ES 13 28 5 2 48 85% 15%
Stevens Forest ES 12 21 3 3 39 85% 15%
Laurel Woods ES 16 15 5 1 37 84% 16%
Swansfield ES 9 32 6 2 49 84% 16%
St. John's Lane ES 3 22 4 1 30 83% 17%
Talbott Springs ES 16 24 1 5 3 49 83% 17%
Pointers Run ES 18 30 7 3 58 83% 17%
Hollifield Station ES 17 26 7 2 52 83% 17%
Lisbon ES 10 18 4 2 34 82% 18%
Bushy Park ES 10 21 7 38 82% 18%
Thunder Hill ES 6 25 6 1 38 82% 18%
Veterans ES 22 39 9 5 75 81% 19%
Longfellow ES 16 35 9 3 63 81% 19%
Bollman Bridge ES 8 28 7 2 45 80% 20%
Gorman Crossing ES 6 32 3 7 48 79% 21%
Forest Ridge ES 17 23 8 3 51 78% 22%
Worthington ES 9 20 1 3 5 38 78% 22%
Jeffers Hill ES 6 15 6 27 78% 22%
Cradlerock ES 9 25 8 2 44 77% 23%
Centennial Lane ES 7 30 9 2 48 77% 23%
Clarksville ES 7 25 7 4 43 74% 26%
Bellows Spring ES 13 27 10 4 54 74% 26%
Deep Run ES 18 44 21 4 87 71% 29%
Waverly ES 5 28 1 11 4 49 69% 31%
Waterloo ES 13 30 16 4 63 68% 32%
Guilford ES 4 19 9 2 34 68% 32%
Clemens Crossing ES 9 17 14 3 43 60% 40%
Bryant Woods ES 5 15 9 7 36 56% 44%
Ilchester ES 8 22 20 4 54 56% 44%
2012-2013 HCEA Job Satisfaction Survey
17
School/Worksite Strongly
Agree
Agree Does
Not
Apply
Disagree Strongly
Disagree
Grand
Total
%
AGREE
%
DISAGREE
High 220 479 5 154 54 912 77% 23%
Hammond HS 38 26 6 4 74 86% 14%
Marriotts Ridge HS 17 31 3 7 1 59 86% 14%
Mt. Hebron HS 26 33 11 1 71 83% 17%
Howard HS 23 64 14 4 105 83% 17%
Oakland Mills HS 14 35 8 4 61 80% 20%
Wilde Lake HS 20 43 11 5 79 80% 20%
Atholton HS 11 42 10 4 67 79% 21%
Reservoir HS 18 52 18 1 89 79% 21%
River Hill HS 21 47 14 5 87 78% 22%
Glenelg HS 14 23 14 1 52 71% 29%
Long Reach HS 9 43 1 22 10 85 62% 38%
Centennial HS 9 40 1 19 14 83 60% 40%
Middle 155 443 2 142 53 795 75% 25%
Ellicott Mills MS 11 26 1 2 40 93% 8%
Oakland Mills MS 9 26 4 2 41 85% 15%
Patapsco MS 11 27 6 1 45 84% 16%
Mayfield Woods MS 14 32 7 2 55 84% 16%
Lime Kiln MS 8 23 4 3 38 82% 18%
Glenwood MS 4 29 1 6 2 42 80% 20%
Elkridge Landing MS 7 21 6 1 35 80% 20%
Lake Elkhorn MS 3 32 6 3 44 80% 20%
Murray Hill MS 9 23 5 4 41 78% 22%
Bonnie Branch MS 8 23 5 4 40 78% 23%
Dunloggin MS 7 16 1 7 1 32 74% 26%
Mount View MS 10 20 8 3 41 73% 27%
Folly Quarter MS 8 22 9 3 42 71% 29%
Burleigh Manor MS 8 20 11 1 40 70% 30%
Hammond MS 9 16 8 3 36 69% 31%
Harper's Choice MS 11 26 11 8 56 66% 34%
Patuxent Valley MS 8 19 11 3 41 66% 34%
Wilde Lake MS 6 22 11 4 43 65% 35%
Clarksville MS 4 20 16 3 43 56% 44%
Special 80 101 1 34 13 229 79% 21%
ARL 11 16 4 2 33 82% 18%
Ascend One 5 7 3 4 19 63% 37%
Building Services 2 1 3 100% 0%
Cedar Lane 12 17 13 1 43 67% 33%
Central Office 23 30 10 4 67 79% 21%
Cluster Nurse 2 7 1 1 11 90% 10%
County Diagnostic Center 7 7 100% 0%
Health Services 3 2 5 60% 40%
Homewood Center 13 18 1 2 34 91% 9%
PPWS 1 2 3 100% 0%
Psychologist 4 4 100% 0%
Grand Total 934 1988 12 600 210 3744 78% 22%
2012-2013 HCEA Job Satisfaction Survey
18
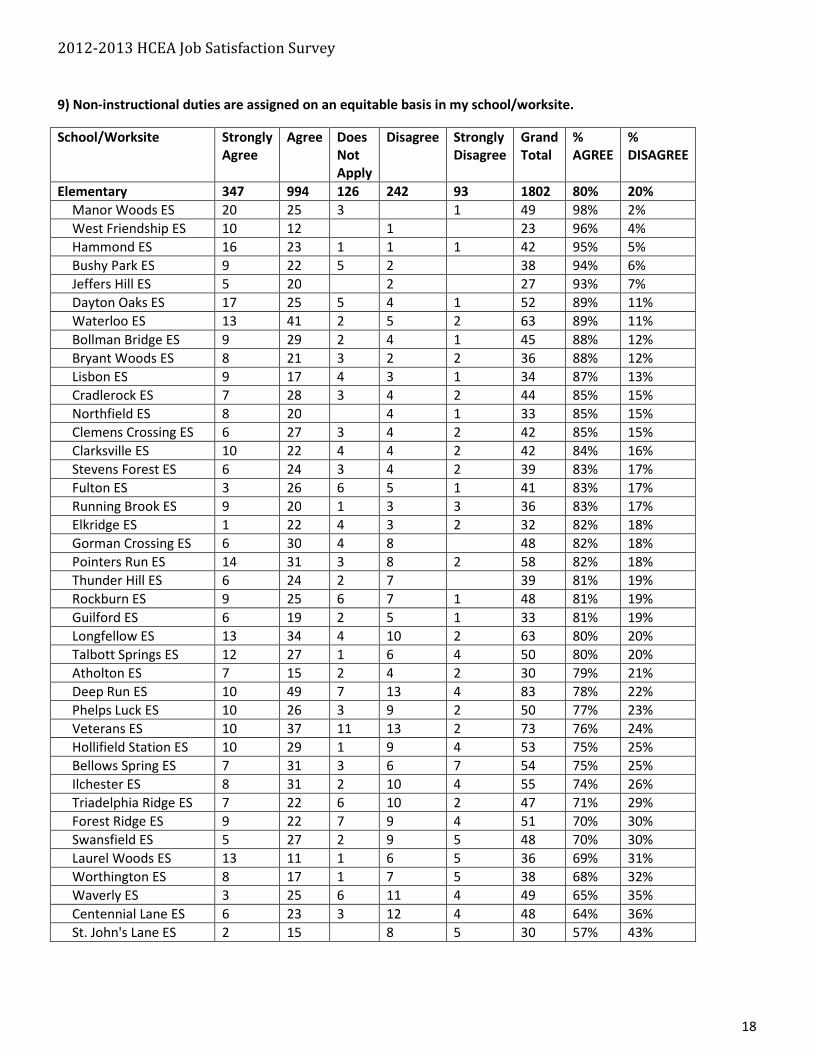
9) Non-instructional duties are assigned on an equitable basis in my school/worksite.
School/Worksite Strongly
Agree
Agree Does
Not
Apply
Disagree Strongly
Disagree
Grand
Total
%
AGREE
%
DISAGREE
Elementary 347 994 126 242 93 1802 80% 20%
Manor Woods ES 20 25 3 1 49 98% 2%
West Friendship ES 10 12 1 23 96% 4%
Hammond ES 16 23 1 1 1 42 95% 5%
Bushy Park ES 9 22 5 2 38 94% 6%
Jeffers Hill ES 5 20 2 27 93% 7%
Dayton Oaks ES 17 25 5 4 1 52 89% 11%
Waterloo ES 13 41 2 5 2 63 89% 11%
Bollman Bridge ES 9 29 2 4 1 45 88% 12%
Bryant Woods ES 8 21 3 2 2 36 88% 12%
Lisbon ES 9 17 4 3 1 34 87% 13%
Cradlerock ES 7 28 3 4 2 44 85% 15%
Northfield ES 8 20 4 1 33 85% 15%
Clemens Crossing ES 6 27 3 4 2 42 85% 15%
Clarksville ES 10 22 4 4 2 42 84% 16%
Stevens Forest ES 6 24 3 4 2 39 83% 17%
Fulton ES 3 26 6 5 1 41 83% 17%
Running Brook ES 9 20 1 3 3 36 83% 17%
Elkridge ES 1 22 4 3 2 32 82% 18%
Gorman Crossing ES 6 30 4 8 48 82% 18%
Pointers Run ES 14 31 3 8 2 58 82% 18%
Thunder Hill ES 6 24 2 7 39 81% 19%
Rockburn ES 9 25 6 7 1 48 81% 19%
Guilford ES 6 19 2 5 1 33 81% 19%
Longfellow ES 13 34 4 10 2 63 80% 20%
Talbott Springs ES 12 27 1 6 4 50 80% 20%
Atholton ES 7 15 2 4 2 30 79% 21%
Deep Run ES 10 49 7 13 4 83 78% 22%
Phelps Luck ES 10 26 3 9 2 50 77% 23%
Veterans ES 10 37 11 13 2 73 76% 24%
Hollifield Station ES 10 29 1 9 4 53 75% 25%
Bellows Spring ES 7 31 3 6 7 54 75% 25%
Ilchester ES 8 31 2 10 4 55 74% 26%
Triadelphia Ridge ES 7 22 6 10 2 47 71% 29%
Forest Ridge ES 9 22 7 9 4 51 70% 30%
Swansfield ES 5 27 2 9 5 48 70% 30%
Laurel Woods ES 13 11 1 6 5 36 69% 31%
Worthington ES 8 17 1 7 5 38 68% 32%
Waverly ES 3 25 6 11 4 49 65% 35%
Centennial Lane ES 6 23 3 12 4 48 64% 36%
St. John's Lane ES 2 15 8 5 30 57% 43%
2012-2013 HCEA Job Satisfaction Survey
19
School/Worksite Strongly
Agree
Agree Does
Not
Apply
Disagree Strongly
Disagree
Grand
Total
%
AGREE
%
DISAGREE
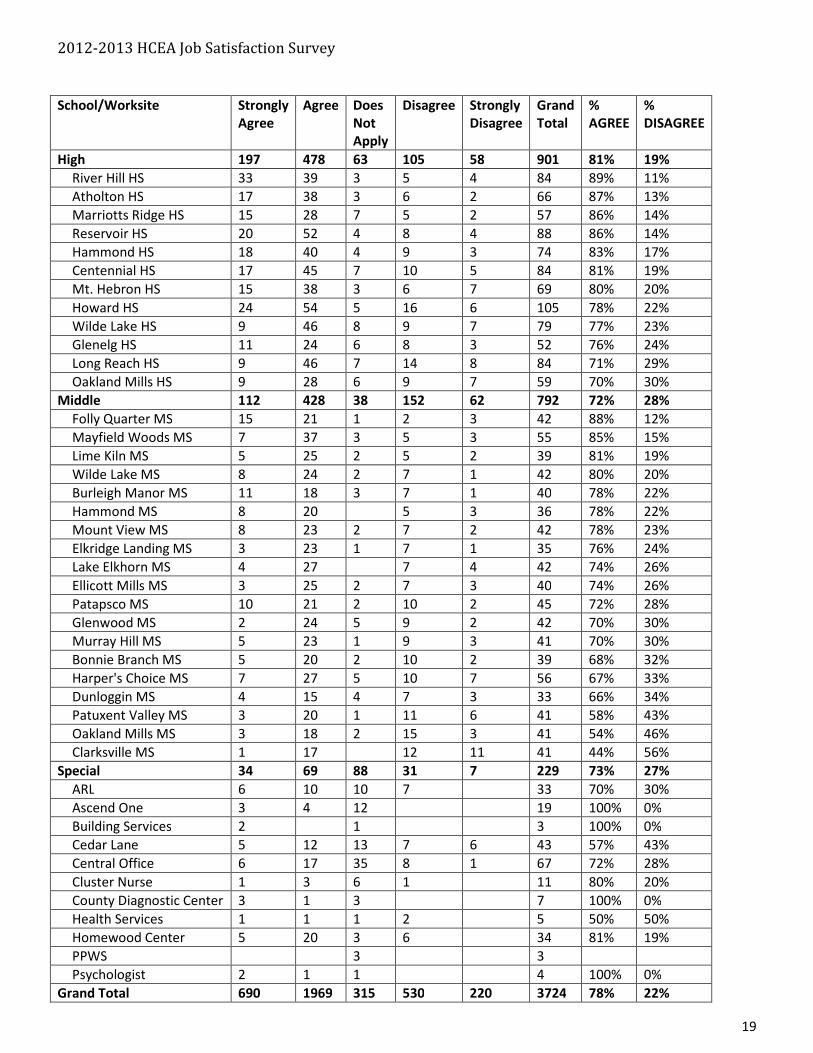
High 197 478 63 105 58 901 81% 19%
River Hill HS 33 39 3 5 4 84 89% 11%
Atholton HS 17 38 3 6 2 66 87% 13%
Marriotts Ridge HS 15 28 7 5 2 57 86% 14%
Reservoir HS 20 52 4 8 4 88 86% 14%
Hammond HS 18 40 4 9 3 74 83% 17%
Centennial HS 17 45 7 10 5 84 81% 19%
Mt. Hebron HS 15 38 3 6 7 69 80% 20%
Howard HS 24 54 5 16 6 105 78% 22%
Wilde Lake HS 9 46 8 9 7 79 77% 23%
Glenelg HS 11 24 6 8 3 52 76% 24%
Long Reach HS 9 46 7 14 8 84 71% 29%
Oakland Mills HS 9 28 6 9 7 59 70% 30%
Middle 112 428 38 152 62 792 72% 28%
Folly Quarter MS 15 21 1 2 3 42 88% 12%
Mayfield Woods MS 7 37 3 5 3 55 85% 15%
Lime Kiln MS 5 25 2 5 2 39 81% 19%
Wilde Lake MS 8 24 2 7 1 42 80% 20%
Burleigh Manor MS 11 18 3 7 1 40 78% 22%
Hammond MS 8 20 5 3 36 78% 22%
Mount View MS 8 23 2 7 2 42 78% 23%
Elkridge Landing MS 3 23 1 7 1 35 76% 24%
Lake Elkhorn MS 4 27 7 4 42 74% 26%
Ellicott Mills MS 3 25 2 7 3 40 74% 26%
Patapsco MS 10 21 2 10 2 45 72% 28%
Glenwood MS 2 24 5 9 2 42 70% 30%
Murray Hill MS 5 23 1 9 3 41 70% 30%
Bonnie Branch MS 5 20 2 10 2 39 68% 32%
Harper's Choice MS 7 27 5 10 7 56 67% 33%
Dunloggin MS 4 15 4 7 3 33 66% 34%
Patuxent Valley MS 3 20 1 11 6 41 58% 43%
Oakland Mills MS 3 18 2 15 3 41 54% 46%
Clarksville MS 1 17 12 11 41 44% 56%
Special 34 69 88 31 7 229 73% 27%
ARL 6 10 10 7 33 70% 30%
Ascend One 3 4 12 19 100% 0%
Building Services 2 1 3 100% 0%
Cedar Lane 5 12 13 7 6 43 57% 43%
Central Office 6 17 35 8 1 67 72% 28%
Cluster Nurse 1 3 6 1 11 80% 20%
County Diagnostic Center 3 1 3 7 100% 0%
Health Services 1 1 1 2 5 50% 50%
Homewood Center 5 20 3 6 34 81% 19%
PPWS 3 3
Psychologist 2 1 1 4 100% 0%
Grand Total 690 1969 315 530 220 3724 78% 22%
2012-2013 HCEA Job Satisfaction Survey
20
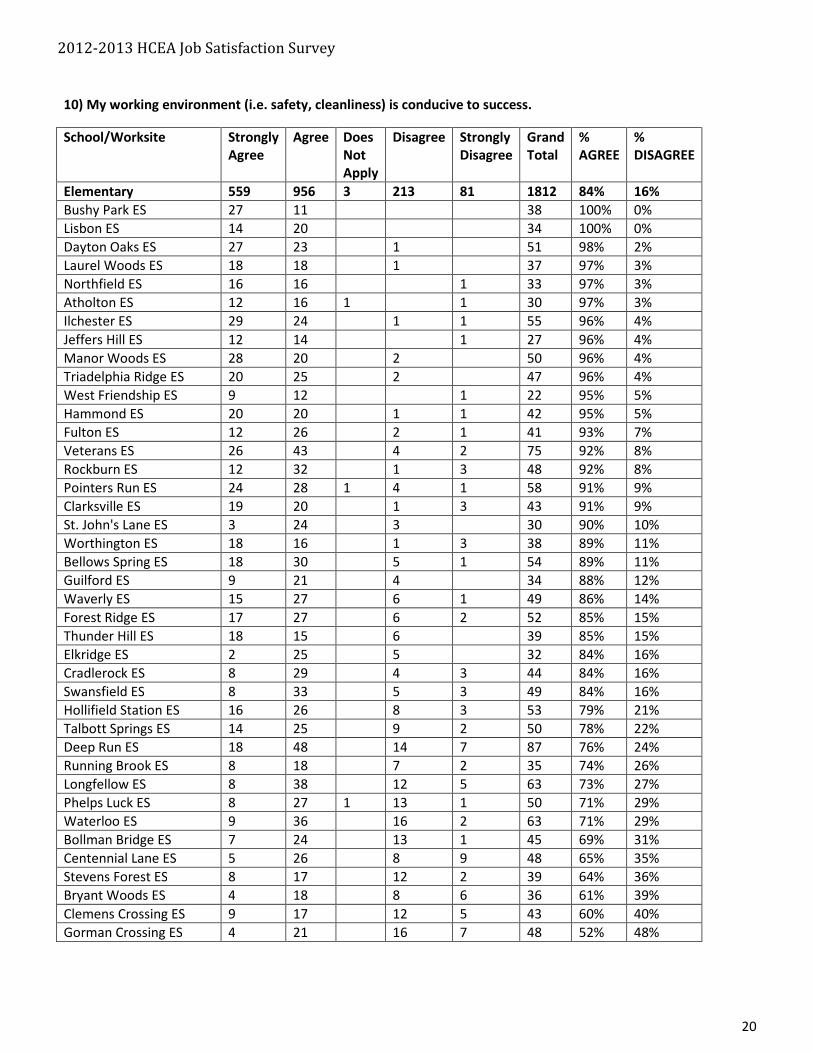
10) My working environment (i.e. safety, cleanliness) is conducive to success.
School/Worksite Strongly
Agree
Agree Does
Not
Apply
Disagree Strongly
Disagree
Grand
Total
%
AGREE
%
DISAGREE
Elementary 559 956 3 213 81 1812 84% 16%
Bushy Park ES 27 11 38 100% 0%
Lisbon ES 14 20 34 100% 0%
Dayton Oaks ES 27 23 1 51 98% 2%
Laurel Woods ES 18 18 1 37 97% 3%
Northfield ES 16 16 1 33 97% 3%
Atholton ES 12 16 1 1 30 97% 3%
Ilchester ES 29 24 1 1 55 96% 4%
Jeffers Hill ES 12 14 1 27 96% 4%
Manor Woods ES 28 20 2 50 96% 4%
Triadelphia Ridge ES 20 25 2 47 96% 4%
West Friendship ES 9 12 1 22 95% 5%
Hammond ES 20 20 1 1 42 95% 5%
Fulton ES 12 26 2 1 41 93% 7%
Veterans ES 26 43 4 2 75 92% 8%
Rockburn ES 12 32 1 3 48 92% 8%
Pointers Run ES 24 28 1 4 1 58 91% 9%
Clarksville ES 19 20 1 3 43 91% 9%
St. John's Lane ES 3 24 3 30 90% 10%
Worthington ES 18 16 1 3 38 89% 11%
Bellows Spring ES 18 30 5 1 54 89% 11%
Guilford ES 9 21 4 34 88% 12%
Waverly ES 15 27 6 1 49 86% 14%
Forest Ridge ES 17 27 6 2 52 85% 15%
Thunder Hill ES 18 15 6 39 85% 15%
Elkridge ES 2 25 5 32 84% 16%
Cradlerock ES 8 29 4 3 44 84% 16%
Swansfield ES 8 33 5 3 49 84% 16%
Hollifield Station ES 16 26 8 3 53 79% 21%
Talbott Springs ES 14 25 9 2 50 78% 22%
Deep Run ES 18 48 14 7 87 76% 24%
Running Brook ES 8 18 7 2 35 74% 26%
Longfellow ES 8 38 12 5 63 73% 27%
Phelps Luck ES 8 27 1 13 1 50 71% 29%
Waterloo ES 9 36 16 2 63 71% 29%
Bollman Bridge ES 7 24 13 1 45 69% 31%
Centennial Lane ES 5 26 8 9 48 65% 35%
Stevens Forest ES 8 17 12 2 39 64% 36%
Bryant Woods ES 4 18 8 6 36 61% 39%
Clemens Crossing ES 9 17 12 5 43 60% 40%
Gorman Crossing ES 4 21 16 7 48 52% 48%
2012-2013 HCEA Job Satisfaction Survey
21
School/Worksite Strongly
Agree
Agree Does
Not
Apply
Disagree Strongly
Disagree
Grand
Total
%
AGREE
%
DISAGREE
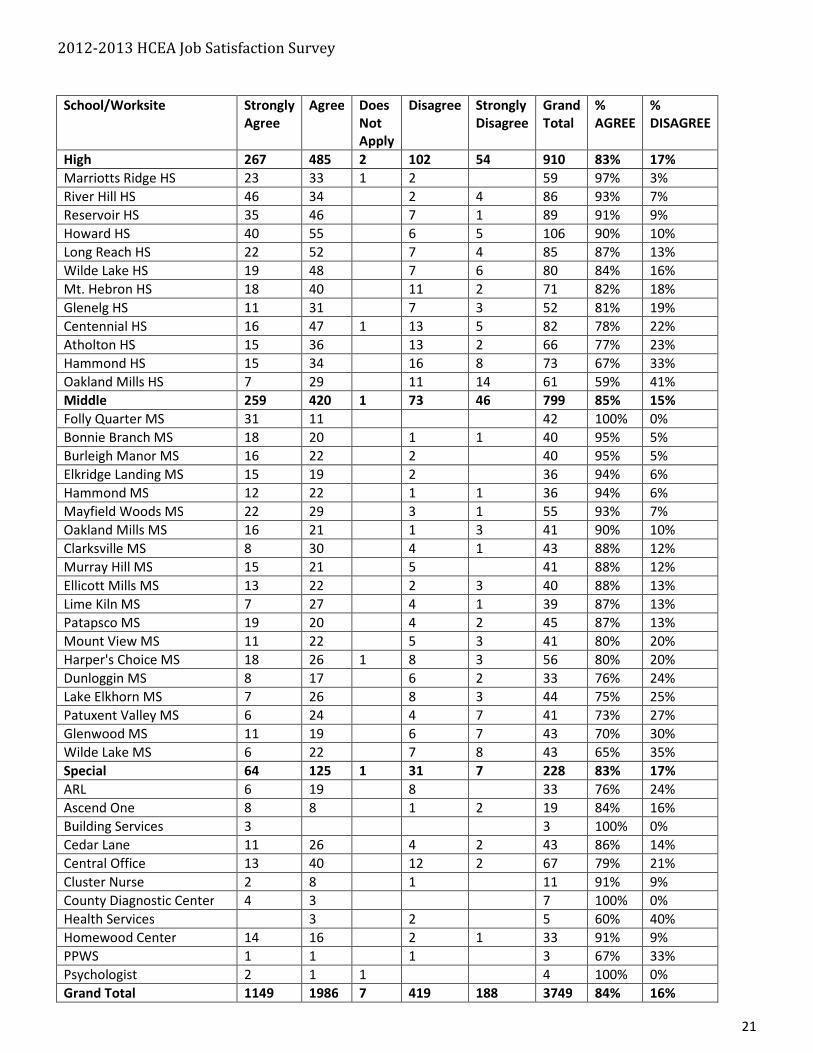
High 267 485 2 102 54 910 83% 17%
Marriotts Ridge HS 23 33 1 2 59 97% 3%
River Hill HS 46 34 2 4 86 93% 7%
Reservoir HS 35 46 7 1 89 91% 9%
Howard HS 40 55 6 5 106 90% 10%
Long Reach HS 22 52 7 4 85 87% 13%
Wilde Lake HS 19 48 7 6 80 84% 16%
Mt. Hebron HS 18 40 11 2 71 82% 18%
Glenelg HS 11 31 7 3 52 81% 19%
Centennial HS 16 47 1 13 5 82 78% 22%
Atholton HS 15 36 13 2 66 77% 23%
Hammond HS 15 34 16 8 73 67% 33%
Oakland Mills HS 7 29 11 14 61 59% 41%
Middle 259 420 1 73 46 799 85% 15%
Folly Quarter MS 31 11 42 100% 0%
Bonnie Branch MS 18 20 1 1 40 95% 5%
Burleigh Manor MS 16 22 2 40 95% 5%
Elkridge Landing MS 15 19 2 36 94% 6%
Hammond MS 12 22 1 1 36 94% 6%
Mayfield Woods MS 22 29 3 1 55 93% 7%
Oakland Mills MS 16 21 1 3 41 90% 10%
Clarksville MS 8 30 4 1 43 88% 12%
Murray Hill MS 15 21 5 41 88% 12%
Ellicott Mills MS 13 22 2 3 40 88% 13%
Lime Kiln MS 7 27 4 1 39 87% 13%
Patapsco MS 19 20 4 2 45 87% 13%
Mount View MS 11 22 5 3 41 80% 20%
Harper's Choice MS 18 26 1 8 3 56 80% 20%
Dunloggin MS 8 17 6 2 33 76% 24%
Lake Elkhorn MS 7 26 8 3 44 75% 25%
Patuxent Valley MS 6 24 4 7 41 73% 27%
Glenwood MS 11 19 6 7 43 70% 30%
Wilde Lake MS 6 22 7 8 43 65% 35%
Special 64 125 1 31 7 228 83% 17%
ARL 6 19 8 33 76% 24%
Ascend One 8 8 1 2 19 84% 16%
Building Services 3 3 100% 0%
Cedar Lane 11 26 4 2 43 86% 14%
Central Office 13 40 12 2 67 79% 21%
Cluster Nurse 2 8 1 11 91% 9%
County Diagnostic Center 4 3 7 100% 0%
Health Services 3 2 5 60% 40%
Homewood Center 14 16 2 1 33 91% 9%
PPWS 1 1 1 3 67% 33%
Psychologist 2 1 1 4 100% 0%
Grand Total 1149 1986 7 419 188 3749 84% 16%
2012-2013 HCEA Job Satisfaction Survey
22
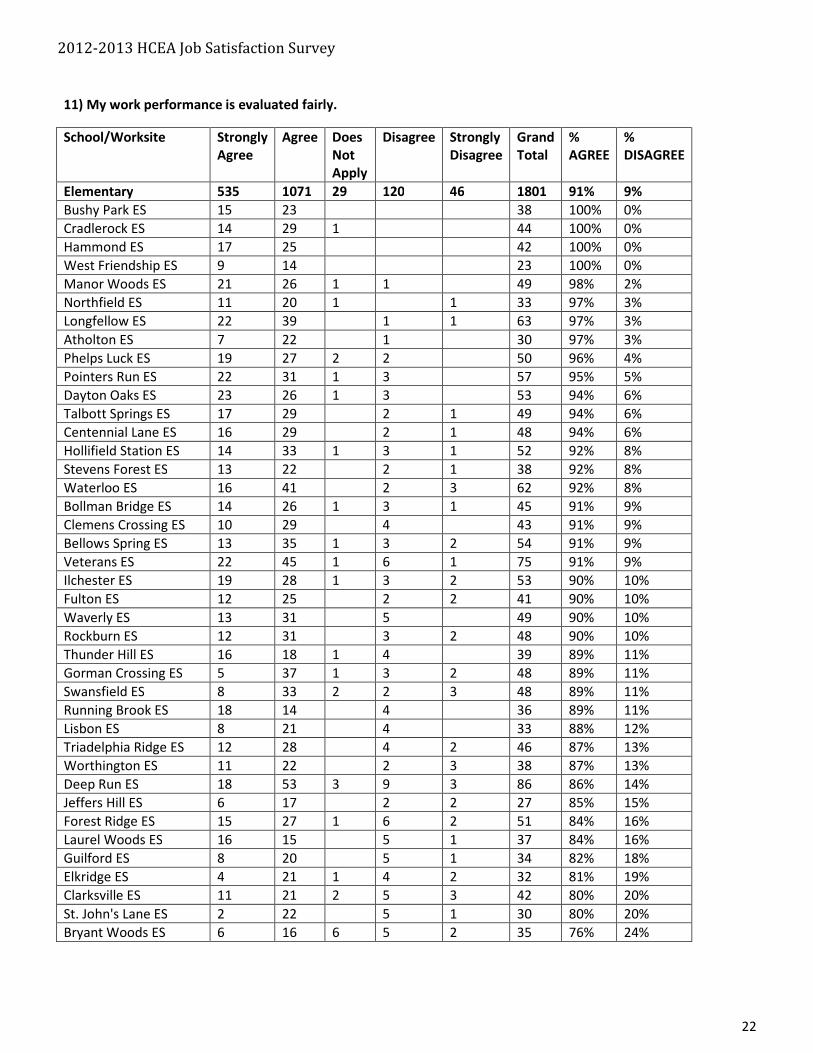
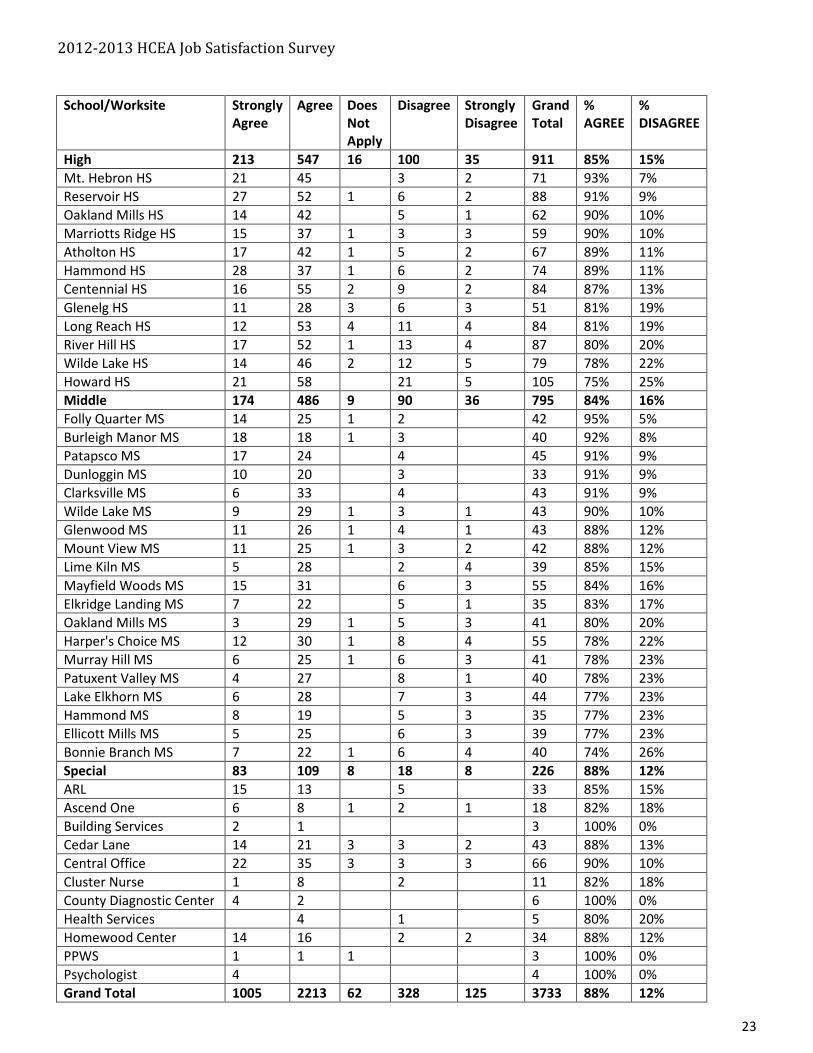
11) My work performance is evaluated fairly.
School/Worksite Strongly
Agree
Agree Does
Not
Apply
Disagree Strongly
Disagree
Grand
Total
%
AGREE
%
DISAGREE
Elementary 535 1071 29 120 46 1801 91% 9%
Bushy Park ES 15 23 38 100% 0%
Cradlerock ES 14 29 1 44 100% 0%
Hammond ES 17 25 42 100% 0%
West Friendship ES 9 14 23 100% 0%
Manor Woods ES 21 26 1 1 49 98% 2%
Northfield ES 11 20 1 1 33 97% 3%
Longfellow ES 22 39 1 1 63 97% 3%
Atholton ES 7 22 1 30 97% 3%
Phelps Luck ES 19 27 2 2 50 96% 4%
Pointers Run ES 22 31 1 3 57 95% 5%
Dayton Oaks ES 23 26 1 3 53 94% 6%
Talbott Springs ES 17 29 2 1 49 94% 6%
Centennial Lane ES 16 29 2 1 48 94% 6%
Hollifield Station ES 14 33 1 3 1 52 92% 8%
Stevens Forest ES 13 22 2 1 38 92% 8%
Waterloo ES 16 41 2 3 62 92% 8%
Bollman Bridge ES 14 26 1 3 1 45 91% 9%
Clemens Crossing ES 10 29 4 43 91% 9%
Bellows Spring ES 13 35 1 3 2 54 91% 9%
Veterans ES 22 45 1 6 1 75 91% 9%
Ilchester ES 19 28 1 3 2 53 90% 10%
Fulton ES 12 25 2 2 41 90% 10%
Waverly ES 13 31 5 49 90% 10%
Rockburn ES 12 31 3 2 48 90% 10%
Thunder Hill ES 16 18 1 4 39 89% 11%
Gorman Crossing ES 5 37 1 3 2 48 89% 11%
Swansfield ES 8 33 2 2 3 48 89% 11%
Running Brook ES 18 14 4 36 89% 11%
Lisbon ES 8 21 4 33 88% 12%
Triadelphia Ridge ES 12 28 4 2 46 87% 13%
Worthington ES 11 22 2 3 38 87% 13%
Deep Run ES 18 53 3 9 3 86 86% 14%
Jeffers Hill ES 6 17 2 2 27 85% 15%
Forest Ridge ES 15 27 1 6 2 51 84% 16%
Laurel Woods ES 16 15 5 1 37 84% 16%
Guilford ES 8 20 5 1 34 82% 18%
Elkridge ES 4 21 1 4 2 32 81% 19%
Clarksville ES 11 21 2 5 3 42 80% 20%
St. John's Lane ES 2 22 5 1 30 80% 20%
Bryant Woods ES 6 16 6 5 2 35 76% 24%
2012-2013 HCEA Job Satisfaction Survey
23
School/Worksite Strongly
Agree
Agree Does
Not
Apply
Disagree Strongly
Disagree
Grand
Total
%
AGREE
%
DISAGREE
High 213 547 16 100 35 911 85% 15%
Mt. Hebron HS 21 45 3 2 71 93% 7%
Reservoir HS 27 52 1 6 2 88 91% 9%
Oakland Mills HS 14 42 5 1 62 90% 10%
Marriotts Ridge HS 15 37 1 3 3 59 90% 10%
Atholton HS 17 42 1 5 2 67 89% 11%
Hammond HS 28 37 1 6 2 74 89% 11%
Centennial HS 16 55 2 9 2 84 87% 13%
Glenelg HS 11 28 3 6 3 51 81% 19%
Long Reach HS 12 53 4 11 4 84 81% 19%
River Hill HS 17 52 1 13 4 87 80% 20%
Wilde Lake HS 14 46 2 12 5 79 78% 22%
Howard HS 21 58 21 5 105 75% 25%
Middle 174 486 9 90 36 795 84% 16%
Folly Quarter MS 14 25 1 2 42 95% 5%
Burleigh Manor MS 18 18 1 3 40 92% 8%
Patapsco MS 17 24 4 45 91% 9%
Dunloggin MS 10 20 3 33 91% 9%
Clarksville MS 6 33 4 43 91% 9%
Wilde Lake MS 9 29 1 3 1 43 90% 10%
Glenwood MS 11 26 1 4 1 43 88% 12%
Mount View MS 11 25 1 3 2 42 88% 12%
Lime Kiln MS 5 28 2 4 39 85% 15%
Mayfield Woods MS 15 31 6 3 55 84% 16%
Elkridge Landing MS 7 22 5 1 35 83% 17%
Oakland Mills MS 3 29 1 5 3 41 80% 20%
Harper's Choice MS 12 30 1 8 4 55 78% 22%
Murray Hill MS 6 25 1 6 3 41 78% 23%
Patuxent Valley MS 4 27 8 1 40 78% 23%
Lake Elkhorn MS 6 28 7 3 44 77% 23%
Hammond MS 8 19 5 3 35 77% 23%
Ellicott Mills MS 5 25 6 3 39 77% 23%
Bonnie Branch MS 7 22 1 6 4 40 74% 26%
Special 83 109 8 18 8 226 88% 12%
ARL 15 13 5 33 85% 15%
Ascend One 6 8 1 2 1 18 82% 18%
Building Services 2 1 3 100% 0%
Cedar Lane 14 21 3 3 2 43 88% 13%
Central Office 22 35 3 3 3 66 90% 10%
Cluster Nurse 1 8 2 11 82% 18%
County Diagnostic Center 4 2 6 100% 0%
Health Services 4 1 5 80% 20%
Homewood Center 14 16 2 2 34 88% 12%
PPWS 1 1 1 3 100% 0%
Psychologist 4 4 100% 0%
Grand Total 1005 2213 62 328 125 3733 88% 12%
2012-2013 HCEA Job Satisfaction Survey
24
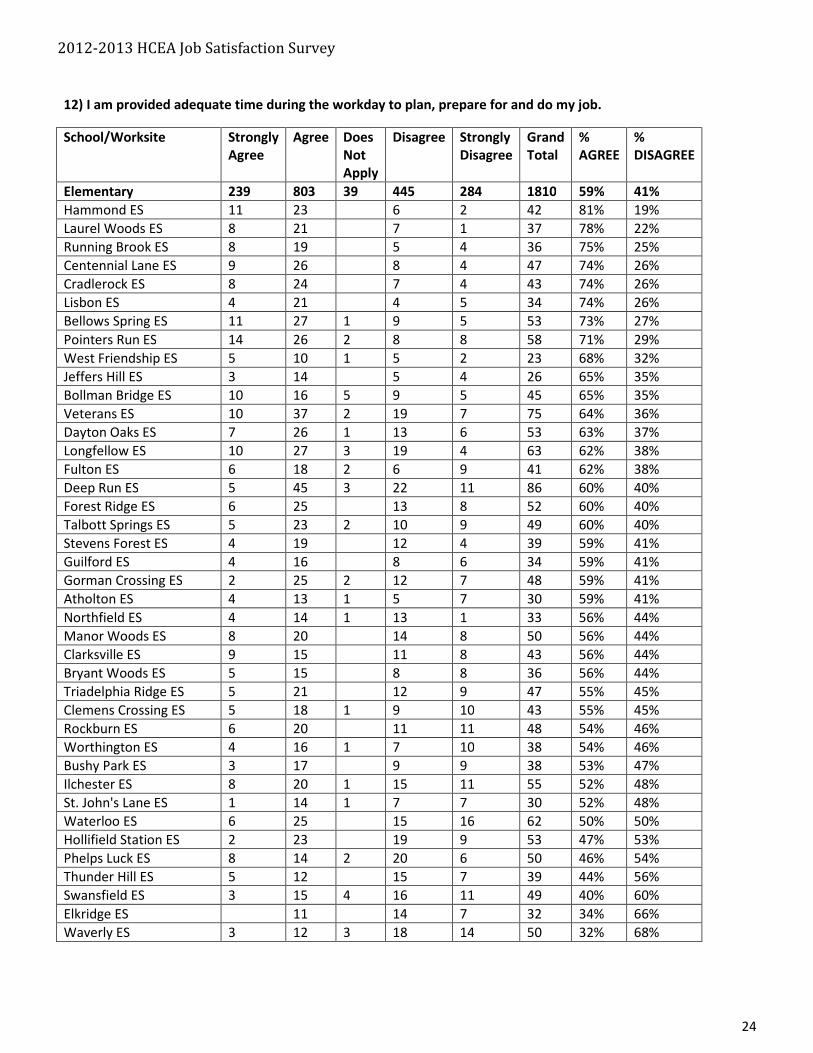
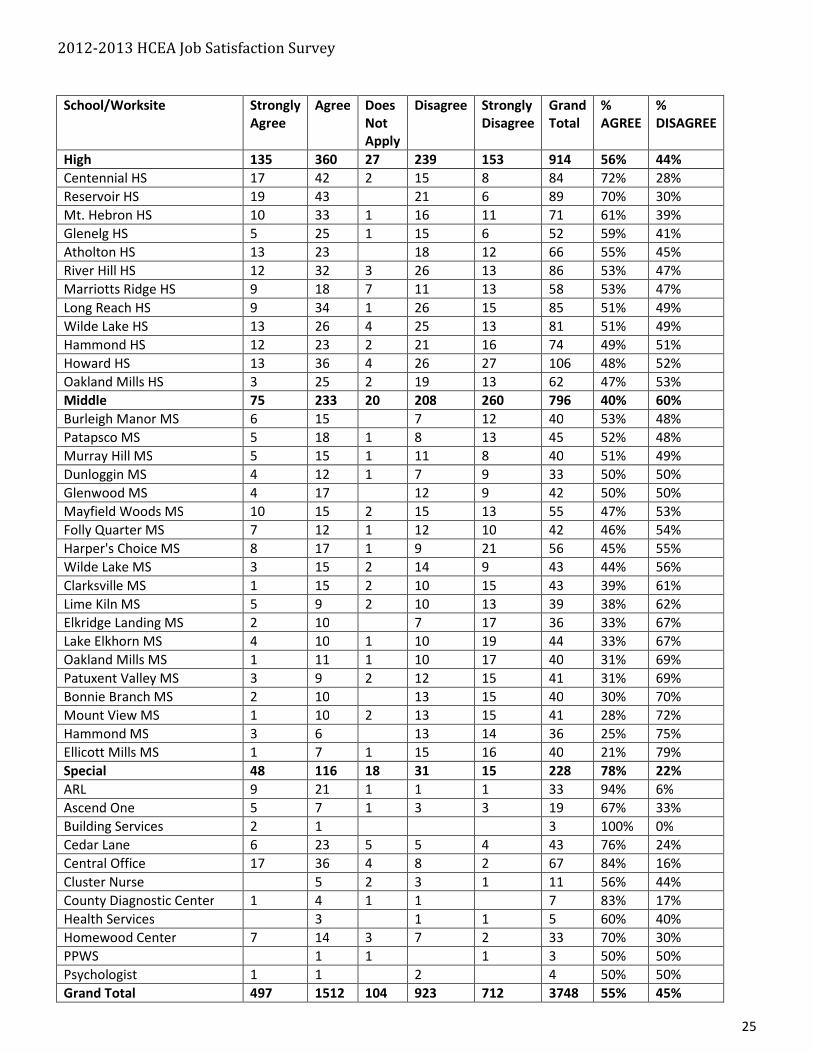
12) I am provided adequate time during the workday to plan, prepare for and do my job.
School/Worksite Strongly
Agree
Agree Does
Not
Apply
Disagree Strongly
Disagree
Grand
Total
%
AGREE
%
DISAGREE
Elementary 239 803 39 445 284 1810 59% 41%
Hammond ES 11 23 6 2 42 81% 19%
Laurel Woods ES 8 21 7 1 37 78% 22%
Running Brook ES 8 19 5 4 36 75% 25%
Centennial Lane ES 9 26 8 4 47 74% 26%
Cradlerock ES 8 24 7 4 43 74% 26%
Lisbon ES 4 21 4 5 34 74% 26%
Bellows Spring ES 11 27 1 9 5 53 73% 27%
Pointers Run ES 14 26 2 8 8 58 71% 29%
West Friendship ES 5 10 1 5 2 23 68% 32%
Jeffers Hill ES 3 14 5 4 26 65% 35%
Bollman Bridge ES 10 16 5 9 5 45 65% 35%
Veterans ES 10 37 2 19 7 75 64% 36%
Dayton Oaks ES 7 26 1 13 6 53 63% 37%
Longfellow ES 10 27 3 19 4 63 62% 38%
Fulton ES 6 18 2 6 9 41 62% 38%
Deep Run ES 5 45 3 22 11 86 60% 40%
Forest Ridge ES 6 25 13 8 52 60% 40%
Talbott Springs ES 5 23 2 10 9 49 60% 40%
Stevens Forest ES 4 19 12 4 39 59% 41%
Guilford ES 4 16 8 6 34 59% 41%
Gorman Crossing ES 2 25 2 12 7 48 59% 41%
Atholton ES 4 13 1 5 7 30 59% 41%
Northfield ES 4 14 1 13 1 33 56% 44%
Manor Woods ES 8 20 14 8 50 56% 44%
Clarksville ES 9 15 11 8 43 56% 44%
Bryant Woods ES 5 15 8 8 36 56% 44%
Triadelphia Ridge ES 5 21 12 9 47 55% 45%
Clemens Crossing ES 5 18 1 9 10 43 55% 45%
Rockburn ES 6 20 11 11 48 54% 46%
Worthington ES 4 16 1 7 10 38 54% 46%
Bushy Park ES 3 17 9 9 38 53% 47%
Ilchester ES 8 20 1 15 11 55 52% 48%
St. John's Lane ES 1 14 1 7 7 30 52% 48%
Waterloo ES 6 25 15 16 62 50% 50%
Hollifield Station ES 2 23 19 9 53 47% 53%
Phelps Luck ES 8 14 2 20 6 50 46% 54%
Thunder Hill ES 5 12 15 7 39 44% 56%
Swansfield ES 3 15 4 16 11 49 40% 60%
Elkridge ES 11 14 7 32 34% 66%
Waverly ES 3 12 3 18 14 50 32% 68%
2012-2013 HCEA Job Satisfaction Survey
25
School/Worksite Strongly
Agree
Agree Does
Not
Apply
Disagree Strongly
Disagree
Grand
Total
%
AGREE
%
DISAGREE
High 135 360 27 239 153 914 56% 44%
Centennial HS 17 42 2 15 8 84 72% 28%
Reservoir HS 19 43 21 6 89 70% 30%
Mt. Hebron HS 10 33 1 16 11 71 61% 39%
Glenelg HS 5 25 1 15 6 52 59% 41%
Atholton HS 13 23 18 12 66 55% 45%
River Hill HS 12 32 3 26 13 86 53% 47%
Marriotts Ridge HS 9 18 7 11 13 58 53% 47%
Long Reach HS 9 34 1 26 15 85 51% 49%
Wilde Lake HS 13 26 4 25 13 81 51% 49%
Hammond HS 12 23 2 21 16 74 49% 51%
Howard HS 13 36 4 26 27 106 48% 52%
Oakland Mills HS 3 25 2 19 13 62 47% 53%
Middle 75 233 20 208 260 796 40% 60%
Burleigh Manor MS 6 15 7 12 40 53% 48%
Patapsco MS 5 18 1 8 13 45 52% 48%
Murray Hill MS 5 15 1 11 8 40 51% 49%
Dunloggin MS 4 12 1 7 9 33 50% 50%
Glenwood MS 4 17 12 9 42 50% 50%
Mayfield Woods MS 10 15 2 15 13 55 47% 53%
Folly Quarter MS 7 12 1 12 10 42 46% 54%
Harper's Choice MS 8 17 1 9 21 56 45% 55%
Wilde Lake MS 3 15 2 14 9 43 44% 56%
Clarksville MS 1 15 2 10 15 43 39% 61%
Lime Kiln MS 5 9 2 10 13 39 38% 62%
Elkridge Landing MS 2 10 7 17 36 33% 67%
Lake Elkhorn MS 4 10 1 10 19 44 33% 67%
Oakland Mills MS 1 11 1 10 17 40 31% 69%
Patuxent Valley MS 3 9 2 12 15 41 31% 69%
Bonnie Branch MS 2 10 13 15 40 30% 70%
Mount View MS 1 10 2 13 15 41 28% 72%
Hammond MS 3 6 13 14 36 25% 75%
Ellicott Mills MS 1 7 1 15 16 40 21% 79%
Special 48 116 18 31 15 228 78% 22%
ARL 9 21 1 1 1 33 94% 6%
Ascend One 5 7 1 3 3 19 67% 33%
Building Services 2 1 3 100% 0%
Cedar Lane 6 23 5 5 4 43 76% 24%
Central Office 17 36 4 8 2 67 84% 16%
Cluster Nurse 5 2 3 1 11 56% 44%
County Diagnostic Center 1 4 1 1 7 83% 17%
Health Services 3 1 1 5 60% 40%
Homewood Center 7 14 3 7 2 33 70% 30%
PPWS 1 1 1 3 50% 50%
Psychologist 1 1 2 4 50% 50%
Grand Total 497 1512 104 923 712 3748 55% 45%
2012-2013 HCEA Job Satisfaction Survey
26
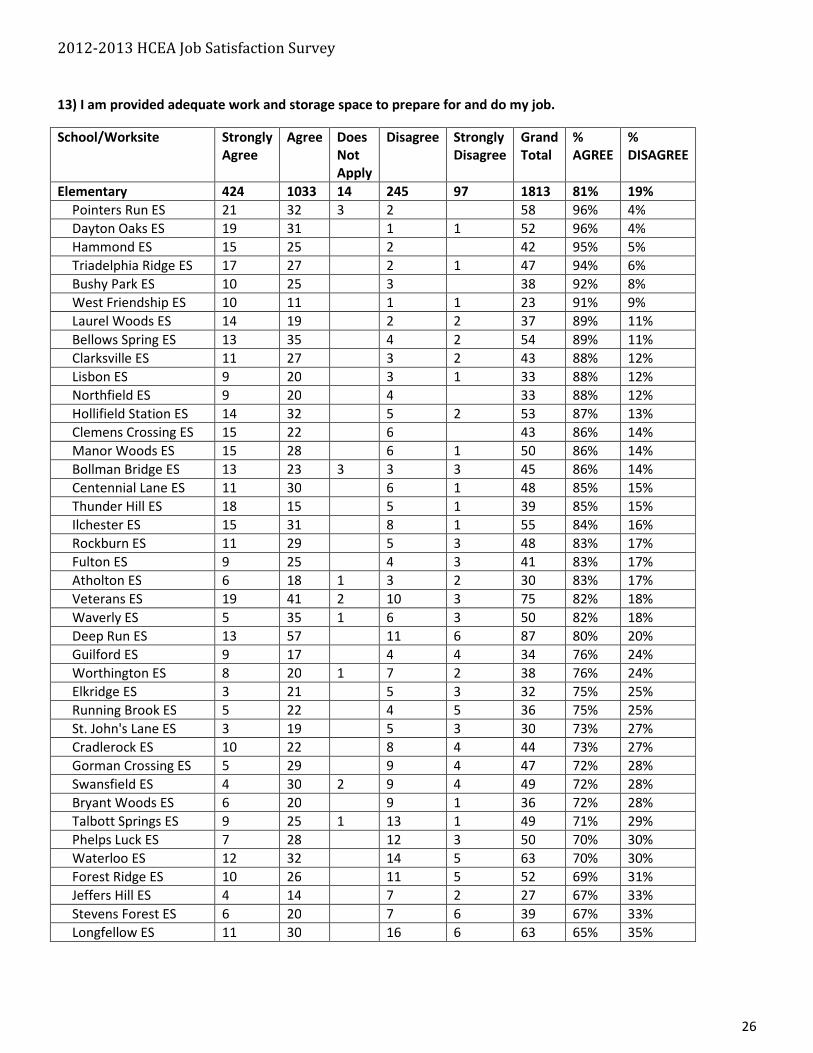
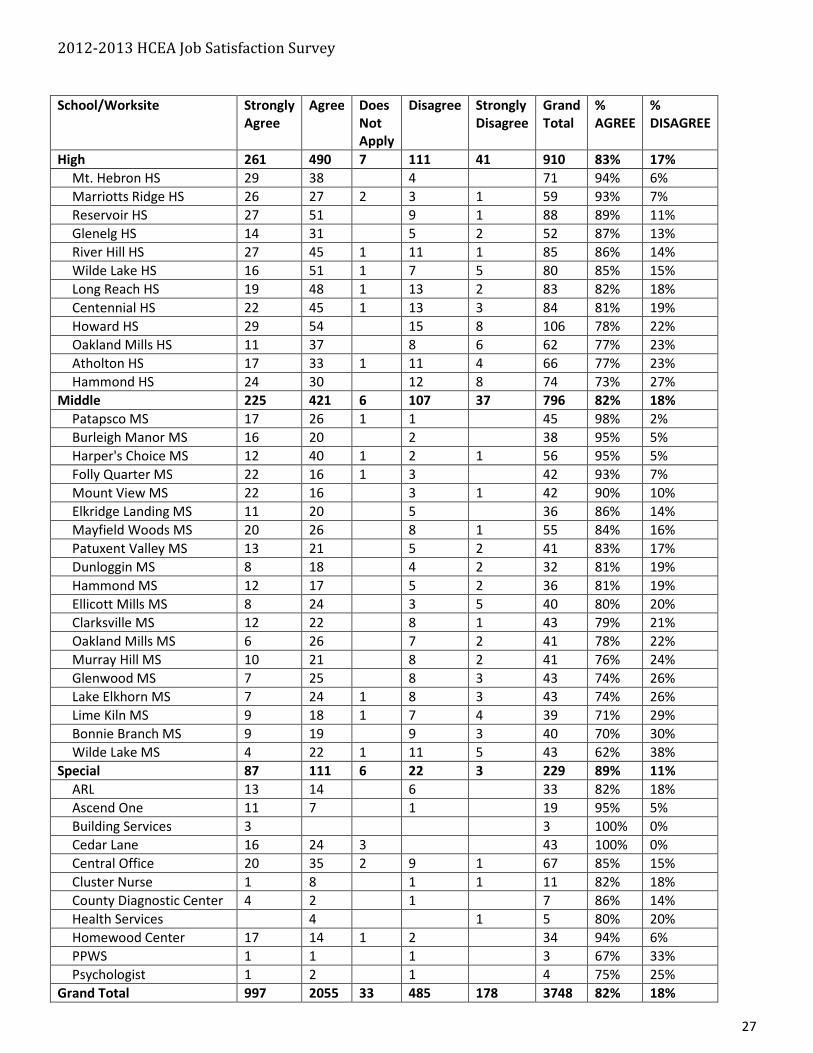
13) I am provided adequate work and storage space to prepare for and do my job.
School/Worksite Strongly
Agree
Agree Does
Not
Apply
Disagree Strongly
Disagree
Grand
Total
%
AGREE
%
DISAGREE
Elementary 424 1033 14 245 97 1813 81% 19%
Pointers Run ES 21 32 3 2 58 96% 4%
Dayton Oaks ES 19 31 1 1 52 96% 4%
Hammond ES 15 25 2 42 95% 5%
Triadelphia Ridge ES 17 27 2 1 47 94% 6%
Bushy Park ES 10 25 3 38 92% 8%
West Friendship ES 10 11 1 1 23 91% 9%
Laurel Woods ES 14 19 2 2 37 89% 11%
Bellows Spring ES 13 35 4 2 54 89% 11%
Clarksville ES 11 27 3 2 43 88% 12%
Lisbon ES 9 20 3 1 33 88% 12%
Northfield ES 9 20 4 33 88% 12%
Hollifield Station ES 14 32 5 2 53 87% 13%
Clemens Crossing ES 15 22 6 43 86% 14%
Manor Woods ES 15 28 6 1 50 86% 14%
Bollman Bridge ES 13 23 3 3 3 45 86% 14%
Centennial Lane ES 11 30 6 1 48 85% 15%
Thunder Hill ES 18 15 5 1 39 85% 15%
Ilchester ES 15 31 8 1 55 84% 16%
Rockburn ES 11 29 5 3 48 83% 17%
Fulton ES 9 25 4 3 41 83% 17%
Atholton ES 6 18 1 3 2 30 83% 17%
Veterans ES 19 41 2 10 3 75 82% 18%
Waverly ES 5 35 1 6 3 50 82% 18%
Deep Run ES 13 57 11 6 87 80% 20%
Guilford ES 9 17 4 4 34 76% 24%
Worthington ES 8 20 1 7 2 38 76% 24%
Elkridge ES 3 21 5 3 32 75% 25%
Running Brook ES 5 22 4 5 36 75% 25%
St. John's Lane ES 3 19 5 3 30 73% 27%
Cradlerock ES 10 22 8 4 44 73% 27%
Gorman Crossing ES 5 29 9 4 47 72% 28%
Swansfield ES 4 30 2 9 4 49 72% 28%
Bryant Woods ES 6 20 9 1 36 72% 28%
Talbott Springs ES 9 25 1 13 1 49 71% 29%
Phelps Luck ES 7 28 12 3 50 70% 30%
Waterloo ES 12 32 14 5 63 70% 30%
Forest Ridge ES 10 26 11 5 52 69% 31%
Jeffers Hill ES 4 14 7 2 27 67% 33%
Stevens Forest ES 6 20 7 6 39 67% 33%
Longfellow ES 11 30 16 6 63 65% 35%
2012-2013 HCEA Job Satisfaction Survey
27
School/Worksite Strongly
Agree
Agree Does
Not
Apply
Disagree Strongly
Disagree
Grand
Total
%
AGREE
%
DISAGREE
High 261 490 7 111 41 910 83% 17%
Mt. Hebron HS 29 38 4 71 94% 6%
Marriotts Ridge HS 26 27 2 3 1 59 93% 7%
Reservoir HS 27 51 9 1 88 89% 11%
Glenelg HS 14 31 5 2 52 87% 13%
River Hill HS 27 45 1 11 1 85 86% 14%
Wilde Lake HS 16 51 1 7 5 80 85% 15%
Long Reach HS 19 48 1 13 2 83 82% 18%
Centennial HS 22 45 1 13 3 84 81% 19%
Howard HS 29 54 15 8 106 78% 22%
Oakland Mills HS 11 37 8 6 62 77% 23%
Atholton HS 17 33 1 11 4 66 77% 23%
Hammond HS 24 30 12 8 74 73% 27%
Middle 225 421 6 107 37 796 82% 18%
Patapsco MS 17 26 1 1 45 98% 2%
Burleigh Manor MS 16 20 2 38 95% 5%
Harper's Choice MS 12 40 1 2 1 56 95% 5%
Folly Quarter MS 22 16 1 3 42 93% 7%
Mount View MS 22 16 3 1 42 90% 10%
Elkridge Landing MS 11 20 5 36 86% 14%
Mayfield Woods MS 20 26 8 1 55 84% 16%
Patuxent Valley MS 13 21 5 2 41 83% 17%
Dunloggin MS 8 18 4 2 32 81% 19%
Hammond MS 12 17 5 2 36 81% 19%
Ellicott Mills MS 8 24 3 5 40 80% 20%
Clarksville MS 12 22 8 1 43 79% 21%
Oakland Mills MS 6 26 7 2 41 78% 22%
Murray Hill MS 10 21 8 2 41 76% 24%
Glenwood MS 7 25 8 3 43 74% 26%
Lake Elkhorn MS 7 24 1 8 3 43 74% 26%
Lime Kiln MS 9 18 1 7 4 39 71% 29%
Bonnie Branch MS 9 19 9 3 40 70% 30%
Wilde Lake MS 4 22 1 11 5 43 62% 38%
Special 87 111 6 22 3 229 89% 11%
ARL 13 14 6 33 82% 18%
Ascend One 11 7 1 19 95% 5%
Building Services 3 3 100% 0%
Cedar Lane 16 24 3 43 100% 0%
Central Office 20 35 2 9 1 67 85% 15%
Cluster Nurse 1 8 1 1 11 82% 18%
County Diagnostic Center 4 2 1 7 86% 14%
Health Services 4 1 5 80% 20%
Homewood Center 17 14 1 2 34 94% 6%
PPWS 1 1 1 3 67% 33%
Psychologist 1 2 1 4 75% 25%
Grand Total 997 2055 33 485 178 3748 82% 18%
2012-2013 HCEA Job Satisfaction Survey
28
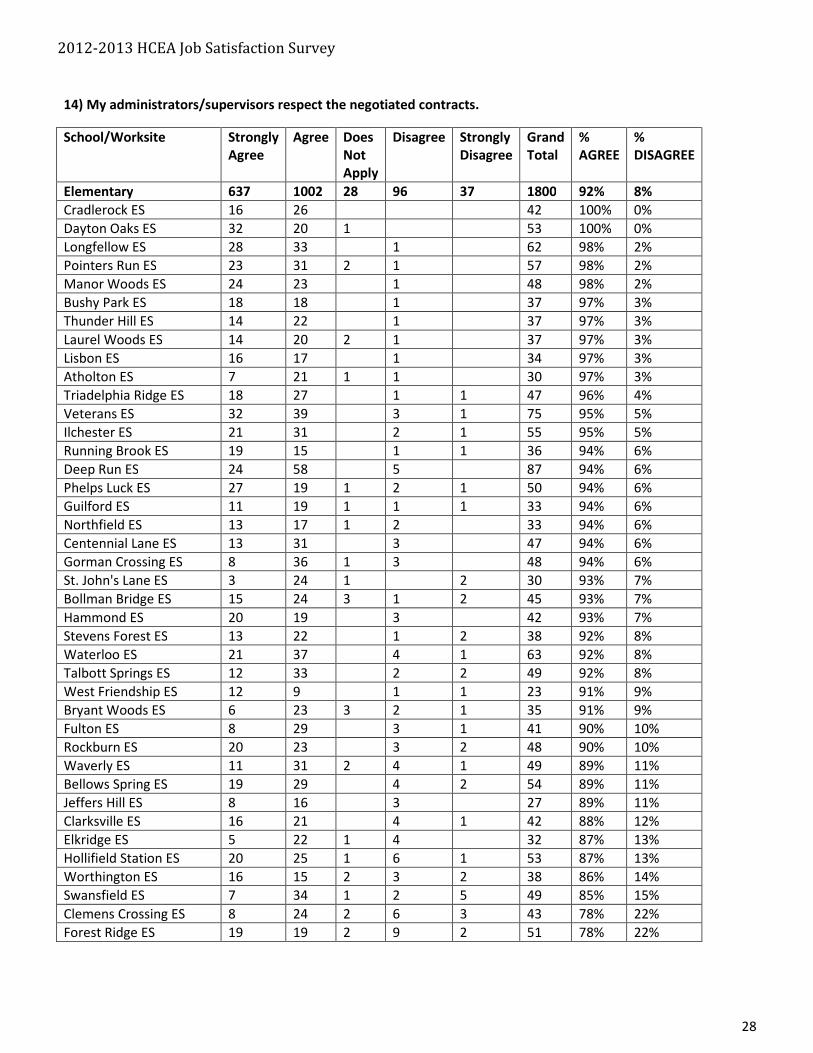
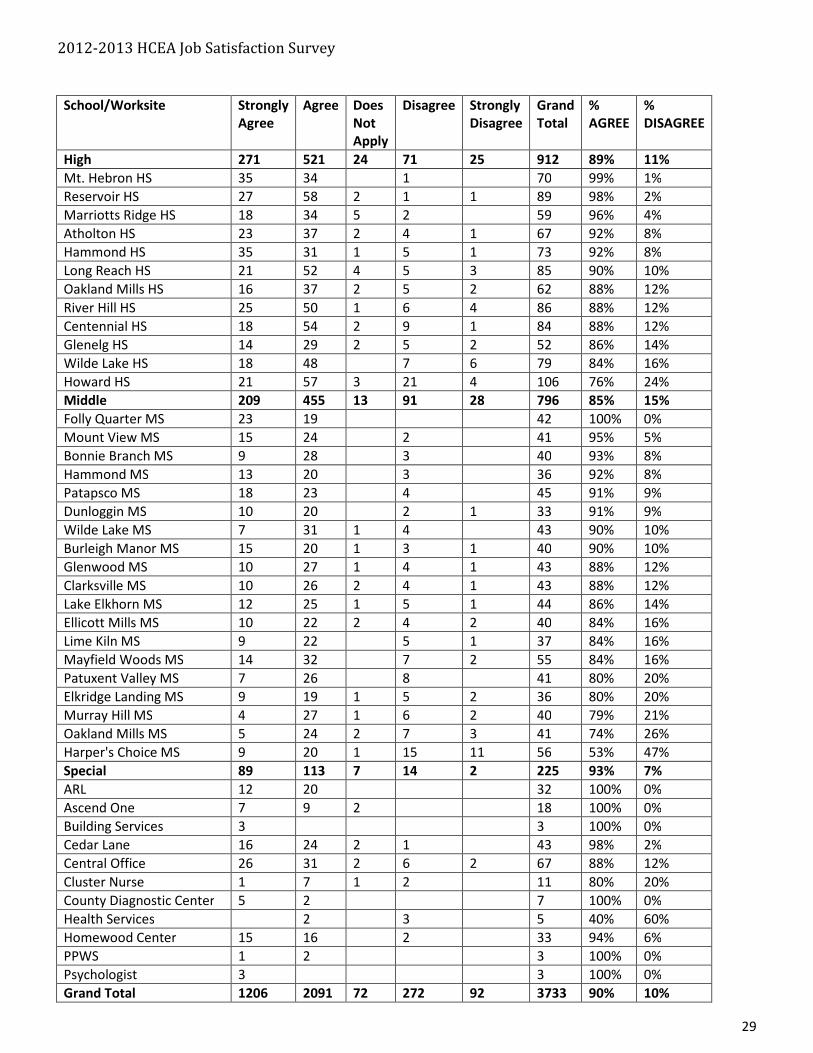
14) My administrators/supervisors respect the negotiated contracts.
School/Worksite Strongly
Agree
Agree Does
Not
Apply
Disagree Strongly
Disagree
Grand
Total
%
AGREE
%
DISAGREE
Elementary 637 1002 28 96 37 1800 92% 8%
Cradlerock ES 16 26 42 100% 0%
Dayton Oaks ES 32 20 1 53 100% 0%
Longfellow ES 28 33 1 62 98% 2%
Pointers Run ES 23 31 2 1 57 98% 2%
Manor Woods ES 24 23 1 48 98% 2%
Bushy Park ES 18 18 1 37 97% 3%
Thunder Hill ES 14 22 1 37 97% 3%
Laurel Woods ES 14 20 2 1 37 97% 3%
Lisbon ES 16 17 1 34 97% 3%
Atholton ES 7 21 1 1 30 97% 3%
Triadelphia Ridge ES 18 27 1 1 47 96% 4%
Veterans ES 32 39 3 1 75 95% 5%
Ilchester ES 21 31 2 1 55 95% 5%
Running Brook ES 19 15 1 1 36 94% 6%
Deep Run ES 24 58 5 87 94% 6%
Phelps Luck ES 27 19 1 2 1 50 94% 6%
Guilford ES 11 19 1 1 1 33 94% 6%
Northfield ES 13 17 1 2 33 94% 6%
Centennial Lane ES 13 31 3 47 94% 6%
Gorman Crossing ES 8 36 1 3 48 94% 6%
St. John's Lane ES 3 24 1 2 30 93% 7%
Bollman Bridge ES 15 24 3 1 2 45 93% 7%
Hammond ES 20 19 3 42 93% 7%
Stevens Forest ES 13 22 1 2 38 92% 8%
Waterloo ES 21 37 4 1 63 92% 8%
Talbott Springs ES 12 33 2 2 49 92% 8%
West Friendship ES 12 9 1 1 23 91% 9%
Bryant Woods ES 6 23 3 2 1 35 91% 9%
Fulton ES 8 29 3 1 41 90% 10%
Rockburn ES 20 23 3 2 48 90% 10%
Waverly ES 11 31 2 4 1 49 89% 11%
Bellows Spring ES 19 29 4 2 54 89% 11%
Jeffers Hill ES 8 16 3 27 89% 11%
Clarksville ES 16 21 4 1 42 88% 12%
Elkridge ES 5 22 1 4 32 87% 13%
Hollifield Station ES 20 25 1 6 1 53 87% 13%
Worthington ES 16 15 2 3 2 38 86% 14%
Swansfield ES 7 34 1 2 5 49 85% 15%
Clemens Crossing ES 8 24 2 6 3 43 78% 22%
Forest Ridge ES 19 19 2 9 2 51 78% 22%
2012-2013 HCEA Job Satisfaction Survey
29
School/Worksite Strongly
Agree
Agree Does
Not
Apply
Disagree Strongly
Disagree
Grand
Total
%
AGREE
%
DISAGREE
High 271 521 24 71 25 912 89% 11%
Mt. Hebron HS 35 34 1 70 99% 1%
Reservoir HS 27 58 2 1 1 89 98% 2%
Marriotts Ridge HS 18 34 5 2 59 96% 4%
Atholton HS 23 37 2 4 1 67 92% 8%
Hammond HS 35 31 1 5 1 73 92% 8%
Long Reach HS 21 52 4 5 3 85 90% 10%
Oakland Mills HS 16 37 2 5 2 62 88% 12%
River Hill HS 25 50 1 6 4 86 88% 12%
Centennial HS 18 54 2 9 1 84 88% 12%
Glenelg HS 14 29 2 5 2 52 86% 14%
Wilde Lake HS 18 48 7 6 79 84% 16%
Howard HS 21 57 3 21 4 106 76% 24%
Middle 209 455 13 91 28 796 85% 15%
Folly Quarter MS 23 19 42 100% 0%
Mount View MS 15 24 2 41 95% 5%
Bonnie Branch MS 9 28 3 40 93% 8%
Hammond MS 13 20 3 36 92% 8%
Patapsco MS 18 23 4 45 91% 9%
Dunloggin MS 10 20 2 1 33 91% 9%
Wilde Lake MS 7 31 1 4 43 90% 10%
Burleigh Manor MS 15 20 1 3 1 40 90% 10%
Glenwood MS 10 27 1 4 1 43 88% 12%
Clarksville MS 10 26 2 4 1 43 88% 12%
Lake Elkhorn MS 12 25 1 5 1 44 86% 14%
Ellicott Mills MS 10 22 2 4 2 40 84% 16%
Lime Kiln MS 9 22 5 1 37 84% 16%
Mayfield Woods MS 14 32 7 2 55 84% 16%
Patuxent Valley MS 7 26 8 41 80% 20%
Elkridge Landing MS 9 19 1 5 2 36 80% 20%
Murray Hill MS 4 27 1 6 2 40 79% 21%
Oakland Mills MS 5 24 2 7 3 41 74% 26%
Harper's Choice MS 9 20 1 15 11 56 53% 47%
Special 89 113 7 14 2 225 93% 7%
ARL 12 20 32 100% 0%
Ascend One 7 9 2 18 100% 0%
Building Services 3 3 100% 0%
Cedar Lane 16 24 2 1 43 98% 2%
Central Office 26 31 2 6 2 67 88% 12%
Cluster Nurse 1 7 1 2 11 80% 20%
County Diagnostic Center 5 2 7 100% 0%
Health Services 2 3 5 40% 60%
Homewood Center 15 16 2 33 94% 6%
PPWS 1 2 3 100% 0%
Psychologist 3 3 100% 0%
Grand Total 1206 2091 72 272 92 3733 90% 10%
2012-2013 HCEA Job Satisfaction Survey
30
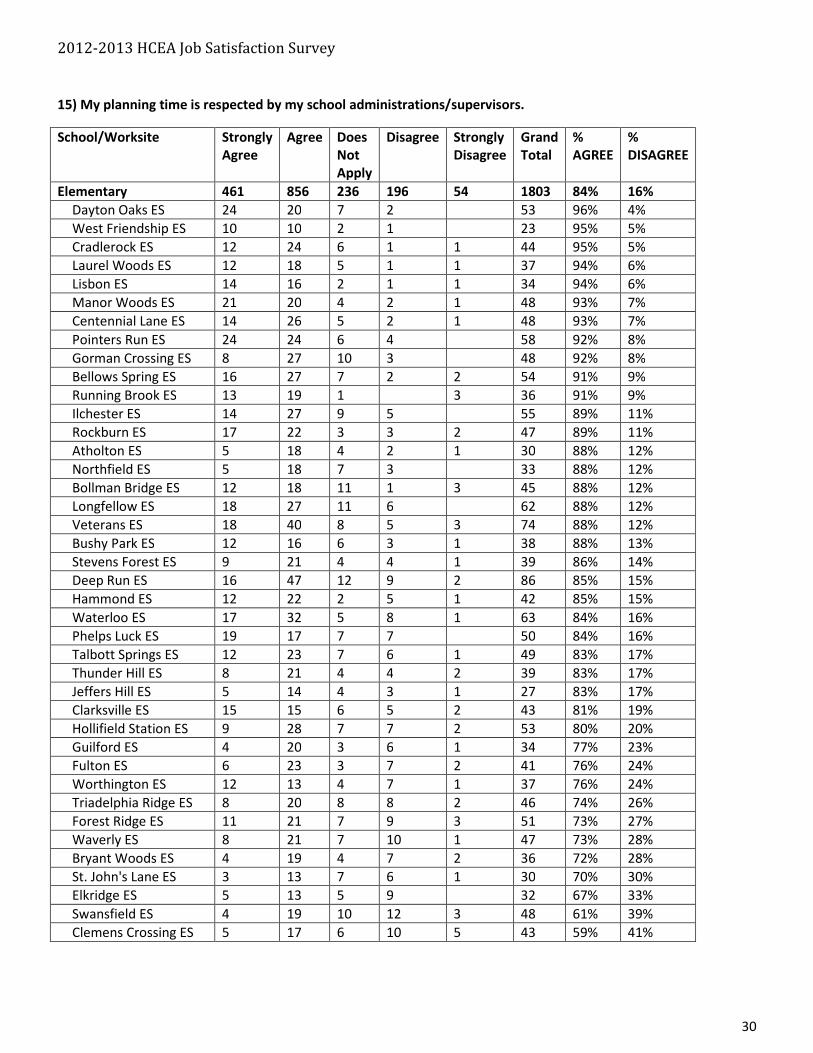
15) My planning time is respected by my school administrations/supervisors.
School/Worksite Strongly
Agree
Agree Does
Not
Apply
Disagree Strongly
Disagree
Grand
Total
%
AGREE
%
DISAGREE
Elementary 461 856 236 196 54 1803 84% 16%
Dayton Oaks ES 24 20 7 2 53 96% 4%
West Friendship ES 10 10 2 1 23 95% 5%
Cradlerock ES 12 24 6 1 1 44 95% 5%
Laurel Woods ES 12 18 5 1 1 37 94% 6%
Lisbon ES 14 16 2 1 1 34 94% 6%
Manor Woods ES 21 20 4 2 1 48 93% 7%
Centennial Lane ES 14 26 5 2 1 48 93% 7%
Pointers Run ES 24 24 6 4 58 92% 8%
Gorman Crossing ES 8 27 10 3 48 92% 8%
Bellows Spring ES 16 27 7 2 2 54 91% 9%
Running Brook ES 13 19 1 3 36 91% 9%
Ilchester ES 14 27 9 5 55 89% 11%
Rockburn ES 17 22 3 3 2 47 89% 11%
Atholton ES 5 18 4 2 1 30 88% 12%
Northfield ES 5 18 7 3 33 88% 12%
Bollman Bridge ES 12 18 11 1 3 45 88% 12%
Longfellow ES 18 27 11 6 62 88% 12%
Veterans ES 18 40 8 5 3 74 88% 12%
Bushy Park ES 12 16 6 3 1 38 88% 13%
Stevens Forest ES 9 21 4 4 1 39 86% 14%
Deep Run ES 16 47 12 9 2 86 85% 15%
Hammond ES 12 22 2 5 1 42 85% 15%
Waterloo ES 17 32 5 8 1 63 84% 16%
Phelps Luck ES 19 17 7 7 50 84% 16%
Talbott Springs ES 12 23 7 6 1 49 83% 17%
Thunder Hill ES 8 21 4 4 2 39 83% 17%
Jeffers Hill ES 5 14 4 3 1 27 83% 17%
Clarksville ES 15 15 6 5 2 43 81% 19%
Hollifield Station ES 9 28 7 7 2 53 80% 20%
Guilford ES 4 20 3 6 1 34 77% 23%
Fulton ES 6 23 3 7 2 41 76% 24%
Worthington ES 12 13 4 7 1 37 76% 24%
Triadelphia Ridge ES 8 20 8 8 2 46 74% 26%
Forest Ridge ES 11 21 7 9 3 51 73% 27%
Waverly ES 8 21 7 10 1 47 73% 28%
Bryant Woods ES 4 19 4 7 2 36 72% 28%
St. John's Lane ES 3 13 7 6 1 30 70% 30%
Elkridge ES 5 13 5 9 32 67% 33%
Swansfield ES 4 19 10 12 3 48 61% 39%
Clemens Crossing ES 5 17 6 10 5 43 59% 41%

2012-2013 HCEA Job Satisfaction Survey
31
School/Worksite Strongly
Agree
Agree Does
Not
Apply
Disagree Strongly
Disagree
Grand
Total
%
AGREE
%
DISAGREE
High 232 442 129 83 23 909 86% 14%
Glenelg HS 15 27 8 1 1 52 95% 5%
Oakland Mills HS 11 36 12 3 62 94% 6%
Hammond HS 29 32 7 4 1 73 92% 8%
Mt. Hebron HS 30 31 5 5 71 92% 8%
Reservoir HS 22 50 8 7 87 91% 9%
Atholton HS 22 22 15 3 3 65 88% 12%
Marriotts Ridge HS 16 21 15 6 58 86% 14%
Long Reach HS 18 43 13 8 3 85 85% 15%
Howard HS 12 64 15 9 6 106 84% 16%
Centennial HS 22 40 7 12 2 83 82% 18%
River Hill HS 20 43 8 11 4 86 81% 19%
Wilde Lake HS 15 33 16 14 3 81 74% 26%
Middle 154 385 94 117 49 799 76% 24%
Burleigh Manor MS 15 17 5 1 2 40 91% 9%
Glenwood MS 9 21 9 4 43 88% 12%
Wilde Lake MS 5 28 5 5 43 87% 13%
Mount View MS 9 22 6 4 1 42 86% 14%
Folly Quarter MS 23 8 5 4 2 42 84% 16%
Patapsco MS 15 21 2 7 45 84% 16%
Murray Hill MS 6 23 6 3 3 41 83% 17%
Lime Kiln MS 5 20 7 7 39 78% 22%
Ellicott Mills MS 6 21 5 6 2 40 77% 23%
Mayfield Woods MS 12 25 7 7 4 55 77% 23%
Hammond MS 8 18 2 7 1 36 76% 24%
Bonnie Branch MS 5 22 4 7 2 40 75% 25%
Patuxent Valley MS 4 22 6 6 3 41 74% 26%
Dunloggin MS 6 14 4 7 1 32 71% 29%
Clarksville MS 4 22 5 8 4 43 68% 32%
Oakland Mills MS 3 23 3 10 2 41 68% 32%
Lake Elkhorn MS 6 22 3 6 7 44 68% 32%
Elkridge Landing MS 6 18 8 4 36 67% 33%
Harper's Choice MS 7 18 10 10 11 56 54% 46%
Special 44 53 118 9 3 227 89% 11%
ARL 10 10 12 1 33 95% 5%
Ascend One 3 2 11 2 18 71% 29%
Building Services 3 3 100% 0%
Cedar Lane 6 14 18 2 3 43 80% 20%
Central Office 8 8 51 67 100% 0%
Cluster Nurse 2 7 1 10 67% 33%
County Diagnostic Center 3 2 2 7 100% 0%
Health Services 1 3 1 5 50% 50%
Homewood Center 9 12 11 2 34 91% 9%
PPWS 1 1 1 3 100% 0%
Psychologist 1 1 2 4 100% 0%
Grand Total 891 1736 577 405 129 3738 83% 17%
2012-2013 HCEA Job Satisfaction Survey
32
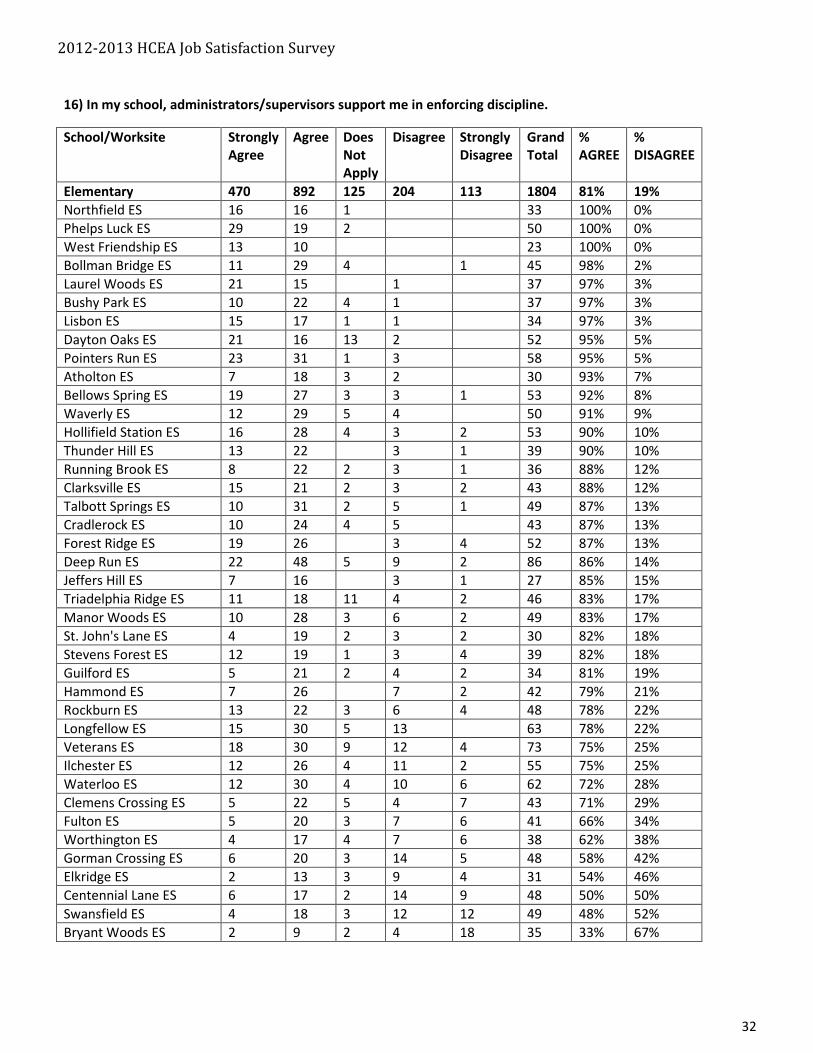
16) In my school, administrators/supervisors support me in enforcing discipline.
School/Worksite Strongly
Agree
Agree Does
Not
Apply
Disagree Strongly
Disagree
Grand
Total
%
AGREE
%
DISAGREE
Elementary 470 892 125 204 113 1804 81% 19%
Northfield ES 16 16 1 33 100% 0%
Phelps Luck ES 29 19 2 50 100% 0%
West Friendship ES 13 10 23 100% 0%
Bollman Bridge ES 11 29 4 1 45 98% 2%
Laurel Woods ES 21 15 1 37 97% 3%
Bushy Park ES 10 22 4 1 37 97% 3%
Lisbon ES 15 17 1 1 34 97% 3%
Dayton Oaks ES 21 16 13 2 52 95% 5%
Pointers Run ES 23 31 1 3 58 95% 5%
Atholton ES 7 18 3 2 30 93% 7%
Bellows Spring ES 19 27 3 3 1 53 92% 8%
Waverly ES 12 29 5 4 50 91% 9%
Hollifield Station ES 16 28 4 3 2 53 90% 10%
Thunder Hill ES 13 22 3 1 39 90% 10%
Running Brook ES 8 22 2 3 1 36 88% 12%
Clarksville ES 15 21 2 3 2 43 88% 12%
Talbott Springs ES 10 31 2 5 1 49 87% 13%
Cradlerock ES 10 24 4 5 43 87% 13%
Forest Ridge ES 19 26 3 4 52 87% 13%
Deep Run ES 22 48 5 9 2 86 86% 14%
Jeffers Hill ES 7 16 3 1 27 85% 15%
Triadelphia Ridge ES 11 18 11 4 2 46 83% 17%
Manor Woods ES 10 28 3 6 2 49 83% 17%
St. John's Lane ES 4 19 2 3 2 30 82% 18%
Stevens Forest ES 12 19 1 3 4 39 82% 18%
Guilford ES 5 21 2 4 2 34 81% 19%
Hammond ES 7 26 7 2 42 79% 21%
Rockburn ES 13 22 3 6 4 48 78% 22%
Longfellow ES 15 30 5 13 63 78% 22%
Veterans ES 18 30 9 12 4 73 75% 25%
Ilchester ES 12 26 4 11 2 55 75% 25%
Waterloo ES 12 30 4 10 6 62 72% 28%
Clemens Crossing ES 5 22 5 4 7 43 71% 29%
Fulton ES 5 20 3 7 6 41 66% 34%
Worthington ES 4 17 4 7 6 38 62% 38%
Gorman Crossing ES 6 20 3 14 5 48 58% 42%
Elkridge ES 2 13 3 9 4 31 54% 46%
Centennial Lane ES 6 17 2 14 9 48 50% 50%
Swansfield ES 4 18 3 12 12 49 48% 52%
Bryant Woods ES 2 9 2 4 18 35 33% 67%
2012-2013 HCEA Job Satisfaction Survey
33
School/Worksite Strongly
Agree
Agree Does
Not
Apply
Disagree Strongly
Disagree
Grand
Total
%
AGREE
%
DISAGREE
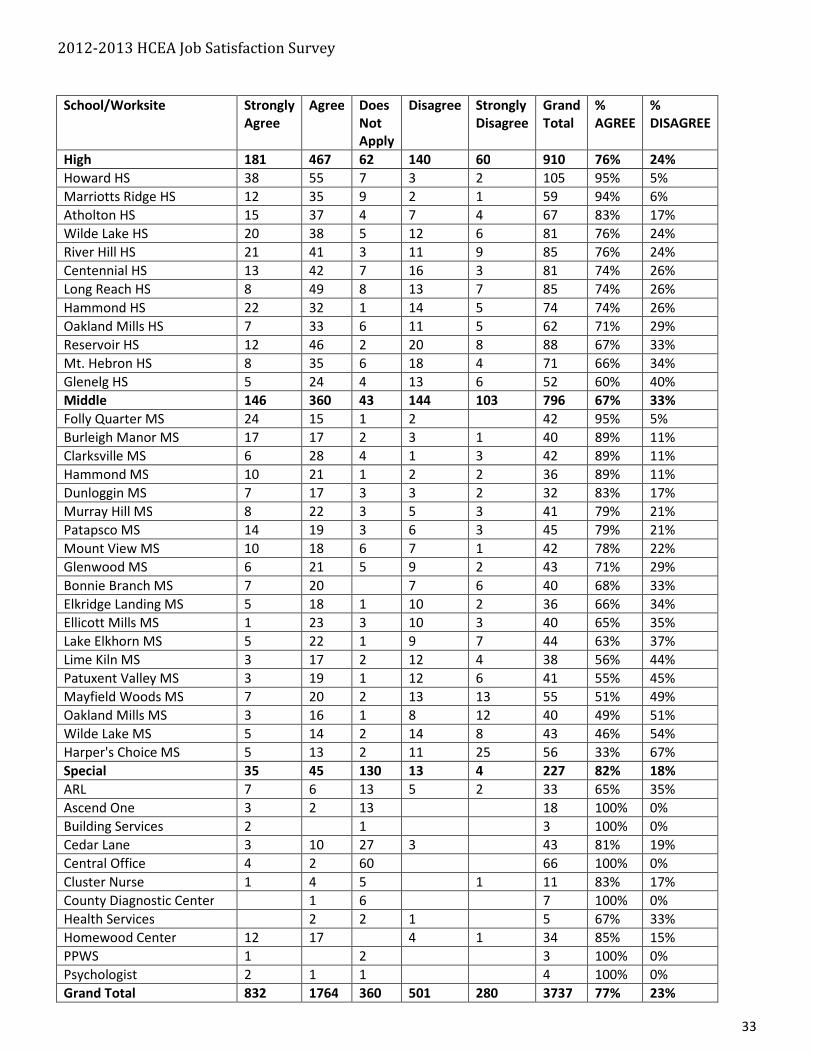
High 181 467 62 140 60 910 76% 24%
Howard HS 38 55 7 3 2 105 95% 5%
Marriotts Ridge HS 12 35 9 2 1 59 94% 6%
Atholton HS 15 37 4 7 4 67 83% 17%
Wilde Lake HS 20 38 5 12 6 81 76% 24%
River Hill HS 21 41 3 11 9 85 76% 24%
Centennial HS 13 42 7 16 3 81 74% 26%
Long Reach HS 8 49 8 13 7 85 74% 26%
Hammond HS 22 32 1 14 5 74 74% 26%
Oakland Mills HS 7 33 6 11 5 62 71% 29%
Reservoir HS 12 46 2 20 8 88 67% 33%
Mt. Hebron HS 8 35 6 18 4 71 66% 34%
Glenelg HS 5 24 4 13 6 52 60% 40%
Middle 146 360 43 144 103 796 67% 33%
Folly Quarter MS 24 15 1 2 42 95% 5%
Burleigh Manor MS 17 17 2 3 1 40 89% 11%
Clarksville MS 6 28 4 1 3 42 89% 11%
Hammond MS 10 21 1 2 2 36 89% 11%
Dunloggin MS 7 17 3 3 2 32 83% 17%
Murray Hill MS 8 22 3 5 3 41 79% 21%
Patapsco MS 14 19 3 6 3 45 79% 21%
Mount View MS 10 18 6 7 1 42 78% 22%
Glenwood MS 6 21 5 9 2 43 71% 29%
Bonnie Branch MS 7 20 7 6 40 68% 33%
Elkridge Landing MS 5 18 1 10 2 36 66% 34%
Ellicott Mills MS 1 23 3 10 3 40 65% 35%
Lake Elkhorn MS 5 22 1 9 7 44 63% 37%
Lime Kiln MS 3 17 2 12 4 38 56% 44%
Patuxent Valley MS 3 19 1 12 6 41 55% 45%
Mayfield Woods MS 7 20 2 13 13 55 51% 49%
Oakland Mills MS 3 16 1 8 12 40 49% 51%
Wilde Lake MS 5 14 2 14 8 43 46% 54%
Harper's Choice MS 5 13 2 11 25 56 33% 67%
Special 35 45 130 13 4 227 82% 18%
ARL 7 6 13 5 2 33 65% 35%
Ascend One 3 2 13 18 100% 0%
Building Services 2 1 3 100% 0%
Cedar Lane 3 10 27 3 43 81% 19%
Central Office 4 2 60 66 100% 0%
Cluster Nurse 1 4 5 1 11 83% 17%
County Diagnostic Center 1 6 7 100% 0%
Health Services 2 2 1 5 67% 33%
Homewood Center 12 17 4 1 34 85% 15%
PPWS 1 2 3 100% 0%
Psychologist 2 1 1 4 100% 0%
Grand Total 832 1764 360 501 280 3737 77% 23%
2012-2013 HCEA Job Satisfaction Survey
34
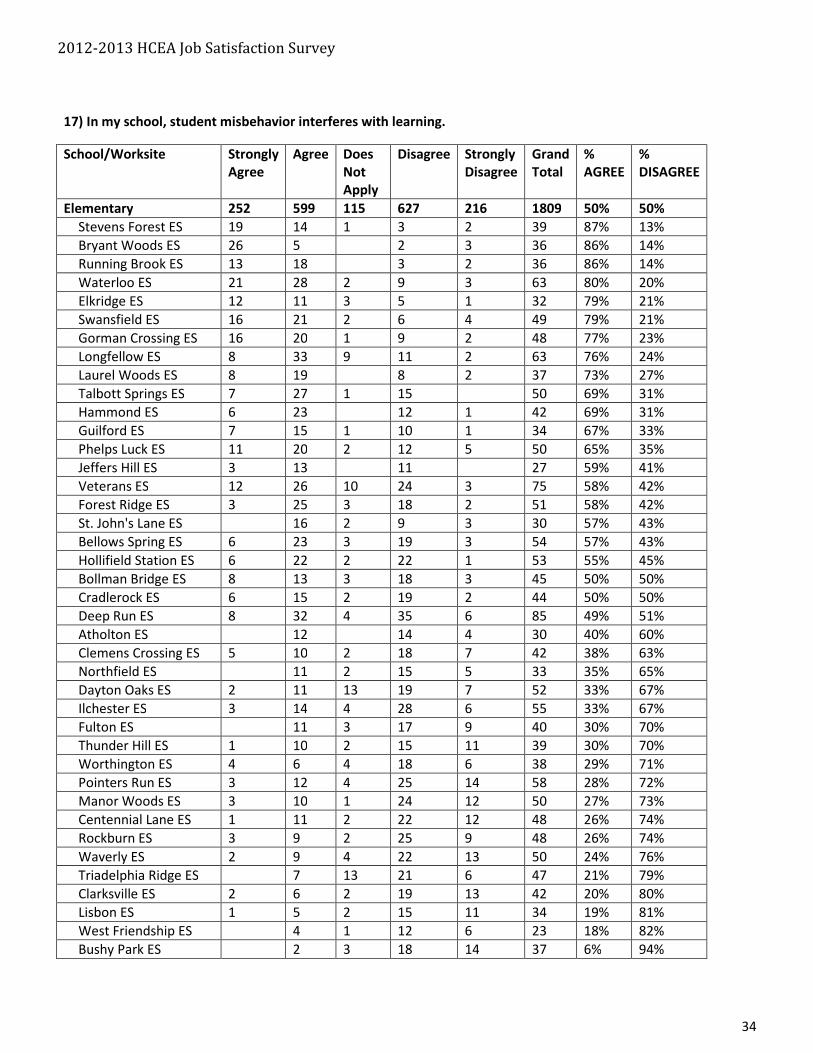
17) In my school, student misbehavior interferes with learning.
School/Worksite Strongly
Agree
Agree Does
Not
Apply
Disagree Strongly
Disagree
Grand
Total
%
AGREE
%
DISAGREE
Elementary 252 599 115 627 216 1809 50% 50%
Stevens Forest ES 19 14 1 3 2 39 87% 13%
Bryant Woods ES 26 5 2 3 36 86% 14%
Running Brook ES 13 18 3 2 36 86% 14%
Waterloo ES 21 28 2 9 3 63 80% 20%
Elkridge ES 12 11 3 5 1 32 79% 21%
Swansfield ES 16 21 2 6 4 49 79% 21%
Gorman Crossing ES 16 20 1 9 2 48 77% 23%
Longfellow ES 8 33 9 11 2 63 76% 24%
Laurel Woods ES 8 19 8 2 37 73% 27%
Talbott Springs ES 7 27 1 15 50 69% 31%
Hammond ES 6 23 12 1 42 69% 31%
Guilford ES 7 15 1 10 1 34 67% 33%
Phelps Luck ES 11 20 2 12 5 50 65% 35%
Jeffers Hill ES 3 13 11 27 59% 41%
Veterans ES 12 26 10 24 3 75 58% 42%
Forest Ridge ES 3 25 3 18 2 51 58% 42%
St. John's Lane ES 16 2 9 3 30 57% 43%
Bellows Spring ES 6 23 3 19 3 54 57% 43%
Hollifield Station ES 6 22 2 22 1 53 55% 45%
Bollman Bridge ES 8 13 3 18 3 45 50% 50%
Cradlerock ES 6 15 2 19 2 44 50% 50%
Deep Run ES 8 32 4 35 6 85 49% 51%
Atholton ES 12 14 4 30 40% 60%
Clemens Crossing ES 5 10 2 18 7 42 38% 63%
Northfield ES 11 2 15 5 33 35% 65%
Dayton Oaks ES 2 11 13 19 7 52 33% 67%
Ilchester ES 3 14 4 28 6 55 33% 67%
Fulton ES 11 3 17 9 40 30% 70%
Thunder Hill ES 1 10 2 15 11 39 30% 70%
Worthington ES 4 6 4 18 6 38 29% 71%
Pointers Run ES 3 12 4 25 14 58 28% 72%
Manor Woods ES 3 10 1 24 12 50 27% 73%
Centennial Lane ES 1 11 2 22 12 48 26% 74%
Rockburn ES 3 9 2 25 9 48 26% 74%
Waverly ES 2 9 4 22 13 50 24% 76%
Triadelphia Ridge ES 7 13 21 6 47 21% 79%
Clarksville ES 2 6 2 19 13 42 20% 80%
Lisbon ES 1 5 2 15 11 34 19% 81%
West Friendship ES 4 1 12 6 23 18% 82%
Bushy Park ES 2 3 18 14 37 6% 94%
2012-2013 HCEA Job Satisfaction Survey
35
School/Worksite Strongly
Agree
Agree Does
Not
Apply
Disagree Strongly
Disagree
Grand
Total
%
AGREE
%
DISAGREE
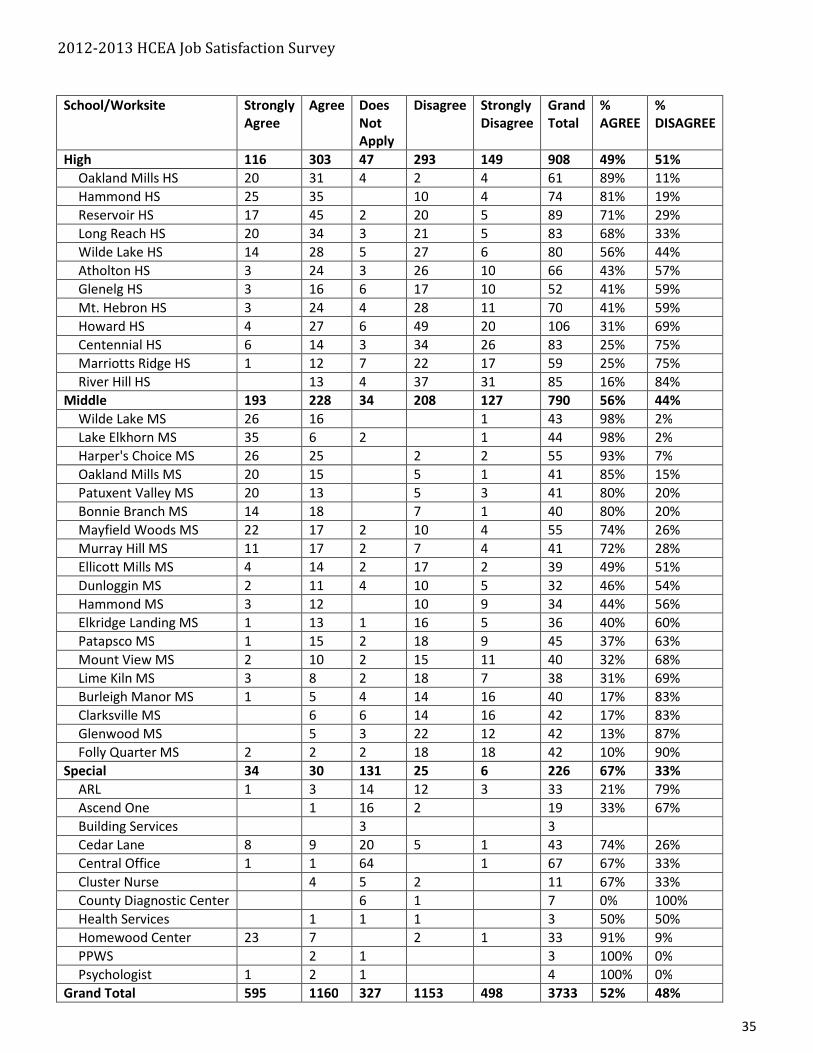
High 116 303 47 293 149 908 49% 51%
Oakland Mills HS 20 31 4 2 4 61 89% 11%
Hammond HS 25 35 10 4 74 81% 19%
Reservoir HS 17 45 2 20 5 89 71% 29%
Long Reach HS 20 34 3 21 5 83 68% 33%
Wilde Lake HS 14 28 5 27 6 80 56% 44%
Atholton HS 3 24 3 26 10 66 43% 57%
Glenelg HS 3 16 6 17 10 52 41% 59%
Mt. Hebron HS 3 24 4 28 11 70 41% 59%
Howard HS 4 27 6 49 20 106 31% 69%
Centennial HS 6 14 3 34 26 83 25% 75%
Marriotts Ridge HS 1 12 7 22 17 59 25% 75%
River Hill HS 13 4 37 31 85 16% 84%
Middle 193 228 34 208 127 790 56% 44%
Wilde Lake MS 26 16 1 43 98% 2%
Lake Elkhorn MS 35 6 2 1 44 98% 2%
Harper's Choice MS 26 25 2 2 55 93% 7%
Oakland Mills MS 20 15 5 1 41 85% 15%
Patuxent Valley MS 20 13 5 3 41 80% 20%
Bonnie Branch MS 14 18 7 1 40 80% 20%
Mayfield Woods MS 22 17 2 10 4 55 74% 26%
Murray Hill MS 11 17 2 7 4 41 72% 28%
Ellicott Mills MS 4 14 2 17 2 39 49% 51%
Dunloggin MS 2 11 4 10 5 32 46% 54%
Hammond MS 3 12 10 9 34 44% 56%
Elkridge Landing MS 1 13 1 16 5 36 40% 60%
Patapsco MS 1 15 2 18 9 45 37% 63%
Mount View MS 2 10 2 15 11 40 32% 68%
Lime Kiln MS 3 8 2 18 7 38 31% 69%
Burleigh Manor MS 1 5 4 14 16 40 17% 83%
Clarksville MS 6 6 14 16 42 17% 83%
Glenwood MS 5 3 22 12 42 13% 87%
Folly Quarter MS 2 2 2 18 18 42 10% 90%
Special 34 30 131 25 6 226 67% 33%
ARL 1 3 14 12 3 33 21% 79%
Ascend One 1 16 2 19 33% 67%
Building Services 3 3
Cedar Lane 8 9 20 5 1 43 74% 26%
Central Office 1 1 64 1 67 67% 33%
Cluster Nurse 4 5 2 11 67% 33%
County Diagnostic Center 6 1 7 0% 100%
Health Services 1 1 1 3 50% 50%
Homewood Center 23 7 2 1 33 91% 9%
PPWS 2 1 3 100% 0%
Psychologist 1 2 1 4 100% 0%
Grand Total 595 1160 327 1153 498 3733 52% 48%
2012-2013 HCEA Job Satisfaction Survey
36
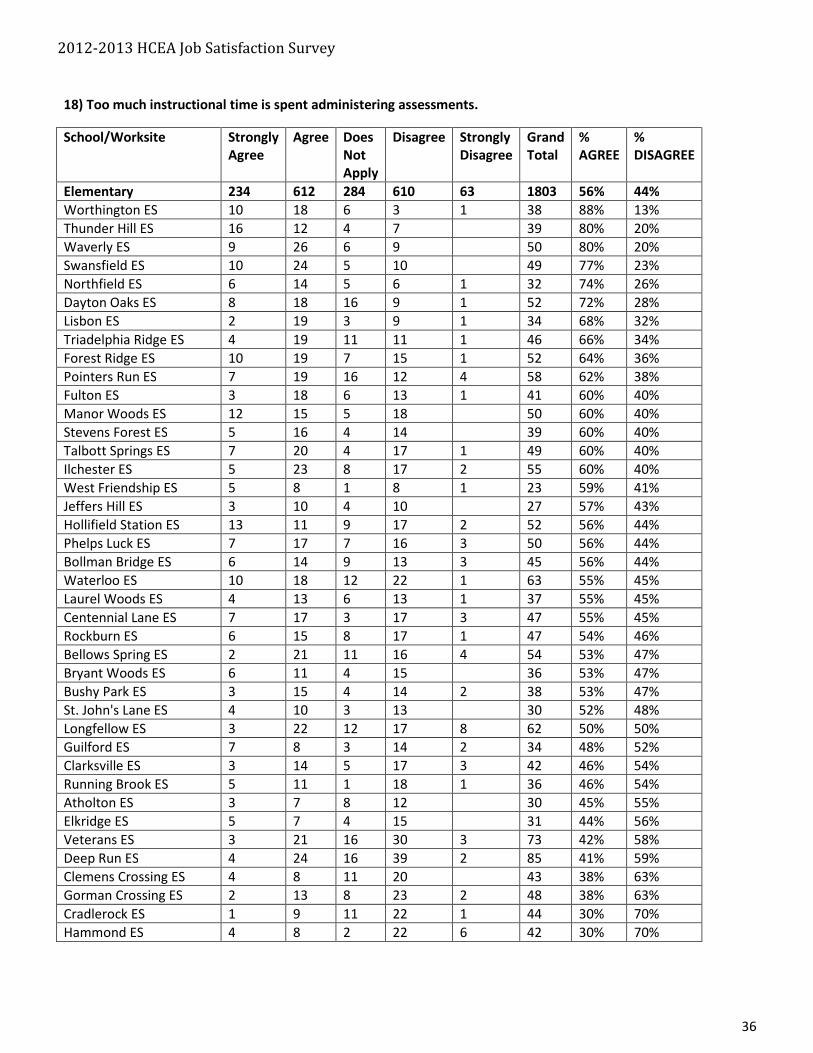
18) Too much instructional time is spent administering assessments.
School/Worksite Strongly
Agree
Agree Does
Not
Apply
Disagree Strongly
Disagree
Grand
Total
%
AGREE
%
DISAGREE
Elementary 234 612 284 610 63 1803 56% 44%
Worthington ES 10 18 6 3 1 38 88% 13%
Thunder Hill ES 16 12 4 7 39 80% 20%
Waverly ES 9 26 6 9 50 80% 20%
Swansfield ES 10 24 5 10 49 77% 23%
Northfield ES 6 14 5 6 1 32 74% 26%
Dayton Oaks ES 8 18 16 9 1 52 72% 28%
Lisbon ES 2 19 3 9 1 34 68% 32%
Triadelphia Ridge ES 4 19 11 11 1 46 66% 34%
Forest Ridge ES 10 19 7 15 1 52 64% 36%
Pointers Run ES 7 19 16 12 4 58 62% 38%
Fulton ES 3 18 6 13 1 41 60% 40%
Manor Woods ES 12 15 5 18 50 60% 40%
Stevens Forest ES 5 16 4 14 39 60% 40%
Talbott Springs ES 7 20 4 17 1 49 60% 40%
Ilchester ES 5 23 8 17 2 55 60% 40%
West Friendship ES 5 8 1 8 1 23 59% 41%
Jeffers Hill ES 3 10 4 10 27 57% 43%
Hollifield Station ES 13 11 9 17 2 52 56% 44%
Phelps Luck ES 7 17 7 16 3 50 56% 44%
Bollman Bridge ES 6 14 9 13 3 45 56% 44%
Waterloo ES 10 18 12 22 1 63 55% 45%
Laurel Woods ES 4 13 6 13 1 37 55% 45%
Centennial Lane ES 7 17 3 17 3 47 55% 45%
Rockburn ES 6 15 8 17 1 47 54% 46%
Bellows Spring ES 2 21 11 16 4 54 53% 47%
Bryant Woods ES 6 11 4 15 36 53% 47%
Bushy Park ES 3 15 4 14 2 38 53% 47%
St. John's Lane ES 4 10 3 13 30 52% 48%
Longfellow ES 3 22 12 17 8 62 50% 50%
Guilford ES 7 8 3 14 2 34 48% 52%
Clarksville ES 3 14 5 17 3 42 46% 54%
Running Brook ES 5 11 1 18 1 36 46% 54%
Atholton ES 3 7 8 12 30 45% 55%
Elkridge ES 5 7 4 15 31 44% 56%
Veterans ES 3 21 16 30 3 73 42% 58%
Deep Run ES 4 24 16 39 2 85 41% 59%
Clemens Crossing ES 4 8 11 20 43 38% 63%
Gorman Crossing ES 2 13 8 23 2 48 38% 63%
Cradlerock ES 1 9 11 22 1 44 30% 70%
Hammond ES 4 8 2 22 6 42 30% 70%
2012-2013 HCEA Job Satisfaction Survey
37
School/Worksite Strongly
Agree
Agree Does
Not
Apply
Disagree Strongly
Disagree
Grand
Total
%
AGREE
%
DISAGREE
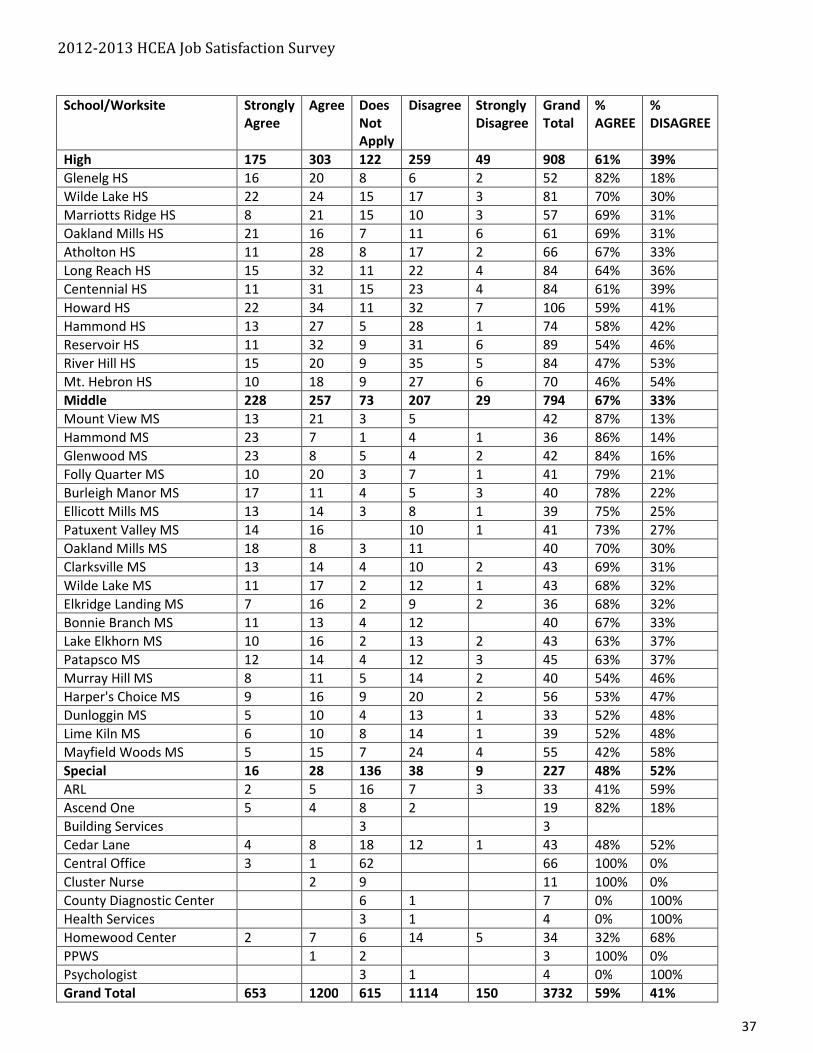
High 175 303 122 259 49 908 61% 39%
Glenelg HS 16 20 8 6 2 52 82% 18%
Wilde Lake HS 22 24 15 17 3 81 70% 30%
Marriotts Ridge HS 8 21 15 10 3 57 69% 31%
Oakland Mills HS 21 16 7 11 6 61 69% 31%
Atholton HS 11 28 8 17 2 66 67% 33%
Long Reach HS 15 32 11 22 4 84 64% 36%
Centennial HS 11 31 15 23 4 84 61% 39%
Howard HS 22 34 11 32 7 106 59% 41%
Hammond HS 13 27 5 28 1 74 58% 42%
Reservoir HS 11 32 9 31 6 89 54% 46%
River Hill HS 15 20 9 35 5 84 47% 53%
Mt. Hebron HS 10 18 9 27 6 70 46% 54%
Middle 228 257 73 207 29 794 67% 33%
Mount View MS 13 21 3 5 42 87% 13%
Hammond MS 23 7 1 4 1 36 86% 14%
Glenwood MS 23 8 5 4 2 42 84% 16%
Folly Quarter MS 10 20 3 7 1 41 79% 21%
Burleigh Manor MS 17 11 4 5 3 40 78% 22%
Ellicott Mills MS 13 14 3 8 1 39 75% 25%
Patuxent Valley MS 14 16 10 1 41 73% 27%
Oakland Mills MS 18 8 3 11 40 70% 30%
Clarksville MS 13 14 4 10 2 43 69% 31%
Wilde Lake MS 11 17 2 12 1 43 68% 32%
Elkridge Landing MS 7 16 2 9 2 36 68% 32%
Bonnie Branch MS 11 13 4 12 40 67% 33%
Lake Elkhorn MS 10 16 2 13 2 43 63% 37%
Patapsco MS 12 14 4 12 3 45 63% 37%
Murray Hill MS 8 11 5 14 2 40 54% 46%
Harper's Choice MS 9 16 9 20 2 56 53% 47%
Dunloggin MS 5 10 4 13 1 33 52% 48%
Lime Kiln MS 6 10 8 14 1 39 52% 48%
Mayfield Woods MS 5 15 7 24 4 55 42% 58%
Special 16 28 136 38 9 227 48% 52%
ARL 2 5 16 7 3 33 41% 59%
Ascend One 5 4 8 2 19 82% 18%
Building Services 3 3
Cedar Lane 4 8 18 12 1 43 48% 52%
Central Office 3 1 62 66 100% 0%
Cluster Nurse 2 9 11 100% 0%
County Diagnostic Center 6 1 7 0% 100%
Health Services 3 1 4 0% 100%
Homewood Center 2 7 6 14 5 34 32% 68%
PPWS 1 2 3 100% 0%
Psychologist 3 1 4 0% 100%
Grand Total 653 1200 615 1114 150 3732 59% 41%
2012-2013 HCEA Job Satisfaction Survey
38
19) HCPSS professional development experiences are meaningful and worthwhile.
School/Worksite Strongly
Agree
Agree Does
Not
Apply
Disagree Strongly
Disagree
Grand
Total
%
AGREE
%
DISAGREE
Elementary 121 947 65 490 176 1799 62% 38%
West Friendship ES 20 1 2 23 87% 13%
Stevens Forest ES 3 27 2 5 2 39 81% 19%
Manor Woods ES 7 32 4 6 49 80% 20%
Cradlerock ES 4 27 2 9 1 43 76% 24%
Longfellow ES 8 37 2 9 6 62 75% 25%
Guilford ES 5 19 1 8 1 34 73% 27%
Northfield ES 2 22 6 3 33 73% 27%
Phelps Luck ES 5 27 5 9 3 49 73% 27%
Laurel Woods ES 5 20 2 10 37 71% 29%
Waterloo ES 2 42 1 16 2 63 71% 29%
Hollifield Station ES 1 35 1 10 5 52 71% 29%
Worthington ES 1 24 2 9 2 38 69% 31%
Talbott Springs ES 4 30 12 3 49 69% 31%
Fulton ES 1 26 2 10 2 41 69% 31%
Hammond ES 1 26 2 10 2 41 69% 31%
Thunder Hill ES 4 23 10 2 39 69% 31%
Rockburn ES 1 30 3 11 3 48 69% 31%
Bollman Bridge ES 4 25 2 13 1 45 67% 33%
Running Brook ES 4 20 9 3 36 67% 33%
Jeffers Hill ES 2 15 1 7 2 27 65% 35%
Veterans ES 6 40 2 20 7 75 63% 37%
Dayton Oaks ES 3 28 2 9 10 52 62% 38%
Deep Run ES 6 43 4 28 3 84 61% 39%
Centennial Lane ES 1 27 2 15 3 48 61% 39%
Bryant Woods ES 3 18 1 11 3 36 60% 40%
Elkridge ES 1 17 2 9 3 32 60% 40%
Triadelphia Ridge ES 27 1 15 4 47 59% 41%
Gorman Crossing ES 1 26 1 16 4 48 57% 43%
Pointers Run ES 8 24 2 16 8 58 57% 43%
Swansfield ES 3 22 2 13 9 49 53% 47%
Clarksville ES 7 13 2 14 7 43 49% 51%
Lisbon ES 16 11 6 33 48% 52%
Bushy Park ES 2 16 15 5 38 47% 53%
Ilchester ES 4 20 3 16 11 54 47% 53%
Bellows Spring ES 4 20 1 21 7 53 46% 54%
St. John's Lane ES 2 11 1 13 3 30 45% 55%
Atholton ES 1 11 3 11 4 30 44% 56%
Forest Ridge ES 2 19 1 22 6 50 43% 57%
Waverly ES 1 15 4 18 12 50 35% 65%
Clemens Crossing ES 2 7 3 19 10 41 24% 76%
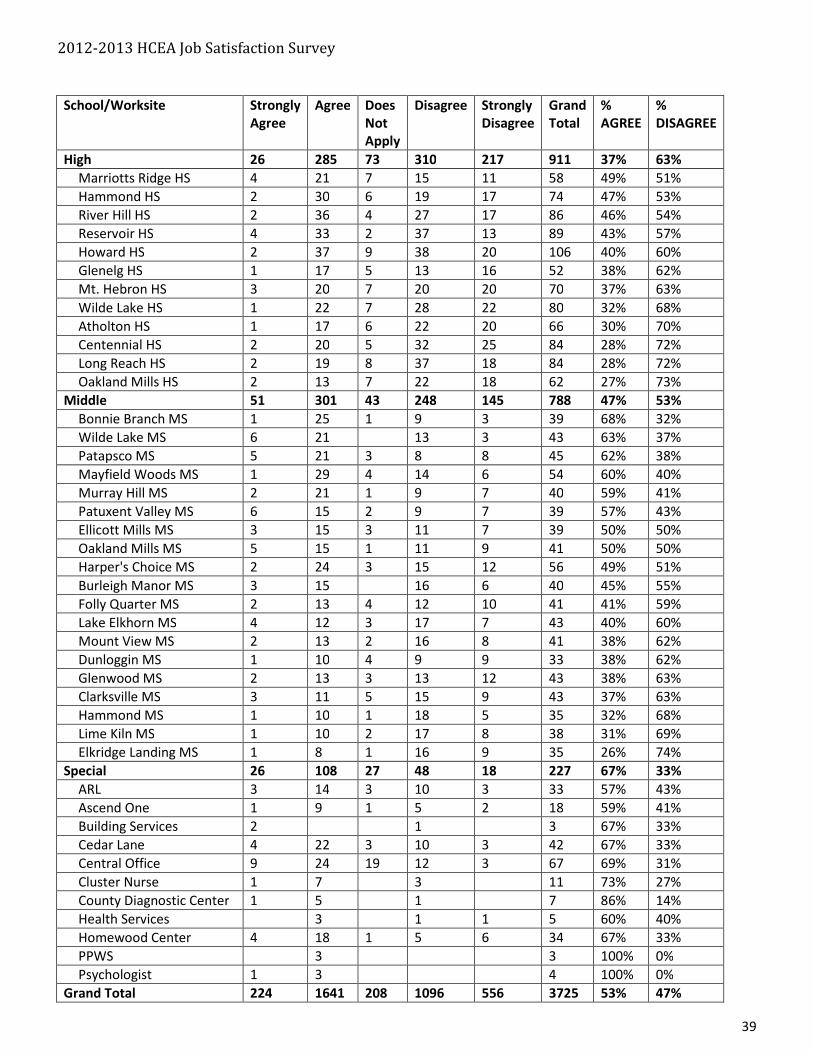
2012-2013 HCEA Job Satisfaction Survey
39
School/Worksite Strongly
Agree
Agree Does
Not
Apply
Disagree Strongly
Disagree
Grand
Total
%
AGREE
%
DISAGREE
High 26 285 73 310 217 911 37% 63%
Marriotts Ridge HS 4 21 7 15 11 58 49% 51%
Hammond HS 2 30 6 19 17 74 47% 53%
River Hill HS 2 36 4 27 17 86 46% 54%
Reservoir HS 4 33 2 37 13 89 43% 57%
Howard HS 2 37 9 38 20 106 40% 60%
Glenelg HS 1 17 5 13 16 52 38% 62%
Mt. Hebron HS 3 20 7 20 20 70 37% 63%
Wilde Lake HS 1 22 7 28 22 80 32% 68%
Atholton HS 1 17 6 22 20 66 30% 70%
Centennial HS 2 20 5 32 25 84 28% 72%
Long Reach HS 2 19 8 37 18 84 28% 72%
Oakland Mills HS 2 13 7 22 18 62 27% 73%
Middle 51 301 43 248 145 788 47% 53%
Bonnie Branch MS 1 25 1 9 3 39 68% 32%
Wilde Lake MS 6 21 13 3 43 63% 37%
Patapsco MS 5 21 3 8 8 45 62% 38%
Mayfield Woods MS 1 29 4 14 6 54 60% 40%
Murray Hill MS 2 21 1 9 7 40 59% 41%
Patuxent Valley MS 6 15 2 9 7 39 57% 43%
Ellicott Mills MS 3 15 3 11 7 39 50% 50%
Oakland Mills MS 5 15 1 11 9 41 50% 50%
Harper's Choice MS 2 24 3 15 12 56 49% 51%
Burleigh Manor MS 3 15 16 6 40 45% 55%
Folly Quarter MS 2 13 4 12 10 41 41% 59%
Lake Elkhorn MS 4 12 3 17 7 43 40% 60%
Mount View MS 2 13 2 16 8 41 38% 62%
Dunloggin MS 1 10 4 9 9 33 38% 62%
Glenwood MS 2 13 3 13 12 43 38% 63%
Clarksville MS 3 11 5 15 9 43 37% 63%
Hammond MS 1 10 1 18 5 35 32% 68%
Lime Kiln MS 1 10 2 17 8 38 31% 69%
Elkridge Landing MS 1 8 1 16 9 35 26% 74%
Special 26 108 27 48 18 227 67% 33%
ARL 3 14 3 10 3 33 57% 43%
Ascend One 1 9 1 5 2 18 59% 41%
Building Services 2 1 3 67% 33%
Cedar Lane 4 22 3 10 3 42 67% 33%
Central Office 9 24 19 12 3 67 69% 31%
Cluster Nurse 1 7 3 11 73% 27%
County Diagnostic Center 1 5 1 7 86% 14%
Health Services 3 1 1 5 60% 40%
Homewood Center 4 18 1 5 6 34 67% 33%
PPWS 3 3 100% 0%
Psychologist 1 3 4 100% 0%
Grand Total 224 1641 208 1096 556 3725 53% 47%
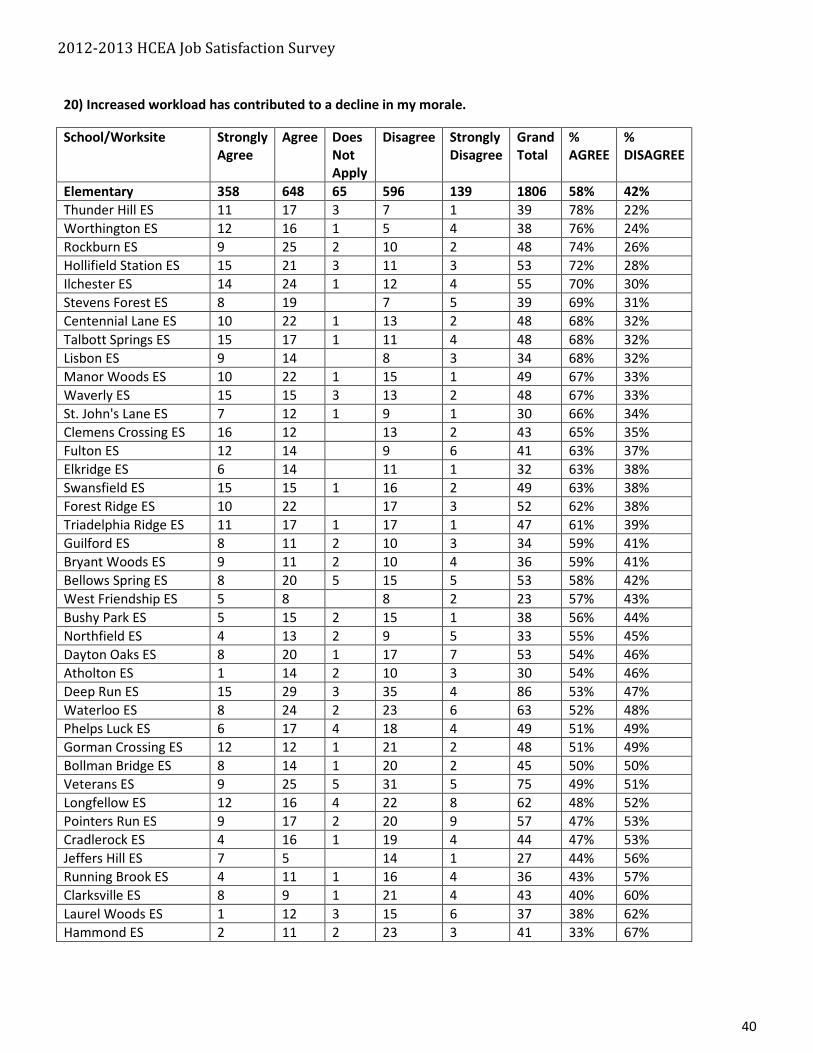
2012-2013 HCEA Job Satisfaction Survey
40
20) Increased workload has contributed to a decline in my morale.
School/Worksite Strongly
Agree
Agree Does
Not
Apply
Disagree Strongly
Disagree
Grand
Total
%
AGREE
%
DISAGREE
Elementary 358 648 65 596 139 1806 58% 42%
Thunder Hill ES 11 17 3 7 1 39 78% 22%
Worthington ES 12 16 1 5 4 38 76% 24%
Rockburn ES 9 25 2 10 2 48 74% 26%
Hollifield Station ES 15 21 3 11 3 53 72% 28%
Ilchester ES 14 24 1 12 4 55 70% 30%
Stevens Forest ES 8 19 7 5 39 69% 31%
Centennial Lane ES 10 22 1 13 2 48 68% 32%
Talbott Springs ES 15 17 1 11 4 48 68% 32%
Lisbon ES 9 14 8 3 34 68% 32%
Manor Woods ES 10 22 1 15 1 49 67% 33%
Waverly ES 15 15 3 13 2 48 67% 33%
St. John's Lane ES 7 12 1 9 1 30 66% 34%
Clemens Crossing ES 16 12 13 2 43 65% 35%
Fulton ES 12 14 9 6 41 63% 37%
Elkridge ES 6 14 11 1 32 63% 38%
Swansfield ES 15 15 1 16 2 49 63% 38%
Forest Ridge ES 10 22 17 3 52 62% 38%
Triadelphia Ridge ES 11 17 1 17 1 47 61% 39%
Guilford ES 8 11 2 10 3 34 59% 41%
Bryant Woods ES 9 11 2 10 4 36 59% 41%
Bellows Spring ES 8 20 5 15 5 53 58% 42%
West Friendship ES 5 8 8 2 23 57% 43%
Bushy Park ES 5 15 2 15 1 38 56% 44%
Northfield ES 4 13 2 9 5 33 55% 45%
Dayton Oaks ES 8 20 1 17 7 53 54% 46%
Atholton ES 1 14 2 10 3 30 54% 46%
Deep Run ES 15 29 3 35 4 86 53% 47%
Waterloo ES 8 24 2 23 6 63 52% 48%
Phelps Luck ES 6 17 4 18 4 49 51% 49%
Gorman Crossing ES 12 12 1 21 2 48 51% 49%
Bollman Bridge ES 8 14 1 20 2 45 50% 50%
Veterans ES 9 25 5 31 5 75 49% 51%
Longfellow ES 12 16 4 22 8 62 48% 52%
Pointers Run ES 9 17 2 20 9 57 47% 53%
Cradlerock ES 4 16 1 19 4 44 47% 53%
Jeffers Hill ES 7 5 14 1 27 44% 56%
Running Brook ES 4 11 1 16 4 36 43% 57%
Clarksville ES 8 9 1 21 4 43 40% 60%
Laurel Woods ES 1 12 3 15 6 37 38% 62%
Hammond ES 2 11 2 23 3 41 33% 67%

2012-2013 HCEA Job Satisfaction Survey
41
School/Worksite Strongly
Agree
Agree Does
Not
Apply
Disagree Strongly
Disagree
Grand
Total
%
AGREE
%
DISAGREE
High 187 298 46 303 76 910 56% 44%
River Hill HS 30 33 1 14 6 84 76% 24%
Marriotts Ridge HS 17 19 5 11 7 59 67% 33%
Atholton HS 10 27 4 20 4 65 61% 39%
Howard HS 20 41 5 30 10 106 60% 40%
Long Reach HS 15 33 5 23 9 85 60% 40%
Glenelg HS 11 17 3 14 7 52 57% 43%
Mt. Hebron HS 9 28 5 25 4 71 56% 44%
Wilde Lake HS 21 18 7 31 4 81 53% 47%
Oakland Mills HS 15 15 2 23 6 61 51% 49%
Centennial HS 15 23 2 38 5 83 47% 53%
Reservoir HS 11 27 3 38 10 89 44% 56%
Hammond HS 13 17 4 36 4 74 43% 57%
Middle 290 262 34 165 47 798 72% 28%
Hammond MS 22 11 1 2 36 94% 6%
Mount View MS 22 11 2 6 1 42 83% 18%
Wilde Lake MS 14 20 1 6 2 43 81% 19%
Bonnie Branch MS 17 14 1 7 1 40 79% 21%
Lake Elkhorn MS 17 17 1 7 2 44 79% 21%
Oakland Mills MS 16 16 6 3 41 78% 22%
Patuxent Valley MS 17 15 8 1 41 78% 22%
Elkridge Landing MS 15 12 5 3 35 77% 23%
Burleigh Manor MS 12 17 2 5 4 40 76% 24%
Clarksville MS 18 12 3 8 2 43 75% 25%
Folly Quarter MS 19 10 3 8 2 42 74% 26%
Ellicott Mills MS 16 12 2 7 3 40 74% 26%
Glenwood MS 16 13 2 7 5 43 71% 29%
Lime Kiln MS 16 7 5 10 1 39 68% 32%
Mayfield Woods MS 13 20 3 17 2 55 63% 37%
Murray Hill MS 10 13 1 11 5 40 59% 41%
Dunloggin MS 7 10 4 9 3 33 59% 41%
Patapsco MS 10 15 1 16 3 45 57% 43%
Harper's Choice MS 13 17 2 20 4 56 56% 44%
Special 21 57 23 96 31 228 38% 62%
ARL 5 13 4 9 2 33 62% 38%
Ascend One 3 3 1 7 5 19 33% 67%
Building Services 2 1 3 0% 100%
Cedar Lane 4 14 5 16 3 42 49% 51%
Central Office 6 11 11 29 10 67 30% 70%
Cluster Nurse 1 4 1 4 1 11 50% 50%
County Diagnostic Center 6 1 7 0% 100%
Health Services 1 3 1 5 20% 80%
Homewood Center 1 10 16 7 34 32% 68%
PPWS 1 1 1 3 50% 50%
Psychologist 1 3 4 25% 75%
Grand Total 856 1265 168 1160 293 3742 59% 41%
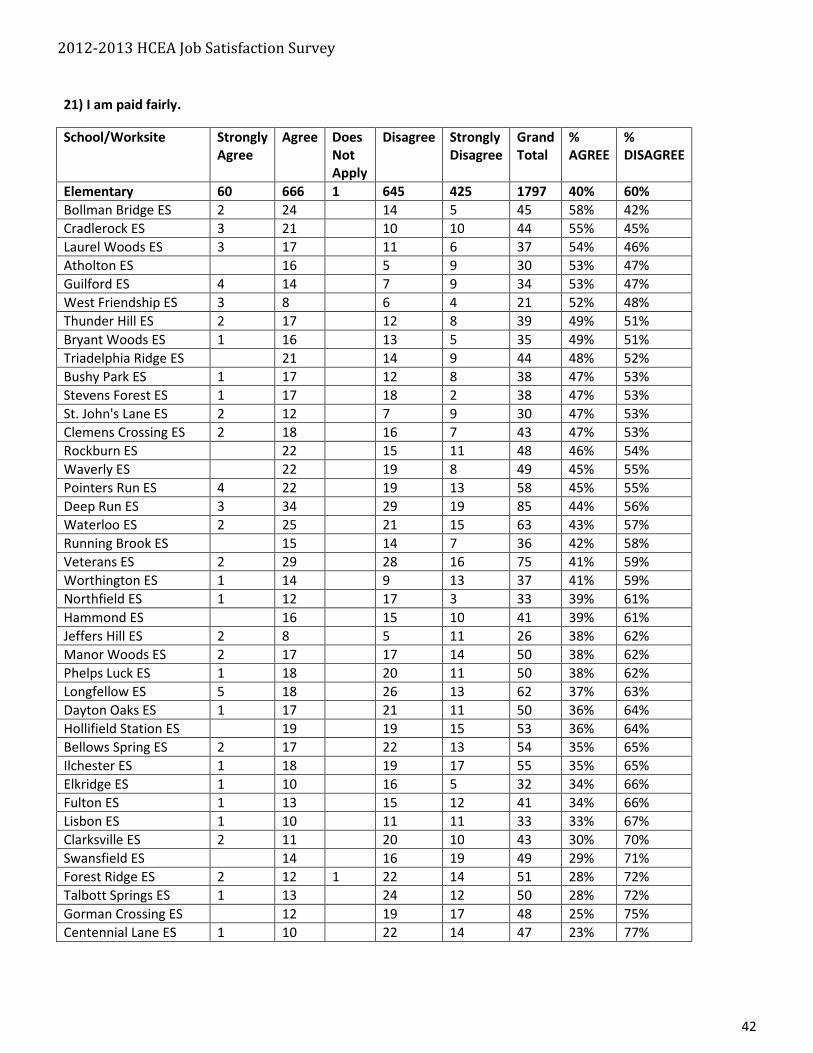
2012-2013 HCEA Job Satisfaction Survey
42
21) I am paid fairly.
School/Worksite Strongly
Agree
Agree Does
Not
Apply
Disagree Strongly
Disagree
Grand
Total
%
AGREE
%
DISAGREE
Elementary 60 666 1 645 425 1797 40% 60%
Bollman Bridge ES 2 24 14 5 45 58% 42%
Cradlerock ES 3 21 10 10 44 55% 45%
Laurel Woods ES 3 17 11 6 37 54% 46%
Atholton ES 16 5 9 30 53% 47%
Guilford ES 4 14 7 9 34 53% 47%
West Friendship ES 3 8 6 4 21 52% 48%
Thunder Hill ES 2 17 12 8 39 49% 51%
Bryant Woods ES 1 16 13 5 35 49% 51%
Triadelphia Ridge ES 21 14 9 44 48% 52%
Bushy Park ES 1 17 12 8 38 47% 53%
Stevens Forest ES 1 17 18 2 38 47% 53%
St. John's Lane ES 2 12 7 9 30 47% 53%
Clemens Crossing ES 2 18 16 7 43 47% 53%
Rockburn ES 22 15 11 48 46% 54%
Waverly ES 22 19 8 49 45% 55%
Pointers Run ES 4 22 19 13 58 45% 55%
Deep Run ES 3 34 29 19 85 44% 56%
Waterloo ES 2 25 21 15 63 43% 57%
Running Brook ES 15 14 7 36 42% 58%
Veterans ES 2 29 28 16 75 41% 59%
Worthington ES 1 14 9 13 37 41% 59%
Northfield ES 1 12 17 3 33 39% 61%
Hammond ES 16 15 10 41 39% 61%
Jeffers Hill ES 2 8 5 11 26 38% 62%
Manor Woods ES 2 17 17 14 50 38% 62%
Phelps Luck ES 1 18 20 11 50 38% 62%
Longfellow ES 5 18 26 13 62 37% 63%
Dayton Oaks ES 1 17 21 11 50 36% 64%
Hollifield Station ES 19 19 15 53 36% 64%
Bellows Spring ES 2 17 22 13 54 35% 65%
Ilchester ES 1 18 19 17 55 35% 65%
Elkridge ES 1 10 16 5 32 34% 66%
Fulton ES 1 13 15 12 41 34% 66%
Lisbon ES 1 10 11 11 33 33% 67%
Clarksville ES 2 11 20 10 43 30% 70%
Swansfield ES 14 16 19 49 29% 71%
Forest Ridge ES 2 12 1 22 14 51 28% 72%
Talbott Springs ES 1 13 24 12 50 28% 72%
Gorman Crossing ES 12 19 17 48 25% 75%
Centennial Lane ES 1 10 22 14 47 23% 77%

2012-2013 HCEA Job Satisfaction Survey
43
School/Worksite Strongly
Agree
Agree Does
Not
Apply
Disagree Strongly
Disagree
Grand
Total
%
AGREE
%
DISAGREE
High 27 332 3 313 232 907 40% 60%
Long Reach HS 4 36 33 10 83 48% 52%
River Hill HS 4 36 1 25 20 86 47% 53%
Wilde Lake HS 2 32 1 25 20 80 43% 57%
Reservoir HS 5 32 29 21 87 43% 57%
Glenelg HS 22 18 12 52 42% 58%
Mt. Hebron HS 2 27 21 19 69 42% 58%
Oakland Mills HS 2 23 18 19 62 40% 60%
Marriotts Ridge HS 3 20 1 24 11 59 40% 60%
Hammond HS 1 25 23 25 74 35% 65%
Atholton HS 1 21 23 22 67 33% 67%
Howard HS 2 32 40 30 104 33% 67%
Centennial HS 1 26 34 23 84 32% 68%
Middle 34 291 1 280 187 793 41% 59%
Lime Kiln MS 1 22 10 5 38 61% 39%
Patapsco MS 4 22 11 8 45 58% 42%
Harper's Choice MS 4 26 16 10 56 54% 46%
Dunloggin MS 3 13 9 8 33 48% 52%
Folly Quarter MS 1 18 14 9 42 45% 55%
Bonnie Branch MS 2 16 14 8 40 45% 55%
Wilde Lake MS 19 14 10 43 44% 56%
Patuxent Valley MS 4 14 16 7 41 44% 56%
Lake Elkhorn MS 19 17 8 44 43% 57%
Mayfield Woods MS 1 21 18 15 55 40% 60%
Murray Hill MS 2 14 12 12 40 40% 60%
Mount View MS 1 15 11 14 41 39% 61%
Glenwood MS 2 14 19 7 42 38% 62%
Hammond MS 4 9 11 11 35 37% 63%
Clarksville MS 15 13 15 43 35% 65%
Burleigh Manor MS 1 10 19 9 39 28% 72%
Oakland Mills MS 2 9 1 18 11 41 28% 73%
Ellicott Mills MS 1 8 20 10 39 23% 77%
Elkridge Landing MS 1 7 18 10 36 22% 78%
Special 21 113 65 29 228 59% 41%
ARL 2 15 12 4 33 52% 48%
Ascend One 3 7 5 4 19 53% 47%
Building Services 1 2 3 33% 67%
Cedar Lane 4 18 15 5 42 52% 48%
Central Office 7 42 12 6 67 73% 27%
Cluster Nurse 5 6 11 45% 55%
County Diagnostic Center 1 5 1 7 86% 14%
Health Services 2 2 1 5 40% 60%
Homewood Center 3 12 11 8 34 44% 56%
PPWS 3 3 100% 0%
Psychologist 4 4 100% 0%
Grand Total 142 1402 5 1303 873 3725 42% 58%
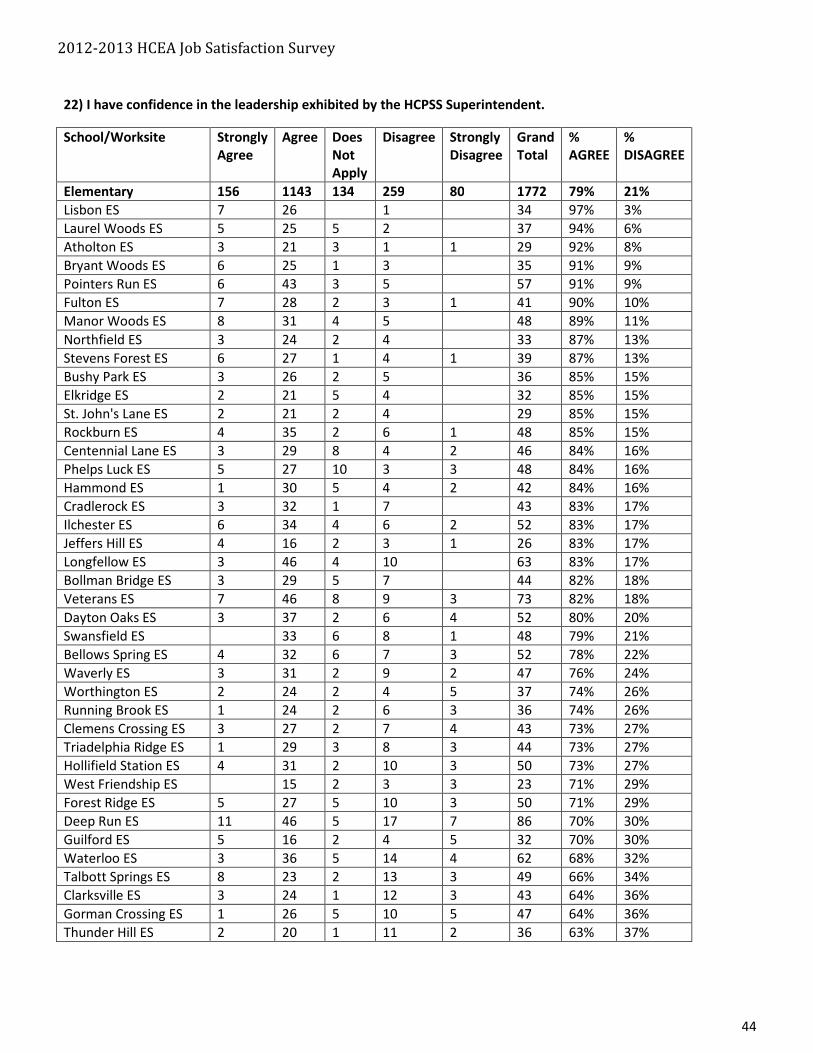
2012-2013 HCEA Job Satisfaction Survey
44
22) I have confidence in the leadership exhibited by the HCPSS Superintendent.
School/Worksite Strongly
Agree
Agree Does
Not
Apply
Disagree Strongly
Disagree
Grand
Total
%
AGREE
%
DISAGREE
Elementary 156 1143 134 259 80 1772 79% 21%
Lisbon ES 7 26 1 34 97% 3%
Laurel Woods ES 5 25 5 2 37 94% 6%
Atholton ES 3 21 3 1 1 29 92% 8%
Bryant Woods ES 6 25 1 3 35 91% 9%
Pointers Run ES 6 43 3 5 57 91% 9%
Fulton ES 7 28 2 3 1 41 90% 10%
Manor Woods ES 8 31 4 5 48 89% 11%
Northfield ES 3 24 2 4 33 87% 13%
Stevens Forest ES 6 27 1 4 1 39 87% 13%
Bushy Park ES 3 26 2 5 36 85% 15%
Elkridge ES 2 21 5 4 32 85% 15%
St. John's Lane ES 2 21 2 4 29 85% 15%
Rockburn ES 4 35 2 6 1 48 85% 15%
Centennial Lane ES 3 29 8 4 2 46 84% 16%
Phelps Luck ES 5 27 10 3 3 48 84% 16%
Hammond ES 1 30 5 4 2 42 84% 16%
Cradlerock ES 3 32 1 7 43 83% 17%
Ilchester ES 6 34 4 6 2 52 83% 17%
Jeffers Hill ES 4 16 2 3 1 26 83% 17%
Longfellow ES 3 46 4 10 63 83% 17%
Bollman Bridge ES 3 29 5 7 44 82% 18%
Veterans ES 7 46 8 9 3 73 82% 18%
Dayton Oaks ES 3 37 2 6 4 52 80% 20%
Swansfield ES 33 6 8 1 48 79% 21%
Bellows Spring ES 4 32 6 7 3 52 78% 22%
Waverly ES 3 31 2 9 2 47 76% 24%
Worthington ES 2 24 2 4 5 37 74% 26%
Running Brook ES 1 24 2 6 3 36 74% 26%
Clemens Crossing ES 3 27 2 7 4 43 73% 27%
Triadelphia Ridge ES 1 29 3 8 3 44 73% 27%
Hollifield Station ES 4 31 2 10 3 50 73% 27%
West Friendship ES 15 2 3 3 23 71% 29%
Forest Ridge ES 5 27 5 10 3 50 71% 29%
Deep Run ES 11 46 5 17 7 86 70% 30%
Guilford ES 5 16 2 4 5 32 70% 30%
Waterloo ES 3 36 5 14 4 62 68% 32%
Talbott Springs ES 8 23 2 13 3 49 66% 34%
Clarksville ES 3 24 1 12 3 43 64% 36%
Gorman Crossing ES 1 26 5 10 5 47 64% 36%
Thunder Hill ES 2 20 1 11 2 36 63% 37%
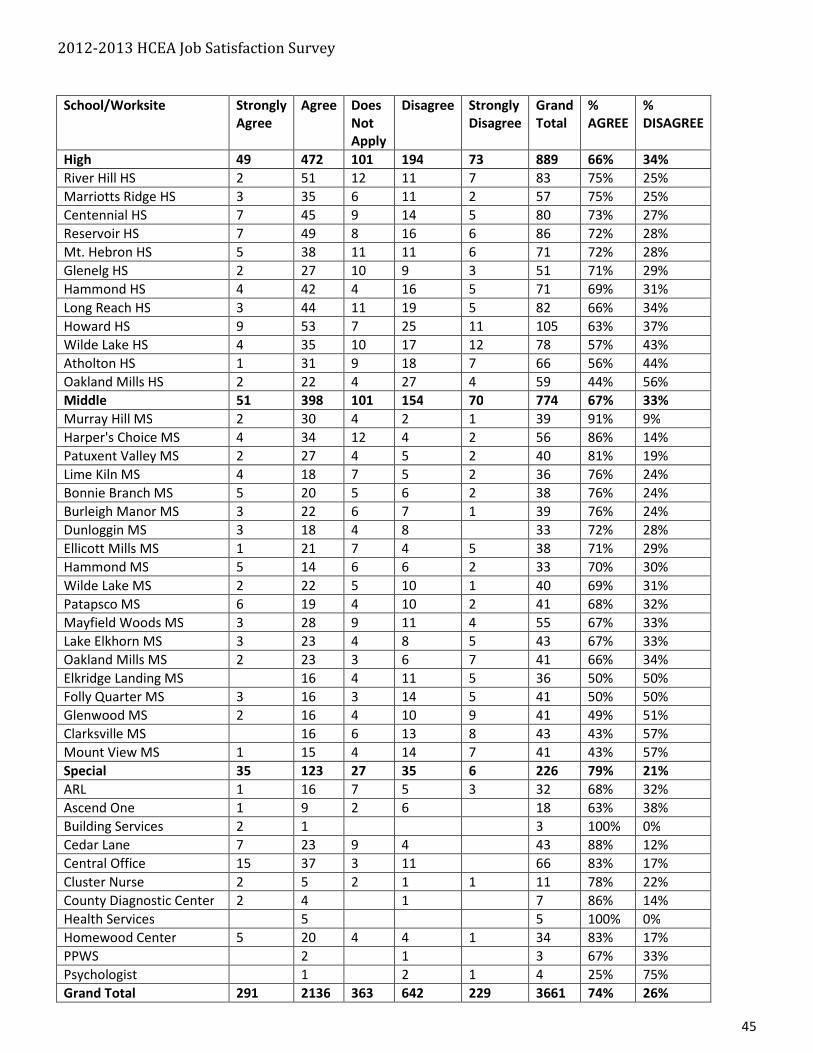
2012-2013 HCEA Job Satisfaction Survey
45
School/Worksite Strongly
Agree
Agree Does
Not
Apply
Disagree Strongly
Disagree
Grand
Total
%
AGREE
%
DISAGREE
High 49 472 101 194 73 889 66% 34%
River Hill HS 2 51 12 11 7 83 75% 25%
Marriotts Ridge HS 3 35 6 11 2 57 75% 25%
Centennial HS 7 45 9 14 5 80 73% 27%
Reservoir HS 7 49 8 16 6 86 72% 28%
Mt. Hebron HS 5 38 11 11 6 71 72% 28%
Glenelg HS 2 27 10 9 3 51 71% 29%
Hammond HS 4 42 4 16 5 71 69% 31%
Long Reach HS 3 44 11 19 5 82 66% 34%
Howard HS 9 53 7 25 11 105 63% 37%
Wilde Lake HS 4 35 10 17 12 78 57% 43%
Atholton HS 1 31 9 18 7 66 56% 44%
Oakland Mills HS 2 22 4 27 4 59 44% 56%
Middle 51 398 101 154 70 774 67% 33%
Murray Hill MS 2 30 4 2 1 39 91% 9%
Harper's Choice MS 4 34 12 4 2 56 86% 14%
Patuxent Valley MS 2 27 4 5 2 40 81% 19%
Lime Kiln MS 4 18 7 5 2 36 76% 24%
Bonnie Branch MS 5 20 5 6 2 38 76% 24%
Burleigh Manor MS 3 22 6 7 1 39 76% 24%
Dunloggin MS 3 18 4 8 33 72% 28%
Ellicott Mills MS 1 21 7 4 5 38 71% 29%
Hammond MS 5 14 6 6 2 33 70% 30%
Wilde Lake MS 2 22 5 10 1 40 69% 31%
Patapsco MS 6 19 4 10 2 41 68% 32%
Mayfield Woods MS 3 28 9 11 4 55 67% 33%
Lake Elkhorn MS 3 23 4 8 5 43 67% 33%
Oakland Mills MS 2 23 3 6 7 41 66% 34%
Elkridge Landing MS 16 4 11 5 36 50% 50%
Folly Quarter MS 3 16 3 14 5 41 50% 50%
Glenwood MS 2 16 4 10 9 41 49% 51%
Clarksville MS 16 6 13 8 43 43% 57%
Mount View MS 1 15 4 14 7 41 43% 57%
Special 35 123 27 35 6 226 79% 21%
ARL 1 16 7 5 3 32 68% 32%
Ascend One 1 9 2 6 18 63% 38%
Building Services 2 1 3 100% 0%
Cedar Lane 7 23 9 4 43 88% 12%
Central Office 15 37 3 11 66 83% 17%
Cluster Nurse 2 5 2 1 1 11 78% 22%
County Diagnostic Center 2 4 1 7 86% 14%
Health Services 5 5 100% 0%
Homewood Center 5 20 4 4 1 34 83% 17%
PPWS 2 1 3 67% 33%
Psychologist 1 2 1 4 25% 75%
Grand Total 291 2136 363 642 229 3661 74% 26%
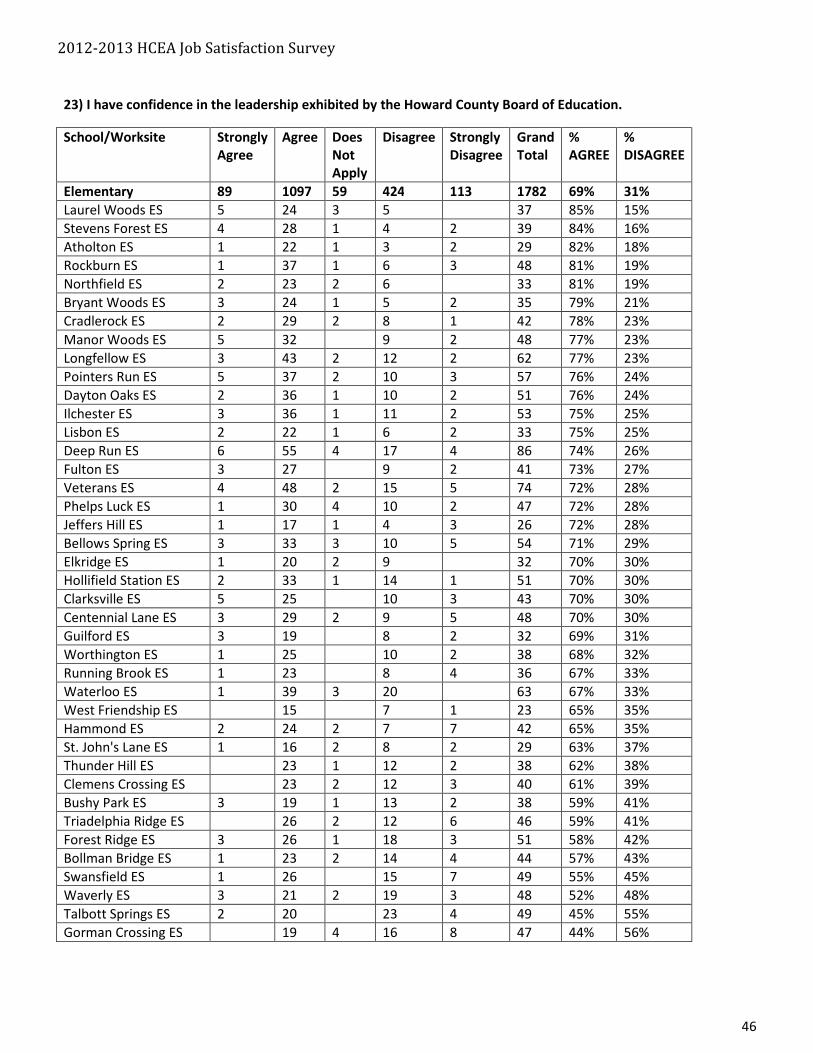
2012-2013 HCEA Job Satisfaction Survey
46
23) I have confidence in the leadership exhibited by the Howard County Board of Education.
School/Worksite Strongly
Agree
Agree Does
Not
Apply
Disagree Strongly
Disagree
Grand
Total
%
AGREE
%
DISAGREE
Elementary 89 1097 59 424 113 1782 69% 31%
Laurel Woods ES 5 24 3 5 37 85% 15%
Stevens Forest ES 4 28 1 4 2 39 84% 16%
Atholton ES 1 22 1 3 2 29 82% 18%
Rockburn ES 1 37 1 6 3 48 81% 19%
Northfield ES 2 23 2 6 33 81% 19%
Bryant Woods ES 3 24 1 5 2 35 79% 21%
Cradlerock ES 2 29 2 8 1 42 78% 23%
Manor Woods ES 5 32 9 2 48 77% 23%
Longfellow ES 3 43 2 12 2 62 77% 23%
Pointers Run ES 5 37 2 10 3 57 76% 24%
Dayton Oaks ES 2 36 1 10 2 51 76% 24%
Ilchester ES 3 36 1 11 2 53 75% 25%
Lisbon ES 2 22 1 6 2 33 75% 25%
Deep Run ES 6 55 4 17 4 86 74% 26%
Fulton ES 3 27 9 2 41 73% 27%
Veterans ES 4 48 2 15 5 74 72% 28%
Phelps Luck ES 1 30 4 10 2 47 72% 28%
Jeffers Hill ES 1 17 1 4 3 26 72% 28%
Bellows Spring ES 3 33 3 10 5 54 71% 29%
Elkridge ES 1 20 2 9 32 70% 30%
Hollifield Station ES 2 33 1 14 1 51 70% 30%
Clarksville ES 5 25 10 3 43 70% 30%
Centennial Lane ES 3 29 2 9 5 48 70% 30%
Guilford ES 3 19 8 2 32 69% 31%
Worthington ES 1 25 10 2 38 68% 32%
Running Brook ES 1 23 8 4 36 67% 33%
Waterloo ES 1 39 3 20 63 67% 33%
West Friendship ES 15 7 1 23 65% 35%
Hammond ES 2 24 2 7 7 42 65% 35%
St. John's Lane ES 1 16 2 8 2 29 63% 37%
Thunder Hill ES 23 1 12 2 38 62% 38%
Clemens Crossing ES 23 2 12 3 40 61% 39%
Bushy Park ES 3 19 1 13 2 38 59% 41%
Triadelphia Ridge ES 26 2 12 6 46 59% 41%
Forest Ridge ES 3 26 1 18 3 51 58% 42%
Bollman Bridge ES 1 23 2 14 4 44 57% 43%
Swansfield ES 1 26 15 7 49 55% 45%
Waverly ES 3 21 2 19 3 48 52% 48%
Talbott Springs ES 2 20 23 4 49 45% 55%
Gorman Crossing ES 19 4 16 8 47 44% 56%

2012-2013 HCEA Job Satisfaction Survey
47
School/Worksite Strongly
Agree
Agree Does
Not
Apply
Disagree Strongly
Disagree
Grand
Total
%
AGREE
%
DISAGREE
High 28 416 53 289 110 896 53% 47%
Long Reach HS 2 45 7 20 7 81 64% 36%
River Hill HS 2 44 6 28 4 84 59% 41%
Reservoir HS 4 43 5 27 8 87 57% 43%
Mt. Hebron HS 1 36 4 16 12 69 57% 43%
Glenelg HS 1 28 1 12 10 52 57% 43%
Marriotts Ridge HS 3 29 1 19 6 58 56% 44%
Howard HS 6 45 8 29 15 103 54% 46%
Hammond HS 38 3 27 6 74 54% 46%
Centennial HS 4 36 4 26 13 83 51% 49%
Wilde Lake HS 3 27 8 32 9 79 42% 58%
Atholton HS 1 24 2 24 14 65 40% 60%
Oakland Mills HS 1 21 4 29 6 61 39% 61%
Middle 25 317 41 232 165 780 46% 54%
Murray Hill MS 2 28 1 5 4 40 77% 23%
Patuxent Valley MS 1 26 1 8 5 41 68% 33%
Oakland Mills MS 2 21 4 10 4 41 62% 38%
Patapsco MS 4 21 2 13 3 43 61% 39%
Mayfield Woods MS 1 28 2 17 7 55 55% 45%
Harper's Choice MS 3 25 4 17 7 56 54% 46%
Lake Elkhorn MS 23 13 7 43 53% 47%
Dunloggin MS 1 15 3 8 6 33 53% 47%
Lime Kiln MS 2 15 2 9 9 37 49% 51%
Bonnie Branch MS 1 15 2 14 7 39 43% 57%
Glenwood MS 1 14 3 14 9 41 39% 61%
Ellicott Mills MS 14 4 14 8 40 39% 61%
Wilde Lake MS 2 12 3 14 8 39 39% 61%
Elkridge Landing MS 2 10 3 10 11 36 36% 64%
Burleigh Manor MS 1 12 1 13 12 39 34% 66%
Mount View MS 1 12 3 18 7 41 34% 66%
Folly Quarter MS 11 2 13 15 41 28% 72%
Hammond MS 1 8 10 13 32 28% 72%
Clarksville MS 7 1 12 23 43 17% 83%
Special 21 134 7 45 16 223 72% 28%
ARL 2 18 2 8 3 33 65% 35%
Ascend One 12 4 2 18 67% 33%
Building Services 1 2 3 100% 0%
Cedar Lane 8 27 2 3 2 42 88% 13%
Central Office 5 36 19 4 64 64% 36%
Cluster Nurse 9 2 11 82% 18%
County Diagnostic Center 2 4 1 7 86% 14%
Health Services 4 1 5 80% 20%
Homewood Center 3 20 3 5 2 33 77% 23%
PPWS 1 1 1 3 33% 67%
Psychologist 1 2 1 4 25% 75%
Grand Total 163 1964 160 990 404 3681 60% 40%
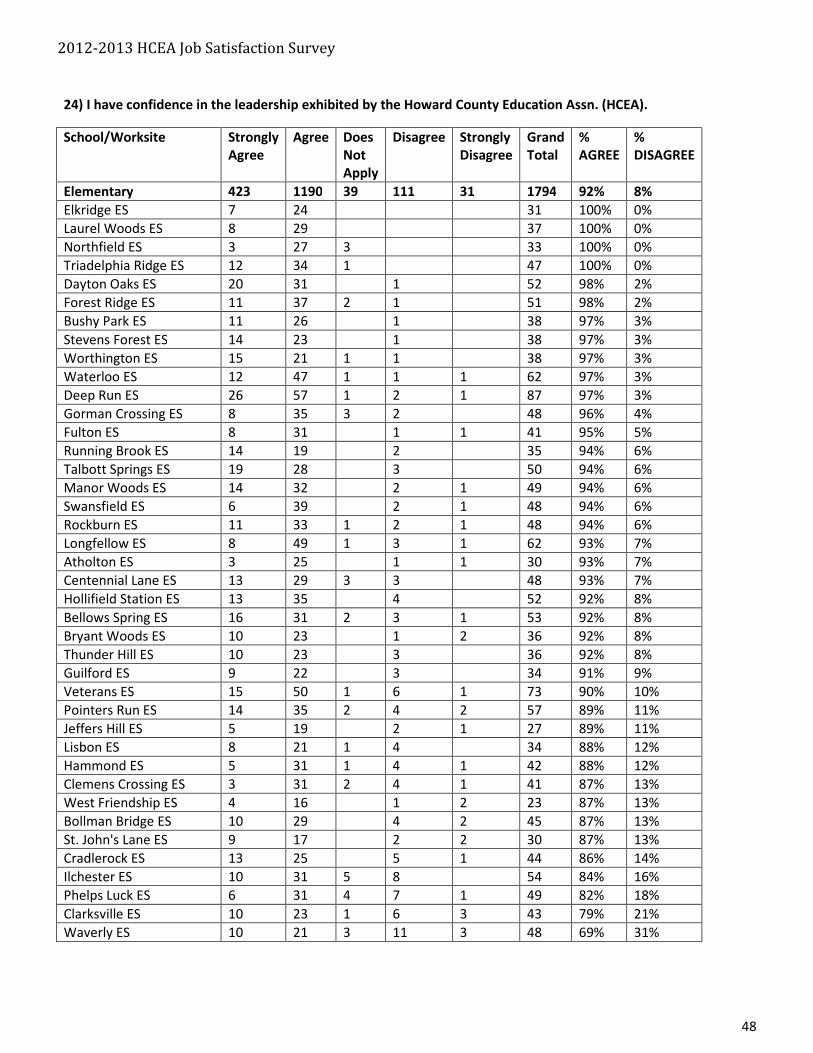
2012-2013 HCEA Job Satisfaction Survey
48
24) I have confidence in the leadership exhibited by the Howard County Education Assn. (HCEA).
School/Worksite Strongly
Agree
Agree Does
Not
Apply
Disagree Strongly
Disagree
Grand
Total
%
AGREE
%
DISAGREE
Elementary 423 1190 39 111 31 1794 92% 8%
Elkridge ES 7 24 31 100% 0%
Laurel Woods ES 8 29 37 100% 0%
Northfield ES 3 27 3 33 100% 0%
Triadelphia Ridge ES 12 34 1 47 100% 0%
Dayton Oaks ES 20 31 1 52 98% 2%
Forest Ridge ES 11 37 2 1 51 98% 2%
Bushy Park ES 11 26 1 38 97% 3%
Stevens Forest ES 14 23 1 38 97% 3%
Worthington ES 15 21 1 1 38 97% 3%
Waterloo ES 12 47 1 1 1 62 97% 3%
Deep Run ES 26 57 1 2 1 87 97% 3%
Gorman Crossing ES 8 35 3 2 48 96% 4%
Fulton ES 8 31 1 1 41 95% 5%
Running Brook ES 14 19 2 35 94% 6%
Talbott Springs ES 19 28 3 50 94% 6%
Manor Woods ES 14 32 2 1 49 94% 6%
Swansfield ES 6 39 2 1 48 94% 6%
Rockburn ES 11 33 1 2 1 48 94% 6%
Longfellow ES 8 49 1 3 1 62 93% 7%
Atholton ES 3 25 1 1 30 93% 7%
Centennial Lane ES 13 29 3 3 48 93% 7%
Hollifield Station ES 13 35 4 52 92% 8%
Bellows Spring ES 16 31 2 3 1 53 92% 8%
Bryant Woods ES 10 23 1 2 36 92% 8%
Thunder Hill ES 10 23 3 36 92% 8%
Guilford ES 9 22 3 34 91% 9%
Veterans ES 15 50 1 6 1 73 90% 10%
Pointers Run ES 14 35 2 4 2 57 89% 11%
Jeffers Hill ES 5 19 2 1 27 89% 11%
Lisbon ES 8 21 1 4 34 88% 12%
Hammond ES 5 31 1 4 1 42 88% 12%
Clemens Crossing ES 3 31 2 4 1 41 87% 13%
West Friendship ES 4 16 1 2 23 87% 13%
Bollman Bridge ES 10 29 4 2 45 87% 13%
St. John's Lane ES 9 17 2 2 30 87% 13%
Cradlerock ES 13 25 5 1 44 86% 14%
Ilchester ES 10 31 5 8 54 84% 16%
Phelps Luck ES 6 31 4 7 1 49 82% 18%
Clarksville ES 10 23 1 6 3 43 79% 21%
Waverly ES 10 21 3 11 3 48 69% 31%
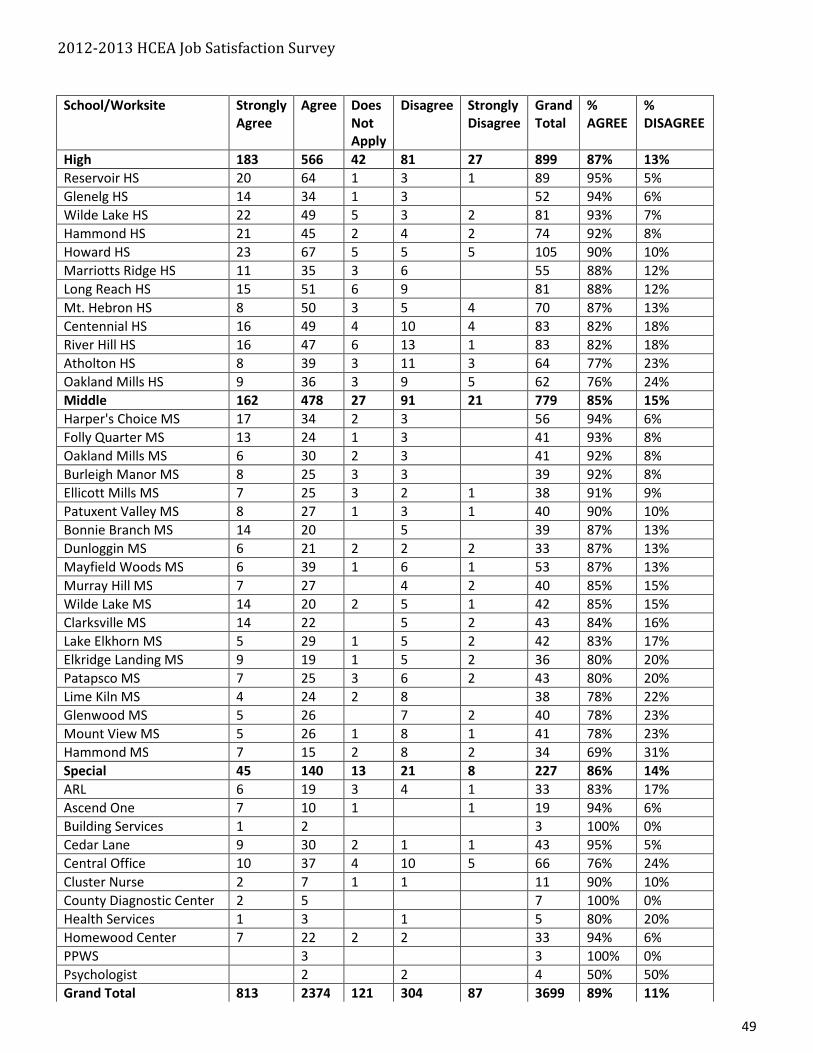
2012-2013 HCEA Job Satisfaction Survey
49
School/Worksite Strongly
Agree
Agree Does
Not
Apply
Disagree Strongly
Disagree
Grand
Total
%
AGREE
%
DISAGREE
High 183 566 42 81 27 899 87% 13%
Reservoir HS 20 64 1 3 1 89 95% 5%
Glenelg HS 14 34 1 3 52 94% 6%
Wilde Lake HS 22 49 5 3 2 81 93% 7%
Hammond HS 21 45 2 4 2 74 92% 8%
Howard HS 23 67 5 5 5 105 90% 10%
Marriotts Ridge HS 11 35 3 6 55 88% 12%
Long Reach HS 15 51 6 9 81 88% 12%
Mt. Hebron HS 8 50 3 5 4 70 87% 13%
Centennial HS 16 49 4 10 4 83 82% 18%
River Hill HS 16 47 6 13 1 83 82% 18%
Atholton HS 8 39 3 11 3 64 77% 23%
Oakland Mills HS 9 36 3 9 5 62 76% 24%
Middle 162 478 27 91 21 779 85% 15%
Harper's Choice MS 17 34 2 3 56 94% 6%
Folly Quarter MS 13 24 1 3 41 93% 8%
Oakland Mills MS 6 30 2 3 41 92% 8%
Burleigh Manor MS 8 25 3 3 39 92% 8%
Ellicott Mills MS 7 25 3 2 1 38 91% 9%
Patuxent Valley MS 8 27 1 3 1 40 90% 10%
Bonnie Branch MS 14 20 5 39 87% 13%
Dunloggin MS 6 21 2 2 2 33 87% 13%
Mayfield Woods MS 6 39 1 6 1 53 87% 13%
Murray Hill MS 7 27 4 2 40 85% 15%
Wilde Lake MS 14 20 2 5 1 42 85% 15%
Clarksville MS 14 22 5 2 43 84% 16%
Lake Elkhorn MS 5 29 1 5 2 42 83% 17%
Elkridge Landing MS 9 19 1 5 2 36 80% 20%
Patapsco MS 7 25 3 6 2 43 80% 20%
Lime Kiln MS 4 24 2 8 38 78% 22%
Glenwood MS 5 26 7 2 40 78% 23%
Mount View MS 5 26 1 8 1 41 78% 23%
Hammond MS 7 15 2 8 2 34 69% 31%
Special 45 140 13 21 8 227 86% 14%
ARL 6 19 3 4 1 33 83% 17%
Ascend One 7 10 1 1 19 94% 6%
Building Services 1 2 3 100% 0%
Cedar Lane 9 30 2 1 1 43 95% 5%
Central Office 10 37 4 10 5 66 76% 24%
Cluster Nurse 2 7 1 1 11 90% 10%
County Diagnostic Center 2 5 7 100% 0%
Health Services 1 3 1 5 80% 20%
Homewood Center 7 22 2 2 33 94% 6%
PPWS 3 3 100% 0%
Psychologist 2 2 4 50% 50%
Grand Total 813 2374 121 304 87 3699 89% 11%
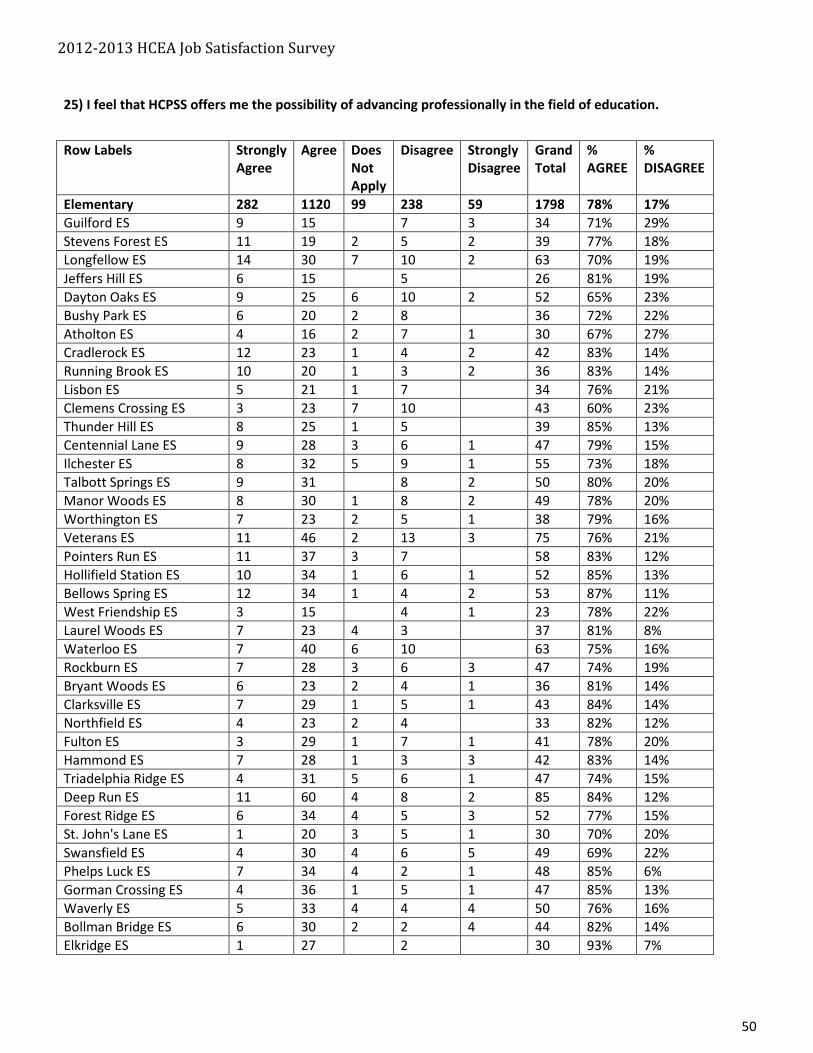
2012-2013 HCEA Job Satisfaction Survey
50
25) I feel that HCPSS offers me the possibility of advancing professionally in the field of education.
Row Labels Strongly
Agree
Agree Does
Not
Apply
Disagree Strongly
Disagree
Grand
Total
%
AGREE
%
DISAGREE
Elementary 282 1120 99 238 59 1798 78% 17%
Guilford ES 9 15 7 3 34 71% 29%
Stevens Forest ES 11 19 2 5 2 39 77% 18%
Longfellow ES 14 30 7 10 2 63 70% 19%
Jeffers Hill ES 6 15 5 26 81% 19%
Dayton Oaks ES 9 25 6 10 2 52 65% 23%
Bushy Park ES 6 20 2 8 36 72% 22%
Atholton ES 4 16 2 7 1 30 67% 27%
Cradlerock ES 12 23 1 4 2 42 83% 14%
Running Brook ES 10 20 1 3 2 36 83% 14%
Lisbon ES 5 21 1 7 34 76% 21%
Clemens Crossing ES 3 23 7 10 43 60% 23%
Thunder Hill ES 8 25 1 5 39 85% 13%
Centennial Lane ES 9 28 3 6 1 47 79% 15%
Ilchester ES 8 32 5 9 1 55 73% 18%
Talbott Springs ES 9 31 8 2 50 80% 20%
Manor Woods ES 8 30 1 8 2 49 78% 20%
Worthington ES 7 23 2 5 1 38 79% 16%
Veterans ES 11 46 2 13 3 75 76% 21%
Pointers Run ES 11 37 3 7 58 83% 12%
Hollifield Station ES 10 34 1 6 1 52 85% 13%
Bellows Spring ES 12 34 1 4 2 53 87% 11%
West Friendship ES 3 15 4 1 23 78% 22%
Laurel Woods ES 7 23 4 3 37 81% 8%
Waterloo ES 7 40 6 10 63 75% 16%
Rockburn ES 7 28 3 6 3 47 74% 19%
Bryant Woods ES 6 23 2 4 1 36 81% 14%
Clarksville ES 7 29 1 5 1 43 84% 14%
Northfield ES 4 23 2 4 33 82% 12%
Fulton ES 3 29 1 7 1 41 78% 20%
Hammond ES 7 28 1 3 3 42 83% 14%
Triadelphia Ridge ES 4 31 5 6 1 47 74% 15%
Deep Run ES 11 60 4 8 2 85 84% 12%
Forest Ridge ES 6 34 4 5 3 52 77% 15%
St. John's Lane ES 1 20 3 5 1 30 70% 20%
Swansfield ES 4 30 4 6 5 49 69% 22%
Phelps Luck ES 7 34 4 2 1 48 85% 6%
Gorman Crossing ES 4 36 1 5 1 47 85% 13%
Waverly ES 5 33 4 4 4 50 76% 16%
Bollman Bridge ES 6 30 2 2 4 44 82% 14%
Elkridge ES 1 27 2 30 93% 7%
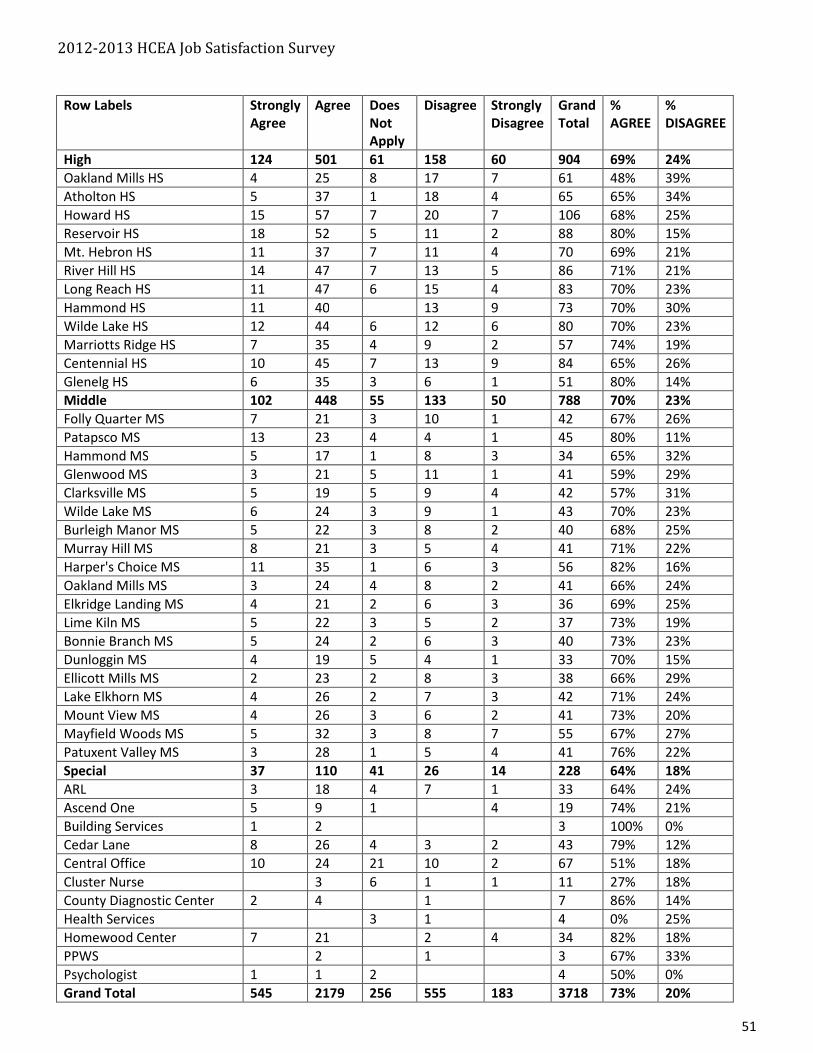
2012-2013 HCEA Job Satisfaction Survey
51
Row Labels Strongly
Agree
Agree Does
Not
Apply
Disagree Strongly
Disagree
Grand
Total
%
AGREE
%
DISAGREE
High 124 501 61 158 60 904 69% 24%
Oakland Mills HS 4 25 8 17 7 61 48% 39%
Atholton HS 5 37 1 18 4 65 65% 34%
Howard HS 15 57 7 20 7 106 68% 25%
Reservoir HS 18 52 5 11 2 88 80% 15%
Mt. Hebron HS 11 37 7 11 4 70 69% 21%
River Hill HS 14 47 7 13 5 86 71% 21%
Long Reach HS 11 47 6 15 4 83 70% 23%
Hammond HS 11 40 13 9 73 70% 30%
Wilde Lake HS 12 44 6 12 6 80 70% 23%
Marriotts Ridge HS 7 35 4 9 2 57 74% 19%
Centennial HS 10 45 7 13 9 84 65% 26%
Glenelg HS 6 35 3 6 1 51 80% 14%
Middle 102 448 55 133 50 788 70% 23%
Folly Quarter MS 7 21 3 10 1 42 67% 26%
Patapsco MS 13 23 4 4 1 45 80% 11%
Hammond MS 5 17 1 8 3 34 65% 32%
Glenwood MS 3 21 5 11 1 41 59% 29%
Clarksville MS 5 19 5 9 4 42 57% 31%
Wilde Lake MS 6 24 3 9 1 43 70% 23%
Burleigh Manor MS 5 22 3 8 2 40 68% 25%
Murray Hill MS 8 21 3 5 4 41 71% 22%
Harper's Choice MS 11 35 1 6 3 56 82% 16%
Oakland Mills MS 3 24 4 8 2 41 66% 24%
Elkridge Landing MS 4 21 2 6 3 36 69% 25%
Lime Kiln MS 5 22 3 5 2 37 73% 19%
Bonnie Branch MS 5 24 2 6 3 40 73% 23%
Dunloggin MS 4 19 5 4 1 33 70% 15%
Ellicott Mills MS 2 23 2 8 3 38 66% 29%
Lake Elkhorn MS 4 26 2 7 3 42 71% 24%
Mount View MS 4 26 3 6 2 41 73% 20%
Mayfield Woods MS 5 32 3 8 7 55 67% 27%
Patuxent Valley MS 3 28 1 5 4 41 76% 22%
Special 37 110 41 26 14 228 64% 18%
ARL 3 18 4 7 1 33 64% 24%
Ascend One 5 9 1 4 19 74% 21%
Building Services 1 2 3 100% 0%
Cedar Lane 8 26 4 3 2 43 79% 12%
Central Office 10 24 21 10 2 67 51% 18%
Cluster Nurse 3 6 1 1 11 27% 18%
County Diagnostic Center 2 4 1 7 86% 14%
Health Services 3 1 4 0% 25%
Homewood Center 7 21 2 4 34 82% 18%
PPWS 2 1 3 67% 33%
Psychologist 1 1 2 4 50% 0%
Grand Total 545 2179 256 555 183 3718 73% 20%
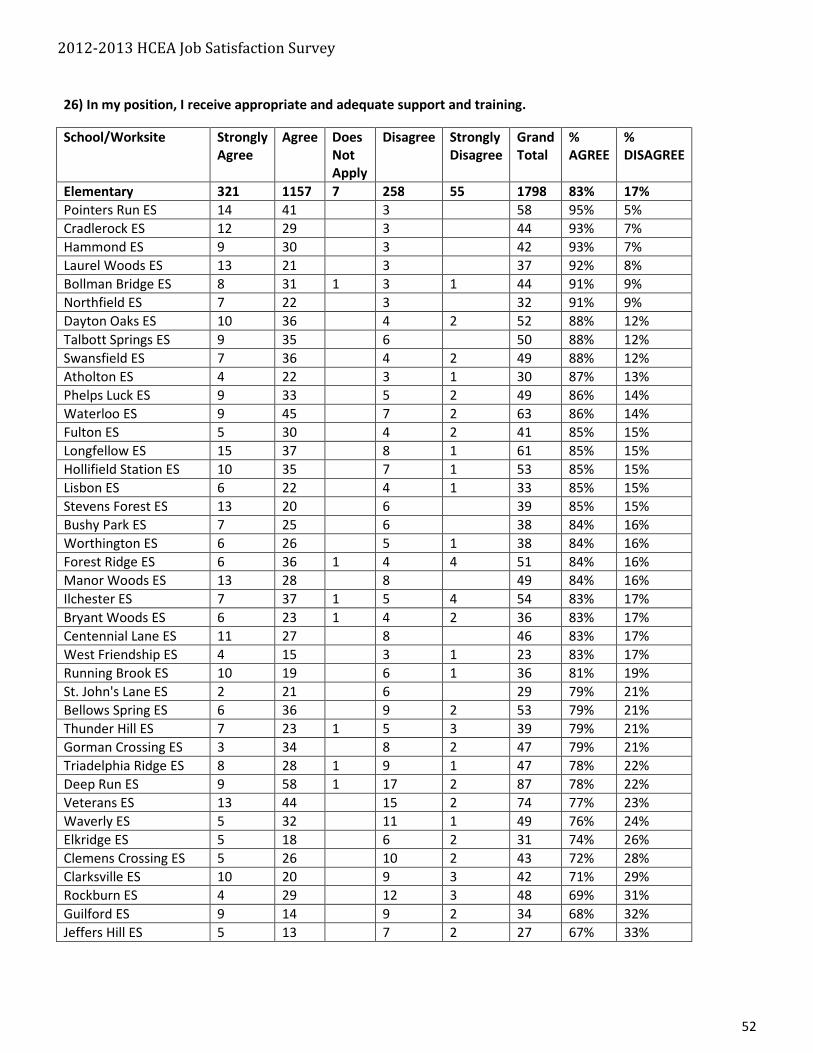
2012-2013 HCEA Job Satisfaction Survey
52
26) In my position, I receive appropriate and adequate support and training.
School/Worksite Strongly
Agree
Agree Does
Not
Apply
Disagree Strongly
Disagree
Grand
Total
%
AGREE
%
DISAGREE
Elementary 321 1157 7 258 55 1798 83% 17%
Pointers Run ES 14 41 3 58 95% 5%
Cradlerock ES 12 29 3 44 93% 7%
Hammond ES 9 30 3 42 93% 7%
Laurel Woods ES 13 21 3 37 92% 8%
Bollman Bridge ES 8 31 1 3 1 44 91% 9%
Northfield ES 7 22 3 32 91% 9%
Dayton Oaks ES 10 36 4 2 52 88% 12%
Talbott Springs ES 9 35 6 50 88% 12%
Swansfield ES 7 36 4 2 49 88% 12%
Atholton ES 4 22 3 1 30 87% 13%
Phelps Luck ES 9 33 5 2 49 86% 14%
Waterloo ES 9 45 7 2 63 86% 14%
Fulton ES 5 30 4 2 41 85% 15%
Longfellow ES 15 37 8 1 61 85% 15%
Hollifield Station ES 10 35 7 1 53 85% 15%
Lisbon ES 6 22 4 1 33 85% 15%
Stevens Forest ES 13 20 6 39 85% 15%
Bushy Park ES 7 25 6 38 84% 16%
Worthington ES 6 26 5 1 38 84% 16%
Forest Ridge ES 6 36 1 4 4 51 84% 16%
Manor Woods ES 13 28 8 49 84% 16%
Ilchester ES 7 37 1 5 4 54 83% 17%
Bryant Woods ES 6 23 1 4 2 36 83% 17%
Centennial Lane ES 11 27 8 46 83% 17%
West Friendship ES 4 15 3 1 23 83% 17%
Running Brook ES 10 19 6 1 36 81% 19%
St. John's Lane ES 2 21 6 29 79% 21%
Bellows Spring ES 6 36 9 2 53 79% 21%
Thunder Hill ES 7 23 1 5 3 39 79% 21%
Gorman Crossing ES 3 34 8 2 47 79% 21%
Triadelphia Ridge ES 8 28 1 9 1 47 78% 22%
Deep Run ES 9 58 1 17 2 87 78% 22%
Veterans ES 13 44 15 2 74 77% 23%
Waverly ES 5 32 11 1 49 76% 24%
Elkridge ES 5 18 6 2 31 74% 26%
Clemens Crossing ES 5 26 10 2 43 72% 28%
Clarksville ES 10 20 9 3 42 71% 29%
Rockburn ES 4 29 12 3 48 69% 31%
Guilford ES 9 14 9 2 34 68% 32%
Jeffers Hill ES 5 13 7 2 27 67% 33%
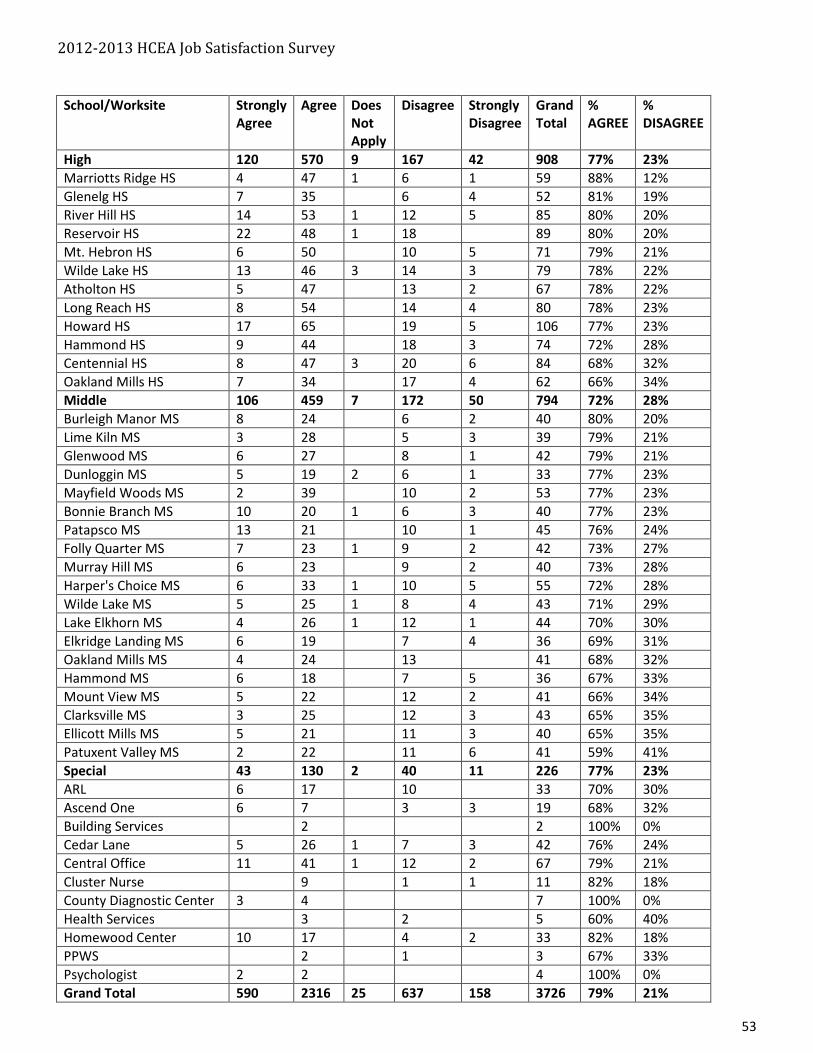
2012-2013 HCEA Job Satisfaction Survey
53
School/Worksite Strongly
Agree
Agree Does
Not
Apply
Disagree Strongly
Disagree
Grand
Total
%
AGREE
%
DISAGREE
High 120 570 9 167 42 908 77% 23%
Marriotts Ridge HS 4 47 1 6 1 59 88% 12%
Glenelg HS 7 35 6 4 52 81% 19%
River Hill HS 14 53 1 12 5 85 80% 20%
Reservoir HS 22 48 1 18 89 80% 20%
Mt. Hebron HS 6 50 10 5 71 79% 21%
Wilde Lake HS 13 46 3 14 3 79 78% 22%
Atholton HS 5 47 13 2 67 78% 22%
Long Reach HS 8 54 14 4 80 78% 23%
Howard HS 17 65 19 5 106 77% 23%
Hammond HS 9 44 18 3 74 72% 28%
Centennial HS 8 47 3 20 6 84 68% 32%
Oakland Mills HS 7 34 17 4 62 66% 34%
Middle 106 459 7 172 50 794 72% 28%
Burleigh Manor MS 8 24 6 2 40 80% 20%
Lime Kiln MS 3 28 5 3 39 79% 21%
Glenwood MS 6 27 8 1 42 79% 21%
Dunloggin MS 5 19 2 6 1 33 77% 23%
Mayfield Woods MS 2 39 10 2 53 77% 23%
Bonnie Branch MS 10 20 1 6 3 40 77% 23%
Patapsco MS 13 21 10 1 45 76% 24%
Folly Quarter MS 7 23 1 9 2 42 73% 27%
Murray Hill MS 6 23 9 2 40 73% 28%
Harper's Choice MS 6 33 1 10 5 55 72% 28%
Wilde Lake MS 5 25 1 8 4 43 71% 29%
Lake Elkhorn MS 4 26 1 12 1 44 70% 30%
Elkridge Landing MS 6 19 7 4 36 69% 31%
Oakland Mills MS 4 24 13 41 68% 32%
Hammond MS 6 18 7 5 36 67% 33%
Mount View MS 5 22 12 2 41 66% 34%
Clarksville MS 3 25 12 3 43 65% 35%
Ellicott Mills MS 5 21 11 3 40 65% 35%
Patuxent Valley MS 2 22 11 6 41 59% 41%
Special 43 130 2 40 11 226 77% 23%
ARL 6 17 10 33 70% 30%
Ascend One 6 7 3 3 19 68% 32%
Building Services 2 2 100% 0%
Cedar Lane 5 26 1 7 3 42 76% 24%
Central Office 11 41 1 12 2 67 79% 21%
Cluster Nurse 9 1 1 11 82% 18%
County Diagnostic Center 3 4 7 100% 0%
Health Services 3 2 5 60% 40%
Homewood Center 10 17 4 2 33 82% 18%
PPWS 2 1 3 67% 33%
Psychologist 2 2 4 100% 0%
Grand Total 590 2316 25 637 158 3726 79% 21%
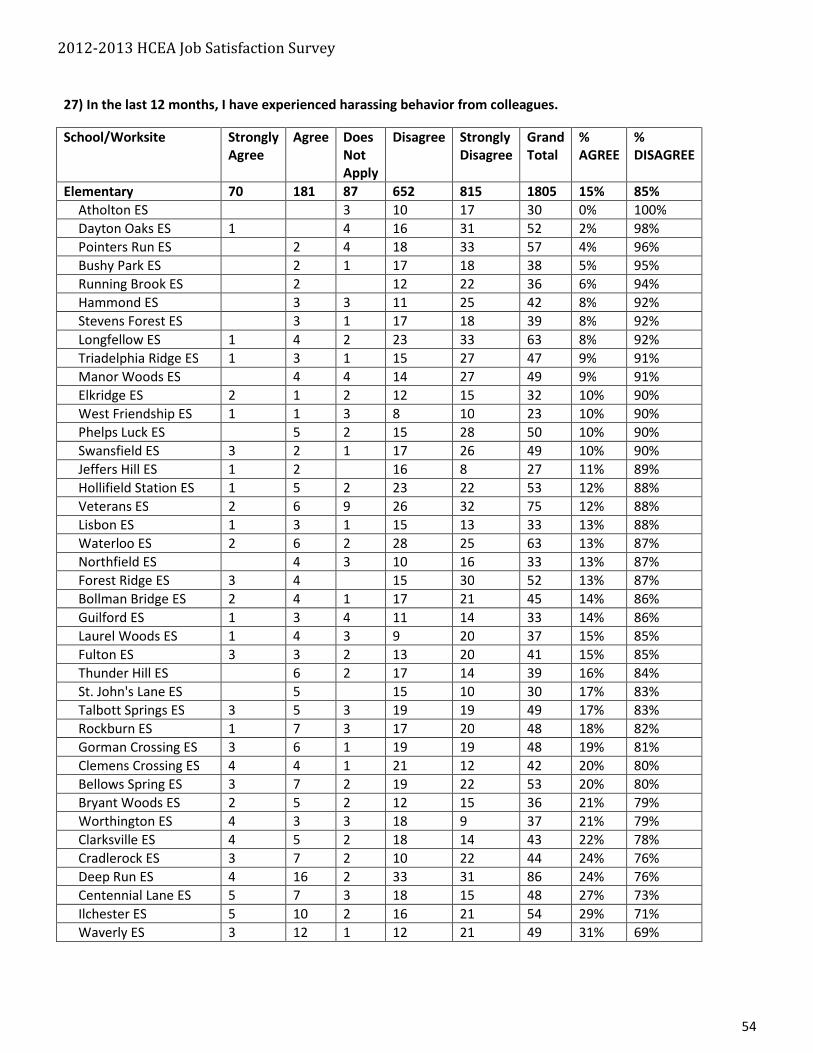
2012-2013 HCEA Job Satisfaction Survey
54
27) In the last 12 months, I have experienced harassing behavior from colleagues.
School/Worksite Strongly
Agree
Agree Does
Not
Apply
Disagree Strongly
Disagree
Grand
Total
%
AGREE
%
DISAGREE
Elementary 70 181 87 652 815 1805 15% 85%
Atholton ES 3 10 17 30 0% 100%
Dayton Oaks ES 1 4 16 31 52 2% 98%
Pointers Run ES 2 4 18 33 57 4% 96%
Bushy Park ES 2 1 17 18 38 5% 95%
Running Brook ES 2 12 22 36 6% 94%
Hammond ES 3 3 11 25 42 8% 92%
Stevens Forest ES 3 1 17 18 39 8% 92%
Longfellow ES 1 4 2 23 33 63 8% 92%
Triadelphia Ridge ES 1 3 1 15 27 47 9% 91%
Manor Woods ES 4 4 14 27 49 9% 91%
Elkridge ES 2 1 2 12 15 32 10% 90%
West Friendship ES 1 1 3 8 10 23 10% 90%
Phelps Luck ES 5 2 15 28 50 10% 90%
Swansfield ES 3 2 1 17 26 49 10% 90%
Jeffers Hill ES 1 2 16 8 27 11% 89%
Hollifield Station ES 1 5 2 23 22 53 12% 88%
Veterans ES 2 6 9 26 32 75 12% 88%
Lisbon ES 1 3 1 15 13 33 13% 88%
Waterloo ES 2 6 2 28 25 63 13% 87%
Northfield ES 4 3 10 16 33 13% 87%
Forest Ridge ES 3 4 15 30 52 13% 87%
Bollman Bridge ES 2 4 1 17 21 45 14% 86%
Guilford ES 1 3 4 11 14 33 14% 86%
Laurel Woods ES 1 4 3 9 20 37 15% 85%
Fulton ES 3 3 2 13 20 41 15% 85%
Thunder Hill ES 6 2 17 14 39 16% 84%
St. John's Lane ES 5 15 10 30 17% 83%
Talbott Springs ES 3 5 3 19 19 49 17% 83%
Rockburn ES 1 7 3 17 20 48 18% 82%
Gorman Crossing ES 3 6 1 19 19 48 19% 81%
Clemens Crossing ES 4 4 1 21 12 42 20% 80%
Bellows Spring ES 3 7 2 19 22 53 20% 80%
Bryant Woods ES 2 5 2 12 15 36 21% 79%
Worthington ES 4 3 3 18 9 37 21% 79%
Clarksville ES 4 5 2 18 14 43 22% 78%
Cradlerock ES 3 7 2 10 22 44 24% 76%
Deep Run ES 4 16 2 33 31 86 24% 76%
Centennial Lane ES 5 7 3 18 15 48 27% 73%
Ilchester ES 5 10 2 16 21 54 29% 71%
Waverly ES 3 12 1 12 21 49 31% 69%
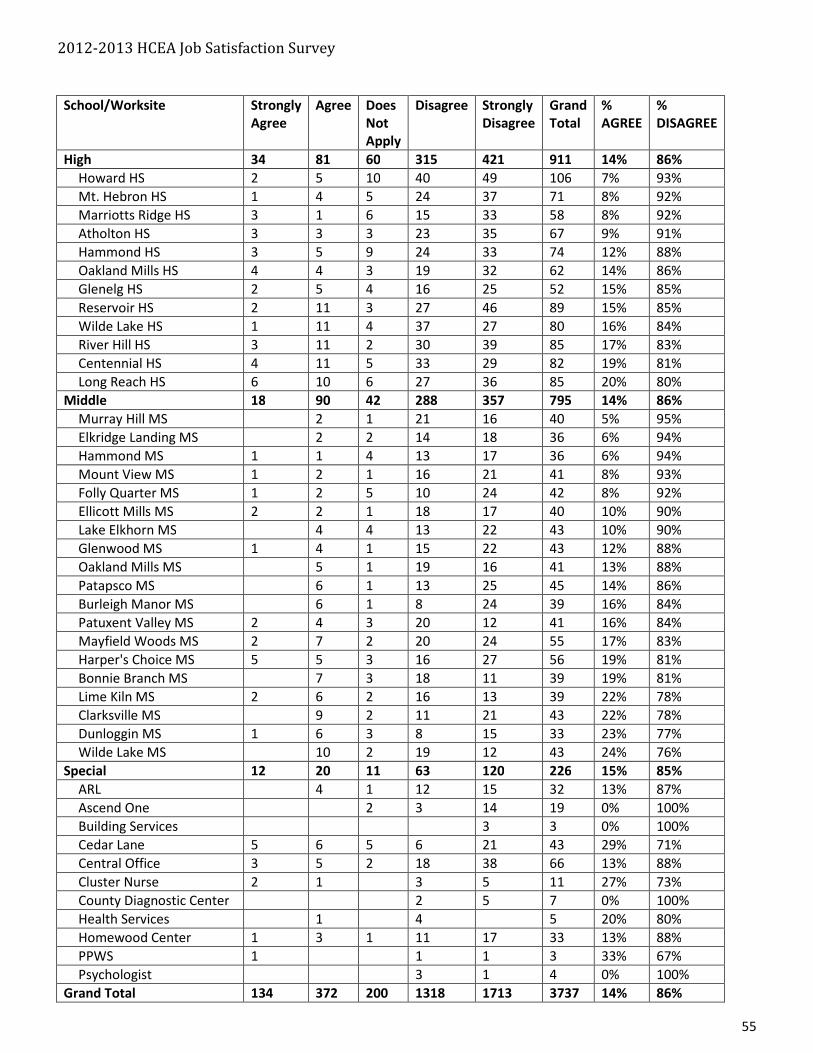
2012-2013 HCEA Job Satisfaction Survey
55
School/Worksite Strongly
Agree
Agree Does
Not
Apply
Disagree Strongly
Disagree
Grand
Total
%
AGREE
%
DISAGREE
High 34 81 60 315 421 911 14% 86%
Howard HS 2 5 10 40 49 106 7% 93%
Mt. Hebron HS 1 4 5 24 37 71 8% 92%
Marriotts Ridge HS 3 1 6 15 33 58 8% 92%
Atholton HS 3 3 3 23 35 67 9% 91%
Hammond HS 3 5 9 24 33 74 12% 88%
Oakland Mills HS 4 4 3 19 32 62 14% 86%
Glenelg HS 2 5 4 16 25 52 15% 85%
Reservoir HS 2 11 3 27 46 89 15% 85%
Wilde Lake HS 1 11 4 37 27 80 16% 84%
River Hill HS 3 11 2 30 39 85 17% 83%
Centennial HS 4 11 5 33 29 82 19% 81%
Long Reach HS 6 10 6 27 36 85 20% 80%
Middle 18 90 42 288 357 795 14% 86%
Murray Hill MS 2 1 21 16 40 5% 95%
Elkridge Landing MS 2 2 14 18 36 6% 94%
Hammond MS 1 1 4 13 17 36 6% 94%
Mount View MS 1 2 1 16 21 41 8% 93%
Folly Quarter MS 1 2 5 10 24 42 8% 92%
Ellicott Mills MS 2 2 1 18 17 40 10% 90%
Lake Elkhorn MS 4 4 13 22 43 10% 90%
Glenwood MS 1 4 1 15 22 43 12% 88%
Oakland Mills MS 5 1 19 16 41 13% 88%
Patapsco MS 6 1 13 25 45 14% 86%
Burleigh Manor MS 6 1 8 24 39 16% 84%
Patuxent Valley MS 2 4 3 20 12 41 16% 84%
Mayfield Woods MS 2 7 2 20 24 55 17% 83%
Harper's Choice MS 5 5 3 16 27 56 19% 81%
Bonnie Branch MS 7 3 18 11 39 19% 81%
Lime Kiln MS 2 6 2 16 13 39 22% 78%
Clarksville MS 9 2 11 21 43 22% 78%
Dunloggin MS 1 6 3 8 15 33 23% 77%
Wilde Lake MS 10 2 19 12 43 24% 76%
Special 12 20 11 63 120 226 15% 85%
ARL 4 1 12 15 32 13% 87%
Ascend One 2 3 14 19 0% 100%
Building Services 3 3 0% 100%
Cedar Lane 5 6 5 6 21 43 29% 71%
Central Office 3 5 2 18 38 66 13% 88%
Cluster Nurse 2 1 3 5 11 27% 73%
County Diagnostic Center 2 5 7 0% 100%
Health Services 1 4 5 20% 80%
Homewood Center 1 3 1 11 17 33 13% 88%
PPWS 1 1 1 3 33% 67%
Psychologist 3 1 4 0% 100%
Grand Total 134 372 200 1318 1713 3737 14% 86%
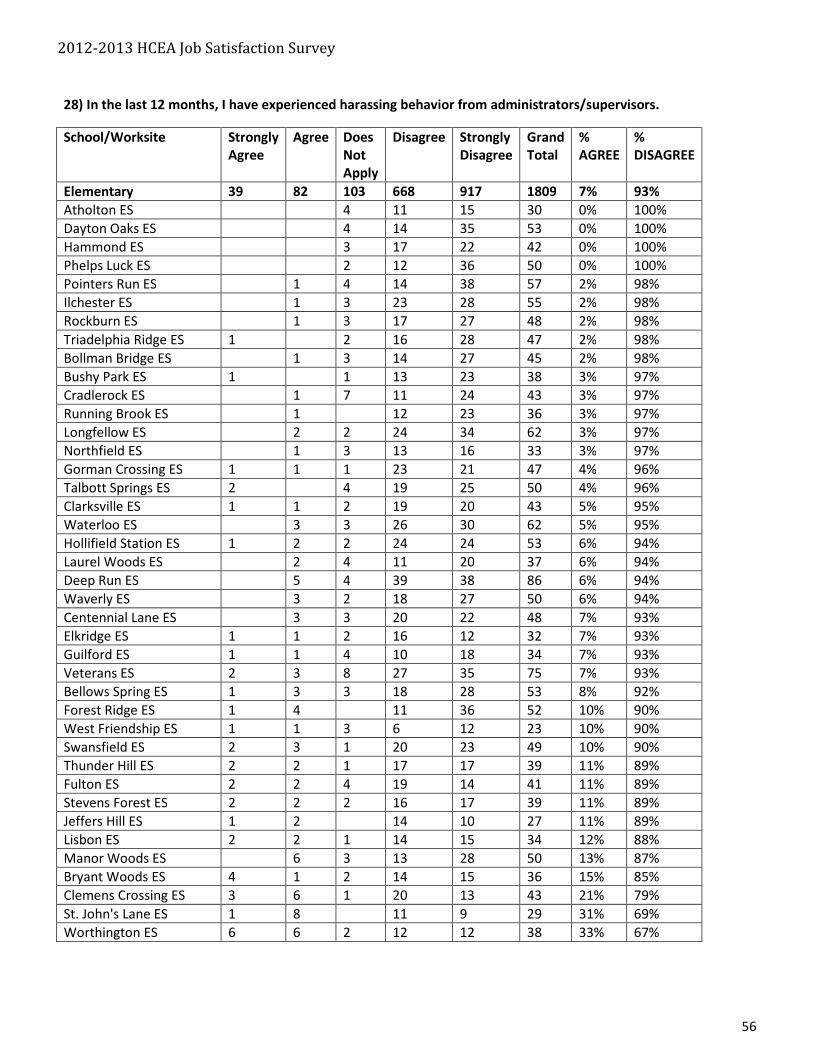
2012-2013 HCEA Job Satisfaction Survey
56
28) In the last 12 months, I have experienced harassing behavior from administrators/supervisors.
School/Worksite Strongly
Agree
Agree Does
Not
Apply
Disagree Strongly
Disagree
Grand
Total
%
AGREE
%
DISAGREE
Elementary 39 82 103 668 917 1809 7% 93%
Atholton ES 4 11 15 30 0% 100%
Dayton Oaks ES 4 14 35 53 0% 100%
Hammond ES 3 17 22 42 0% 100%
Phelps Luck ES 2 12 36 50 0% 100%
Pointers Run ES 1 4 14 38 57 2% 98%
Ilchester ES 1 3 23 28 55 2% 98%
Rockburn ES 1 3 17 27 48 2% 98%
Triadelphia Ridge ES 1 2 16 28 47 2% 98%
Bollman Bridge ES 1 3 14 27 45 2% 98%
Bushy Park ES 1 1 13 23 38 3% 97%
Cradlerock ES 1 7 11 24 43 3% 97%
Running Brook ES 1 12 23 36 3% 97%
Longfellow ES 2 2 24 34 62 3% 97%
Northfield ES 1 3 13 16 33 3% 97%
Gorman Crossing ES 1 1 1 23 21 47 4% 96%
Talbott Springs ES 2 4 19 25 50 4% 96%
Clarksville ES 1 1 2 19 20 43 5% 95%
Waterloo ES 3 3 26 30 62 5% 95%
Hollifield Station ES 1 2 2 24 24 53 6% 94%
Laurel Woods ES 2 4 11 20 37 6% 94%
Deep Run ES 5 4 39 38 86 6% 94%
Waverly ES 3 2 18 27 50 6% 94%
Centennial Lane ES 3 3 20 22 48 7% 93%
Elkridge ES 1 1 2 16 12 32 7% 93%
Guilford ES 1 1 4 10 18 34 7% 93%
Veterans ES 2 3 8 27 35 75 7% 93%
Bellows Spring ES 1 3 3 18 28 53 8% 92%
Forest Ridge ES 1 4 11 36 52 10% 90%
West Friendship ES 1 1 3 6 12 23 10% 90%
Swansfield ES 2 3 1 20 23 49 10% 90%
Thunder Hill ES 2 2 1 17 17 39 11% 89%
Fulton ES 2 2 4 19 14 41 11% 89%
Stevens Forest ES 2 2 2 16 17 39 11% 89%
Jeffers Hill ES 1 2 14 10 27 11% 89%
Lisbon ES 2 2 1 14 15 34 12% 88%
Manor Woods ES 6 3 13 28 50 13% 87%
Bryant Woods ES 4 1 2 14 15 36 15% 85%
Clemens Crossing ES 3 6 1 20 13 43 21% 79%
St. John's Lane ES 1 8 11 9 29 31% 69%
Worthington ES 6 6 2 12 12 38 33% 67%
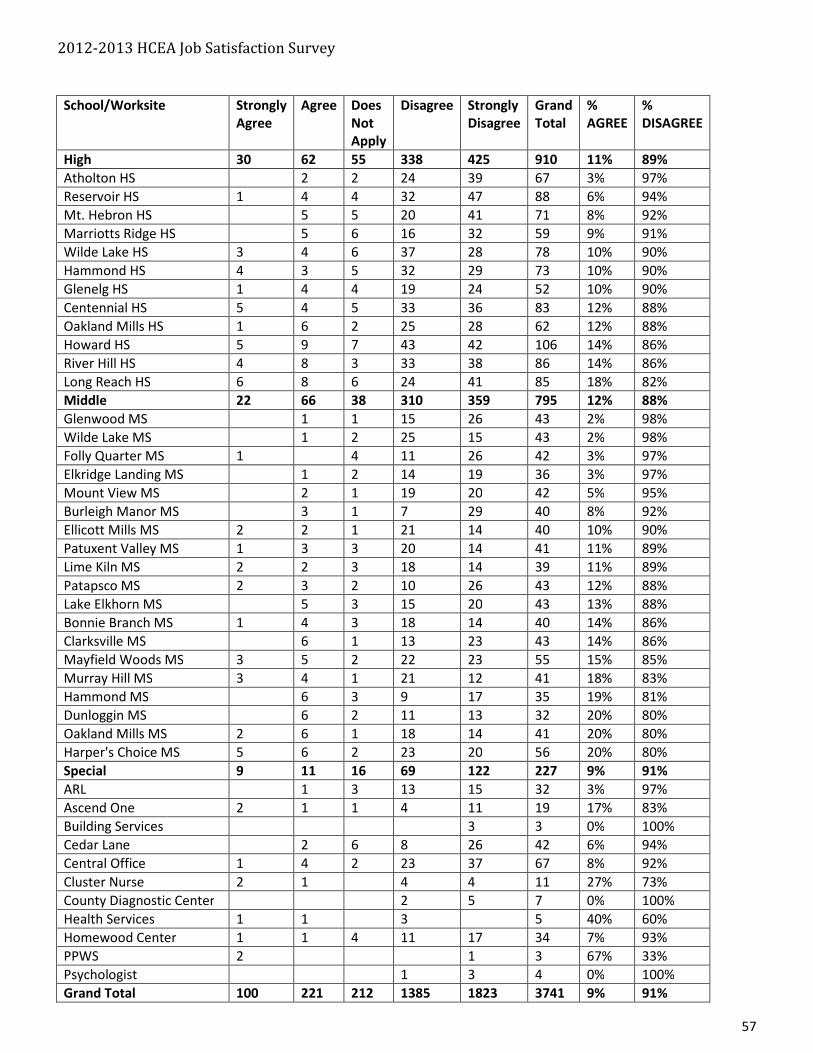
2012-2013 HCEA Job Satisfaction Survey
57
School/Worksite Strongly
Agree
Agree Does
Not
Apply
Disagree Strongly
Disagree
Grand
Total
%
AGREE
%
DISAGREE
High 30 62 55 338 425 910 11% 89%
Atholton HS 2 2 24 39 67 3% 97%
Reservoir HS 1 4 4 32 47 88 6% 94%
Mt. Hebron HS 5 5 20 41 71 8% 92%
Marriotts Ridge HS 5 6 16 32 59 9% 91%
Wilde Lake HS 3 4 6 37 28 78 10% 90%
Hammond HS 4 3 5 32 29 73 10% 90%
Glenelg HS 1 4 4 19 24 52 10% 90%
Centennial HS 5 4 5 33 36 83 12% 88%
Oakland Mills HS 1 6 2 25 28 62 12% 88%
Howard HS 5 9 7 43 42 106 14% 86%
River Hill HS 4 8 3 33 38 86 14% 86%
Long Reach HS 6 8 6 24 41 85 18% 82%
Middle 22 66 38 310 359 795 12% 88%
Glenwood MS 1 1 15 26 43 2% 98%
Wilde Lake MS 1 2 25 15 43 2% 98%
Folly Quarter MS 1 4 11 26 42 3% 97%
Elkridge Landing MS 1 2 14 19 36 3% 97%
Mount View MS 2 1 19 20 42 5% 95%
Burleigh Manor MS 3 1 7 29 40 8% 92%
Ellicott Mills MS 2 2 1 21 14 40 10% 90%
Patuxent Valley MS 1 3 3 20 14 41 11% 89%
Lime Kiln MS 2 2 3 18 14 39 11% 89%
Patapsco MS 2 3 2 10 26 43 12% 88%
Lake Elkhorn MS 5 3 15 20 43 13% 88%
Bonnie Branch MS 1 4 3 18 14 40 14% 86%
Clarksville MS 6 1 13 23 43 14% 86%
Mayfield Woods MS 3 5 2 22 23 55 15% 85%
Murray Hill MS 3 4 1 21 12 41 18% 83%
Hammond MS 6 3 9 17 35 19% 81%
Dunloggin MS 6 2 11 13 32 20% 80%
Oakland Mills MS 2 6 1 18 14 41 20% 80%
Harper's Choice MS 5 6 2 23 20 56 20% 80%
Special 9 11 16 69 122 227 9% 91%
ARL 1 3 13 15 32 3% 97%
Ascend One 2 1 1 4 11 19 17% 83%
Building Services 3 3 0% 100%
Cedar Lane 2 6 8 26 42 6% 94%
Central Office 1 4 2 23 37 67 8% 92%
Cluster Nurse 2 1 4 4 11 27% 73%
County Diagnostic Center 2 5 7 0% 100%
Health Services 1 1 3 5 40% 60%
Homewood Center 1 1 4 11 17 34 7% 93%
PPWS 2 1 3 67% 33%
Psychologist 1 3 4 0% 100%
Grand Total 100 221 212 1385 1823 3741 9% 91%
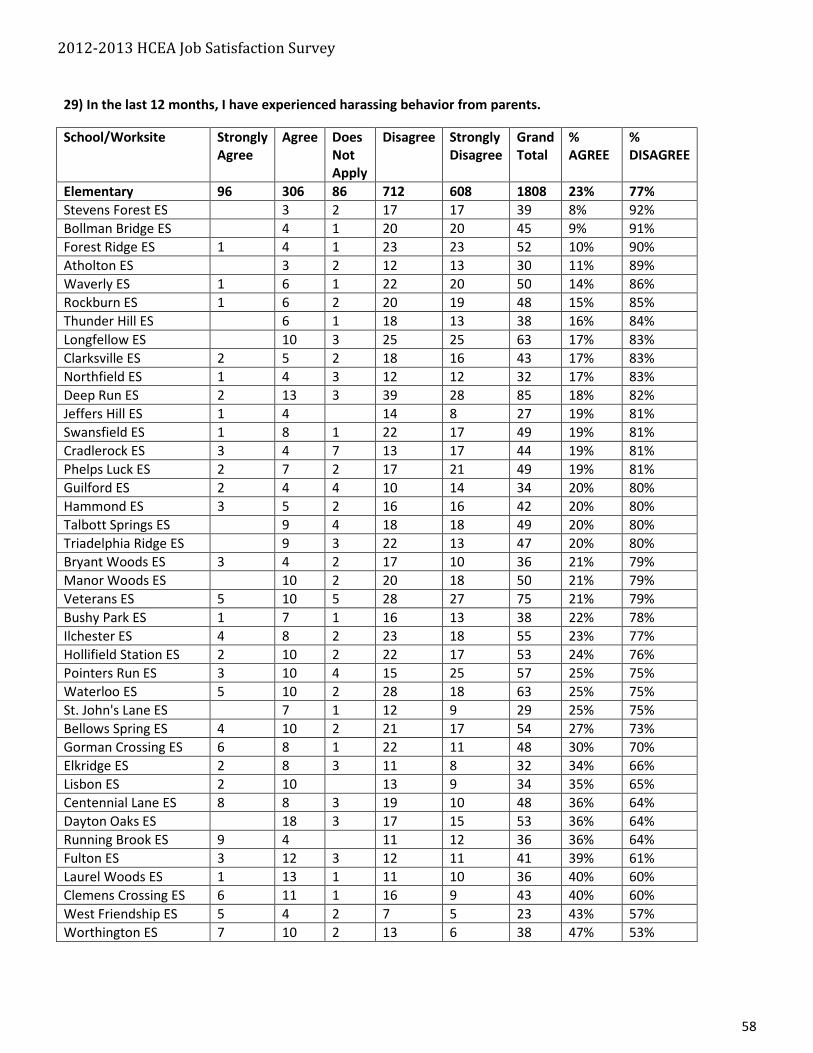
2012-2013 HCEA Job Satisfaction Survey
58
29) In the last 12 months, I have experienced harassing behavior from parents.
School/Worksite Strongly
Agree
Agree Does
Not
Apply
Disagree Strongly
Disagree
Grand
Total
%
AGREE
%
DISAGREE
Elementary 96 306 86 712 608 1808 23% 77%
Stevens Forest ES 3 2 17 17 39 8% 92%
Bollman Bridge ES 4 1 20 20 45 9% 91%
Forest Ridge ES 1 4 1 23 23 52 10% 90%
Atholton ES 3 2 12 13 30 11% 89%
Waverly ES 1 6 1 22 20 50 14% 86%
Rockburn ES 1 6 2 20 19 48 15% 85%
Thunder Hill ES 6 1 18 13 38 16% 84%
Longfellow ES 10 3 25 25 63 17% 83%
Clarksville ES 2 5 2 18 16 43 17% 83%
Northfield ES 1 4 3 12 12 32 17% 83%
Deep Run ES 2 13 3 39 28 85 18% 82%
Jeffers Hill ES 1 4 14 8 27 19% 81%
Swansfield ES 1 8 1 22 17 49 19% 81%
Cradlerock ES 3 4 7 13 17 44 19% 81%
Phelps Luck ES 2 7 2 17 21 49 19% 81%
Guilford ES 2 4 4 10 14 34 20% 80%
Hammond ES 3 5 2 16 16 42 20% 80%
Talbott Springs ES 9 4 18 18 49 20% 80%
Triadelphia Ridge ES 9 3 22 13 47 20% 80%
Bryant Woods ES 3 4 2 17 10 36 21% 79%
Manor Woods ES 10 2 20 18 50 21% 79%
Veterans ES 5 10 5 28 27 75 21% 79%
Bushy Park ES 1 7 1 16 13 38 22% 78%
Ilchester ES 4 8 2 23 18 55 23% 77%
Hollifield Station ES 2 10 2 22 17 53 24% 76%
Pointers Run ES 3 10 4 15 25 57 25% 75%
Waterloo ES 5 10 2 28 18 63 25% 75%
St. John's Lane ES 7 1 12 9 29 25% 75%
Bellows Spring ES 4 10 2 21 17 54 27% 73%
Gorman Crossing ES 6 8 1 22 11 48 30% 70%
Elkridge ES 2 8 3 11 8 32 34% 66%
Lisbon ES 2 10 13 9 34 35% 65%
Centennial Lane ES 8 8 3 19 10 48 36% 64%
Dayton Oaks ES 18 3 17 15 53 36% 64%
Running Brook ES 9 4 11 12 36 36% 64%
Fulton ES 3 12 3 12 11 41 39% 61%
Laurel Woods ES 1 13 1 11 10 36 40% 60%
Clemens Crossing ES 6 11 1 16 9 43 40% 60%
West Friendship ES 5 4 2 7 5 23 43% 57%
Worthington ES 7 10 2 13 6 38 47% 53%
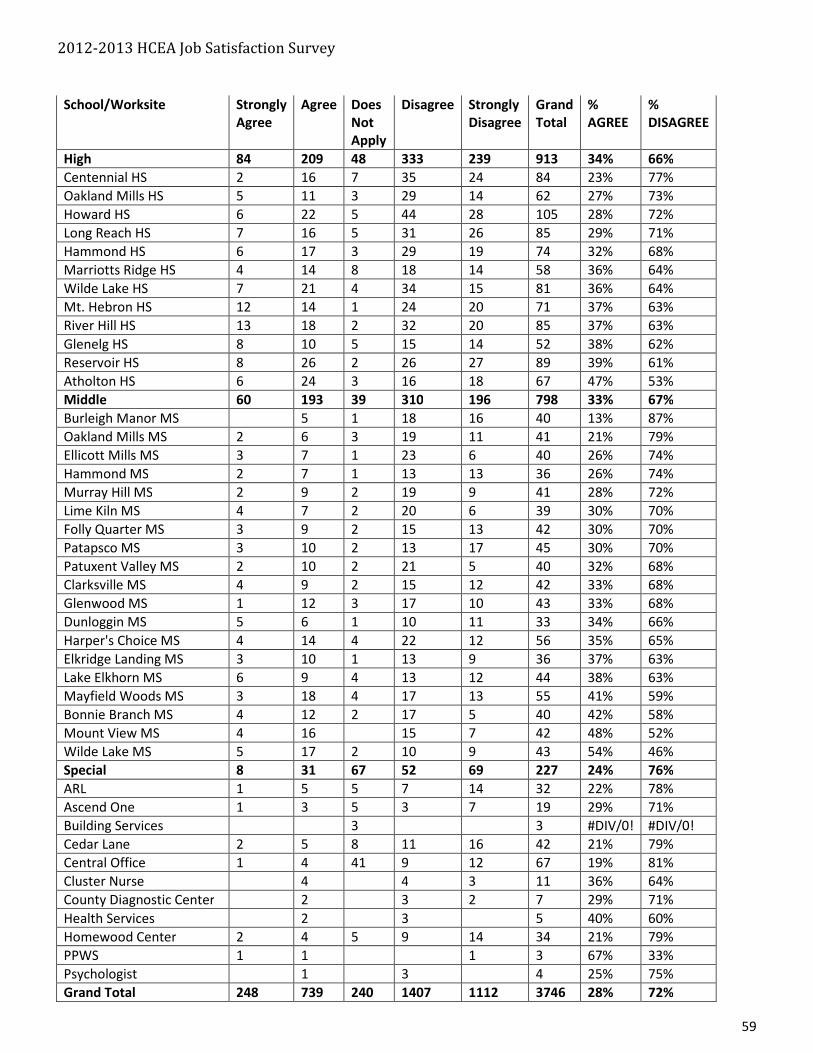
2012-2013 HCEA Job Satisfaction Survey
59
School/Worksite Strongly
Agree
Agree Does
Not
Apply
Disagree Strongly
Disagree
Grand
Total
%
AGREE
%
DISAGREE
High 84 209 48 333 239 913 34% 66%
Centennial HS 2 16 7 35 24 84 23% 77%
Oakland Mills HS 5 11 3 29 14 62 27% 73%
Howard HS 6 22 5 44 28 105 28% 72%
Long Reach HS 7 16 5 31 26 85 29% 71%
Hammond HS 6 17 3 29 19 74 32% 68%
Marriotts Ridge HS 4 14 8 18 14 58 36% 64%
Wilde Lake HS 7 21 4 34 15 81 36% 64%
Mt. Hebron HS 12 14 1 24 20 71 37% 63%
River Hill HS 13 18 2 32 20 85 37% 63%
Glenelg HS 8 10 5 15 14 52 38% 62%
Reservoir HS 8 26 2 26 27 89 39% 61%
Atholton HS 6 24 3 16 18 67 47% 53%
Middle 60 193 39 310 196 798 33% 67%
Burleigh Manor MS 5 1 18 16 40 13% 87%
Oakland Mills MS 2 6 3 19 11 41 21% 79%
Ellicott Mills MS 3 7 1 23 6 40 26% 74%
Hammond MS 2 7 1 13 13 36 26% 74%
Murray Hill MS 2 9 2 19 9 41 28% 72%
Lime Kiln MS 4 7 2 20 6 39 30% 70%
Folly Quarter MS 3 9 2 15 13 42 30% 70%
Patapsco MS 3 10 2 13 17 45 30% 70%
Patuxent Valley MS 2 10 2 21 5 40 32% 68%
Clarksville MS 4 9 2 15 12 42 33% 68%
Glenwood MS 1 12 3 17 10 43 33% 68%
Dunloggin MS 5 6 1 10 11 33 34% 66%
Harper's Choice MS 4 14 4 22 12 56 35% 65%
Elkridge Landing MS 3 10 1 13 9 36 37% 63%
Lake Elkhorn MS 6 9 4 13 12 44 38% 63%
Mayfield Woods MS 3 18 4 17 13 55 41% 59%
Bonnie Branch MS 4 12 2 17 5 40 42% 58%
Mount View MS 4 16 15 7 42 48% 52%
Wilde Lake MS 5 17 2 10 9 43 54% 46%
Special 8 31 67 52 69 227 24% 76%
ARL 1 5 5 7 14 32 22% 78%
Ascend One 1 3 5 3 7 19 29% 71%
Building Services 3 3 #DIV/0! #DIV/0!
Cedar Lane 2 5 8 11 16 42 21% 79%
Central Office 1 4 41 9 12 67 19% 81%
Cluster Nurse 4 4 3 11 36% 64%
County Diagnostic Center 2 3 2 7 29% 71%
Health Services 2 3 5 40% 60%
Homewood Center 2 4 5 9 14 34 21% 79%
PPWS 1 1 1 3 67% 33%
Psychologist 1 3 4 25% 75%
Grand Total 248 739 240 1407 1112 3746 28% 72%
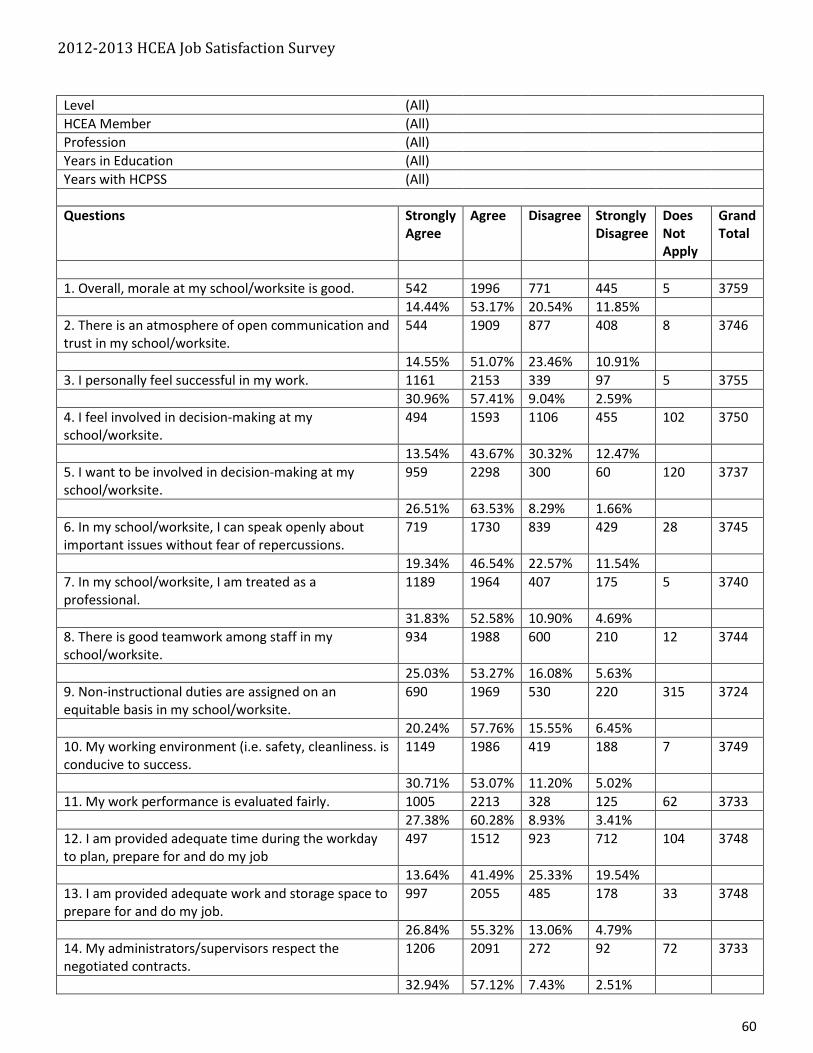
2012-2013 HCEA Job Satisfaction Survey
60
Level (All)
HCEA Member (All)
Profession (All)
Years in Education (All)
Years with HCPSS (All)
Questions Strongly
Agree
Agree Disagree Strongly
Disagree
Does
Not
Apply
Grand
Total
1. Overall, morale at my school/worksite is good. 542 1996 771 445 5 3759
14.44% 53.17% 20.54% 11.85%
2. There is an atmosphere of open communication and
trust in my school/worksite.
544 1909 877 408 8 3746
14.55% 51.07% 23.46% 10.91%
3. I personally feel successful in my work. 1161 2153 339 97 5 3755
30.96% 57.41% 9.04% 2.59%
4. I feel involved in decision-making at my
school/worksite.
494 1593 1106 455 102 3750
13.54% 43.67% 30.32% 12.47%
5. I want to be involved in decision-making at my
school/worksite.
959 2298 300 60 120 3737
26.51% 63.53% 8.29% 1.66%
6. In my school/worksite, I can speak openly about
important issues without fear of repercussions.
719 1730 839 429 28 3745
19.34% 46.54% 22.57% 11.54%
7. In my school/worksite, I am treated as a
professional.
1189 1964 407 175 5 3740
31.83% 52.58% 10.90% 4.69%
8. There is good teamwork among staff in my
school/worksite.
934 1988 600 210 12 3744
25.03% 53.27% 16.08% 5.63%
9. Non-instructional duties are assigned on an
equitable basis in my school/worksite.
690 1969 530 220 315 3724
20.24% 57.76% 15.55% 6.45%
10. My working environment (i.e. safety, cleanliness. is
conducive to success.
1149 1986 419 188 7 3749
30.71% 53.07% 11.20% 5.02%
11. My work performance is evaluated fairly. 1005 2213 328 125 62 3733
27.38% 60.28% 8.93% 3.41%
12. I am provided adequate time during the workday
to plan, prepare for and do my job
497 1512 923 712 104 3748
13.64% 41.49% 25.33% 19.54%
13. I am provided adequate work and storage space to
prepare for and do my job.
997 2055 485 178 33 3748
26.84% 55.32% 13.06% 4.79%
14. My administrators/supervisors respect the
negotiated contracts.
1206 2091 272 92 72 3733
32.94% 57.12% 7.43% 2.51%
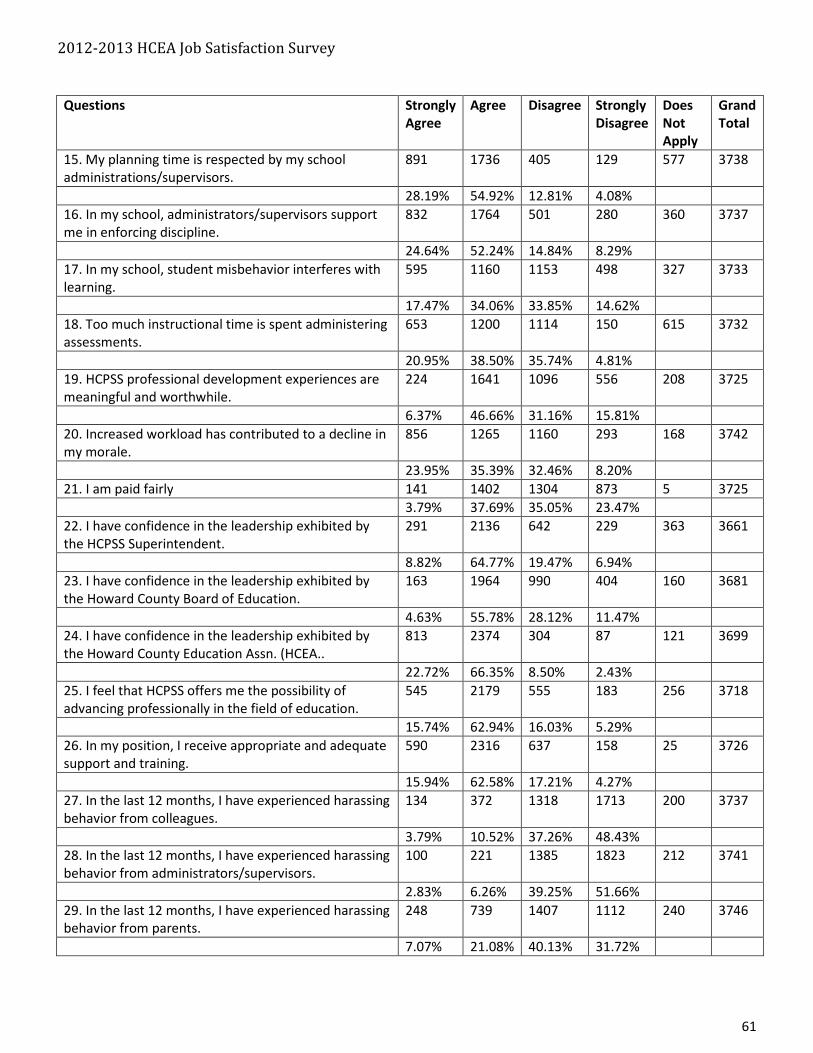
2012-2013 HCEA Job Satisfaction Survey
61
Questions Strongly
Agree
Agree Disagree Strongly
Disagree
Does
Not
Apply
Grand
Total
15. My planning time is respected by my school
administrations/supervisors.
891 1736 405 129 577 3738
28.19% 54.92% 12.81% 4.08%
16. In my school, administrators/supervisors support
me in enforcing discipline.
832 1764 501 280 360 3737
24.64% 52.24% 14.84% 8.29%
17. In my school, student misbehavior interferes with
learning.
595 1160 1153 498 327 3733
17.47% 34.06% 33.85% 14.62%
18. Too much instructional time is spent administering
assessments.
653 1200 1114 150 615 3732
20.95% 38.50% 35.74% 4.81%
19. HCPSS professional development experiences are
meaningful and worthwhile.
224 1641 1096 556 208 3725
6.37% 46.66% 31.16% 15.81%
20. Increased workload has contributed to a decline in
my morale.
856 1265 1160 293 168 3742
23.95% 35.39% 32.46% 8.20%
21. I am paid fairly 141 1402 1304 873 5 3725
3.79% 37.69% 35.05% 23.47%
22. I have confidence in the leadership exhibited by
the HCPSS Superintendent.
291 2136 642 229 363 3661
8.82% 64.77% 19.47% 6.94%
23. I have confidence in the leadership exhibited by
the Howard County Board of Education.
163 1964 990 404 160 3681
4.63% 55.78% 28.12% 11.47%
24. I have confidence in the leadership exhibited by
the Howard County Education Assn. (HCEA..
813 2374 304 87 121 3699
22.72% 66.35% 8.50% 2.43%
25. I feel that HCPSS offers me the possibility of
advancing professionally in the field of education.
545 2179 555 183 256 3718
15.74% 62.94% 16.03% 5.29%
26. In my position, I receive appropriate and adequate
support and training.
590 2316 637 158 25 3726
15.94% 62.58% 17.21% 4.27%
27. In the last 12 months, I have experienced harassing
behavior from colleagues.
134 372 1318 1713 200 3737
3.79% 10.52% 37.26% 48.43%
28. In the last 12 months, I have experienced harassing
behavior from administrators/supervisors.
100 221 1385 1823 212 3741
2.83% 6.26% 39.25% 51.66%
29. In the last 12 months, I have experienced harassing
behavior from parents.
248 739 1407 1112 240 3746
7.07% 21.08% 40.13% 31.72%

2012-2013 HCEA Job Satisfaction Survey
62
Level (All)
HCEA Member (All)
Profession Teacher
Years in Education less than 5
Years with HCPSS (All)
Questions Strongly
Agree
Agree Disagree Strongly
Disagree
Does
Not
Apply
Grand
Total
1. Overall, morale at my school/worksite is good. 50 153 46 33 282
17.73% 54.26% 16.31% 11.70%
2. There is an atmosphere of open communication and
trust in my school/worksite.
37 161 62 22 282
13.12% 57.09% 21.99% 7.80%
3. I personally feel successful in my work. 70 170 33 8 281
24.91% 60.50% 11.74% 2.85%
4. I feel involved in decision-making at my
school/worksite.
36 120 77 42 7 282
13.09% 43.64% 28.00% 15.27%
5. I want to be involved in decision-making at my
school/worksite.
63 180 21 6 11 281
23.33% 66.67% 7.78% 2.22%
6. In my school/worksite, I can speak openly about
important issues without fear of repercussions.
37 146 66 30 2 281
13.26% 52.33% 23.66% 10.75%
7. In my school/worksite, I am treated as a
professional.
93 158 19 11 281
33.10% 56.23% 6.76% 3.91%
8. There is good teamwork among staff in my
school/worksite.
81 150 39 11 281
28.83% 53.38% 13.88% 3.91%
9. Non-instructional duties are assigned on an
equitable basis in my school/worksite.
53 165 34 12 16 280
20.08% 62.50% 12.88% 4.55%
10. My working environment (i.e. safety, cleanliness. is
conducive to success.
95 145 26 13 3 282
34.05% 51.97% 9.32% 4.66%
11. My work performance is evaluated fairly. 83 167 23 8 1 282
29.54% 59.43% 8.19% 2.85%
12. I am provided adequate time during the workday
to plan, prepare for and do my job
30 110 94 47 1 282
10.68% 39.15% 33.45% 16.73%
13. I am provided adequate work and storage space to
prepare for and do my job.
72 153 48 8 1 282
25.62% 54.45% 17.08% 2.85%
14. My administrators/supervisors respect the
negotiated contracts.
95 156 20 3 7 281
34.67% 56.93% 7.30% 1.09%
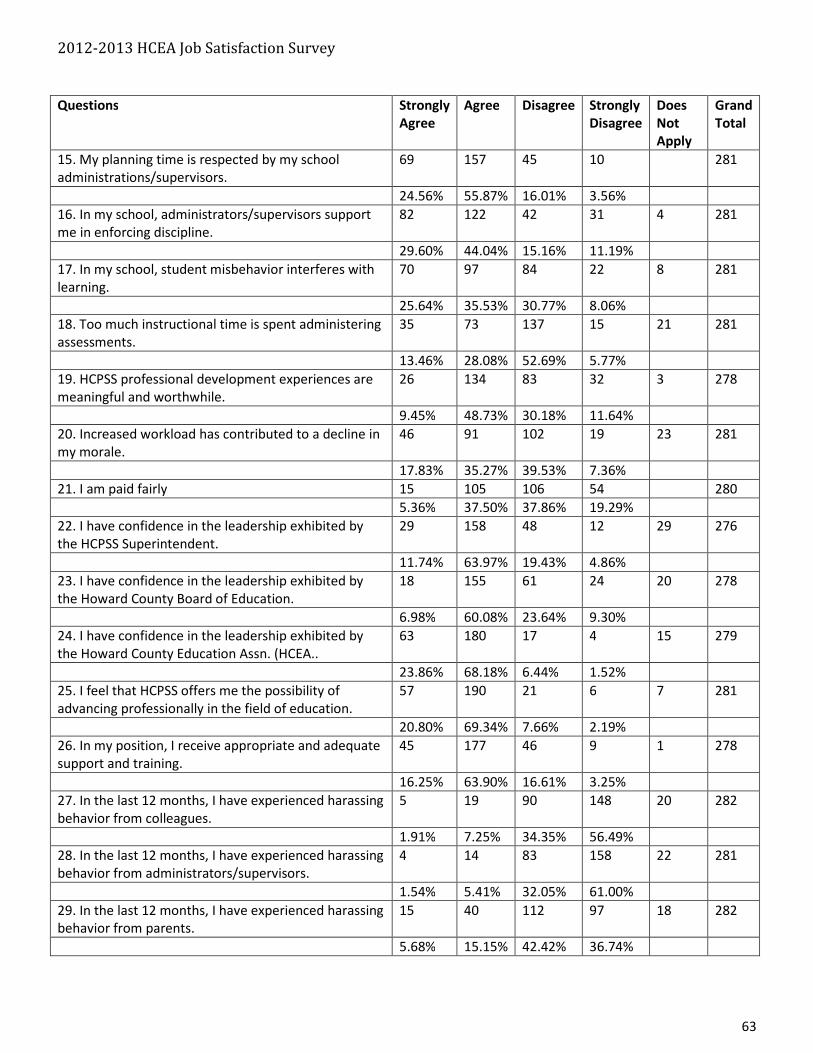
2012-2013 HCEA Job Satisfaction Survey
63
Questions Strongly
Agree
Agree Disagree Strongly
Disagree
Does
Not
Apply
Grand
Total
15. My planning time is respected by my school
administrations/supervisors.
69 157 45 10 281
24.56% 55.87% 16.01% 3.56%
16. In my school, administrators/supervisors support
me in enforcing discipline.
82 122 42 31 4 281
29.60% 44.04% 15.16% 11.19%
17. In my school, student misbehavior interferes with
learning.
70 97 84 22 8 281
25.64% 35.53% 30.77% 8.06%
18. Too much instructional time is spent administering
assessments.
35 73 137 15 21 281
13.46% 28.08% 52.69% 5.77%
19. HCPSS professional development experiences are
meaningful and worthwhile.
26 134 83 32 3 278
9.45% 48.73% 30.18% 11.64%
20. Increased workload has contributed to a decline in
my morale.
46 91 102 19 23 281
17.83% 35.27% 39.53% 7.36%
21. I am paid fairly 15 105 106 54 280
5.36% 37.50% 37.86% 19.29%
22. I have confidence in the leadership exhibited by
the HCPSS Superintendent.
29 158 48 12 29 276
11.74% 63.97% 19.43% 4.86%
23. I have confidence in the leadership exhibited by
the Howard County Board of Education.
18 155 61 24 20 278
6.98% 60.08% 23.64% 9.30%
24. I have confidence in the leadership exhibited by
the Howard County Education Assn. (HCEA..
63 180 17 4 15 279
23.86% 68.18% 6.44% 1.52%
25. I feel that HCPSS offers me the possibility of
advancing professionally in the field of education.
57 190 21 6 7 281
20.80% 69.34% 7.66% 2.19%
26. In my position, I receive appropriate and adequate
support and training.
45 177 46 9 1 278
16.25% 63.90% 16.61% 3.25%
27. In the last 12 months, I have experienced harassing
behavior from colleagues.
5 19 90 148 20 282
1.91% 7.25% 34.35% 56.49%
28. In the last 12 months, I have experienced harassing
behavior from administrators/supervisors.
4 14 83 158 22 281
1.54% 5.41% 32.05% 61.00%
29. In the last 12 months, I have experienced harassing
behavior from parents.
15 40 112 97 18 282
5.68% 15.15% 42.42% 36.74%

2012-2013 HCEA Job Satisfaction Survey
64
Level (All)
HCEA Member (All)
Profession Teacher
Years in Education 5 to 10
Years with HCPSS (All)
Questions Strongly
Agree
Agree Disagree Strongly
Disagree
Does
Not
Apply
Grand
Total
1. Overall, morale at my school/worksite is good. 86 358 132 81 1 658
13.09% 54.49% 20.09% 12.33%
2. There is an atmosphere of open communication and
trust in my school/worksite.
94 323 160 73 1 651
14.46% 49.69% 24.62% 11.23%
3. I personally feel successful in my work. 193 379 64 20 1 657
29.42% 57.77% 9.76% 3.05%
4. I feel involved in decision-making at my
school/worksite.
85 286 201 74 10 656
13.16% 44.27% 31.11% 11.46%
5. I want to be involved in decision-making at my
school/worksite.
174 409 50 7 15 655
27.19% 63.91% 7.81% 1.09%
6. In my school/worksite, I can speak openly about
important issues without fear of repercussions.
110 306 151 87 1 655
16.82% 46.79% 23.09% 13.30%
7. In my school/worksite, I am treated as a
professional.
206 347 73 30 656
31.40% 52.90% 11.13% 4.57%
8. There is good teamwork among staff in my
school/worksite.
156 349 108 42 2 657
23.82% 53.28% 16.49% 6.41%
9. Non-instructional duties are assigned on an
equitable basis in my school/worksite.
135 358 90 41 25 649
21.63% 57.37% 14.42% 6.57%
10. My working environment (i.e. safety, cleanliness. is
conducive to success.
200 332 82 41 655
30.53% 50.69% 12.52% 6.26%
11. My work performance is evaluated fairly. 174 397 58 25 5 659
26.61% 60.70% 8.87% 3.82%
12. I am provided adequate time during the workday
to plan, prepare for and do my job
76 236 187 156 655
11.60% 36.03% 28.55% 23.82%
13. I am provided adequate work and storage space to
prepare for and do my job.
176 361 87 30 1 655
26.91% 55.20% 13.30% 4.59%
14. My administrators/supervisors respect the
negotiated contracts.
226 370 46 12 3 657
34.56% 56.57% 7.03% 1.83%

2012-2013 HCEA Job Satisfaction Survey
65
Questions Strongly
Agree
Agree Disagree Strongly
Disagree
Does
Not
Apply
Grand
Total
15. My planning time is respected by my school
administrations/supervisors.
198 349 84 23 2 656
30.28% 53.36% 12.84% 3.52%
16. In my school, administrators/supervisors support
me in enforcing discipline.
166 308 102 61 15 652
26.06% 48.35% 16.01% 9.58%
17. In my school, student misbehavior interferes with
learning.
117 209 219 92 21 658
18.37% 32.81% 34.38% 14.44%
18. Too much instructional time is spent administering
assessments.
104 216 262 28 42 652
17.05% 35.41% 42.95% 4.59%
19. HCPSS professional development experiences are
meaningful and worthwhile.
29 275 220 121 7 652
4.50% 42.64% 34.11% 18.76%
20. Increased workload has contributed to a decline in
my morale.
185 233 204 27 8 657
28.51% 35.90% 31.43% 4.16%
21. I am paid fairly 16 212 247 179 654
2.45% 32.42% 37.77% 27.37%
22. I have confidence in the leadership exhibited by
the HCPSS Superintendent.
40 376 122 41 70 649
6.91% 64.94% 21.07% 7.08%
23. I have confidence in the leadership exhibited by
the Howard County Board of Education.
17 337 172 84 37 647
2.79% 55.25% 28.20% 13.77%
24. I have confidence in the leadership exhibited by
the Howard County Education Assn. (HCEA..
145 425 45 13 22 650
23.09% 67.68% 7.17% 2.07%
25. I feel that HCPSS offers me the possibility of
advancing professionally in the field of education.
108 406 95 28 13 650
16.95% 63.74% 14.91% 4.40%
26. In my position, I receive appropriate and adequate
support and training.
84 430 115 24 653
12.86% 65.85% 17.61% 3.68%
27. In the last 12 months, I have experienced harassing
behavior from colleagues.
31 73 231 297 26 658
4.91% 11.55% 36.55% 46.99%
28. In the last 12 months, I have experienced harassing
behavior from administrators/supervisors.
16 37 250 323 30 656
2.56% 5.91% 39.94% 51.60%
29. In the last 12 months, I have experienced harassing
behavior from parents.
57 174 249 161 16 657
8.89% 27.15% 38.85% 25.12%
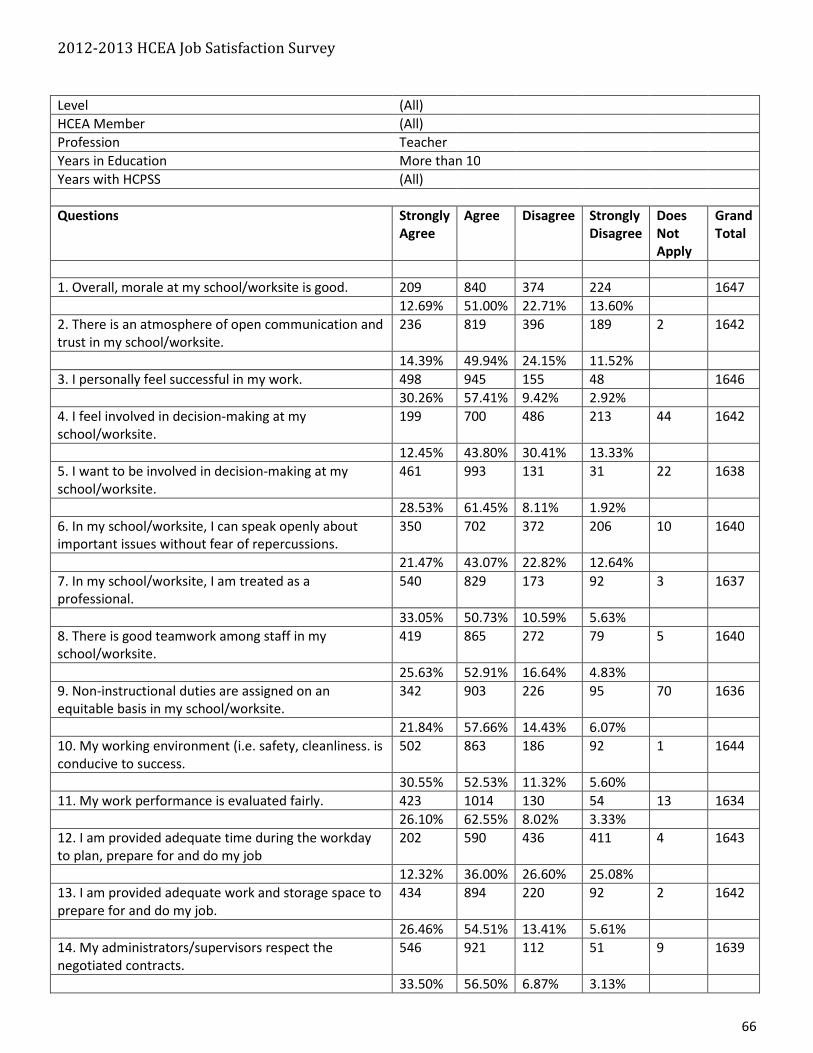
2012-2013 HCEA Job Satisfaction Survey
66
Level (All)
HCEA Member (All)
Profession Teacher
Years in Education More than 10
Years with HCPSS (All)
Questions Strongly
Agree
Agree Disagree Strongly
Disagree
Does
Not
Apply
Grand
Total
1. Overall, morale at my school/worksite is good. 209 840 374 224 1647
12.69% 51.00% 22.71% 13.60%
2. There is an atmosphere of open communication and
trust in my school/worksite.
236 819 396 189 2 1642
14.39% 49.94% 24.15% 11.52%
3. I personally feel successful in my work. 498 945 155 48 1646
30.26% 57.41% 9.42% 2.92%
4. I feel involved in decision-making at my
school/worksite.
199 700 486 213 44 1642
12.45% 43.80% 30.41% 13.33%
5. I want to be involved in decision-making at my
school/worksite.
461 993 131 31 22 1638
28.53% 61.45% 8.11% 1.92%
6. In my school/worksite, I can speak openly about
important issues without fear of repercussions.
350 702 372 206 10 1640
21.47% 43.07% 22.82% 12.64%
7. In my school/worksite, I am treated as a
professional.
540 829 173 92 3 1637
33.05% 50.73% 10.59% 5.63%
8. There is good teamwork among staff in my
school/worksite.
419 865 272 79 5 1640
25.63% 52.91% 16.64% 4.83%
9. Non-instructional duties are assigned on an
equitable basis in my school/worksite.
342 903 226 95 70 1636
21.84% 57.66% 14.43% 6.07%
10. My working environment (i.e. safety, cleanliness. is
conducive to success.
502 863 186 92 1 1644
30.55% 52.53% 11.32% 5.60%
11. My work performance is evaluated fairly. 423 1014 130 54 13 1634
26.10% 62.55% 8.02% 3.33%
12. I am provided adequate time during the workday
to plan, prepare for and do my job
202 590 436 411 4 1643
12.32% 36.00% 26.60% 25.08%
13. I am provided adequate work and storage space to
prepare for and do my job.
434 894 220 92 2 1642
26.46% 54.51% 13.41% 5.61%
14. My administrators/supervisors respect the
negotiated contracts.
546 921 112 51 9 1639
33.50% 56.50% 6.87% 3.13%
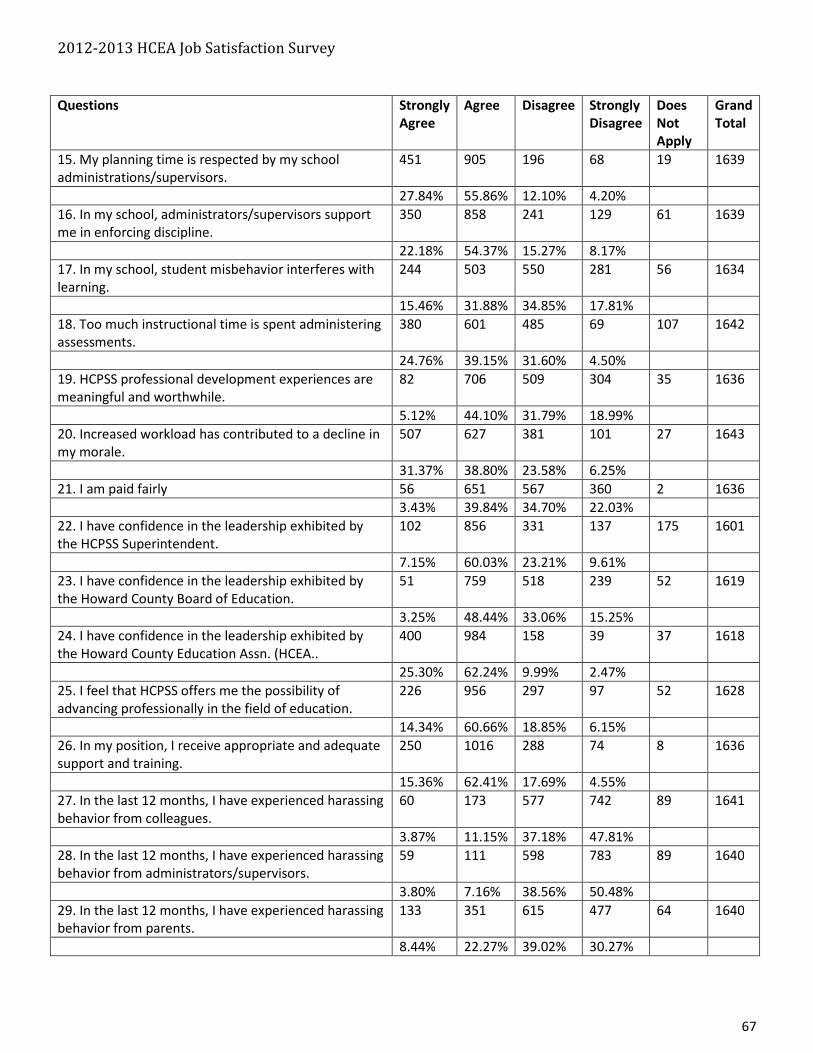
2012-2013 HCEA Job Satisfaction Survey
67
Questions Strongly
Agree
Agree Disagree Strongly
Disagree
Does
Not
Apply
Grand
Total
15. My planning time is respected by my school
administrations/supervisors.
451 905 196 68 19 1639
27.84% 55.86% 12.10% 4.20%
16. In my school, administrators/supervisors support
me in enforcing discipline.
350 858 241 129 61 1639
22.18% 54.37% 15.27% 8.17%
17. In my school, student misbehavior interferes with
learning.
244 503 550 281 56 1634
15.46% 31.88% 34.85% 17.81%
18. Too much instructional time is spent administering
assessments.
380 601 485 69 107 1642
24.76% 39.15% 31.60% 4.50%
19. HCPSS professional development experiences are
meaningful and worthwhile.
82 706 509 304 35 1636
5.12% 44.10% 31.79% 18.99%
20. Increased workload has contributed to a decline in
my morale.
507 627 381 101 27 1643
31.37% 38.80% 23.58% 6.25%
21. I am paid fairly 56 651 567 360 2 1636
3.43% 39.84% 34.70% 22.03%
22. I have confidence in the leadership exhibited by
the HCPSS Superintendent.
102 856 331 137 175 1601
7.15% 60.03% 23.21% 9.61%
23. I have confidence in the leadership exhibited by
the Howard County Board of Education.
51 759 518 239 52 1619
3.25% 48.44% 33.06% 15.25%
24. I have confidence in the leadership exhibited by
the Howard County Education Assn. (HCEA..
400 984 158 39 37 1618
25.30% 62.24% 9.99% 2.47%
25. I feel that HCPSS offers me the possibility of
advancing professionally in the field of education.
226 956 297 97 52 1628
14.34% 60.66% 18.85% 6.15%
26. In my position, I receive appropriate and adequate
support and training.
250 1016 288 74 8 1636
15.36% 62.41% 17.69% 4.55%
27. In the last 12 months, I have experienced harassing
behavior from colleagues.
60 173 577 742 89 1641
3.87% 11.15% 37.18% 47.81%
28. In the last 12 months, I have experienced harassing
behavior from administrators/supervisors.
59 111 598 783 89 1640
3.80% 7.16% 38.56% 50.48%
29. In the last 12 months, I have experienced harassing
behavior from parents.
133 351 615 477 64 1640
8.44% 22.27% 39.02% 30.27%

2012-2013 HCEA Job Satisfaction Survey
68
Level Elementary
HCEA Member (All)
Profession Teacher
Years in Education (All)
Years with HCPSS (All)
Questions Strongly
Agree
Agree Disagree Strongly
Disagree
Does
Not
Apply
Grand
Total
1. Overall, morale at my school/worksite is good. 208 709 201 102 1 1221
17.05% 58.11% 16.48% 8.36%
2. There is an atmosphere of open communication and
trust in my school/worksite.
212 649 254 102 1217
17.42% 53.33% 20.87% 8.38%
3. I personally feel successful in my work. 384 721 92 23 1220
31.48% 59.10% 7.54% 1.89%
4. I feel involved in decision-making at my
school/worksite.
161 566 340 125 24 1216
13.51% 47.48% 28.52% 10.49%
5. I want to be involved in decision-making at my
school/worksite.
357 749 73 16 19 1214
29.87% 62.68% 6.11% 1.34%
6. In my school/worksite, I can speak openly about
important issues without fear of repercussions.
262 589 230 131 4 1216
21.62% 48.60% 18.98% 10.81%
7. In my school/worksite, I am treated as a
professional.
452 626 90 47 1 1216
37.20% 51.52% 7.41% 3.87%
8. There is good teamwork among staff in my
school/worksite.
340 648 174 53 2 1217
27.98% 53.33% 14.32% 4.36%
9. Non-instructional duties are assigned on an
equitable basis in my school/worksite.
258 678 147 50 78 1211
22.77% 59.84% 12.97% 4.41%
10. My working environment (i.e. safety, cleanliness. is
conducive to success.
378 626 151 62 2 1219
31.06% 51.44% 12.41% 5.09%
11. My work performance is evaluated fairly. 381 726 66 33 8 1214
31.59% 60.20% 5.47% 2.74%
12. I am provided adequate time during the workday
to plan, prepare for and do my job
144 502 337 235 1218
11.82% 41.22% 27.67% 19.29%
13. I am provided adequate work and storage space to
prepare for and do my job.
287 691 174 65 2 1219
23.58% 56.78% 14.30% 5.34%
14. My administrators/supervisors respect the
negotiated contracts.
468 657 56 27 7 1215
38.74% 54.39% 4.64% 2.24%

2012-2013 HCEA Job Satisfaction Survey
69
Questions Strongly
Agree
Agree Disagree Strongly
Disagree
Does
Not
Apply
Grand
Total
15. My planning time is respected by my school
administrations/supervisors.
359 659 150 44 4 1216
29.62% 54.37% 12.38% 3.63%
16. In my school, administrators/supervisors support
me in enforcing discipline.
331 616 137 86 43 1213
28.29% 52.65% 11.71% 7.35%
17. In my school, student misbehavior interferes with
learning.
164 411 438 161 42 1216
13.97% 35.01% 37.31% 13.71%
18. Too much instructional time is spent administering
assessments.
170 427 470 45 102 1214
15.29% 38.40% 42.27% 4.05%
19. HCPSS professional development experiences are
meaningful and worthwhile.
73 655 339 136 8 1211
6.07% 54.45% 28.18% 11.31%
20. Increased workload has contributed to a decline in
my morale.
287 473 362 68 29 1219
24.12% 39.75% 30.42% 5.71%
21. I am paid fairly 37 462 439 275 1213
3.05% 38.09% 36.19% 22.67%
22. I have confidence in the leadership exhibited by
the HCPSS Superintendent.
96 750 194 59 98 1197
8.74% 68.24% 17.65% 5.37%
23. I have confidence in the leadership exhibited by
the Howard County Board of Education.
51 718 302 92 38 1201
4.39% 61.74% 25.97% 7.91%
24. I have confidence in the leadership exhibited by
the Howard County Education Assn. (HCEA..
311 780 71 21 24 1207
26.29% 65.93% 6.00% 1.78%
25. I feel that HCPSS offers me the possibility of
advancing professionally in the field of education.
208 764 163 45 30 1210
17.63% 64.75% 13.81% 3.81%
26. In my position, I receive appropriate and adequate
support and training.
212 799 167 32 1 1211
17.52% 66.03% 13.80% 2.64%
27. In the last 12 months, I have experienced harassing
behavior from colleagues.
49 127 424 564 54 1218
4.21% 10.91% 36.43% 48.45%
28. In the last 12 months, I have experienced harassing
behavior from administrators/supervisors.
30 63 429 632 65 1219
2.60% 5.46% 37.18% 54.77%
29. In the last 12 months, I have experienced harassing
behavior from parents.
75 224 473 398 48 1218
6.41% 19.15% 40.43% 34.02%
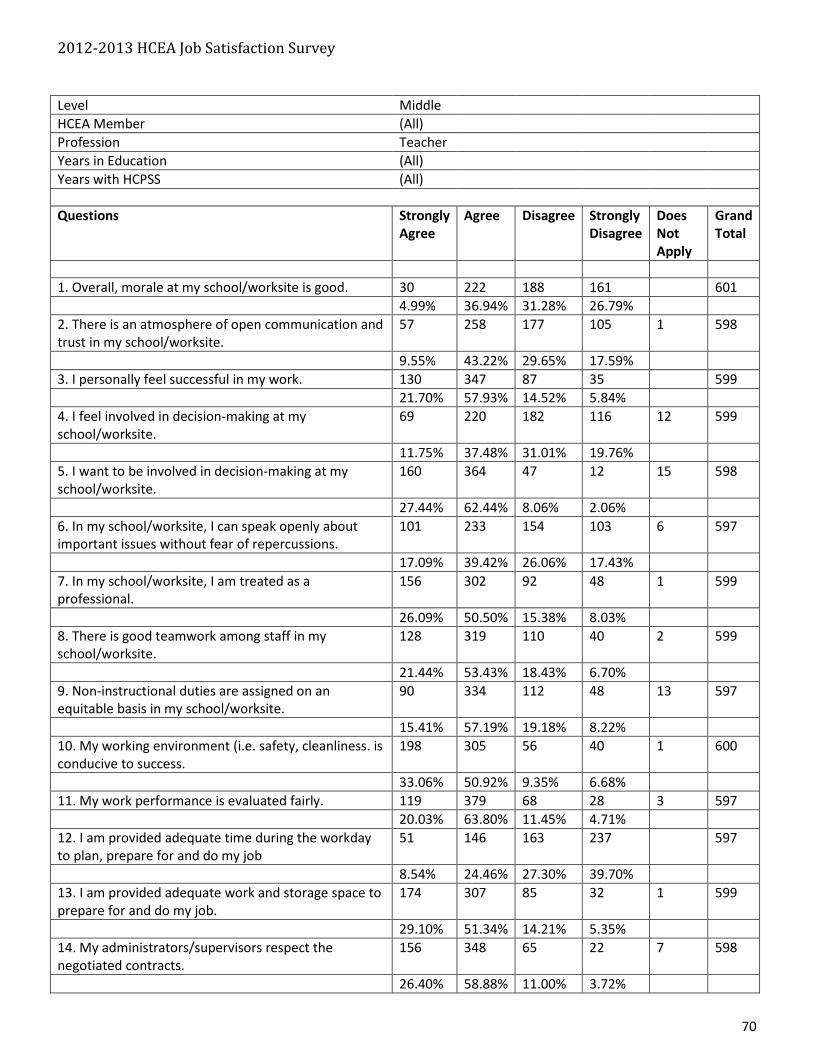
2012-2013 HCEA Job Satisfaction Survey
70
Level Middle
HCEA Member (All)
Profession Teacher
Years in Education (All)
Years with HCPSS (All)
Questions Strongly
Agree
Agree Disagree Strongly
Disagree
Does
Not
Apply
Grand
Total
1. Overall, morale at my school/worksite is good. 30 222 188 161 601
4.99% 36.94% 31.28% 26.79%
2. There is an atmosphere of open communication and
trust in my school/worksite.
57 258 177 105 1 598
9.55% 43.22% 29.65% 17.59%
3. I personally feel successful in my work. 130 347 87 35 599
21.70% 57.93% 14.52% 5.84%
4. I feel involved in decision-making at my
school/worksite.
69 220 182 116 12 599
11.75% 37.48% 31.01% 19.76%
5. I want to be involved in decision-making at my
school/worksite.
160 364 47 12 15 598
27.44% 62.44% 8.06% 2.06%
6. In my school/worksite, I can speak openly about
important issues without fear of repercussions.
101 233 154 103 6 597
17.09% 39.42% 26.06% 17.43%
7. In my school/worksite, I am treated as a
professional.
156 302 92 48 1 599
26.09% 50.50% 15.38% 8.03%
8. There is good teamwork among staff in my
school/worksite.
128 319 110 40 2 599
21.44% 53.43% 18.43% 6.70%
9. Non-instructional duties are assigned on an
equitable basis in my school/worksite.
90 334 112 48 13 597
15.41% 57.19% 19.18% 8.22%
10. My working environment (i.e. safety, cleanliness. is
conducive to success.
198 305 56 40 1 600
33.06% 50.92% 9.35% 6.68%
11. My work performance is evaluated fairly. 119 379 68 28 3 597
20.03% 63.80% 11.45% 4.71%
12. I am provided adequate time during the workday
to plan, prepare for and do my job
51 146 163 237 597
8.54% 24.46% 27.30% 39.70%
13. I am provided adequate work and storage space to
prepare for and do my job.
174 307 85 32 1 599
29.10% 51.34% 14.21% 5.35%
14. My administrators/supervisors respect the
negotiated contracts.
156 348 65 22 7 598
26.40% 58.88% 11.00% 3.72%

2012-2013 HCEA Job Satisfaction Survey
71
Questions Strongly
Agree
Agree Disagree Strongly
Disagree
Does
Not
Apply
Grand
Total
15. My planning time is respected by my school
administrations/supervisors.
132 330 100 36 2 600
22.07% 55.18% 16.72% 6.02%
16. In my school, administrators/supervisors support
me in enforcing discipline.
109 278 119 83 8 597
18.51% 47.20% 20.20% 14.09%
17. In my school, student misbehavior interferes with
learning.
159 161 158 104 14 596
27.32% 27.66% 27.15% 17.87%
18. Too much instructional time is spent administering
assessments.
192 198 165 23 19 597
33.22% 34.26% 28.55% 3.98%
19. HCPSS professional development experiences are
meaningful and worthwhile.
39 217 207 122 8 593
6.67% 37.09% 35.38% 20.85%
20. Increased workload has contributed to a decline in
my morale.
265 214 80 35 6 600
44.61% 36.03% 13.47% 5.89%
21. I am paid fairly 25 222 212 137 1 597
4.19% 37.25% 35.57% 22.99%
22. I have confidence in the leadership exhibited by
the HCPSS Superintendent.
35 273 131 60 83 582
7.01% 54.71% 26.25% 12.02%
23. I have confidence in the leadership exhibited by
the Howard County Board of Education.
15 205 191 151 28 590
2.67% 36.48% 33.99% 26.87%
24. I have confidence in the leadership exhibited by
the Howard County Education Assn. (HCEA..
135 342 76 14 19 586
23.81% 60.32% 13.40% 2.47%
25. I feel that HCPSS offers me the possibility of
advancing professionally in the field of education.
80 340 108 41 21 590
14.06% 59.75% 18.98% 7.21%
26. In my position, I receive appropriate and adequate
support and training.
80 339 133 42 3 597
13.47% 57.07% 22.39% 7.07%
27. In the last 12 months, I have experienced harassing
behavior from colleagues.
14 71 213 268 31 597
2.47% 12.54% 37.63% 47.35%
28. In the last 12 months, I have experienced harassing
behavior from administrators/supervisors.
18 53 221 273 31 596
3.19% 9.38% 39.12% 48.32%
29. In the last 12 months, I have experienced harassing
behavior from parents.
54 161 227 136 21 599
9.34% 27.85% 39.27% 23.53%
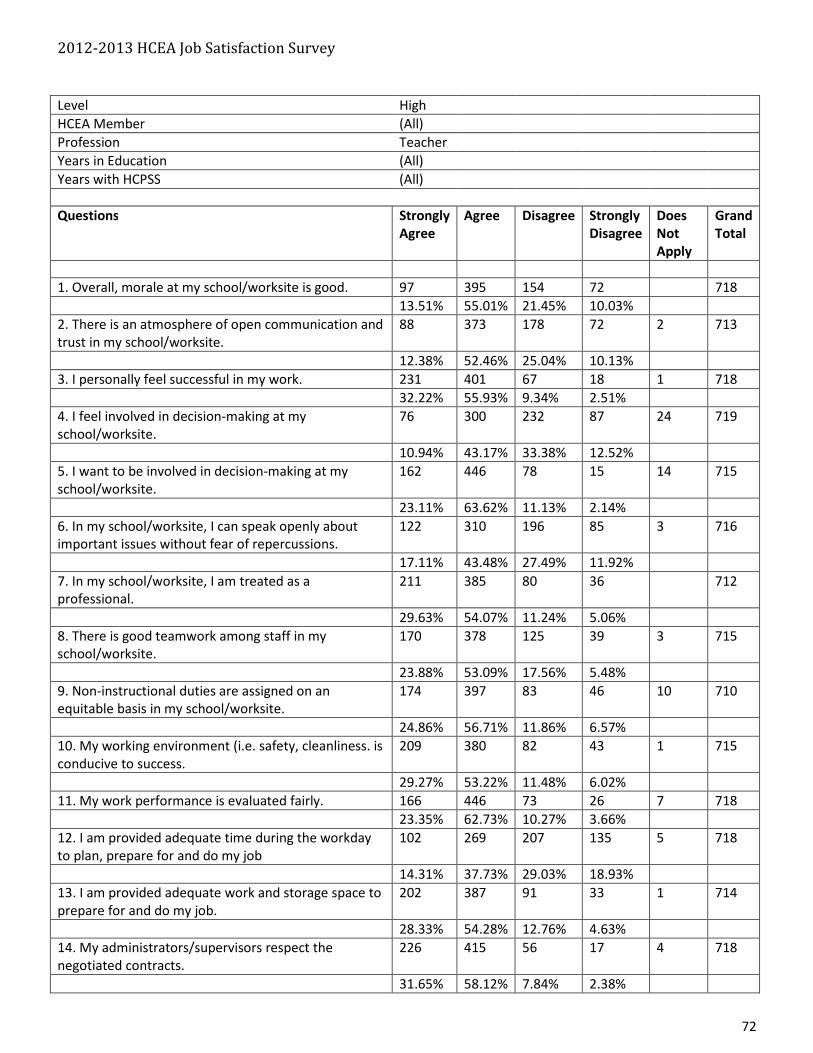
2012-2013 HCEA Job Satisfaction Survey
72
Level High
HCEA Member (All)
Profession Teacher
Years in Education (All)
Years with HCPSS (All)
Questions Strongly
Agree
Agree Disagree Strongly
Disagree
Does
Not
Apply
Grand
Total
1. Overall, morale at my school/worksite is good. 97 395 154 72 718
13.51% 55.01% 21.45% 10.03%
2. There is an atmosphere of open communication and
trust in my school/worksite.
88 373 178 72 2 713
12.38% 52.46% 25.04% 10.13%
3. I personally feel successful in my work. 231 401 67 18 1 718
32.22% 55.93% 9.34% 2.51%
4. I feel involved in decision-making at my
school/worksite.
76 300 232 87 24 719
10.94% 43.17% 33.38% 12.52%
5. I want to be involved in decision-making at my
school/worksite.
162 446 78 15 14 715
23.11% 63.62% 11.13% 2.14%
6. In my school/worksite, I can speak openly about
important issues without fear of repercussions.
122 310 196 85 3 716
17.11% 43.48% 27.49% 11.92%
7. In my school/worksite, I am treated as a
professional.
211 385 80 36 712
29.63% 54.07% 11.24% 5.06%
8. There is good teamwork among staff in my
school/worksite.
170 378 125 39 3 715
23.88% 53.09% 17.56% 5.48%
9. Non-instructional duties are assigned on an
equitable basis in my school/worksite.
174 397 83 46 10 710
24.86% 56.71% 11.86% 6.57%
10. My working environment (i.e. safety, cleanliness. is
conducive to success.
209 380 82 43 1 715
29.27% 53.22% 11.48% 6.02%
11. My work performance is evaluated fairly. 166 446 73 26 7 718
23.35% 62.73% 10.27% 3.66%
12. I am provided adequate time during the workday
to plan, prepare for and do my job
102 269 207 135 5 718
14.31% 37.73% 29.03% 18.93%
13. I am provided adequate work and storage space to
prepare for and do my job.
202 387 91 33 1 714
28.33% 54.28% 12.76% 4.63%
14. My administrators/supervisors respect the
negotiated contracts.
226 415 56 17 4 718
31.65% 58.12% 7.84% 2.38%

2012-2013 HCEA Job Satisfaction Survey
73
Questions Strongly
Agree
Agree Disagree Strongly
Disagree
Does
Not
Apply
Grand
Total
15. My planning time is respected by my school
administrations/supervisors.
216 404 72 19 4 715
30.38% 56.82% 10.13% 2.67%
16. In my school, administrators/supervisors support
me in enforcing discipline.
151 382 126 52 5 716
21.24% 53.73% 17.72% 7.31%
17. In my school, student misbehavior interferes with
learning.
94 232 251 129 8 714
13.31% 32.86% 35.55% 18.27%
18. Too much instructional time is spent administering
assessments.
149 260 230 42 36 717
21.88% 38.18% 33.77% 6.17%
19. HCPSS professional development experiences are
meaningful and worthwhile.
19 212 263 195 28 717
2.76% 30.77% 38.17% 28.30%
20. Increased workload has contributed to a decline in
my morale.
179 250 224 40 22 715
25.83% 36.08% 32.32% 5.77%
21. I am paid fairly 19 262 255 176 1 713
2.67% 36.80% 35.81% 24.72%
22. I have confidence in the leadership exhibited by
the HCPSS Superintendent.
28 351 164 70 87 700
4.57% 57.26% 26.75% 11.42%
23. I have confidence in the leadership exhibited by
the Howard County Board of Education.
13 306 247 100 41 707
1.95% 45.95% 37.09% 15.02%
24. I have confidence in the leadership exhibited by
the Howard County Education Assn. (HCEA..
151 440 68 20 29 708
22.24% 64.80% 10.01% 2.95%
25. I feel that HCPSS offers me the possibility of
advancing professionally in the field of education.
93 416 140 43 20 712
13.44% 60.12% 20.23% 6.21%
26. In my position, I receive appropriate and adequate
support and training.
77 460 140 30 5 712
10.89% 65.06% 19.80% 4.24%
27. In the last 12 months, I have experienced harassing
behavior from colleagues.
28 64 248 332 47 719
4.17% 9.52% 36.90% 49.40%
28. In the last 12 months, I have experienced harassing
behavior from administrators/supervisors.
29 46 268 330 43 716
4.31% 6.84% 39.82% 49.03%
29. In the last 12 months, I have experienced harassing
behavior from parents.
73 174 267 181 21 716
10.50% 25.04% 38.42% 26.04%
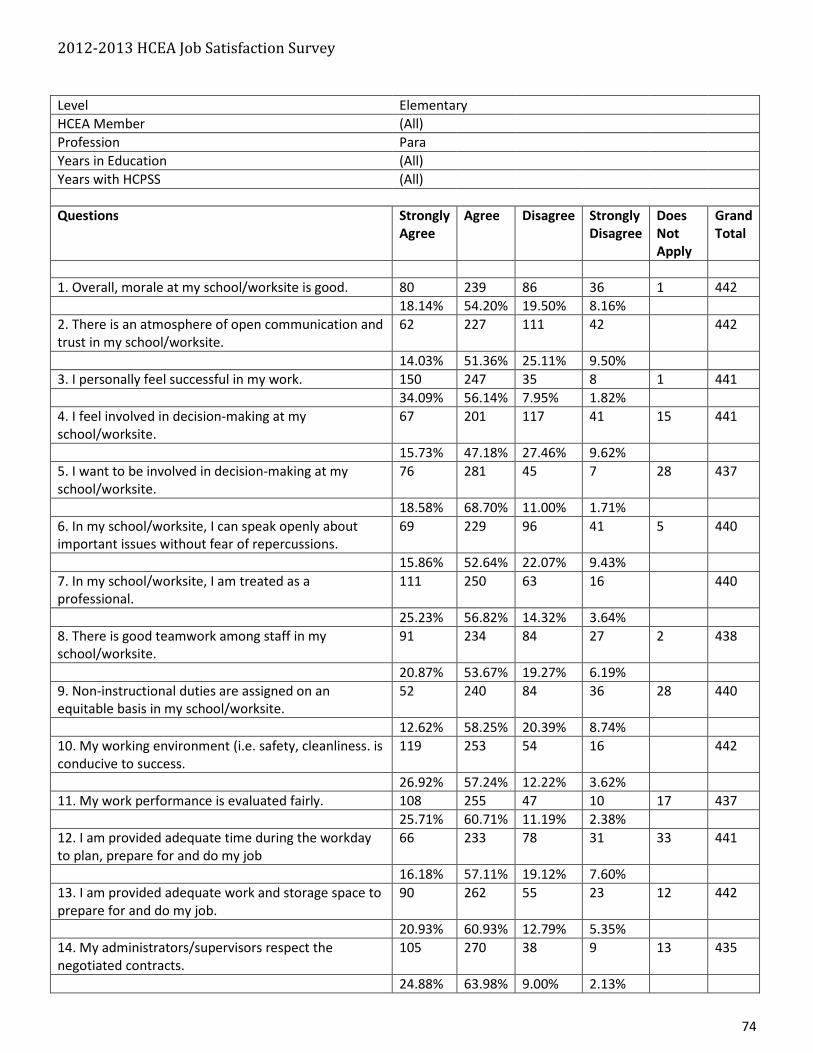
2012-2013 HCEA Job Satisfaction Survey
74
Level Elementary
HCEA Member (All)
Profession Para
Years in Education (All)
Years with HCPSS (All)
Questions Strongly
Agree
Agree Disagree Strongly
Disagree
Does
Not
Apply
Grand
Total
1. Overall, morale at my school/worksite is good. 80 239 86 36 1 442
18.14% 54.20% 19.50% 8.16%
2. There is an atmosphere of open communication and
trust in my school/worksite.
62 227 111 42 442
14.03% 51.36% 25.11% 9.50%
3. I personally feel successful in my work. 150 247 35 8 1 441
34.09% 56.14% 7.95% 1.82%
4. I feel involved in decision-making at my
school/worksite.
67 201 117 41 15 441
15.73% 47.18% 27.46% 9.62%
5. I want to be involved in decision-making at my
school/worksite.
76 281 45 7 28 437
18.58% 68.70% 11.00% 1.71%
6. In my school/worksite, I can speak openly about
important issues without fear of repercussions.
69 229 96 41 5 440
15.86% 52.64% 22.07% 9.43%
7. In my school/worksite, I am treated as a
professional.
111 250 63 16 440
25.23% 56.82% 14.32% 3.64%
8. There is good teamwork among staff in my
school/worksite.
91 234 84 27 2 438
20.87% 53.67% 19.27% 6.19%
9. Non-instructional duties are assigned on an
equitable basis in my school/worksite.
52 240 84 36 28 440
12.62% 58.25% 20.39% 8.74%
10. My working environment (i.e. safety, cleanliness. is
conducive to success.
119 253 54 16 442
26.92% 57.24% 12.22% 3.62%
11. My work performance is evaluated fairly. 108 255 47 10 17 437
25.71% 60.71% 11.19% 2.38%
12. I am provided adequate time during the workday
to plan, prepare for and do my job
66 233 78 31 33 441
16.18% 57.11% 19.12% 7.60%
13. I am provided adequate work and storage space to
prepare for and do my job.
90 262 55 23 12 442
20.93% 60.93% 12.79% 5.35%
14. My administrators/supervisors respect the
negotiated contracts.
105 270 38 9 13 435
24.88% 63.98% 9.00% 2.13%

2012-2013 HCEA Job Satisfaction Survey
75
Questions Strongly
Agree
Agree Disagree Strongly
Disagree
Does
Not
Apply
Grand
Total
15. My planning time is respected by my school
administrations/supervisors.
52 138 41 9 197 437
21.67% 57.50% 17.08% 3.75%
16. In my school, administrators/supervisors support
me in enforcing discipline.
94 216 62 26 43 441
23.62% 54.27% 15.58% 6.53%
17. In my school, student misbehavior interferes with
learning.
79 142 145 34 42 442
19.75% 35.50% 36.25% 8.50%
18. Too much instructional time is spent administering
assessments.
44 145 111 15 123 438
13.97% 46.03% 35.24% 4.76%
19. HCPSS professional development experiences are
meaningful and worthwhile.
26 215 123 35 40 439
6.52% 53.88% 30.83% 8.77%
20. Increased workload has contributed to a decline in
my morale.
44 121 187 53 30 435
10.86% 29.88% 46.17% 13.09%
21. I am paid fairly 13 136 158 127 1 435
3.00% 31.34% 36.41% 29.26%
22. I have confidence in the leadership exhibited by
the HCPSS Superintendent.
48 298 42 15 25 428
11.91% 73.95% 10.42% 3.72%
23. I have confidence in the leadership exhibited by
the Howard County Board of Education.
28 282 90 17 15 432
6.71% 67.63% 21.58% 4.08%
24. I have confidence in the leadership exhibited by
the Howard County Education Assn. (HCEA..
76 311 31 7 12 437
17.88% 73.18% 7.29% 1.65%
25. I feel that HCPSS offers me the possibility of
advancing professionally in the field of education.
53 272 56 12 45 438
13.49% 69.21% 14.25% 3.05%
26. In my position, I receive appropriate and adequate
support and training.
57 279 77 20 3 436
13.16% 64.43% 17.78% 4.62%
27. In the last 12 months, I have experienced harassing
behavior from colleagues.
17 45 173 179 23 437
4.11% 10.87% 41.79% 43.24%
28. In the last 12 months, I have experienced harassing
behavior from administrators/supervisors.
6 14 186 205 28 439
1.46% 3.41% 45.26% 49.88%
29. In the last 12 months, I have experienced harassing
behavior from parents.
16 49 174 170 29 438
3.91% 11.98% 42.54% 41.56%
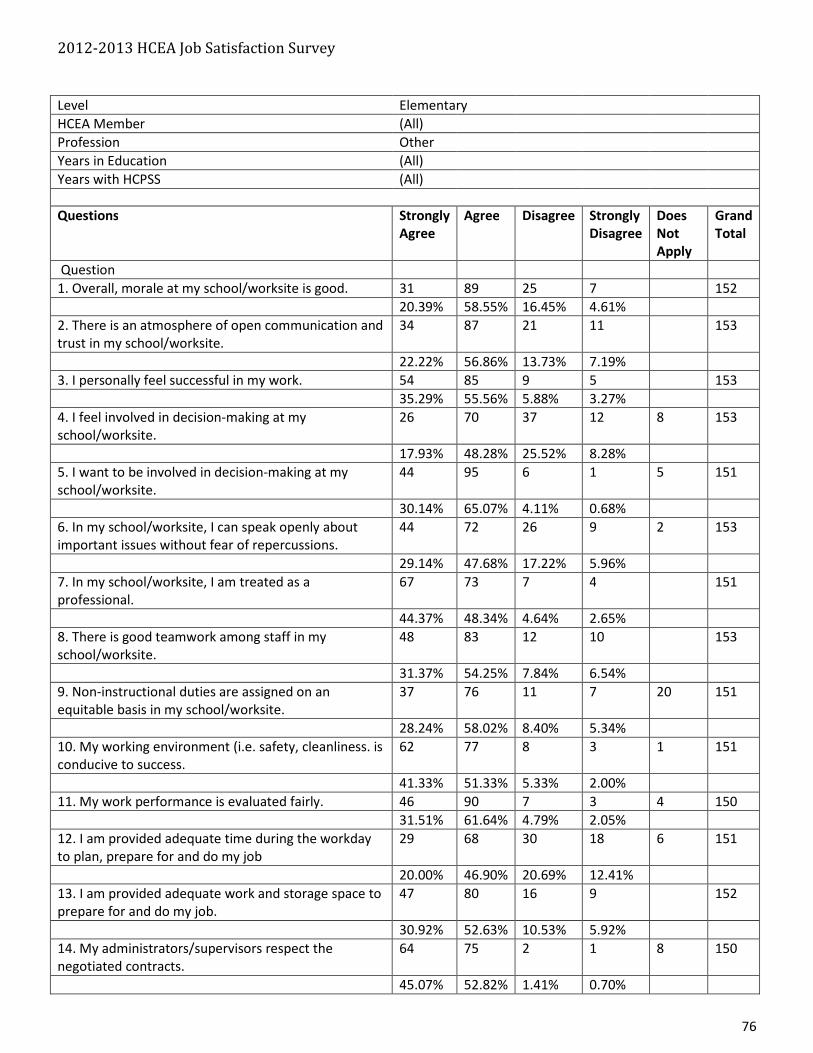
2012-2013 HCEA Job Satisfaction Survey
76
Level Elementary
HCEA Member (All)
Profession Other
Years in Education (All)
Years with HCPSS (All)
Questions Strongly
Agree
Agree Disagree Strongly
Disagree
Does
Not
Apply
Grand
Total
Question
1. Overall, morale at my school/worksite is good. 31 89 25 7 152
20.39% 58.55% 16.45% 4.61%
2. There is an atmosphere of open communication and
trust in my school/worksite.
34 87 21 11 153
22.22% 56.86% 13.73% 7.19%
3. I personally feel successful in my work. 54 85 9 5 153
35.29% 55.56% 5.88% 3.27%
4. I feel involved in decision-making at my
school/worksite.
26 70 37 12 8 153
17.93% 48.28% 25.52% 8.28%
5. I want to be involved in decision-making at my
school/worksite.
44 95 6 1 5 151
30.14% 65.07% 4.11% 0.68%
6. In my school/worksite, I can speak openly about
important issues without fear of repercussions.
44 72 26 9 2 153
29.14% 47.68% 17.22% 5.96%
7. In my school/worksite, I am treated as a
professional.
67 73 7 4 151
44.37% 48.34% 4.64% 2.65%
8. There is good teamwork among staff in my
school/worksite.
48 83 12 10 153
31.37% 54.25% 7.84% 6.54%
9. Non-instructional duties are assigned on an
equitable basis in my school/worksite.
37 76 11 7 20 151
28.24% 58.02% 8.40% 5.34%
10. My working environment (i.e. safety, cleanliness. is
conducive to success.
62 77 8 3 1 151
41.33% 51.33% 5.33% 2.00%
11. My work performance is evaluated fairly. 46 90 7 3 4 150
31.51% 61.64% 4.79% 2.05%
12. I am provided adequate time during the workday
to plan, prepare for and do my job
29 68 30 18 6 151
20.00% 46.90% 20.69% 12.41%
13. I am provided adequate work and storage space to
prepare for and do my job.
47 80 16 9 152
30.92% 52.63% 10.53% 5.92%
14. My administrators/supervisors respect the
negotiated contracts.
64 75 2 1 8 150
45.07% 52.82% 1.41% 0.70%
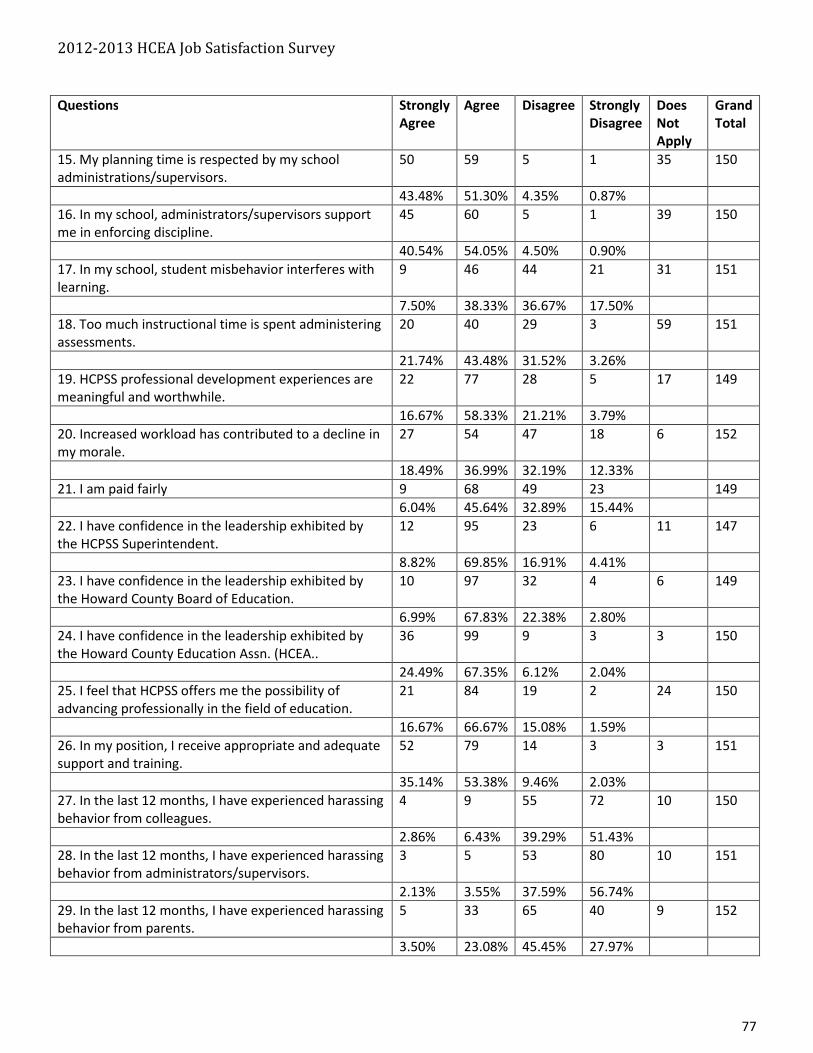
2012-2013 HCEA Job Satisfaction Survey
77
Questions Strongly
Agree
Agree Disagree Strongly
Disagree
Does
Not
Apply
Grand
Total
15. My planning time is respected by my school
administrations/supervisors.
50 59 5 1 35 150
43.48% 51.30% 4.35% 0.87%
16. In my school, administrators/supervisors support
me in enforcing discipline.
45 60 5 1 39 150
40.54% 54.05% 4.50% 0.90%
17. In my school, student misbehavior interferes with
learning.
9 46 44 21 31 151
7.50% 38.33% 36.67% 17.50%
18. Too much instructional time is spent administering
assessments.
20 40 29 3 59 151
21.74% 43.48% 31.52% 3.26%
19. HCPSS professional development experiences are
meaningful and worthwhile.
22 77 28 5 17 149
16.67% 58.33% 21.21% 3.79%
20. Increased workload has contributed to a decline in
my morale.
27 54 47 18 6 152
18.49% 36.99% 32.19% 12.33%
21. I am paid fairly 9 68 49 23 149
6.04% 45.64% 32.89% 15.44%
22. I have confidence in the leadership exhibited by
the HCPSS Superintendent.
12 95 23 6 11 147
8.82% 69.85% 16.91% 4.41%
23. I have confidence in the leadership exhibited by
the Howard County Board of Education.
10 97 32 4 6 149
6.99% 67.83% 22.38% 2.80%
24. I have confidence in the leadership exhibited by
the Howard County Education Assn. (HCEA..
36 99 9 3 3 150
24.49% 67.35% 6.12% 2.04%
25. I feel that HCPSS offers me the possibility of
advancing professionally in the field of education.
21 84 19 2 24 150
16.67% 66.67% 15.08% 1.59%
26. In my position, I receive appropriate and adequate
support and training.
52 79 14 3 3 151
35.14% 53.38% 9.46% 2.03%
27. In the last 12 months, I have experienced harassing
behavior from colleagues.
4 9 55 72 10 150
2.86% 6.43% 39.29% 51.43%
28. In the last 12 months, I have experienced harassing
behavior from administrators/supervisors.
3 5 53 80 10 151
2.13% 3.55% 37.59% 56.74%
29. In the last 12 months, I have experienced harassing
behavior from parents.
5 33 65 40 9 152
3.50% 23.08% 45.45% 27.97%
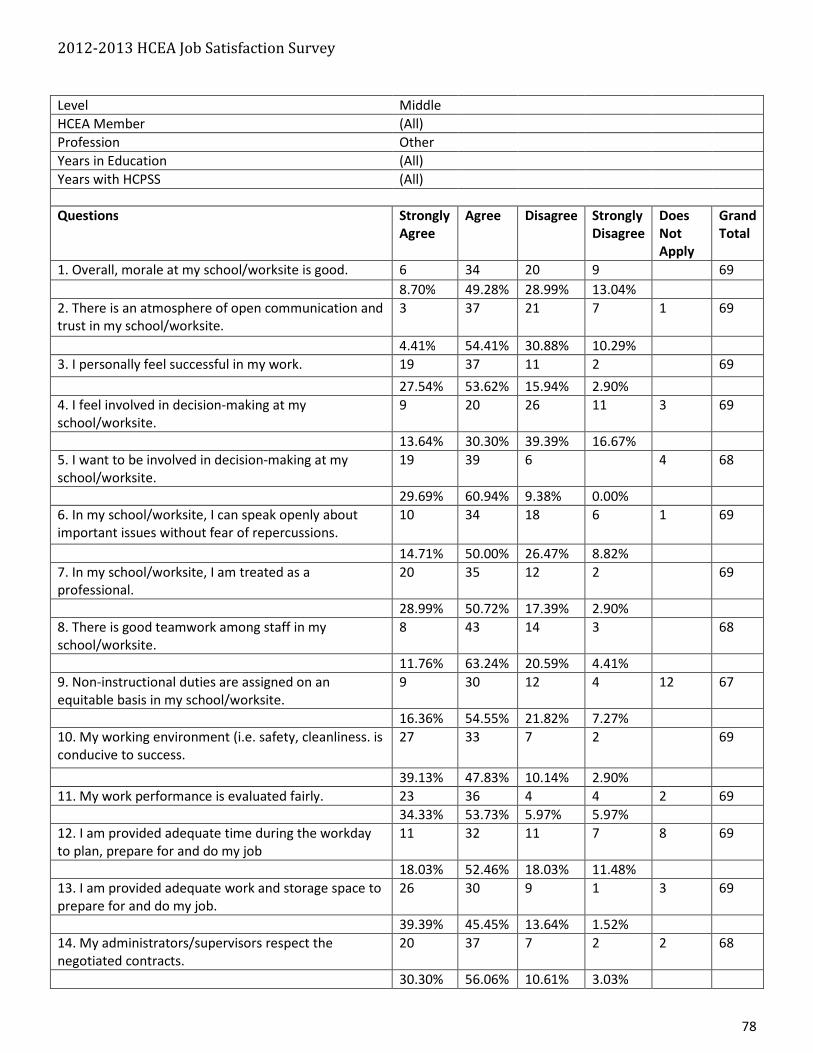
2012-2013 HCEA Job Satisfaction Survey
78
Level Middle
HCEA Member (All)
Profession Other
Years in Education (All)
Years with HCPSS (All)
Questions Strongly
Agree
Agree Disagree Strongly
Disagree
Does
Not
Apply
Grand
Total
1. Overall, morale at my school/worksite is good. 6 34 20 9 69
8.70% 49.28% 28.99% 13.04%
2. There is an atmosphere of open communication and
trust in my school/worksite.
3 37 21 7 1 69
4.41% 54.41% 30.88% 10.29%
3. I personally feel successful in my work. 19 37 11 2 69
27.54% 53.62% 15.94% 2.90%
4. I feel involved in decision-making at my
school/worksite.
9 20 26 11 3 69
13.64% 30.30% 39.39% 16.67%
5. I want to be involved in decision-making at my
school/worksite.
19 39 6 4 68
29.69% 60.94% 9.38% 0.00%
6. In my school/worksite, I can speak openly about
important issues without fear of repercussions.
10 34 18 6 1 69
14.71% 50.00% 26.47% 8.82%
7. In my school/worksite, I am treated as a
professional.
20 35 12 2 69
28.99% 50.72% 17.39% 2.90%
8. There is good teamwork among staff in my
school/worksite.
8 43 14 3 68
11.76% 63.24% 20.59% 4.41%
9. Non-instructional duties are assigned on an
equitable basis in my school/worksite.
9 30 12 4 12 67
16.36% 54.55% 21.82% 7.27%
10. My working environment (i.e. safety, cleanliness. is
conducive to success.
27 33 7 2 69
39.13% 47.83% 10.14% 2.90%
11. My work performance is evaluated fairly. 23 36 4 4 2 69
34.33% 53.73% 5.97% 5.97%
12. I am provided adequate time during the workday
to plan, prepare for and do my job
11 32 11 7 8 69
18.03% 52.46% 18.03% 11.48%
13. I am provided adequate work and storage space to
prepare for and do my job.
26 30 9 1 3 69
39.39% 45.45% 13.64% 1.52%
14. My administrators/supervisors respect the
negotiated contracts.
20 37 7 2 2 68
30.30% 56.06% 10.61% 3.03%

2012-2013 HCEA Job Satisfaction Survey
79
Questions Strongly
Agree
Agree Disagree Strongly
Disagree
Does
Not
Apply
Grand
Total
15. My planning time is respected by my school
administrations/supervisors.
11 22 3 4 29 69
27.50% 55.00% 7.50% 10.00%
16. In my school, administrators/supervisors support
me in enforcing discipline.
15 30 3 1 20 69
30.61% 61.22% 6.12% 2.04%
17. In my school, student misbehavior interferes with
learning.
4 25 19 10 8 66
6.90% 43.10% 32.76% 17.24%
18. Too much instructional time is spent administering
assessments.
16 16 11 4 21 68
34.04% 34.04% 23.40% 8.51%
19. HCPSS professional development experiences are
meaningful and worthwhile.
6 32 11 8 11 68
10.53% 56.14% 19.30% 14.04%
20. Increased workload has contributed to a decline in
my morale.
11 21 23 6 8 69
18.03% 34.43% 37.70% 9.84%
21. I am paid fairly 4 28 22 14 68
5.88% 41.18% 32.35% 20.59%
22. I have confidence in the leadership exhibited by
the HCPSS Superintendent.
6 45 7 2 5 65
10.00% 75.00% 11.67% 3.33%
23. I have confidence in the leadership exhibited by
the Howard County Board of Education.
2 43 14 2 4 65
3.28% 70.49% 22.95% 3.28%
24. I have confidence in the leadership exhibited by
the Howard County Education Assn. (HCEA)
13 44 6 2 2 67
20.00% 67.69% 9.23% 3.08%
25. I feel that HCPSS offers me the possibility of
advancing professionally in the field of education.
5 39 8 5 12 69
8.77% 68.42% 14.04% 8.77%
26. In my position, I receive appropriate and adequate
support and training.
15 38 10 5 1 69
22.06% 55.88% 14.71% 7.35%
27. In the last 12 months, I have experienced harassing
behavior from colleagues.
2 6 28 29 4 69
3.08% 9.23% 43.08% 44.62%
28. In the last 12 months, I have experienced harassing
behavior from administrators/supervisors.
1 4 33 30 1 69
1.47% 5.88% 48.53% 44.12%
29. In the last 12 months, I have experienced harassing
behavior from parents.
2 19 30 15 3 69
3.03% 28.79% 45.45% 22.73%
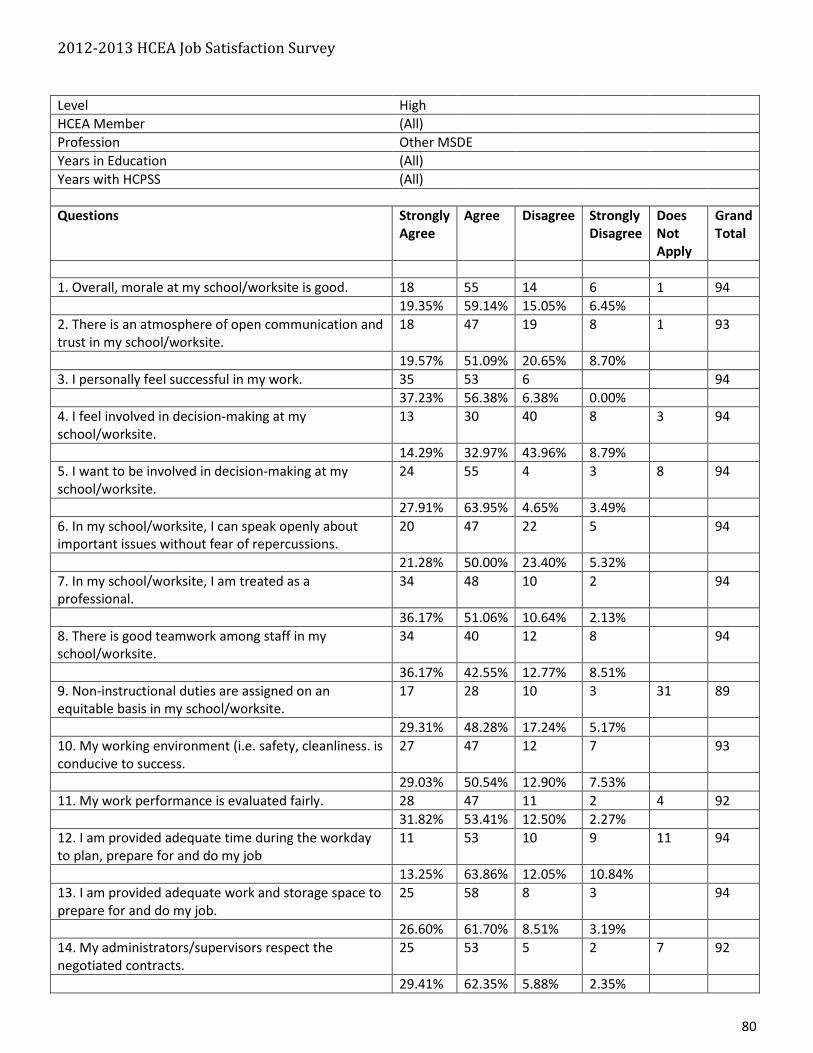
2012-2013 HCEA Job Satisfaction Survey
80
Level High
HCEA Member (All)
Profession Other MSDE
Years in Education (All)
Years with HCPSS (All)
Questions Strongly
Agree
Agree Disagree Strongly
Disagree
Does
Not
Apply
Grand
Total
1. Overall, morale at my school/worksite is good. 18 55 14 6 1 94
19.35% 59.14% 15.05% 6.45%
2. There is an atmosphere of open communication and
trust in my school/worksite.
18 47 19 8 1 93
19.57% 51.09% 20.65% 8.70%
3. I personally feel successful in my work. 35 53 6 94
37.23% 56.38% 6.38% 0.00%
4. I feel involved in decision-making at my
school/worksite.
13 30 40 8 3 94
14.29% 32.97% 43.96% 8.79%
5. I want to be involved in decision-making at my
school/worksite.
24 55 4 3 8 94
27.91% 63.95% 4.65% 3.49%
6. In my school/worksite, I can speak openly about
important issues without fear of repercussions.
20 47 22 5 94
21.28% 50.00% 23.40% 5.32%
7. In my school/worksite, I am treated as a
professional.
34 48 10 2 94
36.17% 51.06% 10.64% 2.13%
8. There is good teamwork among staff in my
school/worksite.
34 40 12 8 94
36.17% 42.55% 12.77% 8.51%
9. Non-instructional duties are assigned on an
equitable basis in my school/worksite.
17 28 10 3 31 89
29.31% 48.28% 17.24% 5.17%
10. My working environment (i.e. safety, cleanliness. is
conducive to success.
27 47 12 7 93
29.03% 50.54% 12.90% 7.53%
11. My work performance is evaluated fairly. 28 47 11 2 4 92
31.82% 53.41% 12.50% 2.27%
12. I am provided adequate time during the workday
to plan, prepare for and do my job
11 53 10 9 11 94
13.25% 63.86% 12.05% 10.84%
13. I am provided adequate work and storage space to
prepare for and do my job.
25 58 8 3 94
26.60% 61.70% 8.51% 3.19%
14. My administrators/supervisors respect the
negotiated contracts.
25 53 5 2 7 92
29.41% 62.35% 5.88% 2.35%

2012-2013 HCEA Job Satisfaction Survey
81
Questions Strongly
Agree
Agree Disagree Strongly
Disagree
Does
Not
Apply
Grand
Total
15. My planning time is respected by my school
administrations/supervisors.
15 25 4 2 48 94
32.61% 54.35% 8.70% 4.35%
16. In my school, administrators/supervisors support
me in enforcing discipline.
18 33 8 2 32 93
29.51% 54.10% 13.11% 3.28%
17. In my school, student misbehavior interferes with
learning.
9 26 25 11 22 93
12.68% 36.62% 35.21% 15.49%
18. Too much instructional time is spent administering
assessments.
17 24 8 2 40 91
33.33% 47.06% 15.69% 3.92%
19. HCPSS professional development experiences are
meaningful and worthwhile.
3 42 18 10 20 93
4.11% 57.53% 24.66% 13.70%
20. Increased workload has contributed to a decline in
my morale.
9 35 29 11 9 93
10.71% 41.67% 34.52% 13.10%
21. I am paid fairly 5 43 26 18 1 93
5.43% 46.74% 28.26% 19.57%
22. I have confidence in the leadership exhibited by
the HCPSS Superintendent.
4 54 18 3 10 89
5.06% 68.35% 22.78% 3.80%
23. I have confidence in the leadership exhibited by
the Howard County Board of Education.
4 46 27 6 5 88
4.82% 55.42% 32.53% 7.23%
24. I have confidence in the leadership exhibited by
the Howard County Education Assn. (HCEA..
15 59 8 5 3 90
17.24% 67.82% 9.20% 5.75%
25. I feel that HCPSS offers me the possibility of
advancing professionally in the field of education.
13 44 9 6 18 90
18.06% 61.11% 12.50% 8.33%
26. In my position, I receive appropriate and adequate
support and training.
27 50 12 3 2 94
29.35% 54.35% 13.04% 3.26%
27. In the last 12 months, I have experienced harassing
behavior from colleagues.
4 12 32 40 3 91
4.55% 13.64% 36.36% 45.45%
28. In the last 12 months, I have experienced harassing
behavior from administrators/supervisors.
1 12 31 44 6 94
1.14% 13.64% 35.23% 50.00%
29. In the last 12 months, I have experienced harassing
behavior from parents.
9 25 26 24 10 94
10.71% 29.76% 30.95% 28.57%
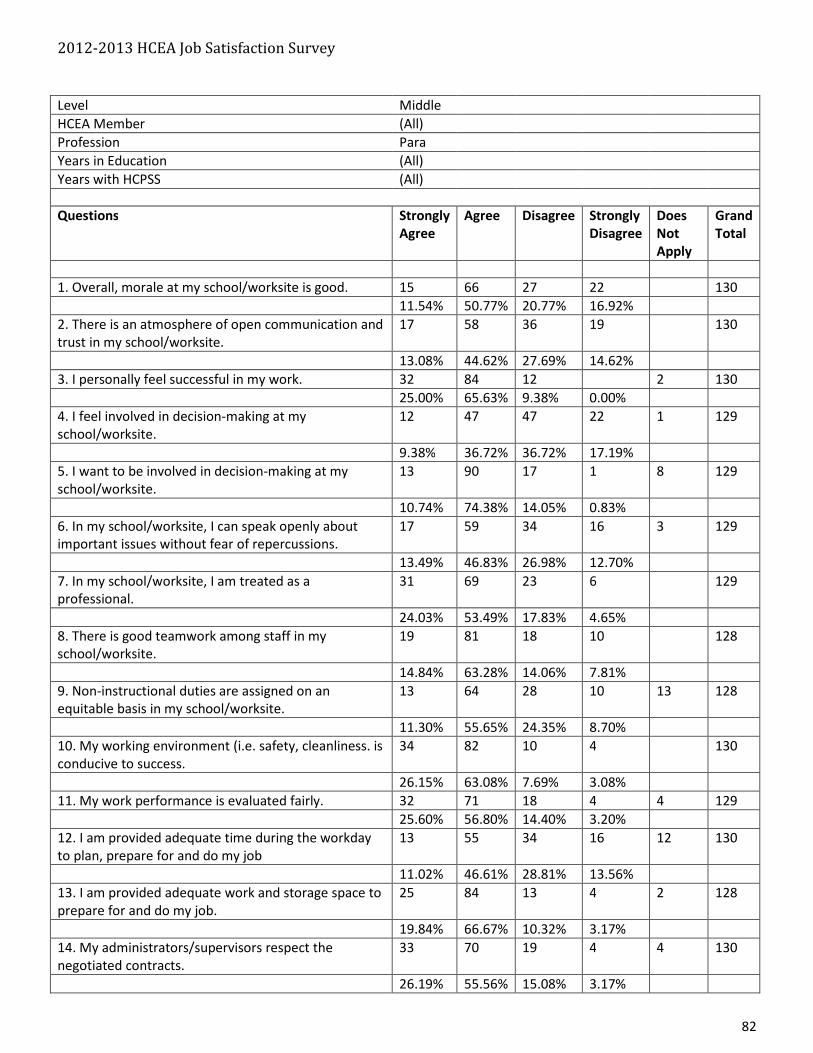
2012-2013 HCEA Job Satisfaction Survey
82
Level Middle
HCEA Member (All)
Profession Para
Years in Education (All)
Years with HCPSS (All)
Questions Strongly
Agree
Agree Disagree Strongly
Disagree
Does
Not
Apply
Grand
Total
1. Overall, morale at my school/worksite is good. 15 66 27 22 130
11.54% 50.77% 20.77% 16.92%
2. There is an atmosphere of open communication and
trust in my school/worksite.
17 58 36 19 130
13.08% 44.62% 27.69% 14.62%
3. I personally feel successful in my work. 32 84 12 2 130
25.00% 65.63% 9.38% 0.00%
4. I feel involved in decision-making at my
school/worksite.
12 47 47 22 1 129
9.38% 36.72% 36.72% 17.19%
5. I want to be involved in decision-making at my
school/worksite.
13 90 17 1 8 129
10.74% 74.38% 14.05% 0.83%
6. In my school/worksite, I can speak openly about
important issues without fear of repercussions.
17 59 34 16 3 129
13.49% 46.83% 26.98% 12.70%
7. In my school/worksite, I am treated as a
professional.
31 69 23 6 129
24.03% 53.49% 17.83% 4.65%
8. There is good teamwork among staff in my
school/worksite.
19 81 18 10 128
14.84% 63.28% 14.06% 7.81%
9. Non-instructional duties are assigned on an
equitable basis in my school/worksite.
13 64 28 10 13 128
11.30% 55.65% 24.35% 8.70%
10. My working environment (i.e. safety, cleanliness. is
conducive to success.
34 82 10 4 130
26.15% 63.08% 7.69% 3.08%
11. My work performance is evaluated fairly. 32 71 18 4 4 129
25.60% 56.80% 14.40% 3.20%
12. I am provided adequate time during the workday
to plan, prepare for and do my job
13 55 34 16 12 130
11.02% 46.61% 28.81% 13.56%
13. I am provided adequate work and storage space to
prepare for and do my job.
25 84 13 4 2 128
19.84% 66.67% 10.32% 3.17%
14. My administrators/supervisors respect the
negotiated contracts.
33 70 19 4 4 130
26.19% 55.56% 15.08% 3.17%
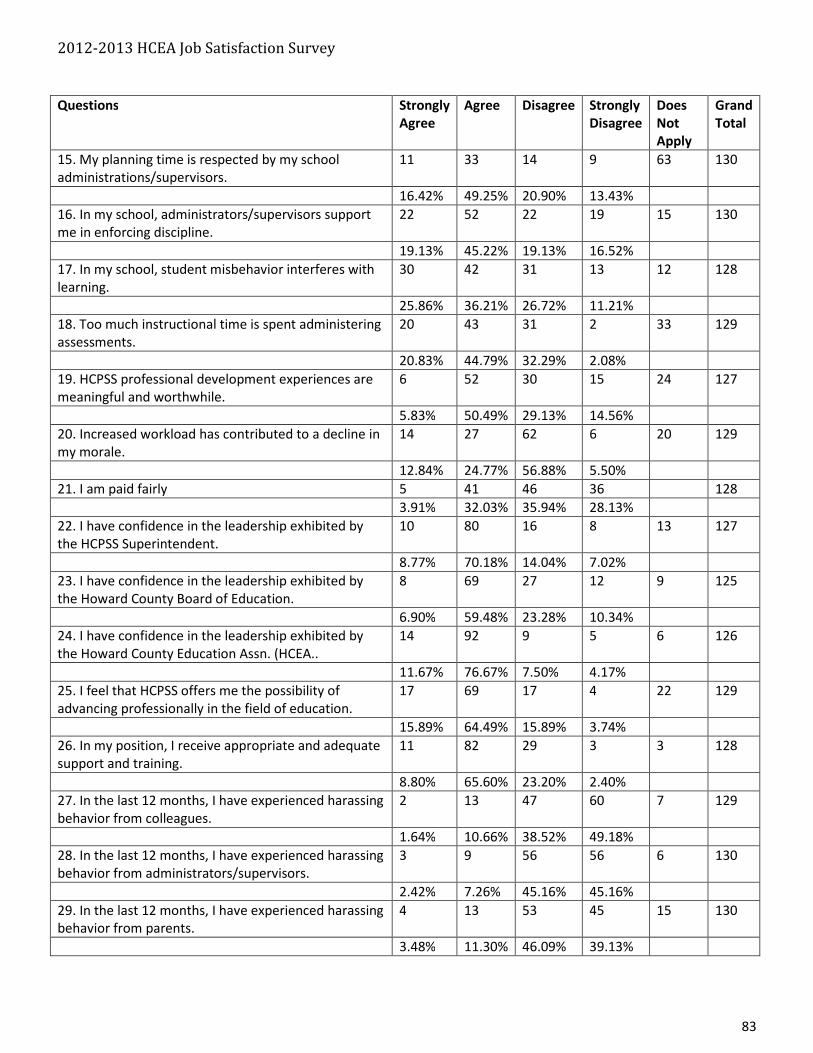
2012-2013 HCEA Job Satisfaction Survey
83
Questions Strongly
Agree
Agree Disagree Strongly
Disagree
Does
Not
Apply
Grand
Total
15. My planning time is respected by my school
administrations/supervisors.
11 33 14 9 63 130
16.42% 49.25% 20.90% 13.43%
16. In my school, administrators/supervisors support
me in enforcing discipline.
22 52 22 19 15 130
19.13% 45.22% 19.13% 16.52%
17. In my school, student misbehavior interferes with
learning.
30 42 31 13 12 128
25.86% 36.21% 26.72% 11.21%
18. Too much instructional time is spent administering
assessments.
20 43 31 2 33 129
20.83% 44.79% 32.29% 2.08%
19. HCPSS professional development experiences are
meaningful and worthwhile.
6 52 30 15 24 127
5.83% 50.49% 29.13% 14.56%
20. Increased workload has contributed to a decline in
my morale.
14 27 62 6 20 129
12.84% 24.77% 56.88% 5.50%
21. I am paid fairly 5 41 46 36 128
3.91% 32.03% 35.94% 28.13%
22. I have confidence in the leadership exhibited by
the HCPSS Superintendent.
10 80 16 8 13 127
8.77% 70.18% 14.04% 7.02%
23. I have confidence in the leadership exhibited by
the Howard County Board of Education.
8 69 27 12 9 125
6.90% 59.48% 23.28% 10.34%
24. I have confidence in the leadership exhibited by
the Howard County Education Assn. (HCEA..
14 92 9 5 6 126
11.67% 76.67% 7.50% 4.17%
25. I feel that HCPSS offers me the possibility of
advancing professionally in the field of education.
17 69 17 4 22 129
15.89% 64.49% 15.89% 3.74%
26. In my position, I receive appropriate and adequate
support and training.
11 82 29 3 3 128
8.80% 65.60% 23.20% 2.40%
27. In the last 12 months, I have experienced harassing
behavior from colleagues.
2 13 47 60 7 129
1.64% 10.66% 38.52% 49.18%
28. In the last 12 months, I have experienced harassing
behavior from administrators/supervisors.
3 9 56 56 6 130
2.42% 7.26% 45.16% 45.16%
29. In the last 12 months, I have experienced harassing
behavior from parents.
4 13 53 45 15 130
3.48% 11.30% 46.09% 39.13%
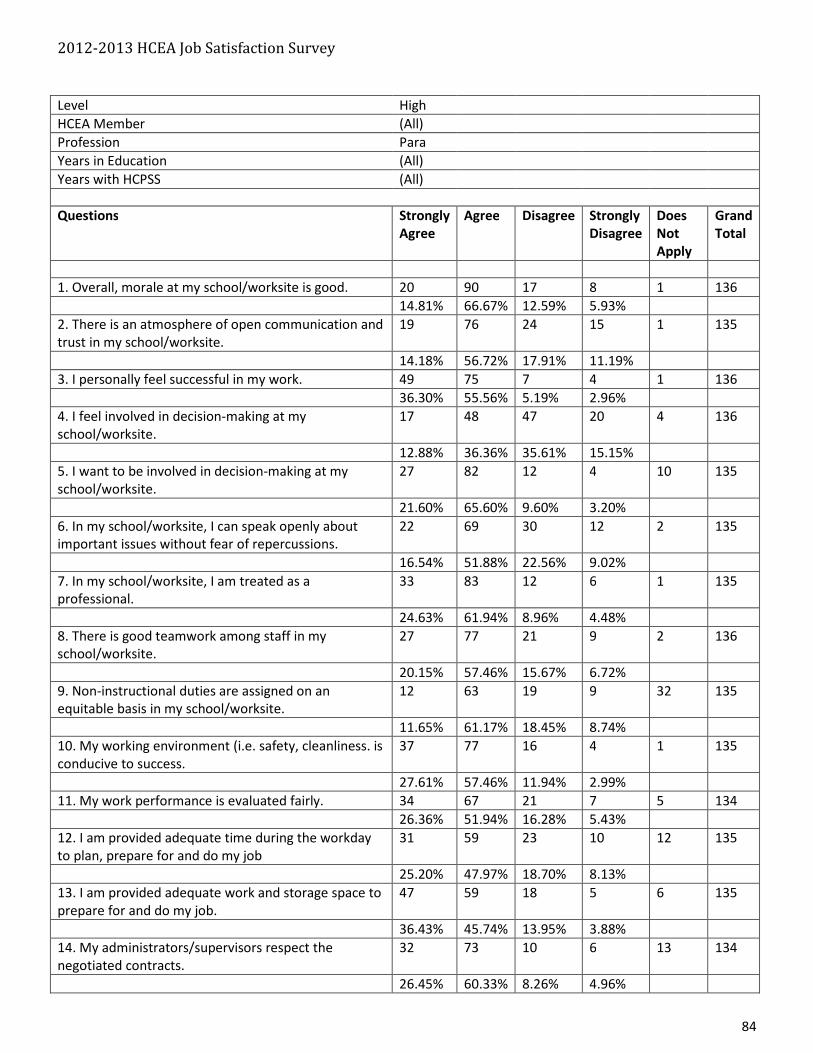
2012-2013 HCEA Job Satisfaction Survey
84
Level High
HCEA Member (All)
Profession Para
Years in Education (All)
Years with HCPSS (All)
Questions Strongly
Agree
Agree Disagree Strongly
Disagree
Does
Not
Apply
Grand
Total
1. Overall, morale at my school/worksite is good. 20 90 17 8 1 136
14.81% 66.67% 12.59% 5.93%
2. There is an atmosphere of open communication and
trust in my school/worksite.
19 76 24 15 1 135
14.18% 56.72% 17.91% 11.19%
3. I personally feel successful in my work. 49 75 7 4 1 136
36.30% 55.56% 5.19% 2.96%
4. I feel involved in decision-making at my
school/worksite.
17 48 47 20 4 136
12.88% 36.36% 35.61% 15.15%
5. I want to be involved in decision-making at my
school/worksite.
27 82 12 4 10 135
21.60% 65.60% 9.60% 3.20%
6. In my school/worksite, I can speak openly about
important issues without fear of repercussions.
22 69 30 12 2 135
16.54% 51.88% 22.56% 9.02%
7. In my school/worksite, I am treated as a
professional.
33 83 12 6 1 135
24.63% 61.94% 8.96% 4.48%
8. There is good teamwork among staff in my
school/worksite.
27 77 21 9 2 136
20.15% 57.46% 15.67% 6.72%
9. Non-instructional duties are assigned on an
equitable basis in my school/worksite.
12 63 19 9 32 135
11.65% 61.17% 18.45% 8.74%
10. My working environment (i.e. safety, cleanliness. is
conducive to success.
37 77 16 4 1 135
27.61% 57.46% 11.94% 2.99%
11. My work performance is evaluated fairly. 34 67 21 7 5 134
26.36% 51.94% 16.28% 5.43%
12. I am provided adequate time during the workday
to plan, prepare for and do my job
31 59 23 10 12 135
25.20% 47.97% 18.70% 8.13%
13. I am provided adequate work and storage space to
prepare for and do my job.
47 59 18 5 6 135
36.43% 45.74% 13.95% 3.88%
14. My administrators/supervisors respect the
negotiated contracts.
32 73 10 6 13 134
26.45% 60.33% 8.26% 4.96%

2012-2013 HCEA Job Satisfaction Survey
85
Questions Strongly
Agree
Agree Disagree Strongly
Disagree
Does
Not
Apply
Grand
Total
15. My planning time is respected by my school
administrations/supervisors.
11 23 8 2 89 133
25.00% 52.27% 18.18% 4.55%
16. In my school, administrators/supervisors support
me in enforcing discipline.
19 58 11 8 38 134
19.79% 60.42% 11.46% 8.33%
17. In my school, student misbehavior interferes with
learning.
14 48 29 12 31 134
13.59% 46.60% 28.16% 11.65%
18. Too much instructional time is spent administering
assessments.
11 24 28 8 62 133
15.49% 33.80% 39.44% 11.27%
19. HCPSS professional development experiences are
meaningful and worthwhile.
7 45 39 15 28 134
6.60% 42.45% 36.79% 14.15%
20. Increased workload has contributed to a decline in
my morale.
4 26 59 27 19 135
3.45% 22.41% 50.86% 23.28%
21. I am paid fairly 5 42 44 42 1 134
3.76% 31.58% 33.08% 31.58%
22. I have confidence in the leadership exhibited by
the HCPSS Superintendent.
18 83 17 3 11 132
14.88% 68.60% 14.05% 2.48%
23. I have confidence in the leadership exhibited by
the Howard County Board of Education.
13 82 23 7 9 134
10.40% 65.60% 18.40% 5.60%
24. I have confidence in the leadership exhibited by
the Howard County Education Assn. (HCEA..
23 86 9 3 13 134
19.01% 71.07% 7.44% 2.48%
25. I feel that HCPSS offers me the possibility of
advancing professionally in the field of education.
21 59 16 12 27 135
19.44% 54.63% 14.81% 11.11%
26. In my position, I receive appropriate and adequate
support and training.
22 77 25 9 2 135
16.54% 57.89% 18.80% 6.77%
27. In the last 12 months, I have experienced harassing
behavior from colleagues.
2 9 47 64 11 133
1.64% 7.38% 38.52% 52.46%
28. In the last 12 months, I have experienced harassing
behavior from administrators/supervisors.
5 52 66 9 132
0.00% 4.07% 42.28% 53.66%
29. In the last 12 months, I have experienced harassing
behavior from parents.
3 15 47 48 22 135
2.65% 13.27% 41.59% 42.48%

2012-2013 HCEA Job Satisfaction Survey
86
Level High
HCEA Member (All)
Profession Other MSDE
Years in Education (All)
Years with HCPSS (All)
Questions Strongly
Agree
Agree Disagree Strongly
Disagree
Does
Not
Apply
Grand
Total
1. Overall, morale at my school/worksite is good. 18 55 14 6 1 94
19.35% 59.14% 15.05% 6.45%
2. There is an atmosphere of open communication and
trust in my school/worksite.
18 47 19 8 1 93
19.57% 51.09% 20.65% 8.70%
3. I personally feel successful in my work. 35 53 6 94
37.23% 56.38% 6.38% 0.00%
4. I feel involved in decision-making at my
school/worksite.
13 30 40 8 3 94
14.29% 32.97% 43.96% 8.79%
5. I want to be involved in decision-making at my
school/worksite.
24 55 4 3 8 94
27.91% 63.95% 4.65% 3.49%
6. In my school/worksite, I can speak openly about
important issues without fear of repercussions.
20 47 22 5 94
21.28% 50.00% 23.40% 5.32%
7. In my school/worksite, I am treated as a
professional.
34 48 10 2 94
36.17% 51.06% 10.64% 2.13%
8. There is good teamwork among staff in my
school/worksite.
34 40 12 8 94
36.17% 42.55% 12.77% 8.51%
9. Non-instructional duties are assigned on an
equitable basis in my school/worksite.
17 28 10 3 31 89
29.31% 48.28% 17.24% 5.17%
10. My working environment (i.e. safety, cleanliness. is
conducive to success.
27 47 12 7 93
29.03% 50.54% 12.90% 7.53%
11. My work performance is evaluated fairly. 28 47 11 2 4 92
31.82% 53.41% 12.50% 2.27%
12. I am provided adequate time during the workday
to plan, prepare for and do my job
11 53 10 9 11 94
13.25% 63.86% 12.05% 10.84%
13. I am provided adequate work and storage space to
prepare for and do my job.
25 58 8 3 94
26.60% 61.70% 8.51% 3.19%
14. My administrators/supervisors respect the
negotiated contracts.
25 53 5 2 7 92
29.41% 62.35% 5.88% 2.35%
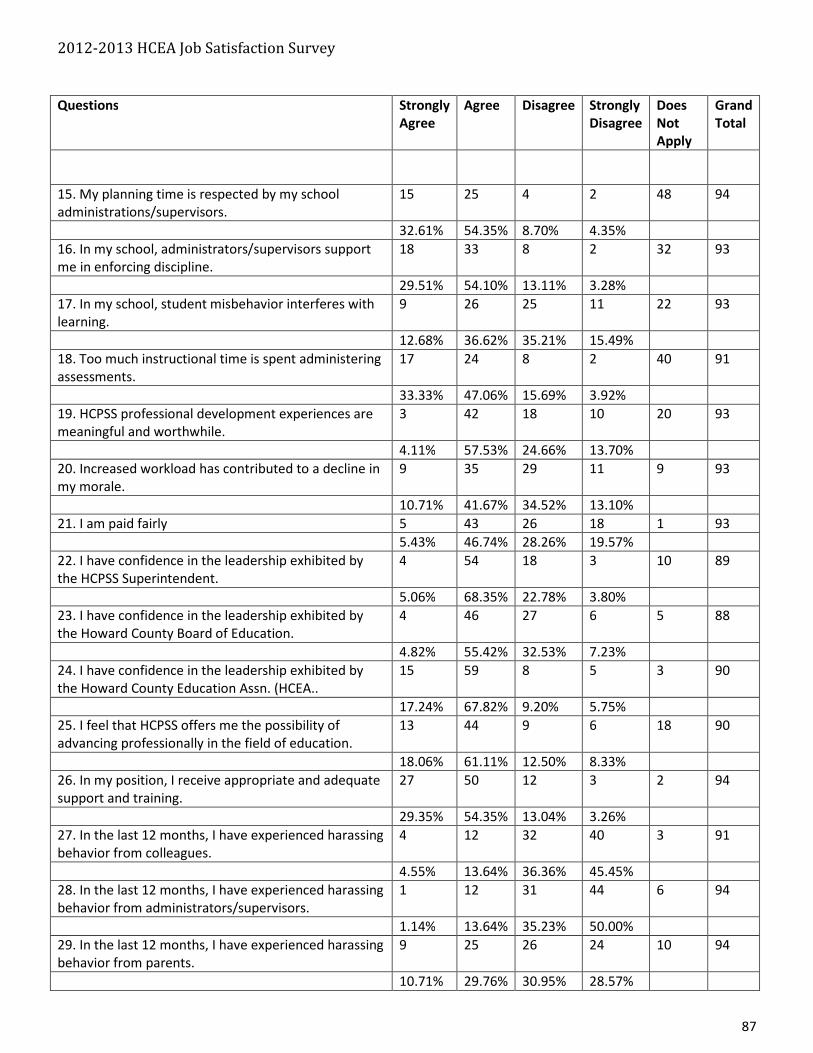
2012-2013 HCEA Job Satisfaction Survey
87
Questions Strongly
Agree
Agree Disagree Strongly
Disagree
Does
Not
Apply
Grand
Total
15. My planning time is respected by my school
administrations/supervisors.
15 25 4 2 48 94
32.61% 54.35% 8.70% 4.35%
16. In my school, administrators/supervisors support
me in enforcing discipline.
18 33 8 2 32 93
29.51% 54.10% 13.11% 3.28%
17. In my school, student misbehavior interferes with
learning.
9 26 25 11 22 93
12.68% 36.62% 35.21% 15.49%
18. Too much instructional time is spent administering
assessments.
17 24 8 2 40 91
33.33% 47.06% 15.69% 3.92%
19. HCPSS professional development experiences are
meaningful and worthwhile.
3 42 18 10 20 93
4.11% 57.53% 24.66% 13.70%
20. Increased workload has contributed to a decline in
my morale.
9 35 29 11 9 93
10.71% 41.67% 34.52% 13.10%
21. I am paid fairly 5 43 26 18 1 93
5.43% 46.74% 28.26% 19.57%
22. I have confidence in the leadership exhibited by
the HCPSS Superintendent.
4 54 18 3 10 89
5.06% 68.35% 22.78% 3.80%
23. I have confidence in the leadership exhibited by
the Howard County Board of Education.
4 46 27 6 5 88
4.82% 55.42% 32.53% 7.23%
24. I have confidence in the leadership exhibited by
the Howard County Education Assn. (HCEA..
15 59 8 5 3 90
17.24% 67.82% 9.20% 5.75%
25. I feel that HCPSS offers me the possibility of
advancing professionally in the field of education.
13 44 9 6 18 90
18.06% 61.11% 12.50% 8.33%
26. In my position, I receive appropriate and adequate
support and training.
27 50 12 3 2 94
29.35% 54.35% 13.04% 3.26%
27. In the last 12 months, I have experienced harassing
behavior from colleagues.
4 12 32 40 3 91
4.55% 13.64% 36.36% 45.45%
28. In the last 12 months, I have experienced harassing
behavior from administrators/supervisors.
1 12 31 44 6 94
1.14% 13.64% 35.23% 50.00%
29. In the last 12 months, I have experienced harassing
behavior from parents.
9 25 26 24 10 94
10.71% 29.76% 30.95% 28.57%

2012-2013 HCEA Job Satisfaction Survey
88
Level (All)
HCEA Member Yes
Profession (All)
Years in Education (All)
Years with HCPSS (All)
Questions Strongly
Agree
Agree Disagree Strongly
Disagree
Does
Not
Apply
Grand
Total
1. Overall, morale at my school/worksite is good. 429 1618 649 388 3 3087
13.91% 52.46% 21.04% 12.58%
2. There is an atmosphere of open communication and
trust in my school/worksite.
424 1551 752 344 7 3078
13.81% 50.50% 24.49% 11.20%
3. I personally feel successful in my work. 930 1764 295 94 3 3086
30.17% 57.22% 9.57% 3.05%
4. I feel involved in decision-making at my
school/worksite.
399 1310 916 376 80 3081
13.30% 43.65% 30.52% 12.53%
5. I want to be involved in decision-making at my
school/worksite.
800 1895 232 52 88 3067
26.85% 63.61% 7.79% 1.75%
6. In my school/worksite, I can speak openly about
important issues without fear of repercussions.
579 1393 701 374 27 3074
19.00% 45.72% 23.01% 12.27%
7. In my school/worksite, I am treated as a
professional.
962 1602 346 157 4 3071
31.37% 52.23% 11.28% 5.12%
8. There is good teamwork among staff in my
school/worksite.
760 1636 497 173 9 3075
24.79% 53.36% 16.21% 5.64%
9. Non-instructional duties are assigned on an
equitable basis in my school/worksite.
573 1620 442 188 235 3058
20.30% 57.39% 15.66% 6.66%
10. My working environment (i.e. safety, cleanliness. is
conducive to success.
952 1607 353 163 6 3081
30.96% 52.26% 11.48% 5.30%
11. My work performance is evaluated fairly. 813 1821 276 103 53 3066
26.98% 60.44% 9.16% 3.42%
12. I am provided adequate time during the workday
to plan, prepare for and do my job
383 1178 792 653 72 3078
12.74% 39.19% 26.35% 21.72%
13. I am provided adequate work and storage space to
prepare for and do my job.
805 1673 418 160 22 3078
26.34% 54.74% 13.68% 5.24%
14. My administrators/supervisors respect the
negotiated contracts.
987 1727 230 86 42 3072
32.57% 57.00% 7.59% 2.84%
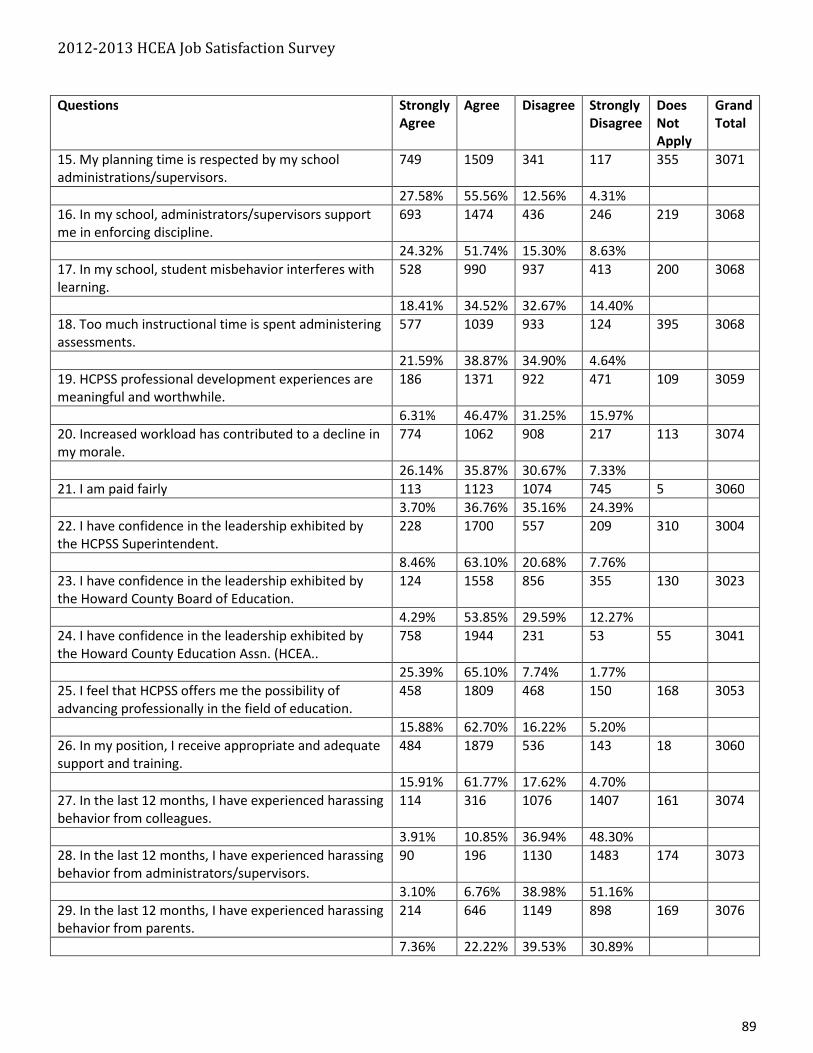
2012-2013 HCEA Job Satisfaction Survey
89
Questions Strongly
Agree
Agree Disagree Strongly
Disagree
Does
Not
Apply
Grand
Total
15. My planning time is respected by my school
administrations/supervisors.
749 1509 341 117 355 3071
27.58% 55.56% 12.56% 4.31%
16. In my school, administrators/supervisors support
me in enforcing discipline.
693 1474 436 246 219 3068
24.32% 51.74% 15.30% 8.63%
17. In my school, student misbehavior interferes with
learning.
528 990 937 413 200 3068
18.41% 34.52% 32.67% 14.40%
18. Too much instructional time is spent administering
assessments.
577 1039 933 124 395 3068
21.59% 38.87% 34.90% 4.64%
19. HCPSS professional development experiences are
meaningful and worthwhile.
186 1371 922 471 109 3059
6.31% 46.47% 31.25% 15.97%
20. Increased workload has contributed to a decline in
my morale.
774 1062 908 217 113 3074
26.14% 35.87% 30.67% 7.33%
21. I am paid fairly 113 1123 1074 745 5 3060
3.70% 36.76% 35.16% 24.39%
22. I have confidence in the leadership exhibited by
the HCPSS Superintendent.
228 1700 557 209 310 3004
8.46% 63.10% 20.68% 7.76%
23. I have confidence in the leadership exhibited by
the Howard County Board of Education.
124 1558 856 355 130 3023
4.29% 53.85% 29.59% 12.27%
24. I have confidence in the leadership exhibited by
the Howard County Education Assn. (HCEA..
758 1944 231 53 55 3041
25.39% 65.10% 7.74% 1.77%
25. I feel that HCPSS offers me the possibility of
advancing professionally in the field of education.
458 1809 468 150 168 3053
15.88% 62.70% 16.22% 5.20%
26. In my position, I receive appropriate and adequate
support and training.
484 1879 536 143 18 3060
15.91% 61.77% 17.62% 4.70%
27. In the last 12 months, I have experienced harassing
behavior from colleagues.
114 316 1076 1407 161 3074
3.91% 10.85% 36.94% 48.30%
28. In the last 12 months, I have experienced harassing
behavior from administrators/supervisors.
90 196 1130 1483 174 3073
3.10% 6.76% 38.98% 51.16%
29. In the last 12 months, I have experienced harassing
behavior from parents.
214 646 1149 898 169 3076
7.36% 22.22% 39.53% 30.89%
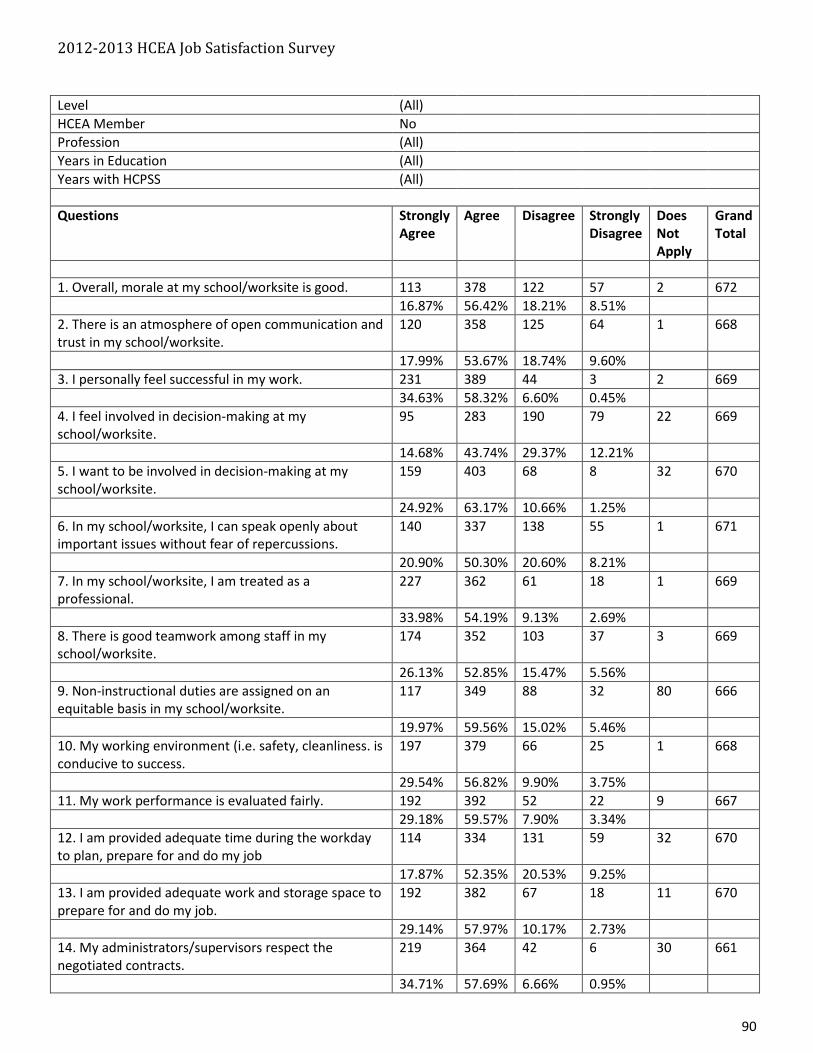
2012-2013 HCEA Job Satisfaction Survey
90
Level (All)
HCEA Member No
Profession (All)
Years in Education (All)
Years with HCPSS (All)
Questions Strongly
Agree
Agree Disagree Strongly
Disagree
Does
Not
Apply
Grand
Total
1. Overall, morale at my school/worksite is good. 113 378 122 57 2 672
16.87% 56.42% 18.21% 8.51%
2. There is an atmosphere of open communication and
trust in my school/worksite.
120 358 125 64 1 668
17.99% 53.67% 18.74% 9.60%
3. I personally feel successful in my work. 231 389 44 3 2 669
34.63% 58.32% 6.60% 0.45%
4. I feel involved in decision-making at my
school/worksite.
95 283 190 79 22 669
14.68% 43.74% 29.37% 12.21%
5. I want to be involved in decision-making at my
school/worksite.
159 403 68 8 32 670
24.92% 63.17% 10.66% 1.25%
6. In my school/worksite, I can speak openly about
important issues without fear of repercussions.
140 337 138 55 1 671
20.90% 50.30% 20.60% 8.21%
7. In my school/worksite, I am treated as a
professional.
227 362 61 18 1 669
33.98% 54.19% 9.13% 2.69%
8. There is good teamwork among staff in my
school/worksite.
174 352 103 37 3 669
26.13% 52.85% 15.47% 5.56%
9. Non-instructional duties are assigned on an
equitable basis in my school/worksite.
117 349 88 32 80 666
19.97% 59.56% 15.02% 5.46%
10. My working environment (i.e. safety, cleanliness. is
conducive to success.
197 379 66 25 1 668
29.54% 56.82% 9.90% 3.75%
11. My work performance is evaluated fairly. 192 392 52 22 9 667
29.18% 59.57% 7.90% 3.34%
12. I am provided adequate time during the workday
to plan, prepare for and do my job
114 334 131 59 32 670
17.87% 52.35% 20.53% 9.25%
13. I am provided adequate work and storage space to
prepare for and do my job.
192 382 67 18 11 670
29.14% 57.97% 10.17% 2.73%
14. My administrators/supervisors respect the
negotiated contracts.
219 364 42 6 30 661
34.71% 57.69% 6.66% 0.95%

2012-2013 HCEA Job Satisfaction Survey
91
Questions Strongly
Agree
Agree Disagree Strongly
Disagree
Does
Not
Apply
Grand
Total
15. My planning time is respected by my school
administrations/supervisors.
142 227 64 12 222 667
31.91% 51.01% 14.38% 2.70%
16. In my school, administrators/supervisors support
me in enforcing discipline.
139 290 65 34 141 669
26.33% 54.92% 12.31% 6.44%
17. In my school, student misbehavior interferes with
learning.
67 170 216 85 127 665
12.45% 31.60% 40.15% 15.80%
18. Too much instructional time is spent administering
assessments.
76 161 181 26 220 664
17.12% 36.26% 40.77% 5.86%
19. HCPSS professional development experiences are
meaningful and worthwhile.
38 270 174 85 99 666
6.70% 47.62% 30.69% 14.99%
20. Increased workload has contributed to a decline in
my morale.
82 203 252 76 55 668
13.38% 33.12% 41.11% 12.40%
21. I am paid fairly 28 279 230 128 665
4.21% 41.95% 34.59% 19.25%
22. I have confidence in the leadership exhibited by
the HCPSS Superintendent.
63 436 85 20 53 657
10.43% 72.19% 14.07% 3.31%
23. I have confidence in the leadership exhibited by
the Howard County Board of Education.
39 406 134 49 30 658
6.21% 64.65% 21.34% 7.80%
24. I have confidence in the leadership exhibited by
the Howard County Education Assn. (HCEA..
55 430 73 34 66 658
9.29% 72.64% 12.33% 5.74%
25. I feel that HCPSS offers me the possibility of
advancing professionally in the field of education.
87 370 87 33 88 665
15.08% 64.12% 15.08% 5.72%
26. In my position, I receive appropriate and adequate
support and training.
106 437 101 15 7 666
16.08% 66.31% 15.33% 2.28%
27. In the last 12 months, I have experienced harassing
behavior from colleagues.
20 56 242 306 39 663
3.21% 8.97% 38.78% 49.04%
28. In the last 12 months, I have experienced harassing
behavior from administrators/supervisors.
10 25 255 340 38 668
1.59% 3.97% 40.48% 53.97%
29. In the last 12 months, I have experienced harassing
behavior from parents.
34 93 258 214 71 670
5.68% 15.53% 43.07% 35.73%
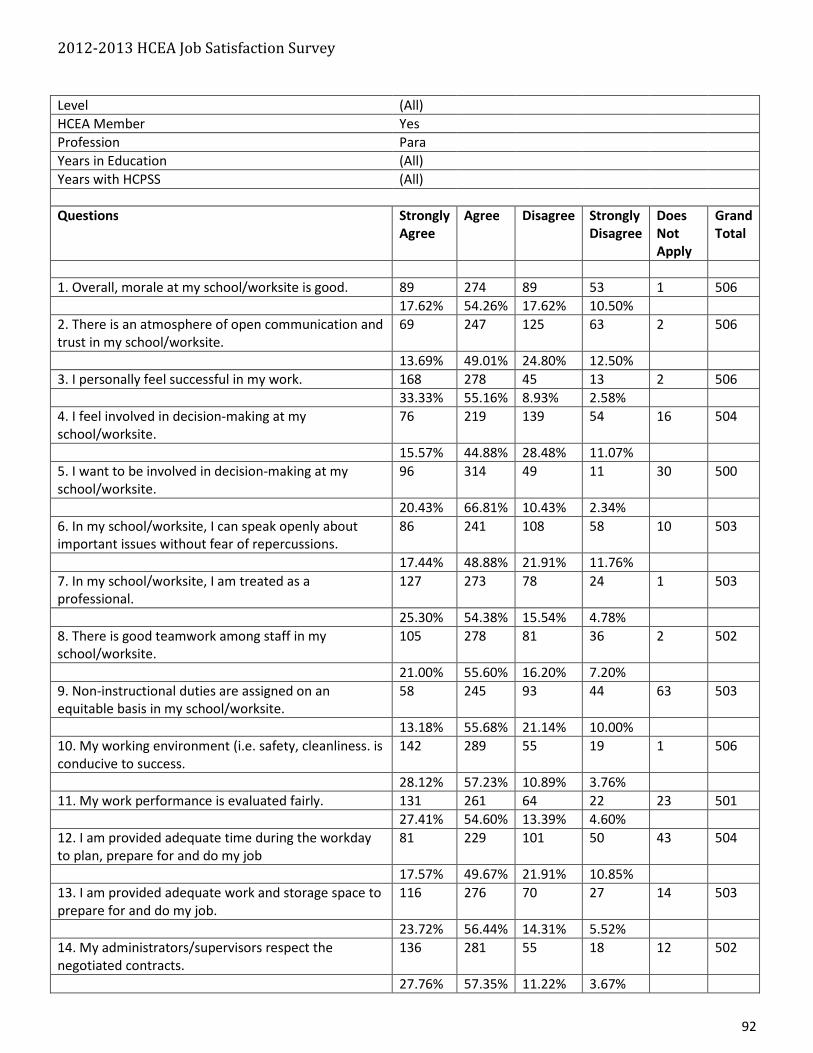
2012-2013 HCEA Job Satisfaction Survey
92
Level (All)
HCEA Member Yes
Profession Para
Years in Education (All)
Years with HCPSS (All)
Questions Strongly
Agree
Agree Disagree Strongly
Disagree
Does
Not
Apply
Grand
Total
1. Overall, morale at my school/worksite is good. 89 274 89 53 1 506
17.62% 54.26% 17.62% 10.50%
2. There is an atmosphere of open communication and
trust in my school/worksite.
69 247 125 63 2 506
13.69% 49.01% 24.80% 12.50%
3. I personally feel successful in my work. 168 278 45 13 2 506
33.33% 55.16% 8.93% 2.58%
4. I feel involved in decision-making at my
school/worksite.
76 219 139 54 16 504
15.57% 44.88% 28.48% 11.07%
5. I want to be involved in decision-making at my
school/worksite.
96 314 49 11 30 500
20.43% 66.81% 10.43% 2.34%
6. In my school/worksite, I can speak openly about
important issues without fear of repercussions.
86 241 108 58 10 503
17.44% 48.88% 21.91% 11.76%
7. In my school/worksite, I am treated as a
professional.
127 273 78 24 1 503
25.30% 54.38% 15.54% 4.78%
8. There is good teamwork among staff in my
school/worksite.
105 278 81 36 2 502
21.00% 55.60% 16.20% 7.20%
9. Non-instructional duties are assigned on an
equitable basis in my school/worksite.
58 245 93 44 63 503
13.18% 55.68% 21.14% 10.00%
10. My working environment (i.e. safety, cleanliness. is
conducive to success.
142 289 55 19 1 506
28.12% 57.23% 10.89% 3.76%
11. My work performance is evaluated fairly. 131 261 64 22 23 501
27.41% 54.60% 13.39% 4.60%
12. I am provided adequate time during the workday
to plan, prepare for and do my job
81 229 101 50 43 504
17.57% 49.67% 21.91% 10.85%
13. I am provided adequate work and storage space to
prepare for and do my job.
116 276 70 27 14 503
23.72% 56.44% 14.31% 5.52%
14. My administrators/supervisors respect the
negotiated contracts.
136 281 55 18 12 502
27.76% 57.35% 11.22% 3.67%

2012-2013 HCEA Job Satisfaction Survey
93
Questions Strongly
Agree
Agree Disagree Strongly
Disagree
Does
Not
Apply
Grand
Total
15. My planning time is respected by my school
administrations/supervisors.
60 137 48 18 237 500
22.81% 52.09% 18.25% 6.84%
16. In my school, administrators/supervisors support
me in enforcing discipline.
106 221 69 43 65 504
24.15% 50.34% 15.72% 9.79%
17. In my school, student misbehavior interferes with
learning.
102 167 126 43 64 502
23.29% 38.13% 28.77% 9.82%
18. Too much instructional time is spent administering
assessments.
54 157 125 20 144 500
15.17% 44.10% 35.11% 5.62%
19. HCPSS professional development experiences are
meaningful and worthwhile.
34 229 145 55 37 500
7.34% 49.46% 31.32% 11.88%
20. Increased workload has contributed to a decline in
my morale.
52 119 219 64 45 499
11.45% 26.21% 48.24% 14.10%
21. I am paid fairly 21 149 171 154 2 497
4.24% 30.10% 34.55% 31.11%
22. I have confidence in the leadership exhibited by
the HCPSS Superintendent.
64 308 58 20 41 491
14.22% 68.44% 12.89% 4.44%
23. I have confidence in the leadership exhibited by
the Howard County Board of Education.
41 297 106 25 25 494
8.74% 63.33% 22.60% 5.33%
24. I have confidence in the leadership exhibited by
the Howard County Education Assn. (HCEA..
109 342 31 6 10 498
22.34% 70.08% 6.35% 1.23%
25. I feel that HCPSS offers me the possibility of
advancing professionally in the field of education.
77 275 64 21 64 501
17.62% 62.93% 14.65% 4.81%
26. In my position, I receive appropriate and adequate
support and training.
70 292 96 32 6 496
14.29% 59.59% 19.59% 6.53%
27. In the last 12 months, I have experienced harassing
behavior from colleagues.
19 52 175 221 33 500
4.07% 11.13% 37.47% 47.32%
28. In the last 12 months, I have experienced harassing
behavior from administrators/supervisors.
7 25 195 234 39 500
1.52% 5.42% 42.30% 50.76%
29. In the last 12 months, I have experienced harassing
behavior from parents.
14 47 187 190 63 501
3.20% 10.73% 42.69% 43.38%

2012-2013 HCEA Job Satisfaction Survey
94
Level (All)
HCEA Member No
Profession Para
Years in Education (All)
Years with HCPSS (All)
Questions Strongly
Agree
Agree Disagree Strongly
Disagree
Does
Not
Apply
Grand
Total
1. Overall, morale at my school/worksite is good. 34 155 55 19 1 264
12.93% 58.94% 20.91% 7.22%
2. There is an atmosphere of open communication and
trust in my school/worksite.
35 151 54 23 263
13.31% 57.41% 20.53% 8.75%
3. I personally feel successful in my work. 84 165 12 2 263
32.18% 63.22% 4.60% 0.00%
4. I feel involved in decision-making at my
school/worksite.
33 107 84 31 8 263
12.94% 41.96% 32.94% 12.16%
5. I want to be involved in decision-making at my
school/worksite.
37 173 30 1 22 263
15.35% 71.78% 12.45% 0.41%
6. In my school/worksite, I can speak openly about
important issues without fear of repercussions.
34 148 62 18 1 263
12.98% 56.49% 23.66% 6.87%
7. In my school/worksite, I am treated as a
professional.
64 162 30 6 1 263
24.43% 61.83% 11.45% 2.29%
8. There is good teamwork among staff in my
school/worksite.
46 149 50 15 2 262
17.69% 57.31% 19.23% 5.77%
9. Non-instructional duties are assigned on an
equitable basis in my school/worksite.
24 143 43 13 39 262
10.76% 64.13% 19.28% 5.83%
10. My working environment (i.e. safety, cleanliness. is
conducive to success.
60 162 32 9 263
22.81% 61.60% 12.17% 3.42%
11. My work performance is evaluated fairly. 62 163 25 4 7 261
24.41% 64.17% 9.84% 1.57%
12. I am provided adequate time during the workday
to plan, prepare for and do my job
40 154 39 7 24 264
16.67% 64.17% 16.25% 2.92%
13. I am provided adequate work and storage space to
prepare for and do my job.
63 167 19 5 10 264
24.80% 65.75% 7.48% 1.97%
14. My administrators/supervisors respect the
negotiated contracts.
56 164 17 1 21 259
23.53% 68.91% 7.14% 0.42%

2012-2013 HCEA Job Satisfaction Survey
95
Questions Strongly
Agree
Agree Disagree Strongly
Disagree
Does
Not
Apply
Grand
Total
15. My planning time is respected by my school
administrations/supervisors.
22 66 16 2 156 262
20.75% 62.26% 15.09% 1.89%
16. In my school, administrators/supervisors support
me in enforcing discipline.
34 120 28 11 70 263
17.62% 62.18% 14.51% 5.70%
17. In my school, student misbehavior interferes with
learning.
31 71 82 17 62 263
15.42% 35.32% 40.80% 8.46%
18. Too much instructional time is spent administering
assessments.
23 65 49 9 115 261
15.75% 44.52% 33.56% 6.16%
19. HCPSS professional development experiences are
meaningful and worthwhile.
9 105 67 15 66 262
4.59% 53.57% 34.18% 7.65%
20. Increased workload has contributed to a decline in
my morale.
13 66 117 32 33 261
5.70% 28.95% 51.32% 14.04%
21. I am paid fairly 7 104 89 61 261
2.68% 39.85% 34.10% 23.37%
22. I have confidence in the leadership exhibited by
the HCPSS Superintendent.
20 196 21 6 14 257
8.23% 80.66% 8.64% 2.47%
23. I have confidence in the leadership exhibited by
the Howard County Board of Education.
13 180 41 12 11 257
5.28% 73.17% 16.67% 4.88%
24. I have confidence in the leadership exhibited by
the Howard County Education Assn. (HCEA..
18 188 21 10 23 260
7.59% 79.32% 8.86% 4.22%
25. I feel that HCPSS offers me the possibility of
advancing professionally in the field of education.
23 153 32 10 45 263
10.55% 70.18% 14.68% 4.59%
26. In my position, I receive appropriate and adequate
support and training.
31 187 40 3 2 263
11.88% 71.65% 15.33% 1.15%
27. In the last 12 months, I have experienced harassing
behavior from colleagues.
5 21 106 115 13 260
2.02% 8.50% 42.91% 46.56%
28. In the last 12 months, I have experienced harassing
behavior from administrators/supervisors.
4 9 117 122 11 263
1.59% 3.57% 46.43% 48.41%
29. In the last 12 months, I have experienced harassing
behavior from parents.
9 31 101 90 33 264
3.90% 13.42% 43.72% 38.96%