Embed Size (px)
Citation preview
ARKANSAS’ COMMUNITY MENTAL HEALTH CENTERSSATISFACTION SURVEY, ADULT AND CHILD
2017 Customer Satisfaction
Survey Results

EXECUTIVE SUMMARY ......................................................................1
SURVEY OVERVIEW AND METHODOLOGY .....................................5
• Background.................................................................................. 5
• Survey Instrument ....................................................................... 5
• Sample Size and Response Rates ................................................. 6
• Sampling Frame .......................................................................... 6
• Survey Procedure ......................................................................... 6
• Survey Tracking ............................................................................ 7
• Disqualified Surveys..................................................................... 7
• Non-returned Surveys .................................................................. 8
• Spanish-language Surveys ........................................................... 8
• Sample Disposition ...................................................................... 8
• Survey Response and Population Characteristics ....................... 11
GENERAL FINDINGS: ADULT AND CHILD/ADOLESCENT SURVEYS .......................................................15
• Adult and Child/Adolescent Domains ......................................... 15
• Overall Ratings of Provider Treatment and Counseling ............... 17
FINDINGS: ADULT SURVEY ............................................................19
• Adult Domain Questions Analysis .............................................. 19
• Key Findings — Adult Survey .................................................... 20
• Detailed Analysis of Adult Survey Responses ............................. 22
• Domain scores by gender (Question 2) ................................. 22
• Domain scores by payment sources (Question 5) .................. 23
• Domain scores by length of time until first appointment (Question 53) .................................. 24
• Domain scores by first appointment meeting needs (Question 54) ............................................... 25
• Domain scores by age categories (Question 1)...................... 26
• Domain scores by race categories (Question 4) ..................... 27
• Employment status (Questions 55, 56 and 57) ..................... 28
• Homelessness (Questions 58, 59 and 60) ............................. 29
• Criminal justice involvement (Questions 43–51) .................. 29
• Currently getting services from this center (Question 42) ..... 30
• Experience with other mental health providers (Questions 62 and 63) ........................................... 31
FINDINGS: CHILD/ADOLESCENT SURVEY ....................................33
• Child/Adolescent Domain Questions Analysis ............................ 33
• Key Findings — Child/Adolescent Survey .................................. 35
• Detailed Analysis of Child/Adolescent Survey Responses ........... 36
• Domain scores by gender (Question 2) ................................. 36
• Domain scores by payment sources (Question 5) .................. 37
• Domain scores by length of time until first appointment (Question 56)........................................... 38
• Domain scores by first appointment meeting needs (Question 57) ............................................................. 39
• Domain scores by age categories (Question 1)...................... 40
• Domain scores by race categories (Question 4) ..................... 41
• Current medication status (Question 37) .............................. 42
• Juvenile justice involvement (Questions 41, 42, 43, 47, 48 and 49) ................................... 43
• School issues reported (Questions 44, 45, 46, 50, 51, 52 and 54) ............................. 44
• Grade improvement (Question 53) ....................................... 45 • Currently getting services from his center (Question 39) ...... 46 • Experience with other mental health providers (Questions 59 and 60) ........................................... 47
WARDS OF STATE COMPARISON ...................................................49
APPENDIX A: Adult Survey Responses .........................................51
APPENDIX B: Child/Adolescent Survey Responses ....................71
TABLE OF CONTENTS
ARKANSAS’ COMMUNITY MENTAL HEALTH CENTERSSATISFACTION SURVEY, ADULT AND CHILD
2017 Customer SatisfactionSurvey Results

ARKANSAS’ COMMUNITY MENTAL HEALTH CENTERS SATISFACTION SURVEY, ADULT AND CHILD • 2017 CUSTOMER SATISFACTION SURVEY RESULTS | PAGE 1
Executive Summary
AFMC conducted a mail survey to evaluate adult and child/adolescent clients’ satis-faction with the services they received from the state’s community mental health centers and clinics (CMHCs). The adult and child/adolescent versions of the Mental Health Statistics Improvement Project (MHSIP) consumer satisfaction surveys were
used, along with added items of local interest. In order to ensure that enough completed surveys were available to allow results valid at the 95 percent confidence level with a five-point confidence interval, a random sample of 1,890 adults and 1,924 children/ado-lescents was taken. The stratified sample of clients receiving services between July 1, 2016, and Dec. 31, 2016, was drawn from each CMHC in proportion to the number of patients of that center compared with the statewide total of CMHC patients. The analyzable sample size after exclusion of ineligibles and adjusting for bad addresses was 1,602 for adults and 1,701 for the child/adolescent surveys. Ultimately, a total of 383 (24%) adult and 376 (22%) child/adolescent surveys were available for analysis.
The MHSIP survey responses from related questions were combined to form domains of various aspects of client satisfaction. Both the adult and child/adolescent surveys mea-sured the domains of satisfaction with access, outcomes, participation in treatment plan-ning and overall satisfaction with services, as well as social connectedness and improved functioning. The adult survey also measured satisfaction with quality/appropriateness of services, while the child/adolescent survey also measured satisfaction with staff cultural sensitivity. In addition to these satisfaction domain areas, the adult survey asked questions regarding employment status, homelessness and criminal justice involvement, while the child/adolescent version inquired about juvenile justice involvement and school issues. Both surveys asked about experience with other mental health providers, in addition to the CMHC providing services.
The percentage of favorable domain scores was calculated by determining the percent-age of respondents indicating an above-average favorable rating on the questions com-prising the domain. The percentage of favorable domain scores for 2017 was compared with the domain scores obtained in the 2016 survey. For adults, none of the differences was statistically significant. Among the child respondents, significantly higher positive percentages were noted for outcomes, cultural sensitivity of staff, and improved function-ing domains. For adults, the highest domain scores for 2017 were in overall satisfaction (78%) and satisfaction with quality and appropriateness (78%), while the lowest domain score was for social connectedness (52%). Although not statistically significant, for adults, correspondingly lower percentages compared to 2016 were noticed in the domains of overall satisfaction, access and social connectedness. For child/adolescent respondents, the highest domain score was in the area of cultural sensitivity of staff (93%), while the lowest domain scores were in the areas of perceptions of outcomes (65%) and improved functioning (67%).
ARKANSAS’ COMMUNITY MENTAL HEALTH CENTERS SATISFACTION SURVEY, ADULT AND CHILD • 2017 CUSTOMER SATISFACTION SURVEY RESULTS | PAGE 2
The percentage of favorable domain scores for different groups of respondents was com-pared for both the adult and child survey populations. Comparisons included were by gender, payment source, length of time to first appointment, age, race, first appointment meeting needs, employment status and whether the respondent is currently getting ser-vices from the same center.
Notable findings from these comparisons for adult respondents include:
Q All male domains were higher than female domains with significantly higher ratings in the satisfaction with outcomes, satisfaction with participation in treatment planning and improved functioning domains.
Q Respondents whose services were paid for, in whole or part, by Medicaid show higher favorable percentages in all domains. The overall satisfaction and satisfaction with access domains measured statistically significant higher percentages.
Q For those who responded they waited less than two weeks for their first appointment statistically significant higher percentages were indicated in the following domains: overall satisfaction, satisfaction with access, satisfaction with quality and appropriateness, social connectedness and improved functioning.
Q Eighty-four percent of respondents reported that their first appointment was soon enough to meet their needs.
Q Respondents ages 45 and older reported more favorable percentages in all domains except improved functioning; however, the satisfaction with access domain is the only statistically significant higher measure.
Q Minorities reported a statistically significant favorable percentage in the satisfaction with participation in treatment planning domain.
Q During the past 12 months, 20 percent of respondents indicated they had held some kind of employment that paid at least minimum wage, while 80 percent indicated holding no employment. Of those holding employment, 47 percent indicated that they held employment that was full-time, while 53 percent indicated it was part-time.
Q Of the 365 respondents answering the question regarding homelessness, 26 (7%) reported experiencing homelessness during the past 12 months.
Q Of the individuals who began treatment in the past 12 months, eight (10%) reported having been arrested since starting treatment, and 13 (17%) reported being arrested in the year before that.
Q Those respondents still receiving services from this clinic had significantly more favorable domain percentages in overall satisfaction, satisfaction with access and satisfaction with participation in treatment planning.
ARKANSAS’ COMMUNITY MENTAL HEALTH CENTERS SATISFACTION SURVEY, ADULT AND CHILD • 2017 CUSTOMER SATISFACTION SURVEY RESULTS | PAGE 3
Notable findings for child/adolescent respondents for the above noted group compari-sons include:
Q The cultural sensitivity of staff domain scored the highest percentage of favorable responses for both males (92%) and females (95%). The largest difference between males and females appears in the satisfaction with participation in treatment planning; however, this difference in not significant.
Q All domains except for satisfaction with cultural sensitivity of staff scored higher favorable percentages for the group that had all or part of the charges covered by Medicaid. However, these percentage differences were not significant.
Q Those who had less than two weeks’ time from the time of their initial contact with the clinic until their first appointment, had slightly higher favorable percentages for all domains except satisfaction with access, satisfaction with outcomes and improved functioning; however, none were significant.
Q Eighty-six percent of parents/caregivers reported that their child’s/adolescent’s first appointment was soon enough to meet their needs.
Q In 2017, no significant difference was observed across the various domains between age groups.
Q Minorities reported a statistically significant favorable percentage in the satisfaction with access domain.
Q Parents/caregivers who reported that their child/adolescent was currently on medication reported statistically significant higher rates for the social connectedness domain.
Q In 2017, 3 percent (N=352) of parents/caregivers of children/adolescents indicated their child had ever been arrested.
Q Sixty-one percent of respondents said their child’s grades had improved as a result of mental health services. Thirty-one percent responded their child’s grades had not improved and eight percent responded this question was not applicable to their child.
Q Sixty-seven percent of parents/caregivers of children/adolescents responded that their child/adolescent is still getting services from this center.
Q When comparing wards of state to other survey recipients, those who were wards of Arkansas had statistically significant higher percentages in the satisfaction with outcomes and improved functioning domains.
ARKANSAS’ COMMUNITY MENTAL HEALTH CENTERS SATISFACTION SURVEY, ADULT AND CHILD • 2017 CUSTOMER SATISFACTION SURVEY RESULTS | PAGE 4
THIS PAGE INTENTIONALLY LEFT BLANK
ARKANSAS’ COMMUNITY MENTAL HEALTH CENTERS SATISFACTION SURVEY, ADULT AND CHILD • 2017 CUSTOMER SATISFACTION SURVEY RESULTS | PAGE 5
BACKGROUND
AFMC has conducted yearly surveys to evaluate adult and child/adolescent ben-eficiaries’ satisfaction with the services they received from Arkansas’ CMHCs since 2005. The survey is conducted for the Department of Human Services’ Division of Behavioral Health Services (DBHS) and Division of Medical Services (Medicaid).
The CMHCs are also active partners in this project. The major areas of interest are satisfac-tion with access, outcomes, participation in treatment planning, social connectedness, improved functioning and overall satisfaction with services. The adult version of the survey also measures satisfaction with quality/appropriateness of services, while the child/ado-lescent version also measures satisfaction with the cultural sensitivity of staff. The results show where CMHCs are meeting or exceeding patients’ expectations as well as areas of potential improvement. These results will be sent to a benchmarking database, where Arkansas’ results will be presented with the results from other states to provide a national picture of consumer satisfaction with public mental health services.
SURVEY INSTRUMENTThe adult and child/adolescent versions of the MHSIP consumer satisfaction surveys were used. A MHSIP policy group has been working for more than 20 years to develop stan-dards for collecting mental health data, including consumer satisfaction survey data. In 2007, the MHSIP surveys were expanded to add items measuring two additional domains (social connectedness and improved functioning) and to cover outcomes in the areas of criminal/juvenile justice contact and, for children, school attendance. The adult survey is completed by the adult beneficiary of services, while the child/adolescent survey is com-pleted by the parent/guardian of the child/adolescent beneficiary of services. A number of items of local interest were added to both the adult and child/adolescent MHSIP surveys. These additional items brought the final adult version to 64 items (see Appendix A) and the child/adolescent version to 61 items (see Appendix B). Both surveys focused primar-ily on experiences with a specific CMHC. Questions were also asked about other mental health services received and satisfaction with these services.
Survey Overviewand Methodology
ARKANSAS’ COMMUNITY MENTAL HEALTH CENTERS SATISFACTION SURVEY, ADULT AND CHILD • 2017 CUSTOMER SATISFACTION SURVEY RESULTS | PAGE 6
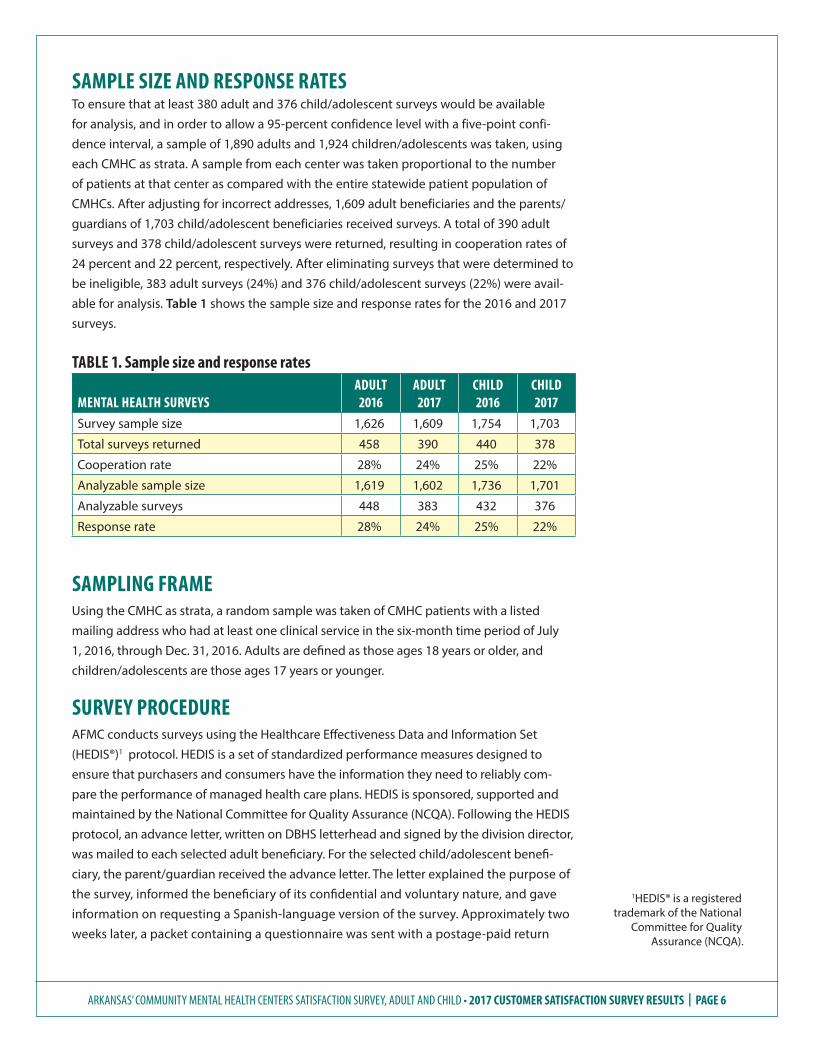
SAMPLE SIZE AND RESPONSE RATESTo ensure that at least 380 adult and 376 child/adolescent surveys would be available for analysis, and in order to allow a 95-percent confidence level with a five-point confi-dence interval, a sample of 1,890 adults and 1,924 children/adolescents was taken, using each CMHC as strata. A sample from each center was taken proportional to the number of patients at that center as compared with the entire statewide patient population of CMHCs. After adjusting for incorrect addresses, 1,609 adult beneficiaries and the parents/guardians of 1,703 child/adolescent beneficiaries received surveys. A total of 390 adult surveys and 378 child/adolescent surveys were returned, resulting in cooperation rates of 24 percent and 22 percent, respectively. After eliminating surveys that were determined to be ineligible, 383 adult surveys (24%) and 376 child/adolescent surveys (22%) were avail-able for analysis. Table 1 shows the sample size and response rates for the 2016 and 2017 surveys.
TABLE 1. Sample size and response rates
MENTAL HEALTH SURVEYSADULT 2016
ADULT 2017
CHILD 2016
CHILD 2017
Survey sample size 1,626 1,609 1,754 1,703
Total surveys returned 458 390 440 378
Cooperation rate 28% 24% 25% 22%
Analyzable sample size 1,619 1,602 1,736 1,701
Analyzable surveys 448 383 432 376
Response rate 28% 24% 25% 22%
SAMPLING FRAMEUsing the CMHC as strata, a random sample was taken of CMHC patients with a listed mailing address who had at least one clinical service in the six-month time period of July 1, 2016, through Dec. 31, 2016. Adults are defined as those ages 18 years or older, and children/adolescents are those ages 17 years or younger. SURVEY PROCEDUREAFMC conducts surveys using the Healthcare Effectiveness Data and Information Set (HEDIS®)1 protocol. HEDIS is a set of standardized performance measures designed to ensure that purchasers and consumers have the information they need to reliably com-pare the performance of managed health care plans. HEDIS is sponsored, supported and maintained by the National Committee for Quality Assurance (NCQA). Following the HEDIS protocol, an advance letter, written on DBHS letterhead and signed by the division director, was mailed to each selected adult beneficiary. For the selected child/adolescent benefi-ciary, the parent/guardian received the advance letter. The letter explained the purpose of the survey, informed the beneficiary of its confidential and voluntary nature, and gave information on requesting a Spanish-language version of the survey. Approximately two weeks later, a packet containing a questionnaire was sent with a postage-paid return
1HEDIS® is a registered trademark of the National
Committee for Quality Assurance (NCQA).
ARKANSAS’ COMMUNITY MENTAL HEALTH CENTERS SATISFACTION SURVEY, ADULT AND CHILD • 2017 CUSTOMER SATISFACTION SURVEY RESULTS | PAGE 7
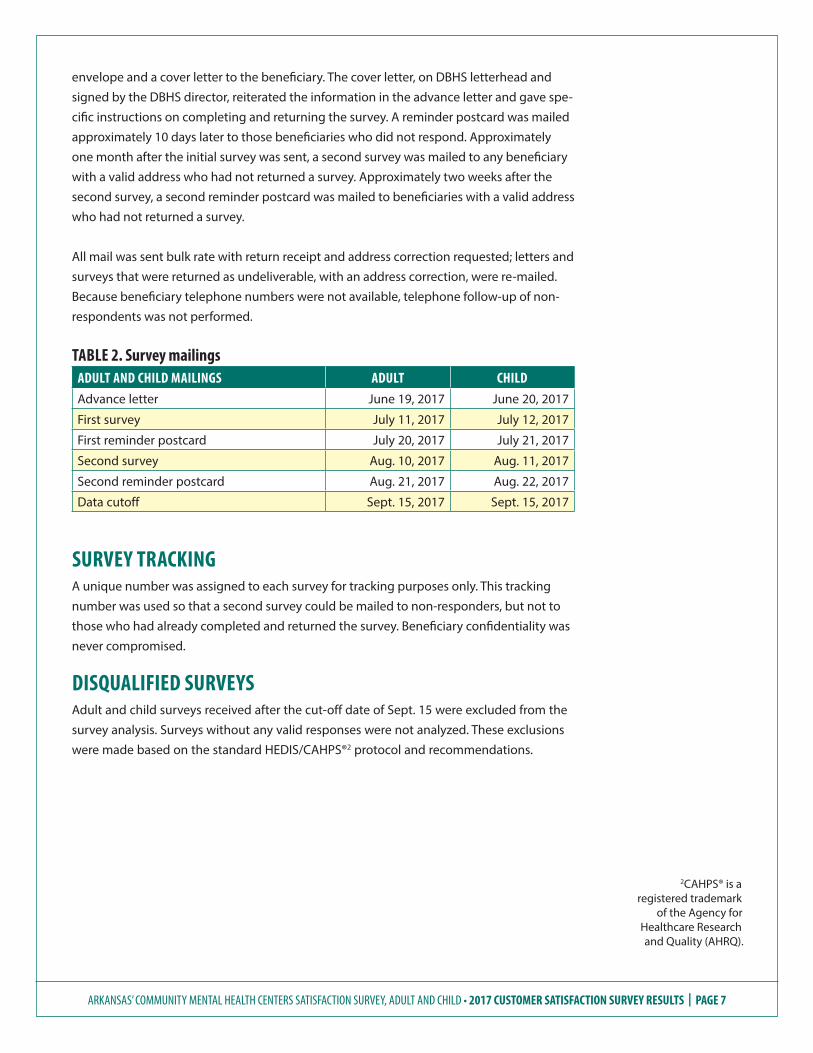
envelope and a cover letter to the beneficiary. The cover letter, on DBHS letterhead and signed by the DBHS director, reiterated the information in the advance letter and gave spe-cific instructions on completing and returning the survey. A reminder postcard was mailed approximately 10 days later to those beneficiaries who did not respond. Approximately one month after the initial survey was sent, a second survey was mailed to any beneficiary with a valid address who had not returned a survey. Approximately two weeks after the second survey, a second reminder postcard was mailed to beneficiaries with a valid address who had not returned a survey.
All mail was sent bulk rate with return receipt and address correction requested; letters and surveys that were returned as undeliverable, with an address correction, were re-mailed. Because beneficiary telephone numbers were not available, telephone follow-up of non-respondents was not performed.
TABLE 2. Survey mailingsADULT AND CHILD MAILINGS ADULT CHILDAdvance letter June 19, 2017 June 20, 2017
First survey July 11, 2017 July 12, 2017
First reminder postcard July 20, 2017 July 21, 2017
Second survey Aug. 10, 2017 Aug. 11, 2017
Second reminder postcard Aug. 21, 2017 Aug. 22, 2017
Data cutoff Sept. 15, 2017 Sept. 15, 2017
SURVEY TRACKINGA unique number was assigned to each survey for tracking purposes only. This tracking number was used so that a second survey could be mailed to non-responders, but not to those who had already completed and returned the survey. Beneficiary confidentiality was never compromised.
DISQUALIFIED SURVEYSAdult and child surveys received after the cut-off date of Sept. 15 were excluded from the survey analysis. Surveys without any valid responses were not analyzed. These exclusions were made based on the standard HEDIS/CAHPS®2 protocol and recommendations.
2CAHPS® is a registered trademark
of the Agency for Healthcare Research and Quality (AHRQ).
ARKANSAS’ COMMUNITY MENTAL HEALTH CENTERS SATISFACTION SURVEY, ADULT AND CHILD • 2017 CUSTOMER SATISFACTION SURVEY RESULTS | PAGE 8
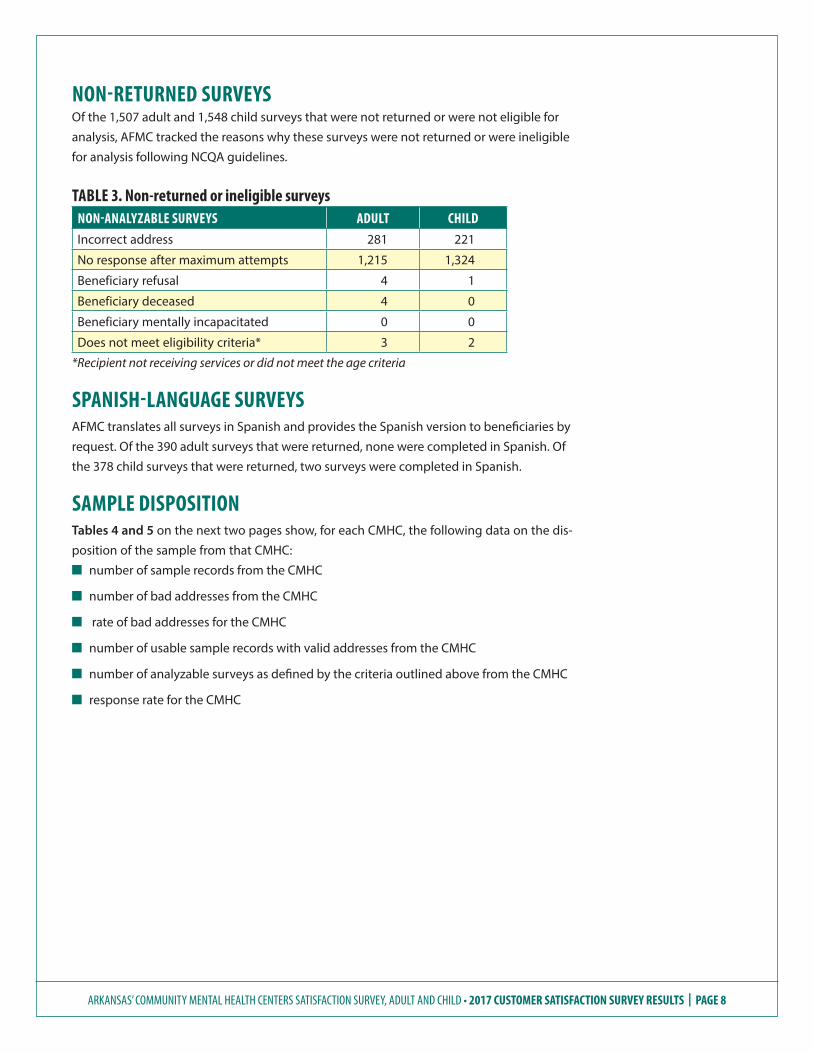
NON-RETURNED SURVEYSOf the 1,507 adult and 1,548 child surveys that were not returned or were not eligible for analysis, AFMC tracked the reasons why these surveys were not returned or were ineligible for analysis following NCQA guidelines.
TABLE 3. Non-returned or ineligible surveysNON-ANALYZABLE SURVEYS ADULT CHILDIncorrect address 281 221
No response after maximum attempts 1,215 1,324
Beneficiary refusal 4 1
Beneficiary deceased 4 0
Beneficiary mentally incapacitated 0 0
Does not meet eligibility criteria* 3 2
*Recipient not receiving services or did not meet the age criteria
SPANISH-LANGUAGE SURVEYSAFMC translates all surveys in Spanish and provides the Spanish version to beneficiaries by request. Of the 390 adult surveys that were returned, none were completed in Spanish. Of the 378 child surveys that were returned, two surveys were completed in Spanish.
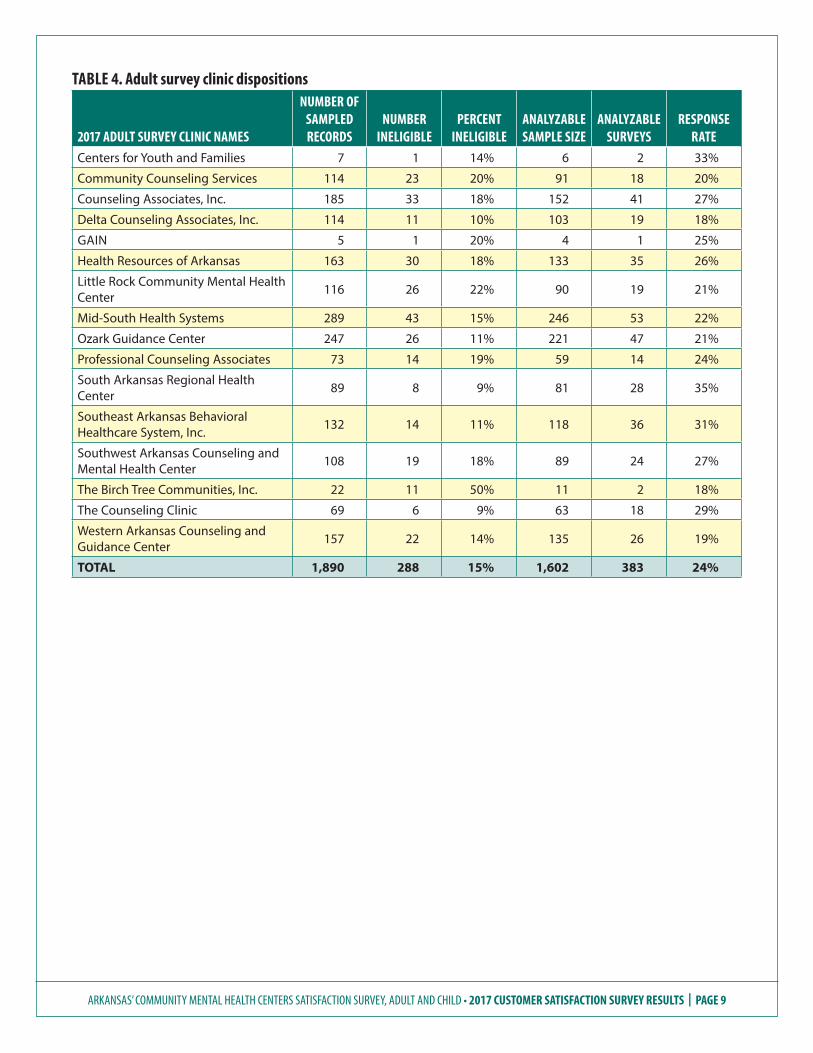
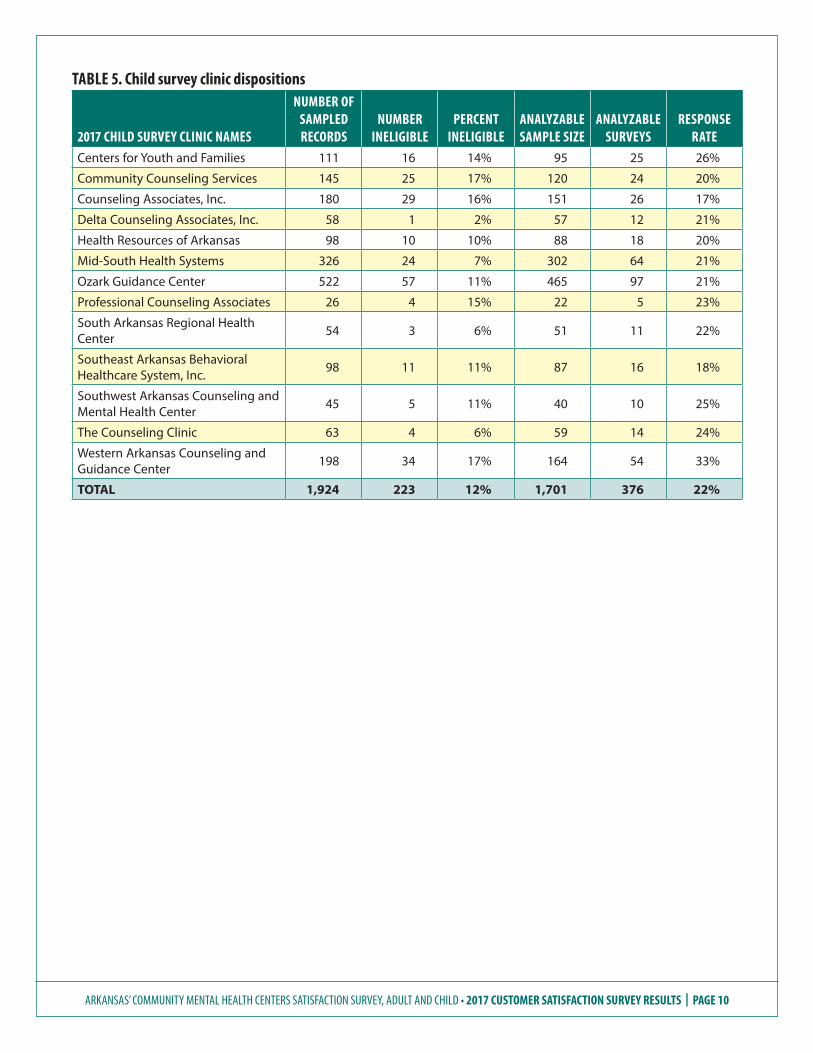
SAMPLE DISPOSITIONTables 4 and 5 on the next two pages show, for each CMHC, the following data on the dis-position of the sample from that CMHC:
Q number of sample records from the CMHC
Q number of bad addresses from the CMHC
Q rate of bad addresses for the CMHC
Q number of usable sample records with valid addresses from the CMHC
Q number of analyzable surveys as defined by the criteria outlined above from the CMHC
Q response rate for the CMHC
ARKANSAS’ COMMUNITY MENTAL HEALTH CENTERS SATISFACTION SURVEY, ADULT AND CHILD • 2017 CUSTOMER SATISFACTION SURVEY RESULTS | PAGE 9
TABLE 4. Adult survey clinic dispositions
2017 ADULT SURVEY CLINIC NAMES
NUMBER OF SAMPLED RECORDS
NUMBER INELIGIBLE
PERCENT INELIGIBLE
ANALYZABLE SAMPLE SIZE
ANALYZABLE SURVEYS
RESPONSE RATE
Centers for Youth and Families 7 1 14% 6 2 33%
Community Counseling Services 114 23 20% 91 18 20%
Counseling Associates, Inc. 185 33 18% 152 41 27%
Delta Counseling Associates, Inc. 114 11 10% 103 19 18%
GAIN 5 1 20% 4 1 25%
Health Resources of Arkansas 163 30 18% 133 35 26%
Little Rock Community Mental Health Center 116 26 22% 90 19 21%
Mid-South Health Systems 289 43 15% 246 53 22%
Ozark Guidance Center 247 26 11% 221 47 21%
Professional Counseling Associates 73 14 19% 59 14 24%
South Arkansas Regional Health Center 89 8 9% 81 28 35%
Southeast Arkansas Behavioral Healthcare System, Inc. 132 14 11% 118 36 31%
Southwest Arkansas Counseling and Mental Health Center 108 19 18% 89 24 27%
The Birch Tree Communities, Inc. 22 11 50% 11 2 18%
The Counseling Clinic 69 6 9% 63 18 29%
Western Arkansas Counseling and Guidance Center 157 22 14% 135 26 19%
TOTAL 1,890 288 15% 1,602 383 24%
ARKANSAS’ COMMUNITY MENTAL HEALTH CENTERS SATISFACTION SURVEY, ADULT AND CHILD • 2017 CUSTOMER SATISFACTION SURVEY RESULTS | PAGE 10
TABLE 5. Child survey clinic dispositions
2017 CHILD SURVEY CLINIC NAMES
NUMBER OF SAMPLED RECORDS
NUMBER INELIGIBLE
PERCENT INELIGIBLE
ANALYZABLE SAMPLE SIZE
ANALYZABLE SURVEYS
RESPONSE RATE
Centers for Youth and Families 111 16 14% 95 25 26%
Community Counseling Services 145 25 17% 120 24 20%
Counseling Associates, Inc. 180 29 16% 151 26 17%
Delta Counseling Associates, Inc. 58 1 2% 57 12 21%
Health Resources of Arkansas 98 10 10% 88 18 20%
Mid-South Health Systems 326 24 7% 302 64 21%
Ozark Guidance Center 522 57 11% 465 97 21%
Professional Counseling Associates 26 4 15% 22 5 23%
South Arkansas Regional Health Center 54 3 6% 51 11 22%
Southeast Arkansas Behavioral Healthcare System, Inc. 98 11 11% 87 16 18%
Southwest Arkansas Counseling and Mental Health Center 45 5 11% 40 10 25%
The Counseling Clinic 63 4 6% 59 14 24%
Western Arkansas Counseling and Guidance Center 198 34 17% 164 54 33%
TOTAL 1,924 223 12% 1,701 376 22%
ARKANSAS’ COMMUNITY MENTAL HEALTH CENTERS SATISFACTION SURVEY, ADULT AND CHILD • 2017 CUSTOMER SATISFACTION SURVEY RESULTS | PAGE 11
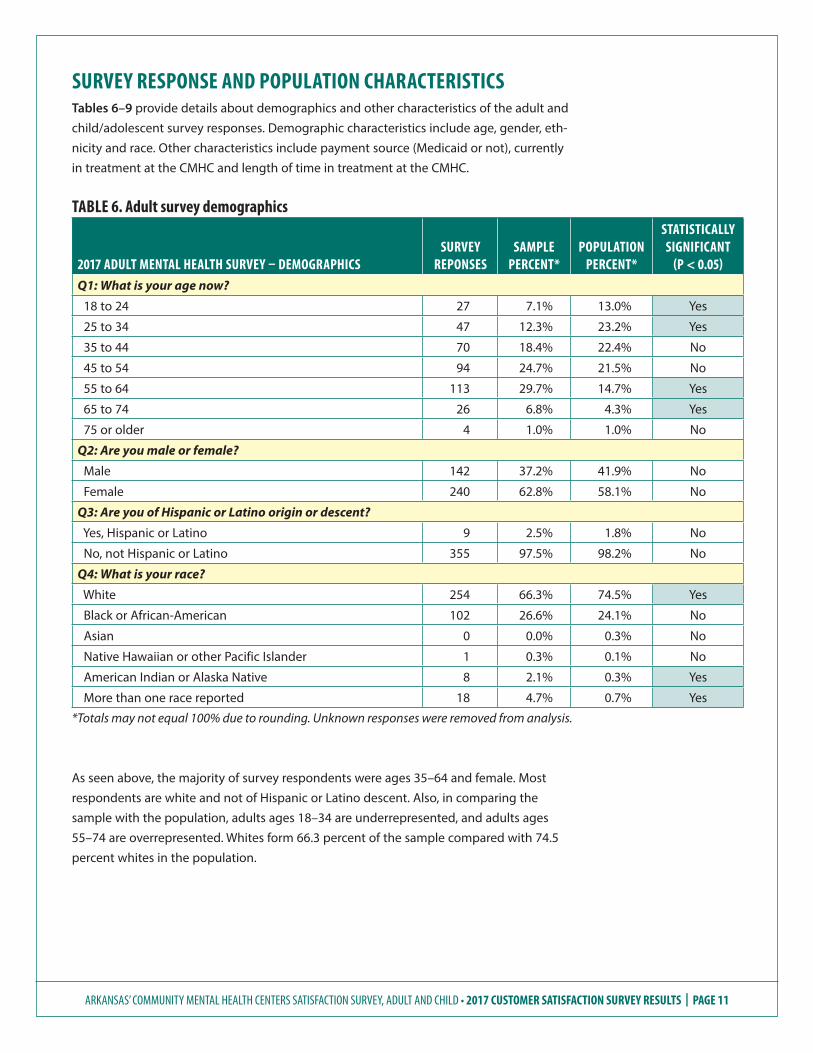
SURVEY RESPONSE AND POPULATION CHARACTERISTICSTables 6–9 provide details about demographics and other characteristics of the adult and child/adolescent survey responses. Demographic characteristics include age, gender, eth-nicity and race. Other characteristics include payment source (Medicaid or not), currently in treatment at the CMHC and length of time in treatment at the CMHC.
TABLE 6. Adult survey demographics
2017 ADULT MENTAL HEALTH SURVEY – DEMOGRAPHICSSURVEY
REPONSESSAMPLE
PERCENT*POPULATION
PERCENT*
STATISTICALLY SIGNIFICANT
(P < 0.05)Q1: What is your age now?
18 to 24 27 7.1% 13.0% Yes
25 to 34 47 12.3% 23.2% Yes
35 to 44 70 18.4% 22.4% No
45 to 54 94 24.7% 21.5% No
55 to 64 113 29.7% 14.7% Yes
65 to 74 26 6.8% 4.3% Yes
75 or older 4 1.0% 1.0% No
Q2: Are you male or female?
Male 142 37.2% 41.9% No
Female 240 62.8% 58.1% No
Q3: Are you of Hispanic or Latino origin or descent?
Yes, Hispanic or Latino 9 2.5% 1.8% No
No, not Hispanic or Latino 355 97.5% 98.2% No
Q4: What is your race?
White 254 66.3% 74.5% Yes
Black or African-American 102 26.6% 24.1% No
Asian 0 0.0% 0.3% No
Native Hawaiian or other Pacific Islander 1 0.3% 0.1% No
American Indian or Alaska Native 8 2.1% 0.3% Yes
More than one race reported 18 4.7% 0.7% Yes
*Totals may not equal 100% due to rounding. Unknown responses were removed from analysis.
As seen above, the majority of survey respondents were ages 35–64 and female. Most respondents are white and not of Hispanic or Latino descent. Also, in comparing the sample with the population, adults ages 18–34 are underrepresented, and adults ages 55–74 are overrepresented. Whites form 66.3 percent of the sample compared with 74.5 percent whites in the population.

ARKANSAS’ COMMUNITY MENTAL HEALTH CENTERS SATISFACTION SURVEY, ADULT AND CHILD • 2017 CUSTOMER SATISFACTION SURVEY RESULTS | PAGE 12
TABLE 7. Child survey demographics
2017 CHILD MENTAL HEALTH SURVEY – DEMOGRAPHICSSURVEY
REPONSESSAMPLE
PERCENT*POPULATION
PERCENT*
STATISTICALLY SIGNIFICANT
(P < 0.05)Q1: What is your child’s age now?
2017 age groups
1 to 9 132 37.2% 38.0% No
10 to 17 223 62.8% 62.0% No
2017 age groups
1 to 6 42 11.8% 14.5% No
7 to 12 167 47.0% 46.1% No
13 to 17 146 41.1% 39.5% No
Q2: Is your child male or female?
Male 213 58.0% 56.9% No
Female 154 42.0% 43.1% No
Q3: Is your child of Hispanic or Latino origin or descent?
Yes, Hispanic or Latino 27 7.6% 8.2% No
No, not Hispanic or Latino 329 92.4% 91.8% No
Q4: What is your child’s race?
White 248 68.3% 74.3% Yes
Black or African-American 82 22.6% 22.1% No
Asian 1 0.3% 0.3% No
Native Hawaiian or other Pacific Islander 0 0.00 0.1% No
American Indian or Alaska Native 5 1.4% 0.5% Yes
More than one race reported 27 7.4% 2.7% Yes
*Totals may not equal 100% due to rounding. Unknown responses were removed from analysis.
Table 7 indicates more parent or caregiver respondents of children ages 10–17 (62.8%) completed surveys than those of ages 1–9 (37.2%). Slightly more respondents had male children and the majority stated their child’s race was white and not of Hispanic or Latino descent. In comparing the sample with the population, those with children ages 1–6 are slightly underrepresented. Those who reported their child’s race as white are underrepresented, while those who reported their child’s race as American Indian or reporting more than one race are overrepresented.
ARKANSAS’ COMMUNITY MENTAL HEALTH CENTERS SATISFACTION SURVEY, ADULT AND CHILD • 2017 CUSTOMER SATISFACTION SURVEY RESULTS | PAGE 13
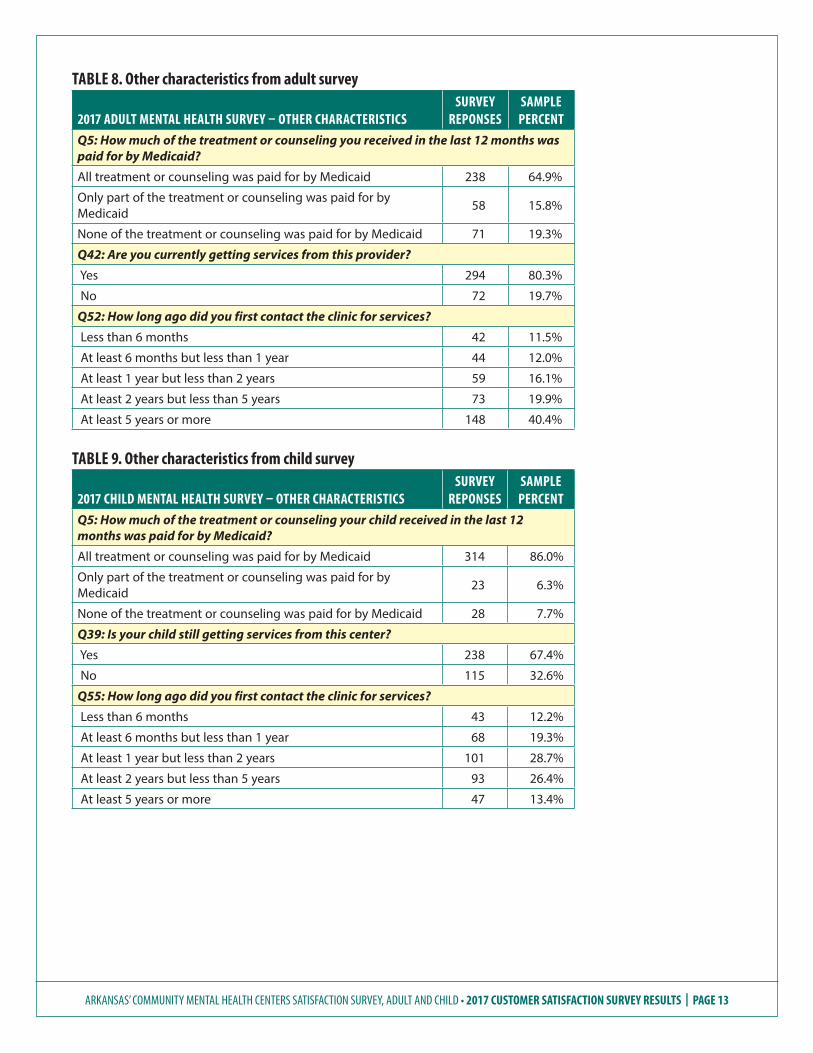
TABLE 8. Other characteristics from adult survey
2017 ADULT MENTAL HEALTH SURVEY – OTHER CHARACTERISTICSSURVEY
REPONSESSAMPLE PERCENT
Q5: How much of the treatment or counseling you received in the last 12 months was paid for by Medicaid?
All treatment or counseling was paid for by Medicaid 238 64.9%
Only part of the treatment or counseling was paid for by Medicaid 58 15.8%
None of the treatment or counseling was paid for by Medicaid 71 19.3%
Q42: Are you currently getting services from this provider?
Yes 294 80.3%
No 72 19.7%
Q52: How long ago did you first contact the clinic for services?
Less than 6 months 42 11.5%
At least 6 months but less than 1 year 44 12.0%
At least 1 year but less than 2 years 59 16.1%
At least 2 years but less than 5 years 73 19.9%
At least 5 years or more 148 40.4%
TABLE 9. Other characteristics from child survey
2017 CHILD MENTAL HEALTH SURVEY – OTHER CHARACTERISTICSSURVEY
REPONSESSAMPLE PERCENT
Q5: How much of the treatment or counseling your child received in the last 12 months was paid for by Medicaid?
All treatment or counseling was paid for by Medicaid 314 86.0%
Only part of the treatment or counseling was paid for by Medicaid 23 6.3%
None of the treatment or counseling was paid for by Medicaid 28 7.7%
Q39: Is your child still getting services from this center?
Yes 238 67.4%
No 115 32.6%
Q55: How long ago did you first contact the clinic for services?
Less than 6 months 43 12.2%
At least 6 months but less than 1 year 68 19.3%
At least 1 year but less than 2 years 101 28.7%
At least 2 years but less than 5 years 93 26.4%
At least 5 years or more 47 13.4%
ARKANSAS’ COMMUNITY MENTAL HEALTH CENTERS SATISFACTION SURVEY, ADULT AND CHILD • 2017 CUSTOMER SATISFACTION SURVEY RESULTS | PAGE 14
THIS PAGE INTENTIONALLY LEFT BLANK
ARKANSAS’ COMMUNITY MENTAL HEALTH CENTERS SATISFACTION SURVEY, ADULT AND CHILD • 2017 CUSTOMER SATISFACTION SURVEY RESULTS | PAGE 15
ADULT AND CHILD/ADOLESCENT DOMAINS
Following the standard procedures for the MHSIP surveys, responses from certain related questions were combined to form domains of various aspects of beneficiary satisfaction. The domains reflect respondents’ satisfaction in various areas related to their care at a specific CMHC. Although using somewhat different questions, both
the adult and child/adolescent surveys measured satisfaction with access, outcomes, participation in treatment planning and overall satisfaction with services, as well as social connectedness and improved functioning. The adult survey version also measured satisfaction with quality/appropriateness of services, while the child/adolescent survey version also measured satisfaction with staff cultural sensitivity.
Per the federal guidelines used to score the survey domains, only respondents who answered at least two-thirds of the questions comprising that domain were included in the domain calculation. Respondents with more than one-third of the questions missing were excluded from the calculations. To score a particular domain, the responses for the series of questions comprising that domain were added together to produce a sum total. The sum total was then divided by the number of questions answered, which produced the mean score, also referred to as the average domain score.
The adult and child/adolescent versions of the survey have different numerical rating scales. For the adult version, lower numerical values indicate higher levels of satisfaction, and mean domain scores of less than 2.5 are the criteria for a positive domain rating. For the child/adolescent version, higher numerical values indicate higher levels of satisfaction, and mean domain scores of more than 3.5 are the criteria for a positive domain rating. Thus, for adults, the numerator for each domain was the number of respondents with a positive rating score − a mean score of less than 2.5. The child/adolescent numerator for each domain was the number of respondents with a positive rating score − a mean score of greater than 3.5. The denominator was the number of respondents included in a par-ticular domain measure.
General Findings:Adult and Child/Adolescent Surveys
ARKANSAS’ COMMUNITY MENTAL HEALTH CENTERS SATISFACTION SURVEY, ADULT AND CHILD • 2017 CUSTOMER SATISFACTION SURVEY RESULTS | PAGE 16
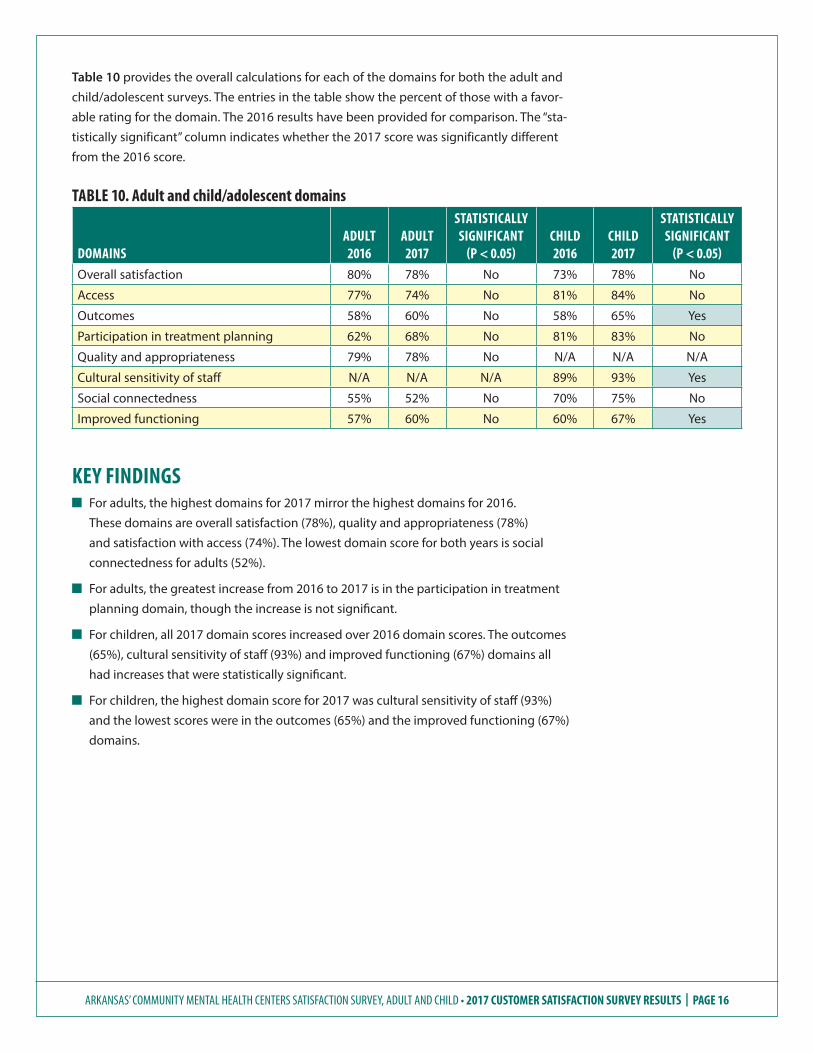
Table 10 provides the overall calculations for each of the domains for both the adult and child/adolescent surveys. The entries in the table show the percent of those with a favor-able rating for the domain. The 2016 results have been provided for comparison. The “sta-tistically significant” column indicates whether the 2017 score was significantly different from the 2016 score.
TABLE 10. Adult and child/adolescent domains
DOMAINSADULT 2016
ADULT 2017
STATISTICALLY SIGNIFICANT
(P < 0.05)CHILD 2016
CHILD 2017
STATISTICALLY SIGNIFICANT
(P < 0.05)Overall satisfaction 80% 78% No 73% 78% No
Access 77% 74% No 81% 84% No
Outcomes 58% 60% No 58% 65% Yes
Participation in treatment planning 62% 68% No 81% 83% No
Quality and appropriateness 79% 78% No N/A N/A N/A
Cultural sensitivity of staff N/A N/A N/A 89% 93% Yes
Social connectedness 55% 52% No 70% 75% No
Improved functioning 57% 60% No 60% 67% Yes
KEY FINDINGS Q For adults, the highest domains for 2017 mirror the highest domains for 2016.
These domains are overall satisfaction (78%), quality and appropriateness (78%)and satisfaction with access (74%). The lowest domain score for both years is social connectedness for adults (52%).
Q For adults, the greatest increase from 2016 to 2017 is in the participation in treatment planning domain, though the increase is not significant.
Q For children, all 2017 domain scores increased over 2016 domain scores. The outcomes (65%), cultural sensitivity of staff (93%) and improved functioning (67%) domains all had increases that were statistically significant.
Q For children, the highest domain score for 2017 was cultural sensitivity of staff (93%) and the lowest scores were in the outcomes (65%) and the improved functioning (67%) domains.
ARKANSAS’ COMMUNITY MENTAL HEALTH CENTERS SATISFACTION SURVEY, ADULT AND CHILD • 2017 CUSTOMER SATISFACTION SURVEY RESULTS | PAGE 17
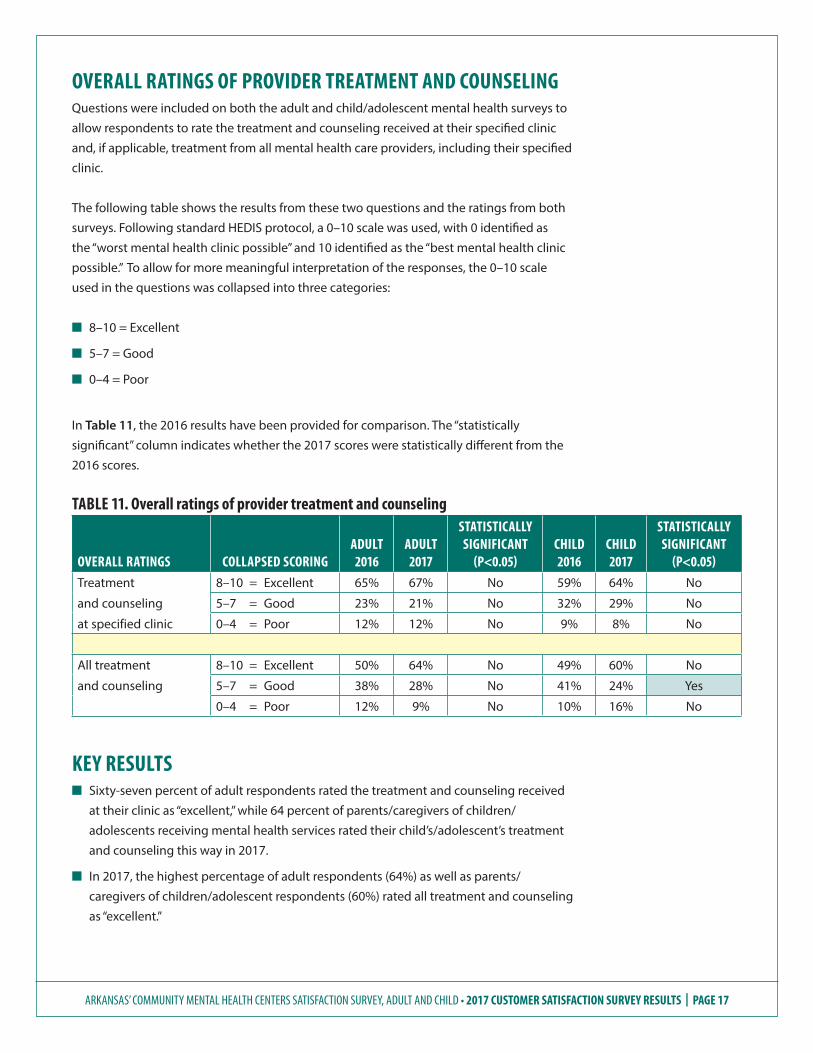
OVERALL RATINGS OF PROVIDER TREATMENT AND COUNSELINGQuestions were included on both the adult and child/adolescent mental health surveys to allow respondents to rate the treatment and counseling received at their specified clinic and, if applicable, treatment from all mental health care providers, including their specified clinic.
The following table shows the results from these two questions and the ratings from both surveys. Following standard HEDIS protocol, a 0–10 scale was used, with 0 identified as the “worst mental health clinic possible” and 10 identified as the “best mental health clinic possible.” To allow for more meaningful interpretation of the responses, the 0–10 scale used in the questions was collapsed into three categories:
n 8–10 = Excellent
n 5–7 = Good
n 0–4 = Poor
In Table 11, the 2016 results have been provided for comparison. The “statistically significant” column indicates whether the 2017 scores were statistically different from the 2016 scores.
TABLE 11. Overall ratings of provider treatment and counseling
OVERALL RATINGS COLLAPSED SCORINGADULT 2016
ADULT 2017
STATISTICALLY SIGNIFICANT
(P<0.05)CHILD 2016
CHILD 2017
STATISTICALLY SIGNIFICANT
(P<0.05)Treatment 8–10 = Excellent 65% 67% No 59% 64% No
and counseling 5–7 = Good 23% 21% No 32% 29% No
at specified clinic 0–4 = Poor 12% 12% No 9% 8% No
All treatment 8–10 = Excellent 50% 64% No 49% 60% No
and counseling 5–7 = Good 38% 28% No 41% 24% Yes
0–4 = Poor 12% 9% No 10% 16% No
KEY RESULTS n Sixty-seven percent of adult respondents rated the treatment and counseling received
at their clinic as “excellent,” while 64 percent of parents/caregivers of children/adolescents receiving mental health services rated their child’s/adolescent’s treatment and counseling this way in 2017.
n In 2017, the highest percentage of adult respondents (64%) as well as parents/caregivers of children/adolescent respondents (60%) rated all treatment and counseling as “excellent.”
ARKANSAS’ COMMUNITY MENTAL HEALTH CENTERS SATISFACTION SURVEY, ADULT AND CHILD • 2017 CUSTOMER SATISFACTION SURVEY RESULTS | PAGE 18
THIS PAGE INTENTIONALLY LEFT BLANK
ARKANSAS’ COMMUNITY MENTAL HEALTH CENTERS SATISFACTION SURVEY, ADULT AND CHILD • 2017 CUSTOMER SATISFACTION SURVEY RESULTS | PAGE 19
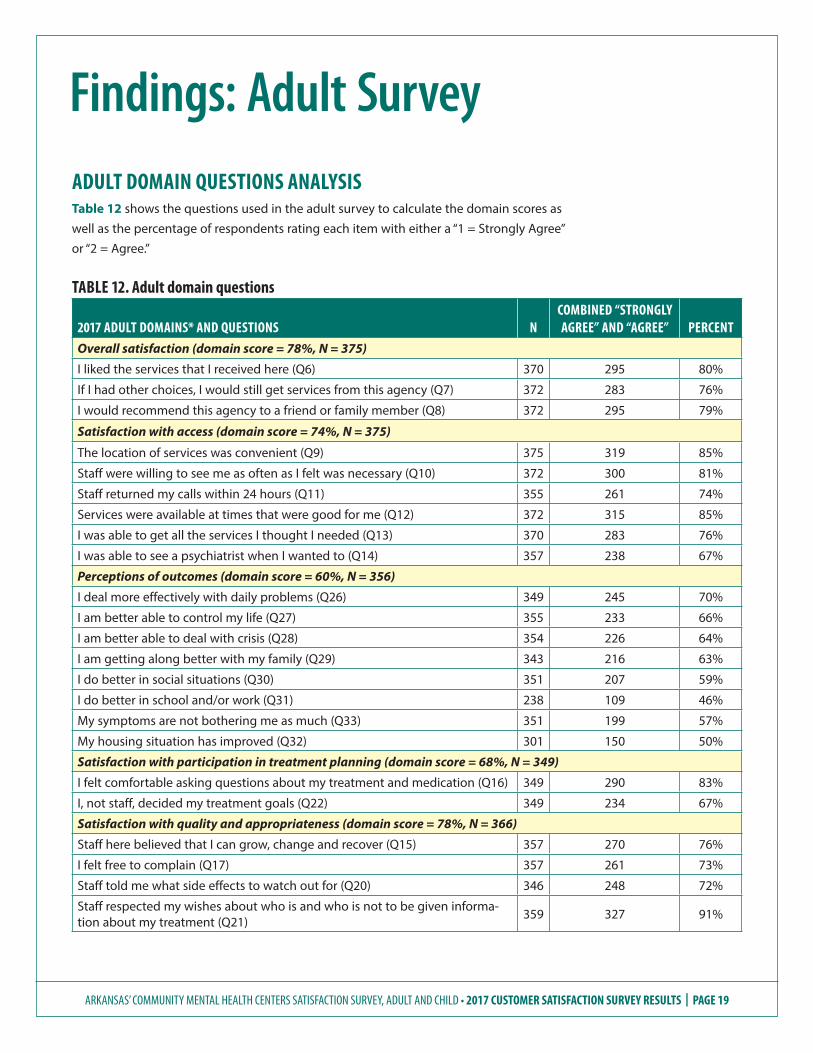
ADULT DOMAIN QUESTIONS ANALYSISTable 12 shows the questions used in the adult survey to calculate the domain scores as well as the percentage of respondents rating each item with either a “1 = Strongly Agree” or “2 = Agree.”
TABLE 12. Adult domain questions
2017 ADULT DOMAINS* AND QUESTIONS NCOMBINED “STRONGLY AGREE” AND “AGREE” PERCENT
Overall satisfaction (domain score = 78%, N = 375)
I liked the services that I received here (Q6) 370 295 80%
If I had other choices, I would still get services from this agency (Q7) 372 283 76%
I would recommend this agency to a friend or family member (Q8) 372 295 79%
Satisfaction with access (domain score = 74%, N = 375)
The location of services was convenient (Q9) 375 319 85%
Staff were willing to see me as often as I felt was necessary (Q10) 372 300 81%
Staff returned my calls within 24 hours (Q11) 355 261 74%
Services were available at times that were good for me (Q12) 372 315 85%
I was able to get all the services I thought I needed (Q13) 370 283 76%
I was able to see a psychiatrist when I wanted to (Q14) 357 238 67%
Perceptions of outcomes (domain score = 60%, N = 356)
I deal more effectively with daily problems (Q26) 349 245 70%
I am better able to control my life (Q27) 355 233 66%
I am better able to deal with crisis (Q28) 354 226 64%
I am getting along better with my family (Q29) 343 216 63%
I do better in social situations (Q30) 351 207 59%
I do better in school and/or work (Q31) 238 109 46%
My symptoms are not bothering me as much (Q33) 351 199 57%
My housing situation has improved (Q32) 301 150 50%
Satisfaction with participation in treatment planning (domain score = 68%, N = 349)
I felt comfortable asking questions about my treatment and medication (Q16) 349 290 83%
I, not staff, decided my treatment goals (Q22) 349 234 67%
Satisfaction with quality and appropriateness (domain score = 78%, N = 366)
Staff here believed that I can grow, change and recover (Q15) 357 270 76%
I felt free to complain (Q17) 357 261 73%
Staff told me what side effects to watch out for (Q20) 346 248 72%
Staff respected my wishes about who is and who is not to be given informa-tion about my treatment (Q21) 359 327 91%
Findings: Adult Survey
ARKANSAS’ COMMUNITY MENTAL HEALTH CENTERS SATISFACTION SURVEY, ADULT AND CHILD • 2017 CUSTOMER SATISFACTION SURVEY RESULTS | PAGE 20
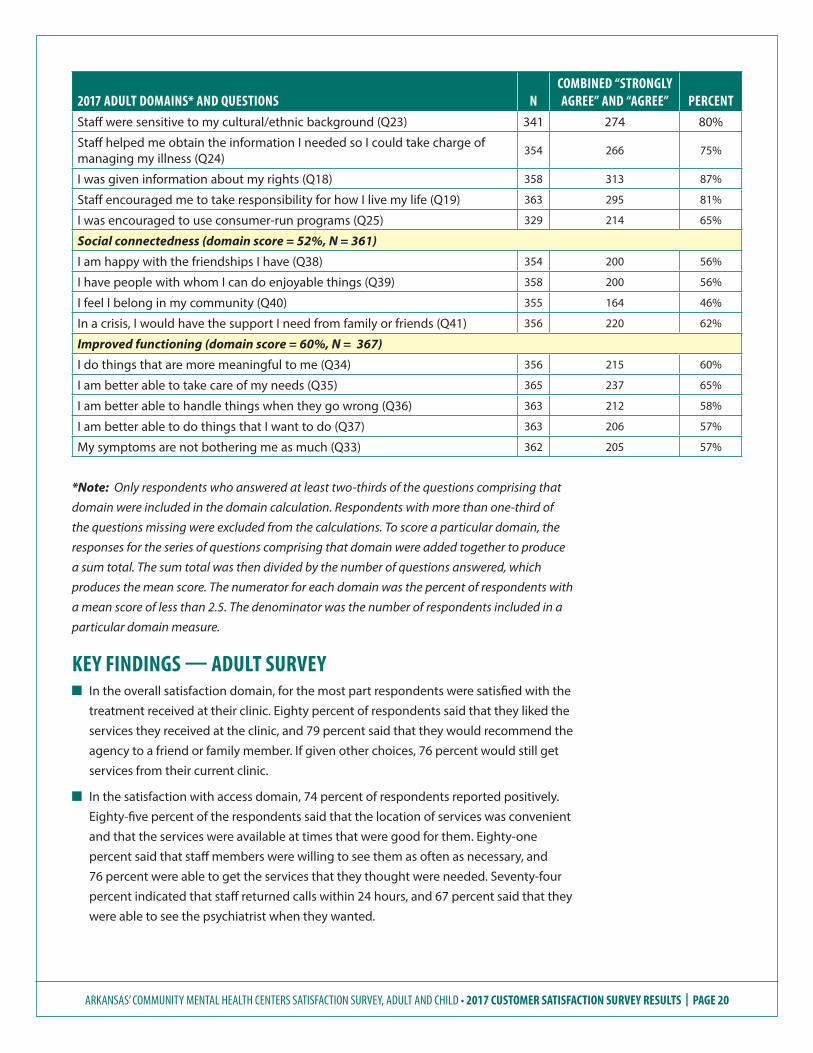
2017 ADULT DOMAINS* AND QUESTIONS NCOMBINED “STRONGLY AGREE” AND “AGREE” PERCENT
Staff were sensitive to my cultural/ethnic background (Q23) 341 274 80%
Staff helped me obtain the information I needed so I could take charge of managing my illness (Q24)
354 266 75%
I was given information about my rights (Q18) 358 313 87%
Staff encouraged me to take responsibility for how I live my life (Q19) 363 295 81%
I was encouraged to use consumer-run programs (Q25) 329 214 65%
Social connectedness (domain score = 52%, N = 361)
I am happy with the friendships I have (Q38) 354 200 56%
I have people with whom I can do enjoyable things (Q39) 358 200 56%
I feel I belong in my community (Q40) 355 164 46%
In a crisis, I would have the support I need from family or friends (Q41) 356 220 62%
Improved functioning (domain score = 60%, N = 367)
I do things that are more meaningful to me (Q34) 356 215 60%
I am better able to take care of my needs (Q35) 365 237 65%
I am better able to handle things when they go wrong (Q36) 363 212 58%
I am better able to do things that I want to do (Q37) 363 206 57%
My symptoms are not bothering me as much (Q33) 362 205 57%
*Note: Only respondents who answered at least two-thirds of the questions comprising that
domain were included in the domain calculation. Respondents with more than one-third of
the questions missing were excluded from the calculations. To score a particular domain, the
responses for the series of questions comprising that domain were added together to produce
a sum total. The sum total was then divided by the number of questions answered, which
produces the mean score. The numerator for each domain was the percent of respondents with
a mean score of less than 2.5. The denominator was the number of respondents included in a
particular domain measure.
KEY FINDINGS — ADULT SURVEY Q In the overall satisfaction domain, for the most part respondents were satisfied with the
treatment received at their clinic. Eighty percent of respondents said that they liked the services they received at the clinic, and 79 percent said that they would recommend the agency to a friend or family member. If given other choices, 76 percent would still get services from their current clinic.
Q In the satisfaction with access domain, 74 percent of respondents reported positively. Eighty-five percent of the respondents said that the location of services was convenient and that the services were available at times that were good for them. Eighty-one percent said that staff members were willing to see them as often as necessary, and 76 percent were able to get the services that they thought were needed. Seventy-four percent indicated that staff returned calls within 24 hours, and 67 percent said that they were able to see the psychiatrist when they wanted.
ARKANSAS’ COMMUNITY MENTAL HEALTH CENTERS SATISFACTION SURVEY, ADULT AND CHILD • 2017 CUSTOMER SATISFACTION SURVEY RESULTS | PAGE 21
Q In the perceptions of outcomes domain, the highest proportion of respondents reporting positively was for the statements that they were more effectively dealing with their daily problems (70%) and were better able to control their life (66%). Sixty-four percent said they were better able to deal with crisis, and 63 percent were getting along better with family. Fifty-nine percent reported doing better in social situations, and 57 percent said their symptoms were not bothering them as much. Less than half (46%) of respondents reported they were doing better in school and/or work, and more than half (50%) reported improved housing situation.
Q Results pertaining to the satisfaction with participation in treatment planning domain received a positive score of 68 percent. While 83 percent of respondents reported they felt comfortable asking questions about their treatment and medication, only 67 percent of respondents said that they, not staff, decided their treatment goals.
Q Regarding the satisfaction with quality and appropriateness domain, the domain score was 78 percent. The highest proportion of respondents reported positively that staff respected their wishes about who is or is not to be given information about their treatment (91%) and that they were given information about their rights (87%). Eighty-one percent said staff encouraged them to take responsibility for how they live their lives, and 80 percent said staff were sensitive to their cultural/ethnic background. More than two-thirds of respondents reported staff believed they could grow, change and recover (76%); were helped by staff to obtain the information needed so they could take charge of managing their illness (75%); felt free to complain (73%); and were told by staff what side effects to watch out for (72%). The lowest proportion of respondents reported they were encouraged to use consumer-run programs (65%).
Q The lowest percentage of respondents (52%) responded positively to the social connectedness domain, with the highest percentage of respondents reporting positively that, in a crisis, they would have the support they needed from family or friends (62%). Fifty-six percent said they were happy with the friendships they have and have people with whom they can do enjoyable things. Only 46 percent feel they belong in their community.
Q In the improved functioning domain, 65 percent reported they were better able to take care of their needs and 60 percent indicated they do things that are meaningful to them. Fifty-eight percent reported being able to handle things when they go wrong. Fifty-seven percent responded that their symptoms were not bothering them as much and that they were better able to do the things they want to do.
ARKANSAS’ COMMUNITY MENTAL HEALTH CENTERS SATISFACTION SURVEY, ADULT AND CHILD • 2017 CUSTOMER SATISFACTION SURVEY RESULTS | PAGE 22
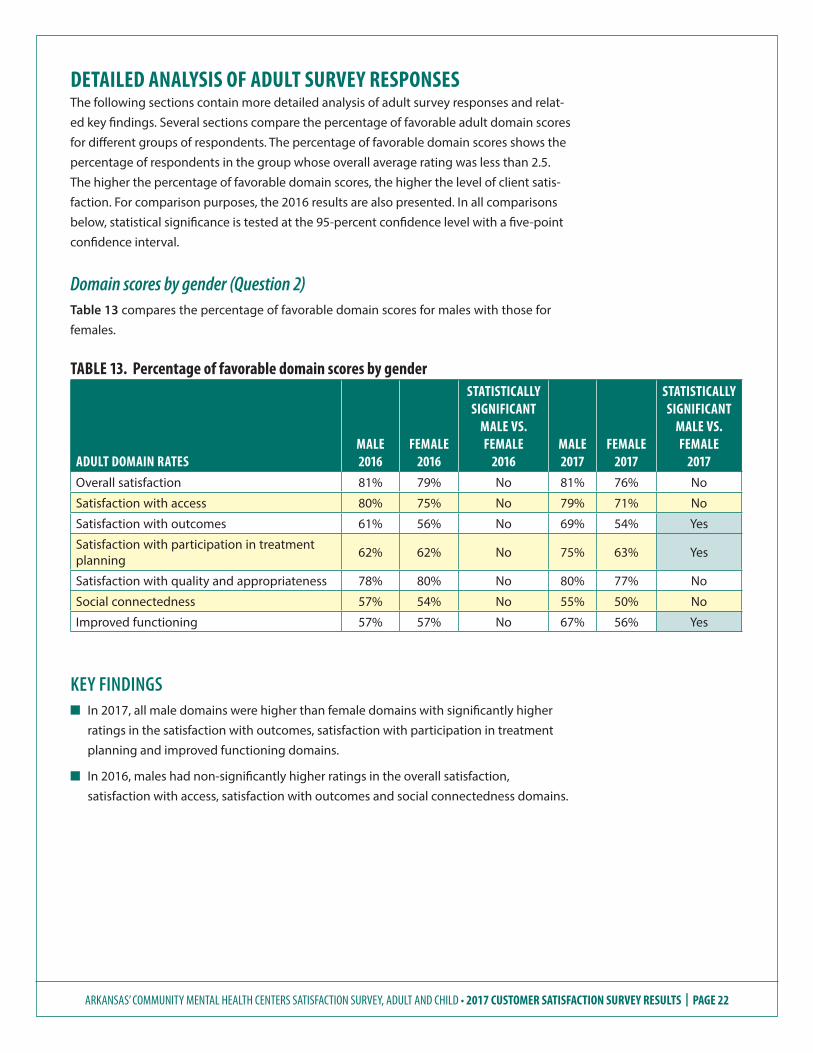
DETAILED ANALYSIS OF ADULT SURVEY RESPONSESThe following sections contain more detailed analysis of adult survey responses and relat-ed key findings. Several sections compare the percentage of favorable adult domain scores for different groups of respondents. The percentage of favorable domain scores shows the percentage of respondents in the group whose overall average rating was less than 2.5. The higher the percentage of favorable domain scores, the higher the level of client satis-faction. For comparison purposes, the 2016 results are also presented. In all comparisons below, statistical significance is tested at the 95-percent confidence level with a five-point confidence interval.
Domain scores by gender (Question 2)Table 13 compares the percentage of favorable domain scores for males with those for females.
TABLE 13. Percentage of favorable domain scores by gender
ADULT DOMAIN RATESMALE 2016
FEMALE 2016
STATISTICALLY SIGNIFICANT
MALE VS. FEMALE
2016MALE 2017
FEMALE 2017
STATISTICALLY SIGNIFICANT
MALE VS. FEMALE
2017Overall satisfaction 81% 79% No 81% 76% No
Satisfaction with access 80% 75% No 79% 71% No
Satisfaction with outcomes 61% 56% No 69% 54% Yes
Satisfaction with participation in treatment planning 62% 62% No 75% 63% Yes
Satisfaction with quality and appropriateness 78% 80% No 80% 77% No
Social connectedness 57% 54% No 55% 50% No
Improved functioning 57% 57% No 67% 56% Yes
KEY FINDINGS n In 2017, all male domains were higher than female domains with significantly higher
ratings in the satisfaction with outcomes, satisfaction with participation in treatment planning and improved functioning domains.
n In 2016, males had non-significantly higher ratings in the overall satisfaction, satisfaction with access, satisfaction with outcomes and social connectedness domains.
ARKANSAS’ COMMUNITY MENTAL HEALTH CENTERS SATISFACTION SURVEY, ADULT AND CHILD • 2017 CUSTOMER SATISFACTION SURVEY RESULTS | PAGE 23
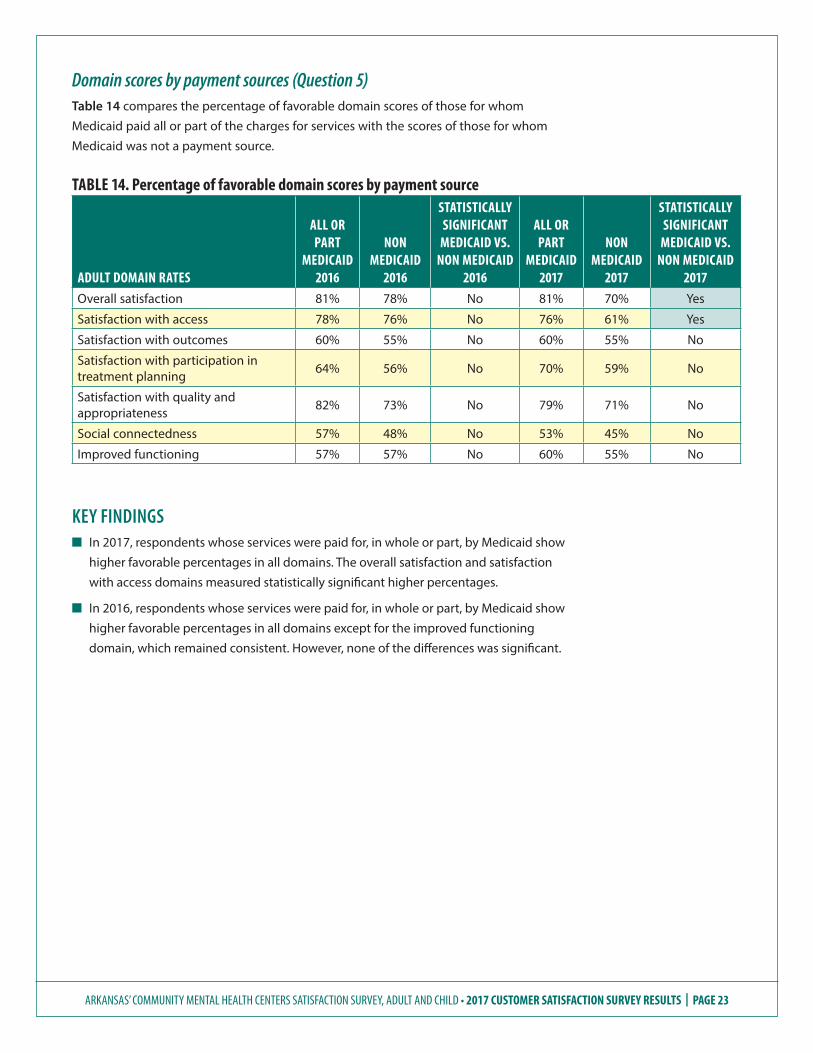
Domain scores by payment sources (Question 5)Table 14 compares the percentage of favorable domain scores of those for whom Medicaid paid all or part of the charges for services with the scores of those for whom Medicaid was not a payment source.
TABLE 14. Percentage of favorable domain scores by payment source
ADULT DOMAIN RATES
ALL OR PART
MEDICAID 2016
NON MEDICAID
2016
STATISTICALLY SIGNIFICANT
MEDICAID VS. NON MEDICAID
2016
ALL OR PART
MEDICAID 2017
NON MEDICAID
2017
STATISTICALLY SIGNIFICANT
MEDICAID VS. NON MEDICAID
2017Overall satisfaction 81% 78% No 81% 70% Yes
Satisfaction with access 78% 76% No 76% 61% Yes
Satisfaction with outcomes 60% 55% No 60% 55% No
Satisfaction with participation in treatment planning 64% 56% No 70% 59% No
Satisfaction with quality and appropriateness 82% 73% No 79% 71% No
Social connectedness 57% 48% No 53% 45% No
Improved functioning 57% 57% No 60% 55% No
KEY FINDINGS n In 2017, respondents whose services were paid for, in whole or part, by Medicaid show
higher favorable percentages in all domains. The overall satisfaction and satisfaction with access domains measured statistically significant higher percentages.
n In 2016, respondents whose services were paid for, in whole or part, by Medicaid show higher favorable percentages in all domains except for the improved functioning domain, which remained consistent. However, none of the differences was significant.
ARKANSAS’ COMMUNITY MENTAL HEALTH CENTERS SATISFACTION SURVEY, ADULT AND CHILD • 2017 CUSTOMER SATISFACTION SURVEY RESULTS | PAGE 24
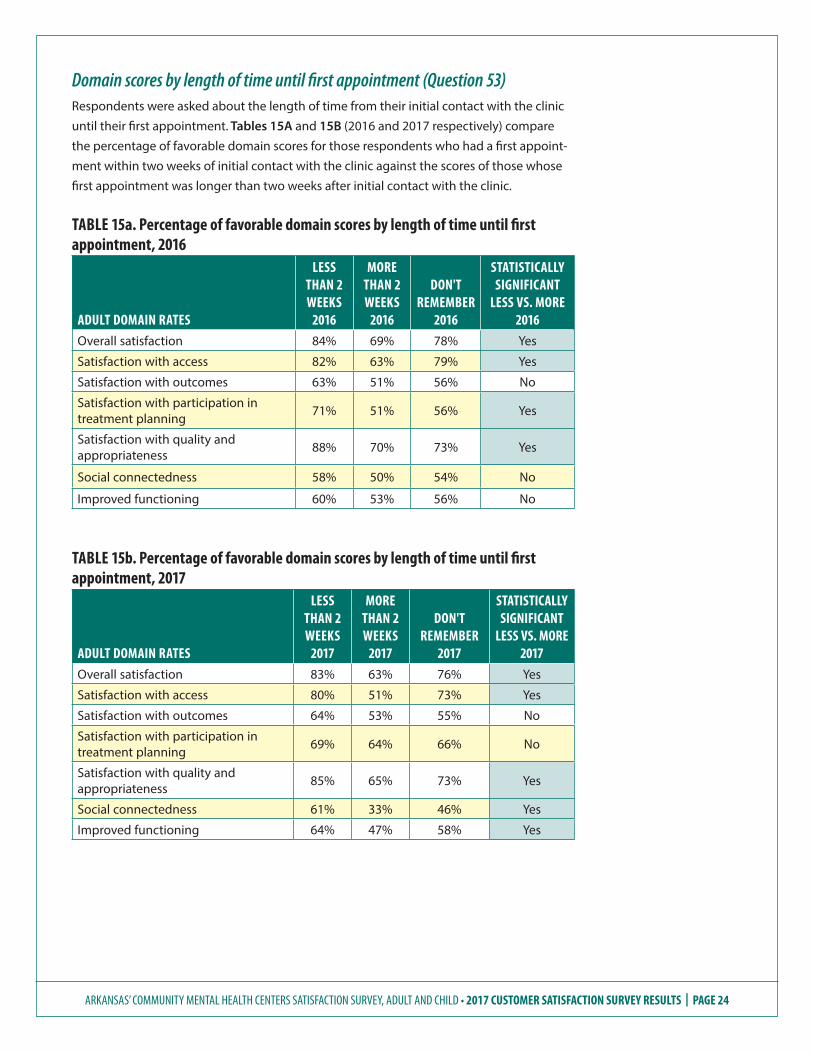
Domain scores by length of time until first appointment (Question 53)Respondents were asked about the length of time from their initial contact with the clinic until their first appointment. Tables 15A and 15B (2016 and 2017 respectively) compare the percentage of favorable domain scores for those respondents who had a first appoint-ment within two weeks of initial contact with the clinic against the scores of those whose first appointment was longer than two weeks after initial contact with the clinic.
TABLE 15a. Percentage of favorable domain scores by length of time until first appointment, 2016
ADULT DOMAIN RATES
LESS THAN 2 WEEKS
2016
MORE THAN 2 WEEKS
2016
DON'T REMEMBER
2016
STATISTICALLY SIGNIFICANT
LESS VS. MORE 2016
Overall satisfaction 84% 69% 78% Yes
Satisfaction with access 82% 63% 79% Yes
Satisfaction with outcomes 63% 51% 56% No
Satisfaction with participation in treatment planning 71% 51% 56% Yes
Satisfaction with quality and appropriateness 88% 70% 73% Yes
Social connectedness 58% 50% 54% No
Improved functioning 60% 53% 56% No
TABLE 15b. Percentage of favorable domain scores by length of time until first appointment, 2017
ADULT DOMAIN RATES
LESS THAN 2 WEEKS
2017
MORE THAN 2 WEEKS
2017
DON'T REMEMBER
2017
STATISTICALLY SIGNIFICANT
LESS VS. MORE 2017
Overall satisfaction 83% 63% 76% Yes
Satisfaction with access 80% 51% 73% Yes
Satisfaction with outcomes 64% 53% 55% No
Satisfaction with participation in treatment planning 69% 64% 66% No
Satisfaction with quality and appropriateness 85% 65% 73% Yes
Social connectedness 61% 33% 46% Yes
Improved functioning 64% 47% 58% Yes
ARKANSAS’ COMMUNITY MENTAL HEALTH CENTERS SATISFACTION SURVEY, ADULT AND CHILD • 2017 CUSTOMER SATISFACTION SURVEY RESULTS | PAGE 25
KEY FINDINGS n Those who indicated they waited less than two weeks for their first appointment in
both 2016 and 2017 showed statistically significant higher percentages in the overall satisfaction, satisfaction with access, and satisfaction with quality and appropriateness domains. In 2017, statistically significant higher percentages were also noted for the social connectedness and improved functioning domains.
n As seen in the response frequency for Question 53 shown in Appendix A, for 2017, 31 percent of the sample could not remember the length of time between their initial contact with the CMHC and their first appointment. Of those who reported remembering, 78 percent reported having the first appointment within two weeks of initial contact, and 8 percent reported a first appointment more than 30 days after the initial contact.
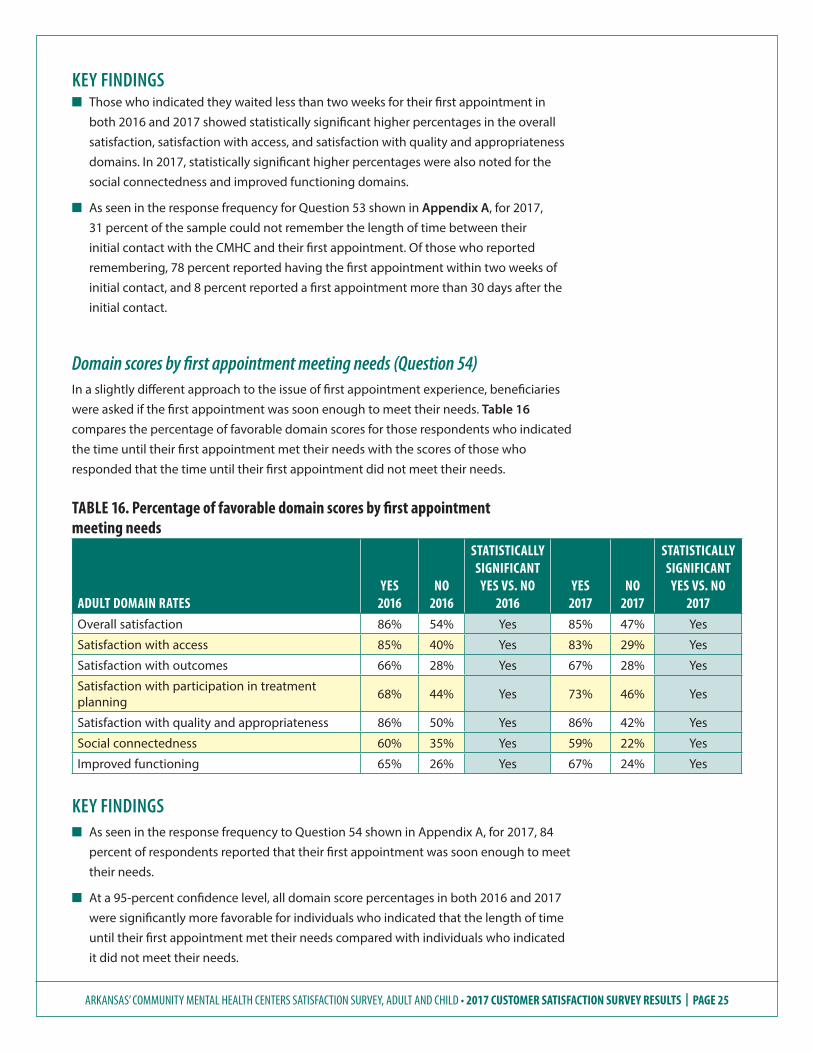
Domain scores by first appointment meeting needs (Question 54)In a slightly different approach to the issue of first appointment experience, beneficiaries were asked if the first appointment was soon enough to meet their needs. Table 16 compares the percentage of favorable domain scores for those respondents who indicated the time until their first appointment met their needs with the scores of those who responded that the time until their first appointment did not meet their needs.
TABLE 16. Percentage of favorable domain scores by first appointment meeting needs
ADULT DOMAIN RATESYES
2016NO
2016
STATISTICALLY SIGNIFICANT
YES VS. NO 2016
YES2017
NO 2017
STATISTICALLY SIGNIFICANT
YES VS. NO 2017
Overall satisfaction 86% 54% Yes 85% 47% Yes
Satisfaction with access 85% 40% Yes 83% 29% Yes
Satisfaction with outcomes 66% 28% Yes 67% 28% Yes
Satisfaction with participation in treatment planning 68% 44% Yes 73% 46% Yes
Satisfaction with quality and appropriateness 86% 50% Yes 86% 42% Yes
Social connectedness 60% 35% Yes 59% 22% Yes
Improved functioning 65% 26% Yes 67% 24% Yes
KEY FINDINGS n As seen in the response frequency to Question 54 shown in Appendix A, for 2017, 84
percent of respondents reported that their first appointment was soon enough to meet their needs.
n At a 95-percent confidence level, all domain score percentages in both 2016 and 2017 were significantly more favorable for individuals who indicated that the length of time until their first appointment met their needs compared with individuals who indicated it did not meet their needs.
ARKANSAS’ COMMUNITY MENTAL HEALTH CENTERS SATISFACTION SURVEY, ADULT AND CHILD • 2017 CUSTOMER SATISFACTION SURVEY RESULTS | PAGE 26
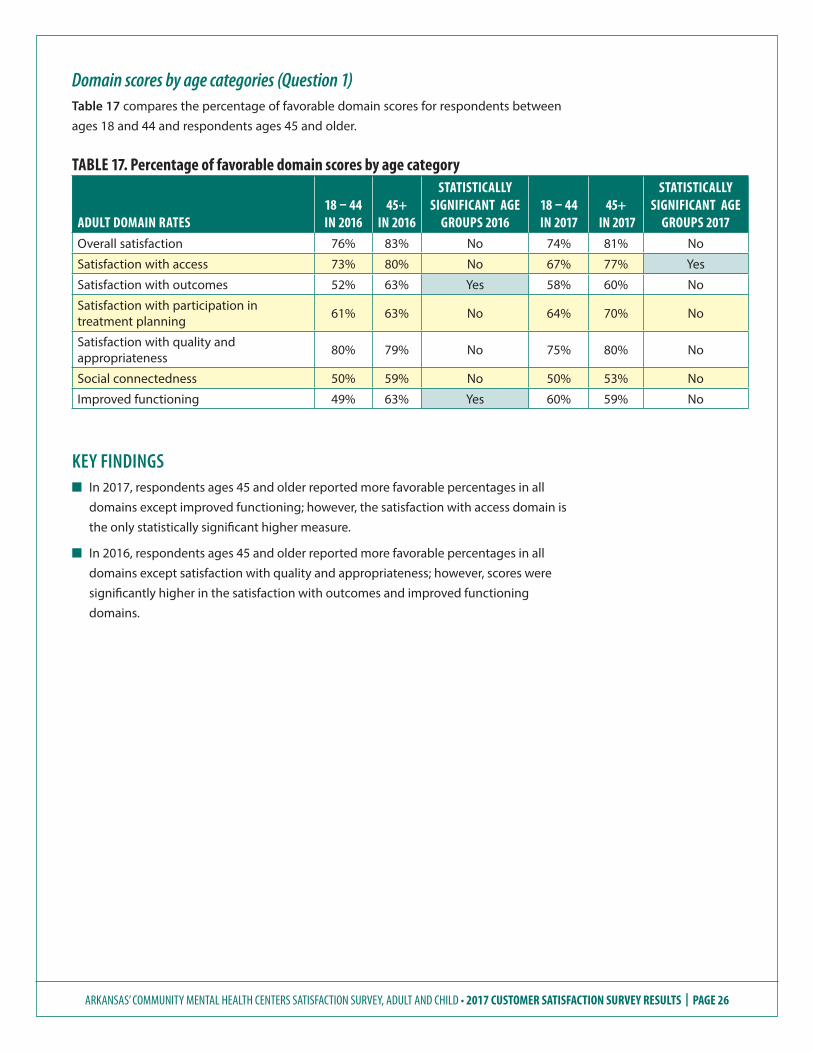
Domain scores by age categories (Question 1)Table 17 compares the percentage of favorable domain scores for respondents between ages 18 and 44 and respondents ages 45 and older.
TABLE 17. Percentage of favorable domain scores by age category
ADULT DOMAIN RATES18 – 44 IN 2016
45+ IN 2016
STATISTICALLY SIGNIFICANT AGE
GROUPS 201618 – 44 IN 2017
45+ IN 2017
STATISTICALLY SIGNIFICANT AGE
GROUPS 2017Overall satisfaction 76% 83% No 74% 81% No
Satisfaction with access 73% 80% No 67% 77% Yes
Satisfaction with outcomes 52% 63% Yes 58% 60% No
Satisfaction with participation in treatment planning 61% 63% No 64% 70% No
Satisfaction with quality and appropriateness 80% 79% No 75% 80% No
Social connectedness 50% 59% No 50% 53% No
Improved functioning 49% 63% Yes 60% 59% No
KEY FINDINGS n In 2017, respondents ages 45 and older reported more favorable percentages in all
domains except improved functioning; however, the satisfaction with access domain is the only statistically significant higher measure.
n In 2016, respondents ages 45 and older reported more favorable percentages in all domains except satisfaction with quality and appropriateness; however, scores were significantly higher in the satisfaction with outcomes and improved functioning domains.

ARKANSAS’ COMMUNITY MENTAL HEALTH CENTERS SATISFACTION SURVEY, ADULT AND CHILD • 2017 CUSTOMER SATISFACTION SURVEY RESULTS | PAGE 27
Domain scores by race categories (Question 4)Table 18 compares the percentage of favorable domain scores for white respondents with those of minority respondents.
TABLE 18. Percentage of favorable domain scores by race categories
ADULT DOMAIN RATESWHITE
2016
MINORITY*
2016
STATISTICALLY SIGNIFICANT
WHITE VS. MINORITY
2016WHITE
2017
MINORITY*
2017
STATISTICALLY SIGNIFICANT
WHITE VS. MINORITY
2017Overall satisfaction 78% 83% No 76% 82% No
Satisfaction with access 75% 81% No 72% 77% No
Satisfaction with outcomes 57% 63% No 59% 60% No
Satisfaction with participation in treatment planning 61% 65% No 64% 76% Yes
Satisfaction with quality and appropriateness 78% 81% No 78% 78% No
Social connectedness 52% 65% Yes 53% 50% No
Improved functioning 57% 58% No 61% 57% No
* Minority category includes multiracial
KEY FINDINGS n In 2017, minorities reported a statistically significant favorable percentage in the
satisfaction with participation in treatment planning domain.
n In 2016, minorities reported a significantly more favorable percentage in the social connectedness domain.
ARKANSAS’ COMMUNITY MENTAL HEALTH CENTERS SATISFACTION SURVEY, ADULT AND CHILD • 2017 CUSTOMER SATISFACTION SURVEY RESULTS | PAGE 28
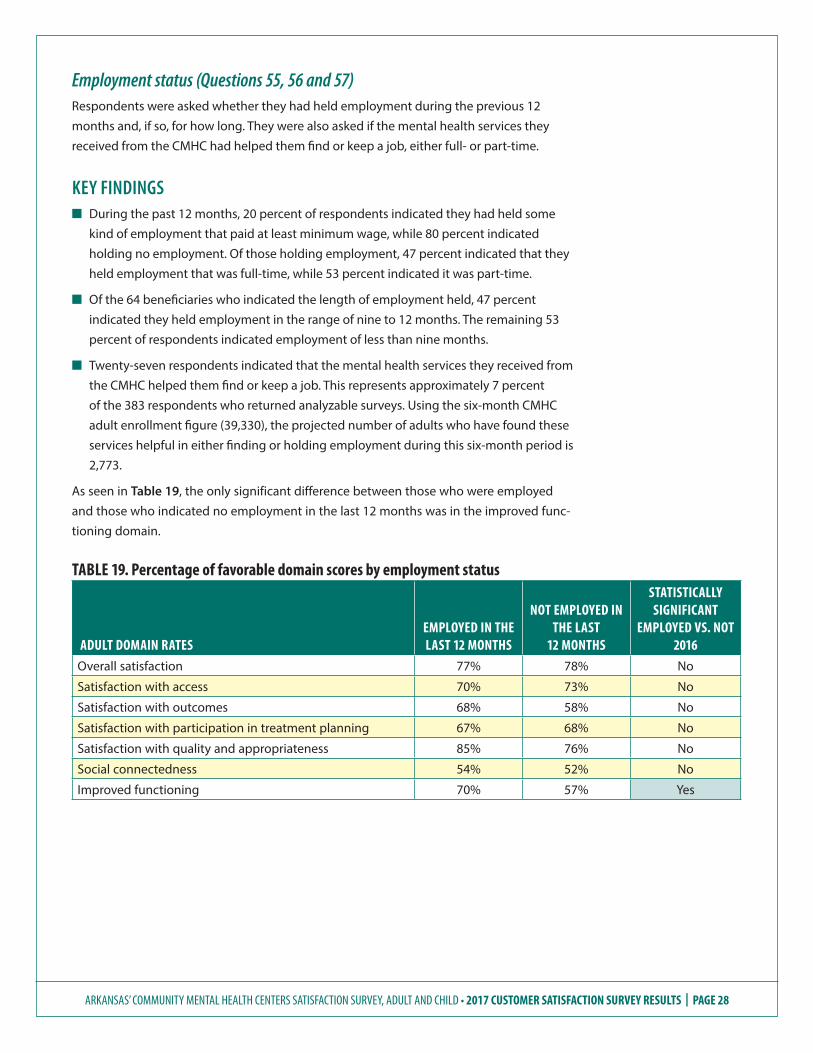
Employment status (Questions 55, 56 and 57)Respondents were asked whether they had held employment during the previous 12 months and, if so, for how long. They were also asked if the mental health services they received from the CMHC had helped them find or keep a job, either full- or part-time.
KEY FINDINGS n During the past 12 months, 20 percent of respondents indicated they had held some
kind of employment that paid at least minimum wage, while 80 percent indicated holding no employment. Of those holding employment, 47 percent indicated that they held employment that was full-time, while 53 percent indicated it was part-time.
n Of the 64 beneficiaries who indicated the length of employment held, 47 percent indicated they held employment in the range of nine to 12 months. The remaining 53 percent of respondents indicated employment of less than nine months.
n Twenty-seven respondents indicated that the mental health services they received from the CMHC helped them find or keep a job. This represents approximately 7 percent of the 383 respondents who returned analyzable surveys. Using the six-month CMHC adult enrollment figure (39,330), the projected number of adults who have found these services helpful in either finding or holding employment during this six-month period is 2,773.
As seen in Table 19, the only significant difference between those who were employed and those who indicated no employment in the last 12 months was in the improved func-tioning domain.
TABLE 19. Percentage of favorable domain scores by employment status
ADULT DOMAIN RATESEMPLOYED IN THE LAST 12 MONTHS
NOT EMPLOYED IN THE LAST
12 MONTHS
STATISTICALLY SIGNIFICANT
EMPLOYED VS. NOT2016
Overall satisfaction 77% 78% No
Satisfaction with access 70% 73% No
Satisfaction with outcomes 68% 58% No
Satisfaction with participation in treatment planning 67% 68% No
Satisfaction with quality and appropriateness 85% 76% No
Social connectedness 54% 52% No
Improved functioning 70% 57% Yes
ARKANSAS’ COMMUNITY MENTAL HEALTH CENTERS SATISFACTION SURVEY, ADULT AND CHILD • 2017 CUSTOMER SATISFACTION SURVEY RESULTS | PAGE 29
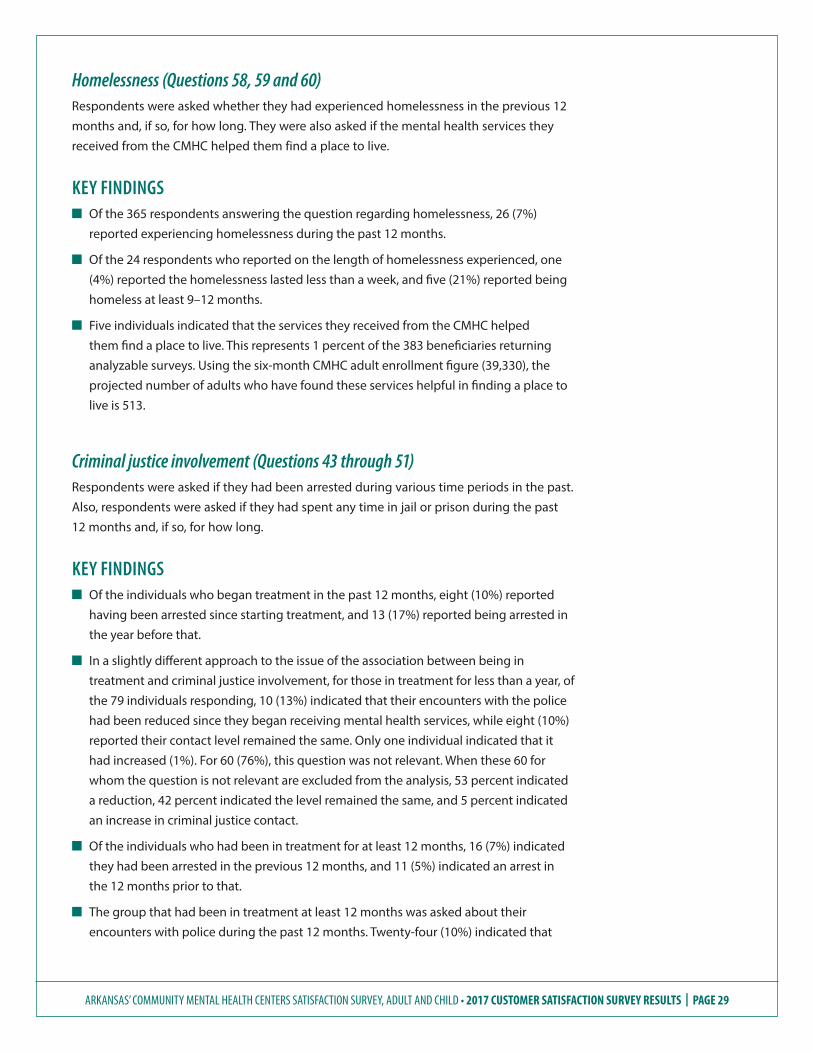
Homelessness (Questions 58, 59 and 60)Respondents were asked whether they had experienced homelessness in the previous 12 months and, if so, for how long. They were also asked if the mental health services they received from the CMHC helped them find a place to live.
KEY FINDINGS Q Of the 365 respondents answering the question regarding homelessness, 26 (7%)
reported experiencing homelessness during the past 12 months.
Q Of the 24 respondents who reported on the length of homelessness experienced, one (4%) reported the homelessness lasted less than a week, and five (21%) reported being homeless at least 9–12 months.
Q Five individuals indicated that the services they received from the CMHC helped them find a place to live. This represents 1 percent of the 383 beneficiaries returning analyzable surveys. Using the six-month CMHC adult enrollment figure (39,330), the projected number of adults who have found these services helpful in finding a place to live is 513.
Criminal justice involvement (Questions 43 through 51)Respondents were asked if they had been arrested during various time periods in the past. Also, respondents were asked if they had spent any time in jail or prison during the past 12 months and, if so, for how long.
KEY FINDINGS Q Of the individuals who began treatment in the past 12 months, eight (10%) reported
having been arrested since starting treatment, and 13 (17%) reported being arrested in the year before that.
Q In a slightly different approach to the issue of the association between being in treatment and criminal justice involvement, for those in treatment for less than a year, of the 79 individuals responding, 10 (13%) indicated that their encounters with the police had been reduced since they began receiving mental health services, while eight (10%) reported their contact level remained the same. Only one individual indicated that it had increased (1%). For 60 (76%), this question was not relevant. When these 60 for whom the question is not relevant are excluded from the analysis, 53 percent indicated a reduction, 42 percent indicated the level remained the same, and 5 percent indicated an increase in criminal justice contact.
Q Of the individuals who had been in treatment for at least 12 months, 16 (7%) indicated they had been arrested in the previous 12 months, and 11 (5%) indicated an arrest in the 12 months prior to that.
Q The group that had been in treatment at least 12 months was asked about their encounters with police during the past 12 months. Twenty-four (10%) indicated that
ARKANSAS’ COMMUNITY MENTAL HEALTH CENTERS SATISFACTION SURVEY, ADULT AND CHILD • 2017 CUSTOMER SATISFACTION SURVEY RESULTS | PAGE 30
contact had been reduced, 17 (7%) indicated it had remained the same, eight (3%) indicated it had increased and 188 (79%) indicated the question was not applicable to them. When these 188 for whom the question is not applicable are excluded from the analysis, 49 percent indicated a reduction in criminal justice contact, 35 percent indicated the level remained the same and 16 percent indicated an increase.
Q Overall, 27 (7%) respondents indicated that they had spent time in jail in the past 12 months. Of the 24 indicating length of imprisonment, five (21%) indicated the time in jail was less than 24 hours, while four (17%) indicated the time in jail ranged between four and 12 months. The 24 individuals also represent 6 percent of the 383 beneficiaries returning analyzable surveys. Using the six-month CMHC adult enrollment figure (39,330), the projected number of adults in that group who had spent time in jail during the previous year was 2,465.
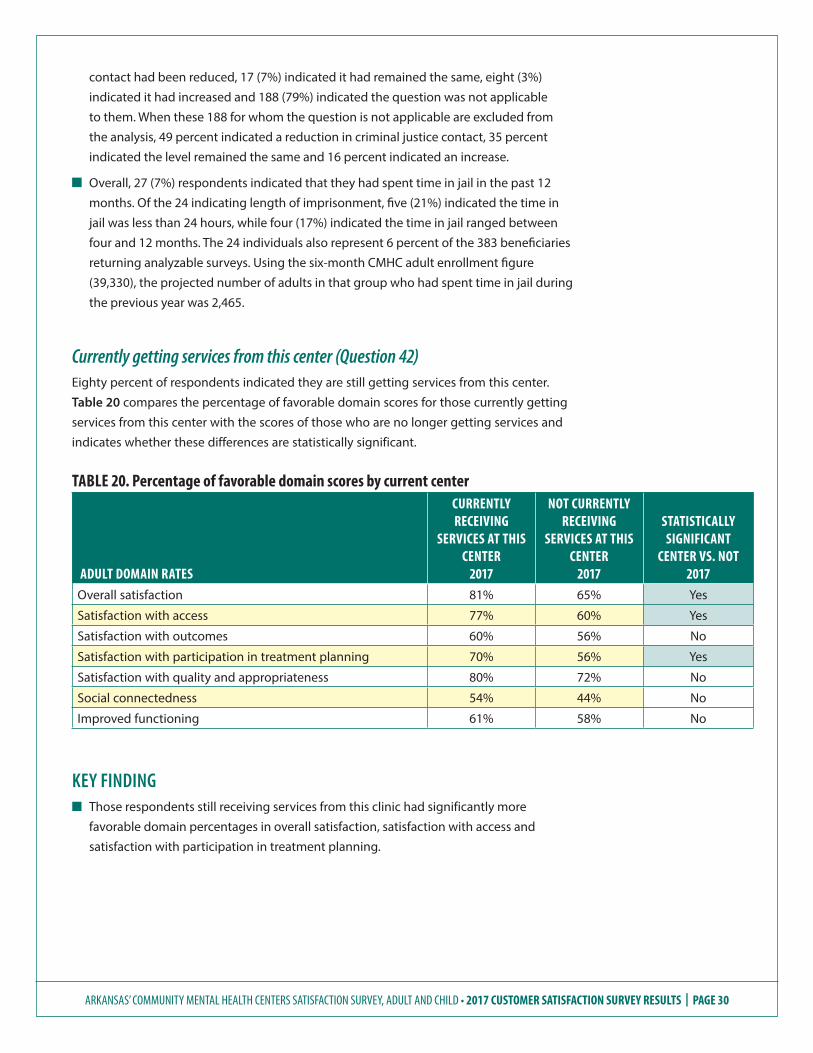
Currently getting services from this center (Question 42)Eighty percent of respondents indicated they are still getting services from this center. Table 20 compares the percentage of favorable domain scores for those currently getting services from this center with the scores of those who are no longer getting services and indicates whether these differences are statistically significant.
TABLE 20. Percentage of favorable domain scores by current center
ADULT DOMAIN RATES
CURRENTLY RECEIVING
SERVICES AT THIS CENTER
2017
NOT CURRENTLY RECEIVING
SERVICES AT THIS CENTER
2017
STATISTICALLY SIGNIFICANT
CENTER VS. NOT 2017
Overall satisfaction 81% 65% Yes
Satisfaction with access 77% 60% Yes
Satisfaction with outcomes 60% 56% No
Satisfaction with participation in treatment planning 70% 56% Yes
Satisfaction with quality and appropriateness 80% 72% No
Social connectedness 54% 44% No
Improved functioning 61% 58% No
KEY FINDING n Those respondents still receiving services from this clinic had significantly more
favorable domain percentages in overall satisfaction, satisfaction with access and satisfaction with participation in treatment planning.
ARKANSAS’ COMMUNITY MENTAL HEALTH CENTERS SATISFACTION SURVEY, ADULT AND CHILD • 2017 CUSTOMER SATISFACTION SURVEY RESULTS | PAGE 31
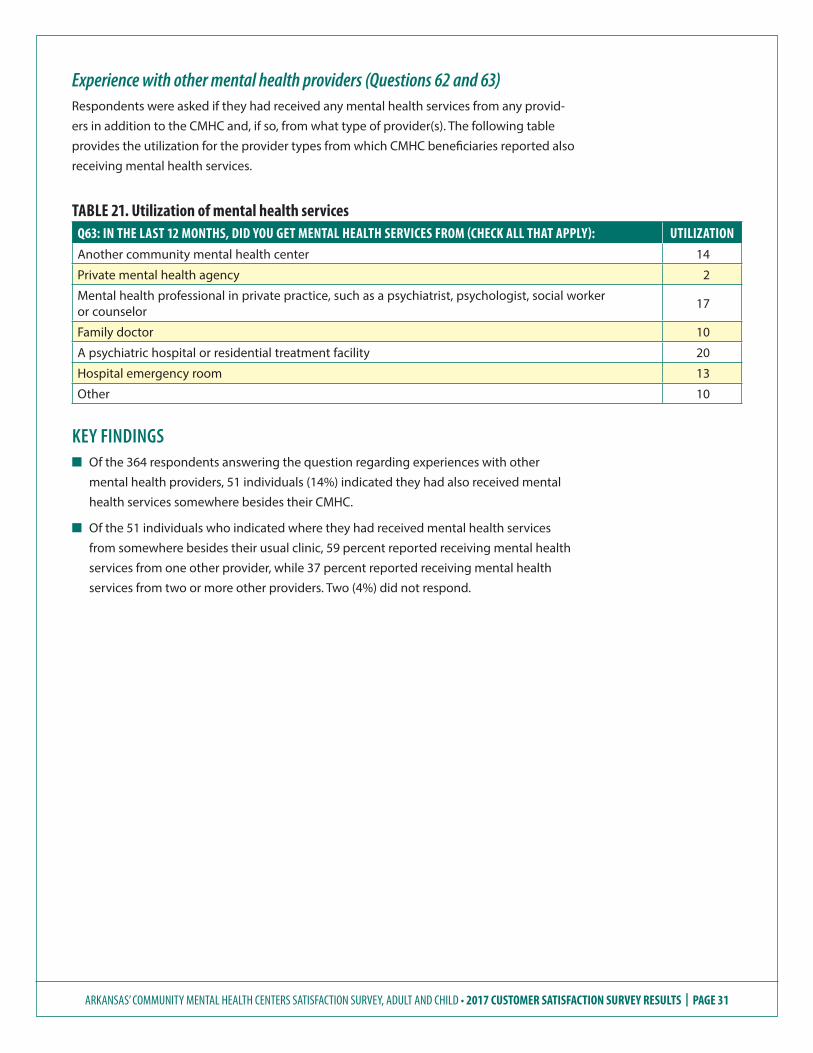
Experience with other mental health providers (Questions 62 and 63)Respondents were asked if they had received any mental health services from any provid-ers in addition to the CMHC and, if so, from what type of provider(s). The following table provides the utilization for the provider types from which CMHC beneficiaries reported also receiving mental health services.
TABLE 21. Utilization of mental health servicesQ63: IN THE LAST 12 MONTHS, DID YOU GET MENTAL HEALTH SERVICES FROM (CHECK ALL THAT APPLY): UTILIZATIONAnother community mental health center 14
Private mental health agency 2
Mental health professional in private practice, such as a psychiatrist, psychologist, social workeror counselor 17
Family doctor 10
A psychiatric hospital or residential treatment facility 20
Hospital emergency room 13
Other 10
KEY FINDINGS n Of the 364 respondents answering the question regarding experiences with other
mental health providers, 51 individuals (14%) indicated they had also received mental health services somewhere besides their CMHC.
n Of the 51 individuals who indicated where they had received mental health services from somewhere besides their usual clinic, 59 percent reported receiving mental health services from one other provider, while 37 percent reported receiving mental health services from two or more other providers. Two (4%) did not respond.
ARKANSAS’ COMMUNITY MENTAL HEALTH CENTERS SATISFACTION SURVEY, ADULT AND CHILD • 2017 CUSTOMER SATISFACTION SURVEY RESULTS | PAGE 32
THIS PAGE INTENTIONALLY LEFT BLANK
ARKANSAS’ COMMUNITY MENTAL HEALTH CENTERS SATISFACTION SURVEY, ADULT AND CHILD • 2017 CUSTOMER SATISFACTION SURVEY RESULTS | PAGE 33
CHILD/ADOLESCENT DOMAIN QUESTIONS ANALYSIS
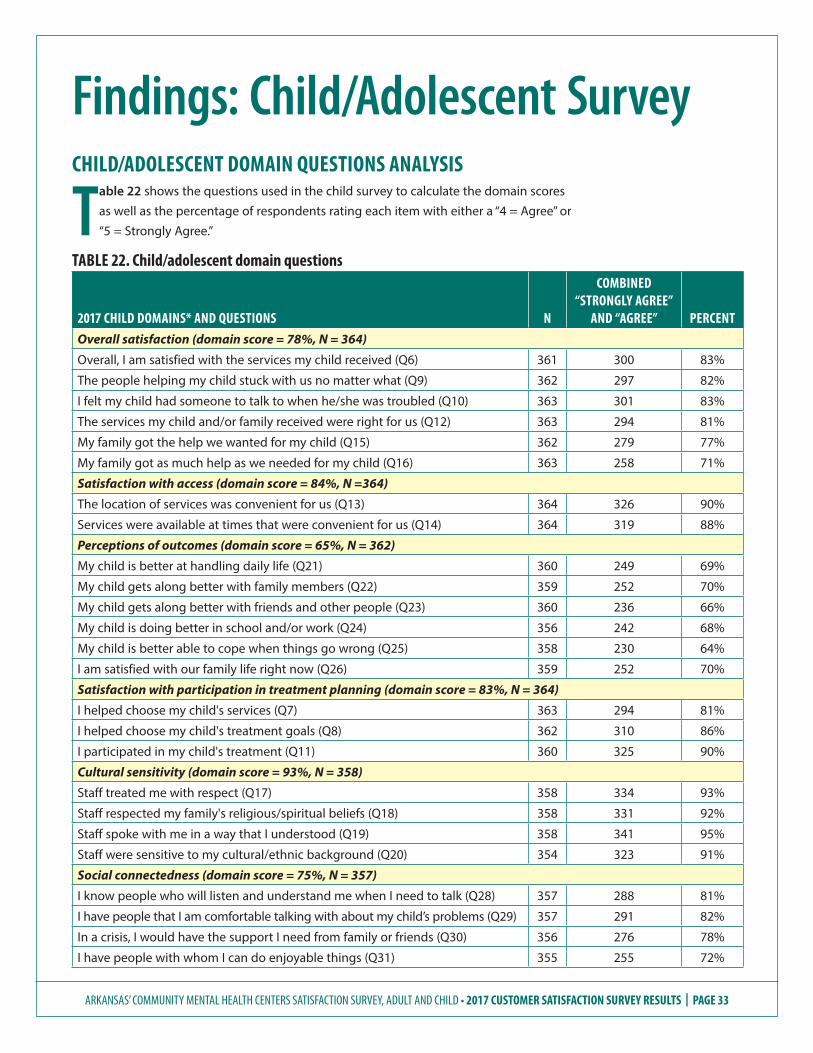
Table 22 shows the questions used in the child survey to calculate the domain scores as well as the percentage of respondents rating each item with either a “4 = Agree” or “5 = Strongly Agree.”
TABLE 22. Child/adolescent domain questions
2017 CHILD DOMAINS* AND QUESTIONS N
COMBINED “STRONGLY AGREE”
AND “AGREE” PERCENTOverall satisfaction (domain score = 78%, N = 364)
Overall, I am satisfied with the services my child received (Q6) 361 300 83%
The people helping my child stuck with us no matter what (Q9) 362 297 82%
I felt my child had someone to talk to when he/she was troubled (Q10) 363 301 83%
The services my child and/or family received were right for us (Q12) 363 294 81%
My family got the help we wanted for my child (Q15) 362 279 77%
My family got as much help as we needed for my child (Q16) 363 258 71%
Satisfaction with access (domain score = 84%, N =364)
The location of services was convenient for us (Q13) 364 326 90%
Services were available at times that were convenient for us (Q14) 364 319 88%
Perceptions of outcomes (domain score = 65%, N = 362)
My child is better at handling daily life (Q21) 360 249 69%
My child gets along better with family members (Q22) 359 252 70%
My child gets along better with friends and other people (Q23) 360 236 66%
My child is doing better in school and/or work (Q24) 356 242 68%
My child is better able to cope when things go wrong (Q25) 358 230 64%
I am satisfied with our family life right now (Q26) 359 252 70%
Satisfaction with participation in treatment planning (domain score = 83%, N = 364)
I helped choose my child's services (Q7) 363 294 81%
I helped choose my child's treatment goals (Q8) 362 310 86%
I participated in my child's treatment (Q11) 360 325 90%
Cultural sensitivity (domain score = 93%, N = 358)
Staff treated me with respect (Q17) 358 334 93%
Staff respected my family's religious/spiritual beliefs (Q18) 358 331 92%
Staff spoke with me in a way that I understood (Q19) 358 341 95%
Staff were sensitive to my cultural/ethnic background (Q20) 354 323 91%
Social connectedness (domain score = 75%, N = 357)
I know people who will listen and understand me when I need to talk (Q28) 357 288 81%
I have people that I am comfortable talking with about my child’s problems (Q29) 357 291 82%
In a crisis, I would have the support I need from family or friends (Q30) 356 276 78%
I have people with whom I can do enjoyable things (Q31) 355 255 72%
Findings: Child/Adolescent Survey
ARKANSAS’ COMMUNITY MENTAL HEALTH CENTERS SATISFACTION SURVEY, ADULT AND CHILD • 2017 CUSTOMER SATISFACTION SURVEY RESULTS | PAGE 34
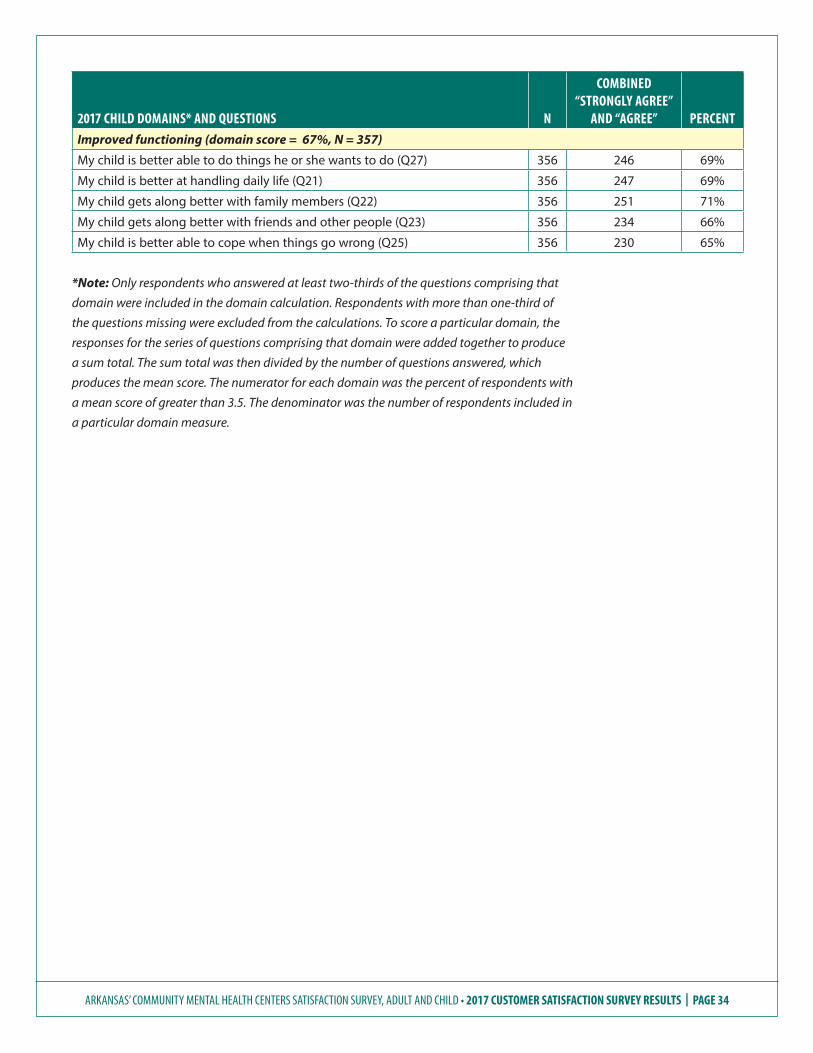
2017 CHILD DOMAINS* AND QUESTIONS N
COMBINED “STRONGLY AGREE”
AND “AGREE” PERCENTImproved functioning (domain score = 67%, N = 357)
My child is better able to do things he or she wants to do (Q27) 356 246 69%
My child is better at handling daily life (Q21) 356 247 69%
My child gets along better with family members (Q22) 356 251 71%
My child gets along better with friends and other people (Q23) 356 234 66%
My child is better able to cope when things go wrong (Q25) 356 230 65%
*Note: Only respondents who answered at least two-thirds of the questions comprising that
domain were included in the domain calculation. Respondents with more than one-third of
the questions missing were excluded from the calculations. To score a particular domain, the
responses for the series of questions comprising that domain were added together to produce
a sum total. The sum total was then divided by the number of questions answered, which
produces the mean score. The numerator for each domain was the percent of respondents with
a mean score of greater than 3.5. The denominator was the number of respondents included in
a particular domain measure.
ARKANSAS’ COMMUNITY MENTAL HEALTH CENTERS SATISFACTION SURVEY, ADULT AND CHILD • 2017 CUSTOMER SATISFACTION SURVEY RESULTS | PAGE 35
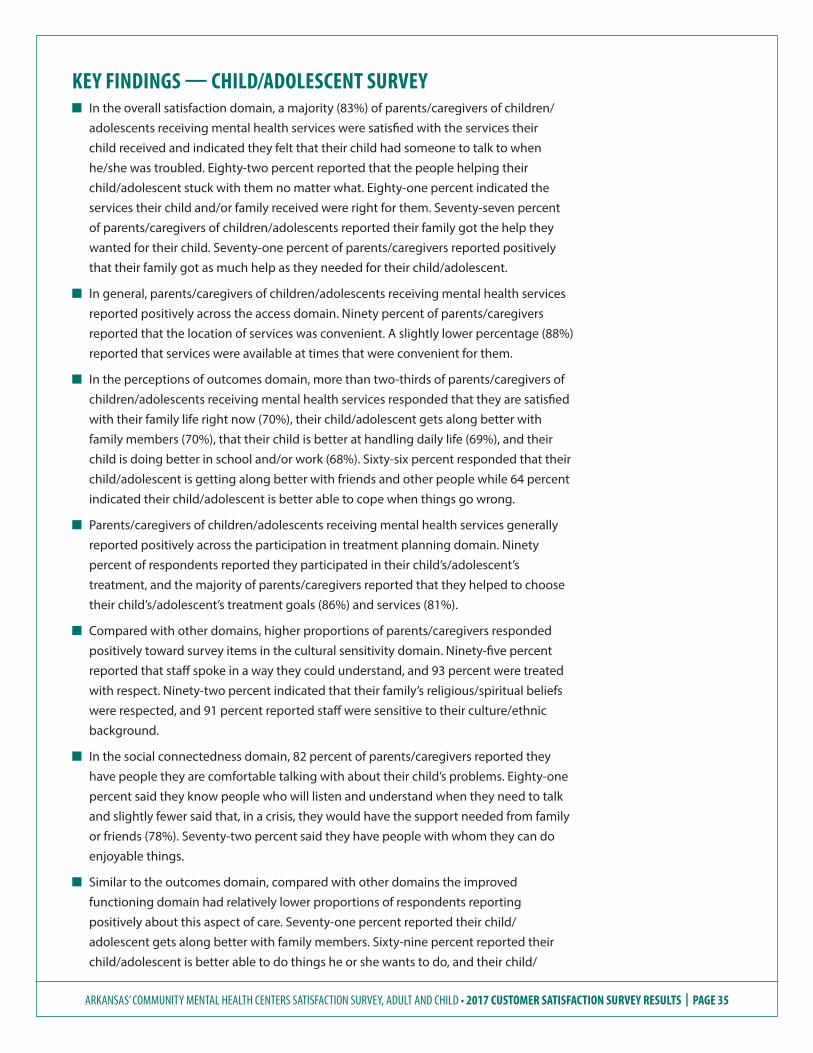
KEY FINDINGS — CHILD/ADOLESCENT SURVEY n In the overall satisfaction domain, a majority (83%) of parents/caregivers of children/
adolescents receiving mental health services were satisfied with the services their child received and indicated they felt that their child had someone to talk to when he/she was troubled. Eighty-two percent reported that the people helping their child/adolescent stuck with them no matter what. Eighty-one percent indicated the services their child and/or family received were right for them. Seventy-seven percent of parents/caregivers of children/adolescents reported their family got the help they wanted for their child. Seventy-one percent of parents/caregivers reported positively that their family got as much help as they needed for their child/adolescent.
n In general, parents/caregivers of children/adolescents receiving mental health services reported positively across the access domain. Ninety percent of parents/caregivers reported that the location of services was convenient. A slightly lower percentage (88%) reported that services were available at times that were convenient for them.
n In the perceptions of outcomes domain, more than two-thirds of parents/caregivers of children/adolescents receiving mental health services responded that they are satisfied with their family life right now (70%), their child/adolescent gets along better with family members (70%), that their child is better at handling daily life (69%), and their child is doing better in school and/or work (68%). Sixty-six percent responded that their child/adolescent is getting along better with friends and other people while 64 percent indicated their child/adolescent is better able to cope when things go wrong.
n Parents/caregivers of children/adolescents receiving mental health services generally reported positively across the participation in treatment planning domain. Ninety percent of respondents reported they participated in their child’s/adolescent’s treatment, and the majority of parents/caregivers reported that they helped to choose their child’s/adolescent’s treatment goals (86%) and services (81%).
n Compared with other domains, higher proportions of parents/caregivers responded positively toward survey items in the cultural sensitivity domain. Ninety-five percent reported that staff spoke in a way they could understand, and 93 percent were treated with respect. Ninety-two percent indicated that their family’s religious/spiritual beliefs were respected, and 91 percent reported staff were sensitive to their culture/ethnic background.
n In the social connectedness domain, 82 percent of parents/caregivers reported they have people they are comfortable talking with about their child’s problems. Eighty-one percent said they know people who will listen and understand when they need to talk and slightly fewer said that, in a crisis, they would have the support needed from family or friends (78%). Seventy-two percent said they have people with whom they can do enjoyable things.
n Similar to the outcomes domain, compared with other domains the improved functioning domain had relatively lower proportions of respondents reporting positively about this aspect of care. Seventy-one percent reported their child/adolescent gets along better with family members. Sixty-nine percent reported their child/adolescent is better able to do things he or she wants to do, and their child/
ARKANSAS’ COMMUNITY MENTAL HEALTH CENTERS SATISFACTION SURVEY, ADULT AND CHILD • 2017 CUSTOMER SATISFACTION SURVEY RESULTS | PAGE 36
adolescent is better at handling daily life. Sixty-six percent reported getting along better with friends and other people. Sixty-five percent of parents/caregivers reported their child is better able to cope when things go wrong.
DETAILED ANALYSIS OF CHILD/ADOLESCENT SURVEY RESPONSESThe following sections contain more detailed analysis of parent/caregiver survey responses and related key findings. Several sections compare percent favorable child/adolescent domain scores for different groups of respondents. The percentage of favorable domain scores shows the percentage of respondents in the group whose overall average rating was more than 3.5. The higher the percentage of favorable domain scores, the higher the level of client satisfaction. For comparison purposes, the 2016 results are also presented. In all comparisons below statistical significance is tested at the 95 percent confidence level with a five-point confidence interval.
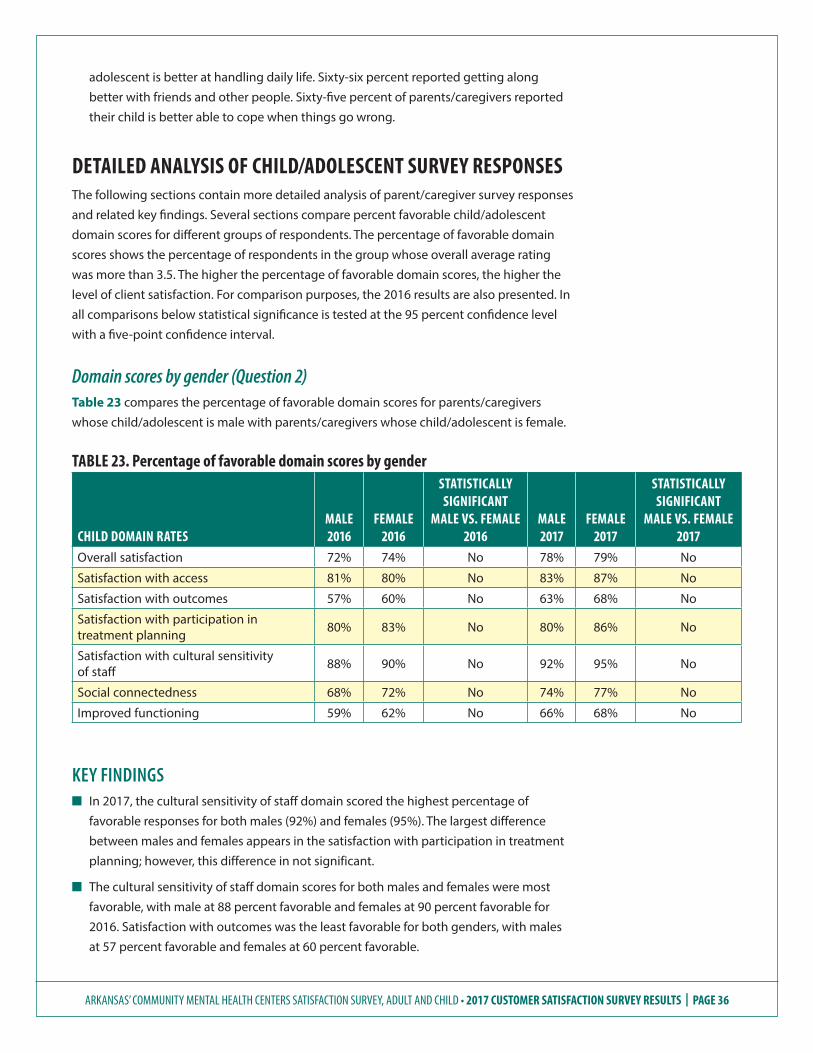
Domain scores by gender (Question 2)Table 23 compares the percentage of favorable domain scores for parents/caregivers whose child/adolescent is male with parents/caregivers whose child/adolescent is female.
TABLE 23. Percentage of favorable domain scores by gender
CHILD DOMAIN RATESMALE 2016
FEMALE 2016
STATISTICALLY SIGNIFICANT
MALE VS. FEMALE 2016
MALE 2017
FEMALE 2017
STATISTICALLY SIGNIFICANT
MALE VS. FEMALE 2017
Overall satisfaction 72% 74% No 78% 79% No
Satisfaction with access 81% 80% No 83% 87% No
Satisfaction with outcomes 57% 60% No 63% 68% No
Satisfaction with participation in treatment planning 80% 83% No 80% 86% No
Satisfaction with cultural sensitivityof staff 88% 90% No 92% 95% No
Social connectedness 68% 72% No 74% 77% No
Improved functioning 59% 62% No 66% 68% No
KEY FINDINGS n In 2017, the cultural sensitivity of staff domain scored the highest percentage of
favorable responses for both males (92%) and females (95%). The largest difference between males and females appears in the satisfaction with participation in treatment planning; however, this difference in not significant.
n The cultural sensitivity of staff domain scores for both males and females were most favorable, with male at 88 percent favorable and females at 90 percent favorable for 2016. Satisfaction with outcomes was the least favorable for both genders, with males at 57 percent favorable and females at 60 percent favorable.
ARKANSAS’ COMMUNITY MENTAL HEALTH CENTERS SATISFACTION SURVEY, ADULT AND CHILD • 2017 CUSTOMER SATISFACTION SURVEY RESULTS | PAGE 37
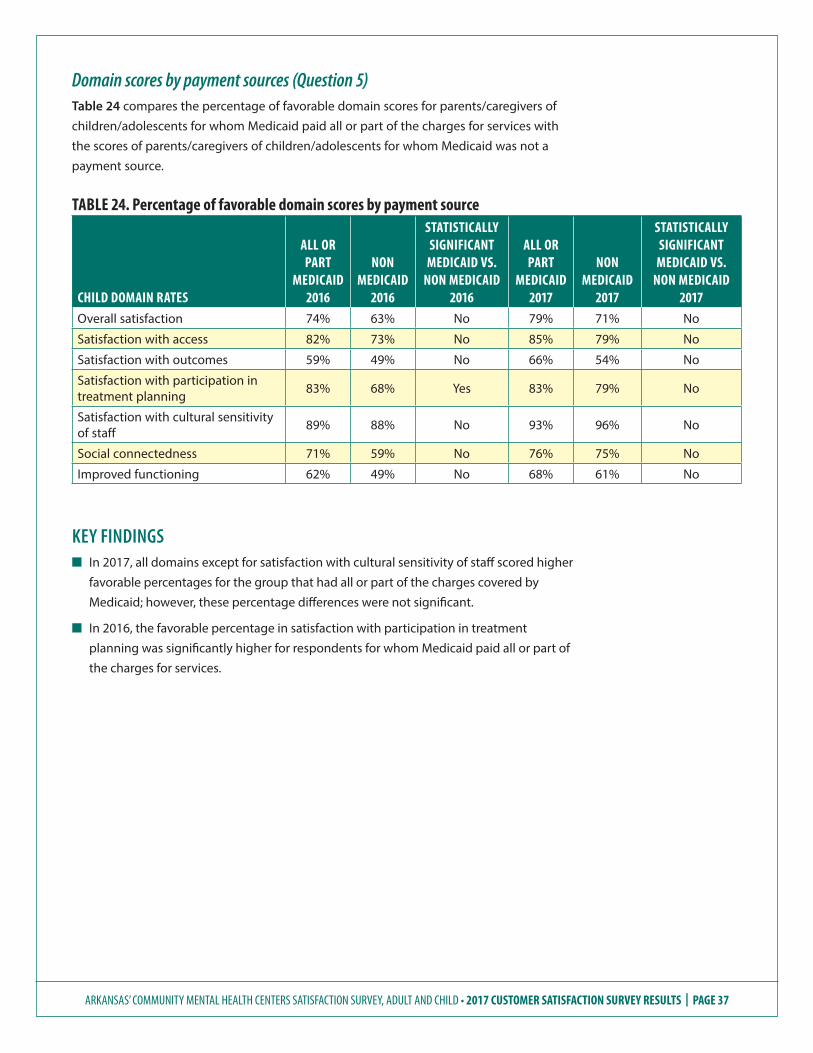
Domain scores by payment sources (Question 5)Table 24 compares the percentage of favorable domain scores for parents/caregivers of children/adolescents for whom Medicaid paid all or part of the charges for services with the scores of parents/caregivers of children/adolescents for whom Medicaid was not a payment source.
TABLE 24. Percentage of favorable domain scores by payment source
CHILD DOMAIN RATES
ALL OR PART
MEDICAID 2016
NON MEDICAID
2016
STATISTICALLY SIGNIFICANT
MEDICAID VS. NON MEDICAID
2016
ALL OR PART
MEDICAID 2017
NON MEDICAID
2017
STATISTICALLY SIGNIFICANT
MEDICAID VS. NON MEDICAID
2017Overall satisfaction 74% 63% No 79% 71% No
Satisfaction with access 82% 73% No 85% 79% No
Satisfaction with outcomes 59% 49% No 66% 54% No
Satisfaction with participation in treatment planning 83% 68% Yes 83% 79% No
Satisfaction with cultural sensitivityof staff 89% 88% No 93% 96% No
Social connectedness 71% 59% No 76% 75% No
Improved functioning 62% 49% No 68% 61% No
KEY FINDINGS n In 2017, all domains except for satisfaction with cultural sensitivity of staff scored higher
favorable percentages for the group that had all or part of the charges covered by Medicaid; however, these percentage differences were not significant.
n In 2016, the favorable percentage in satisfaction with participation in treatment planning was significantly higher for respondents for whom Medicaid paid all or part of the charges for services.
ARKANSAS’ COMMUNITY MENTAL HEALTH CENTERS SATISFACTION SURVEY, ADULT AND CHILD • 2017 CUSTOMER SATISFACTION SURVEY RESULTS | PAGE 38
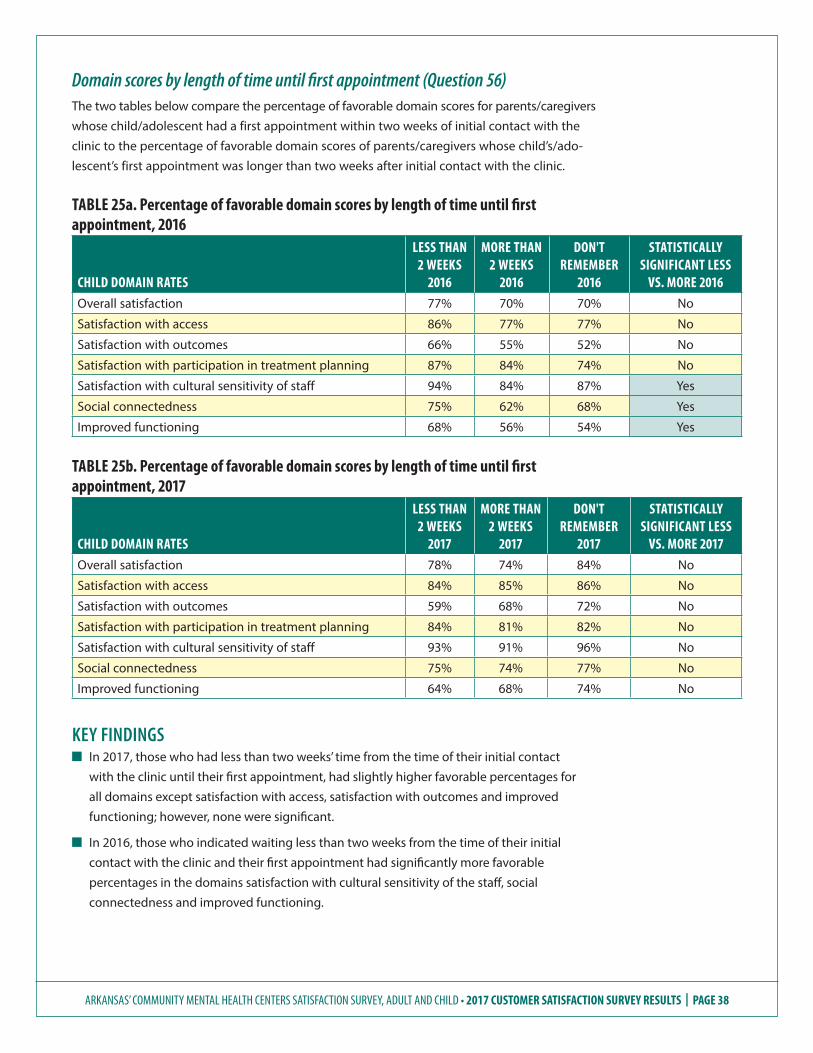
Domain scores by length of time until first appointment (Question 56)The two tables below compare the percentage of favorable domain scores for parents/caregivers whose child/adolescent had a first appointment within two weeks of initial contact with the clinic to the percentage of favorable domain scores of parents/caregivers whose child’s/ado-lescent’s first appointment was longer than two weeks after initial contact with the clinic.
TABLE 25a. Percentage of favorable domain scores by length of time until first appointment, 2016
CHILD DOMAIN RATES
LESS THAN 2 WEEKS
2016
MORE THAN 2 WEEKS
2016
DON'T REMEMBER
2016
STATISTICALLY SIGNIFICANT LESS
VS. MORE 2016Overall satisfaction 77% 70% 70% No
Satisfaction with access 86% 77% 77% No
Satisfaction with outcomes 66% 55% 52% No
Satisfaction with participation in treatment planning 87% 84% 74% No
Satisfaction with cultural sensitivity of staff 94% 84% 87% Yes
Social connectedness 75% 62% 68% Yes
Improved functioning 68% 56% 54% Yes
TABLE 25b. Percentage of favorable domain scores by length of time until first appointment, 2017
CHILD DOMAIN RATES
LESS THAN 2 WEEKS
2017
MORE THAN 2 WEEKS
2017
DON'T REMEMBER
2017
STATISTICALLY SIGNIFICANT LESS
VS. MORE 2017Overall satisfaction 78% 74% 84% No
Satisfaction with access 84% 85% 86% No
Satisfaction with outcomes 59% 68% 72% No
Satisfaction with participation in treatment planning 84% 81% 82% No
Satisfaction with cultural sensitivity of staff 93% 91% 96% No
Social connectedness 75% 74% 77% No
Improved functioning 64% 68% 74% No
KEY FINDINGS Q In 2017, those who had less than two weeks’ time from the time of their initial contact
with the clinic until their first appointment, had slightly higher favorable percentages for all domains except satisfaction with access, satisfaction with outcomes and improved functioning; however, none were significant.
Q In 2016, those who indicated waiting less than two weeks from the time of their initial contact with the clinic and their first appointment had significantly more favorable percentages in the domains satisfaction with cultural sensitivity of the staff, social connectedness and improved functioning.
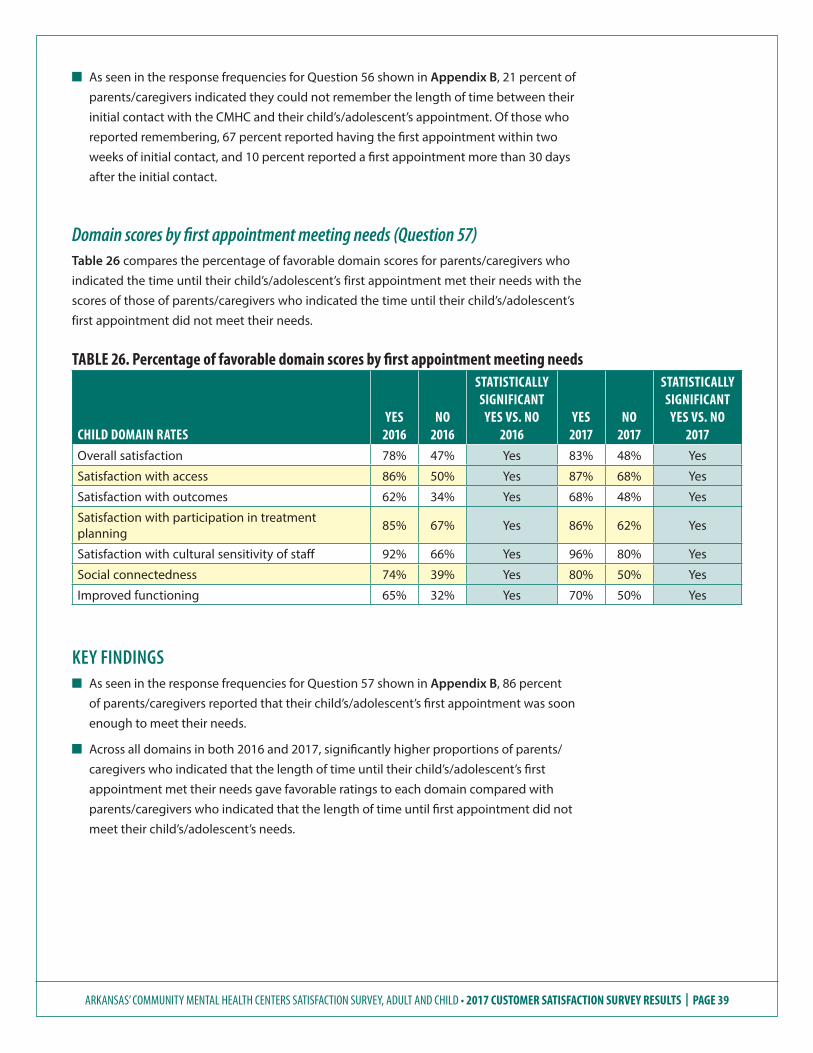
ARKANSAS’ COMMUNITY MENTAL HEALTH CENTERS SATISFACTION SURVEY, ADULT AND CHILD • 2017 CUSTOMER SATISFACTION SURVEY RESULTS | PAGE 39
Q As seen in the response frequencies for Question 56 shown in Appendix B, 21 percent of parents/caregivers indicated they could not remember the length of time between their initial contact with the CMHC and their child’s/adolescent’s appointment. Of those who reported remembering, 67 percent reported having the first appointment within two weeks of initial contact, and 10 percent reported a first appointment more than 30 days after the initial contact.
Domain scores by first appointment meeting needs (Question 57)Table 26 compares the percentage of favorable domain scores for parents/caregivers who indicated the time until their child’s/adolescent’s first appointment met their needs with the scores of those of parents/caregivers who indicated the time until their child’s/adolescent’s first appointment did not meet their needs.
TABLE 26. Percentage of favorable domain scores by first appointment meeting needs
CHILD DOMAIN RATESYES
2016NO
2016
STATISTICALLY SIGNIFICANT
YES VS. NO 2016
YES 2017
NO 2017
STATISTICALLY SIGNIFICANT
YES VS. NO 2017
Overall satisfaction 78% 47% Yes 83% 48% Yes
Satisfaction with access 86% 50% Yes 87% 68% Yes
Satisfaction with outcomes 62% 34% Yes 68% 48% Yes
Satisfaction with participation in treatment planning 85% 67% Yes 86% 62% Yes
Satisfaction with cultural sensitivity of staff 92% 66% Yes 96% 80% Yes
Social connectedness 74% 39% Yes 80% 50% Yes
Improved functioning 65% 32% Yes 70% 50% Yes
KEY FINDINGS n As seen in the response frequencies for Question 57 shown in Appendix B, 86 percent
of parents/caregivers reported that their child’s/adolescent’s first appointment was soon enough to meet their needs.
Q Across all domains in both 2016 and 2017, significantly higher proportions of parents/caregivers who indicated that the length of time until their child’s/adolescent’s first appointment met their needs gave favorable ratings to each domain compared with parents/caregivers who indicated that the length of time until first appointment did not meet their child’s/adolescent’s needs.
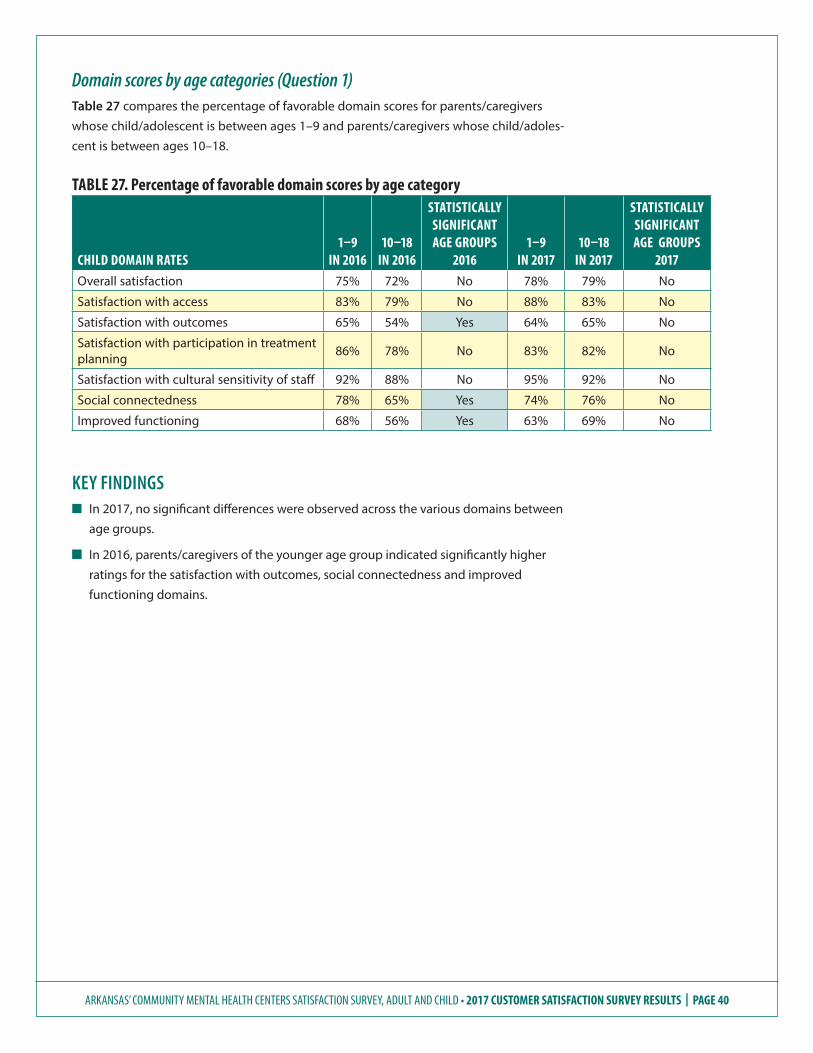
ARKANSAS’ COMMUNITY MENTAL HEALTH CENTERS SATISFACTION SURVEY, ADULT AND CHILD • 2017 CUSTOMER SATISFACTION SURVEY RESULTS | PAGE 40
Domain scores by age categories (Question 1)Table 27 compares the percentage of favorable domain scores for parents/caregivers whose child/adolescent is between ages 1–9 and parents/caregivers whose child/adoles-cent is between ages 10–18.
TABLE 27. Percentage of favorable domain scores by age category
CHILD DOMAIN RATES1–9
IN 201610–18
IN 2016
STATISTICALLY SIGNIFICANT AGE GROUPS
20161–9
IN 201710–18
IN 2017
STATISTICALLY SIGNIFICANT AGE GROUPS
2017Overall satisfaction 75% 72% No 78% 79% No
Satisfaction with access 83% 79% No 88% 83% No
Satisfaction with outcomes 65% 54% Yes 64% 65% No
Satisfaction with participation in treatment planning 86% 78% No 83% 82% No
Satisfaction with cultural sensitivity of staff 92% 88% No 95% 92% No
Social connectedness 78% 65% Yes 74% 76% No
Improved functioning 68% 56% Yes 63% 69% No
KEY FINDINGS n In 2017, no significant differences were observed across the various domains between
age groups.
Q In 2016, parents/caregivers of the younger age group indicated significantly higher ratings for the satisfaction with outcomes, social connectedness and improved functioning domains.

ARKANSAS’ COMMUNITY MENTAL HEALTH CENTERS SATISFACTION SURVEY, ADULT AND CHILD • 2017 CUSTOMER SATISFACTION SURVEY RESULTS | PAGE 41
Domain scores by race categories (Question 4)Table 28 compares the percentage of favorable domain scores for parents/caregivers whose child/adolescent is white compared with parents/caregivers whose child/adoles-cent is of a minority race.
TABLE 28. Percentage of favorable domain scores by race category
CHILD DOMAIN RATESWHITE
2016MINORITY*
2016
STATISTICALLY SIGNIFICANT
WHITE VS. MINORITY
2016WHITE
2017MINORITY*
2017
STATISTICALLY SIGNIFICANT
WHITE VS. MINORITY
2017Overall satisfaction 72% 74% No 77% 81% No
Satisfaction with access 80% 81% No 82% 90% Yes
Satisfaction with outcomes 58% 56% No 67% 61% No
Satisfaction with participation in treatment planning 79% 85% No 81% 86% No
Satisfaction with cultural sensitivity of staff 89% 89% No 92% 95% No
Social connectedness 69% 73% No 75% 76% No
Improved functioning 61% 58% No 69% 64% No
* Minority category includes multiracial
KEY FINDINGSn In 2017, minorities reported a statistically significant favorable percentage in the
satisfaction with access domain.
Q In 2016, there were no significant differences in domain scores between whites and minorities.
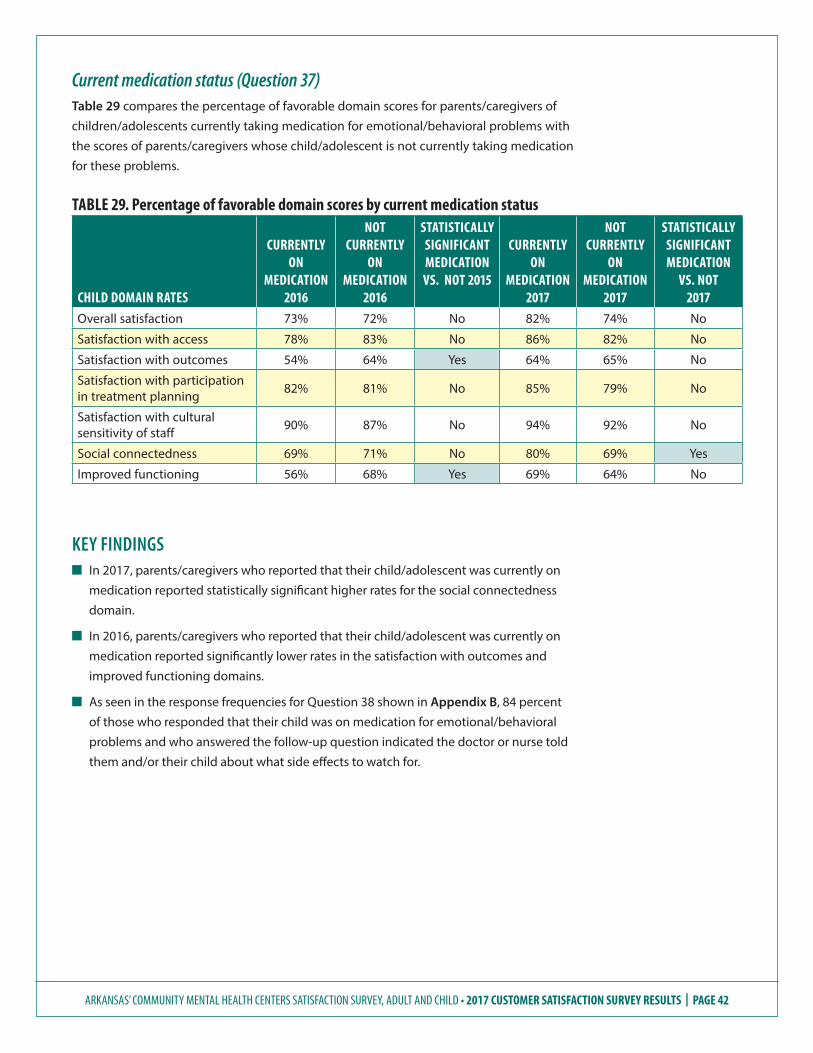
ARKANSAS’ COMMUNITY MENTAL HEALTH CENTERS SATISFACTION SURVEY, ADULT AND CHILD • 2017 CUSTOMER SATISFACTION SURVEY RESULTS | PAGE 42
Current medication status (Question 37)Table 29 compares the percentage of favorable domain scores for parents/caregivers of children/adolescents currently taking medication for emotional/behavioral problems with the scores of parents/caregivers whose child/adolescent is not currently taking medication for these problems.
TABLE 29. Percentage of favorable domain scores by current medication status
CHILD DOMAIN RATES
CURRENTLY ON
MEDICATION 2016
NOT CURRENTLY
ON MEDICATION
2016
STATISTICALLY SIGNIFICANT MEDICATION VS. NOT 2015
CURRENTLY ON
MEDICATION 2017
NOT CURRENTLY
ON MEDICATION
2017
STATISTICALLY SIGNIFICANT MEDICATION
VS. NOT 2017
Overall satisfaction 73% 72% No 82% 74% No
Satisfaction with access 78% 83% No 86% 82% No
Satisfaction with outcomes 54% 64% Yes 64% 65% No
Satisfaction with participation in treatment planning 82% 81% No 85% 79% No
Satisfaction with cultural sensitivity of staff 90% 87% No 94% 92% No
Social connectedness 69% 71% No 80% 69% Yes
Improved functioning 56% 68% Yes 69% 64% No
KEY FINDINGS Q In 2017, parents/caregivers who reported that their child/adolescent was currently on
medication reported statistically significant higher rates for the social connectedness domain.
Q In 2016, parents/caregivers who reported that their child/adolescent was currently on medication reported significantly lower rates in the satisfaction with outcomes and improved functioning domains.
Q As seen in the response frequencies for Question 38 shown in Appendix B, 84 percent of those who responded that their child was on medication for emotional/behavioral problems and who answered the follow-up question indicated the doctor or nurse told them and/or their child about what side effects to watch for.
ARKANSAS’ COMMUNITY MENTAL HEALTH CENTERS SATISFACTION SURVEY, ADULT AND CHILD • 2017 CUSTOMER SATISFACTION SURVEY RESULTS | PAGE 43
Juvenile justice involvement (Questions 41, 42, 43, 47, 48 and 49)Parents/caregivers of children/adolescents were asked if their child/adolescent had been arrested during various time periods in the past.
KEY FINDINGS Q Of parents/caregivers of children/adolescents who began treatment in the past 12
months, two (1%) reported having been arrested since starting treatment and four (3%) arrested in the year before that.
Q In a slightly different approach to the issue of the association between being in treatment and juvenile justice involvement, for those in treatment for less than a year, of the 153 parents/caregivers responding, 10 (7%) indicated that encounters with the police had decreased since their child began to receive mental health services, nine (6%) reported their children’s contact level remained the same and four (3 %) indicated that it had increased. For 130 (85%), this question was not relevant. When these 130 for whom the question is not relevant are excluded from the analysis, 43 percent (10 of 23) indicated a reduction in criminal justice contact, 39 percent (9 of 23) indicated the level remained the same and 17 percent (4 of 23) indicated an increase in criminal justice contact.
Q Parents/caregivers of children/adolescents who had been in treatment for more than a year reported that six (4%) had been arrested in the recent 12 months and three (2%) had been arrested in the 12 months prior to that.
Q The parents/caregivers of children/adolescents who had been in treatment for more than a year were also asked about their child’s/adolescent’s encounters with police during the recent 12 months. Nine (6%) indicated that contact had been reduced, three (2%) indicated it had remained the same, four (3%) indicated it had increased and 128 (89%) indicated the question was not applicable to them. When these 128 for whom the question is not applicable are excluded from the analysis, 56 percent (9 of 16) indicated a reduction in criminal justice contact, 19 percent (3 of 16) indicated the level remained the same, and 25 percent (4 of 16) indicated that the level increased.
Q In 2017, 3 percent (N=352) of parents/caregivers of children/adolescents indicated their child had ever been arrested.
ARKANSAS’ COMMUNITY MENTAL HEALTH CENTERS SATISFACTION SURVEY, ADULT AND CHILD • 2017 CUSTOMER SATISFACTION SURVEY RESULTS | PAGE 44
School issues reported (Questions 44, 45, 46, 50, 51, 52 and 54)Parents/caregivers of children/adolescents were asked whether or not their child/adoles-cent had been expelled or suspended from school in the past, how often their child/ado-lescent was absent from school, and whether or not their child/adolescent had received mental health services at school.
KEY FINDINGS Q Parents/caregivers of children/adolescents who began treatment in the past 12 months
reported 10 (6%) having been expelled or suspended since starting treatment and 21 (13%) having been expelled or suspended in the year before that.
Q In a slightly different approach to the issue of the association between being in treatment and school attendance, for those in treatment for less than a year, of the 142 parents/caregivers responding, 24 (17%) indicated that the number of days their child/adolescent was in school had increased since their child began to receive mental health services, 61 (43%) reported their child’s school attendance level remained the same and five (4%) indicated it had decreased. For 52 (37%), this question was not relevant. When these 52 for whom the question is not relevant are excluded from the analysis, 27 percent (24 of 90) indicated that the number of days their child/adolescent was in school had increased since their child began to receive mental health services, 68 percent (61 of 90) reported their child’s school attendance level remained the same and 6 percent (5 of 90) indicated it had decreased.
Q Parents/caregivers of children/adolescents who had been in treatment for more than a year reported that 19 (13%) had been expelled or suspended in the recent 12 months and 19 (13%) had been expelled or suspended in the 12 months prior to that.
Q In a slightly different approach to the issue of the association between being in treatment and school attendance, for those in treatment for more than a year, of the 129 parents/caregivers responding, 25 (19%) indicated that the number of days their child/adolescent was in school had increased since their child began to receive mental health services, 53 (41%) reported their child’s school attendance level remained the same and seven (5%) indicated it had decreased. For 44 (34%), this question was not relevant. When these 44 are excluded from the analysis, 29 percent (25 of 85) indicated that the number of days their child/adolescent was in school had increased since their child began to receive mental health services, 62 percent (53 of 85) reported their child’s school attendance level remained the same and 8 percent (7 of 85) indicated it had decreased.
Q Of the 316 parents/caregivers for whom Question 54 was applicable, 68 percent indicated that their child/adolescent received mental health services at school. Those responding “Don’t know” were excluded from the calculation.
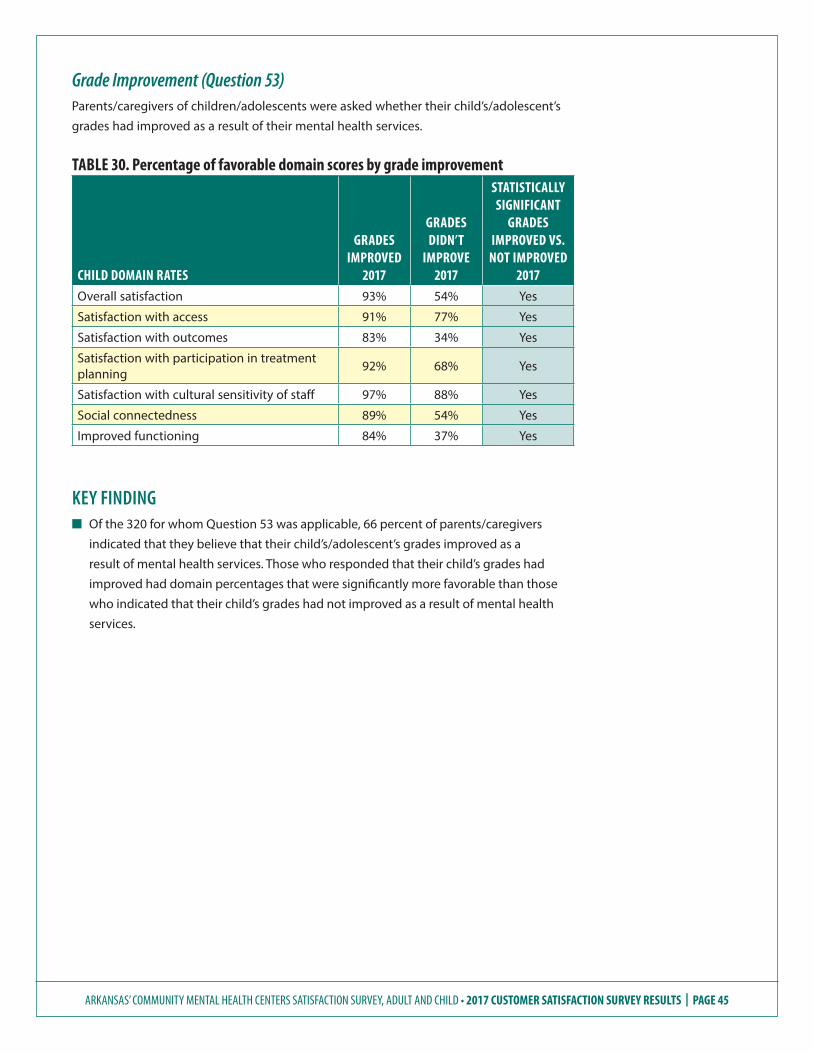
ARKANSAS’ COMMUNITY MENTAL HEALTH CENTERS SATISFACTION SURVEY, ADULT AND CHILD • 2017 CUSTOMER SATISFACTION SURVEY RESULTS | PAGE 45
Grade Improvement (Question 53)Parents/caregivers of children/adolescents were asked whether their child’s/adolescent’s grades had improved as a result of their mental health services.
TABLE 30. Percentage of favorable domain scores by grade improvement
CHILD DOMAIN RATES
GRADES IMPROVED
2017
GRADES DIDN’T
IMPROVE 2017
STATISTICALLY SIGNIFICANT
GRADES IMPROVED VS.
NOT IMPROVED 2017
Overall satisfaction 93% 54% Yes
Satisfaction with access 91% 77% Yes
Satisfaction with outcomes 83% 34% Yes
Satisfaction with participation in treatment planning 92% 68% Yes
Satisfaction with cultural sensitivity of staff 97% 88% Yes
Social connectedness 89% 54% Yes
Improved functioning 84% 37% Yes
KEY FINDING n Of the 320 for whom Question 53 was applicable, 66 percent of parents/caregivers
indicated that they believe that their child’s/adolescent’s grades improved as a result of mental health services. Those who responded that their child’s grades had improved had domain percentages that were significantly more favorable than those who indicated that their child’s grades had not improved as a result of mental health services.
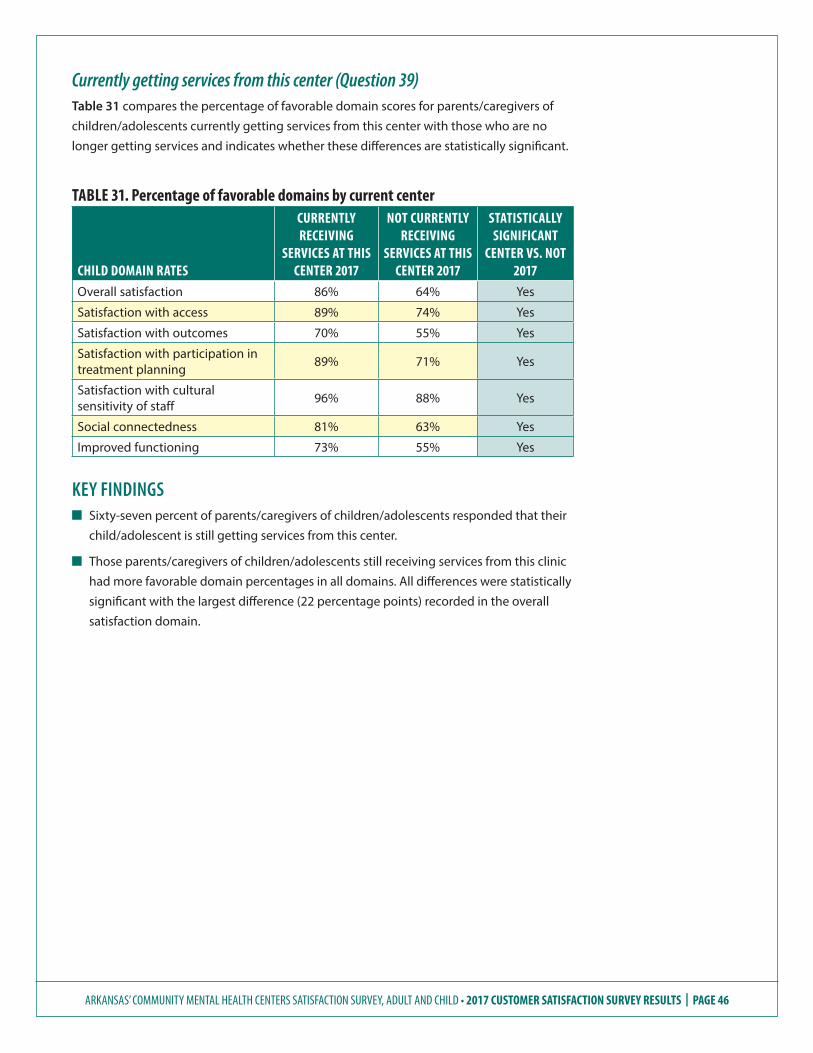
ARKANSAS’ COMMUNITY MENTAL HEALTH CENTERS SATISFACTION SURVEY, ADULT AND CHILD • 2017 CUSTOMER SATISFACTION SURVEY RESULTS | PAGE 46
Currently getting services from this center (Question 39)Table 31 compares the percentage of favorable domain scores for parents/caregivers of children/adolescents currently getting services from this center with those who are no longer getting services and indicates whether these differences are statistically significant.
TABLE 31. Percentage of favorable domains by current center
CHILD DOMAIN RATES
CURRENTLY RECEIVING
SERVICES AT THIS CENTER 2017
NOT CURRENTLY RECEIVING
SERVICES AT THIS CENTER 2017
STATISTICALLY SIGNIFICANT
CENTER VS. NOT 2017
Overall satisfaction 86% 64% Yes
Satisfaction with access 89% 74% Yes
Satisfaction with outcomes 70% 55% Yes
Satisfaction with participation in treatment planning 89% 71% Yes
Satisfaction with cultural sensitivity of staff 96% 88% Yes
Social connectedness 81% 63% Yes
Improved functioning 73% 55% Yes
KEY FINDINGS Q Sixty-seven percent of parents/caregivers of children/adolescents responded that their
child/adolescent is still getting services from this center.
Q Those parents/caregivers of children/adolescents still receiving services from this clinic had more favorable domain percentages in all domains. All differences were statistically significant with the largest difference (22 percentage points) recorded in the overall satisfaction domain.
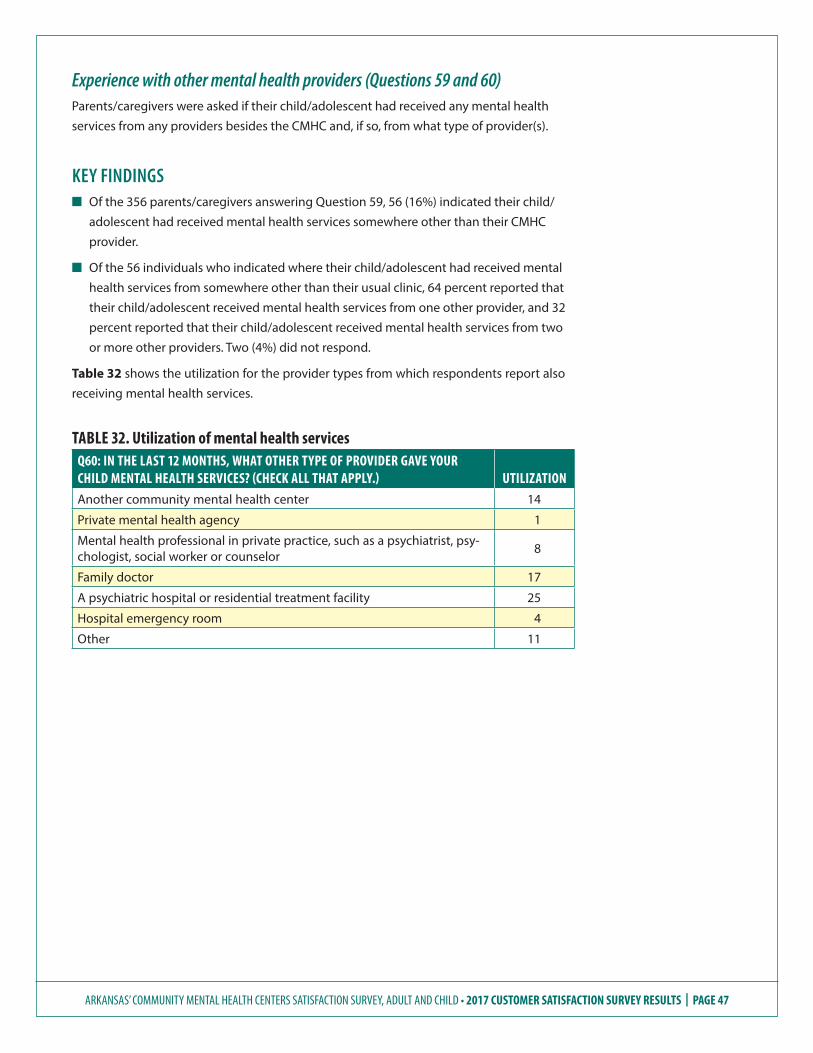
ARKANSAS’ COMMUNITY MENTAL HEALTH CENTERS SATISFACTION SURVEY, ADULT AND CHILD • 2017 CUSTOMER SATISFACTION SURVEY RESULTS | PAGE 47
Experience with other mental health providers (Questions 59 and 60)Parents/caregivers were asked if their child/adolescent had received any mental health services from any providers besides the CMHC and, if so, from what type of provider(s).
KEY FINDINGS n Of the 356 parents/caregivers answering Question 59, 56 (16%) indicated their child/
adolescent had received mental health services somewhere other than their CMHC provider.
n Of the 56 individuals who indicated where their child/adolescent had received mental health services from somewhere other than their usual clinic, 64 percent reported that their child/adolescent received mental health services from one other provider, and 32 percent reported that their child/adolescent received mental health services from two or more other providers. Two (4%) did not respond.
Table 32 shows the utilization for the provider types from which respondents report also receiving mental health services.
TABLE 32. Utilization of mental health servicesQ60: IN THE LAST 12 MONTHS, WHAT OTHER TYPE OF PROVIDER GAVE YOUR CHILD MENTAL HEALTH SERVICES? (CHECK ALL THAT APPLY.) UTILIZATIONAnother community mental health center 14
Private mental health agency 1
Mental health professional in private practice, such as a psychiatrist, psy-chologist, social worker or counselor 8
Family doctor 17
A psychiatric hospital or residential treatment facility 25
Hospital emergency room 4
Other 11

ARKANSAS’ COMMUNITY MENTAL HEALTH CENTERS SATISFACTION SURVEY, ADULT AND CHILD • 2017 CUSTOMER SATISFACTION SURVEY RESULTS | PAGE 48
THIS PAGE INTENTIONALLY LEFT BLANK

ARKANSAS’ COMMUNITY MENTAL HEALTH CENTERS SATISFACTION SURVEY, ADULT AND CHILD • 2017 CUSTOMER SATISFACTION SURVEY RESULTS | PAGE 49
Wards of State ComparisonTable 33 reports results of comparisons of the percentage of favorable domain scores made between wards of the state of Arkansas and the remainder of the respondents. A total of 54 surveys from wards of the state were available for analysis in 2017. All statistical testing for this section was completed using a 95 percent confidence level, alpha = 0.05.
It is important to note that surveys for wards of the state were completed primarily by Division of Children and Family Services caseworkers with varying degrees of contact/input from the child and/or the foster parent. This factor makes it necessary to use caution when making comparisons between responses from parents/guardians of non-custody children and responses primarily from employees of the Division of Children and Family Services.
TABLE 33. Percentage of favorable domain scores by wards of the state status
CHILD DOMAIN RATES
WARDS OF ARKANSAS
2017
NOT WARDS OF ARKANSAS
2017
STATISTICALLY SIGNIFICANT
2017Overall satisfaction 83% 77% No
Satisfaction with access 77% 86% No
Satisfaction with outcomes 79% 63% Yes
Satisfaction with participation in treatment planning 83% 83% No
Satisfaction with cultural sensitivity of staff 92% 93% No
Social connectedness 86% 74% No
Improved functioning 81% 65% Yes
KEY FINDINGn When comparing wards of state to other survey recipients, those who were wards
of Arkansas had statistically significant higher percentages in the satisfaction with outcomes and improved functioning domains.

ARKANSAS’ COMMUNITY MENTAL HEALTH CENTERS SATISFACTION SURVEY, ADULT AND CHILD • 2017 CUSTOMER SATISFACTION SURVEY RESULTS | PAGE 50
THIS PAGE INTENTIONALLY LEFT BLANK

ARKANSAS’ COMMUNITY MENTAL HEALTH CENTERS SATISFACTION SURVEY, ADULT AND CHILD • 2017 CUSTOMER SATISFACTION SURVEY RESULTS | PAGE 51
APPENDIX A:Adult Survey Responses
Appendix A: Adult Survey Responses
What is your age now?
Q1 Frequency Percent Cumulative Frequency
Cumulative Percent
18 to 24 27 7.09 27 7.09
25 to 34 47 12.34 74 19.42
35 to 44 70 18.37 144 37.80
45 to 54 94 24.67 238 62.47
55 to 64 113 29.66 351 92.13
65 to 74 26 6.82 377 98.95
75 or older 4 1.05 381 100.00
Are you male or female?
Q2 Frequency Percent Cumulative Frequency
Cumulative Percent
Male 142 37.17 142 37.17
Female 240 62.83 382 100.00
Are you of Hispanic or Latino origin or descent?
Q3 Frequency Percent Cumulative Frequency
Cumulative Percent
Yes 9 2.47 9 2.47
No 355 97.53 364 100.00
What is your race? Please mark one or more.
Q4 Frequency Percent Cumulative Frequency
Cumulative Percent
White 254 66.32 254 66.32
Black or African-American 102 26.63 356 92.95
Asian 0 0.00 356 92.95
Native Hawaiian or other Pacific Islander 1 0.26 357 93.21
American Indian or Alaska Native 8 2.09 365 95.30
Multiracial 18 4.70 383 100.00
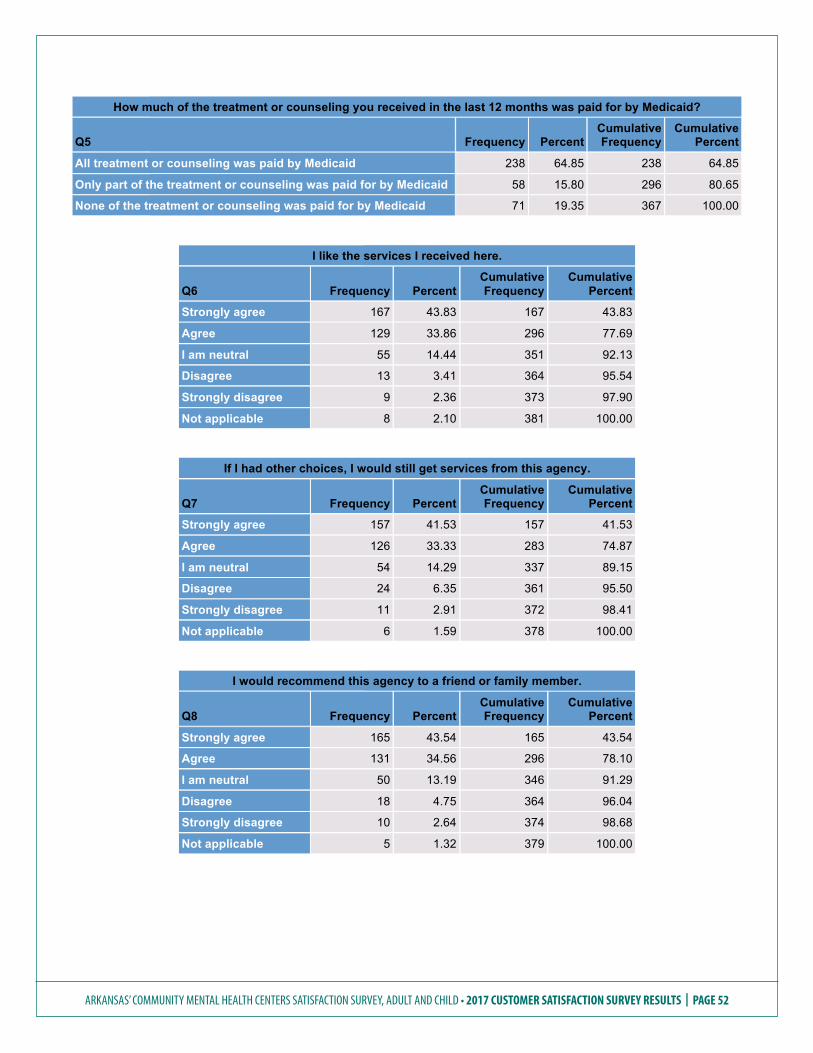
ARKANSAS’ COMMUNITY MENTAL HEALTH CENTERS SATISFACTION SURVEY, ADULT AND CHILD • 2017 CUSTOMER SATISFACTION SURVEY RESULTS | PAGE 52
How much of the treatment or counseling you received in the last 12 months was paid for by Medicaid?
Q5 Frequency Percent Cumulative Frequency
Cumulative Percent
All treatment or counseling was paid by Medicaid 238 64.85 238 64.85
Only part of the treatment or counseling was paid for by Medicaid 58 15.80 296 80.65
None of the treatment or counseling was paid for by Medicaid 71 19.35 367 100.00
I like the services I received here.
Q6 Frequency Percent Cumulative Frequency
Cumulative Percent
Strongly agree 167 43.83 167 43.83
Agree 129 33.86 296 77.69
I am neutral 55 14.44 351 92.13
Disagree 13 3.41 364 95.54
Strongly disagree 9 2.36 373 97.90
Not applicable 8 2.10 381 100.00
If I had other choices, I would still get services from this agency.
Q7 Frequency Percent Cumulative Frequency
Cumulative Percent
Strongly agree 157 41.53 157 41.53
Agree 126 33.33 283 74.87
I am neutral 54 14.29 337 89.15
Disagree 24 6.35 361 95.50
Strongly disagree 11 2.91 372 98.41
Not applicable 6 1.59 378 100.00
I would recommend this agency to a friend or family member.
Q8 Frequency Percent Cumulative Frequency
Cumulative Percent
Strongly agree 165 43.54 165 43.54
Agree 131 34.56 296 78.10
I am neutral 50 13.19 346 91.29
Disagree 18 4.75 364 96.04
Strongly disagree 10 2.64 374 98.68
Not applicable 5 1.32 379 100.00
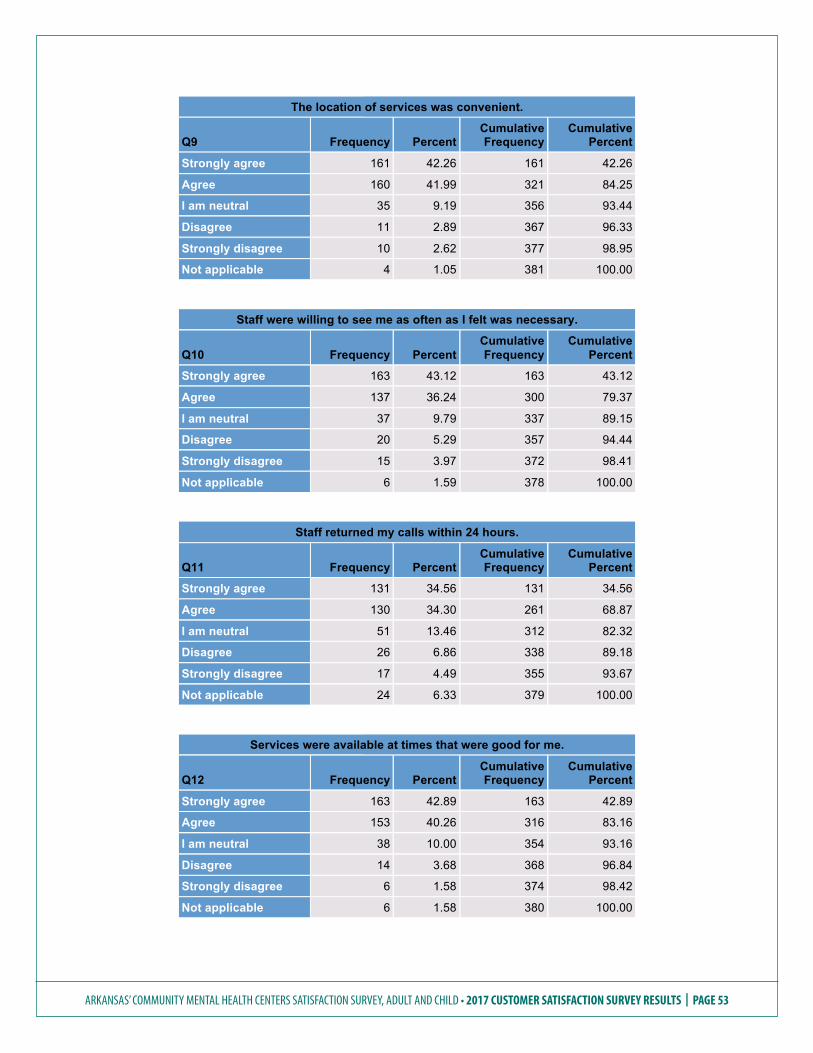
ARKANSAS’ COMMUNITY MENTAL HEALTH CENTERS SATISFACTION SURVEY, ADULT AND CHILD • 2017 CUSTOMER SATISFACTION SURVEY RESULTS | PAGE 53
The location of services was convenient.
Q9 Frequency Percent Cumulative Frequency
Cumulative Percent
Strongly agree 161 42.26 161 42.26
Agree 160 41.99 321 84.25
I am neutral 35 9.19 356 93.44
Disagree 11 2.89 367 96.33
Strongly disagree 10 2.62 377 98.95
Not applicable 4 1.05 381 100.00
Staff were willing to see me as often as I felt was necessary.
Q10 Frequency Percent Cumulative Frequency
Cumulative Percent
Strongly agree 163 43.12 163 43.12
Agree 137 36.24 300 79.37
I am neutral 37 9.79 337 89.15
Disagree 20 5.29 357 94.44
Strongly disagree 15 3.97 372 98.41
Not applicable 6 1.59 378 100.00
Staff returned my calls within 24 hours.
Q11 Frequency Percent Cumulative Frequency
Cumulative Percent
Strongly agree 131 34.56 131 34.56
Agree 130 34.30 261 68.87
I am neutral 51 13.46 312 82.32
Disagree 26 6.86 338 89.18
Strongly disagree 17 4.49 355 93.67
Not applicable 24 6.33 379 100.00
Services were available at times that were good for me.
Q12 Frequency Percent Cumulative Frequency
Cumulative Percent
Strongly agree 163 42.89 163 42.89
Agree 153 40.26 316 83.16
I am neutral 38 10.00 354 93.16
Disagree 14 3.68 368 96.84
Strongly disagree 6 1.58 374 98.42
Not applicable 6 1.58 380 100.00
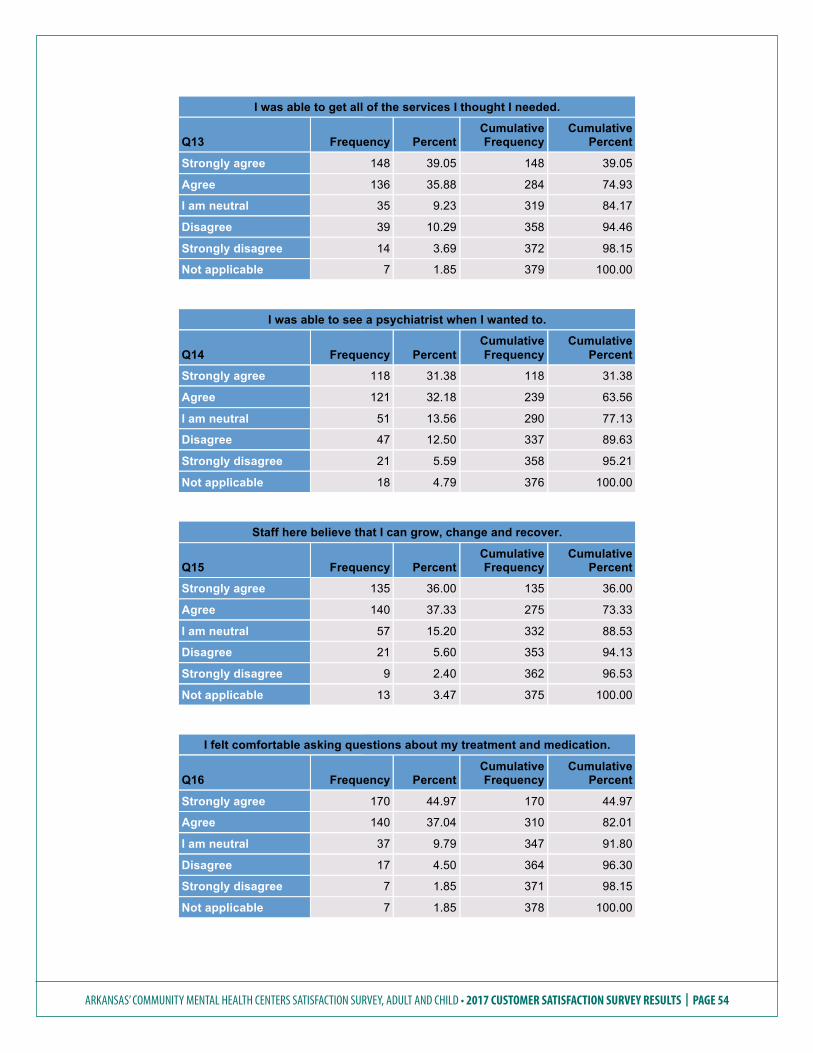
ARKANSAS’ COMMUNITY MENTAL HEALTH CENTERS SATISFACTION SURVEY, ADULT AND CHILD • 2017 CUSTOMER SATISFACTION SURVEY RESULTS | PAGE 54
I was able to get all of the services I thought I needed.
Q13 Frequency Percent Cumulative Frequency
Cumulative Percent
Strongly agree 148 39.05 148 39.05
Agree 136 35.88 284 74.93
I am neutral 35 9.23 319 84.17
Disagree 39 10.29 358 94.46
Strongly disagree 14 3.69 372 98.15
Not applicable 7 1.85 379 100.00
I was able to see a psychiatrist when I wanted to.
Q14 Frequency Percent Cumulative Frequency
Cumulative Percent
Strongly agree 118 31.38 118 31.38
Agree 121 32.18 239 63.56
I am neutral 51 13.56 290 77.13
Disagree 47 12.50 337 89.63
Strongly disagree 21 5.59 358 95.21
Not applicable 18 4.79 376 100.00
Staff here believe that I can grow, change and recover.
Q15 Frequency Percent Cumulative Frequency
Cumulative Percent
Strongly agree 135 36.00 135 36.00
Agree 140 37.33 275 73.33
I am neutral 57 15.20 332 88.53
Disagree 21 5.60 353 94.13
Strongly disagree 9 2.40 362 96.53
Not applicable 13 3.47 375 100.00
I felt comfortable asking questions about my treatment and medication.
Q16 Frequency Percent Cumulative Frequency
Cumulative Percent
Strongly agree 170 44.97 170 44.97
Agree 140 37.04 310 82.01
I am neutral 37 9.79 347 91.80
Disagree 17 4.50 364 96.30
Strongly disagree 7 1.85 371 98.15
Not applicable 7 1.85 378 100.00
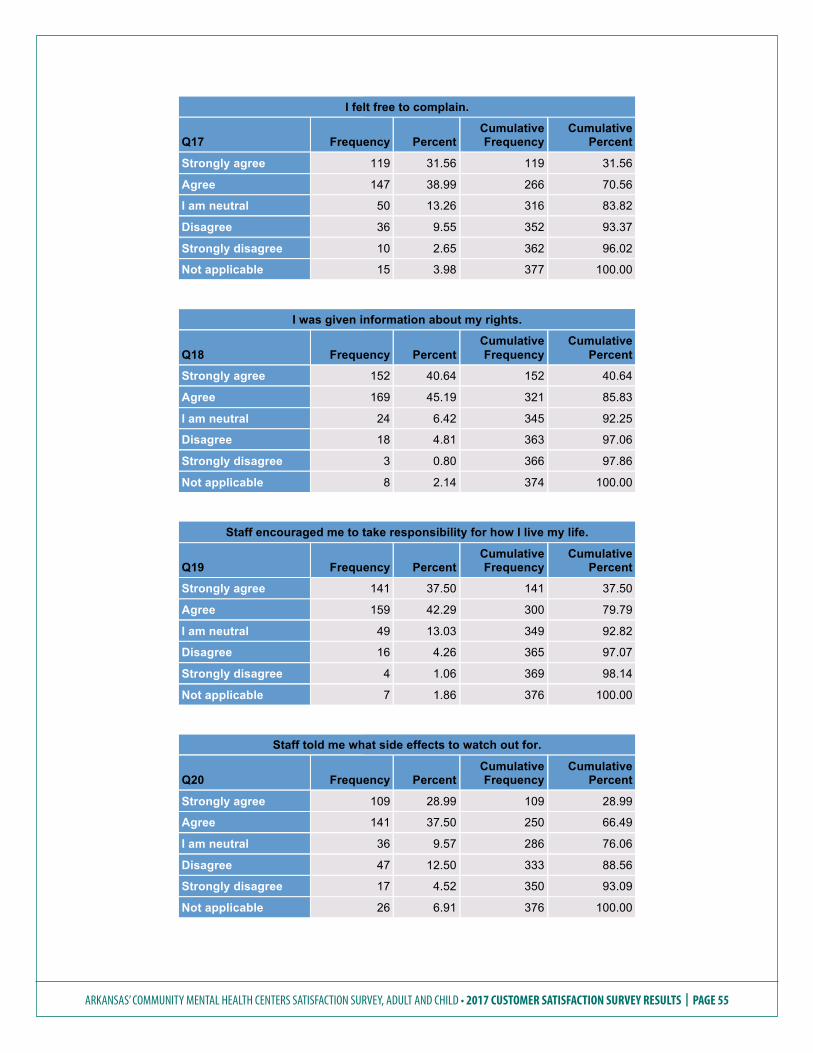
ARKANSAS’ COMMUNITY MENTAL HEALTH CENTERS SATISFACTION SURVEY, ADULT AND CHILD • 2017 CUSTOMER SATISFACTION SURVEY RESULTS | PAGE 55
I felt free to complain.
Q17 Frequency Percent Cumulative Frequency
Cumulative Percent
Strongly agree 119 31.56 119 31.56
Agree 147 38.99 266 70.56
I am neutral 50 13.26 316 83.82
Disagree 36 9.55 352 93.37
Strongly disagree 10 2.65 362 96.02
Not applicable 15 3.98 377 100.00
I was given information about my rights.
Q18 Frequency Percent Cumulative Frequency
Cumulative Percent
Strongly agree 152 40.64 152 40.64
Agree 169 45.19 321 85.83
I am neutral 24 6.42 345 92.25
Disagree 18 4.81 363 97.06
Strongly disagree 3 0.80 366 97.86
Not applicable 8 2.14 374 100.00
Staff encouraged me to take responsibility for how I live my life.
Q19 Frequency Percent Cumulative Frequency
Cumulative Percent
Strongly agree 141 37.50 141 37.50
Agree 159 42.29 300 79.79
I am neutral 49 13.03 349 92.82
Disagree 16 4.26 365 97.07
Strongly disagree 4 1.06 369 98.14
Not applicable 7 1.86 376 100.00
Staff told me what side effects to watch out for.
Q20 Frequency Percent Cumulative Frequency
Cumulative Percent
Strongly agree 109 28.99 109 28.99
Agree 141 37.50 250 66.49
I am neutral 36 9.57 286 76.06
Disagree 47 12.50 333 88.56
Strongly disagree 17 4.52 350 93.09
Not applicable 26 6.91 376 100.00
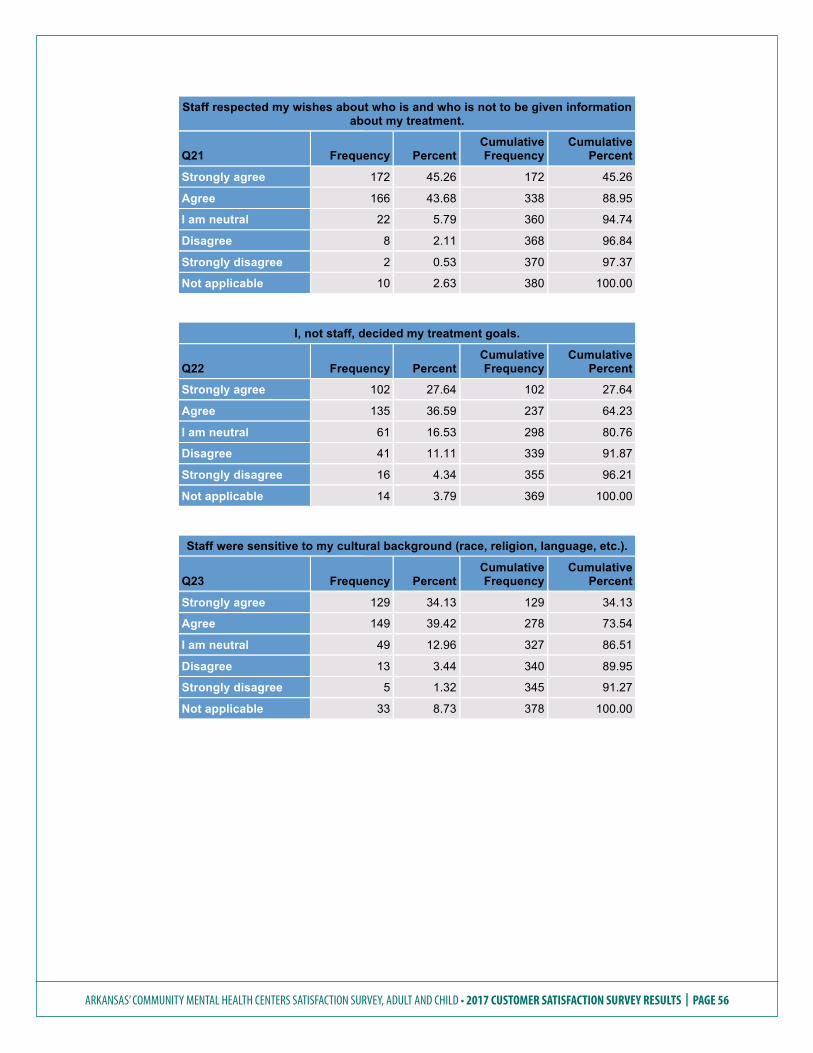
ARKANSAS’ COMMUNITY MENTAL HEALTH CENTERS SATISFACTION SURVEY, ADULT AND CHILD • 2017 CUSTOMER SATISFACTION SURVEY RESULTS | PAGE 56
Staff respected my wishes about who is and who is not to be given information about my treatment.
Q21 Frequency Percent Cumulative Frequency
Cumulative Percent
Strongly agree 172 45.26 172 45.26
Agree 166 43.68 338 88.95
I am neutral 22 5.79 360 94.74
Disagree 8 2.11 368 96.84
Strongly disagree 2 0.53 370 97.37
Not applicable 10 2.63 380 100.00
I, not staff, decided my treatment goals.
Q22 Frequency Percent Cumulative Frequency
Cumulative Percent
Strongly agree 102 27.64 102 27.64
Agree 135 36.59 237 64.23
I am neutral 61 16.53 298 80.76
Disagree 41 11.11 339 91.87
Strongly disagree 16 4.34 355 96.21
Not applicable 14 3.79 369 100.00
Staff were sensitive to my cultural background (race, religion, language, etc.).
Q23 Frequency Percent Cumulative Frequency
Cumulative Percent
Strongly agree 129 34.13 129 34.13
Agree 149 39.42 278 73.54
I am neutral 49 12.96 327 86.51
Disagree 13 3.44 340 89.95
Strongly disagree 5 1.32 345 91.27
Not applicable 33 8.73 378 100.00

ARKANSAS’ COMMUNITY MENTAL HEALTH CENTERS SATISFACTION SURVEY, ADULT AND CHILD • 2017 CUSTOMER SATISFACTION SURVEY RESULTS | PAGE 57
Staff helped me obtain the information I needed so that I could take charge of managing my illness.
Q24 Frequency Percent Cumulative Frequency
Cumulative Percent
Strongly agree 124 33.16 124 33.16
Agree 146 39.04 270 72.19
I am neutral 48 12.83 318 85.03
Disagree 32 8.56 350 93.58
Strongly disagree 8 2.14 358 95.72
Not applicable 16 4.28 374 100.00
I was encouraged to use consumer-run programs (support groups, drop-in centers, crisis phone lines, etc.).
Q25 Frequency Percent Cumulative Frequency
Cumulative Percent
Strongly agree 88 23.53 88 23.53
Agree 126 33.69 214 57.22
I am neutral 62 16.58 276 73.80
Disagree 47 12.57 323 86.36
Strongly disagree 7 1.87 330 88.24
Not applicable 44 11.76 374 100.00
As a direct result of services I received, I deal more effectively with daily problems.
Q26 Frequency Percent Cumulative Frequency
Cumulative Percent
Strongly agree 101 26.79 101 26.79
Agree 151 40.05 252 66.84
I am neutral 63 16.71 315 83.55
Disagree 36 9.55 351 93.10
Strongly disagree 10 2.65 361 95.76
Not applicable 16 4.24 377 100.00
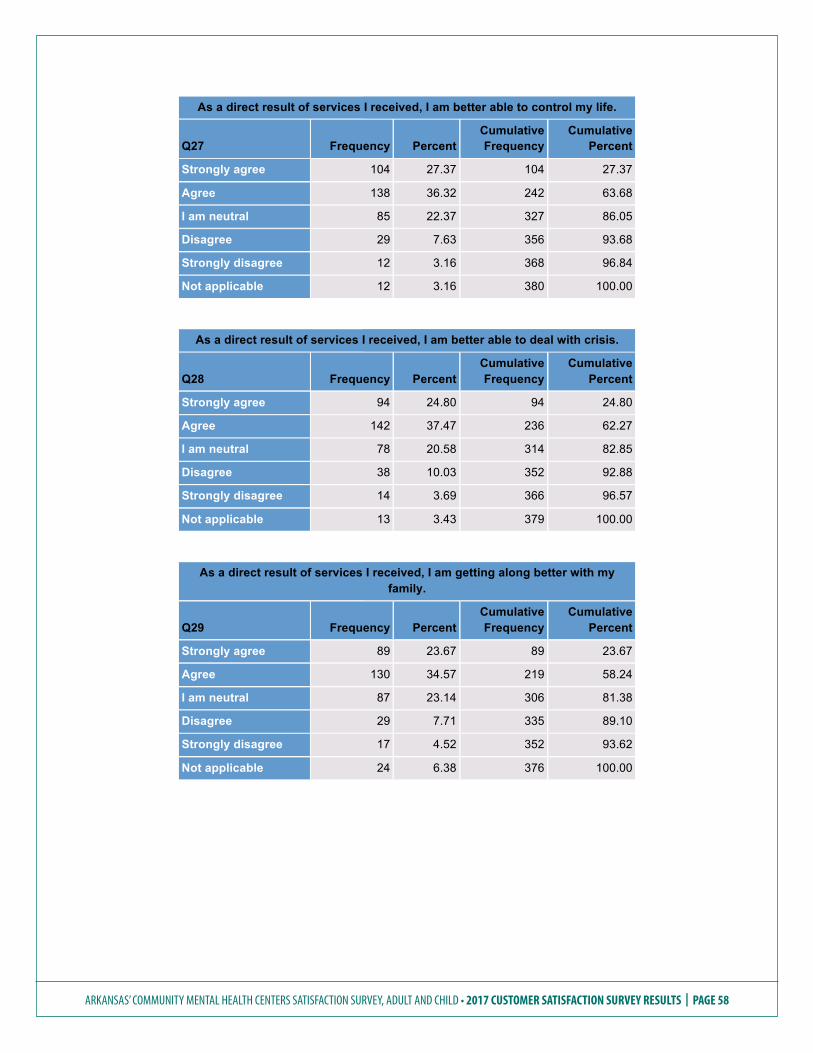
ARKANSAS’ COMMUNITY MENTAL HEALTH CENTERS SATISFACTION SURVEY, ADULT AND CHILD • 2017 CUSTOMER SATISFACTION SURVEY RESULTS | PAGE 58
As a direct result of services I received, I am better able to control my life.
Q27 Frequency Percent Cumulative Frequency
Cumulative Percent
Strongly agree 104 27.37 104 27.37
Agree 138 36.32 242 63.68
I am neutral 85 22.37 327 86.05
Disagree 29 7.63 356 93.68
Strongly disagree 12 3.16 368 96.84
Not applicable 12 3.16 380 100.00
As a direct result of services I received, I am better able to deal with crisis.
Q28 Frequency Percent Cumulative Frequency
Cumulative Percent
Strongly agree 94 24.80 94 24.80
Agree 142 37.47 236 62.27
I am neutral 78 20.58 314 82.85
Disagree 38 10.03 352 92.88
Strongly disagree 14 3.69 366 96.57
Not applicable 13 3.43 379 100.00
As a direct result of services I received, I am getting along better with my family.
Q29 Frequency Percent Cumulative Frequency
Cumulative Percent
Strongly agree 89 23.67 89 23.67
Agree 130 34.57 219 58.24
I am neutral 87 23.14 306 81.38
Disagree 29 7.71 335 89.10
Strongly disagree 17 4.52 352 93.62
Not applicable 24 6.38 376 100.00
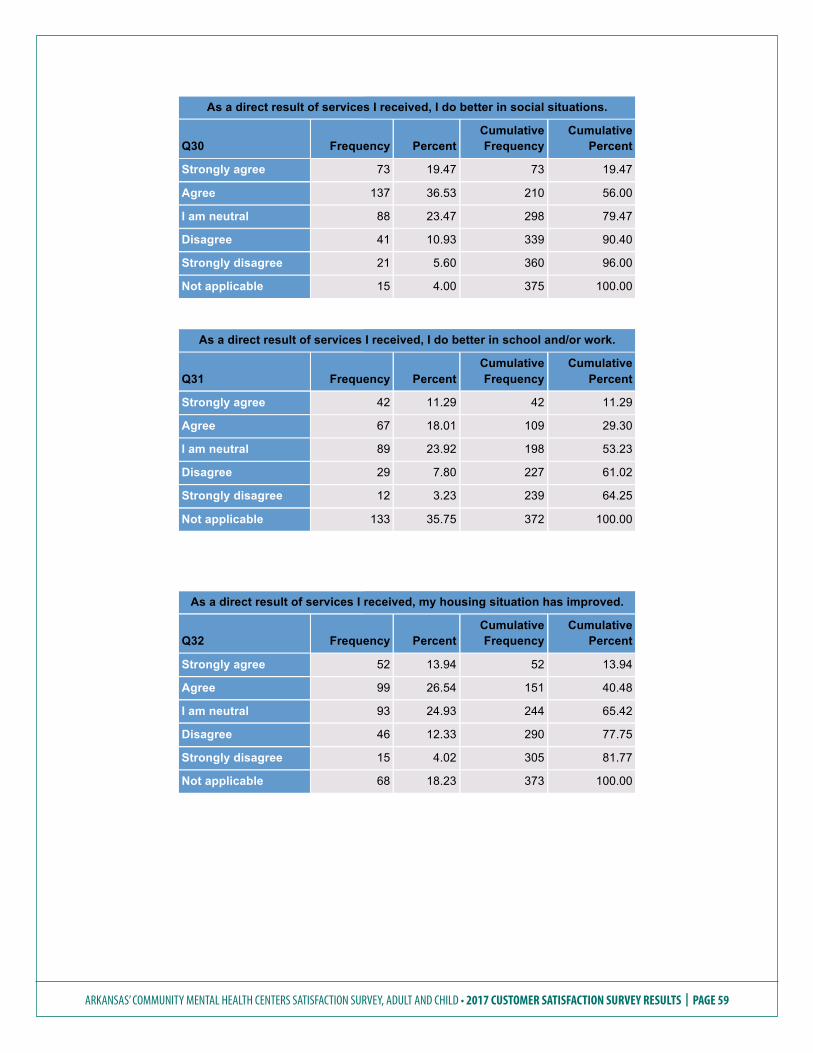
ARKANSAS’ COMMUNITY MENTAL HEALTH CENTERS SATISFACTION SURVEY, ADULT AND CHILD • 2017 CUSTOMER SATISFACTION SURVEY RESULTS | PAGE 59
As a direct result of services I received, I do better in social situations.
Q30 Frequency Percent Cumulative Frequency
Cumulative Percent
Strongly agree 73 19.47 73 19.47
Agree 137 36.53 210 56.00
I am neutral 88 23.47 298 79.47
Disagree 41 10.93 339 90.40
Strongly disagree 21 5.60 360 96.00
Not applicable 15 4.00 375 100.00
As a direct result of services I received, I do better in school and/or work.
Q31 Frequency Percent Cumulative Frequency
Cumulative Percent
Strongly agree 42 11.29 42 11.29
Agree 67 18.01 109 29.30
I am neutral 89 23.92 198 53.23
Disagree 29 7.80 227 61.02
Strongly disagree 12 3.23 239 64.25
Not applicable 133 35.75 372 100.00
As a direct result of services I received, my housing situation has improved.
Q32 Frequency Percent Cumulative Frequency
Cumulative Percent
Strongly agree 52 13.94 52 13.94
Agree 99 26.54 151 40.48
I am neutral 93 24.93 244 65.42
Disagree 46 12.33 290 77.75
Strongly disagree 15 4.02 305 81.77
Not applicable 68 18.23 373 100.00
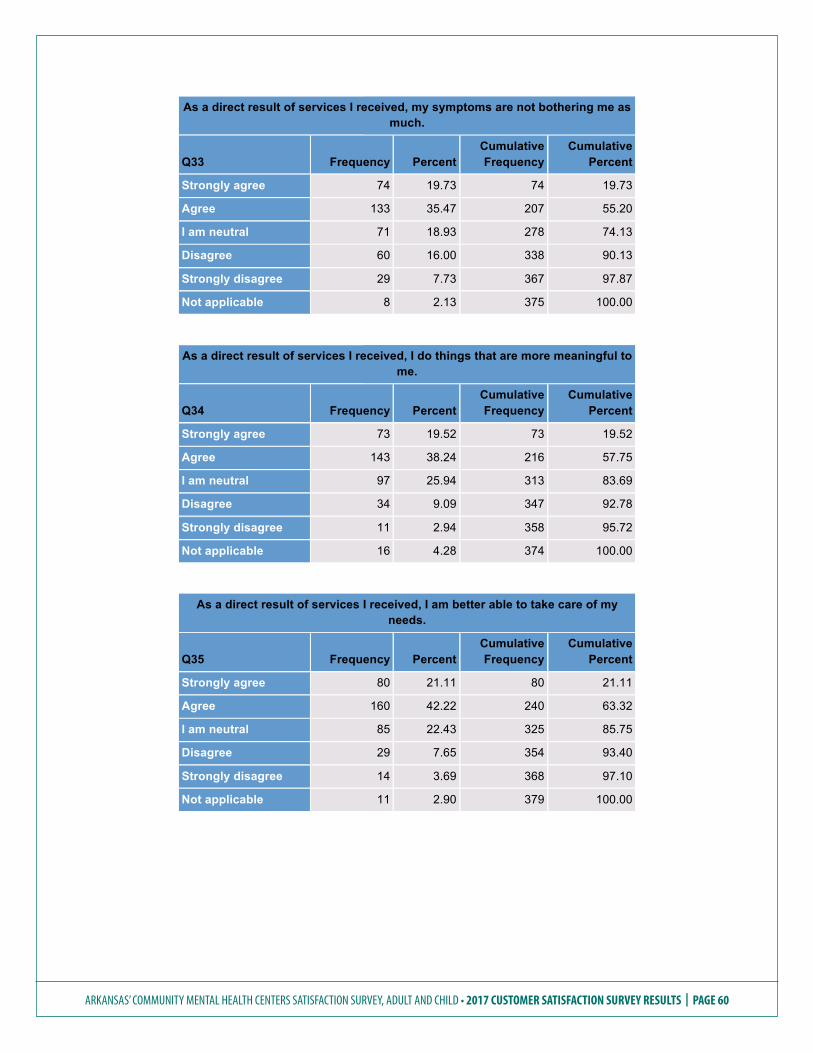
ARKANSAS’ COMMUNITY MENTAL HEALTH CENTERS SATISFACTION SURVEY, ADULT AND CHILD • 2017 CUSTOMER SATISFACTION SURVEY RESULTS | PAGE 60
As a direct result of services I received, my symptoms are not bothering me as much.
Q33 Frequency Percent Cumulative Frequency
Cumulative Percent
Strongly agree 74 19.73 74 19.73
Agree 133 35.47 207 55.20
I am neutral 71 18.93 278 74.13
Disagree 60 16.00 338 90.13
Strongly disagree 29 7.73 367 97.87
Not applicable 8 2.13 375 100.00
As a direct result of services I received, I do things that are more meaningful to me.
Q34 Frequency Percent Cumulative Frequency
Cumulative Percent
Strongly agree 73 19.52 73 19.52
Agree 143 38.24 216 57.75
I am neutral 97 25.94 313 83.69
Disagree 34 9.09 347 92.78
Strongly disagree 11 2.94 358 95.72
Not applicable 16 4.28 374 100.00
As a direct result of services I received, I am better able to take care of my needs.
Q35 Frequency Percent Cumulative Frequency
Cumulative Percent
Strongly agree 80 21.11 80 21.11
Agree 160 42.22 240 63.32
I am neutral 85 22.43 325 85.75
Disagree 29 7.65 354 93.40
Strongly disagree 14 3.69 368 97.10
Not applicable 11 2.90 379 100.00
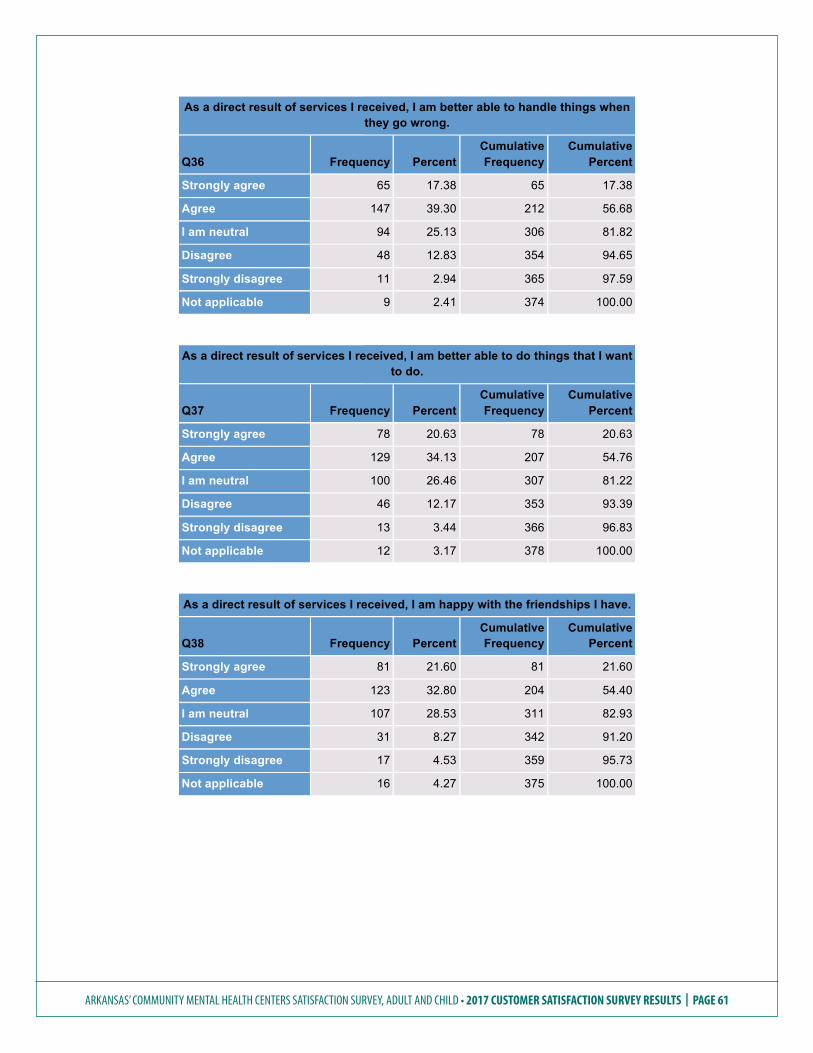
ARKANSAS’ COMMUNITY MENTAL HEALTH CENTERS SATISFACTION SURVEY, ADULT AND CHILD • 2017 CUSTOMER SATISFACTION SURVEY RESULTS | PAGE 61
As a direct result of services I received, I am better able to handle things when they go wrong.
Q36 Frequency Percent Cumulative Frequency
Cumulative Percent
Strongly agree 65 17.38 65 17.38
Agree 147 39.30 212 56.68
I am neutral 94 25.13 306 81.82
Disagree 48 12.83 354 94.65
Strongly disagree 11 2.94 365 97.59
Not applicable 9 2.41 374 100.00
As a direct result of services I received, I am better able to do things that I want to do.
Q37 Frequency Percent Cumulative Frequency
Cumulative Percent
Strongly agree 78 20.63 78 20.63
Agree 129 34.13 207 54.76
I am neutral 100 26.46 307 81.22
Disagree 46 12.17 353 93.39
Strongly disagree 13 3.44 366 96.83
Not applicable 12 3.17 378 100.00
As a direct result of services I received, I am happy with the friendships I have.
Q38 Frequency Percent Cumulative Frequency
Cumulative Percent
Strongly agree 81 21.60 81 21.60
Agree 123 32.80 204 54.40
I am neutral 107 28.53 311 82.93
Disagree 31 8.27 342 91.20
Strongly disagree 17 4.53 359 95.73
Not applicable 16 4.27 375 100.00
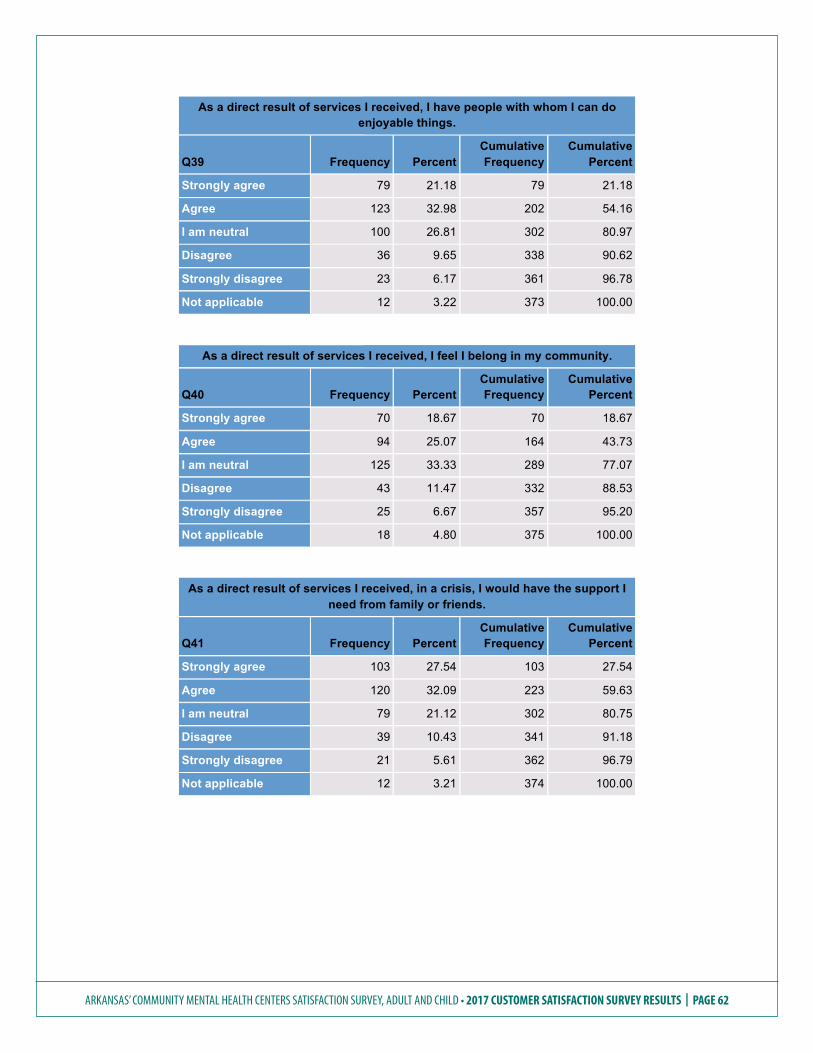
ARKANSAS’ COMMUNITY MENTAL HEALTH CENTERS SATISFACTION SURVEY, ADULT AND CHILD • 2017 CUSTOMER SATISFACTION SURVEY RESULTS | PAGE 62
As a direct result of services I received, I have people with whom I can do enjoyable things.
Q39 Frequency Percent Cumulative Frequency
Cumulative Percent
Strongly agree 79 21.18 79 21.18
Agree 123 32.98 202 54.16
I am neutral 100 26.81 302 80.97
Disagree 36 9.65 338 90.62
Strongly disagree 23 6.17 361 96.78
Not applicable 12 3.22 373 100.00
As a direct result of services I received, I feel I belong in my community.
Q40 Frequency Percent Cumulative Frequency
Cumulative Percent
Strongly agree 70 18.67 70 18.67
Agree 94 25.07 164 43.73
I am neutral 125 33.33 289 77.07
Disagree 43 11.47 332 88.53
Strongly disagree 25 6.67 357 95.20
Not applicable 18 4.80 375 100.00
As a direct result of services I received, in a crisis, I would have the support I need from family or friends.
Q41 Frequency Percent Cumulative Frequency
Cumulative Percent
Strongly agree 103 27.54 103 27.54
Agree 120 32.09 223 59.63
I am neutral 79 21.12 302 80.75
Disagree 39 10.43 341 91.18
Strongly disagree 21 5.61 362 96.79
Not applicable 12 3.21 374 100.00
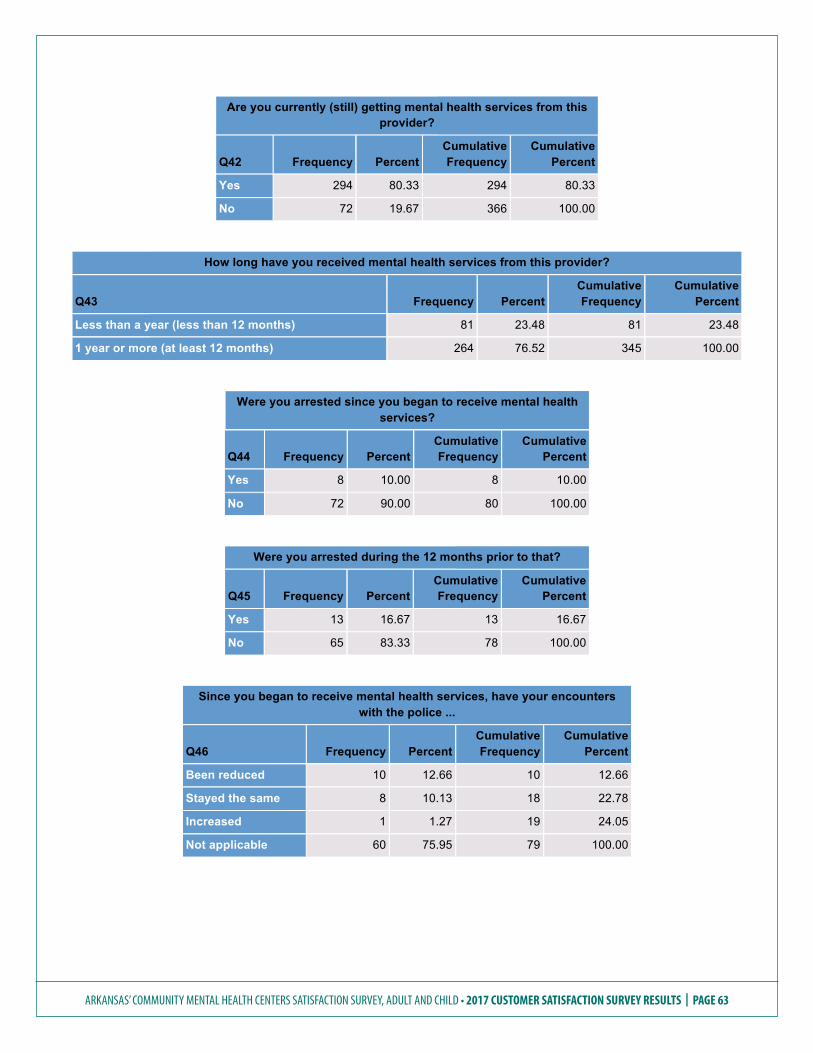
ARKANSAS’ COMMUNITY MENTAL HEALTH CENTERS SATISFACTION SURVEY, ADULT AND CHILD • 2017 CUSTOMER SATISFACTION SURVEY RESULTS | PAGE 63
Are you currently (still) getting mental health services from this provider?
Q42 Frequency Percent Cumulative Frequency
Cumulative Percent
Yes 294 80.33 294 80.33
No 72 19.67 366 100.00
How long have you received mental health services from this provider?
Q43 Frequency Percent Cumulative Frequency
Cumulative Percent
Less than a year (less than 12 months) 81 23.48 81 23.48
1 year or more (at least 12 months) 264 76.52 345 100.00
Were you arrested since you began to receive mental health services?
Q44 Frequency Percent Cumulative Frequency
Cumulative Percent
Yes 8 10.00 8 10.00
No 72 90.00 80 100.00
Were you arrested during the 12 months prior to that?
Q45 Frequency Percent Cumulative Frequency
Cumulative Percent
Yes 13 16.67 13 16.67
No 65 83.33 78 100.00
Since you began to receive mental health services, have your encounters with the police ...
Q46 Frequency Percent Cumulative Frequency
Cumulative Percent
Been reduced 10 12.66 10 12.66
Stayed the same 8 10.13 18 22.78
Increased 1 1.27 19 24.05
Not applicable 60 75.95 79 100.00
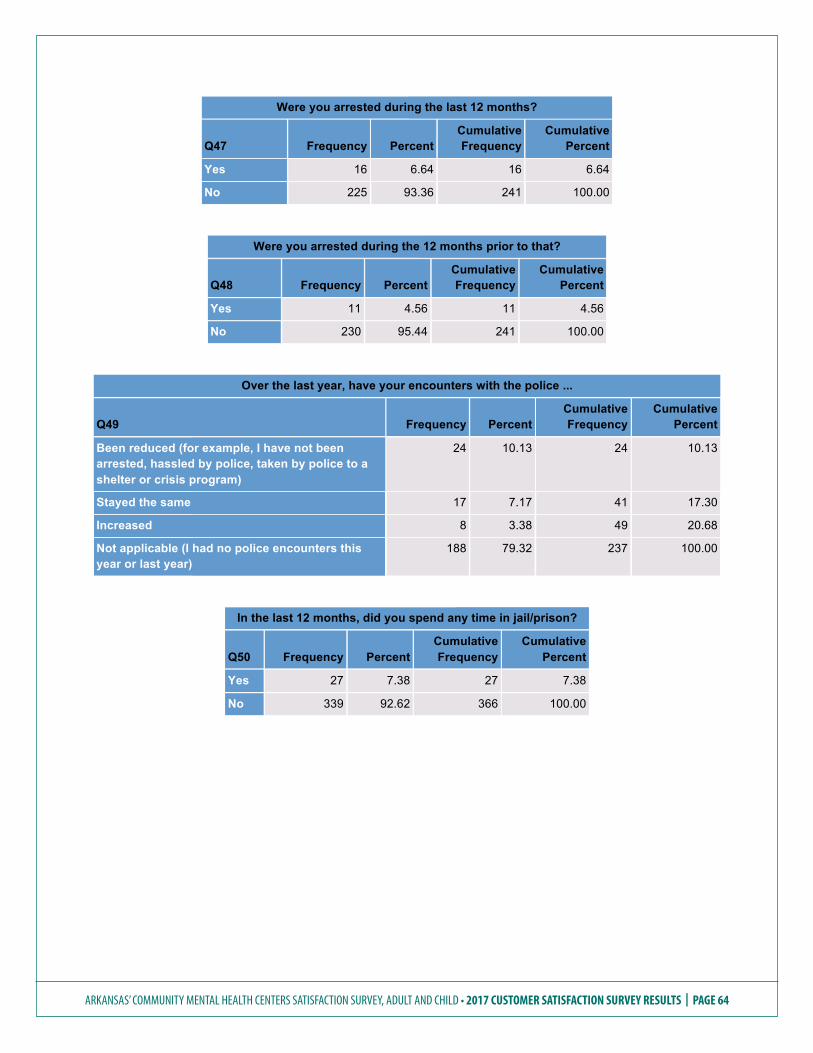
ARKANSAS’ COMMUNITY MENTAL HEALTH CENTERS SATISFACTION SURVEY, ADULT AND CHILD • 2017 CUSTOMER SATISFACTION SURVEY RESULTS | PAGE 64
Were you arrested during the last 12 months?
Q47 Frequency Percent Cumulative Frequency
Cumulative Percent
Yes 16 6.64 16 6.64
No 225 93.36 241 100.00
Were you arrested during the 12 months prior to that?
Q48 Frequency Percent Cumulative Frequency
Cumulative Percent
Yes 11 4.56 11 4.56
No 230 95.44 241 100.00
Over the last year, have your encounters with the police ...
Q49 Frequency Percent Cumulative Frequency
Cumulative Percent
Been reduced (for example, I have not been arrested, hassled by police, taken by police to a shelter or crisis program)
24 10.13 24 10.13
Stayed the same 17 7.17 41 17.30
Increased 8 3.38 49 20.68
Not applicable (I had no police encounters this year or last year)
188 79.32 237 100.00
In the last 12 months, did you spend any time in jail/prison?
Q50 Frequency Percent Cumulative Frequency
Cumulative Percent
Yes 27 7.38 27 7.38
No 339 92.62 366 100.00
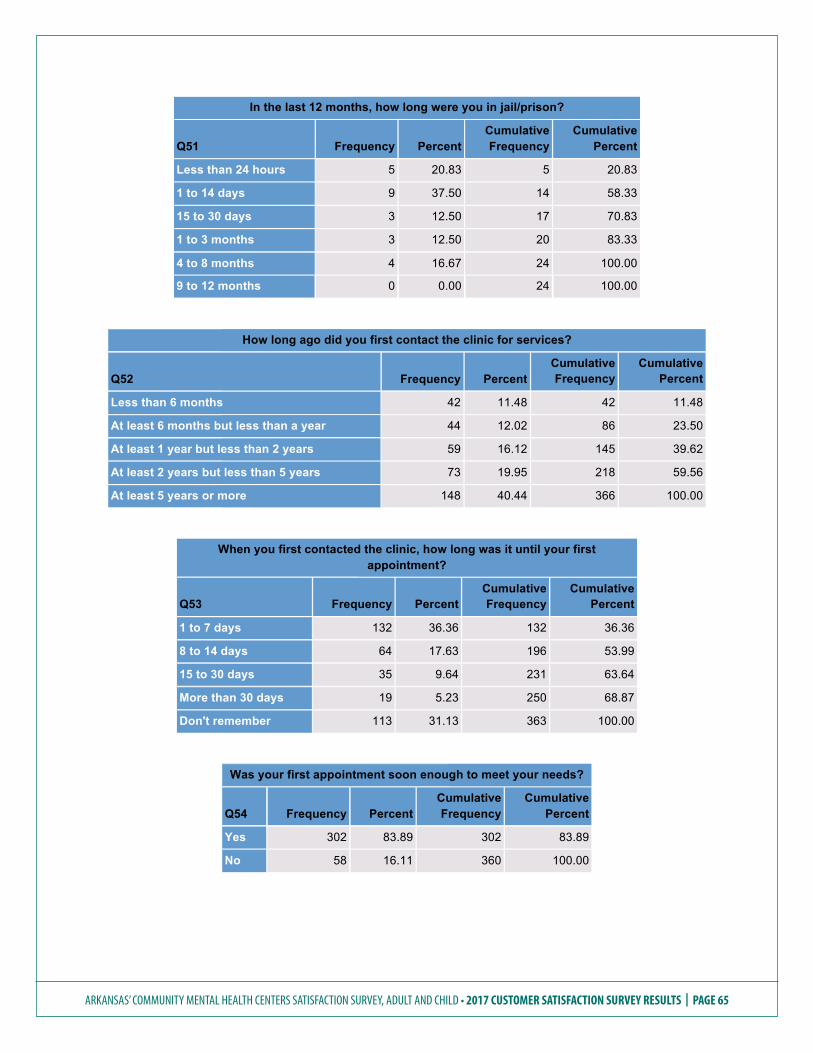
ARKANSAS’ COMMUNITY MENTAL HEALTH CENTERS SATISFACTION SURVEY, ADULT AND CHILD • 2017 CUSTOMER SATISFACTION SURVEY RESULTS | PAGE 65
In the last 12 months, how long were you in jail/prison?
Q51 Frequency Percent Cumulative Frequency
Cumulative Percent
Less than 24 hours 5 20.83 5 20.83
1 to 14 days 9 37.50 14 58.33
15 to 30 days 3 12.50 17 70.83
1 to 3 months 3 12.50 20 83.33
4 to 8 months 4 16.67 24 100.00
9 to 12 months 0 0.00 24 100.00
How long ago did you first contact the clinic for services?
Q52 Frequency Percent Cumulative Frequency
Cumulative Percent
Less than 6 months 42 11.48 42 11.48
At least 6 months but less than a year 44 12.02 86 23.50
At least 1 year but less than 2 years 59 16.12 145 39.62
At least 2 years but less than 5 years 73 19.95 218 59.56
At least 5 years or more 148 40.44 366 100.00
When you first contacted the clinic, how long was it until your first appointment?
Q53 Frequency Percent Cumulative Frequency
Cumulative Percent
1 to 7 days 132 36.36 132 36.36
8 to 14 days 64 17.63 196 53.99
15 to 30 days 35 9.64 231 63.64
More than 30 days 19 5.23 250 68.87
Don't remember 113 31.13 363 100.00
Was your first appointment soon enough to meet your needs?
Q54 Frequency Percent Cumulative Frequency
Cumulative Percent
Yes 302 83.89 302 83.89
No 58 16.11 360 100.00
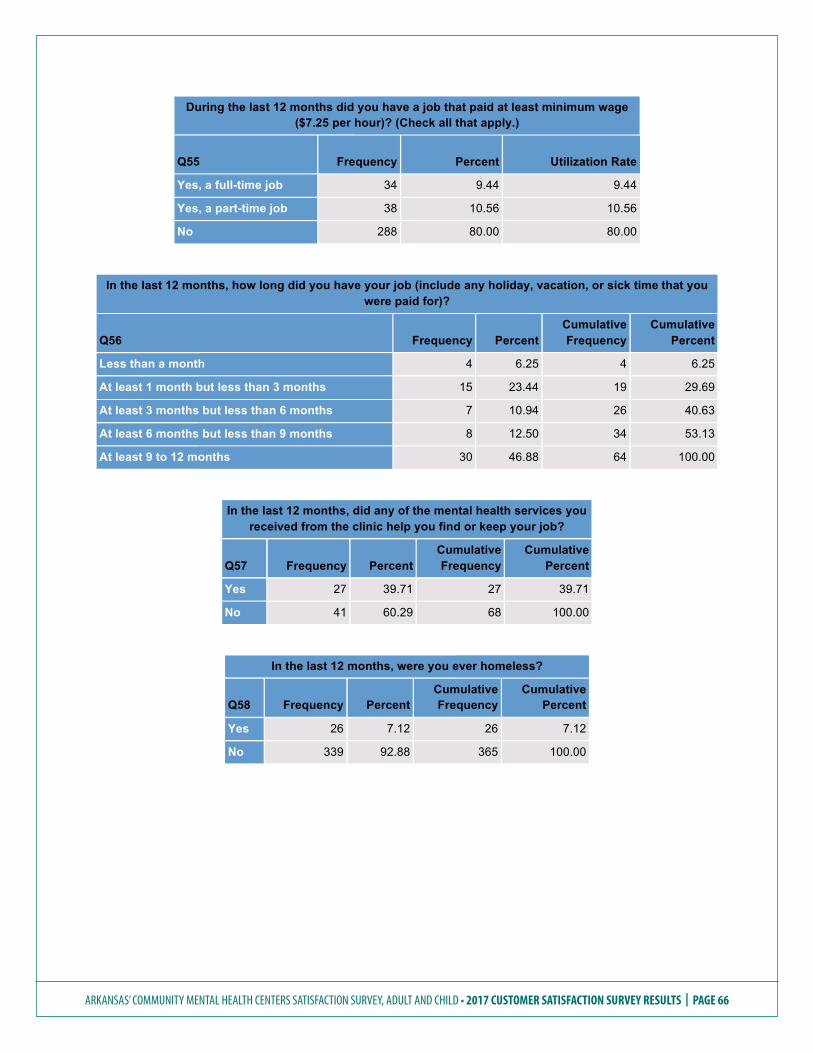
ARKANSAS’ COMMUNITY MENTAL HEALTH CENTERS SATISFACTION SURVEY, ADULT AND CHILD • 2017 CUSTOMER SATISFACTION SURVEY RESULTS | PAGE 66
During the last 12 months did you have a job that paid at least minimum wage ($7.25 per hour)? (Check all that apply.)
Q55 Frequency Percent Utilization Rate
Yes, a full-time job 34 9.44 9.44
Yes, a part-time job 38 10.56 10.56
No 288 80.00 80.00
In the last 12 months, how long did you have your job (include any holiday, vacation, or sick time that you were paid for)?
Q56 Frequency Percent Cumulative Frequency
Cumulative Percent
Less than a month 4 6.25 4 6.25
At least 1 month but less than 3 months 15 23.44 19 29.69
At least 3 months but less than 6 months 7 10.94 26 40.63
At least 6 months but less than 9 months 8 12.50 34 53.13
At least 9 to 12 months 30 46.88 64 100.00
In the last 12 months, did any of the mental health services you received from the clinic help you find or keep your job?
Q57 Frequency Percent Cumulative Frequency
Cumulative Percent
Yes 27 39.71 27 39.71
No 41 60.29 68 100.00
In the last 12 months, were you ever homeless?
Q58 Frequency Percent Cumulative Frequency
Cumulative Percent
Yes 26 7.12 26 7.12
No 339 92.88 365 100.00
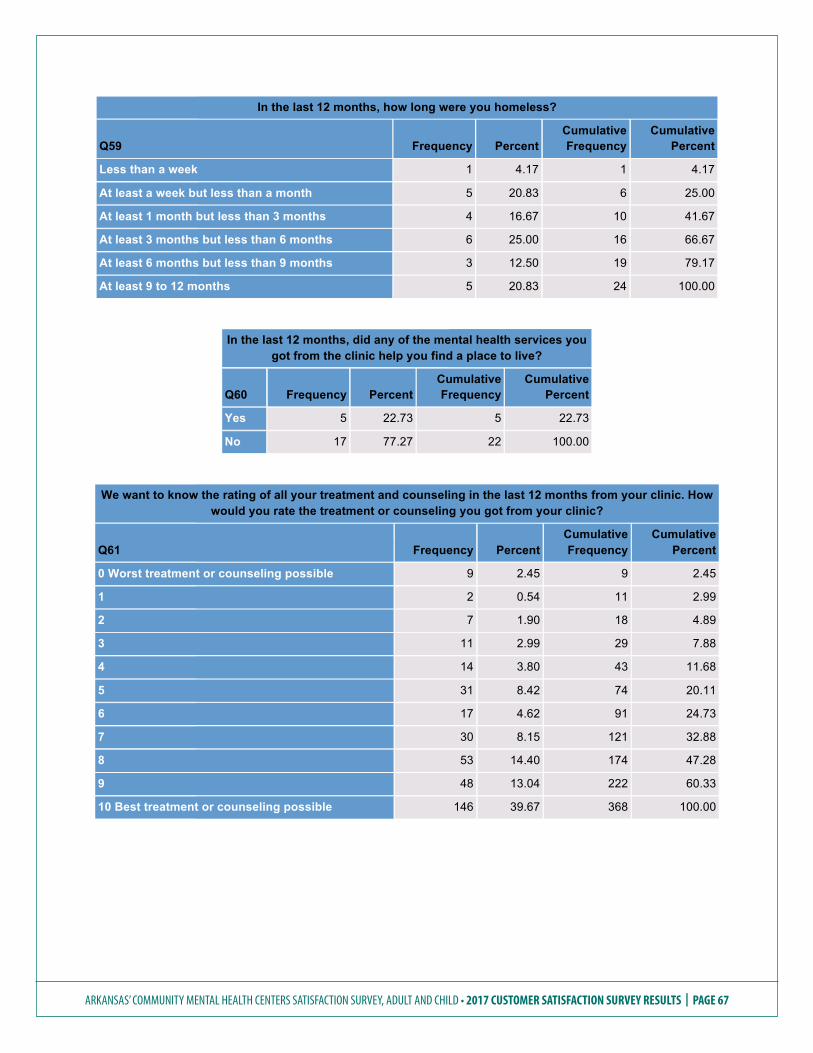
ARKANSAS’ COMMUNITY MENTAL HEALTH CENTERS SATISFACTION SURVEY, ADULT AND CHILD • 2017 CUSTOMER SATISFACTION SURVEY RESULTS | PAGE 67
In the last 12 months, how long were you homeless?
Q59 Frequency Percent Cumulative Frequency
Cumulative Percent
Less than a week 1 4.17 1 4.17
At least a week but less than a month 5 20.83 6 25.00
At least 1 month but less than 3 months 4 16.67 10 41.67
At least 3 months but less than 6 months 6 25.00 16 66.67
At least 6 months but less than 9 months 3 12.50 19 79.17
At least 9 to 12 months 5 20.83 24 100.00
In the last 12 months, did any of the mental health services you got from the clinic help you find a place to live?
Q60 Frequency Percent Cumulative Frequency
Cumulative Percent
Yes 5 22.73 5 22.73
No 17 77.27 22 100.00
We want to know the rating of all your treatment and counseling in the last 12 months from your clinic. How would you rate the treatment or counseling you got from your clinic?
Q61 Frequency Percent Cumulative Frequency
Cumulative Percent
0 Worst treatment or counseling possible 9 2.45 9 2.45
1 2 0.54 11 2.99
2 7 1.90 18 4.89
3 11 2.99 29 7.88
4 14 3.80 43 11.68
5 31 8.42 74 20.11
6 17 4.62 91 24.73
7 30 8.15 121 32.88
8 53 14.40 174 47.28
9 48 13.04 222 60.33
10 Best treatment or counseling possible 146 39.67 368 100.00
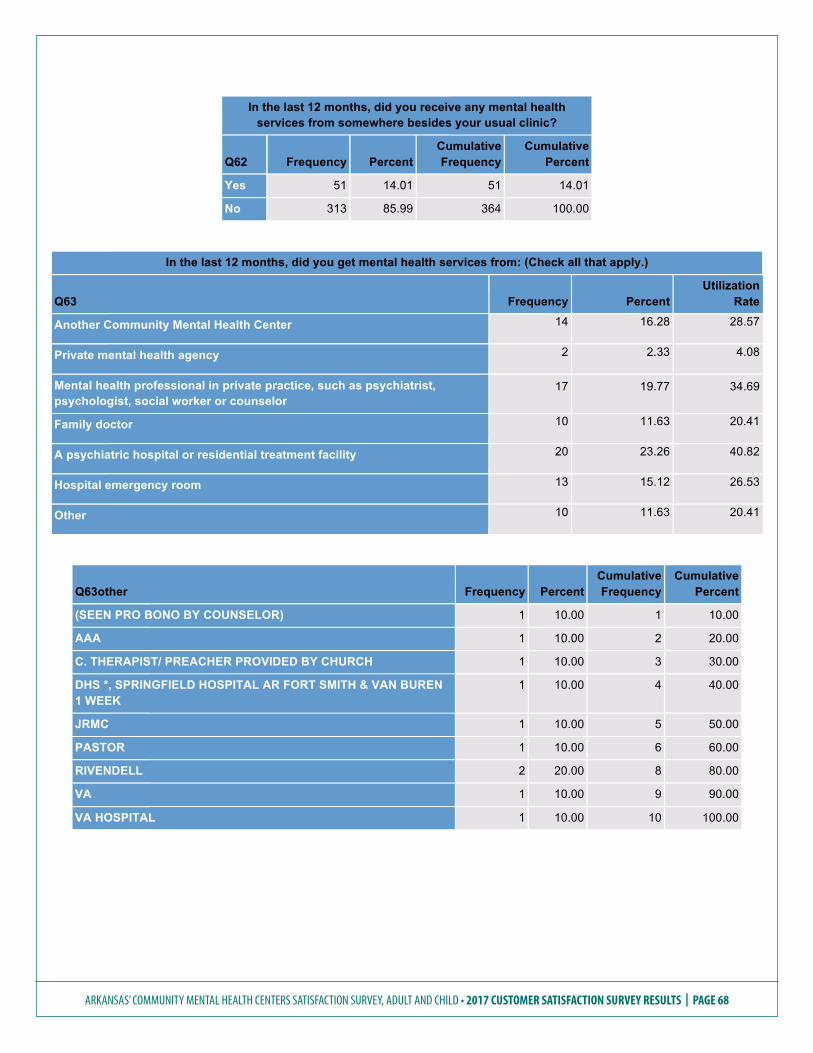
ARKANSAS’ COMMUNITY MENTAL HEALTH CENTERS SATISFACTION SURVEY, ADULT AND CHILD • 2017 CUSTOMER SATISFACTION SURVEY RESULTS | PAGE 68
In the last 12 months, did you receive any mental health services from somewhere besides your usual clinic?
Q62 Frequency Percent Cumulative Frequency
Cumulative Percent
Yes 51 14.01 51 14.01
No 313 85.99 364 100.00
In the last 12 months, did you get mental health services from: (Check all that apply.)
Q63 Frequency Percent Utilization
Rate
Another Community Mental Health Center 14 16.28 28.57
Private mental health agency 2 2.33 4.08
Mental health professional in private practice, such as psychiatrist, psychologist, social worker or counselor
17 19.77 34.69
Family doctor 10 11.63 20.41
A psychiatric hospital or residential treatment facility 20 23.26 40.82
Hospital emergency room 13 15.12 26.53
Other 10 11.63 20.41
Q63other Frequency Percent Cumulative Frequency
Cumulative Percent
(SEEN PRO BONO BY COUNSELOR) 1 10.00 1 10.00
AAA 1 10.00 2 20.00
C. THERAPIST/ PREACHER PROVIDED BY CHURCH 1 10.00 3 30.00
DHS *, SPRINGFIELD HOSPITAL AR FORT SMITH & VAN BUREN 1 WEEK
1 10.00 4 40.00
JRMC 1 10.00 5 50.00
PASTOR 1 10.00 6 60.00
RIVENDELL 2 20.00 8 80.00
VA 1 10.00 9 90.00
VA HOSPITAL 1 10.00 10 100.00
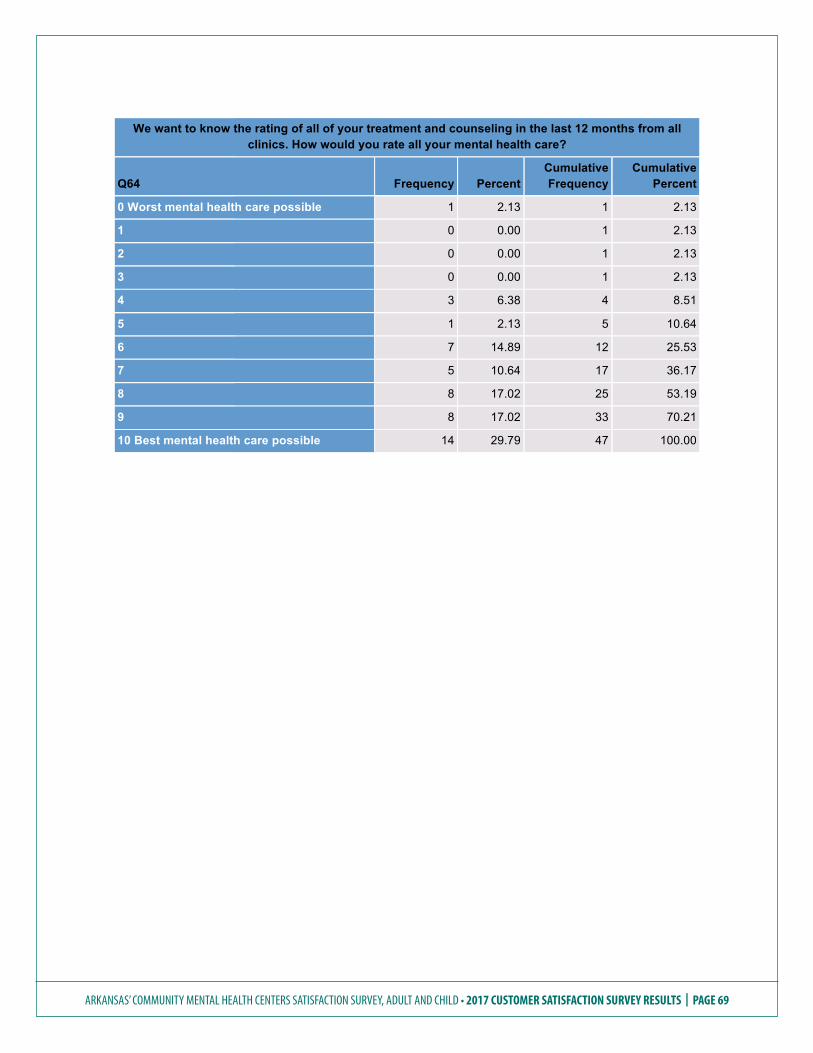
ARKANSAS’ COMMUNITY MENTAL HEALTH CENTERS SATISFACTION SURVEY, ADULT AND CHILD • 2017 CUSTOMER SATISFACTION SURVEY RESULTS | PAGE 69
We want to know the rating of all of your treatment and counseling in the last 12 months from all clinics. How would you rate all your mental health care?
Q64 Frequency Percent Cumulative Frequency
Cumulative Percent
0 Worst mental health care possible 1 2.13 1 2.13
1 0 0.00 1 2.13
2 0 0.00 1 2.13
3 0 0.00 1 2.13
4 3 6.38 4 8.51
5 1 2.13 5 10.64
6 7 14.89 12 25.53
7 5 10.64 17 36.17
8 8 17.02 25 53.19
9 8 17.02 33 70.21
10 Best mental health care possible 14 29.79 47 100.00

ARKANSAS’ COMMUNITY MENTAL HEALTH CENTERS SATISFACTION SURVEY, ADULT AND CHILD • 2017 CUSTOMER SATISFACTION SURVEY RESULTS | PAGE 70
THIS PAGE INTENTIONALLY LEFT BLANK
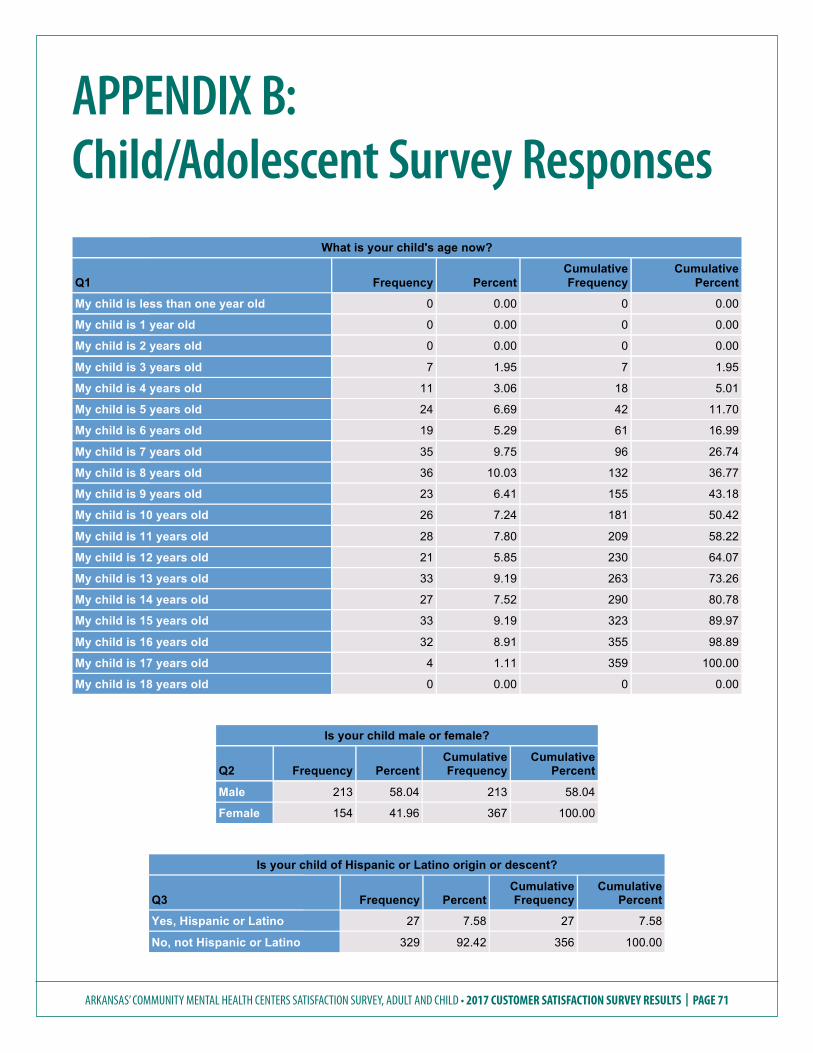
ARKANSAS’ COMMUNITY MENTAL HEALTH CENTERS SATISFACTION SURVEY, ADULT AND CHILD • 2017 CUSTOMER SATISFACTION SURVEY RESULTS | PAGE 71
Appendix B: Child/Adolescent Survey Responses
What is your child's age now?
Q1 Frequency Percent Cumulative Frequency
Cumulative Percent
My child is less than one year old 0 0.00 0 0.00
My child is 1 year old 0 0.00 0 0.00
My child is 2 years old 0 0.00 0 0.00
My child is 3 years old 7 1.95 7 1.95
My child is 4 years old 11 3.06 18 5.01
My child is 5 years old 24 6.69 42 11.70
My child is 6 years old 19 5.29 61 16.99
My child is 7 years old 35 9.75 96 26.74
My child is 8 years old 36 10.03 132 36.77
My child is 9 years old 23 6.41 155 43.18
My child is 10 years old 26 7.24 181 50.42
My child is 11 years old 28 7.80 209 58.22
My child is 12 years old 21 5.85 230 64.07
My child is 13 years old 33 9.19 263 73.26
My child is 14 years old 27 7.52 290 80.78
My child is 15 years old 33 9.19 323 89.97
My child is 16 years old 32 8.91 355 98.89
My child is 17 years old 4 1.11 359 100.00
My child is 18 years old 0 0.00 0 0.00
Is your child male or female?
Q2 Frequency Percent Cumulative Frequency
Cumulative Percent
Male 213 58.04 213 58.04
Female 154 41.96 367 100.00
Is your child of Hispanic or Latino origin or descent?
Q3 Frequency Percent Cumulative Frequency
Cumulative Percent
Yes, Hispanic or Latino 27 7.58 27 7.58
No, not Hispanic or Latino 329 92.42 356 100.00
APPENDIX B:Child/Adolescent Survey Responses

ARKANSAS’ COMMUNITY MENTAL HEALTH CENTERS SATISFACTION SURVEY, ADULT AND CHILD • 2017 CUSTOMER SATISFACTION SURVEY RESULTS | PAGE 72
What is your child's race?
Q4 Frequency Percent Cumulative Frequency
Cumulative Percent
White 248 68.32 248 68.32
Black or African-American 82 22.59 330 90.91
Asian 1 0.28 331 91.18
Native Hawaiian or other Pacific Islander 0 0.00 331 91.18
American Indian or Alaska Native 5 1.38 336 92.56
Multiracial 27 7.44 363 100.00
How much of the treatment or counseling your child received in the last 12 months was paid for by Medicaid?
Q5 Frequency Percent Cumulative Frequency
Cumulative Percent
All treatment or counseling was paid by Medicaid 314 86.03 314 86.03
Only part of the treatment or counseling was paid for by Medicaid
23 6.30 337 92.33
None of the treatment or counseling was paid for by Medicaid
28 7.67 365 100.00
Overall, I am satisfied with the services my child received.
Q6 Frequency Percent Cumulative Frequency
Cumulative Percent
Strongly disagree 14 3.86 14 3.86
Disagree 17 4.68 31 8.54
Undecided 31 8.54 62 17.08
Agree 168 46.28 230 63.36
Strongly agree 133 36.64 363 100.00
I helped to choose my child's services.
Q7 Frequency Percent Cumulative Frequency
Cumulative Percent
Strongly disagree 14 3.86 14 3.86
Disagree 24 6.61 38 10.47
Undecided 31 8.54 69 19.01
Agree 199 54.82 268 73.83
Strongly agree 95 26.17 363 100.00

ARKANSAS’ COMMUNITY MENTAL HEALTH CENTERS SATISFACTION SURVEY, ADULT AND CHILD • 2017 CUSTOMER SATISFACTION SURVEY RESULTS | PAGE 73
I helped to choose my child's treatment goals.
Q8 Frequency Percent Cumulative Frequency
Cumulative Percent
Strongly disagree 7 1.93 7 1.93
Disagree 18 4.97 25 6.91
Undecided 27 7.46 52 14.36
Agree 196 54.14 248 68.51
Strongly agree 114 31.49 362 100.00
The people helping my child stuck with us no matter what.
Q9 Frequency Percent Cumulative Frequency
Cumulative Percent
Strongly disagree 14 3.87 14 3.87
Disagree 18 4.97 32 8.84
Undecided 33 9.12 65 17.96
Agree 173 47.79 238 65.75
Strongly agree 124 34.25 362 100.00
I felt my child had someone to talk to when he/she was troubled.
Q10 Frequency Percent Cumulative Frequency
Cumulative Percent
Strongly disagree 9 2.48 9 2.48
Disagree 20 5.51 29 7.99
Undecided 33 9.09 62 17.08
Agree 182 50.14 244 67.22
Strongly agree 119 32.78 363 100.00
I participated in my child's treatment.
Q11 Frequency Percent Cumulative Frequency
Cumulative Percent
Strongly disagree 9 2.49 9 2.49
Disagree 10 2.76 19 5.25
Undecided 16 4.42 35 9.67
Agree 180 49.72 215 59.39
Strongly agree 147 40.61 362 100.00

ARKANSAS’ COMMUNITY MENTAL HEALTH CENTERS SATISFACTION SURVEY, ADULT AND CHILD • 2017 CUSTOMER SATISFACTION SURVEY RESULTS | PAGE 74
The services my child and/or family received were right for us.
Q12 Frequency Percent Cumulative Frequency
Cumulative Percent
Strongly disagree 11 3.03 11 3.03
Disagree 16 4.41 27 7.44
Undecided 42 11.57 69 19.01
Agree 192 52.89 261 71.90
Strongly agree 102 28.10 363 100.00
The location of services was convenient for us.
Q13 Frequency Percent Cumulative Frequency
Cumulative Percent
Strongly disagree 7 1.92 7 1.92
Disagree 13 3.57 20 5.49
Undecided 18 4.95 38 10.44
Agree 192 52.75 230 63.19
Strongly agree 134 36.81 364 100.00
Services were available at times that were convenient for us.
Q14 Frequency Percent Cumulative Frequency
Cumulative Percent
Strongly disagree 7 1.92 7 1.92
Disagree 15 4.12 22 6.04
Undecided 23 6.32 45 12.36
Agree 207 56.87 252 69.23
Strongly agree 112 30.77 364 100.00
My family got the help we wanted for my child.
Q15 Frequency Percent Cumulative Frequency
Cumulative Percent
Strongly disagree 13 3.59 13 3.59
Disagree 20 5.52 33 9.12
Undecided 50 13.81 83 22.93
Agree 179 49.45 262 72.38
Strongly agree 100 27.62 362 100.00
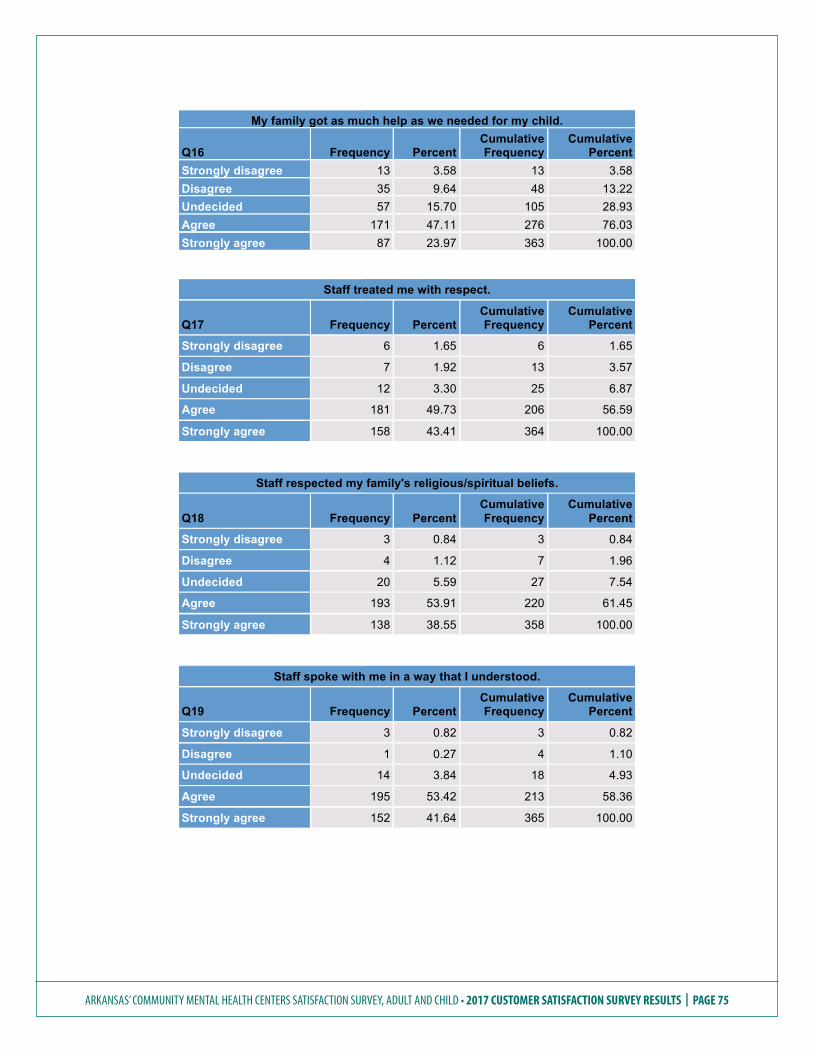
ARKANSAS’ COMMUNITY MENTAL HEALTH CENTERS SATISFACTION SURVEY, ADULT AND CHILD • 2017 CUSTOMER SATISFACTION SURVEY RESULTS | PAGE 75
My family got as much help as we needed for my child.
Q16 Frequency Percent Cumulative Frequency
Cumulative Percent
Strongly disagree 13 3.58 13 3.58 Disagree 35 9.64 48 13.22 Undecided 57 15.70 105 28.93 Agree 171 47.11 276 76.03 Strongly agree 87 23.97 363 100.00
Staff treated me with respect.
Q17 Frequency Percent Cumulative Frequency
Cumulative Percent
Strongly disagree 6 1.65 6 1.65
Disagree 7 1.92 13 3.57
Undecided 12 3.30 25 6.87
Agree 181 49.73 206 56.59
Strongly agree 158 43.41 364 100.00
Staff respected my family's religious/spiritual beliefs.
Q18 Frequency Percent Cumulative Frequency
Cumulative Percent
Strongly disagree 3 0.84 3 0.84
Disagree 4 1.12 7 1.96
Undecided 20 5.59 27 7.54
Agree 193 53.91 220 61.45
Strongly agree 138 38.55 358 100.00
Staff spoke with me in a way that I understood.
Q19 Frequency Percent Cumulative Frequency
Cumulative Percent
Strongly disagree 3 0.82 3 0.82
Disagree 1 0.27 4 1.10
Undecided 14 3.84 18 4.93
Agree 195 53.42 213 58.36
Strongly agree 152 41.64 365 100.00
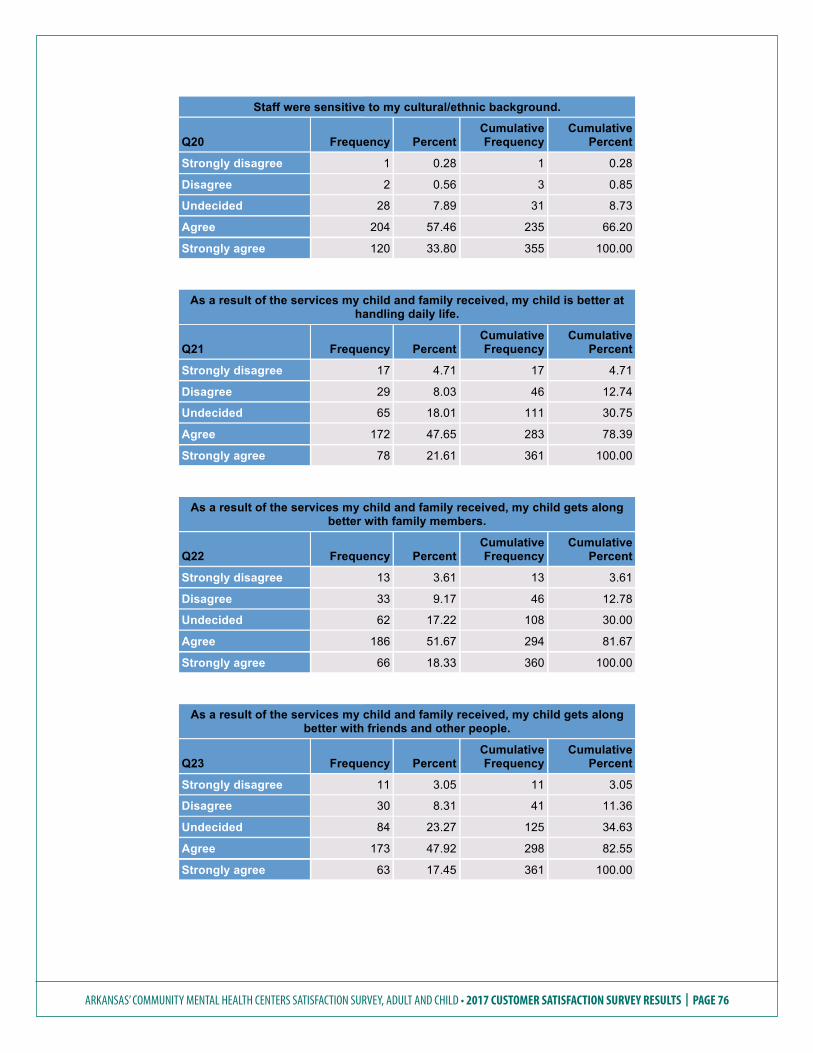
ARKANSAS’ COMMUNITY MENTAL HEALTH CENTERS SATISFACTION SURVEY, ADULT AND CHILD • 2017 CUSTOMER SATISFACTION SURVEY RESULTS | PAGE 76
Staff were sensitive to my cultural/ethnic background.
Q20 Frequency Percent Cumulative Frequency
Cumulative Percent
Strongly disagree 1 0.28 1 0.28
Disagree 2 0.56 3 0.85
Undecided 28 7.89 31 8.73
Agree 204 57.46 235 66.20
Strongly agree 120 33.80 355 100.00
As a result of the services my child and family received, my child is better at handling daily life.
Q21 Frequency Percent Cumulative Frequency
Cumulative Percent
Strongly disagree 17 4.71 17 4.71
Disagree 29 8.03 46 12.74
Undecided 65 18.01 111 30.75
Agree 172 47.65 283 78.39
Strongly agree 78 21.61 361 100.00
As a result of the services my child and family received, my child gets along better with family members.
Q22 Frequency Percent Cumulative Frequency
Cumulative Percent
Strongly disagree 13 3.61 13 3.61
Disagree 33 9.17 46 12.78
Undecided 62 17.22 108 30.00
Agree 186 51.67 294 81.67
Strongly agree 66 18.33 360 100.00
As a result of the services my child and family received, my child gets along better with friends and other people.
Q23 Frequency Percent Cumulative Frequency
Cumulative Percent
Strongly disagree 11 3.05 11 3.05
Disagree 30 8.31 41 11.36
Undecided 84 23.27 125 34.63
Agree 173 47.92 298 82.55
Strongly agree 63 17.45 361 100.00
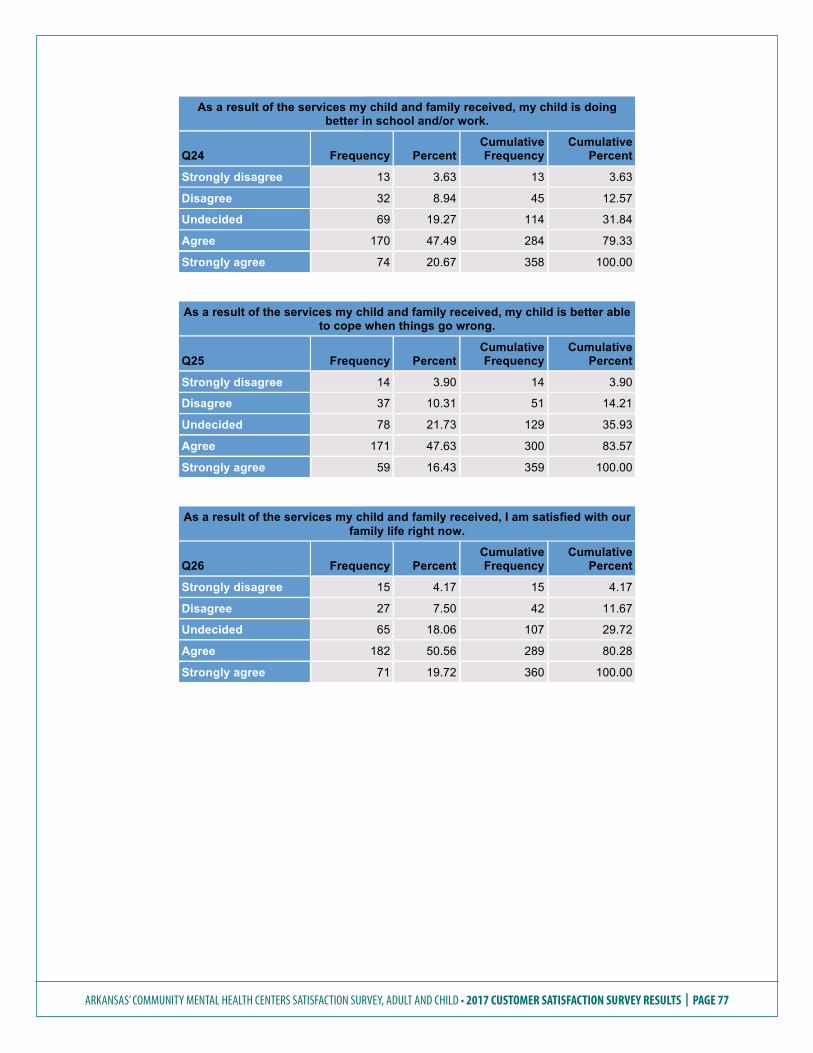
ARKANSAS’ COMMUNITY MENTAL HEALTH CENTERS SATISFACTION SURVEY, ADULT AND CHILD • 2017 CUSTOMER SATISFACTION SURVEY RESULTS | PAGE 77
As a result of the services my child and family received, my child is doing better in school and/or work.
Q24 Frequency Percent Cumulative Frequency
Cumulative Percent
Strongly disagree 13 3.63 13 3.63
Disagree 32 8.94 45 12.57
Undecided 69 19.27 114 31.84
Agree 170 47.49 284 79.33
Strongly agree 74 20.67 358 100.00
As a result of the services my child and family received, my child is better able to cope when things go wrong.
Q25 Frequency Percent Cumulative Frequency
Cumulative Percent
Strongly disagree 14 3.90 14 3.90
Disagree 37 10.31 51 14.21
Undecided 78 21.73 129 35.93
Agree 171 47.63 300 83.57
Strongly agree 59 16.43 359 100.00
As a result of the services my child and family received, I am satisfied with our family life right now.
Q26 Frequency Percent Cumulative Frequency
Cumulative Percent
Strongly disagree 15 4.17 15 4.17
Disagree 27 7.50 42 11.67
Undecided 65 18.06 107 29.72
Agree 182 50.56 289 80.28
Strongly agree 71 19.72 360 100.00
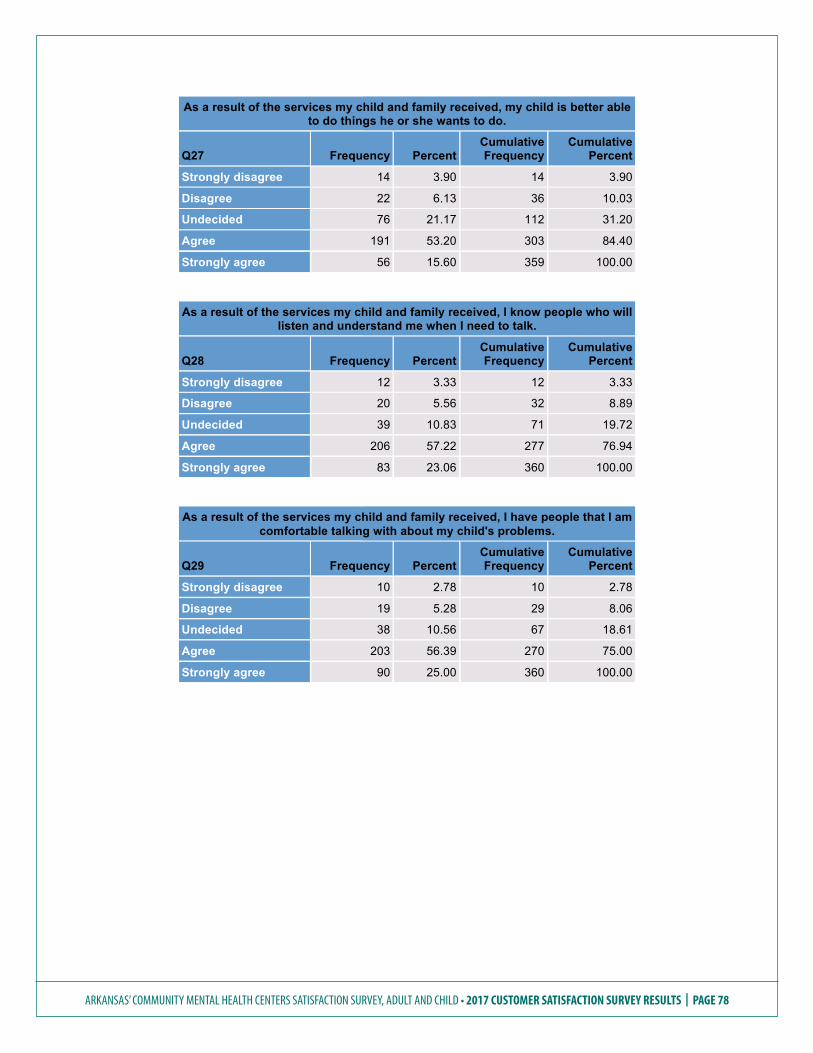
ARKANSAS’ COMMUNITY MENTAL HEALTH CENTERS SATISFACTION SURVEY, ADULT AND CHILD • 2017 CUSTOMER SATISFACTION SURVEY RESULTS | PAGE 78
As a result of the services my child and family received, my child is better able to do things he or she wants to do.
Q27 Frequency Percent Cumulative Frequency
Cumulative Percent
Strongly disagree 14 3.90 14 3.90
Disagree 22 6.13 36 10.03
Undecided 76 21.17 112 31.20
Agree 191 53.20 303 84.40
Strongly agree 56 15.60 359 100.00
As a result of the services my child and family received, I know people who will listen and understand me when I need to talk.
Q28 Frequency Percent Cumulative Frequency
Cumulative Percent
Strongly disagree 12 3.33 12 3.33
Disagree 20 5.56 32 8.89
Undecided 39 10.83 71 19.72
Agree 206 57.22 277 76.94
Strongly agree 83 23.06 360 100.00
As a result of the services my child and family received, I have people that I am comfortable talking with about my child's problems.
Q29 Frequency Percent Cumulative Frequency
Cumulative Percent
Strongly disagree 10 2.78 10 2.78
Disagree 19 5.28 29 8.06
Undecided 38 10.56 67 18.61
Agree 203 56.39 270 75.00
Strongly agree 90 25.00 360 100.00
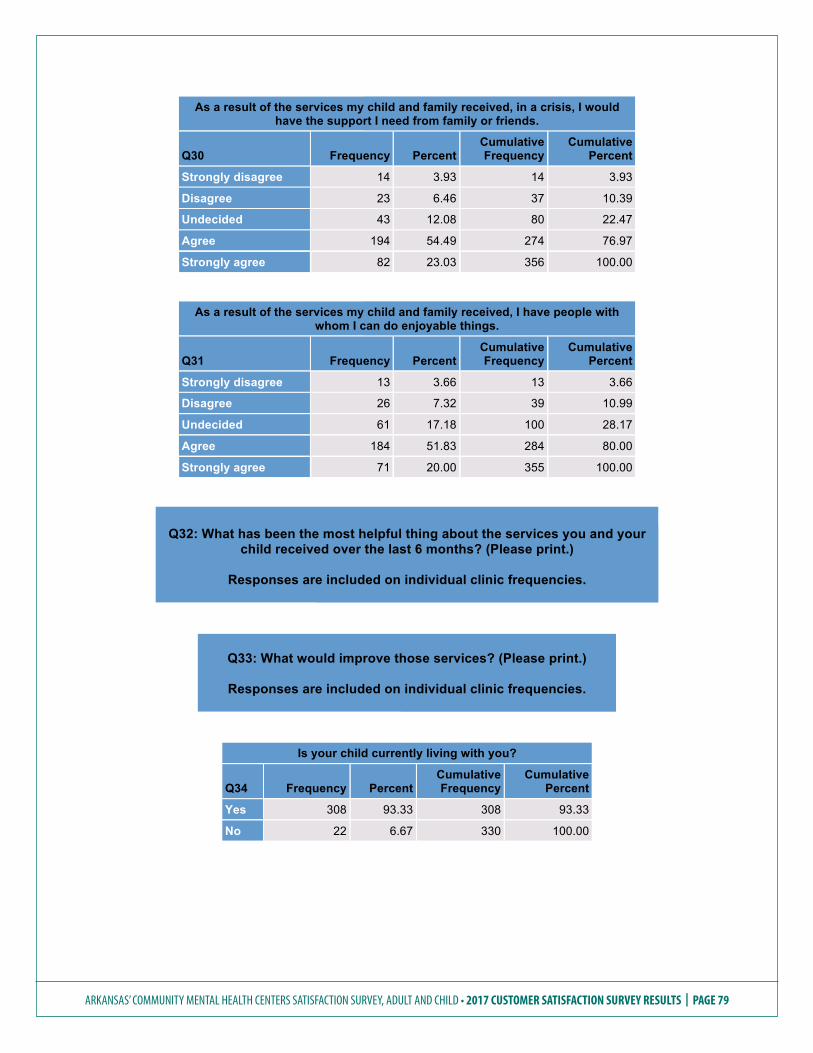
ARKANSAS’ COMMUNITY MENTAL HEALTH CENTERS SATISFACTION SURVEY, ADULT AND CHILD • 2017 CUSTOMER SATISFACTION SURVEY RESULTS | PAGE 79
As a result of the services my child and family received, in a crisis, I would have the support I need from family or friends.
Q30 Frequency Percent Cumulative Frequency
Cumulative Percent
Strongly disagree 14 3.93 14 3.93
Disagree 23 6.46 37 10.39
Undecided 43 12.08 80 22.47
Agree 194 54.49 274 76.97
Strongly agree 82 23.03 356 100.00
As a result of the services my child and family received, I have people with whom I can do enjoyable things.
Q31 Frequency Percent Cumulative Frequency
Cumulative Percent
Strongly disagree 13 3.66 13 3.66
Disagree 26 7.32 39 10.99
Undecided 61 17.18 100 28.17
Agree 184 51.83 284 80.00
Strongly agree 71 20.00 355 100.00
Q32: What has been the most helpful thing about the services you and your child received over the last 6 months? (Please print.)
Responses are included on individual clinic frequencies.
Q33: What would improve those services? (Please print.)
Responses are included on individual clinic frequencies.
Is your child currently living with you?
Q34 Frequency Percent Cumulative Frequency
Cumulative Percent
Yes 308 93.33 308 93.33
No 22 6.67 330 100.00
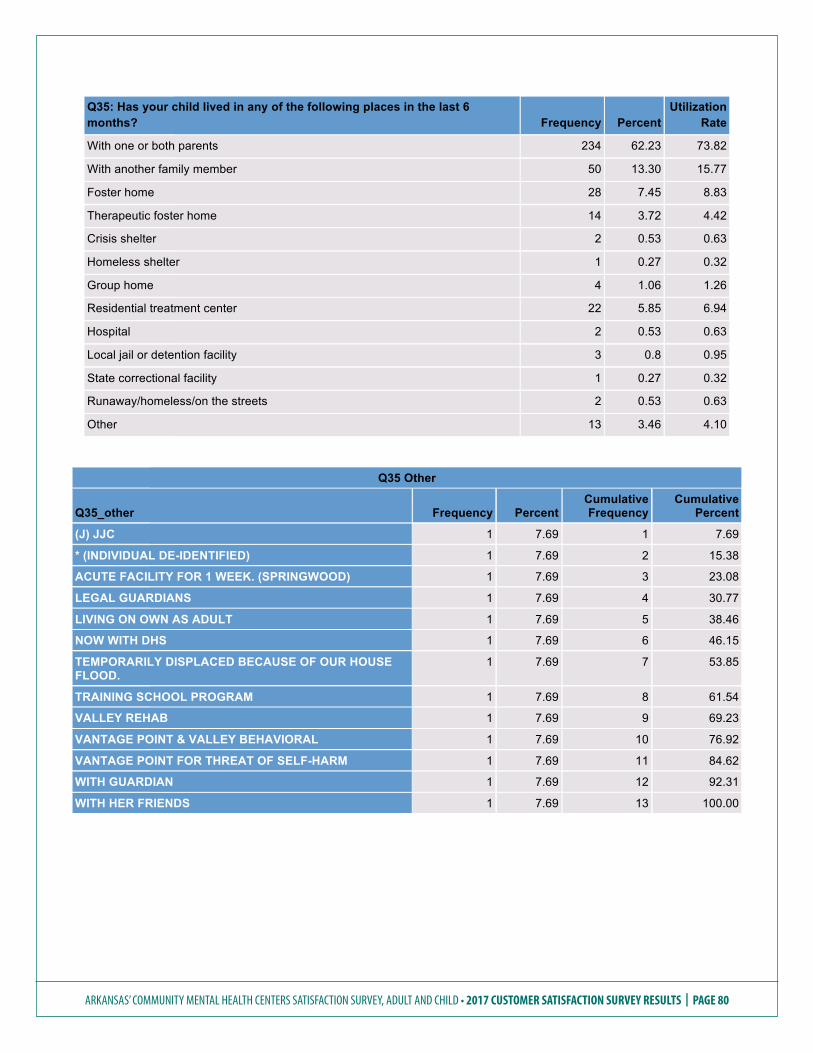
ARKANSAS’ COMMUNITY MENTAL HEALTH CENTERS SATISFACTION SURVEY, ADULT AND CHILD • 2017 CUSTOMER SATISFACTION SURVEY RESULTS | PAGE 80
Q35: Has your child lived in any of the following places in the last 6 months? Frequency Percent
Utilization Rate
With one or both parents 234 62.23 73.82
With another family member 50 13.30 15.77
Foster home 28 7.45 8.83
Therapeutic foster home 14 3.72 4.42
Crisis shelter 2 0.53 0.63
Homeless shelter 1 0.27 0.32
Group home 4 1.06 1.26
Residential treatment center 22 5.85 6.94
Hospital 2 0.53 0.63
Local jail or detention facility 3 0.8 0.95
State correctional facility 1 0.27 0.32
Runaway/homeless/on the streets 2 0.53 0.63
Other 13 3.46 4.10
Q35 Other
Q35_other Frequency Percent Cumulative Frequency
Cumulative Percent
(J) JJC 1 7.69 1 7.69
* (INDIVIDUAL DE-IDENTIFIED) 1 7.69 2 15.38
ACUTE FACILITY FOR 1 WEEK. (SPRINGWOOD) 1 7.69 3 23.08
LEGAL GUARDIANS 1 7.69 4 30.77
LIVING ON OWN AS ADULT 1 7.69 5 38.46
NOW WITH DHS 1 7.69 6 46.15
TEMPORARILY DISPLACED BECAUSE OF OUR HOUSE FLOOD.
1 7.69 7 53.85
TRAINING SCHOOL PROGRAM 1 7.69 8 61.54
VALLEY REHAB 1 7.69 9 69.23
VANTAGE POINT & VALLEY BEHAVIORAL 1 7.69 10 76.92
VANTAGE POINT FOR THREAT OF SELF-HARM 1 7.69 11 84.62
WITH GUARDIAN 1 7.69 12 92.31
WITH HER FRIENDS 1 7.69 13 100.00
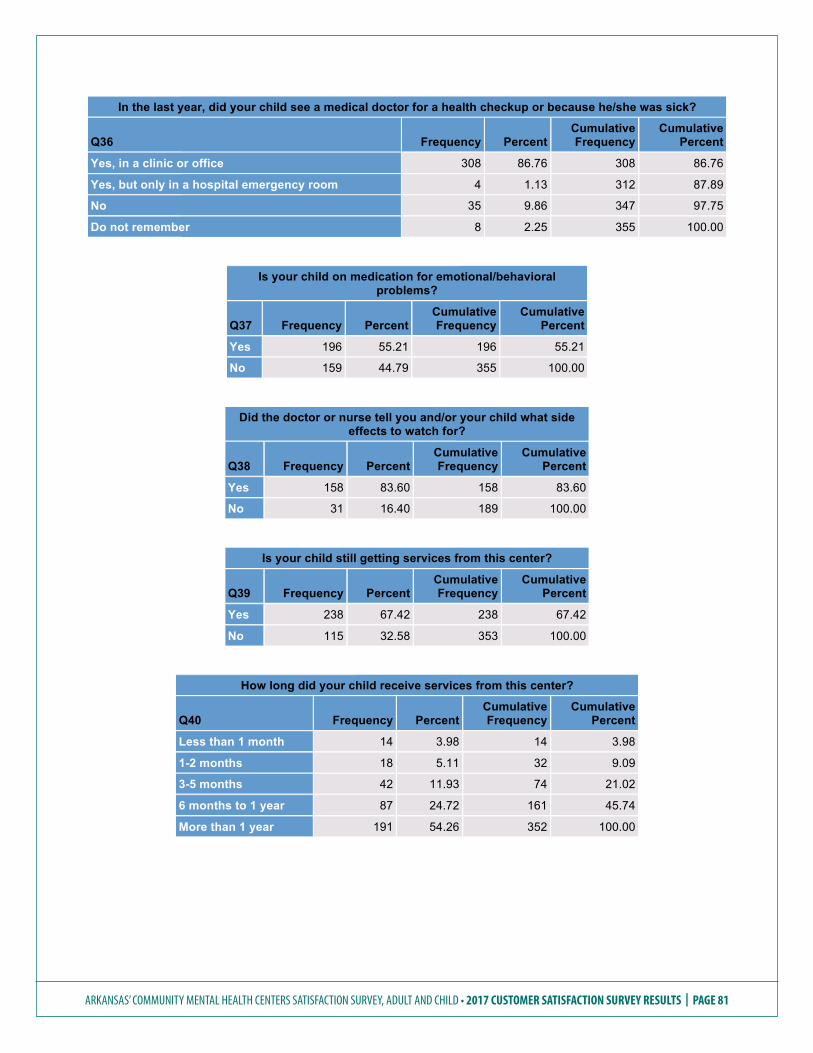
ARKANSAS’ COMMUNITY MENTAL HEALTH CENTERS SATISFACTION SURVEY, ADULT AND CHILD • 2017 CUSTOMER SATISFACTION SURVEY RESULTS | PAGE 81
In the last year, did your child see a medical doctor for a health checkup or because he/she was sick?
Q36 Frequency Percent Cumulative Frequency
Cumulative Percent
Yes, in a clinic or office 308 86.76 308 86.76
Yes, but only in a hospital emergency room 4 1.13 312 87.89
No 35 9.86 347 97.75
Do not remember 8 2.25 355 100.00
Is your child on medication for emotional/behavioral problems?
Q37 Frequency Percent Cumulative Frequency
Cumulative Percent
Yes 196 55.21 196 55.21
No 159 44.79 355 100.00
Did the doctor or nurse tell you and/or your child what side effects to watch for?
Q38 Frequency Percent Cumulative Frequency
Cumulative Percent
Yes 158 83.60 158 83.60
No 31 16.40 189 100.00
Is your child still getting services from this center?
Q39 Frequency Percent Cumulative Frequency
Cumulative Percent
Yes 238 67.42 238 67.42
No 115 32.58 353 100.00
How long did your child receive services from this center?
Q40 Frequency Percent Cumulative Frequency
Cumulative Percent
Less than 1 month 14 3.98 14 3.98
1-2 months 18 5.11 32 9.09
3-5 months 42 11.93 74 21.02
6 months to 1 year 87 24.72 161 45.74
More than 1 year 191 54.26 352 100.00
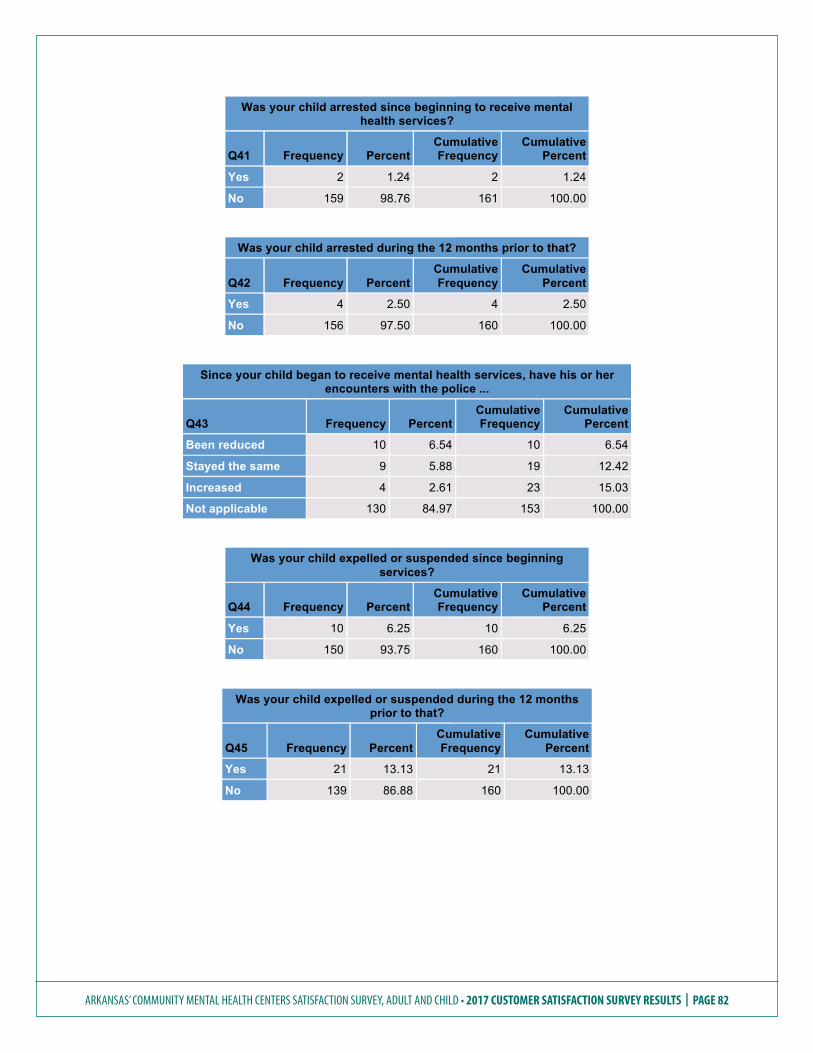
ARKANSAS’ COMMUNITY MENTAL HEALTH CENTERS SATISFACTION SURVEY, ADULT AND CHILD • 2017 CUSTOMER SATISFACTION SURVEY RESULTS | PAGE 82
Was your child arrested since beginning to receive mental health services?
Q41 Frequency Percent Cumulative Frequency
Cumulative Percent
Yes 2 1.24 2 1.24
No 159 98.76 161 100.00
Was your child arrested during the 12 months prior to that?
Q42 Frequency Percent Cumulative Frequency
Cumulative Percent
Yes 4 2.50 4 2.50
No 156 97.50 160 100.00
Since your child began to receive mental health services, have his or her encounters with the police ...
Q43 Frequency Percent Cumulative Frequency
Cumulative Percent
Been reduced 10 6.54 10 6.54
Stayed the same 9 5.88 19 12.42
Increased 4 2.61 23 15.03
Not applicable 130 84.97 153 100.00
Was your child expelled or suspended since beginning services?
Q44 Frequency Percent Cumulative Frequency
Cumulative Percent
Yes 10 6.25 10 6.25
No 150 93.75 160 100.00
Was your child expelled or suspended during the 12 months prior to that?
Q45 Frequency Percent Cumulative Frequency
Cumulative Percent
Yes 21 13.13 21 13.13
No 139 86.88 160 100.00
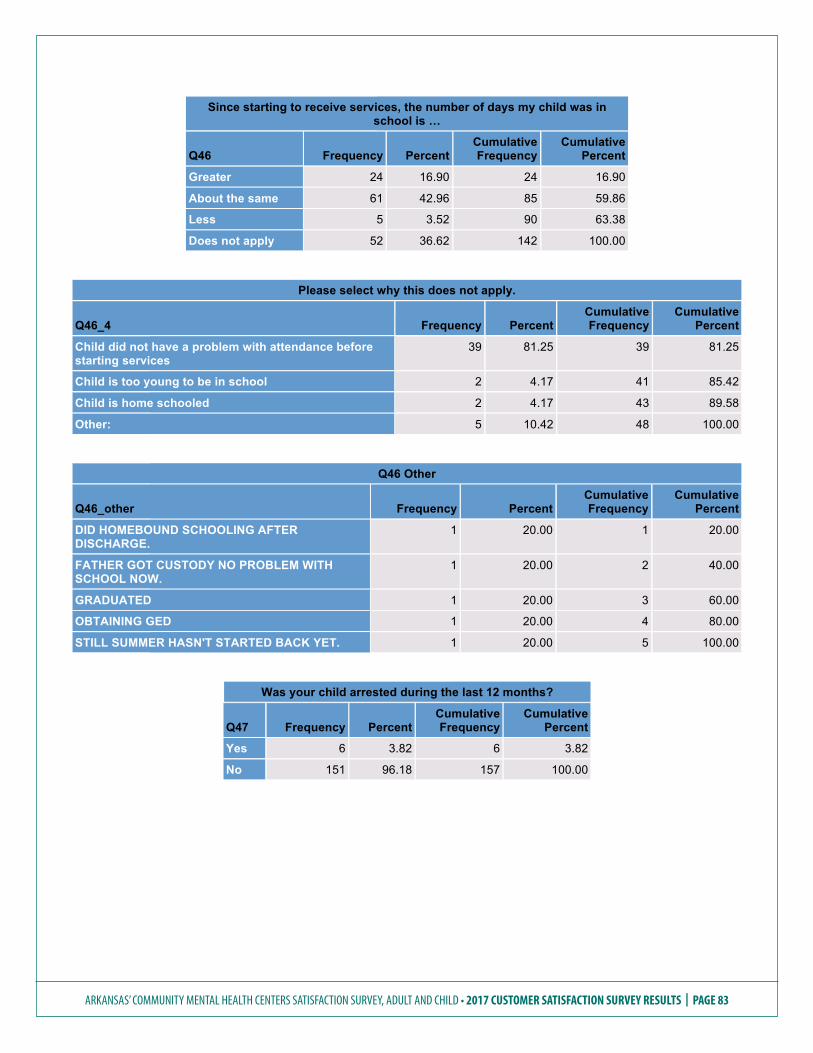
ARKANSAS’ COMMUNITY MENTAL HEALTH CENTERS SATISFACTION SURVEY, ADULT AND CHILD • 2017 CUSTOMER SATISFACTION SURVEY RESULTS | PAGE 83
Since starting to receive services, the number of days my child was in school is …
Q46 Frequency Percent Cumulative Frequency
Cumulative Percent
Greater 24 16.90 24 16.90
About the same 61 42.96 85 59.86
Less 5 3.52 90 63.38
Does not apply 52 36.62 142 100.00
Please select why this does not apply.
Q46_4 Frequency Percent Cumulative Frequency
Cumulative Percent
Child did not have a problem with attendance before starting services
39 81.25 39 81.25
Child is too young to be in school 2 4.17 41 85.42
Child is home schooled 2 4.17 43 89.58
Other: 5 10.42 48 100.00
Q46 Other
Q46_other Frequency Percent Cumulative Frequency
Cumulative Percent
DID HOMEBOUND SCHOOLING AFTER DISCHARGE.
1 20.00 1 20.00
FATHER GOT CUSTODY NO PROBLEM WITH SCHOOL NOW.
1 20.00 2 40.00
GRADUATED 1 20.00 3 60.00
OBTAINING GED 1 20.00 4 80.00
STILL SUMMER HASN'T STARTED BACK YET. 1 20.00 5 100.00
Was your child arrested during the last 12 months?
Q47 Frequency Percent Cumulative Frequency
Cumulative Percent
Yes 6 3.82 6 3.82
No 151 96.18 157 100.00
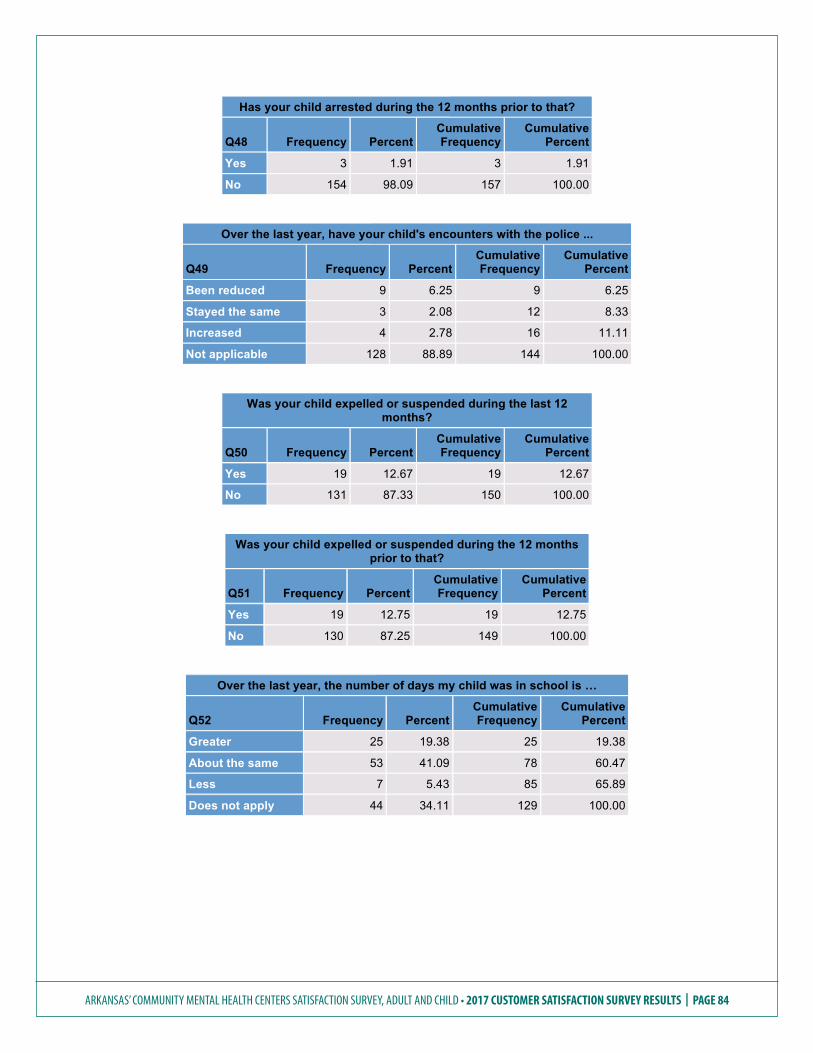
ARKANSAS’ COMMUNITY MENTAL HEALTH CENTERS SATISFACTION SURVEY, ADULT AND CHILD • 2017 CUSTOMER SATISFACTION SURVEY RESULTS | PAGE 84
Has your child arrested during the 12 months prior to that?
Q48 Frequency Percent Cumulative Frequency
Cumulative Percent
Yes 3 1.91 3 1.91
No 154 98.09 157 100.00
Over the last year, have your child's encounters with the police ...
Q49 Frequency Percent Cumulative Frequency
Cumulative Percent
Been reduced 9 6.25 9 6.25
Stayed the same 3 2.08 12 8.33
Increased 4 2.78 16 11.11
Not applicable 128 88.89 144 100.00
Was your child expelled or suspended during the last 12 months?
Q50 Frequency Percent Cumulative Frequency
Cumulative Percent
Yes 19 12.67 19 12.67
No 131 87.33 150 100.00
Was your child expelled or suspended during the 12 months prior to that?
Q51 Frequency Percent Cumulative Frequency
Cumulative Percent
Yes 19 12.75 19 12.75
No 130 87.25 149 100.00
Over the last year, the number of days my child was in school is …
Q52 Frequency Percent Cumulative Frequency
Cumulative Percent
Greater 25 19.38 25 19.38
About the same 53 41.09 78 60.47
Less 7 5.43 85 65.89
Does not apply 44 34.11 129 100.00
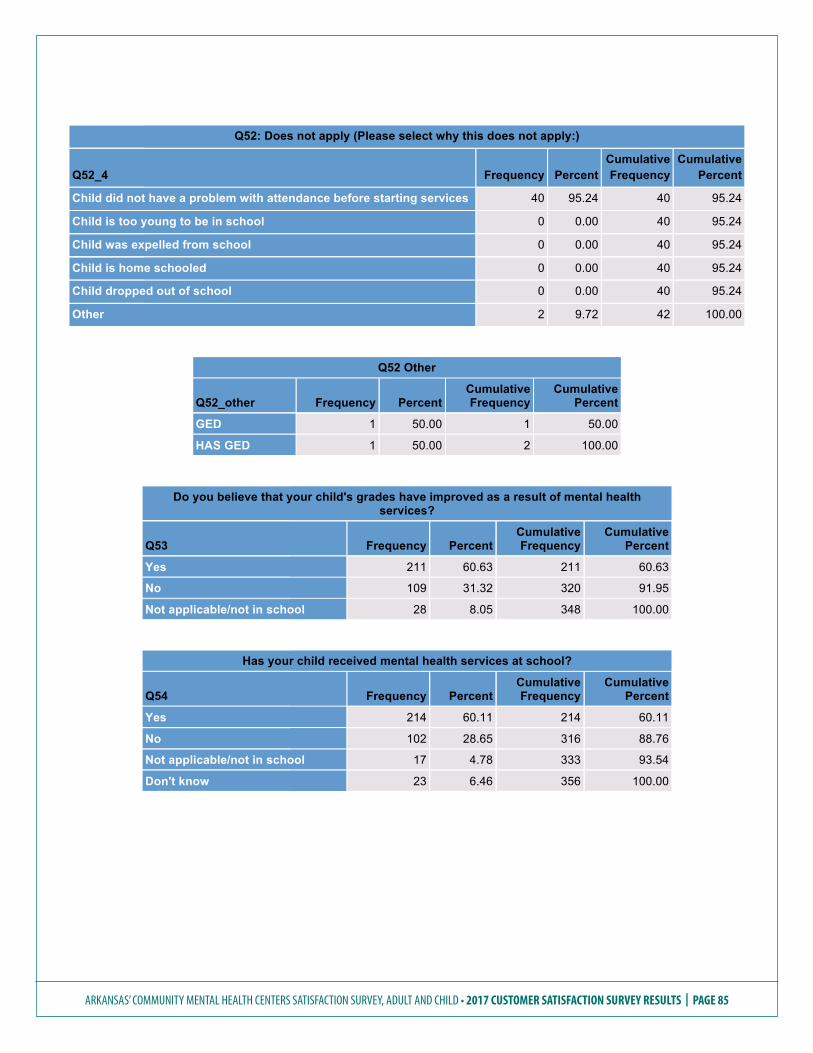
ARKANSAS’ COMMUNITY MENTAL HEALTH CENTERS SATISFACTION SURVEY, ADULT AND CHILD • 2017 CUSTOMER SATISFACTION SURVEY RESULTS | PAGE 85
Q52: Does not apply (Please select why this does not apply:)
Q52_4 Frequency Percent Cumulative Frequency
Cumulative Percent
Child did not have a problem with attendance before starting services 40 95.24 40 95.24
Child is too young to be in school 0 0.00 40 95.24
Child was expelled from school 0 0.00 40 95.24
Child is home schooled 0 0.00 40 95.24
Child dropped out of school 0 0.00 40 95.24
Other 2 9.72 42 100.00
Q52 Other
Q52_other Frequency Percent Cumulative Frequency
Cumulative Percent
GED 1 50.00 1 50.00
HAS GED 1 50.00 2 100.00
Do you believe that your child's grades have improved as a result of mental health services?
Q53 Frequency Percent Cumulative Frequency
Cumulative Percent
Yes 211 60.63 211 60.63
No 109 31.32 320 91.95
Not applicable/not in school 28 8.05 348 100.00
Has your child received mental health services at school?
Q54 Frequency Percent Cumulative Frequency
Cumulative Percent
Yes 214 60.11 214 60.11
No 102 28.65 316 88.76
Not applicable/not in school 17 4.78 333 93.54
Don't know 23 6.46 356 100.00
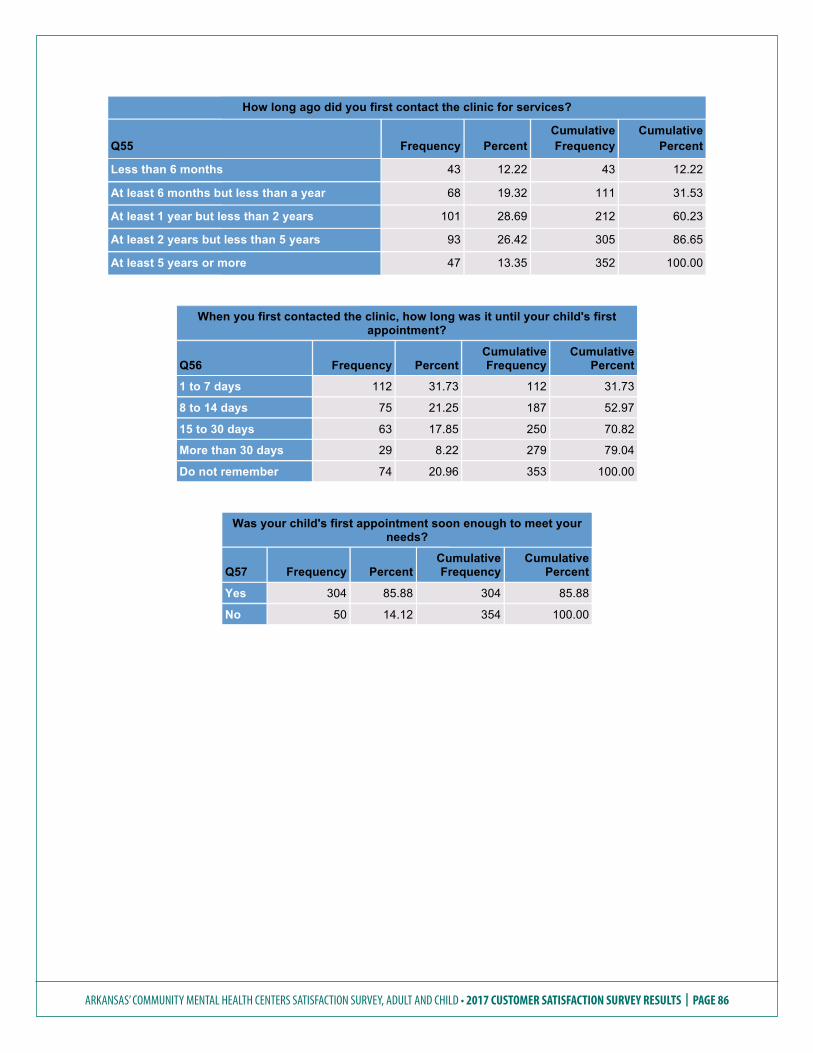
ARKANSAS’ COMMUNITY MENTAL HEALTH CENTERS SATISFACTION SURVEY, ADULT AND CHILD • 2017 CUSTOMER SATISFACTION SURVEY RESULTS | PAGE 86
How long ago did you first contact the clinic for services?
Q55 Frequency Percent Cumulative Frequency
Cumulative Percent
Less than 6 months 43 12.22 43 12.22
At least 6 months but less than a year 68 19.32 111 31.53
At least 1 year but less than 2 years 101 28.69 212 60.23
At least 2 years but less than 5 years 93 26.42 305 86.65
At least 5 years or more 47 13.35 352 100.00
When you first contacted the clinic, how long was it until your child's first appointment?
Q56 Frequency Percent Cumulative Frequency
Cumulative Percent
1 to 7 days 112 31.73 112 31.73
8 to 14 days 75 21.25 187 52.97
15 to 30 days 63 17.85 250 70.82
More than 30 days 29 8.22 279 79.04
Do not remember 74 20.96 353 100.00
Was your child's first appointment soon enough to meet your needs?
Q57 Frequency Percent Cumulative Frequency
Cumulative Percent
Yes 304 85.88 304 85.88
No 50 14.12 354 100.00
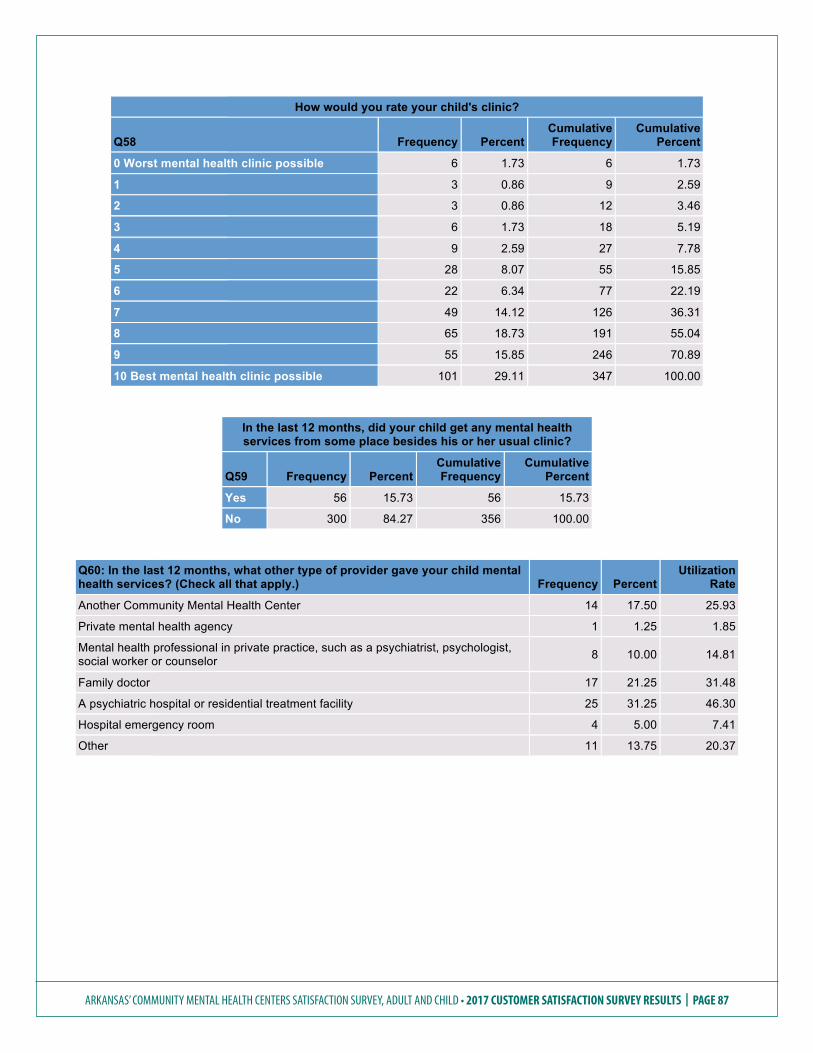
ARKANSAS’ COMMUNITY MENTAL HEALTH CENTERS SATISFACTION SURVEY, ADULT AND CHILD • 2017 CUSTOMER SATISFACTION SURVEY RESULTS | PAGE 87
How would you rate your child's clinic?
Q58 Frequency Percent Cumulative Frequency
Cumulative Percent
0 Worst mental health clinic possible 6 1.73 6 1.73
1 3 0.86 9 2.59
2 3 0.86 12 3.46
3 6 1.73 18 5.19
4 9 2.59 27 7.78
5 28 8.07 55 15.85
6 22 6.34 77 22.19
7 49 14.12 126 36.31
8 65 18.73 191 55.04
9 55 15.85 246 70.89
10 Best mental health clinic possible 101 29.11 347 100.00
In the last 12 months, did your child get any mental health services from some place besides his or her usual clinic?
Q59 Frequency Percent Cumulative Frequency
Cumulative Percent
Yes 56 15.73 56 15.73
No 300 84.27 356 100.00
Q60: In the last 12 months, what other type of provider gave your child mental health services? (Check all that apply.) Frequency Percent
Utilization Rate
Another Community Mental Health Center 14 17.50 25.93
Private mental health agency 1 1.25 1.85
Mental health professional in private practice, such as a psychiatrist, psychologist, social worker or counselor 8 10.00 14.81
Family doctor 17 21.25 31.48
A psychiatric hospital or residential treatment facility 25 31.25 46.30
Hospital emergency room 4 5.00 7.41
Other 11 13.75 20.37
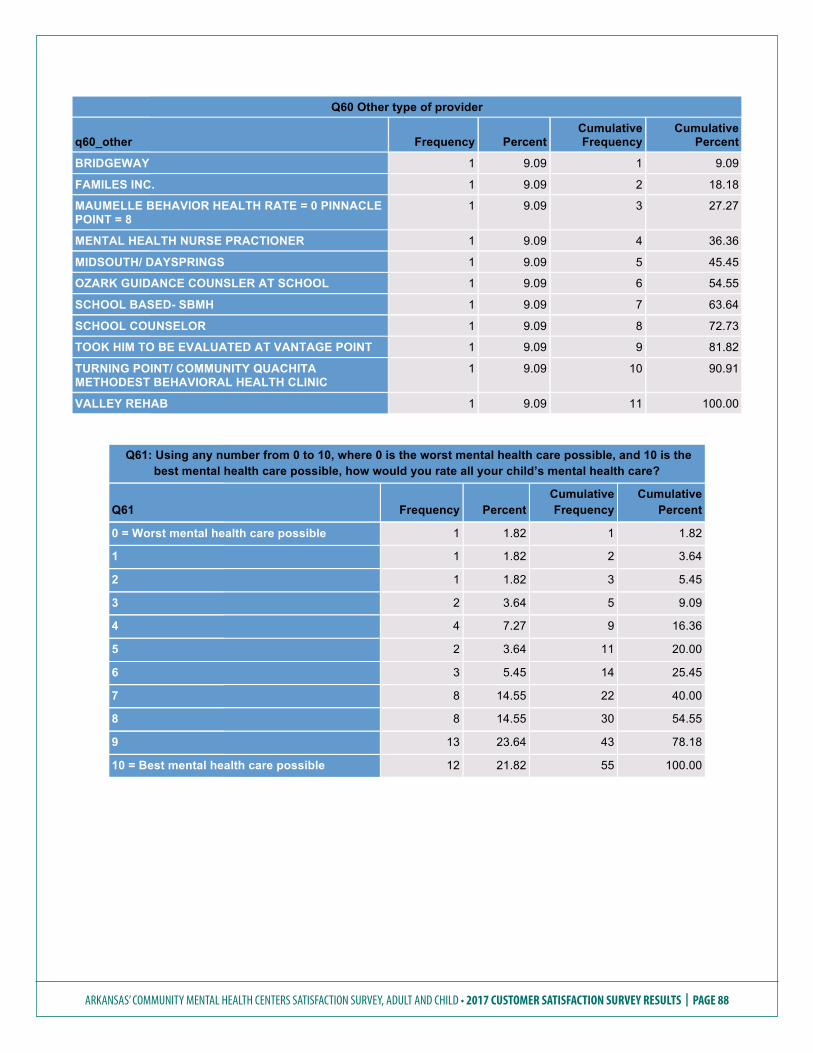
ARKANSAS’ COMMUNITY MENTAL HEALTH CENTERS SATISFACTION SURVEY, ADULT AND CHILD • 2017 CUSTOMER SATISFACTION SURVEY RESULTS | PAGE 88
Q60 Other type of provider
q60_other Frequency Percent Cumulative Frequency
Cumulative Percent
BRIDGEWAY 1 9.09 1 9.09
FAMILES INC. 1 9.09 2 18.18
MAUMELLE BEHAVIOR HEALTH RATE = 0 PINNACLE POINT = 8
1 9.09 3 27.27
MENTAL HEALTH NURSE PRACTIONER 1 9.09 4 36.36
MIDSOUTH/ DAYSPRINGS 1 9.09 5 45.45
OZARK GUIDANCE COUNSLER AT SCHOOL 1 9.09 6 54.55
SCHOOL BASED- SBMH 1 9.09 7 63.64
SCHOOL COUNSELOR 1 9.09 8 72.73
TOOK HIM TO BE EVALUATED AT VANTAGE POINT 1 9.09 9 81.82
TURNING POINT/ COMMUNITY QUACHITA METHODEST BEHAVIORAL HEALTH CLINIC
1 9.09 10 90.91
VALLEY REHAB 1 9.09 11 100.00
Q61: Using any number from 0 to 10, where 0 is the worst mental health care possible, and 10 is the best mental health care possible, how would you rate all your child’s mental health care?
Q61 Frequency Percent Cumulative Frequency
Cumulative Percent
0 = Worst mental health care possible 1 1.82 1 1.82
1 1 1.82 2 3.64
2 1 1.82 3 5.45
3 2 3.64 5 9.09
4 4 7.27 9 16.36
5 2 3.64 11 20.00
6 3 5.45 14 25.45
7 8 14.55 22 40.00
8 8 14.55 30 54.55
9 13 23.64 43 78.18
10 = Best mental health care possible 12 21.82 55 100.00

AFMC DEVELOPED THIS MATERIAL UNDER CONTRACT WITH THE ARKANSAS DEPARTMENT OF HUMAN SERVICES, DIVISION OF MEDICAL SERVICES. WE ARE NOT PROVIDING LEGAL OR PROFESSIONAL MEDICAL ADVICE. WE MAKE NO WARRANTY, EXPRESSED OR IMPLIED, ON ANY SUBJECT INCLUDING COMPLETENESS AND FITNESS OF THE INFORMATION FOR ANY PURPOSE. THE INFORMATION PRESENTED IN THIS MATERIAL IS CONSISTENT WITH DHS POLICY AS OF SEPTEMBER 2017. IF
ANY ARKANSAS DHS POLICY CHANGES MADE AFTER SEPTEMBER 2017 ARE INCONSISTENT WITH THIS MATERIAL, THE POLICY CONTROLS. ARKANSAS DHS IS IN COMPLIANCE WITH TITLES VI AND VII OF THE CIVIL RIGHTS ACT. REVISED NOVEMBER 2017.