Embed Size (px)
Citation preview

Hazardous Air Pollutants | Environments and Contaminants
50 America’s Children and the Environment | Third Edition
Hazardous Air Pollutants
Hazardous air pollutants (HAPs) are air contaminants, frequently referred to as “air toxics,” that are known or suspected to cause serious human health effects or adverse environmental effects.1 The Clean Air Act identifies 187 substances as HAPs. Examples include benzene, trichloroethylene, mercury, chromium, and dioxin. The “criteria” air pollutants such as ozone and particulate matter are excluded from the HAPs list.i
HAPs are emitted into ambient air from a diverse range of facilities, businesses, and vehicles that are grouped into three general categories: major sources, area sources, and mobile sources. Major sources typically are large industrial facilities such as chemical manufacturing plants, refineries, and waste incinerators. These sources may release air toxics from equipment leaks, when materials are transferred from one location to another, or during discharge through emission stacks or vents. Area sources typically are smaller stationary facilities such as dry cleaners, auto body repair shops, and small manufacturing operations. Though emissions from individual area sources often are relatively small, collectively they can be of concern—particularly where large numbers of sources are located in heavily populated areas. Mobile sources include both on-road sources, such as cars, light trucks, large trucks, and buses, and non-road sources such as farm and construction equipment, lawn and garden equipment, marine engines, aircraft, and locomotives. Some HAPs are also emitted from natural sources such as volcanoes. Health effects associated with HAPs include cancer, asthma and other respiratory ailments, birth defects, reproductive effects, and neurodevelopmental effects.2-9
In some cases, health concerns are based on studies of workers exposed to high levels of particular HAPs on the job. For example, EPA has determined that HAPs such as benzene; 1,3-butadiene; chromium; nickel; and vinyl chloride are carcinogenic to humans, based on findings in occupational studies.10-14 Similarly, toluene diisocyanate exposure has been associated with effects on the lung, and manganese exposure with neurological effects, in occupational studies.15,16
A limited number of HAPs have also been studied in human populations that have been exposed in their day-to-day lives. For examples, several studies have reported associations between formaldehyde exposure (usually indoors at home or at school) and childhood asthma.3 In addition, a series of recent studies conducted in New York City reported that children of women who were exposed to increased levels of polycyclic aromatic hydrocarbons (PAHs, produced when gasoline and other materials are burned) during pregnancy are more likely to have experienced adverse effects on neurological development (such as reduced intelligence quotient (IQ) or behavioral problems6,7), as well as respiratory effects.17-19
i Lead is an exception: it is regulated as a criteria pollutant, and “lead compounds” are included on the list of HAPs. Note that criteria pollutants are discussed further in the Criteria Air Pollutants topic.

Environments and Contaminants | Hazardous Air Pollutants
America’s Children and the Environment | Third Edition 51
For the majority of HAPs, however, there are no human epidemiological studies, or very few, and concern for health effects is based on findings from animal studies. For example, many HAPs, such as PAHs,20 acetaldehyde21 and carbon tetrachloride22 are considered likely to be carcinogenic to human based primarily on evidence from long-term laboratory animal studies.
Although many HAPs are of concern due to their potential to cause cancer, a substantial number of HAPs lack evidence of cancer—either because the relevant long-term studies have not been conducted, or because studies have been conducted and do not indicate carcinogenic potential. An example of a HAP that is not associated with cancer is acrolein; there are no appropriate human or animal studies with which to assess the carcinogenic potential of acrolein. However, acrolein has been identified as a HAP of particular concern for effects other than cancer.23,24 Health concerns for acrolein include respiratory effects and irritation of the eyes, nose, and throat, based on animal studies and on short-term studies of small groups of humans intentionally exposed to high levels of acrolein.25
EPA relies on both monitoring and modeled data to characterize ambient air concentrations of HAPs, and to estimate potential human exposure and risk of adverse health effects associated with these toxics. EPA and state monitoring programs do not cover all the places where people live in the United States. For this reason, the following indicator relies on modeled data from the National Air Toxics Assessment.26 The indicator presents the percentage of children living in census tracts with estimated HAP concentrations greater than benchmark comparison levels derived from health effects information.
In addition to their presence in ambient air, many HAPs also have indoor sources, and the indoor sources may frequently result in greater exposure than the presence of HAPs in ambient air. Sufficient data are not available to develop an indicator considering the combined exposure to HAPs from both indoor and outdoor sources; therefore the following indicator considers only levels of HAPs in ambient air.ii
ii Indoor sources of HAPs are further discussed in the Indoor Environments and Contaminants in Schools and Child
Care Facilities topics, and in several of the biomonitoring topics.

Hazardous Air Pollutants | Environments and Contaminants
52 America’s Children and the Environment | Third Edition
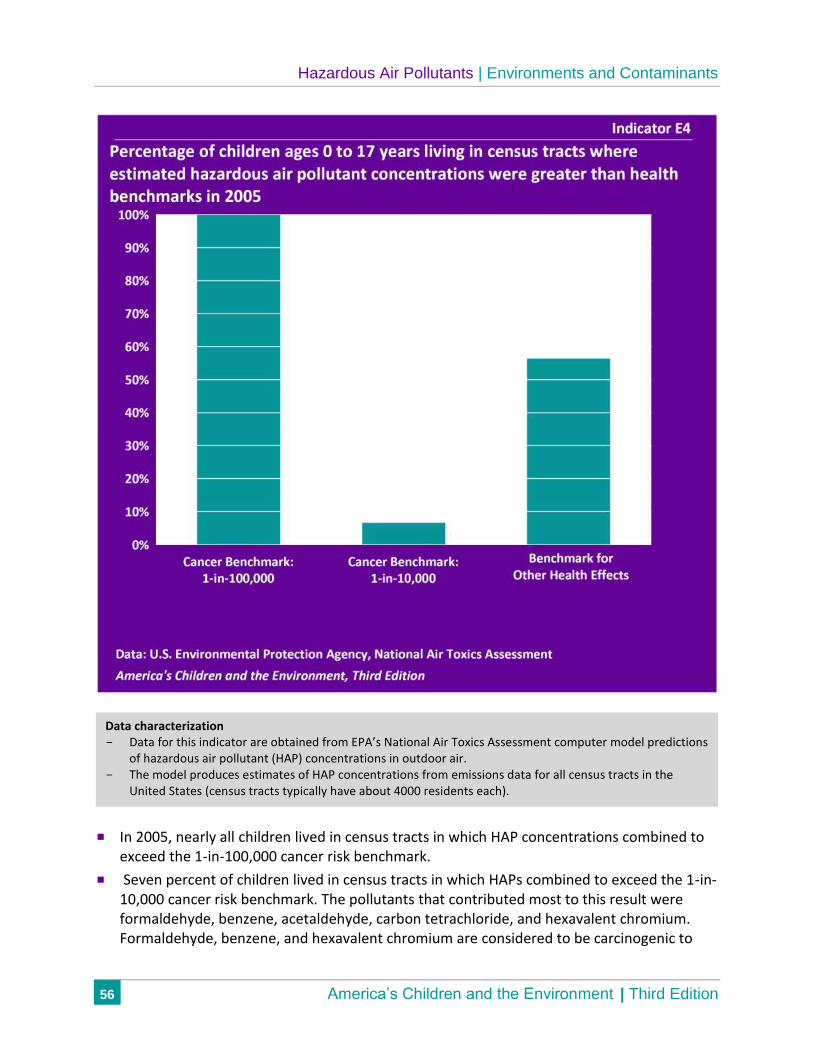
Indicator E4: Percentage of children ages 0 to 17 years living in census tracts where estimated hazardous air pollutant concentrations were greater than health benchmarks in 2005
National Air Toxics Assessment
EPA’s National Air Toxics Assessment (NATA) provides estimated concentrations of 181 HAPs in ambient air for the year 2005. NATA is the most comprehensive resource on potential human exposure to and risk of adverse health effects from HAPs in the United States. Monitoring data are insufficient to characterize HAP concentrations across the country because of the limited number of monitors, and because concentrations of many HAPs may vary considerably within a metropolitan area or region.
Under NATA, EPA develops modeled estimates of ambient concentrations of HAPs using estimated emissions data from major, area, onroad mobile, and non-road mobile sources. These emissions data are collected and updated periodically, and are maintained in an emissions inventory. The original NATA was developed using emissions data for the year 1996. Since the initial release, EPA has developed additional estimates of ambient air concentrations of HAPs using updated emissions inventories for 1999, 2002, and 2005. NATA’s computer modeling approach has the advantage of allowing estimation of HAP concentrations at locations throughout the United States, rather than in just those locations that have HAP monitors. However, compared with monitoring, the computer model requires estimating quantities of HAP emissions, estimating locations of HAP emissions sources, and modeling the dispersion of HAPs in the atmosphere after they have been emitted.
The most recent assessment developed estimated ambient concentrations of 179 air toxics for the year 2005. A computer model provided estimates for every census tract in the United States. The modeled estimates generally are consistent with the limited set of ambient air toxics monitoring data, although at many locations the model estimates for some HAPs are lower than measured concentrations.27 The 2005 NATA estimates do not reflect any changes in emissions that may have occurred since 2005 due to new regulations, new technologies, changes in economic activity, or changes in the vehicle fleet and vehicle miles traveled.
About the Indicator: Indicator E4 presents estimates of the percentage of children living in census tracts with ambient hazardous air pollutant (HAP) concentrations greater than benchmark values representing levels of concern for health effects. The HAP concentrations are computer model estimates for 2005, representing all identified sources of HAP emissions, including factories and motor vehicles. The health benchmarks are based on concerns for cancer and other adverse health effects that may be associated with HAP exposure.

Environments and Contaminants | Hazardous Air Pollutants
America’s Children and the Environment | Third Edition 53
Health Benchmarks for Hazardous Air Pollutants
Indicator E4 presents comparisons of modeled concentrations of HAPs in ambient air for 2005 with three health benchmark concentrations derived from scientific assessments conducted by EPA and other environmental agencies.28
EPA uses the three benchmark risk levels to identify HAPs that are of priority concern.29
Two benchmarks reflect potential cancer risks, at levels of 1-in-100,000 risk and 1-in-10,000 risk. If a particular hazardous air pollutant is present in ambient air at a 1-in-100,000 benchmark concentration, for example, it is estimated that one additional case of cancer would occur in a population of 100,000 people exposed for a lifetime. The comparison to the cancer risk benchmark incorporates data for all HAPs considered carcinogenic to humans, likely carcinogenic to humans, or with suggestive evidence of carcinogenicity. The majority of HAPs included in the comparison to the cancer risk benchmarks are considered “carcinogenic to humans” or “likely carcinogenic to humans.”30
The third benchmark concentration corresponds to the level at which exposure to the hazardous air pollutant is estimated to be of minimal risk for adverse non-cancer health effects; exposures above this benchmark may be associated with adverse health effects such as respiratory or neurological effects. Due to variation in human response to HAP exposure and uncertainty in the benchmark values, it is not necessarily the case that a person living in a location where this benchmark is exceeded will experience adverse effects. It is also possible that individuals may experience effects at levels below the benchmark level.
The health benchmarks are generally derived from laboratory animal studies, although for some HAPs they are derived from human epidemiological studies of workers exposed on the job. For some HAPs, even the animal studies are very limited and no benchmark has been derived. Health benchmarks were available to assess 87 HAPs as cancer-causing agents and 105 HAPs as agents that cause adverse health effects other than cancer. Some HAPs had benchmarks for both cancer and non-cancer health endpoints; a total of 141 air toxics were used in calculating the indicator.
Because they are typically based on studies of adults or mature laboratory animals, the three benchmarks generally reflect health risks to adults, rather than potential risks to children or risks in adulthood stemming from childhood exposure. Benchmarks for non-cancer effects incorporate assumptions that are based on adult respiratory physiology (i.e., breathing rates and lung structure); benchmarks for some HAPs would be lower if they were adjusted for children’s respiratory physiology.31
Under a policy adopted in 2005, EPA adjusts risk estimates for certain carcinogens to account for increased risks associated with exposures during early life.32 This adjustment has been applied to the cancer benchmarks for PAHs, acrylamide, benzidine, and ethyl carbamate. Benchmark values for other HAPs that are suspected carcinogens receive no adjustment for

Hazardous Air Pollutants | Environments and Contaminants
54 America’s Children and the Environment | Third Edition
potential elevated risks from early-life exposures because they do not meet the criteria of the EPA policy or lack sufficient data to support application of the adjustment.
Further, the benchmarks reflect risks of continuous exposure over the course of a lifetime. Potential risks from higher concentrations experienced over a short amount of time (one day, one hour, or less) may in some cases trigger immediate responses, such as asthma attacks or effects on the central nervous system are not addressed by these benchmarks.
Finally, the benchmark values for HAP s are uncertain to varying degrees, due to data limitations and the lag in time between when new studies become available and the completion of updated assessments by EPA and other government agencies.
Data Presented in the Indicator
Indicator E4 presents the percentage of children living in census tracts where estimated 2005 HAP concentrations exceeded benchmark levels for cancer (at levels of 1-in-100,000 risk and 1-in-10,000 risk) and for other (non-cancer) adverse health effects. The indicator is calculated by comparing the estimated HAP concentrations for each U.S. census tract in 2005 to each of the benchmark concentrations. Census tracts are geographic areas within U.S. counties that vary in size and generally have 1,500 to 8,000 residents, with a typical population of 4,000 residents.
The comparison to the cancer risk benchmark sums up data for all carcinogenic HAPs. The comparison to the benchmark for other adverse health effects considers only individual HAPs; that is, a county is considered to exceed this benchmark if the modeled concentration for any single HAP exceeds the corresponding non-cancer benchmark for that HAP, but it does not consider adverse effects of combinations of HAPs.
Available information indicates that the NATA estimates of ambient HAP concentrations tend to be similar to or lower than actual HAP concentrations.27 To the extent that underestimation occurs, the percentage of children living in census tracts exceeding the benchmark levels may be understated. In addition, the indicator does not differentiate between census tracts in which the benchmarks are exceeded by a large margin and those in which estimated HAP concentrations are just above the benchmark concentrations. The indicator presents results only for 2005, and does not compare results across assessment years, such as between 1999 and 2005, because each update of the assessment brings new improvements to methods. For example, improvements to the emissions estimation methodologies made in the 2005 assessment were not applied to the earlier versions, so the ambient concentration estimates are not entirely comparable between years.
Actual exposures may differ from ambient concentrations. Indoor concentrations of HAPs from outdoor sources may be slightly lower than ambient concentrations, although they can be significantly higher if any indoor sources are present.33-36 Levels of some hazardous pollutants may be substantially higher inside cars and school buses,37-39 and those higher levels would increase the risks.

Environments and Contaminants | Hazardous Air Pollutants
America’s Children and the Environment | Third Edition 55
In addition, this indicator only considers exposures to air toxics that occur by inhalation. For many air toxics, dietary exposures are also important. Air toxics that are persistent in the environment settle out of the atmosphere onto land and water, and then may accumulate in fish and other animals in the food web. For HAPs that are persistent in the environment and accumulate significantly in food, exposures through food consumption typically are greater than inhalation exposures. HAPs for which food chain exposures are important include mercury, dioxins, and PCBs.40-42
The comparison of ambient HAP concentrations in 2005 to the health benchmarks is not equivalent to an estimate of risk to the population from chronic HAP exposure. Actual risks to health depend on concentrations of HAPs in many environments over an extended period of time. Ambient concentrations will change over time as the mix of sources changes (e.g., due to businesses opening and closing), vehicle use changes (e.g., more cars and trucks traveling longer distances), and regulatory controls are applied. In addition, children spend most of their time indoors at home, at school, or at child care centers, and pollutant concentrations in indoor environments may be greater or lesser than the modeled ambient concentrations.
In addition to the indicator presented in the figure, which is based on where children live, the same statistics are calculated based on where children’s schools are located (see data tables). Exposures at school are an important consideration, as children spend an average of 33 hours per week in school.43 The data tables also provide indicator values by race/ethnicity and income, based on where children live.
Hazardous Air Pollutants | Environments and Contaminants
56 America’s Children and the Environment | Third Edition
In 2005, nearly all children lived in census tracts in which HAP concentrations combined to exceed the 1-in-100,000 cancer risk benchmark.
Seven percent of children lived in census tracts in which HAPs combined to exceed the 1-in-10,000 cancer risk benchmark. The pollutants that contributed most to this result were formaldehyde, benzene, acetaldehyde, carbon tetrachloride, and hexavalent chromium. Formaldehyde, benzene, and hexavalent chromium are considered to be carcinogenic to
Data characterization - Data for this indicator are obtained from EPA’s National Air Toxics Assessment computer model predictions
of hazardous air pollutant (HAP) concentrations in outdoor air. - The model produces estimates of HAP concentrations from emissions data for all census tracts in the
United States (census tracts typically have about 4000 residents each).

Environments and Contaminants | Hazardous Air Pollutants
America’s Children and the Environment | Third Edition 57
humans,5,10,13 and acetaldehyde and carbon tetrachloride are considered likely to be carcinogenic to humans.21,22
Fifty-six percent of children lived in census tracts in which at least one HAP exceeded the benchmark for health effects other than cancer. In almost all cases, this result was attributable to the pollutant acrolein, which is a respiratory irritant. More than 90% of acrolein emissions are from wood-burning fires and mobile sources such as cars, trucks, buses, planes, and construction equipment.
Exposures to diesel particulate matter from diesel engine emissions are not included in this indicator due to uncertainty regarding the appropriate values to use as cancer benchmarks. Some studies have found that cancer risks from diesel particulate matter exceed those of the HAPs considered in this indicator.44 Although EPA does not endorse any particular cancer benchmark value for diesel particulate matter, if the State of California’s benchmark for diesel particulate matter were used in this analysis, 73% of children would live in census tracts where HAP estimates combined to exceed the 1-in-10,000 cancer risk benchmark.
In 2005, all children’s schools were located in census tracts where HAPs concentrations combined to exceed the 1-in-100,000 cancer risk benchmark. Six percent of children attended schools in census tracts where the HAPs concentrations exceeded the higher 1-in-10,000 cancer risk benchmark.
Fifty-seven percent of children attended schools that were located in census tracts where at least one HAP exceeded the benchmark for health effects other than cancer.

Environments and Contaminants | References
310 America’s Children and the Environment | Third Edition
Hazardous Air Pollutants 1. U.S. Environmental Protection Agency. 2009. About Air Toxics. Retrieved August 6, 2009 from www.epa.gov/ttn/atw/allabout.html.
2. Leikauf, G.D. 2002. Hazardous air pollutants and asthma. Environmental Health Perspectives 110 Suppl 4:505-26.
3. McGwin, G., J. Lienert, and J.I. Kennedy. 2010. Formaldehyde exposure and asthma in children: a systematic review. Environmental Health Perspectives 118 (3):313-7.
4. McMartin, K.I., M. Chu, E. Kopecky, T.R. Einarson, and G. Koren. 1998. Pregnancy outcome following maternal organic solvent exposure: a meta-analysis of epidemiologic studies. American Journal of Industrial Medicine 34 (3):288-92.
5. National Toxicology Program. 2011. Report on Carcinogens, 12th Edition. Research Triangle Park, NC: U.S. Department of Health and Human Services, National Toxicology Program. http://ntp.niehs.nih.gov/ntp/roc/twelfth/roc12.pdf.
6. Perera, F.P., Z. Li, R. Whyatt, L. Hoepner, S. Wang, D. Camann, and V. Rauh. 2009. Prenatal airborne polycyclic aromatic hydrocarbon exposure and child IQ at age 5 years. Pediatrics 124 (2):e195-202.
7. Perera, F.P., S. Wang, J. Vishnevetsky, B. Zhang, K.J. Cole, D. Tang, V. Rauh, and D.H. Phillips. 2011. PAH/Aromatic DNA Adducts in Cord Blood and Behavior Scores in New York City Children. Environmental Health Perspectives 119 (8):1176-81.
8. Schantz, S.L., J.J. Widholm, and D.C. Rice. 2003. Effects of PCB exposure on neuropsychological function in children. Environmental Health Perspectives 111 (3):357-576.
9. Wigle, D.T., T.E. Arbuckle, M.C. Turner, A. Berube, Q. Yang, S. Liu, and D. Krewski. 2008. Epidemiologic evidence of relationships between reproductive and child health outcomes and environmental chemical contaminants. Journal of Toxicology and Environmental Health Part B: Critical Reviews 11 (5-6):373-517.
10. U.S. Environmental Protection Agency. 2011. IRIS Summaries: Benzene (CASRN 71-43-2). U.S. EPA, National Center for Environmental Assessment. Retrieved June 6, 2011 from http://www.epa.gov/iris/subst/0276.htm.
11. U.S. Environmental Protection Agency. 2011. IRIS Summaries: Vinyl Chloride (CASRN 75-01-4). U.S. EPA, National Center for Environmental Assessment. Retrieved June 6, 2011 from http://www.epa.gov/iris/subst/1001.htm.
12. U.S. Environmental Protection Agency. 2011. IRIS Summaries: 1,3 Butadiene (CASRN 106-99-0). U.S. EPA, National Center for Environmental Assessment. Retrieved June 6, 2011 from http://www.epa.gov/iris/subst/0139.htm.
13. U.S. Environmental Protection Agency. 2011. IRIS Summaries: Chromium (VI) (CASRN 18540-29-9). U.S. EPA, National Center for Environmental Assessment. Retrieved June 6, 2011 from http://www.epa.gov/iris/subst/0144.htm.
14. U.S. Environmental Protection Agency. 2011. IRIS Summaries: Nickel Subsulfide (CASRN 12035-72-2). U.S. EPA, National Center for Environmental Assessment. Retrieved June 6, 2011 from http://www.epa.gov/iris/subst/0273.htm.
15. U.S. Environmental Protection Agency. 2011. IRIS Summaries: 2,4-/2,6-Toluene diisocyanate mixture (TDI) (CASRN 26471-62-5). U.S. EPA, National Center for Environmental Assessment. Retrieved June 6, 2011 from http://www.epa.gov/iris/subst/0503.htm.
16. U.S. Environmental Protection Agency. 2011. IRIS Summaries: Manganese (CASRN 7439-96-5). U.S. EPA, National Center for Environmental Assessment. Retrieved June 6, 2011 from http://www.epa.gov/iris/subst/0373.htm.
17. Jedrychowski, W., A. Galas, A. Pac, E. Flak, D. Camman, V. Rauh, and F. Perera. 2005. Prenatal ambient air exposure to polycyclic aromatic hydrocarbons and the occurrence of respiratory symptoms over the first year of life. European Journal of Epidemiology 20 (9):775-82.
18. Miller, R.L., R. Garfinkel, M. Horton, D. Camann, F.P. Perera, R.M. Whyatt, and P.L. Kinney. 2004. Polycyclic aromatic hydrocarbons, environmental tobacco smoke, and respiratory symptoms in an inner-city birth cohort. Chest 126 (4):1071-8.
19. Rosa, M.J., K.H. Jung, M.S. Perzanowski, E.A. Kelvin, K.W. Darling, D.E. Camann, S.N. Chillrud, R.M. Whyatt, P.L. Kinney, F.P. Perera, et al. 2011. Prenatal exposure to polycyclic aromatic hydrocarbons, environmental tobacco smoke and asthma. Respiratory Medicine 105 (6):869-76.
20. U.S. Environmental Protection Agency. 2011. IRIS Summaries: Benzo[a]pyrene (BaP) (CASRN 50-32-8). U.S. EPA, National Center for Environmental Assessment. Retrieved June 6, 2011 from http://www.epa.gov/iris/subst/0136.htm.
21. U.S. Environmental Protection Agency. 2011. IRIS Summaries: Acetaldehyde (CASRN 75-07-0). U.S. EPA, National Center for Environmental Assessment. Retrieved June 6, 2011 from http://www.epa.gov/iris/subst/0290.htm.
22. U.S. Environmental Protection Agency. IRIS Summaries: Carbon Tetrachloride (CASRN 56-23-5). U.S. EPA, National Center for Environmental Assessment. Retrieved August 9, 2011 from http://www.epa.gov/iris/subst/0020.htm.
23. Cook, R., M. Strum, J.S. Touma, T. Palma, J. Thurman, D. Ensley, and R. Smith. 2007. Inhalation exposure and risk from mobile source air toxics in future years. Journal of Exposure Science and Environmental Epidemiology 17 (1):95-105.
24. Woodruff, T.J., D.A. Axelrad, J. Caldwell, R. Morello-Frosch, and A. Rosenbaum. 1998. Public health implications of 1990 air toxics concentrations across the United States. Environmental Health Perspectives 106 (5):245-51.

References | Environments and Contaminants
America’s Children and the Environment | Third Edition 311
Hazardous Air Pollutants (continued) 25. U.S. Environmental Protection Agency. 2003. Toxicological Review of Acrolein (CAS No. 107-02-8). Washington, DC: U.S. EPA, National Center for Environmental Assessment. EPA/635/R-03/003. http://www.epa.gov/iris/toxreviews/0364tr.pdf.
26. U.S. Environmental Protection Agency. 2011. National Air Toxics Assessment, 2005. Office of Air Quality Planning and Standards. Retrieved June 6, 2011 from http://www.epa.gov/ttn/atw/nata2005/.
27. U.S. Environmental Protection Agency. 2010. Results of the 2005 NATA Model-to-Monitor Comparison, Final Report. Research Triangle Park, NC: U.S. EPA, Office of Air Quality Planning and Standards. http://www.epa.gov/ttn/atw/nata2005/05pdf/nata2005_model2monitor.pdf.
28. U.S. Environmental Protection Agency. Health Effects Information Used in Cancer and Noncancer Risk Characterization for the 2005 National-Scale Assessment. U.S. EPA, Office of Air and Radiation. Retrieved June 6, 2011 from http://www.epa.gov/ttn/atw/nata2005/05pdf/health_effects.pdf.
29. U.S. Environmental Protection Agency. 2011. An Overview of Methods for EPA's National-Scale Air Toxics Assessment. Research Triangle Park, NC: U.S. EPA, Office of Air Quality, Planning, and Standards. http://www.epa.gov/ttn/atw/nata2005/05pdf/nata_tmd.pdf.
30. U.S. Environmental Protection Agency. 2011. Summary of Results for the 2005 National-Scale Assessment. Washington, DC: U.S. EPA, Office of Air and Radiation http://www.epa.gov/ttn/atw/nata2005/05pdf/sum_results.pdf.
31. Ginsberg, G., B. Foos, R.B. Dzubow, and M. Firestone. 2010. Options for incorporating children's inhaled dose into human health risk assessment. Inhalation Toxicology 22 (8):627-47.
32. U.S. Environmental Protection Agency. 2005. Supplemental Guidance for Assessing Susceptibility from Early-Life Exposure to Carcinogens. Washington, DC: U.S. EPA, Risk Assessment Forum. EPA/630/R-03/003F. http://www.epa.gov/ttn/atw/childrens_supplement_final.pdf.
33. Brody, J.G., R. Morello-Frosch, A. Zota, P. Brown, C. Perez, and R. Rudel. 2009. Linking exposure assessment science with policy objectives for environmental justice and breast cancer advocacy: The Northern California Household Exposure Study. American Journal of Public Health 99 (Suppl 3):S600-9.
34. Long, T., T. Johnson, J. Laurenson, and A. Rosenbaum. 2004. Memorandum: Development of Penetration and Proximity Microenvironment Factor Distributions for the HAPEM5 in Support of the 1999 National-Scale Air Toxics Assessment (NATA). Washington, DC: U.S. EPA. http://www.epa.gov/ttn/fera/hapem5/hapem5_me_factor_memo.pdf.
35. Payne-Sturges, D.C., T.A. Burke, P. Breysse, M. Diener-West, and T.J. Buckley. 2004. Personal exposure meets risk assessment: a comparison of measured and modeled exposures and risks in an urban community. Environmental Health Perspectives 112 (5):589-98.
36. Weisel, C.P., J. Zhang, B.J. Turpin, M.T. Morandi, S. Colome, T.H. Stock, D.M. Spektor, L. Korn, A.M. Winer, J. Kwon, et al. 2005. Relationships of Indoor, Outdoor, and Personal Air (RIOPA): Part I. Collection Methods and Descriptive Analyses. Boston, MA and Houston, TX: Health Effects Institute and Mickey Leland National Urban Air Toxics Research Center. HEI Research Report 130; NUATRC Research Report 7. http://pubs.healtheffects.org/getfile.php?u=25.
37. California Air Resources Board. 2004. Children's School Bus Exposure Study. California Environmental Protection Agency, Air Resources Board. Retrieved October 3, 2011 from http://www.arb.ca.gov/research/schoolbus/schoolbus.htm.
38. Sabin, L.D., E. Behrentz, A.M. Winer, S. Jeong, D.R. Fitz, D.V. Pankratz, S.D. Colome, and S.A. Fruin. 2004. Characterizing the range of children's air pollutant exposure during school bus commutes. Journal of Exposure Analysis and Environmental Epidemiology 15 (5):377-387.
39. California Air Resources Board. 2005. Measuring Inside Vehicle Pollutants. California Environmental Protection Agency, California Air Resources Board. Retrieved October 3, 2011 from http://www.arb.ca.gov/research/indoor/in-vehsm.htm.
40. National Research Council. 2000. Toxicological Effects of Methylmercury. Washington, DC: National Academy Press.
41. U.S. Environmental Protection Agency. 1997. Mercury Study Report to Congress Volumes I to VII. Washington DC: U.S. Environmental Protection Agency Office of Air Quality Planning and Standards and Office of Research and Development. EPA-452/R-97-003. http://www.epa.gov/hg/report.htm.
42. U.S. Environmental Protection Agency. 2000. Deposition of Air Pollutants to the Great Waters: Third Report to Congress. Washington, DC. http://epa.gov/ttncaaa1/t3/reports/head_2kf.pdf.
43. U.S. Department of Education. 2010. Average number of hours and percentage of the student school week that public school teachers of first- through fourth-grade, self-contained classrooms spent on each of four subjects, total instruction hours per week on four subjects, total time spent delivering all instruction per week, and average length of student school week: Selected years 1987-88 through 2007-08. National Center for Education Statistics. Retrieved July 22, 2010 from http://nces.ed.gov/surveys/sass/tables/sass0708_005_t1n.asp.
44. South Coast Air Quality Management District. 2000. Multiple Air Toxics Exposure Study II. Retrieved July 22, 2010 from: http://www.aqmd.gov/matesiidf/matestoc.htm.

Appendices | Appendix A: Data Tables
America’s Children and the Environment | Third Edition A-7
Hazardous Air Pollutants
Table E4: Percentage of children ages 0 to 17 years living in census tracts where estimated hazardous air pollutant concentrations were greater than health benchmarks in 2005
Health Benchmark Cancer, one in 100,000 99.9
Cancer, one in 10,000 6.6
Other health effects 56.4
DATA: U.S. Environmental Protection Agency, National Air Toxics Assessment
Table E4a: Percentage of schoolchildren attending schools in census tracts where estimated hazardous air pollutant concentrations were greater than health benchmarks in 2005
Health Benchmark Cancer, one in 100,000 100.0
Cancer, one in 10,000 6.2
Other health effects 56.6
DATA: U.S. Environmental Protection Agency, National Air Toxics Assessment
Table E4b: Percentage of children ages 0 to 17 years living in census tracts where the cancer risk from estimated hazardous air pollutant concentrations was at least one in 10,000 in 2005, by race/ethnicity and family income
Race / Ethnicity All Incomes < Poverty Level ≥ Poverty Level All Races/Ethnicities 6.6 9.3 5.9
White 4.1 6.5 3.7
Black 7.2 7.4 7.0
Asian 14.4 21.1 13.5
American Indian/Alaska Native 4.1 3.5 4.4
Native Hawaiian or Other Pacific Islander 8.2 9.1 7.8
Hispanic 16.2 16.9 15.9
All Other Races† 17.0 19.9 16.0
DATA: U.S. Environmental Protection Agency, National Air Toxics Assessment
NOTE: Race categories include children of Hispanic ethnicity. Hispanic children may be of any race.
† The “All Other Races” category includes all other races not specified, together with those individuals who report more than one race.
Table E4c: Percentage of children ages 0 to 17 years living in census tracts where the non-cancer risk from estimated hazardous air pollutant concentrations exceeded health benchmarks in 2005, by race/ethnicity and family income
Race / Ethnicity All Incomes < Poverty Level ≥ Poverty Level All Races/Ethnicities 56.4 57.3 56.2
White 49.3 46.0 50.0
Black 72.9 71.8 73.5
Asian 81.4 84.4 81.0
American Indian/Alaska Native 32.1 28.0 34.2
Native Hawaiian or Other Pacific Islander 57.2 57.1 57.3
Hispanic 68.7 63.8 70.8
All Other Races† 70.3 68.5 71.0

Appendix A: Data Tables | Appendices
A-8 America’s Children and the Environment | Third Edition
DATA: U.S. Environmental Protection Agency, National Air Toxics Assessment
NOTE: Race categories include children of Hispanic ethnicity. Hispanic children may be of any race.
† The “All Other Races” category includes all other races not specified, together with those individuals who report more than one race.