Embed Size (px)
Citation preview

1
NATIONAL EMISSION STANDARDS FOR HAZARDOUS AIR POLLUTANTS (NESHAP) FOR THE PORTLAND CEMENT MANUFACTURING INDUSTRY SUBPART LLL
Rule Guidance October 2016 version
Table of Contents
PURPOSE AND GOALS FOR GUIDANCE ........................................................................................................... 3
POLICY AND TECHNICAL CONTACTS............................................................................................................... 3
INDIVIDUAL SECTION GUIDANCE ..................................................................................................................... 3
Section 63.1343(b) Table 1 – Dioxin/Furan Factors (updated July 2016) ........................................... 3
Section 63.1346(g)(3) – Startup and Shutdown Work Practices ............................................................. 4
Section 63.1349(b)(1)(vi) – Testing with mill on and mill off .................................................................... 4
Section 63.1349(b)(6)(v)(C)(1)(i) – Performance Testing Requirements (updated August 30 2016) ................................................................................................................................................................................... 4
Section 63.1349(b)(7) – Total Organic HAP Testing and Setting the THC Operating Limit......... 4
WEIGHTED AVERAGING ...................................................................................................................................... 5
Organic HAP Averaging .............................................................................................................................................. 5
THC Continuous Monitoring Averaging ............................................................................................................... 5
PM CPMS scaling ............................................................................................................................................................ 7
75% scaling for PM Performance Test ................................................................................................................. 9
SO2 SCALING GUIDANCE ...................................................................................................................................... 9
Section 63.1349(b)(6)(iii) Choosing to Monitor SO2 Emissions as Alternative to Section 63.1349(b)(6)(B) ........................................................................................................................................................... 9
CEDRI UPDATES (UPDATED 07/2016) .......................................................................................................... 10
Section 63.1354(b)9) – Reporting Requirements ......................................................................................... 10
Summary Reports (Section 63.1354(b)(9)) ..................................................................................................... 11

2
Semi-annual summary reporting of temperature averages (updated September 2016) ........... 11
PERFORMANCE TEST REPORTS ..................................................................................................................... 12
30-day Rolling Average Reporting ...................................................................................................................... 13
Reporting of Violations ............................................................................................................................................. 15
Updates to CEDRI for performance test reporting .................................................................................. 16
APPENDIX A – TOXIC EQUIVALENCY FACTORS ........................................................................................ 18

3
PURPOSE AND GOALS FOR GUIDANCE This document is intended for the use of EPA staff, State and Local regulatory agencies and their staff, and industry plant managers. The discussion in this document is intended solely as guidance. It does not impose legally binding requirements on the United States Environmental Protection Agency, state regulators, or the regulated industry. As new issues emerge on Subpart LLL, this guidance will be updated at http://www.epa.gov/airquality/cement/actions.html and a notice will be sent to industry and regulatory contacts for distribution.
POLICY AND TECHNICAL CONTACTS
• Sector Policies and Programs Division, Measurement Policy Group (MPG), Technical Contacts:
o Theresa Lowe, (919) 541-4786, for questions on Electronic Reporting Tool (ERT) or both Theresa or Gerri Garwood, (919) 541-2406 for technical questions associated with determination of Organic HAP operating limits.
o Ketan Patel, (919) 541-9736 for questions associated with electronic reporting using the Compliance and Emissions Data Reporting Interface (CEDRI).
• Regulatory Contact: Minerals and Manufacturing Group (MMG), Sharon Nizich, (919) 541-2825
• Office of Enforcement and Compliance Assurance Contact: Patrick Yellin (202) 564-2970
INDIVIDUAL SECTION GUIDANCE
Section 63.1343(b) Table 1 – Dioxin/Furan Factors (updated July 2016)
Table 1 of Section 63.1343(b) lists the emission limits for dioxin/furans. The units of the emission limit are ng/dscm @7% O2. The TEQ is developed by determining the mass of each congener measured during the performance test, then multiplying each congener by the toxic equivalent factor, or TEF. After the TEQ is developed per congener, they are added to obtain the total TEQ’s. The TEF’s have been re-evaluated in 2005 by the World Health Organization -IPCS using a different scale of magnitude.1, but Subpart LLL standards were developed based on TEF’s developed in 1989 as referenced in the TEQ definition section of the rule (Section 63.1341). Laboratories calculating the TEQ’s should be using these TEFs. They are copied in Appendix A below for the reader’s convenience.
1 Van den Berg, Martin, et. Al. The 2005 World Health Organization Re-evaluation of Human and Mammalian Toxic Equivalency Factors for Dioxins and Dioxin-like Compounds. Toxicol. Sci. 2006,Oct 93(2): 223-241

4
Section 63.1346(g)(3) – Startup and Shutdown Work Practices
This section states that all air pollution control devices must be turned on and operating prior to combustion of any fuels. This requirement is intended for air pollution control devices that are used to reduce HAP, and is not intended for non-HAP pollutants regulated under other standards (since the subpart LLL standards apply only to HAP emissions). Thus, air pollution control devices for NOx or SOx control, for example, are not be covered under this subsection (unless these devices are used to demonstrate compliance with HAP emission standards (e.g. SOx control device used for purposes of parametric monitoring of the HCl standard)) (see 78 FR 10011/1 (Feb. 13, 3013)).
Section 63.1349(b)(1)(vi) – Testing with mill on and mill off
This section states that for each performance test, one must conduct at least three separate test runs each while the mill is on and the mill is off. This requirement only applies to kilns with inline raw mills, as inline raw mills are considered part of the kiln and can affect kiln PM emissions. It specifically would not apply to a kiln that does not have an inline raw mill or to a clinker cooler, as in these cases the raw mill is a separate source from the kiln and has no effect on kiln or clinker cooler PM emissions. Note that if the exhaust streams of a kiln with an inline raw mill and a clinker cooler are comingled, then the comingled exhaust stream would need to be tested with raw mill off and raw mill on.
Section 63.1349(b)(6)(v)(C)(1)(i) – Performance Testing Requirements (updated August 30 2016)
In the recently published Direct Final Rule [[EPA–HQ–OAR–2011–0817; FRL–9949–46–OAR], 81 FR 48356 dated July 25, 2016, the EPA issued amended National Emissions Standards for Hazardous Air Pollutants for the Portland Cement Manufacturing Industry. Specifically, this rulemaking provides a one year allowance for the use of HCl CPMS instrumentation for continuous monitoring of HCl emissions.
This guidance seeks to clarify procedures for the establishment of a zero point related to setting the site specific operating limit. Zero point data for extractive instruments should be obtained by flooding the extractive probe with a zero air cylinder gas for a minimum of two minutes and observing a stable instrument response determined at the point where the instrument output changes less than 0.1 ppm in 30 seconds. As listed in provision 63.1349(b)(6)(v)(C)(1)(ii), if you are unable to perform this procedure, you must use a zero output value provided by the manufacturer.
Section 63.1349(b)(7) – Total Organic HAP Testing and Setting the THC Operating Limit
A source with an in line raw mill must do an initial performance test for each of two conditions: one with the raw mill on and one with the raw mill off. Below is a step by step example for setting a THC operating limit when a facility has an in line raw mill. Organic HAP Test. Use Method 320, Method 18, or ASTM D6348-03 or a combination of the methods. Method 320 and ASTM D6348-03 both employ an FTIR instrument that can detect a

5
number of organic HAP simultaneously; however, interferences in some spectra exist such that Method 18 may be necessary to target individual HAP and conduct GC analysis of the sample. THC CEMS. At the same time as the organic HAP test, a THC CEMS must be in operation. See 63.1349 (b)(7)(ii). The CEMS measurement scale must be capable of reading THC concentrations from zero to a level equivalent to two times your highest THC emissions average determined during the performance test. See 63.1349(b) (7) (v). Performance testing and THC monitoring must be conducted both while the raw mill is on and while the raw mill is off. See 63.1349 (b)(7) (iii ). When testing is complete, you must calculate both a weighted average organic HAP emission test result and a weighted average THC value using the fraction of the time the raw mill is on and the fraction of the time that the raw mill is off. See 63.1349 (b)(7) (iii). The fractions of raw mill on/off are determined based on historical representative averages. The operating limit will be calculated using these weighted averages.
WEIGHTED AVERAGING
Organic HAP Averaging
The following is an example of how to weight the average to determine both whether the facility is in compliance, and whether scaling would be allowed. 3 run average organic HAP measurement with mill off = 5.6 ppmv 3 run average organic HAP measurement with mill on = 7.7 ppmv Percent operating time with mill on = 90% Percent operating time with mill off = 10% Time weighted organic HAP emission = (y*t)+(x*(1-t)) Where: y = Average organic HAP value during mill on operations, ppmv t = Percentage of operating time with mill on x = Average organic HAP value during mill off operations, ppmv (1-t) = Percentage of operating time with mill off So in the above example we have: (7.7 * 0.9) + (5.6 * 0.1), therefore the time weighted organic HAP concentration would be (6.93 + 0.56) or 7.49 ppmv.
THC Continuous Monitoring Averaging
As specified in Section 63.1349(b)(7)(ii), at the same time that you are conducting the performance test for total organic HAP, you must also determine a site-specific THC emissions

6
limit by operating a THC CEMS in accordance with the requirements of §63.1350(j). The duration of the performance test must be at least 3 hours and the average THC concentration (as calculated from the 1-minute averages) during the 3-hour test period must be calculated. It is permissible to extend the testing time of the organic HAP performance test beyond 3 hours if you believe extended testing is required to adequately capture THC variability over time.
You must establish your THC operating limit and determine compliance with it according to paragraphs (b)(7)(vii) through (viii) of section 63.1349. (Please note the final rule lists it as (a)(7)(vii) through (viii), but that was a typographical error and will be corrected through a technical correction). Note that there are two different procedures to establish the THC limit depending on the measured level of organic HAP. If the measured weighted average organic HAP level is 9 ppmv or above, you establish the THC operating limit as the weighted average of the raw mill on/off measured THC levels. Continuing with the example stated above,
3 run average organic THC measurement with mill off = 30 ppmv 3 run average organic THC measurement with mill on = 40 ppmv Percent operating time with mill on = 90% Percent operating time with mill off = 10% Time weighted organic HAP emission = (y*t)+(x*(1-t)) Where: y = Average organic THC value during mill on operations, ppmv t = Fraction of operating time with mill on. x = Average organic THC value during mill off operations, ppmv (1-t) = Percentage of operating time with mill off. So in the above example we have: (40 * 0.9) + (30 * 0.1), therefore the time weighted THC operating limit would be (36 + 3) or 39 ppmv If the measured weighted average organic HAP is less than 9 ppmv Section 63.1349(b)(7)(iv) provides a scaling option for setting the THC site-specific parametric operating limit The scaling procedure estimates the expected THC emission level that would occur if the measured organic HAP level was exactly 9 ppmv (versus the 7.49 ppmv level in the example above). This is calculated by using the following formula which is found under 63.1349(b)(7)(vii)(B):
𝑇𝑇 = �9𝑌𝑌1� ∗ 𝑋𝑋1
Where:

7
T = the 30-day operating limit for a parametric THC instrument, ppmvw
Y1 = the average organic HAP concentration from performance testing, and
X1 = the average parametric THC concentration during performance testing, ppmvw
So in the above example we have: T = (9/7.49) * 39, therefore T = 47 ppmvw.
PM CPMS scaling
Section 63.1349(b) (1)(i)(A) states: “Your PM CPMS must provide a 4-20 milliamp output and the establishment of its relationship to manual reference method measurements must be determined in units of milliamps.” We note that many new CEMs no longer use an analog signal output (such as 4-20 milliamp) but make use of a digital signal output instead. Conversion of a digital signal to analog, then transporting that signal down a stack to an analog display that reads the analog signal, then reconverting that back to a digital signal before sending that signal to the Data Acquisition Handling System, requires the installation of equipment and unnecessary complexity which EPA did not intend. This guidance is directed at demonstrating the equivalency of each signal output and providing a means of compliance with the rule when a source uses an instrument equipped only with a digital signal output. It is important to understand that any digital or analog value from an instrument output uses some percentage of the output scale available to the instrument, between 0 and 100% of the output range. Think of this in terms of some fraction of the scale between zero and 100. The range of any digital signal from zero to 100% covers the range of the digital increments available to the signal. This depends on how many “bits” the digital signal is composed of, and the granularity of the signal value increases proportional to the number of bits carried. An eight bit digital signal has 28 , or 256 signal increments, a twelve bit signal as 212 or 4096 signal increments, a sixteen bit digital signal as 216 or 65536 signal increments and so on. In this manner, fifty percent of a digital scale is represented by a value at half of the digital signal increments. The range of a 4-20 milliamp signal is just that, from 4 to 20 milliamps; or a range of 16 milliamps between a zero value (4) and full (100%) scale (20). Fifty percent of a 4-20 milliamp signal is represented by a value of 12 milliamps (((20 – 4) / 2) + 4). In this manner a zero to full scale response of a 4 to 20 milliamp signal involves increasing a 4 milliamp reading a total of 16 milliamps until one reaches 20 milliamps. So a 100% rise in signal on a 4 to 20 milliamp output equates to 100 / 16 or 6.25% of full scale per milliamp. What remains constant about any output signal is that no matter how many increments one is able to divide the signal into, one is always able to determine what percent of output range is indicated by the value of the signal increment itself.
8
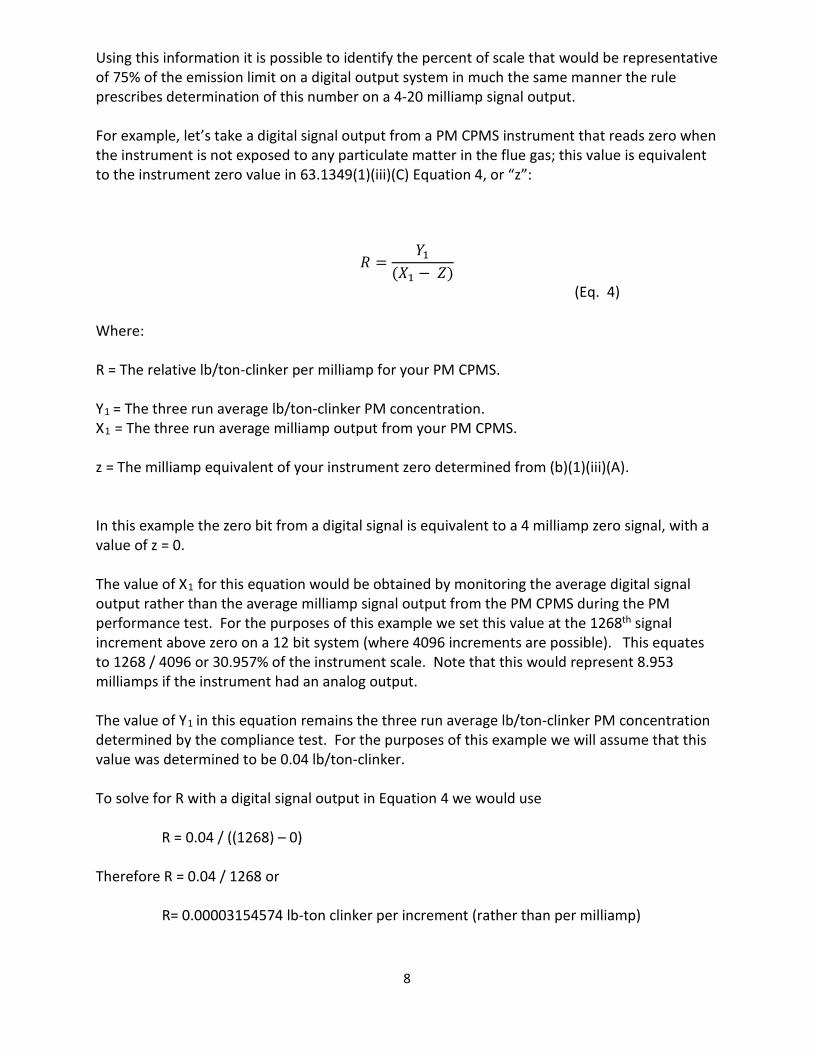
Using this information it is possible to identify the percent of scale that would be representative of 75% of the emission limit on a digital output system in much the same manner the rule prescribes determination of this number on a 4-20 milliamp signal output. For example, let’s take a digital signal output from a PM CPMS instrument that reads zero when the instrument is not exposed to any particulate matter in the flue gas; this value is equivalent to the instrument zero value in 63.1349(1)(iii)(C) Equation 4, or “z”:
𝑅𝑅 =𝑌𝑌1
(𝑋𝑋1 − 𝑍𝑍)
(Eq. 4) Where: R = The relative lb/ton-clinker per milliamp for your PM CPMS. Y1 = The three run average lb/ton-clinker PM concentration. X1 = The three run average milliamp output from your PM CPMS. z = The milliamp equivalent of your instrument zero determined from (b)(1)(iii)(A). In this example the zero bit from a digital signal is equivalent to a 4 milliamp zero signal, with a value of z = 0. The value of X1 for this equation would be obtained by monitoring the average digital signal output rather than the average milliamp signal output from the PM CPMS during the PM performance test. For the purposes of this example we set this value at the 1268th signal increment above zero on a 12 bit system (where 4096 increments are possible). This equates to 1268 / 4096 or 30.957% of the instrument scale. Note that this would represent 8.953 milliamps if the instrument had an analog output. The value of Y1 in this equation remains the three run average lb/ton-clinker PM concentration determined by the compliance test. For the purposes of this example we will assume that this value was determined to be 0.04 lb/ton-clinker. To solve for R with a digital signal output in Equation 4 we would use
R = 0.04 / ((1268) – 0) Therefore R = 0.04 / 1268 or
R= 0.00003154574 lb-ton clinker per increment (rather than per milliamp)

9
Carrying this value of R forward we can determine our source specific 30-day rolling average operating limit at 75% of the emission limit using the procedures in 63.1349(1)(iii)(D) as follows: (D) Determine your source specific 30-day rolling average operating limit using the lb/ton-clinker per milliamp value from Equation 4 in Equation 5, below. This sets your operating limit at the PM CPMS output value corresponding to 75 percent of your emission limit.
𝑂𝑂1 = 𝑧𝑧 + 0.75 (𝐿𝐿)
𝑅𝑅
(Eq. 5) This gives us the following: O1 = 0 + (0.75 * 0.07 lb/ton clinker) / 0.00003154574 OR O1 = 0.0525 / .00003154574 OR O1 = 1664.25 digital signal increments OR 40.63 % of the instrument scale. If the instrument used an analog output we could calculate the milliamp value by multiplying 16 (the amount of analog milliamp increments) by the percent of scale above, so 16 * 0.4063 = 6.500 and then we would add 4 (to represent our zero of four milliamps plus the percent scale) which places the 75% operating limit for an analog output signal at 10.5 milliamps on the 4-20 milliamp scale.
75% scaling for PM Performance Test
Note that the intent of Section 63.1349(b)(1)(i) was for the operator to use a weighted average for when the mill is on and the mill is off (as in all mill on/mill off situations). This weighted average would be calculated the same way as the weighted average developed and discussed above under the paragraph, “THC Continuous monitoring averaging”. However note that the units for averaging PM CPMS output are in milliamp, not ppmv.
SO2 SCALING GUIDANCE
Section 63.1349(b)(6)(iii) Choosing to Monitor SO2 Emissions as Alternative to Section 63.1349(b)(6)(B)
10
As noted above, the rule allows use of SO2 parametric monitoring to demonstrate continuous compliance with the HCl standard. Monitoring of SO2 using a CEMS and setting an SO2 operating limit must be done when the mill is on and the mill is off. As in the example above for organic HAP scaling, a weighted average should be calculated. The 75% adjustment however, does not apply for setting an SO2 operating limit.
In addition, please note that the rule places no restriction on the amount of sorbent injection used as long as the SO2 limit is met. However, if the SO2 control device is used intermittently, then an HCl monitor as described in 63.1349(b)(6)(i)(B) would be required, since the rule requires continuous monitoring if the source opts to demonstrate compliance using SO2 parametric monitoring. See section 63.1350(l).
CEDRI UPDATES (updated 07/2016)
Section 63.1354(b)9) – Reporting Requirements
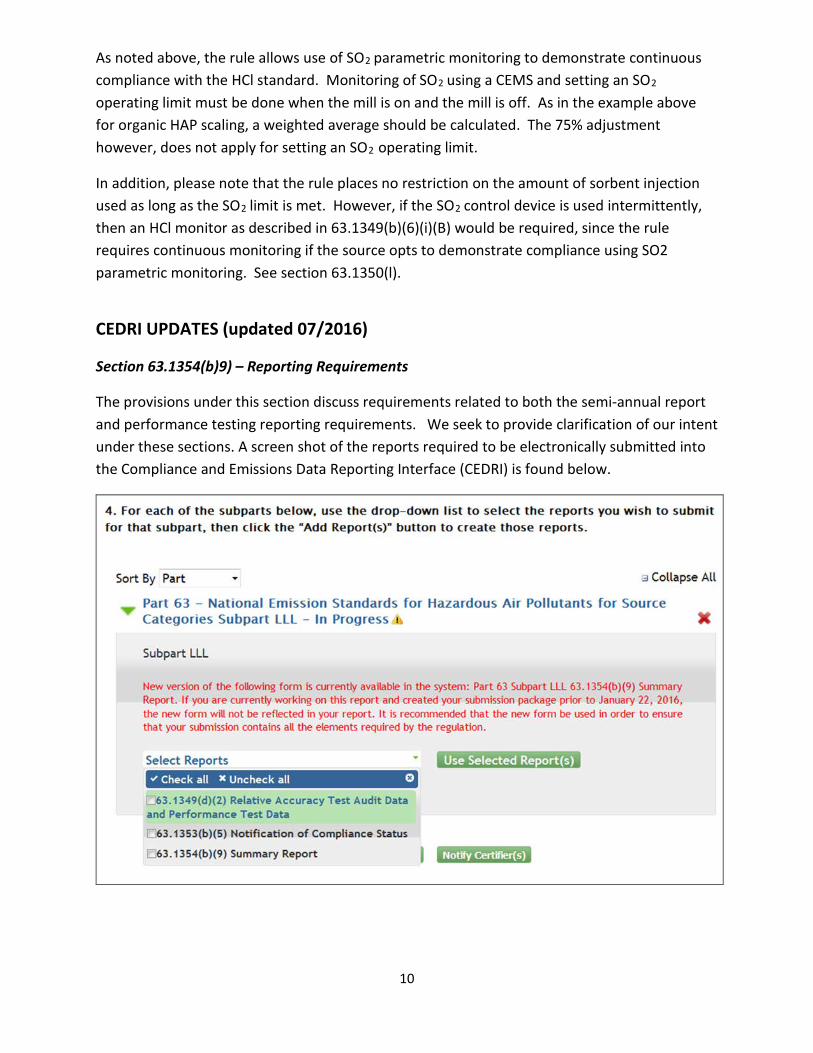
The provisions under this section discuss requirements related to both the semi-annual report and performance testing reporting requirements. We seek to provide clarification of our intent under these sections. A screen shot of the reports required to be electronically submitted into the Compliance and Emissions Data Reporting Interface (CEDRI) is found below.

11
Summary Reports (Section 63.1354(b)(9))
All summary reports are now to be entered into the CEDRI as listed under this section. The summary report submitted semiannually is now entered via the forms found in CEDRI. As of January 27, 2016, CEDRI has been revised and updated to allow users fields whereby they can add the required information via dropdown boxes, pdf uploads, or file uploads. Please note that CEDRI has also been updated to allow users to upload their calculated 180 minute average temperature values, for compliance with Section 63.1354(b)(9)(vi).
Semi-annual summary reporting of temperature averages (updated September 2016)
After a new analysis EPA conducted of the language in Section 63.1354(b)(9)(vi), D/F temperature averages reporting is not required by this provision. Therefore, reporting these averages is not required in CEDRI. Please note however, that the requirement to report any exceedance of the D/F temperature limit in the semiannual report per Section 63.1354(b)(9)(i) is still in force.
For facilities who wish to continue reporting these averages, the guidance on developing the reports will remain in this guidance document as follows:
According to Section 63.1350(g)(4), a source must calculate the rolling three-hour average temperature using the average of 180 successive, one-minute average temperatures. To report these averages, the source would need to report the initial three-hour average derived from these 180 successive one-minute average temperatures. For each hour, the previous 180 successive, one-minute average temperatures should be reported. For instance, at the beginning of each hour of minutes the source would include the previous two hours (or 120 minutes) and the current hour (60 minutes), which totals 180 minutes, and then report those values, so that for each day, there would be 24 discrete values reported. Thus, this translates to a maximum of 4320 values in a 6-month report (24/day x 30/month x 6 months). This can be uploaded to CEDRI in spreadsheet form. The owner/operator would submit two spreadsheets: one with the raw mill on and one with the raw mill off. Since the raw mill is off about 10 percent of the time, the expected raw mill off spreadsheet would include about 432 values, and the raw mill on spreadsheet would include about 3888 values. CEDRI is now programmed to accept these two spreadsheets. The spreadsheets should be labelled so that the reviewer can ascertain which spreadsheet is for the raw mill on and which spreadsheet is for the raw mill off.
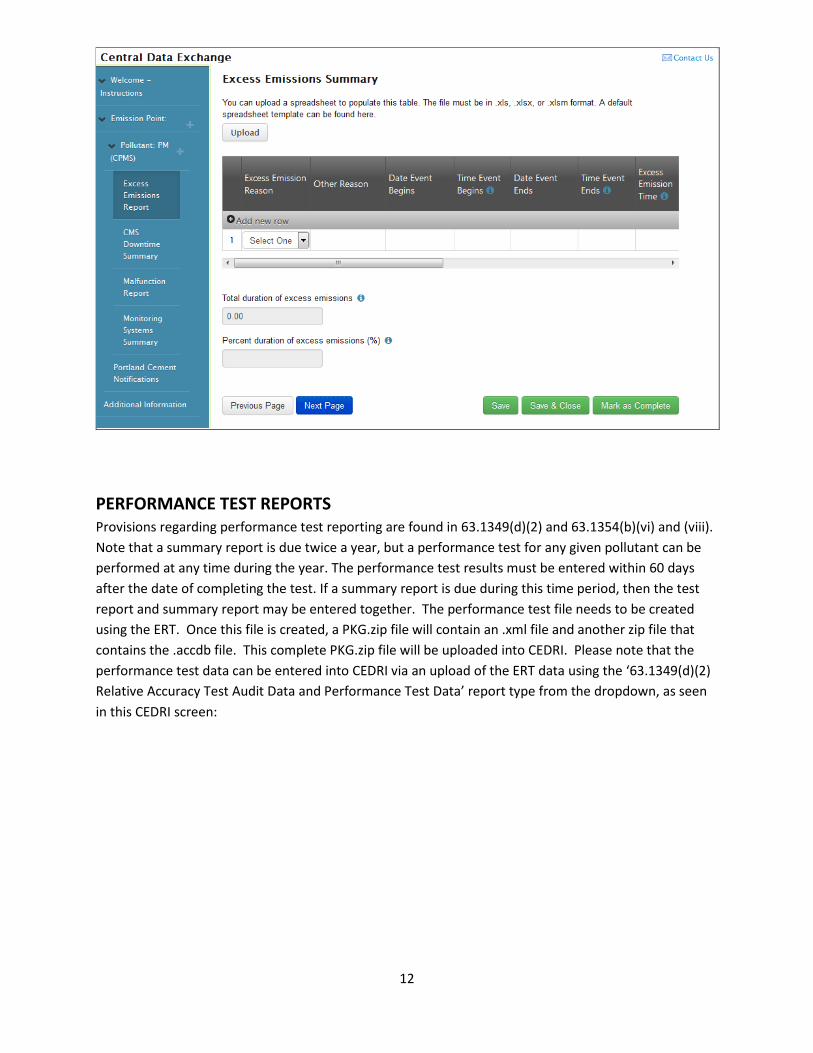
A summary report is due 60 days after the end of the reporting period. In addition, fields are provided in the `63.1354(b)(9) Summary Report’ form found in CEDRI to account for items required for reporting under Section 63.10(e)(3)(vi). For example, the “excess emissions summary” screen is shown below:
12
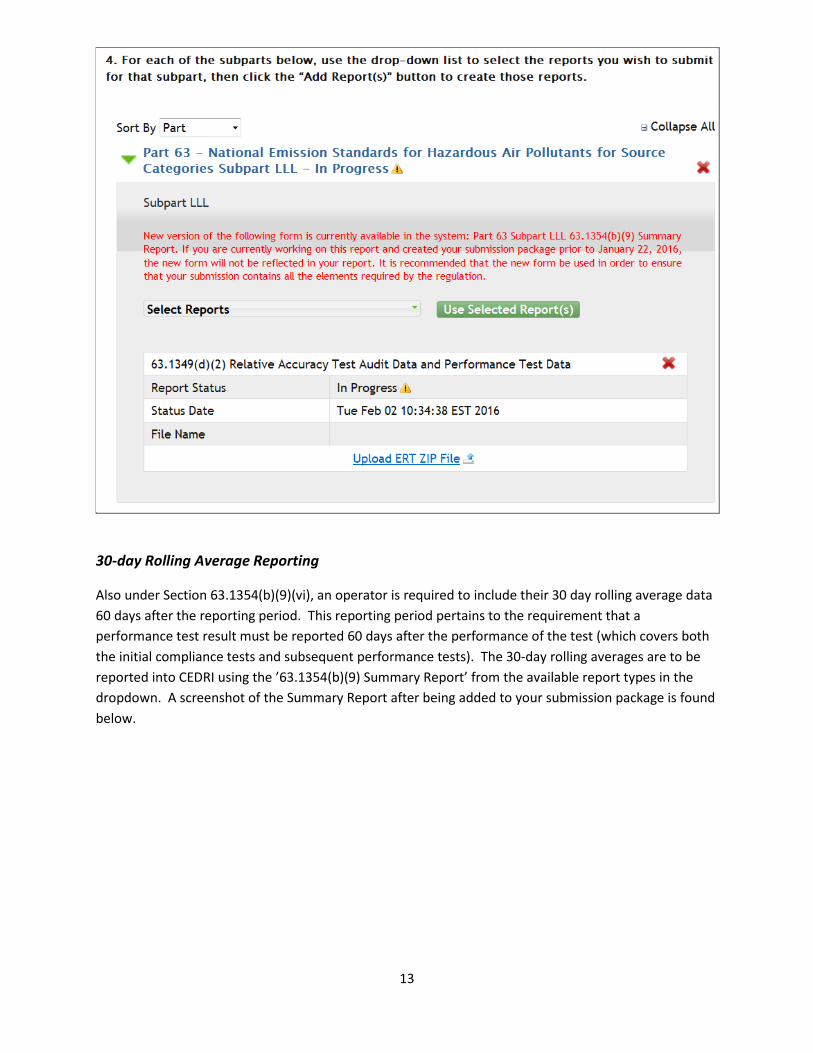
PERFORMANCE TEST REPORTS Provisions regarding performance test reporting are found in 63.1349(d)(2) and 63.1354(b)(vi) and (viii). Note that a summary report is due twice a year, but a performance test for any given pollutant can be performed at any time during the year. The performance test results must be entered within 60 days after the date of completing the test. If a summary report is due during this time period, then the test report and summary report may be entered together. The performance test file needs to be created using the ERT. Once this file is created, a PKG.zip file will contain an .xml file and another zip file that contains the .accdb file. This complete PKG.zip file will be uploaded into CEDRI. Please note that the performance test data can be entered into CEDRI via an upload of the ERT data using the ‘63.1349(d)(2) Relative Accuracy Test Audit Data and Performance Test Data’ report type from the dropdown, as seen in this CEDRI screen:
13
30-day Rolling Average Reporting
Also under Section 63.1354(b)(9)(vi), an operator is required to include their 30 day rolling average data 60 days after the reporting period. This reporting period pertains to the requirement that a performance test result must be reported 60 days after the performance of the test (which covers both the initial compliance tests and subsequent performance tests). The 30-day rolling averages are to be reported into CEDRI using the ’63.1354(b)(9) Summary Report’ from the available report types in the dropdown. A screenshot of the Summary Report after being added to your submission package is found below.

14
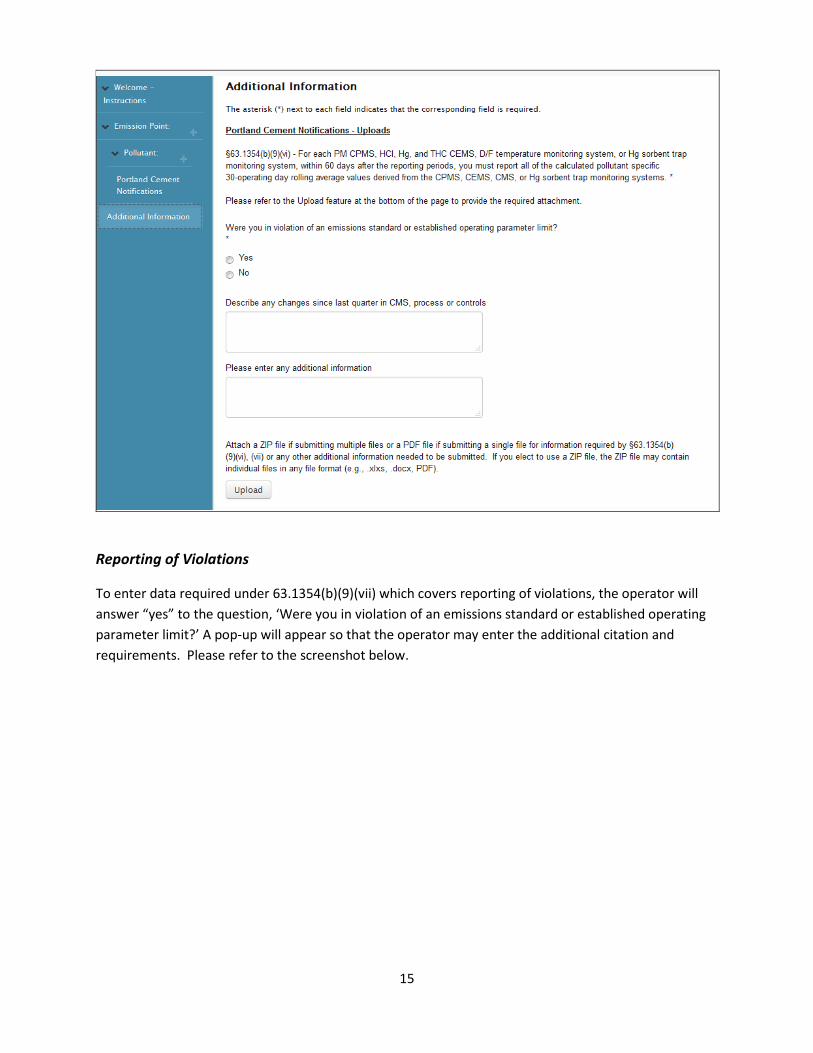
Once this report is selected, you will click on the ‘Create/Edit Form(s)’ link to access the form. Within the Summary Report form, the 30-day rolling average data can be uploaded on the “Additional Information” page under the citation found under 63.1354(b)(9)(vi). Please see the screen shot below:
15
Reporting of Violations
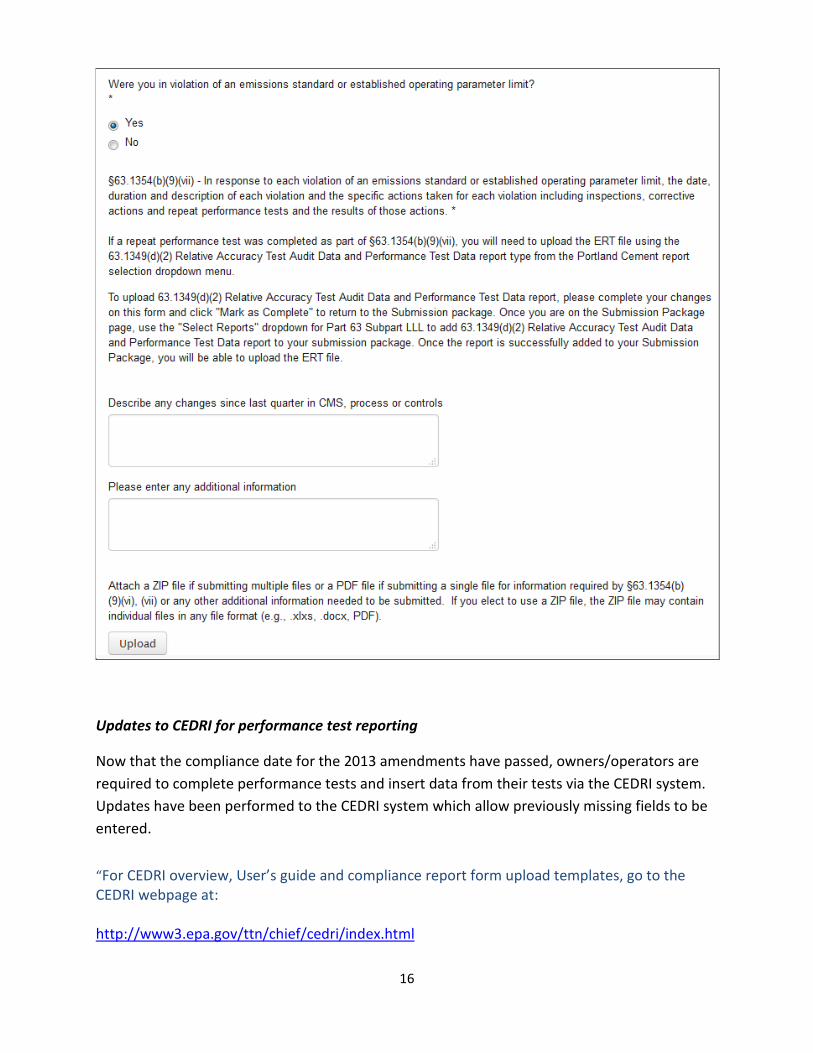
To enter data required under 63.1354(b)(9)(vii) which covers reporting of violations, the operator will answer “yes” to the question, ‘Were you in violation of an emissions standard or established operating parameter limit?’ A pop-up will appear so that the operator may enter the additional citation and requirements. Please refer to the screenshot below.
16
Updates to CEDRI for performance test reporting
Now that the compliance date for the 2013 amendments have passed, owners/operators are required to complete performance tests and insert data from their tests via the CEDRI system. Updates have been performed to the CEDRI system which allow previously missing fields to be entered.
“For CEDRI overview, User’s guide and compliance report form upload templates, go to the CEDRI webpage at: http://www3.epa.gov/ttn/chief/cedri/index.html

17
Or download the CEDRI user’s guide at: http://www3.epa.gov/ttn/chief/cedri/TDD%2010%2011%20CEDRI%20User%20Guide%20v%208.pdf”

18
APPENDIX A – Toxic Equivalency Factors
Dioxins/furans TEFs 89 2,3,7,8-TCDD 1 1,2,3,7,8-PeCDD 0.5 1,2,3,4,7,8-HxCDD 0.1 1,2,3,6,7,8-HxCDD 0.1 1,2,3,7,8,9-HxCDD 0.1 1,2,3,4,6,7,8-HpCDD 0.01 OCDD 0.001 2,3,7,8-TCDF 0.1 1,2,3,7,8-PeCDF 0.05 2,3,4,7,8-PeCDF 0.5 1,2,3,4,7,8-HxCDF 0.1 1,2,3,6,7,8-HxCDF 0.1 1,2,3,7,8,9-HxCDF 0.1 2,3,4,6,7,8-HxCDF 0.1 1,2,3,4,6,7,8-HpCDF 0.01 1,2,3,4,7,8,9-HpCDF 0.01 OCDF 0.001