Embed Size (px)
Citation preview

Hazard Detection on Runways using Image processing
Techniques
Girish Singh Rajput, Zia-ur Rahman
Old Dominion University, Electrical and Computer Engineering Department,
Norfolk, Virginia 23529
ABSTRACT
With the tremendous increase in the number of air passengers in the past years, aviation safety has been ofutmost importance. At any given point of time, there will be several flights lining up for landing. Landing ingood visibility conditions is not a problem. However, the problem arises when we have poor visibility conditions,especially foggy conditions. The pilot finds it difficult to land the flight in poor visibility conditions becauseof the difficulty to spot the runway clearly. This paper presents a novel method for detecting the runways andhazards on it in poor visibility conditions using image processing techniques.
The first step is to obtain the images of a runway on a clear day and compute the smoothness coefficientfollowed by edge detection, using the SUSAN edge detection algorithm and then finally develop a database ofthe smoothness coefficients and edge detected images. Now, for the foggy images we compute the smoothnesscoefficient. Typically, foggy images have low contrast. Hence, before we perform edge detection, we enhancethe image using Multi-Scale Retinex (msr). msr provides the low contrast enhancement and color constancy,required to enhance foggy images, by performing non-linear spatial/spectral transforms. After enhancement,the next step is to run the same edge detection algorithm with appropriate thresholds. Finally we determine ahazard by comparing the edge detected images of images taken under clear and foggy conditions. The paper alsocompares the results of the SUSAN edge detection algorithm with the state of art edge detection techniques.
Keywords: Runway detection, smoothing coefficient, Multi-Scale Retinex, SUSAN edge detection
1. INTRODUCTION
With the increasing demand for air travel, runway safety is of prime importance for Federal Aviation Adminis-tration (FAA), airlines and airports. Runway safety is an aviation safety concern, involving measures to preventrunway incursions and overruns. FAA defined a runway incursion as any occurrence involving an aircraft, ve-hicle, person, or object on the ground that creates a collision hazard or results in a loss of required separationwhen an aircraft is taking off, intending to take off, landing, or intending to land. The International Civil Avi-ation Organization (ICAO) defined an incursion as the incorrect presence of aircraft, vehicle, or person on theprotected area of a surface designated for landing or take-off of aircraft. There had been six runway collisions inUnited States in the past since 1990 with the worst accident occurring at the Los Angles International airportin 1997.1 Increasing number of runway accidents are raising concerns over the safety of air travelers. There canbe several reasons for accidents on the runway. There is a possibility of a landing aircraft running into anotheraircraft or unattended vehicle that is holding on the runway. Landing the aircraft in clear conditions is not aproblem for the pilot because the pilot can visualize the situation and act accordingly. There would be a varietyof problems that a pilot could face to land the aircraft in poor visibility conditions, starting from viewing therunway to determining if the runway is clear. Hazard detection on runways in poor visibility conditions is oneof the current research areas of the NASA’s aviation safety program. Poor visibility conditions could be fog,haze, smoke or dull lighting conditions. Because the pilot is faced with several tasks before landing, we proposea novel approach to assist the pilot to determine the runway and detect the hazards on the runway to avoidaccidents.
Contact: GSR: [email protected]; ZR: [email protected].
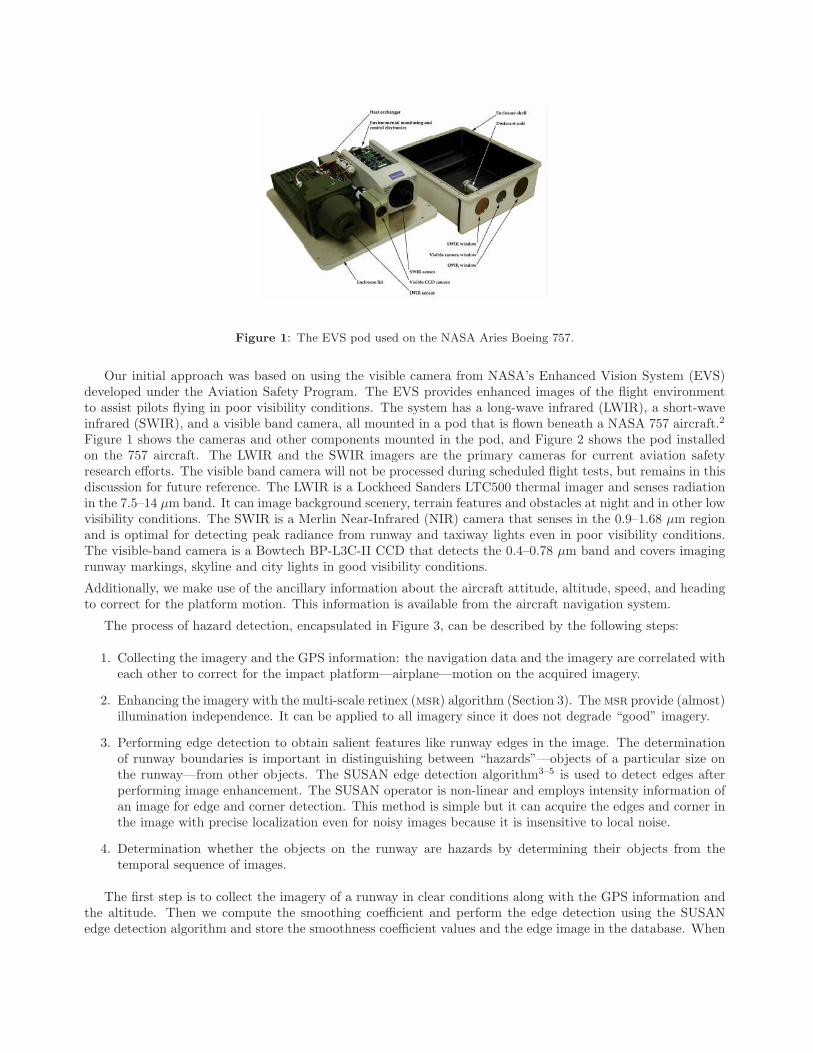
Figure 1: The EVS pod used on the NASA Aries Boeing 757.
Our initial approach was based on using the visible camera from NASA’s Enhanced Vision System (EVS)developed under the Aviation Safety Program. The EVS provides enhanced images of the flight environmentto assist pilots flying in poor visibility conditions. The system has a long-wave infrared (LWIR), a short-waveinfrared (SWIR), and a visible band camera, all mounted in a pod that is flown beneath a NASA 757 aircraft.2
Figure 1 shows the cameras and other components mounted in the pod, and Figure 2 shows the pod installedon the 757 aircraft. The LWIR and the SWIR imagers are the primary cameras for current aviation safetyresearch efforts. The visible band camera will not be processed during scheduled flight tests, but remains in thisdiscussion for future reference. The LWIR is a Lockheed Sanders LTC500 thermal imager and senses radiationin the 7.5–14 µm band. It can image background scenery, terrain features and obstacles at night and in other lowvisibility conditions. The SWIR is a Merlin Near-Infrared (NIR) camera that senses in the 0.9–1.68 µm regionand is optimal for detecting peak radiance from runway and taxiway lights even in poor visibility conditions.The visible-band camera is a Bowtech BP-L3C-II CCD that detects the 0.4–0.78 µm band and covers imagingrunway markings, skyline and city lights in good visibility conditions.
Additionally, we make use of the ancillary information about the aircraft attitude, altitude, speed, and headingto correct for the platform motion. This information is available from the aircraft navigation system.
The process of hazard detection, encapsulated in Figure 3, can be described by the following steps:
1. Collecting the imagery and the GPS information: the navigation data and the imagery are correlated witheach other to correct for the impact platform—airplane—motion on the acquired imagery.
2. Enhancing the imagery with the multi-scale retinex (msr) algorithm (Section 3). The msr provide (almost)illumination independence. It can be applied to all imagery since it does not degrade “good” imagery.
3. Performing edge detection to obtain salient features like runway edges in the image. The determinationof runway boundaries is important in distinguishing between “hazards”—objects of a particular size onthe runway—from other objects. The SUSAN edge detection algorithm3–5 is used to detect edges afterperforming image enhancement. The SUSAN operator is non-linear and employs intensity information ofan image for edge and corner detection. This method is simple but it can acquire the edges and corner inthe image with precise localization even for noisy images because it is insensitive to local noise.
4. Determination whether the objects on the runway are hazards by determining their objects from thetemporal sequence of images.
The first step is to collect the imagery of a runway in clear conditions along with the GPS information andthe altitude. Then we compute the smoothing coefficient and perform the edge detection using the SUSANedge detection algorithm and store the smoothness coefficient values and the edge image in the database. When

Figure 2. The EVS pod mounted on the NASA Aries Boeing 757. The sensors point down at a 4◦ angle with respectto the belly of the aircraft.
the aircraft is ready to land, we take the imagery and correct it for the attitude by using the GPS information.Then we compute the smoothness coefficient and compare it with the smoothness coefficient values in thedatabase for the corresponding GPS information. If the value is more than the value in the database, then itindicates that the image is foggy. Then we apply the Multi-Scale Retinex (msr) to the image which is an imageenhancement technique. Image enhancement is not required if the smoothness coefficient is lower than the valuein the database. Then we take the edge image using the SUSAN edge detection operator. The threshold ishigher for the image with lower smoothness coefficient than the enhanced imaged. After we get the edge image,we subtract it from the edge image in the database. If there is a significant difference, then we say that thereis a hazard, else, we say that the runway is safe to land.
2. SMOOTHING COEFFICIENT
The degree of smoothness of an image depends upon the amount of energy in the high frequencies. Hence, thesmoothness can be quantified by using measuring the energy in the image at high frequencies. The smoothnesscoefficient is given by the following equation:6
S2 =M1M2
∑
ω1,ω2
∣
∣I(ω1, ω2)G(ω1, ω2; ζ = 1.0; ρc = 0.3)∣
∣
2(1)
where, I is the discrete Fourier transform of the M1 × M2 input image, and G is a high-pass filter given by
G(ω1, ω2; ρc; ζ) = exp[
− (ω21 + ω2
2)/ρ2c
]
− ζ exp[
− 2.56(ω21 + ω2
2)/ρ2c
]
. (2)
The smoothness coefficient, S, represents the reciprocal of the amount of energy in the high-pass filtered versionof the input image, I: the higher the amount of energy, the more the high frequency information. Since, the

Figure 3: Illustration of the flow for detection runway hazards.
high-frequency information is directly correlated to the fine details in an image, the smoother an image thelarger the S.
Figure 4 displays the images with the decreasing amount of fog and Figure 5 shows their correspondingsmoothness coefficients.
3. MULTI-SCALE RETINEX
A fundamental concern in the development of resilient, vision-based, automation technology is the impactof wide-ranging extraneous lighting and exposure variations on the acquired imagery. This concern can beconsiderably ameliorated by the application of the (msr) image-enhancement algorithm.7–11 The msr is a non-linear, context-dependent enhancement algorithm that provides color-constancy, dynamic range compressionand sharpening:
Ri(x1, x2) =κ∑
k=0
wk (log (Ii(x1, x2)) − log (Ii(x1, x2) ∗ Fk(x1, x2))) , i = 1, . . . , N, (3)
where Ii is the ith spectral band of the N -band input image, Ri is the corresponding is the Retinex output, ‘∗’represents the (circular) convolution operator, F is a (Gaussian) surround function, and κ is the number of thescales. The Gaussian surround function is given by:
Fk(x1, x2) = akGk(x1, x2) (4)
Gk(x1, x2) = exp(
−(x21 + x2
2)/σ2k
)
(5)
ak =∑
x1,x2
Gk(x1, x2), (6)
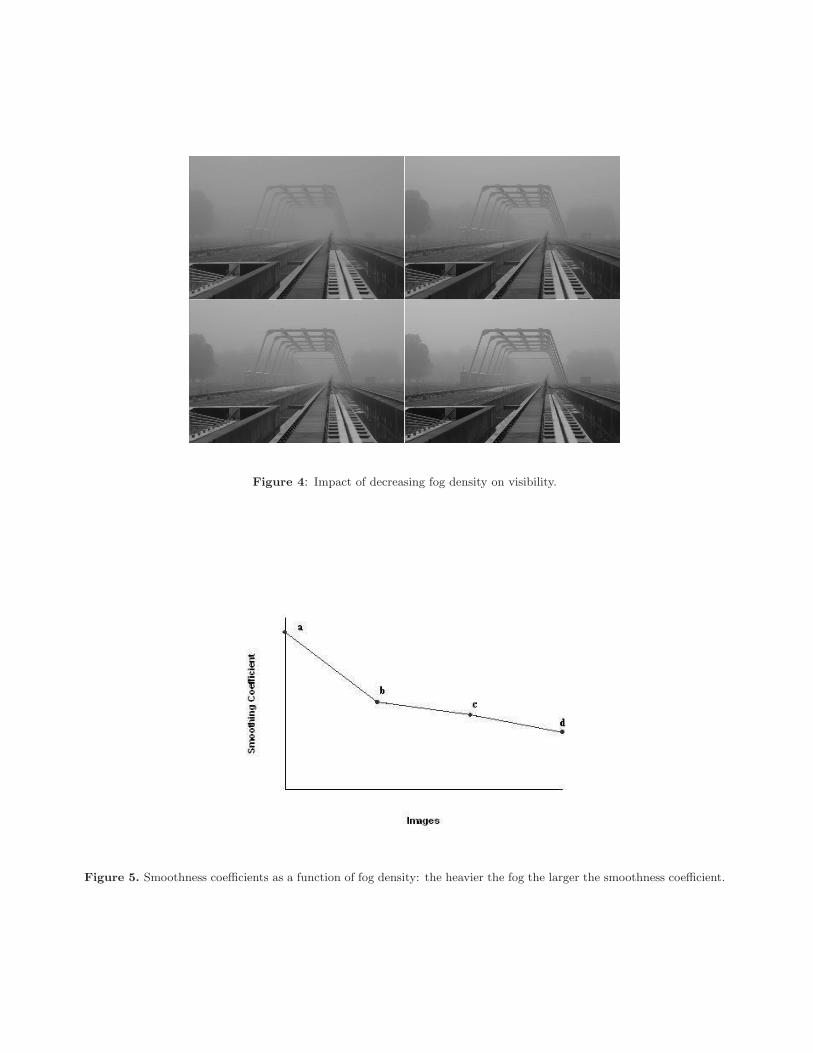
Figure 4: Impact of decreasing fog density on visibility.
Figure 5. Smoothness coefficients as a function of fog density: the heavier the fog the larger the smoothness coefficient.
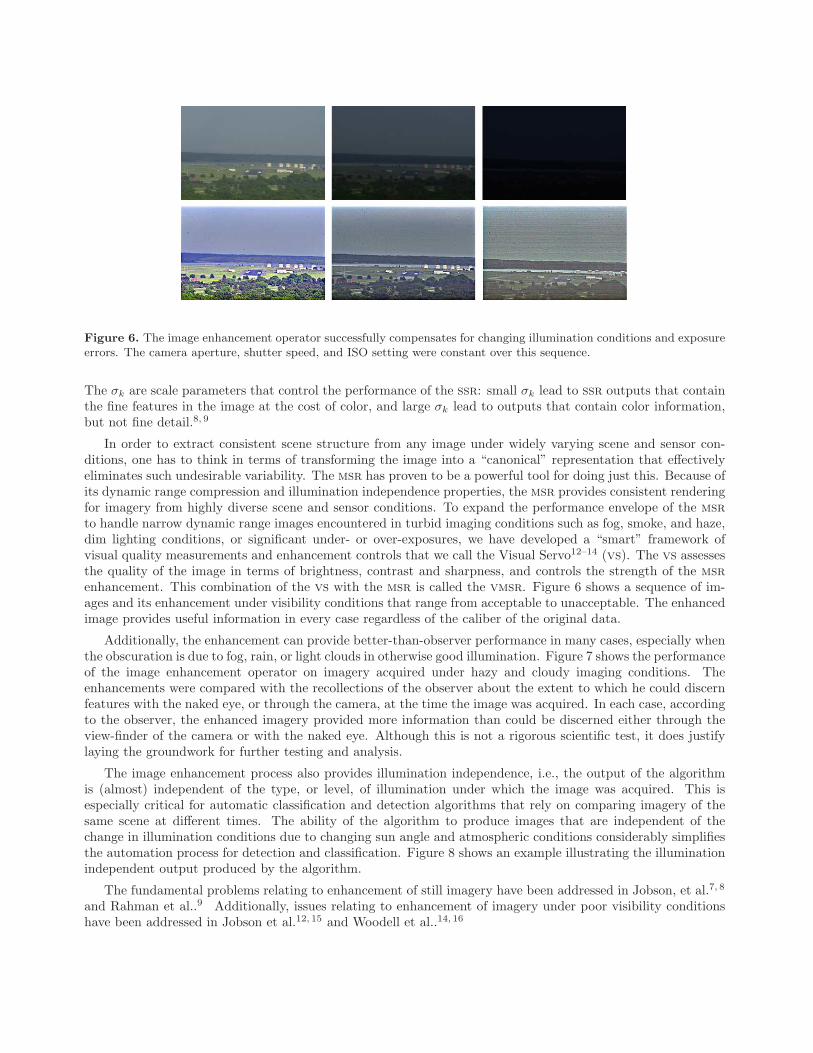
Figure 6. The image enhancement operator successfully compensates for changing illumination conditions and exposureerrors. The camera aperture, shutter speed, and ISO setting were constant over this sequence.
The σk are scale parameters that control the performance of the ssr: small σk lead to ssr outputs that containthe fine features in the image at the cost of color, and large σk lead to outputs that contain color information,but not fine detail.8, 9
In order to extract consistent scene structure from any image under widely varying scene and sensor con-ditions, one has to think in terms of transforming the image into a “canonical” representation that effectivelyeliminates such undesirable variability. The msr has proven to be a powerful tool for doing just this. Because ofits dynamic range compression and illumination independence properties, the msr provides consistent renderingfor imagery from highly diverse scene and sensor conditions. To expand the performance envelope of the msr
to handle narrow dynamic range images encountered in turbid imaging conditions such as fog, smoke, and haze,dim lighting conditions, or significant under- or over-exposures, we have developed a “smart” framework ofvisual quality measurements and enhancement controls that we call the Visual Servo12–14 (vs). The vs assessesthe quality of the image in terms of brightness, contrast and sharpness, and controls the strength of the msr
enhancement. This combination of the vs with the msr is called the vmsr. Figure 6 shows a sequence of im-ages and its enhancement under visibility conditions that range from acceptable to unacceptable. The enhancedimage provides useful information in every case regardless of the caliber of the original data.
Additionally, the enhancement can provide better-than-observer performance in many cases, especially whenthe obscuration is due to fog, rain, or light clouds in otherwise good illumination. Figure 7 shows the performanceof the image enhancement operator on imagery acquired under hazy and cloudy imaging conditions. Theenhancements were compared with the recollections of the observer about the extent to which he could discernfeatures with the naked eye, or through the camera, at the time the image was acquired. In each case, accordingto the observer, the enhanced imagery provided more information than could be discerned either through theview-finder of the camera or with the naked eye. Although this is not a rigorous scientific test, it does justifylaying the groundwork for further testing and analysis.
The image enhancement process also provides illumination independence, i.e., the output of the algorithmis (almost) independent of the type, or level, of illumination under which the image was acquired. This isespecially critical for automatic classification and detection algorithms that rely on comparing imagery of thesame scene at different times. The ability of the algorithm to produce images that are independent of thechange in illumination conditions due to changing sun angle and atmospheric conditions considerably simplifiesthe automation process for detection and classification. Figure 8 shows an example illustrating the illuminationindependent output produced by the algorithm.
The fundamental problems relating to enhancement of still imagery have been addressed in Jobson, et al.7, 8
and Rahman et al..9 Additionally, issues relating to enhancement of imagery under poor visibility conditionshave been addressed in Jobson et al.12, 15 and Woodell et al..14, 16

Figure 7. Images acquired with a Nikon Digital D1 camera during NASA Langley Research Center’s FORESITE testflights. The enhancements provide better-than-observer visibility.
Figure 8. The impact of illuminant change was simulated by red, blue, and green shifting an image (top row). The msr
outputs are almost perfectly color constant (bottom row).

4. SUSAN EDGE DETECTION
After the preprocessing stage (if required), the next step is to perform the edge detection to determine thehazards on the runway. Edge detection is used because it is the basic low level primitive for image processingwhich conveys the structural information about the structures in the image. Edge detection performs the filteringoperation to reduce the amount of data in the image by removing the irrelevant information and preserving thestructural information in the image.
There are many edge detection operators like Canny, Sobel, Marr-Hildreth, that are widely used which havetheir own drawbacks. Some of the drawbacks are poor connectivity at the edges and the corners being rounded.Also, with the increase in the Gaussian filter, there is a decrease in the noise levels at the expense of accuracyin localization of edges. The authors have resorted to the SUSAN edge detection operator, a non-linear filteringoperator, which is above the drawbacks of most of the other edge detection operators.
The main idea of the SUSAN edge detection operator is to associate a small area of neighboring pixels withsimilar brightness to a center pixel. This small area of pixels with similar brightness is termed as USAN, whichis an acronym for Univalue Segment Assimilating Nucleus. This phenomenon of associating each point in theimage with an area of pixels with similar brightness is the basis for the SUSAN principle. The USAN containslot of information about the structure of the image which is effectively region finding on a small scale. From thesize, centroid and the axis of symmetry of the USAN, the edges and two dimensional features can be detected.The acronym SUSAN (Smallest Univalue Segment Assimilating Nucleus) comes from the principle which statesthat, an image processed to give as output inverted USAN area has edges and two dimensional features stronglyenhanced, with the two dimensional features more strongly enhanced than edges.
The SUSAN edge detection algorithm is implemented using circular masks of 37 pixels (radius of 3.4 pixels).The mask is as follows:
Mask =
0 0 1 1 1 0 00 1 1 1 1 1 01 1 1 1 1 1 11 1 1 1 1 1 11 1 1 1 1 1 10 1 1 1 1 1 00 0 1 1 1 0 0
(7)
This mask is placed at each pixel in the image and the brightness of each pixel in the mask is compared withthe nucleus using the following equation:
c(~r, ~r0) =
{
1 if |I(~r) − I(~r0)| ≤ t0 if |I(~r) − I(~r0)| > t
(8)
where ~ro is the position of the center pixel, ~r is the position of neighboring pixels in the mask in the twodimensional image, I(~ro) is the intensity of the nucleus, I(~r) is the intensity of other pixels in the mask and t isthe threshold. The parameter t is used to determine the minimum contrast of features and maximum amountof noise to be ignored. For a foggy image, the value of t is smaller when compared to that of a clear imagebecause the foggy images have lower contrast. Figure 9 shows the edges of an image in clear conditions. Thenumber of pixels in the USAN is counted as follows:
n(~ro) =∑
~r
c(~r, ~ro). (9)
After finding the value of n, it is compared with the geometric threshold:
R(~r0) =
{
g − n(~ro) if n(~ro) < g0 otherwise,
(10)
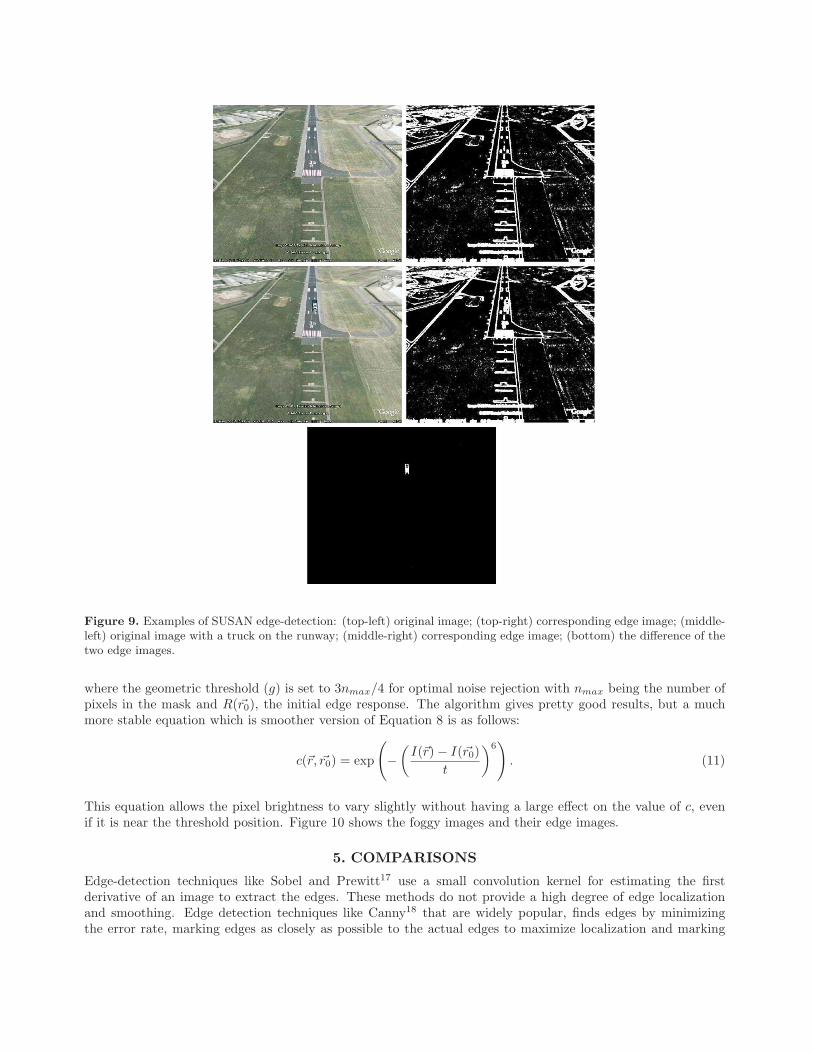
Figure 9. Examples of SUSAN edge-detection: (top-left) original image; (top-right) corresponding edge image; (middle-left) original image with a truck on the runway; (middle-right) corresponding edge image; (bottom) the difference of thetwo edge images.
where the geometric threshold (g) is set to 3nmax/4 for optimal noise rejection with nmax being the number ofpixels in the mask and R(~r0), the initial edge response. The algorithm gives pretty good results, but a muchmore stable equation which is smoother version of Equation 8 is as follows:
c(~r, ~r0) = exp
(
−
(
I(~r) − I(~r0)
t
)6)
. (11)
This equation allows the pixel brightness to vary slightly without having a large effect on the value of c, evenif it is near the threshold position. Figure 10 shows the foggy images and their edge images.
5. COMPARISONS
Edge-detection techniques like Sobel and Prewitt17 use a small convolution kernel for estimating the firstderivative of an image to extract the edges. These methods do not provide a high degree of edge localizationand smoothing. Edge detection techniques like Canny18 that are widely popular, finds edges by minimizingthe error rate, marking edges as closely as possible to the actual edges to maximize localization and marking

edges only once when a single edge exists for minimal response. Canny uses the calculus of variation to satisfythe criterion and derive the optimal function which is a close approximation to the first derivative of theGaussian function. Non-maximum suppression is performed followed by removal of edges using thresholding.Thresholding is applied with hysteresis. While performing the Gaussian convolution can be fast, the hysteresisstage can slow down the computation. Even though the results from the Canny are stable, it does not providegood edge connectivity and the corner are rounded. The scale of the Gaussian determines the amount of noisereduction. With the increase in the size of the Gaussian, the smoothing effect increases resulting in poor edgelocalization. The fact that the SUSAN edge detection algorithm does not use any image derivatives gives agood reason for its performance in presence of noise. Because the SUSAN edge detection technique uses theUSAN area, it provides better localization, good connectivity and no false edges. The computation speed of theSUSAN edge detection is about 10 times faster than Sobel and Canny which is very important in applicationslike the one described here. Because of the integrating effect and its non-linear response, the SUSAN givesshows good tolerance to noise. Figure 10 (third-row) shows examples of the performance of the Canny operatoron images of interest. The performance of the SUSAN algorithm (Figure 10 (bottom-row)) is superior to thatprovided by Canny and does not depend on selecting an optimal threshold value for each of the images.
6. CONCLUSIONS
In this paper, we have presented a novel method for detection of hazards on the runways in poor visibilitycondition. This technique assists the pilot at the time of landing the aircraft by automatically detecting thehazards on the runway. The algorithm uses the msr image enhancement technique which performs well underpoor visibility conditions. The SUSAN edge detection algorithm was used for foggy images and provided goodresults. Also, the SUSAN edge detection algorithm is fast when compared to other state of the art techniques.The work presented here is in initial stages and system design has not been finalized. There could be a fewmore add-ons to make the system more robust to varying illumination and weather conditions. Also, the resultsprovided in this paper are not the images of the runway because; we could not acquire the runway images infoggy conditions. However, the good results that are provided in the initial stages provide a good platform forfurther improving this project.
ACKNOWLEDGMENTS
The authors wish to thank the NASA Aviation Safety Program for the funding which made this work possible.This work was supported under NASA cooperative agreement NNL07AA02A.
REFERENCES
1. US Government Accountability Office, “AVIATION RUNWAY AND RAMP SAFETY: Sustained efforts toaddress leadership, technology, and other challenges needed to reduce accidents and incidents.” GAO-08-29,Novemeber 2007.
2. C. L. Tiana, J. R. Kerr, and S. D. Harrah, “Multispectral uncooled infrared enhanced-vision system forflight test,” in Enhanced and Synthetic Vision 2001, J. G. Verly, ed., pp. 231–236, Proc. SPIE 4363, 2001.
3. R. Zhang, G. Zhao, and L. Su, “A new edge detection method in image processing,” in IEEE InternationalSymposium on Communications and Information Technology, 2005 (ISCIT 2005), pp. 445–448, 2005.
4. M. M. Perez and T. J. Dennis, “An adaptive implementation of the susan method for image edge and featuredetection,” in Proceedings of the IEEE International Conference on Image Processing, p. 394, IEEE, 1997.
5. W. Muyun and H. Mingyi, “Image feature detection and matching based on SUSAN method,” in Pro-ceedings of the First International Conference on Innovative Computing: Information and Control, 1,pp. 322–325, 2006.
6. Z. Rahman, D. J. Jobson, G. A. Woodell, and G. D. Hines, “Automated, on-board terrain analysis forprecision landings,” in Visual Information Processing XV, Z. Rahman, S. E. Reichenbach, and M. A.Neifeld, eds., Proc. SPIE 6246, 2006.
7. D. J. Jobson, Z. Rahman, and G. A. Woodell, “Properties and performance of a center/surround retinex,”IEEE Trans. on Image Processing 6, pp. 451–462, March 1997.
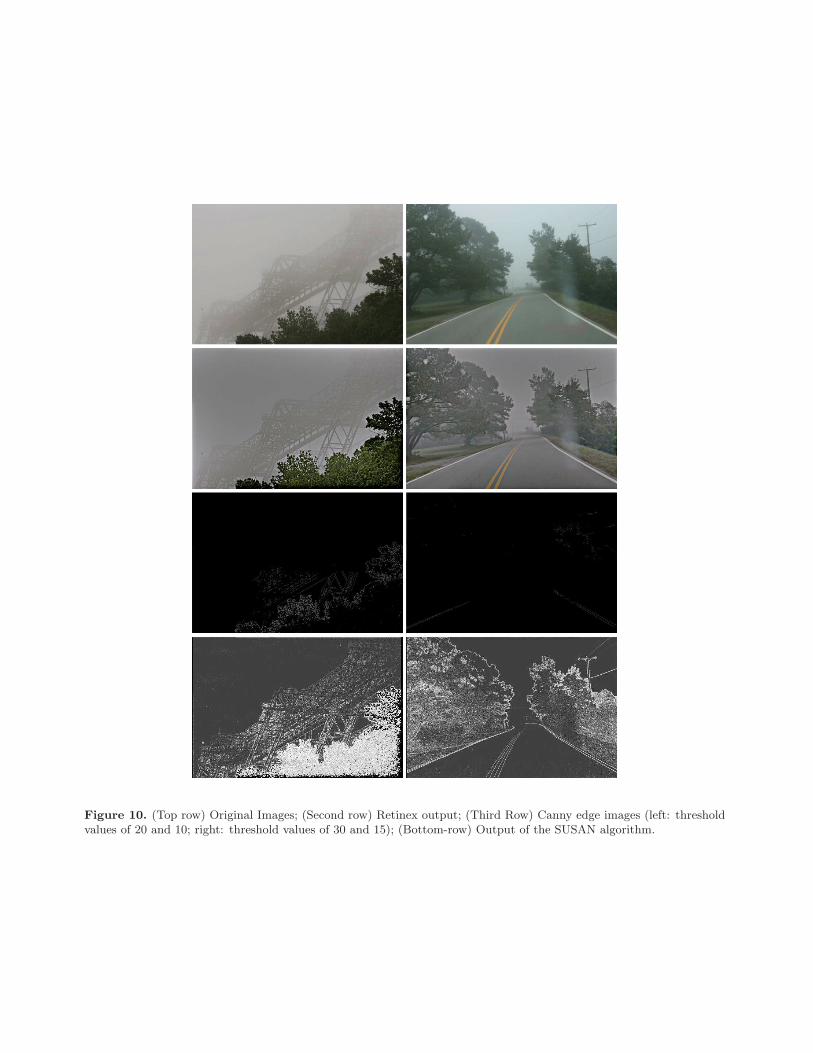
Figure 10. (Top row) Original Images; (Second row) Retinex output; (Third Row) Canny edge images (left: thresholdvalues of 20 and 10; right: threshold values of 30 and 15); (Bottom-row) Output of the SUSAN algorithm.
8. D. J. Jobson, Z. Rahman, and G. A. Woodell, “A multi-scale Retinex for bridging the gap between colorimages and the human observation of scenes,” IEEE Transactions on Image Processing: Special Issue onColor Processing 6, pp. 965–976, July 1997.
9. Z. Rahman, D. J. Jobson, and G. A. Woodell, “Retinex processing for automatic image enhancement,”Journal of Electronic Imaging 13(1), pp. 100–110, 2004.
10. Z. Rahman, D. J. Jobson, and G. A. Woodell, “Resliency of the multiscale retinex image enhancementalgorithm,” in Proceedings of the IS&T Sixth color Imaging Conference: Color Science, Systems, andApplications, pp. 129–134, IS&T, 1998.
11. Z. Rahman, G. A. Woodell, and D. J. Jobson, “A comparison of the multiscale retinex with other imageenhancement techniques,” in Proceedings of the IS&T 50th Anniversary Conference, pp. 426–431, IS&T,1997.
12. D. J. Jobson, Z. Rahman, and G. A. Woodell, “Feature visibility limit in the nonlinear enhancementof turbid images,” in Visual Information Processing XII, Z. Rahman, R. A. Schowengerdt, and S. E.Reichenbach, eds., Proc. SPIE 5108, 2003.
13. D. J. Jobson, Z. Rahman, G. A. Woodell, and G. D. Hines, “The automatic assessment and reduction ofnoise using edge pattern analysis in nonlinear image enhancement,” in Visual Information Processing XIII,Z. Rahman, R. A. Schowengerdt, and S. E. Reichenbach, eds., Proc. SPIE 5438, 2004.
14. G. A. Woodell, D. J. Jobson, Z. Rahman, and G. D. Hines, “Enhancement of imagery in poor visibilityconditions,” in Sensors, and Command, Control, Communications, and Intelligence (C3I) Technologies forHomeland Security and Homeland Defense IV, E. Carapezza, ed., Proc. SPIE 5778, 2005.
15. D. J. Jobson, Z. Rahman, G. A. Woodell, and G. D. Hines, “A comparison of visual statistics for the imageenhancement of foresite aerial images with those of major image classes,” in Visual Information ProcessingXV, Z. Rahman, S. E. Reichenbach, and M. A. Neifeld, eds., Proc. SPIE 6246, 2006.
16. G. A. Woodell, D. J. Jobson, Z. Rahman, and G. D. Hines, “Advanced image processing of aerial imagery,”in Visual Information Processing XV, Z. Rahman, S. E. Reichenbach, and M. A. Neifeld, eds., Proc. SPIE6246, 2006.
17. R. C. Gonzalez and R. E. Woods, Digital Image Processing, Addison-Wesley, Reading, MA, 1993.
18. J. Canny, “A computational approach to edge detection,” IEEE Transactions on Pattern Analysis andMachine Intelligence 8(6), pp. 679–698, 1986.