Embed Size (px)
Citation preview
Hazard Assessment of Lava Flows,
Wildfires, and Tsunamis on the Big
Island of Hawaii’s population
By: Thomas Ditges
The Problem:
The Big Island of Hawaii is the largest and most dangerous of the Hawaiian Islands. The
Hawaiian hotspot has triggered 3 active volcanoes: Hualalai, Mauna Loa, and Kilauea. In
addition, the Big Island of Hawaii is highly susceptible to tsunamis and wildfires. These can pose
a dangerous threat to the surrounding population. The purpose of this project is to assess what
regions of the Big Island are the most dangerous and what percentage of the population are
affected by these hazards.
Question: What regions and populations of the Big Island are the most susceptible to hazards?
Data Collection:
Downloaded Transportation shapefile from the Big Island from the USGS National Map
Viewer.
https://viewer.nationalmap.gov/basic/#productSearch
Downloaded **Census Tracks- 2015 from the 016 Cultural and Demographic tab on the
Hawaiian government website from Home<Hawaii Statewide GIS Program<Download
GIS Data.
http://planning.hawaii.gov/gis/download-gis-data/
Downloaded Lava Flow Hazard Zones from the 009-Human Health and Safety tab on the
Hawaiian government website from Home<Hawaii Statewide GIS Program<Download
GIS Data. The source of this data is the U.S. Department of the Interior/ Geological
Survey and the data is digitized by the Office of Planning for the USGS, Hawaii Volcano
Observatory, 1991.
Downloaded Wildfire Risk Ratings from the 009-Human Health and Safety tab on the
Hawaiian government website from Home<Hawaii Statewide GIS Program<Download
GIS Data. The source of this data is the Department of Land and Natural Resources,
Division of Forestry and Wildlife, Fire Management Program, 2007. Data was collected
by state wildland fire-fighting agencies in 2006 and 2007.
Downloaded Tsunami Wave Heights Ratings from the 009-Human Health and Safety tab
on the Hawaiian government website from Home<Hawaii Statewide GIS
Program<Download GIS Data. The source of the data is ‘Tsunami Wave Runup Heights
in Hawaii,’ Harold G. Loomis, May, 1976. The data was digitized by the Office of
Planning Staff in October,1999.
Downloaded Boundaries, Names, and Transportation datasets from the USGS national
map viewer from data download. These datasets are more accurate because they are
regularly updated in the years 2017 and 2018.
Downloaded United States Board on Geographic names
https://geonames.usgs.gov/domestic/download_data.htm
Data Preprocessing:
1) Converting GIS Data into ArcGIS-readable format
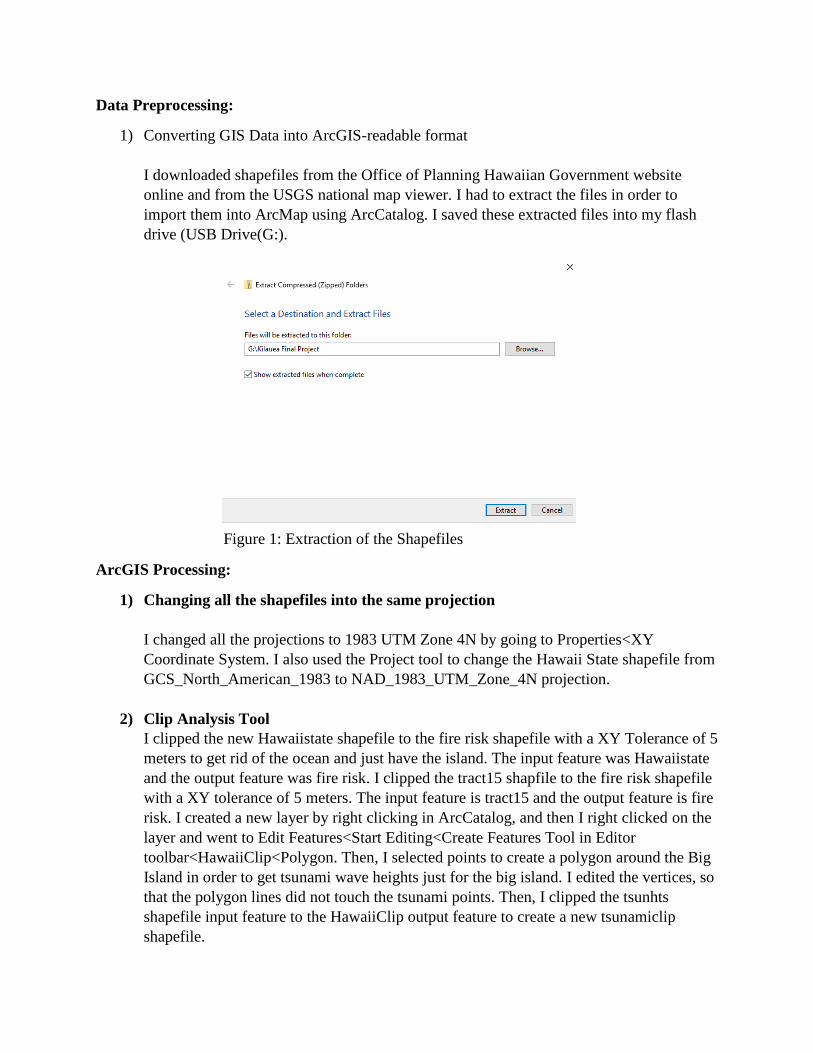
I downloaded shapefiles from the Office of Planning Hawaiian Government website
online and from the USGS national map viewer. I had to extract the files in order to
import them into ArcMap using ArcCatalog. I saved these extracted files into my flash
drive (USB Drive(G:).
Figure 1: Extraction of the Shapefiles
ArcGIS Processing:
1) Changing all the shapefiles into the same projection
I changed all the projections to 1983 UTM Zone 4N by going to Properties<XY
Coordinate System. I also used the Project tool to change the Hawaii State shapefile from
GCS_North_American_1983 to NAD_1983_UTM_Zone_4N projection.
2) Clip Analysis Tool
I clipped the new Hawaiistate shapefile to the fire risk shapefile with a XY Tolerance of 5
meters to get rid of the ocean and just have the island. The input feature was Hawaiistate
and the output feature was fire risk. I clipped the tract15 shapfile to the fire risk shapefile
with a XY tolerance of 5 meters. The input feature is tract15 and the output feature is fire
risk. I created a new layer by right clicking in ArcCatalog, and then I right clicked on the
layer and went to Edit Features<Start Editing<Create Features Tool in Editor
toolbar<HawaiiClip<Polygon. Then, I selected points to create a polygon around the Big
Island in order to get tsunami wave heights just for the big island. I edited the vertices, so
that the polygon lines did not touch the tsunami points. Then, I clipped the tsunhts
shapefile input feature to the HawaiiClip output feature to create a new tsunamiclip
shapefile.
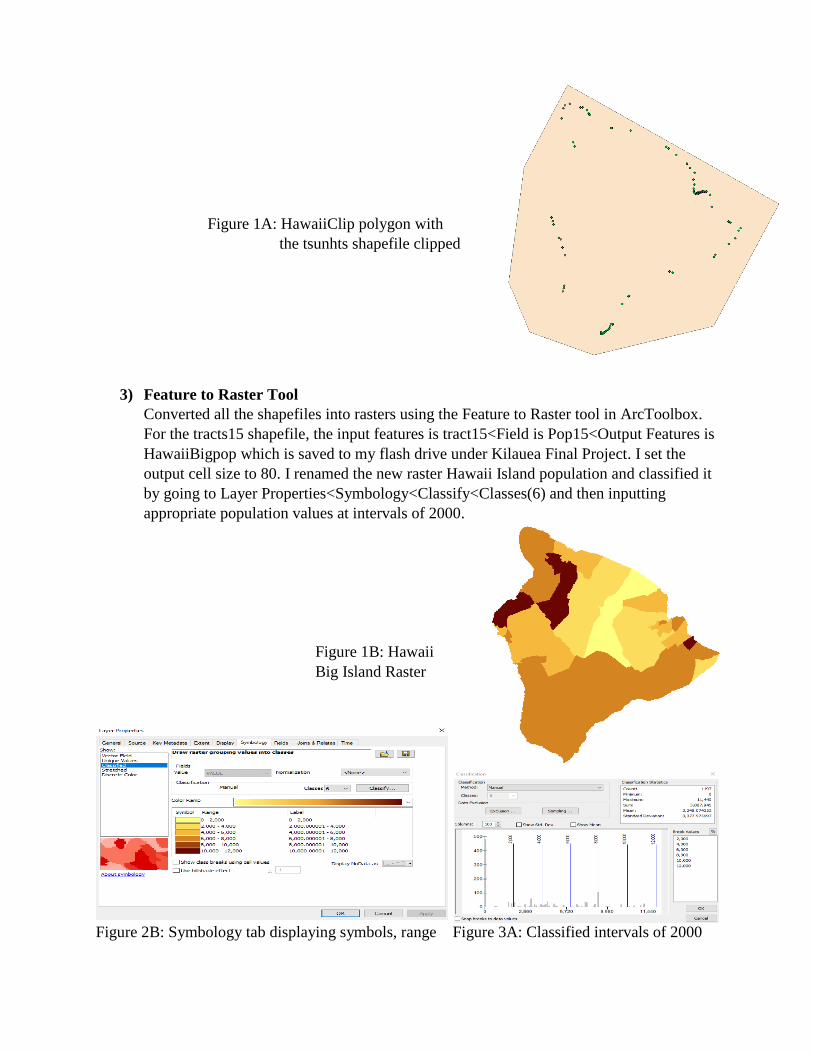
Figure 1A: HawaiiClip polygon with
the tsunhts shapefile clipped
3) Feature to Raster Tool
Converted all the shapefiles into rasters using the Feature to Raster tool in ArcToolbox.
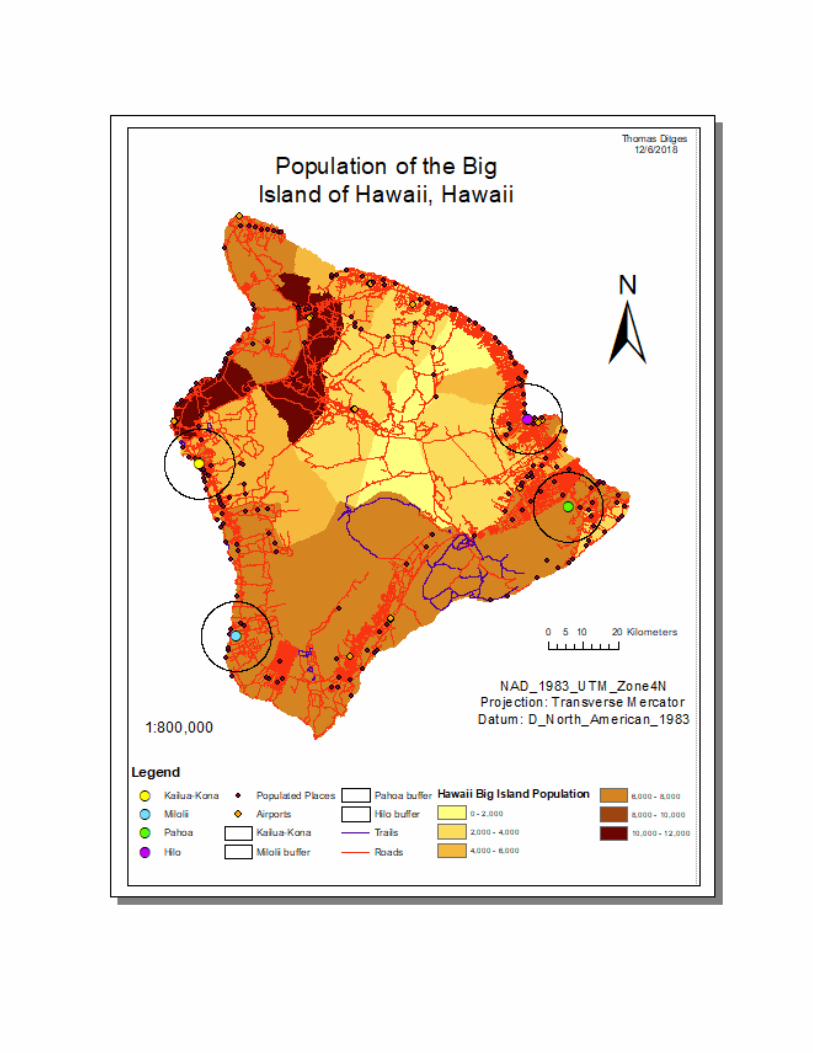
For the tracts15 shapefile, the input features is tract15<Field is Pop15<Output Features is
HawaiiBigpop which is saved to my flash drive under Kilauea Final Project. I set the
output cell size to 80. I renamed the new raster Hawaii Island population and classified it
by going to Layer Properties<Symbology<Classify<Classes(6) and then inputting
appropriate population values at intervals of 2000.
Figure 1B: Hawaii
Big Island Raster
Figure 2B: Symbology tab displaying symbols, range Figure 3A: Classified intervals of 2000
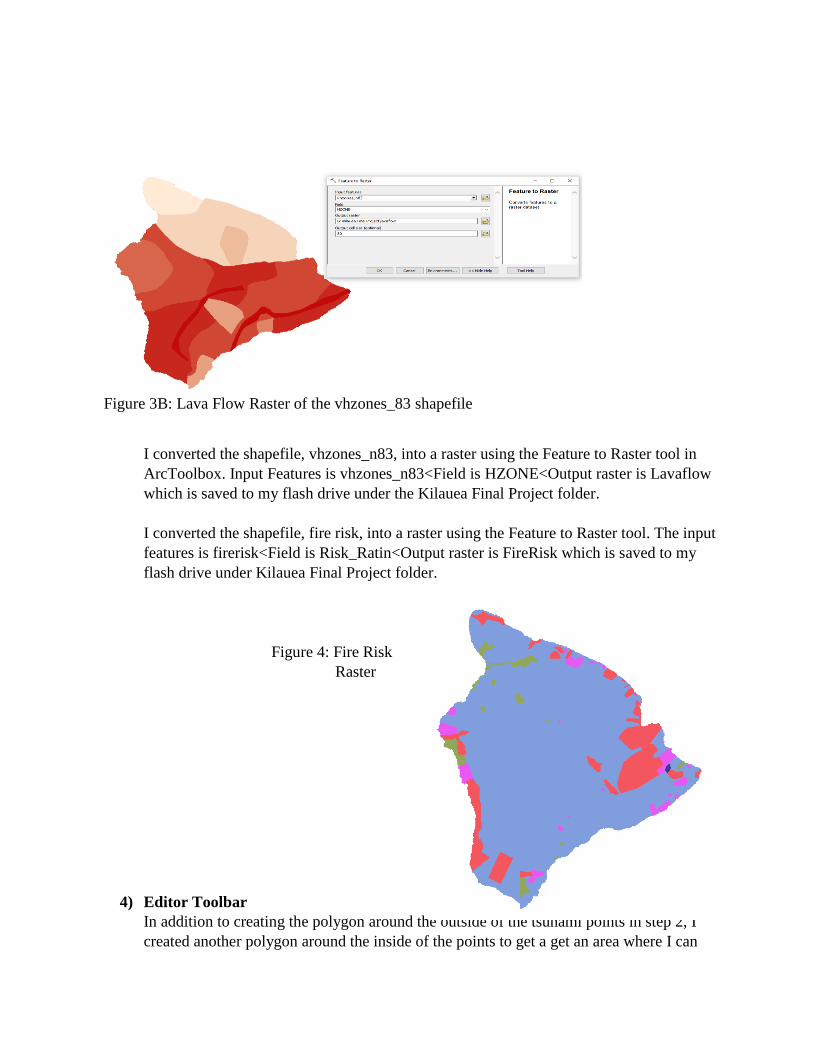
Figure 3B: Lava Flow Raster of the vhzones_83 shapefile
I converted the shapefile, vhzones_n83, into a raster using the Feature to Raster tool in
ArcToolbox. Input Features is vhzones_n83<Field is HZONE<Output raster is Lavaflow
which is saved to my flash drive under the Kilauea Final Project folder.
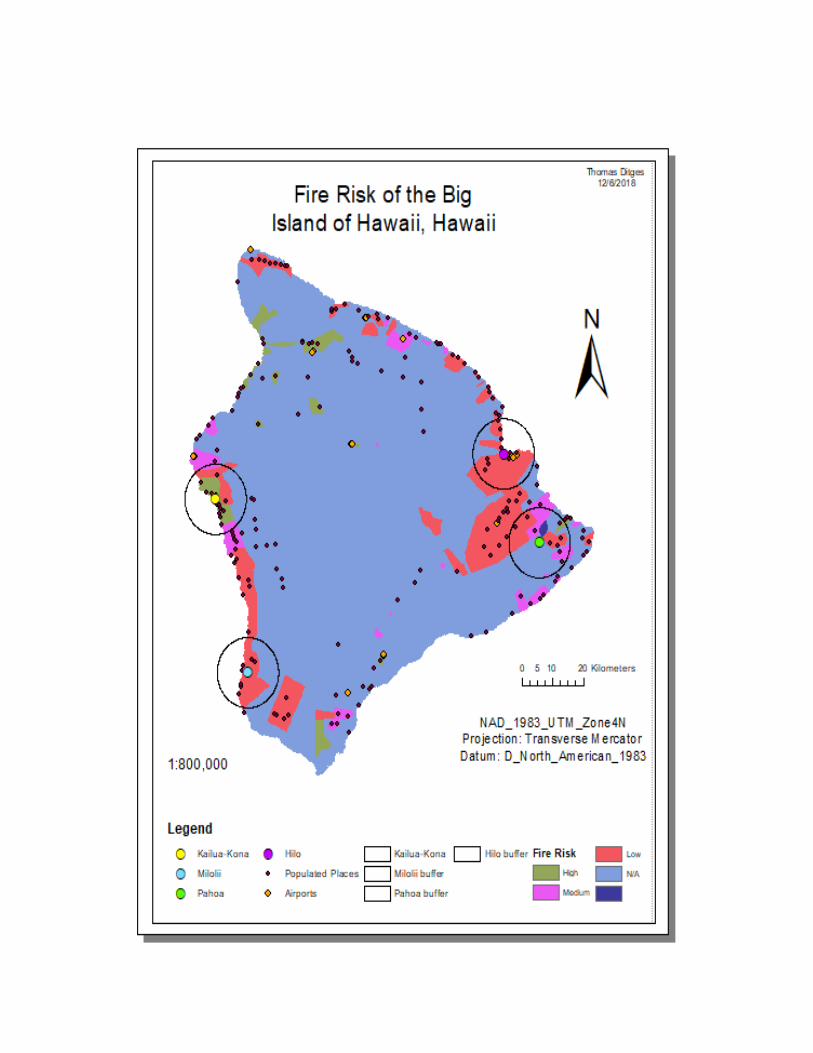
I converted the shapefile, fire risk, into a raster using the Feature to Raster tool. The input
features is firerisk<Field is Risk_Ratin<Output raster is FireRisk which is saved to my
flash drive under Kilauea Final Project folder.
Figure 4: Fire Risk
Raster
4) Editor Toolbar
In addition to creating the polygon around the outside of the tsunami points in step 2, I
created another polygon around the inside of the points to get a get an area where I can
get a mask. The steps I did to get this polygon are: HawaiiClip layer<Edit Features<Start
Editing<Create Features in Editor toolbar<HawaiiClip<Polygon. Then, I selected vertices
around the inside of the tsunami points by inserting vertices and saving my edits.
Figure 4A: Edited polygons
of the HawaiiClip shapefile
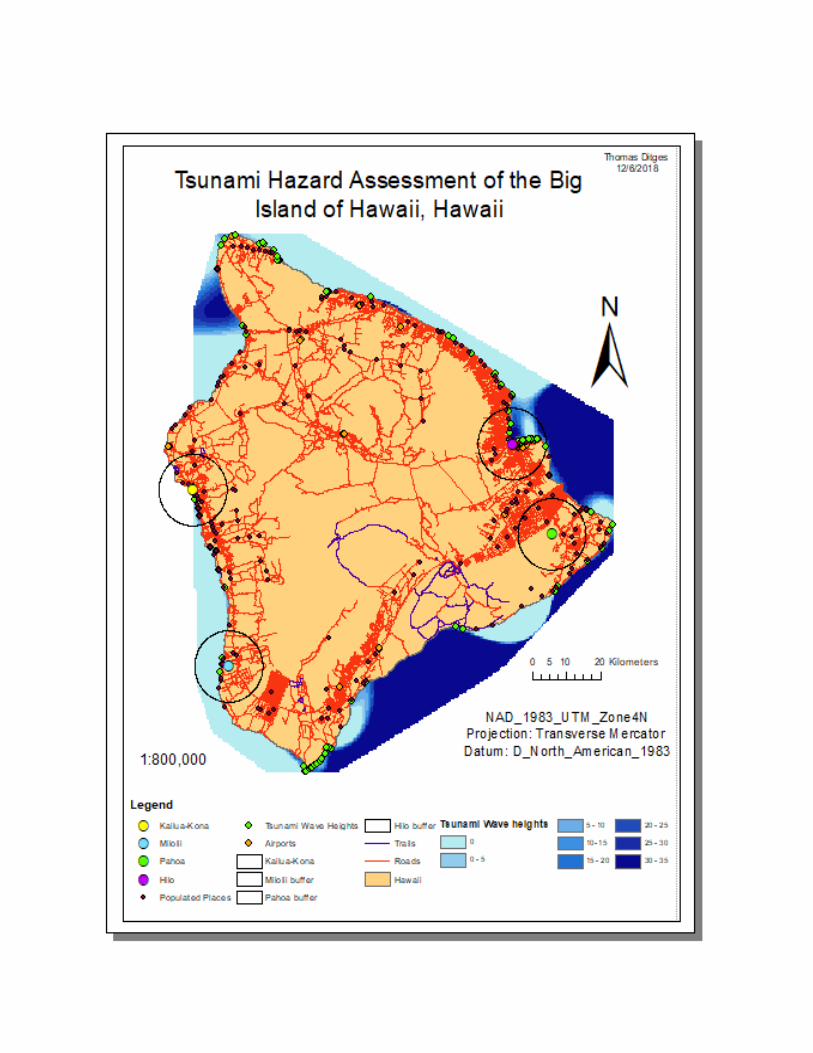
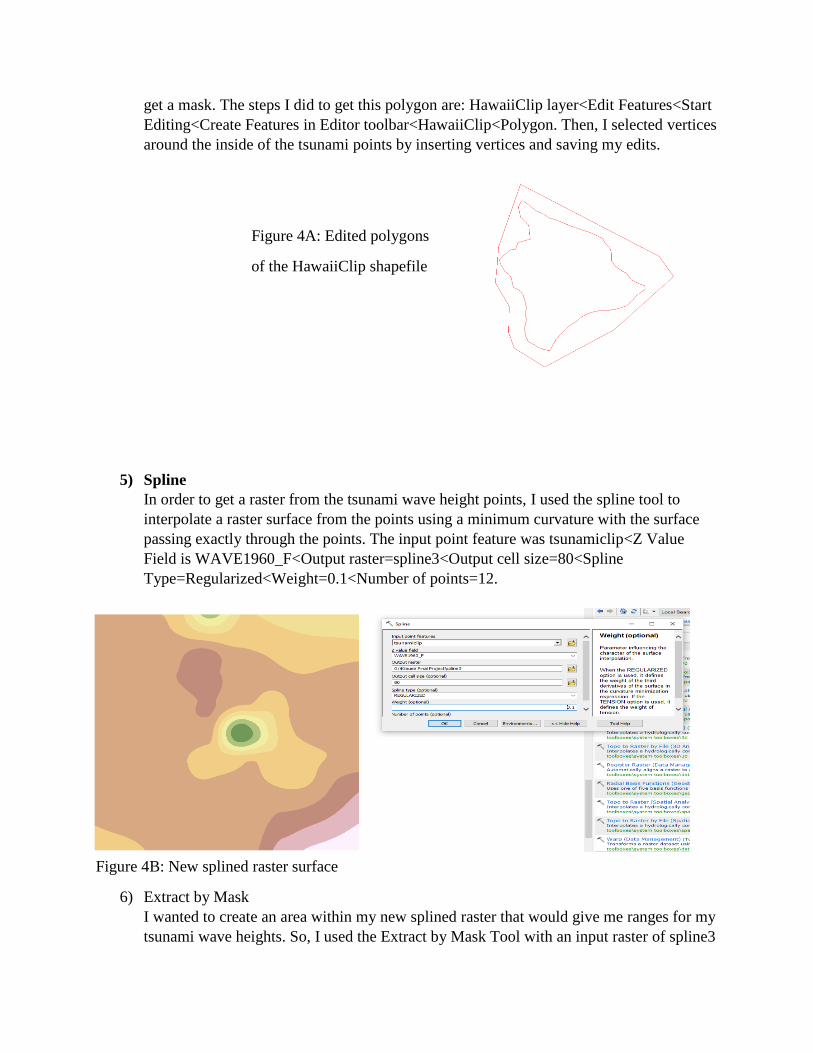
5) Spline
In order to get a raster from the tsunami wave height points, I used the spline tool to
interpolate a raster surface from the points using a minimum curvature with the surface
passing exactly through the points. The input point feature was tsunamiclip<Z Value
Field is WAVE1960_F<Output raster=spline3<Output cell size=80<Spline
Type=Regularized<Weight=0.1<Number of points=12.
Figure 4B: New splined raster surface
6) Extract by Mask
I wanted to create an area within my new splined raster that would give me ranges for my
tsunami wave heights. So, I used the Extract by Mask Tool with an input raster of spline3
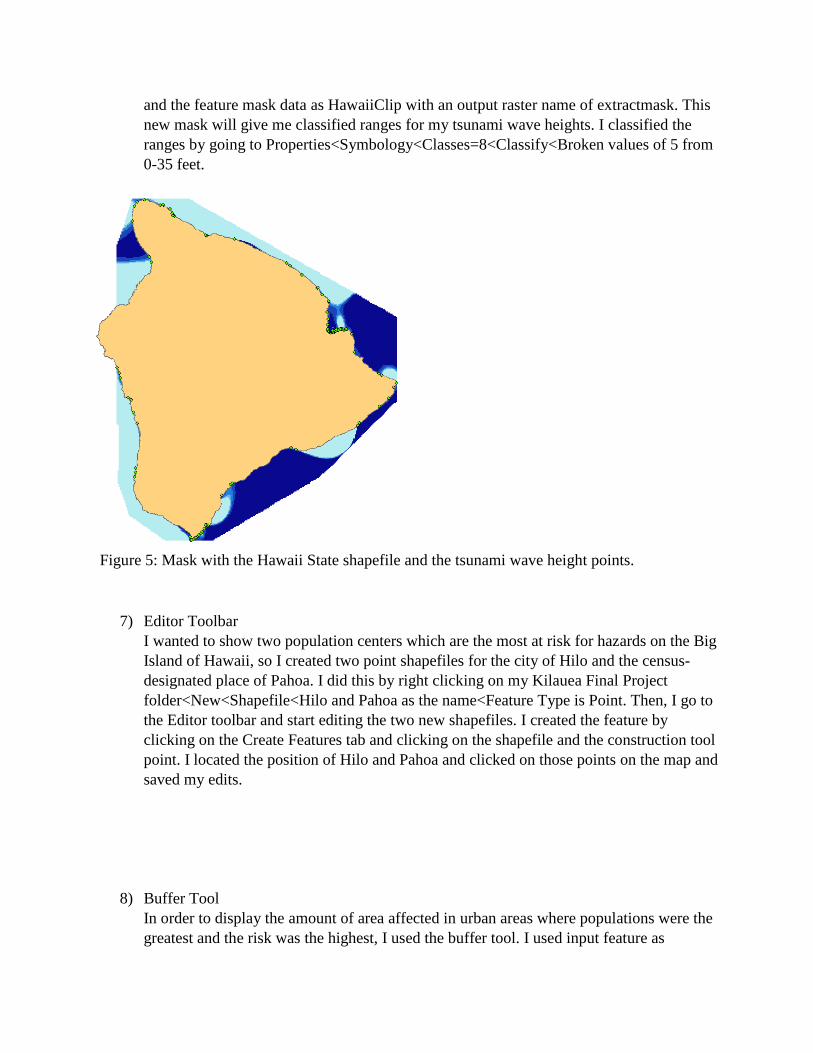
and the feature mask data as HawaiiClip with an output raster name of extractmask. This
new mask will give me classified ranges for my tsunami wave heights. I classified the
ranges by going to Properties<Symbology<Classes=8<Classify<Broken values of 5 from
0-35 feet.
Figure 5: Mask with the Hawaii State shapefile and the tsunami wave height points.
7) Editor Toolbar
I wanted to show two population centers which are the most at risk for hazards on the Big
Island of Hawaii, so I created two point shapefiles for the city of Hilo and the census-
designated place of Pahoa. I did this by right clicking on my Kilauea Final Project
folder<New<Shapefile<Hilo and Pahoa as the name<Feature Type is Point. Then, I go to
the Editor toolbar and start editing the two new shapefiles. I created the feature by
clicking on the Create Features tab and clicking on the shapefile and the construction tool
point. I located the position of Hilo and Pahoa and clicked on those points on the map and
saved my edits.
8) Buffer Tool
In order to display the amount of area affected in urban areas where populations were the
greatest and the risk was the highest, I used the buffer tool. I used input feature as
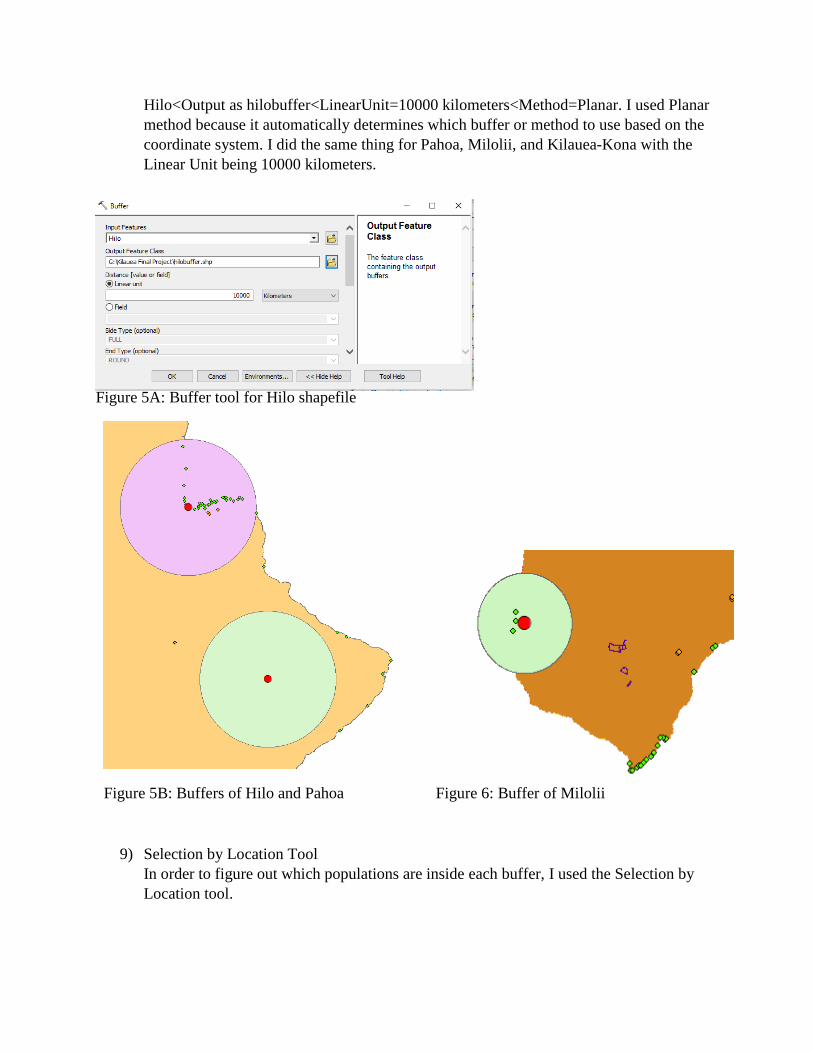
Hilo<Output as hilobuffer<LinearUnit=10000 kilometers<Method=Planar. I used Planar
method because it automatically determines which buffer or method to use based on the
coordinate system. I did the same thing for Pahoa, Milolii, and Kilauea-Kona with the
Linear Unit being 10000 kilometers.
Figure 5A: Buffer tool for Hilo shapefile
Figure 5B: Buffers of Hilo and Pahoa Figure 6: Buffer of Milolii
9) Selection by Location Tool
In order to figure out which populations are inside each buffer, I used the Selection by
Location tool.
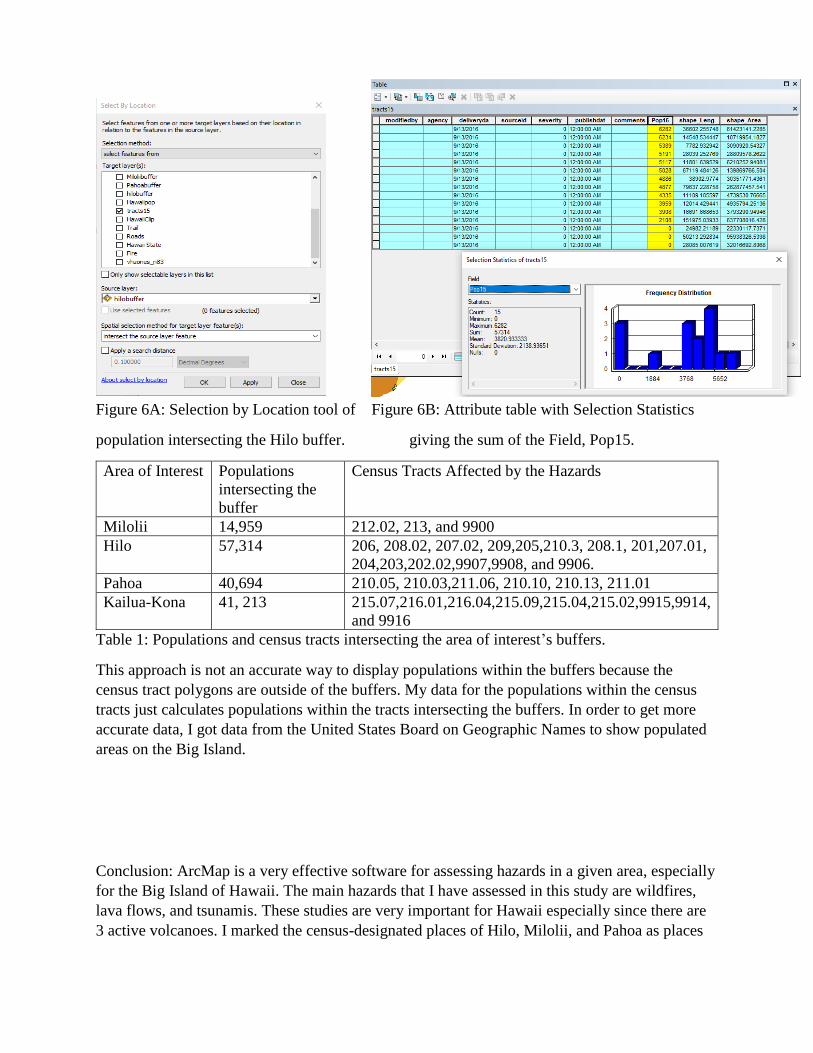
Figure 6A: Selection by Location tool of Figure 6B: Attribute table with Selection Statistics
population intersecting the Hilo buffer. giving the sum of the Field, Pop15.
Area of Interest Populations
intersecting the
buffer
Census Tracts Affected by the Hazards
Milolii 14,959 212.02, 213, and 9900
Hilo 57,314 206, 208.02, 207.02, 209,205,210.3, 208.1, 201,207.01,
204,203,202.02,9907,9908, and 9906.
Pahoa 40,694 210.05, 210.03,211.06, 210.10, 210.13, 211.01
Kailua-Kona 41, 213 215.07,216.01,216.04,215.09,215.04,215.02,9915,9914,
and 9916
Table 1: Populations and census tracts intersecting the area of interest’s buffers.
This approach is not an accurate way to display populations within the buffers because the
census tract polygons are outside of the buffers. My data for the populations within the census
tracts just calculates populations within the tracts intersecting the buffers. In order to get more
accurate data, I got data from the United States Board on Geographic Names to show populated
areas on the Big Island.
Conclusion: ArcMap is a very effective software for assessing hazards in a given area, especially
for the Big Island of Hawaii. The main hazards that I have assessed in this study are wildfires,
lava flows, and tsunamis. These studies are very important for Hawaii especially since there are
3 active volcanoes. I marked the census-designated places of Hilo, Milolii, and Pahoa as places
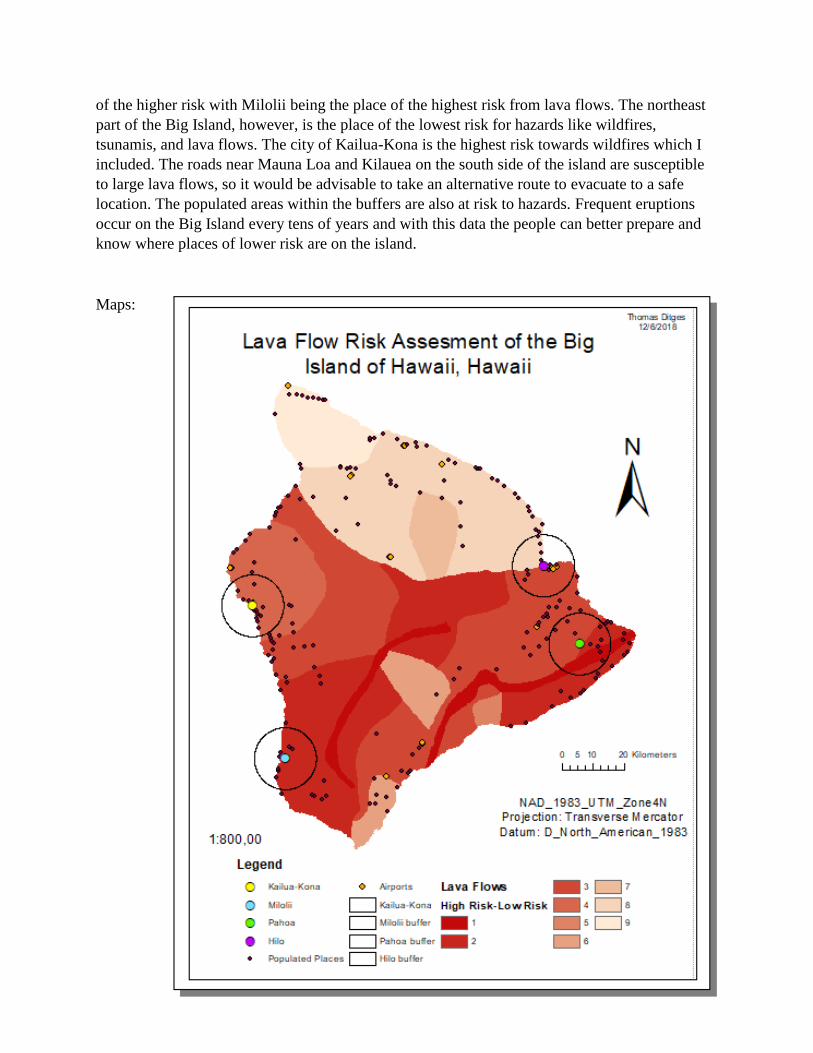
of the higher risk with Milolii being the place of the highest risk from lava flows. The northeast
part of the Big Island, however, is the place of the lowest risk for hazards like wildfires,
tsunamis, and lava flows. The city of Kailua-Kona is the highest risk towards wildfires which I
included. The roads near Mauna Loa and Kilauea on the south side of the island are susceptible
to large lava flows, so it would be advisable to take an alternative route to evacuate to a safe
location. The populated areas within the buffers are also at risk to hazards. Frequent eruptions
occur on the Big Island every tens of years and with this data the people can better prepare and
know where places of lower risk are on the island.
Maps: