Embed Size (px)
Citation preview
Has the One-Child Policy Improved Adolescents’ Educational Wellbeing in China?
Juhua Yang
Population Research and Development Center People’s University of China
Haidian District Beijing 100872, P. R. China
[email protected](86-10) 6251-4984
February 2006
Has the One-Child Policy Improved Adolescents’ Educational Wellbeing in China?
Abstract One of the purposes of China’s one-child policy is to improve child wellbeing. However,
past studies overwhelmingly focus on policy effect on fertility, and thus, whether the policy has
achieved this goal remains unclear. This paper explores the relationship between the one-child
policy and educational wellbeing (measured as school enrollment and grade completion) among
adolescent children in the 1990s, using CHNS data (1993-2000). Drawing on local variations in
policy strength and sibship composition, I find a consistent, strong advantage of single children in
school enrollment and grade completion relative to those with an older brother or 2+ siblings among
children beyond compulsory education, regardless of residence and child gender. The quality of
children decreases with quantity, particularly with the presence of an older brother. The results
provide evidence to support the idea that restricting family size (but not necessarily one child per
couple) and promoting sibling equality will necessarily help increase adolescents’ educational
wellbeing in developing settings.

Has the One-Child Policy Improved Adolescents’ Educational Wellbeing in China?
INTRODUCTION
One of the purposes of the one-child policy in China is to improve child wellbeing. The
government has taken strenuous effects to ensure that couples limit their fertility in exchange for
high “quality” children – “give birth to fewer children, but give them better care and education.” The
underlying rationale is that more resources at the national, community and household levels would
be available for children, and that children with fewer siblings would garner more resources and be
better off in physical and intellectual development (Chen 1979; Peng 1997a; Wu 1997).
However, although the one-child policy is not only about fertility limitation, but also aims to
improve child wellbeing, two factors limit studies on the relationship between the one-child policy
and child (particularly adolescent) wellbeing. First, it is only recently that testing such long term
outcomes of the one-child policy is possible due to the date of first implementation of the policy;
second, researchers and policy makers both inside and outside China are mostly concerned with the
policy effect on fertility (Gu et al. 2006; Qiao et al. 2005). Thus, it has been well acknowledged that
the one-child policy has successfully curbed population growth: fertility is below replacement and
the proportion of all births that are second and higher parity keeps falling (Guo et al. 2003; Zhang
1998). What is less known is the consequences of the policy beyond fertility. There is little question
that the one-child policy, through legislating when couples can give birth and to how many children,
shapes, in fundamental ways, Chinese family life (Short et al. 2001). This would in turn have
implications for child wellbeing. Do children with no sibling, one sibling or two or more siblings,
for example, differ in their wellbeing?
This paper focuses on one dimension of child wellbeing, education wellbeing, defined as
school enrollment and grade completion, among adolescent children in a rapidly developing and low
1

fertility regime. Using data from multiple waves of the China Health and Nutrition Survey, it
addresses three interrelated issues by exploring a broad range of factors at the community,
household, and individual levels associated with child schooling. Is the one-child policy related to
child school enrollment and grade completion? To what extent is it related to child education? What
are the mechanisms for policy to affect child schooling?
My interest in child wellbeing in the context of the one-child policy regime necessitates that
I take into account local variations in policy rules. The so-called one-child policy varies
substantially across the nation. Drawing on direct measures of policy variations and sibship
composition, I am able to evaluate the consequences of the one-child policy beyond fertility and
make inferences about policy effects on children’s educational wellbeing. Very few studies have
empirically examined the relationship between the one-child policy and adolescents’ education that
includes direct local policy measures. This study also complements other sociological analyses of
children’s lives in contemporary China by focusing on teenage children. Other studies have
examined childcare practice under the one-child policy regime (Short et al. 2001) and compared
educational attainment, personality development or physical growth between the only children and
children with siblings for young children (Falbo et al. 1989; Falbo and Polit 1986; Falbo and Poston
1993; Poston and Falbo 1990). Among these, only few adopt local policy measures (Short et al.
2001; Short et al. 2003).
This paper is organized as follows. It first describes policy characteristics and its potential
linkage to child education. Then it presents data and variable specifications. Descriptive and
analytical results are followed; finally, it summarizes the major findings emerging from this analysis,
presents conclusion and provides policy implications.
ONE-CHILD POLICY AND ADOLESCENTS’ EDUCATION
2

The one-child policy, initiated in 1979, promotes one child per couple. Contrary to public
perception, however, the policy has not been implemented uniformly across the nation. The state
government stipulates basic regulations of the one-child policy, which allow exceptions. It is up to the
local government to interpret and implement exceptions (Peng 1997b). Based on local economic
development (Merli and Smith 2002) and population size, seven provinces and municipalities
implement the strict one-child policy under normal circumstances;1 six provinces and the rural areas
of Tibet implement a two-or-more-child policy, and the rest provinces have a girl-exception policy in
the countryside (Guo et al. 2003; Peng and Li 2002; Zhang and Chen 1999).2 The latter allows
couples whose first child is a daughter to have a second birth, provided a four-year interval between
the two births (Peng 1997b). Thus, some families may have two or more children, while other
families are still limited to one child. Nevertheless, variations always exist within each policy rule.
Sichuan and Jiangsu, for example, still allow some couples to have a second birth (White 1992;
Zeng 1989). Even within close proximity in the same geographic areas, practice of the one-child
policy varies widely (Kaufman et al. 1989).
Two closely intertwined mechanisms can be identified for the policy to affect child
education: (1) change fertility and childrearing norms and (2) change fertility behavior. The first
results from the campaigns of “you sheng you yu” (give birth to fewer children, but give them better 1 Normal circumstances are broadly defined: the couple is Han ethnicity, not from overseas, has sibling(s); children do
not have health problems, etc. The most common variation is that if the first child has health problems, broadly defined, couples
are allowed to have a second birth. This exception applies to all families across the nation.
2 Strict one-child policy provinces and municipalities include Beijing, Tianjin, Shanghai, Chongqing, Jiangsu and Sichuan; two-child
policy provinces or autonomous regions include Qianhai, Hainan, Yunan, Tibet, Ningxia and Xinjiang; the rest provinces implement a
girl-exception policy in the countryside. These two exceptions mostly apply to rural residents. Urban residents are under
stricter policy control and required to have only one child (Ahn 1994) under normal circumstances. Also, regulations in
urban areas tend to be more stable than in the countryside.
3

care and education), which, as policy propaganda, have been conducted across the country. Family
planning activists visited urban working units and the countryside, presenting systematic family
planning education (Family Planning 1984); posters, signs, billboards, and building walls have been
continuously used to remind couples of the advantage of one child per family for the child, the family
and the nation (Peng 1997b). The long-lasting “you sheng you yu” campaigns would exert intangible
or imperceptible influences on couples’ childbearing and childrearing ideology, increase their
expectations for children, and provide them incentives to better educate children.
To change couples’ fertility behavior, the government has taken great efforts to promote
gender equality, encourage couples to lengthen birth intervals, reduce higher parity birth(s), and have
fewer children. This would substantially shape family building process, not only sibsize, but also
birth interval, birth order and sex composition of siblings in households.
The core of the one-child policy is a set of systematically designed implementation strategies,
including incentives (e.g., healthcare subsidy to the only children), disincentives (e.g., out-of-plan
birth fine), and family planning responsibility system (Peng 1997b). Policy incentives target couples
who sign the one-child certificate, a pledge agreeing to have only one child in return for benefits. On
the contrary, disincentives exist as sanctions for couples that have “out of plan births,” including
fines, but there are no tuition or other penalties to child schooling. Under the family planning
responsibility system, the local chief cadre is responsible for implementing the policy and keep the
number of births under his/her jurisdiction under the officially assigned birth quota. As economic
and administrative constraints to couples’ reproduction, these implementation methods aim to
encourage couples to conform to the policy, and would have greatly shaped couples’ reproduction.
The rationale behind the one-child policy is that, with a lower fertility rate, more resources
will be available for children at the national, community and household levels, benefiting children.
This is consistent with the conceptual framework of resource dilution. The resource dilution model
4

argues that sibsize shapes the amount of resources that can be distributed to each child. The more
siblings a child has, the more household resources will be diluted, and hence the lower the quality of
output, and vice versa (Blake 1981; Steelman et al. 2002). Sibsize effect on child outcomes, however,
may be intervened by birth order. A short interval prevents parents from devoting maximum attention
to them, and diminishes financial assets or makes it harder to recover from economic setbacks than a
wider spacing (Powell and Steelman 1990, 1995). A higher-order birth may imply a shorter spacing
and a larger sibsize. Hence, the addition of a higher-order birth further dilutes the share of resources
each child may receive. Given limited family resources, many children with a shorter interval may be
disadvantaged in development, particularly for higher parity children.
However, worldwide studies on the relationship between sibship composition and child
education have yielded mixed effect. First, most studies have documented an inverse association
between child education and (a) sibsize (Blake 1981; Downey 1995; Knodel 1993; Knodel et al. 1990;
Pong 1997; Shreeniwas 1997; Sudha 1997), (b) a short birth interval (Powell and Steelman 1990;
1993; 1995), (c) lower-order births (Parish and Willis 1993; Powell and Steelman 1995; Stash and
Hannum 2001; Steelman et al. 2002), and (d) daughters (Buchmann 2000; Greenhalgn 1985;
Jejeebhoy 1993; Lloyd 1993; Sathar 1994). Second, some studies have found a positive linkage
between child education and sibsize (e.g. Chernichovsky 1985; Gomes 1984; Guo and VanWey 1999;
Qian 2004) or a lower order birth (Jejeebhoy 1993). Third, other studies have generated no effect of
sibsize and child education when interactions are controlled for (Anh et al. 1998; Buchmann and
Brakewook 2000). Lastly, recent studies tend to find that the effect of sibsize and birth order on child
education is intervened by (a) sibling density (Buchmann and Hannum 2001; Chernichovsky 1985),
(b) household wealth (Buchmann 2000; Fuller et al. 1995), (c) parental background (Lillard and
Wills 1994), (d) kinship system (Buchmann 2000; Shavit and Pierce 1991), (e) living arrangements
5
(Buchmann 2000; Lloyd and Blanc 1996; Pong 1997), and (f) contextual factors (Buchmann and
Brakewood 2000; Parrado 1998; Post 1994).
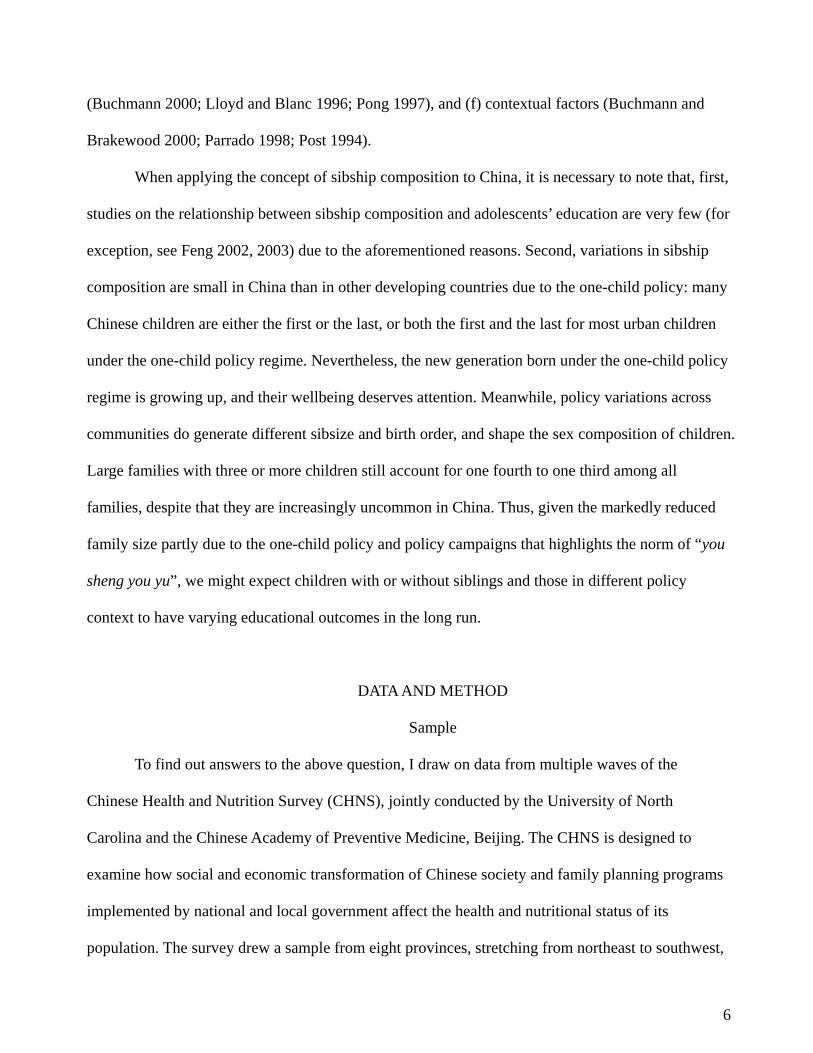
When applying the concept of sibship composition to China, it is necessary to note that, first,
studies on the relationship between sibship composition and adolescents’ education are very few (for
exception, see Feng 2002, 2003) due to the aforementioned reasons. Second, variations in sibship
composition are small in China than in other developing countries due to the one-child policy: many
Chinese children are either the first or the last, or both the first and the last for most urban children
under the one-child policy regime. Nevertheless, the new generation born under the one-child policy
regime is growing up, and their wellbeing deserves attention. Meanwhile, policy variations across
communities do generate different sibsize and birth order, and shape the sex composition of children.
Large families with three or more children still account for one fourth to one third among all
families, despite that they are increasingly uncommon in China. Thus, given the markedly reduced
family size partly due to the one-child policy and policy campaigns that highlights the norm of “you
sheng you yu”, we might expect children with or without siblings and those in different policy
context to have varying educational outcomes in the long run.
DATA AND METHOD
Sample
To find out answers to the above question, I draw on data from multiple waves of the
Chinese Health and Nutrition Survey (CHNS), jointly conducted by the University of North
Carolina and the Chinese Academy of Preventive Medicine, Beijing. The CHNS is designed to
examine how social and economic transformation of Chinese society and family planning programs
implemented by national and local government affect the health and nutritional status of its
population. The survey drew a sample from eight provinces, stretching from northeast to southwest,
6
including Heilongjiang, Liaoning, Henan, Shangdong, Jiangsu, Hubei, Hunan, Guizhou, and
Guangxi.3 These provinces vary substantially in geography, economic development, public
resources and infrastructure (PCO et al. 2002) and socioeconomic development (Statistic Bureau of
China 2001). Other analyses of birth planning data indicate that policy varies substantially across
communities and over time (Short and Zhai 1998). Households in each province are selected using a
stratified multistage cluster design that includes approximately 20 households in each of some 190
urban and rural communities.
As a panel data, the CHNS has interviewed households five times between 1989 and 2000.
My analysis uses information from the 1993, 1997 and 2000 survey. For each wave of survey, I
identify children age 13-19, who were born between 1974-1980, 1978-1984 and 1981-1987,
respectively. Most children in1993 were born before the implementation of the one-child policy, and
those in 1997 and 2000 were born under the one-child policy regime.
I draw three samples from the household rosters. First, a sample of all children age 13-19 in
households, regardless of residence at the time of survey, is selected for the purpose of estimating
school enrollment. Primary school-age children are excluded from the sample because their
enrollment is almost universal (Chinagate 2003), particularly for children age 10 or younger. This
sample allows observing the educational experience across cohorts born during 1974-1987. All
children in the sample start to attend secondary school after 1986, a year marking the onset of rapid
expansion of formal education, the 9-year compulsory education. Year 1986 also marks the
relaxation of policy when more families are allowed having more than one child. The total sample
size of this analysis is 4825, 1455, 1451 and 1919 children are from the 1993, 1997 and 2000 survey,
3 In 1993, Liaoning is surveyed, but it is replaced by Heilongjiang in 1997; the 2000 survey includes both and other provinces.
7
respectively.4
Second, among those who have ever enrolled in school, two sub-samples of children age 14
and 17 are selected to examine primary school (xiao xue, 1-6 grades) and middle school (chu zhong,
6-9 grades) completion respectively. These two analyses are conditional, and simultaneously assess
attrition rate among those who should finish primary and middle school. The Compulsory Education
Law requires that all children attend school at age 6 or 7. In some less developed regions or
households, children probably will not start to attend school until age 8 or even older, but this is not
common. Thus, ages 14 and 17 allow sufficient time for children in the sample to have completed
the sixth grade and ninth grade. The sample size is 1024 and 711 for primary and middle school
completion, respectively.
Third, a sample of children age 20 is selected to examine high school (gao zhong, 10-12th
grades) completion. This sample includes graduates from high school and equivalent technical
school. It is not conditional on previous enrollment given the low incidence of high-school
enrollment. Age 20 is selected to allow the youths to have sufficient time to have finished the 12th
grade. The sample size is 700.
Variables
Dependent variable: My interest centers on adolescents’ educational wellbeing, defined as
school enrollment and grade completion. I create the indicators of this construct from the following
three questions in the CHNS: (1) how many years of formal education have you completed? (2)
What is the highest level of education attained? and (3) are you currently in school? The enrollment
variable is derived from (3): if respondents are in school at the time of survey, they are considered as
4 The 1989 survey is excluded from this analysis because part of the 1989 sample started to attend middle school before 1986, which
complicates the analysis.
8
enrolled.5 It is possible that children age 19 may have already completed high school. By comparing
their level of education and years of schooling, I exclude those who have finished high school from
the sample.
Grade completion is gauged by questions (1) and (2): primary school completion is created
for respondents who report that their year of schooling is greater than 0; middle school completion is
created for respondents whose year of schooling is greater than 6. For high school completion, all
children with 12-year schooling are coded as having completed high school.
Key predictors: To assess the effect of the one-child policy on child education, it is necessary
to first develop appropriate measures of the policy. As discussed above, the policy could affect child
education through two mechanisms: (1) change fertility and childrearing norms, and (2) change
fertility behavior. Due to lack of data, it is impossible to measure change in fertility norms. To
measure childrearing norms, I capitalize on policy variations across communities. The community
survey asks local cadres whether couples in their communities and villages are allowed to have one
child, two children, or a second birth if the first child is a daughter, among other exceptions. I
highlight the two exceptions that allow couples a second birth if the first child is a daughter and two
children under normal circumstances. The two exceptions are particularly relevant to this study
because they generate different sibship composition among households. Also, as Short et al. (2001)
point out, these variations are likely a reasonable indicator of local policy climate. Using these
exceptions, I distinguish between three kinds of policy strength based on local cadres’ responses to
the policy questions: one-child policy, girl-exception policy, and two-child policy, and refer them as
strong, moderate and weak for the ease of discussion (Short et al. 2001). Policy variations are, while
not ideal, a rough proxy of childrearing norms given data limitation, because the intensity and 5 Of course, school enrollment is not the same as currently being in school. It is possible to be enrolled in school, but do not attend
regularly or at all. Thus, this measurement may underestimate school enrollment.
9
effectiveness of “you sheng you yu” campaigns vary by policy rules. It is particularly strong and
enduring in areas with a strict policy, but less effective in other communities, yielding divergent
impact on couples’ childrearing norms.
To measure the second, I draw on sibship configuration, measured as number of siblings:
single child, 1 sibling and 2+ siblings. For those with only 1 sibling, I also differentiate the sibling
by gender, order and interval, as appropriate, to fully capture the effect of different dimensions of
sibship composition on the outcome variables.
The policy is a gendered policy (Greenhalgh 1986; Short et al. 2001) given the girl-exception
variation, and it also shapes children’s sex or sibling’s sex composition within a household. Parents
who keep girls as the first child in girl-exception policy context may differ from parents who keep
girls in other contexts. Studies have found that girls suffer disproportionately in prenatal and
postnatal period (Li et al. 2006; Zhang 2005); once they become a family member, they may be also
treated differently under different policy environment (Short et al. 2001). Thus, sex of children is
used as a key predictor.
Control variable: A series of other individual, household and community characteristics are
incorporated as control variables. These variables include child age, household wealth, father’s
education and occupation, and contextual background that might confound the policy effect on the
outcome variable.6 Table 1 lists variable definitions. Note that in the following multivariate analyses,
I adopt two approaches to account for policy, sibship composition and father’s education and 6 In exploring the determinants of child schooling, it is necessary to take into account whether the result could be affected by factors
that I cannot observe or directly observe. School characteristics, the quality of school and students’ performance and peer pressure at
school, for example, are all important for child educational wellbeing (Fuller 1987; Fuller and Clarke 1994; Heyneman 1976).
Unfortunately, the CHNS does not contain such information. However, the effect of these factors are assumed to be additive, and will
not bias the findings. Additionally, preliminary models show that there is no indication to include ethnicity and the presence of school
in the model.
10

occupation. For school enrollment, I use the above specification; when analyzing the smaller
samples of grade completion, I collapse policy as strict vs. other policy, sibship as sibsize, and
primary school vs. higher education and farmers vs. non-farmers of fathers.
[Table 1 about here]
DESCRIPTIVE RESULTS
Figures 1 and 2 describe school enrollment by age and grade completion between 1989 and
2000, respectively. Overall, school enrollment among adolescents tends to increase over time, but
for each year, older children are less likely to enroll in school than younger children. However,
enrollment in 2000 is lower than that in 1997 in most ages, which is puzzling, and deserves further
studies beyond the scope of this analysis. The rate of grade completion, regardless of levels, also
rises from 1989 to 2000. Despite compulsory education, however, there are still 10 and 20 percent of
children who do not finish primary and secondary school, respectively. Only slightly over one-third
of children has a high school diploma.
[Figures 1 and 2 about here]
Table 1 describes proportion/means and standard deviations, as appropriate, of variables used
in this analysis, for the full sample of school enrollment. About one-fourth of sampled children are
single children; another one-fourth has two or more siblings, and the rest have only one sibling.
About half communities implement a strong policy. The samples also differ in individual, household
and contextual background. Additionally, the prevalence of school enrollment varies by age cohorts
and urban residence (not shown here). Children age 16 to 19 and the rural youths have a much lower
incidence of enrollment in school than younger and urban children, respectively, but the rate of
school enrollment for boys and girls is similar.
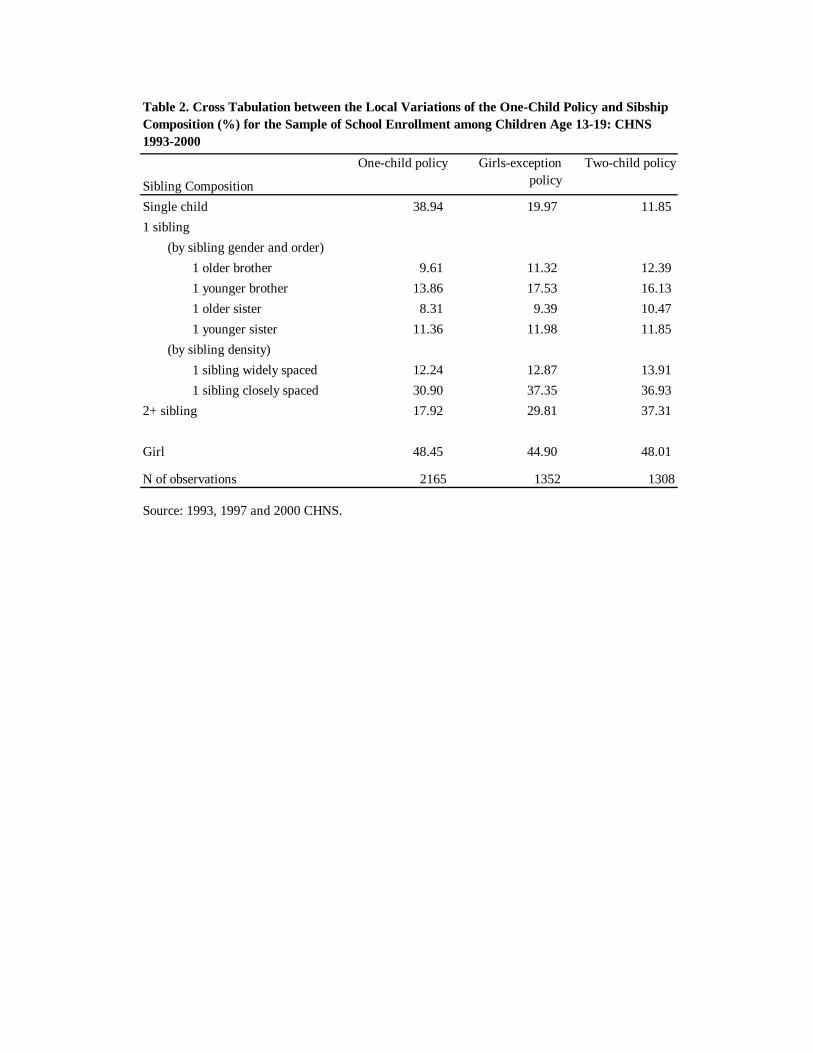
Table 2 presents the relationship between the local variations of the one-child policy and
11
sibship composition for the sample of school enrollment. As it shows, sibship composition
corresponds to policy strength such that a strong policy is associated with fewer siblings, and vice
verse. Regardless of the specification of sibship composition, children in strong-policy communities
are over 3 times more likely to be single children (39 percent) and twice less likely to have 2+
siblings (18 percent) than those in weak policy communities (12 and 37 percent, respectively). But it
appears that there is no gender difference between strong policy and weak policy communities.
Nevertheless, not all children in strong policy communities are single children; even for those in the
2000 sample who were all born after 1982, less than half of children in strong policy communities
are single children (results not shown). Sibship variations associated with policy strength indicate
that sibship is largely determined by policy strength, but individual choices are still being made in
response to one’s own fertility desire. This provides evidence to include both policy strength and
sibship composition in same equations. The effect of policy strength also goes beyond sibship
composition and captures something that sibship does not.
[Table 2 about here]
How related is the one-child policy and sibship composition to child educational wellbeing?
Table 3 shows that single children have the highest enrollment rate among all children, about 30
percent higher than children with 2+ siblings and those with an older brother. In fact, the latter have
the lowest rate of enrollment. Those from strong-policy communities have an 8 percent higher rate
of enrolling in school than their peers in weak-policy communities (68 vs. 60 percent). However, it
is children residing in girl-exception policy communities that have the lowest enrollment rate (59
percent). This pattern holds for grade completion. There are also great disparities in school
enrollment by age cohort and urban residence, but boys and girls do not differ in this outcome across
policy strength and family context (results not shown here). The lack of a gender gap in enrollment
and grade completion is striking given China’s son preference and will be revisited in the analyses
12
that follow.
[Table 3 about here]
The bivariate associations based on the CHNS clearly suggest a connection between policy
and adolescents’ schooling, whether it works through fertility (sibship composition) or norm change
(policy strength). However, this relationship may be confounded by other factors, such as child age
and household and community characteristics. Thus, I now turn to a series of regression models,
controlling for child age, father’s education and occupation and household wealth, as well as
contextual factors.
ANALYTIC RESULTS
For school enrollment
In developing models my overall goal is to predict the likelihood of school enrollment and
grade completion, focusing on the net effects of policy variations and sibship composition. Due to
the fact that children age 13-15 are, but children older are not, under the coverage of the
Compulsory Educational Law, the one-child policy and sibship composition may have different
impacts on the outcome variable. Also, because of the tremendous socioeconomic stratification
between the countryside and urban settings, it is reasonable to believe that factors mentioned above
may work differently for urban children and rural children. Current studies of child wellbeing
commonly focus on rural children (Hannum 1999, 2000; Short et al. 2001). By examining both, I am
able to demonstrate the potentially different policy effects on both. Additionally, past studies have
suggested that the local variations of the one-child policy not only affect who becomes a family
member, but also the degree to which a given child in a family is valued (Short et al. 2001). Thus, I
fit fully interactive models by stratifying the sample by age cohort, urban residence, and children’s
sex. This will prevent the possibly divergent effect of predictors on the outcome variable from being
13
cancelled out. Analytical results for all children and by stratified samples, adjusted for standard
errors (White 1980), are presented in Table 4.
Results indicate that sibship composition is indeed a consistent and strong determinant of
school enrollment.7 Across all models except for children age 13-15, single children are more likely
to enroll in school than other children, particularly than those with an older brother or 2+ siblings.
Thus, the presence of an older brother or 2+ siblings has a detrimental effect on sibling’s schooling.
Not only sibsize, but also sibling gender and order are important for child education, and sibling
gender and order are somewhat more important than sibsize in this regard. Compared only children
with 1-sibling children, singletons are only advantaged in education than those with an older brother.
A model (result not shown here) where sibship composition is specified as single children, 1 sibling
and 2+ siblings also shows a difference between singletons and 1-sibling children. By differentiating
sibling gender and order, we know that it is the older brother that matters.
This finding is consistent with existing studies demonstrating that the onlies have higher
academic scores than sibling children (Falbo and Poston 1993; Poston and Falbo 1990). To the
extent that the one-child policy prevents couples from having more children, it increases the
likelihood of school enrollment working through sibship composition. Sibship composition,
particularly the presence of an older brother and 2+ siblings, remains a consistent and substantial
predictor of adolescents’ education in the reform-era, irrespective of other factors.
Other things being equal, however, policy strength does not bear a significant relationship to
enrollment across all models. Children in strong policy communities have a better chance to enroll
7 Parallel model where sibship composition is specified as the combination of birth interval and sibsize are also fitted,
yielding similar results. For sibship composition, however, there is no significantly different school enrollment between
single children and those with 1 sibling, regardless of birth interval (results not shown).
14
in school than those in moderate policy communities, but the magnitude is not significant. The
strong fertility effect and weak norm effect on enrollment suggest that it takes a longer time for
norms to affect human behavior.
[Table 4 about here]
Policy effect on enrollment substantially varies by age cohort. While policy strength bears no
significant effect on both younger and older cohorts, sibship composition clearly shows a strong
impact on the older cohort, but has no effect on younger children age 13-15. Among children age
16-19, the presence of an older brother, a younger brother and 2+ siblings all decreases the sampled
children’s likelihood of school enrollment at the time of survey. The divergent policy effect by age
cohorts may reflect the following issues. The first pertains to China’s educational policy and the
costs of schooling. Younger children are required to attend school by the Compulsory Educational
Law and their education is presumably at low cost, mainly for books and other school supplies
(which can be costly in reality). By contrast, the older cohort is beyond the coverage of compulsory
education, and thus, parents have to rely on their own resources to send children to school,
constraining household finance. Second, the younger cohort is too young for the labor market, but
labor market for older adolescents is widely available in more advanced areas in China, which pulls
children to it. Thus, for households with more than one child, particularly those in need of cash, they
may terminate some children’s schooling and send them to work. For children age 16-19, if he/she
has a brother, the brother has advantages in schooling because of his economic and cultural values to
the family; if he/she has a younger brother, the brother might be too young to go to the labor market,
decreasing the sampled children’s school opportunity.
Policy effect also varies by urban residence: rural children with an older sister are marginally
more likely to enroll in school than single children. In mainland China, as in Taiwan and other
settings with son preference, among parents with limited resources, a common strategy to raise sons’
15
education is to educate daughters a little, send them out to work, and then use daughters’ incomes to
better educate sons. Thus, a substantial number of young women workers work for supporting their
siblings’, especially younger brothers’, schooling (Greenhalgh 1985). When girl disadvantage in
schooling exists, it likely exists in the countryside.
Additionally, model results provide indication that the effect of sibship composition on
school enrollment varies by child gender. The presence of a brother, regardless of order, or 2+
siblings poses threat to boys’ education, while only the presence of an older brother is detrimental to
a girl’s education. Thus, for boys, siblings of the same sex appear to be rivals in attracting
educational investment from parents. In Malaysia (Lillard and Wills 1994) and Taiwan (Parish and
Willis 1993), a boy’s educational opportunity is threatened by the presence of other brothers.
Household characteristics are important and strong determinants of children’s school
enrollment. Children of fathers with a middle school or higher education have a better chance to
enroll in school than those of fathers with primary or less education, regardless of age (except for
younger children), residence and gender. Similarly, a more prestigious occupation of fathers is
positively related to child education. The measure of household wealth suggests that households
with more consumer durable goods are also better able to enroll their children in school, and it is in
fact the most consistent predictor of this educational outcome. Among contextual factors, percent of
labor force in agriculture and village residence decrease school enrollment. While adolescents
residing in northern and southern provinces are associated with a lower likelihood of school
enrollment than their peers in central provinces, the difference is non-significant.
For grade completion
Our descriptive results reveal the importance of differential rates of school attrition (grade
completion) in producing educational differentials by sibship composition and policy strength. This
section explores the issue of grade completion in a multivariate context in order to view disparities
16
by policy strength and sibship composition, controlling for the effects of other individual, household
and community background.
Three levels of grade completion are investigated: primary, secondary and high school
completion. The first two are conditional on ever being enrolled in primary school and secondary
school among children age 14 and 17, respectively, and the analytical results would not only tell us
policy effect, but also provide information on the attrition rate under the compulsory educational
system. Due to the low incidence of high school enrollment, high school completion is
unconditional, including all children age 20. This measure reflects educational attainment of all
youths. Due to small sample size, in the analysis of grade completion, I only differentiate children
by sibsize, and those in strong policy communities from those in other communities. Father’s
education and occupation are also collapsed. No fully interactive models will be fitted.
The results, presented in Table 5, confirm a hierarchy in attrition by policy through sibship
composition for high school completion. As in school enrollment, policy does not seem to matter
significantly to younger children, as both policy strength and sibsize bear no significant effect on
primary and middle school completion. For the high school completion sample, single children have
a higher likelihood of finishing high school education than others. The persistence of sibship
disparities in a multivariate context indicates that the observed relationship between sibsize and high
school completion cannot be attributed to differences resulting from household background and
other contextual characteristics. Child gender is not significantly related to school completion,
regardless of education levels. Household wealth, percent in agriculture, urban residence, and time
are determinants of grade completion.
For both school enrollment and grade completion, child gender does not make a difference.
This suggests that the traditional ideology of “nu zi wu cai bian shi de” (lack of scholastic
knowledge is a desired virtue in women) is disappearing in adolescents’ schooling in contemporary
17
China. Similarly, the fully interactive model by child gender does not yield girl disadvantage by
policy. Thus, although studies on other dimensions of child wellbeing such as childcare and
preschool education have indicated that girls are treated differently in different policy environments
(Short et al. 2001; Short and Sun 2003), gender bias is less salient in adolescents’ education, perhaps
partly due to the current education policy. The compulsory educational system grants girls an equal
opportunity to boys to enroll in primary and middle school. High school entrance is based on school
performance and competition, and only those who pass the high-school examination can go to high
school. Thus, even if parents tend to give sons a better education, they sometimes cannot.
DISCUSSION AND CONCLUSION
It has been well acknowledged that the one-child policy has profoundly affected family
formation processes and sibship composition. What is less known is the nature and extent of policy
effect on child wellbeing. Though frequently recognized, the connections between what might be
simultaneous and contradictory policy effects on child wellbeing have just begun (Short et al.
2001:934). This work investigates the relationship between the one-child policy and school
enrollment and grade completion for adolescent children in transitional China, drawing on and
highlighting local variations of the policy and sibship composition. Multivariate analyses show that
sibship composition is related to education such that singletons consistently have a higher chance of
enrollment and grade completion than other children among those beyond compulsory education,
regardless of residence and child gender. A strong policy is also associated with better educational
opportunities of children, although the magnitude of the effect is statistically non-significant.
While these are perhaps not conclusive evidences of the one-child policy effect on child
educational opportunities, findings of this analysis indicate that the one-child policy does affect
child educational wellbeing, net of household and contextual characteristics, and the mechanism for
18
the policy to affect child education is mostly through fertility (sibship composition). It might be that
reduced fertility and thus a smaller sibsize increase parents’ ability to provide higher levels of
education for children. Given limited household resources, couples of single children are less
constrained in finance, time and energy, and presumably able to invest more resource per child than
do parents of children with siblings. This enhanced attention and investment may facilitate child
intellectual development and increase the competition of the child in school, contributing to a higher
likelihood of school enrollment and completion. It is also possible that parents of single children
have better internalized the “quality children” norm. With a higher expectation for children in mind,
they translate this norm into behavior by giving children better education.
However, sibship effect on education is partly contingent on sibling order and gender.
Children with an older brother are constantly associated with the lowest probability of enrollment
and grade completion, even lower than those with 2+ siblings. The strong yet inverse association
between the presence of an older brother and schooling reflects sibling inequality when sibling size,
gender and order are jointly measured. Such inequality might be explained by the resource dilution
model and/or son preference. When new children are born, household resources (such as income to
buy food and/or time for child schooling) have been diluted, and parents are unable to allocate
sufficient resources to higher parity children (Horton 1988; Lomperis 1991). Nevertheless, we still
need to disentangle what resources are diminished in such a way that they have implications for
child outcome. It is unlikely financial resources since household wealth has been controlled for. The
potential resources that may be diluted include parental quality time and energy in helping children
with their schools. In addition, as it is well known, parents favor earlier births because of their
economic values to the family; parents favor sons for their economic and cultural values. If the child
is both an older child and a son, he will be entitled to advantages for both older children and sons,
and the family has greater incentives to invest more in his education. Therefore, the presence of an
19

older brother always poses a risk to other siblings’ schooling. Although younger sons are also highly
valued and parents are willing to invest in their schooling, parents may not be able to treat them the
same way as they do for the older son because of financial constraints. Thus, the gap in schooling
among single children and other children, particularly those with an older brother or 2+ siblings,
may increase in the long run.
This analysis fails to find a gender disparity in child schooling. Gender is no longer
condition entry into schooling; girls who did enter school progress at an equal rate with boys
through the primary and secondary school, and are as likely to finish high school as boys among all
youths age 20. Another study on child malnutrition and overweight in China yields no gender gap
either (Yang 2005). It might be that gender bias among children within households is disappearing in
China (Short et al. 2001). While son preference maintains, particularly in the countryside, on the
outcomes I explore, once daughters become family members, parents are likely to treat them
similarly to sons. On the optimistic side, it is certainly possible that the wellbeing of boys and girls
grow more similar over time. Of course, gender bias is not eradicated; it exists in a more nuanced
way, as shown by older brother’s advantage.
Sibship affects child schooling above and beyond economic development. The detrimental
impact on children’s educational opportunity of sibsize does not go away with the increase of
household wealth and a higher father’s education and more prestigious occupation, nor with local
economic development or urbanization. This suggests that in transitional China the effect of the
one-child policy is not a function of local socioeconomic development and household wealth.
Wealth alone is not the entire story of child education. Other factors, including the one-child policy,
do play a role in children’s educational opportunities.
By situating child educational opportunities in the context of the one-child policy in
transitional China, we have found that to the extent the policy shapes sibship composition by
20
reducing sibsize and higher-order births, lengthening birth interval and promoting gender equality, it
benefits children in their educational opportunities. However, not all children benefit equally. Those
with an older brother, for example, do not fare as well as those without. The existence of policy
effect on the outcomes may reflect China’s long scholastic tradition and high value that Chinese
have attached to education. For rural and urban family alike, couples are likely to send all children
to school. In modern societies, education remains the engine for social mobility; “those who gets
ahead” are “those who get educated” (Deng and Treiman 1997; Treiman and Yip 1989). Education
might be particularly important for rural families. Due to the tremendous rural-urban stratification,
peasants strive desperately to become urbanites, and education is the best way, if not the only way,
to achieve this goal for the majority of peasants. Nevertheless, parental desire for children’s
education might be compromised by their reproductive behavior and thus family context. This might
be particularly true under two circumstances: (1) parents have to rely on their own resources for
child education, and (2) when parents view education beyond the compulsory level as necessary to
prepare a child for making a living and to achieve the better standard of living in the rapidly
changing socioeconomic environment (Knodel et al. 1990). When parents expect children to
continue education, sibship composition becomes an important determinant of how much
post-middle-school education parents will be able to provide for their children. In this sense, family
planning programs are perhaps one efficient way to improve child educational wellbeing.
This study has several limitations. For example, there might be potential endogeneity in
program design and local fertility preference. In other words, program design might not be
independent of local fertility preferences. If strict one-child programs are intentionally placed in
areas with high fertility, then program effects may be underestimated. On the other hand, if strict
one-child programs occur in areas with already low fertility, then program effects may be
overestimated. If this is the case, then local policy variations and child outcomes are jointly
21
determined by fertility preference. Although I control for local development level and distinguish
between urban/rural residences, it is likely that I do not capture completely the variations in fertility
preference across communities. The inability to measure local variations in fertility preference
directly is not unique to this analysis, but common to most examinations of fertility preference and
other related studies such as gender bias (Short et al. 2001).
Nevertheless, precisely because of the one-child policy, endogeneity is less a problem in
China than it is in settings without such policy. While in other settings most couples respond to and
balance their own desires of family size, the policy makes the situation in China somewhat unusual.
For a substantial proportion of couples, fertility is not their intentional choice; family size does not
necessarily reflect their fertility desire, and their ability to control their own family building is
constrained by policy regulations and normative pressures created by the policy. Studies have
consistently shown that the ideal number of children among Chinese couples, including those in
strong policy regime, is 2 (Mo 2005; Zheng 2004).8 Thus, while the policy might be non-randomly
placed, it does not seem to pose a serious endogenous threat to this analysis. Besides, the ability to
use local measures of the one-child policy and other contextual measures may to some extent offset
the possible endogeneity.
Also, policy variations might not be independent of local economic development (Merli and
Smith 2002). It is possible that advanced settings are more likely to have a strong policy than less
developed communities. This problem can be solved using a two-step procedure. The first is to
predict which community has a strong policy and the second step is to use the predicted values of
policy to predict child outcomes (Evans 2003, personal talk). However, I do not adopt this strategy
8 Note that this desire does not take into account the sex of children. In other words, fertility desire might be higher if
the sex composition of children is considered (Zheng 2004), or/and the one-child policy is not in place.
22
because zero-order correlation shows that the local variations of the one-child policy are not highly
correlated with local development measure (results not shown). When provincial government makes
decisions on policy regulations, it not only considers local economy, but also population size and
political environment. Thus, for example, while Sichuan province is less developed, it implements a
strong policy due to its huge population size; by contrast, Guangdong province, the economically
most advanced province in China, adopts a girl-exception policy. This further suggests that the
one-child policy is exogenous with respect to adolescents’ education, and the parameters of
parametric models of the kind estimated here are not biased by the local selection of policy strength.
Additionally, sibship composition is also a variable over time (Heer 1985) as new children
were born to the mother. Nevertheless, since I examine children age 13-19, it is uncommon for them
to have new sibling(s) under the one-child policy regime; that is, the fertility of parents of the
sampled children can be confidently treated as being completed and that sibship composition occurs
earlier in time than the outcome variables.
Although more studies are needed to better understand the policy-education relationship,
findings emerging from this analysis indicate a consistent, strong advantage of single children
relative to those with an older brother or 2+ siblings among children beyond compulsory education,
regardless of residence and child gender. It is clear that without favorable educational policies, the
quality of children decreases with quantity and with the presence of an older brother. The results
provide evidence to support the idea that restricting family size and promoting sibling equality will
necessarily help increase average human capital investment in developing settings. Thus, policy
makers who aim to improve adolescents’ educational wellbeing should maintain small family norms.
Nevertheless, restricting family size does not necessarily mean one child per couple. Strengthening
the campaign efforts of “giving children better education” down to the local level, and particularly,
promoting sibling equality among families with more than one child and those with older son(s) may
23
remove the educational disparity of single children and 1-sibling children.
Alternatively, the disadvantage of sibling children in education might be offset by better
enforcements of the current compulsory education and the expansion of the current system.
Educational bureaus should first ensure, by all means, all children to complete the ninth grade, and
then gradually expand compulsory education to twelve years. Expansion of educational system is
feasible because, first, economic development in the past two decades enables the central and local
government to invest more in adolescents’ education. Second, the substantially reduced cohort size
of children in high-school age due to the one-child policy makes such expansion even more possible.
Only inequalities in education among children within and between households, and across residence
and regions are reduced, can then “population quality” of China can be ultimately enhanced.
BIBLIOGRAPHY
Anh, TS., J. Knodel, D. Lam, and J. Friedman. 1998. Family size and children’s education in Vietnam. Demography 35:57-70.
Blake, J. 1981. Family size and the quality of children. Demography 18:421-442. Buchmann, Claudia. 2000. Family structure, parental perceptions, and child labor in Kenya: What
factors determines who is enrolled in school? Social Forces 78(4):1349-1379. Buchmann, C., and D. Brakewood. 2000. Labor structures and school enrollments in developing
societies: Thailand and Kenya compared. Comparative Educational Review 44:175-204. Buchmann, C., and Emily Hannum. 2001. Education and stratification in developing countries: a
review of theories and research. Annual Review of Sociology 27:77-102. Chen, Muhua. 1979. Birth planning in China. International Family Planning Perspectives
5(3):92-101. Chernichovsky, D. 1985. Socioeconomic and demographic aspects of school enrollment and
attendance in rural Botswana. Economic Development and Cultural Change 33:319-332. Chinagate. 2003. Available at: http://www.chinagate.com.cn/English/155.htm (accessed December
12, 2003).
24
Downey, D. B. 1995. When bigger is not better: family size, parental resources, and children’s educational performance. American Sociological Review 60:746-761.
Family Planning. 1984. China Facts and Figures. Beijing: Foreign Language Press. Falbo, Toni, and D. F. Polit. 1986. A quantitative review of the only child literature: research
evidence and theory development. Psychological Bulletin 100:176-89. Falbo, Toni; D. L. Poston; Ji G.; Jiao S.; Wang S., Gu H. Yin, and Liu Y. 1989. Physical,
achievement, and personality characteristics of Chinese children. Journal of Biosocial Science 21:483-95.
Falbo, Toni, and Dudley Poston. 1993. The academic, personality, and physical outcomes of only
children in China. Child Development 64(1):18-35. Feng, Xiaotian. 2002. The socialization process of only children and its outcome. Social Sciences in
China 2. -------2003. The one-child policy and its effect on adolescents’ education. Research and Discussion,
3. Fuller, Bruce. 1987. What school factors raise achievement in the developing world? Review of
Educational Research 57:255–92.
Fuller, Bruce, and P. Clarke. 1994. Raising school effects while ignoring culture? Review of Educational Research 64:119–57.
Fuller, Bruce, Judith Singer, and Margaret Keiley. 1995. Why do daughters leave school in southern
Africa? Family economy and mothers’ commitments. Social Forces 74(2): 657-680. Gomes, M. 1984. Family size and educational attainment in Kenya. Population and Development
Review 10:647-660. Greenhalgh, Susan. 1985. Sexual stratification: the other side of growth with equality in East Asia.
Population and Development Review 11(2):265-314. ------- 1986. Shifting in China’s population policy, 1984-86: view from central, provincial and local
levels. Population and Development Review 12(3):491-515. Gu, Baochang (organizer), Guangzong Mu, Liping Zhou, Guixin Wang, Jinhong Ding, Juhua Yang,
and Jinying Wang. 2006. The choice of the China fertility policies in the future. Market and Demographic Analysis 12(1):22-37.
Guo, Guang, and L. VanWey. 1999. Sibship size and intellectual development: is the relationship
causal? American Sociological Review 64:169-187. Guo, Zhigang, Erli Zhang, Baochang Gu, and Feng Wang. 2003. Policy fertility rate and local
variations of birth planning policy. Population Research 27(5):1-10.
25
Hannum, Emily. 1999. Political change and the urban-rural gap in basic education in China. Comparative Educational Review 43:193-211.
--------. 2000. Opportunity Lost: Rural Children and Educational Opportunity in Reform Era China. Harvard University, Mimeo.
Heer, David M. 1985. Effects of sibling number on child outcome. Annual Review of Sociology
11:2747. Heyneman, S.P. 1976. Influences on academic achievement: a comparison of results from Uganda
and more industrialized societies. Sociology of Education 49:200–11. Jejeebhoy, Shireen J. 1993. Family size, outcomes for children, and gender disparities: the case of
rural Maharashtra. In Fertility, Family Size, and Structure: Consequences for Families and Children, edited by Lloyd, Cynthia B., pp. 445-479. New York, the Population Council.
Kaufman, Joan; Zhang Zhirong; Qiao Xinjian; Zhang Yang. 1989. Family planning policy and
practice in China: a study of four rural counties. Population and Development Review 15(4):707-729.
Knodel, John. 1993. Fertility decline and children’s education in Thailand: some macro and micro
effects. In Fertility, Family Size, and Structure: Consequences for Families and Children, edited by Lloyd, Cynthia B., pp. 267-296. New York, the Population Council.
Knodel, J., N. Havanon, and W. Sittitrai. 1990. Family size and the education of children in the
context of rapid fertility decline. Population and Development Review 16:31-62. Li, Shuduo, Yan Wei, and Baoquan Jiang. 2006. The survival of female children in China: past,
present and future. Market and Demographic Analysis 12(1):2-16. Lillard, Lee A., and Robert J. Wills. 1994. Intergenerational educational mobility: effects of family
and state in Malaysia. The Journal of Human Resources 29(4):1126-1166. Lloyd, Cynthia B. 1993. Does sibshize matter? The implications of family size for children’s
education in Ghana. In Fertility, Family Size, and Structure: Consequences for Families and Children, edited by Lloyd, Cynthia B., pp. 481-519. New York, the Population Council.
Lloyd, Cynthia B., and Ann K. Blanc. 1996. Children’s schooling in sub-Saharan Africa: the role of
fathers, mothers, and others. Population and Development Review 22(2):265-298. Merli, M. Giovanna, and H. Smith. 2002. Has the Chinese family planning program been successful
in changing fertility preferences? Demography 39(3):557-572. Mo, Lixia. 2005. Fertility desire and sex preference among peasants in China. Population Research
29(2):62-68. Parrado, Emilio A. 1998. Expansion of schooling, economic growth and regional inequalities in
Argentina. Comparative Education Review 42(3):338-364.
26
Parish, WL., and RJ. Willis. 1993. Daughters, education, and family budgets: Taiwan experience.
Journal of Human Resources 28:863-898. Peng, Peiyun. 1997a. China’s population policy. Population and Development Review 23(4):926. ------- 1997b (editor). Complete Collection of China’s Family Planning. Beijing: China Population
Press. Peng, Xizhe, and Jing Li. 2002. The effect of China population programs and macro policy
environment. Population Research 26(5). Pong, SL. 1997. Sibship size and educational attainment in Peninsular Malaysia: do policies matter?
Sociological Perspectives 40:227-271. PCO (Population Census Office of the State Council and Department of Population, Social, and
Technology Statistics of State Statistic Bureau of China). 2002. Tabulation on the 2000 Population Census of the People’s Republic of China. China Statistics Press, Beijing.
Post, D. 1994. Educational stratification, school expansion, and public policy in Hong Kong.
Sociology of Education 67:121-138. Poston, D., and T. Falbo.1990. “Academic performance and personality traits of Chinese children:
Onlies versus others.” American Journal of Sociology 96(2):433-451. Powell, B., and L. C. Steelman. 1990. Beyond sibship size: sibling density, sex composition, and
educational outcomes. Social Forces 69:181-206. -------1993. The educational benefits of being spaced out: sibship density and educational progress.
American Sociological Review 58:367-381. -------1995. Feeling the pinch: child-spacing and constraints on parental economic investments in
children. Social Forces 73:1465-86. Qiao, Xiaochun (organizer), Zhenwu Zhai, Xuejun Yu, Yingtong Ma, and Qiang Ren. 2005. How
low is the Chinese fertility? Market and Demographic Analysis 11(6):22-33. Sathar, Zeba. 1994. Micro-consequences of high fertility: the case of child schooling in rural
Pakistan. In Fertility, Family Size, and Structure: Consequences for Families and Children, edited by Lloyd, Cynthia B., pp. 415-444. New York, the Population Council.
Shavit, Yossi, and Jennifer Pierce. 1991. Sibship size and educational attainment in nuclear and
extended families: Arabs and Jews in Israel. American Sociological Review 56:321-330. Shreeniwas, S. 1997. Family size, sex composition and children’s education: ethnic differentials
over development in Peninsular Malaysia. Population Studies 51:139-151. Short, Susan, and Zhai Fengying. 1998. Looking locally at China’s one-child policy. Studies in
Family Planning 29:373-87.
27
Short, Susan, Zhai Fengying, Xu Siyuan and Yang Mingliang. 2001. China’s one-child policy and the care of children: an analysis of qualitative and quantitative data. Social Forces 79(3):913-943.
Short, Susan, and Rongjun Song. 2003. Grandmothers, formal care, and educational advantage in
China. Sociology of Education 14:7-31. Stash, Sharon, and Emily Hannum. 2001. Who goes to school? Educational stratification by gender,
caste, and ethnicity in Nepal. Comparative Education Review 45(3):354-378. Statistical Bureau of China: Statistic Yearbook of China, 2001. Beijing: China Statistic Press. Steelman, Lala Carr, Brian Powell, Regina Werum, and Scott Carter. 2002. Reconsidering the effects
of sibling configuration: recent advances and challenges. Annual Review of Sociology 28:243-269.
Sudha, S. 1997. Family size, sex composition and children’s education: ethnic differentials over
development in Peninsular Malaysia. Population Studies 51:139-151. Treiman, Donald J., and Kam-Bor Yip. 1989. “Educational and Occupational Attainment in 21
Countries.” In Cross-National Research in Sociology, edited by Melvin L. Kohn, pp. 373-394. Newbury Park, Calif.: Sage.
White. H. 1980. A heteroskedasticity-consistent covariance matrix estimator and a direct test for
heteroskedasticity. Econometrica 48:817-830. White, T. 1992. Birth planning between plan and market: The impact of reform on China's one-child
policy. In China's economic dilemmas in the 1990s: The problems of reforms, modernization, and interdependence. Studies on Contemporary China, pp.252-69. Armonk, N.Y. U. S. C. J. E. Committee and London, Sharpe.
Wu, Cangping (editor in chief). 1997. General Report of China’s Changing Population and Its
Development. Higher Education Press (English version), Beijing. Yang, Juhua. 2005. Beyond Birth Control: The One-Child Policy and Child Wellbeing in
Transitional China. Dissertation International. Zeng, Yi. 1989. Is the Chinese family planning program “tightening up”? Population and
Development Review 15(2):333-337. Zhang, Erli. 2005. The effect of family planning policy on sex ratio at birth and the sex ratio of
infant mortality: evidence from 2000 Census. Population Research 29(1):11-18. Zhang, Weiqing. 1998. Minister Zhang Weiqing on the goals of China’s family planning programme,
China Population Today, edited by Zhu Hezhong 15:8-9. Zheng, Zhenzhen. 2004. Studies on the fertility desire among women in reproductive ages. Chinese
28

Journal of Population Science 5:73-78.
29

Variables Definitions Mean S.D.School enrollment 1=the child enrolled in school at the survey time; 0=otherwiseGrade completion 1=the child completed primary/secondary/high school; 0=otherwiseIndividua characteristicsSibling CompositionSingle child 1=the child has no sibling; 0=otherwise 0.251 sibling 1=the child has only 1 sibling; 0=otherwise
1 older brother 1=the child has only 1 older brother; 0=otherwise 0.111 younger brother 1=the child has only 1 younger brother; 0=otherwise 0.161 older sister 1=the child has only 1 old sister; 0=otherwise 0.091 younger sister 1=the child has only 1 younger sister; 0=otherwise 0.12
(by sibling density)Wide spacing 1=birth interval > 36 months; 0=otherwise 0.12Close spacing 1=birth interval <= 36 months; 0=otherwise 0.36
2+ sibling 1=the child has 2 or more siblings; 0=otherwise 0.28The child is a girl 1=girls; 0=boys 0.48Age of children (in years) Ranging from 13 to 19 15.73 1.97
Household characteristicsFather's education
<=primary school 1=father has no education or primary education; 0=otherwise 0.45Middle school 1=father has a middle school education; 0=otherwise 0.35Post-middle school 1=father has a post-middle school education; 0=otherwise 0.19
Father's occupationFarmer 1=father is a farmer, fisherman, logger or not work; 0=otherwise 0.58Ordinary worker 1=father is a serviceman, housekeepers, craftsmen, non-skilled workers, drivers,
ordinary soldiers or policemen, secretary, office helpers or other; 0=otherwise
0.29Administrator 1=father is an administrator, professional, police officer, army officer or artist;
0=otherwise 0.13Household wealth Unweighted sum of household consumer durable goods, including color TV,
washing machine, A/C, electric fan, etc. 4.26
Community characteristicsOne-child policy strength
One-child policy 1=community implements a strict one-child policy; 0=otherwise 0.45Girl-exception policy 1=community implements a girl-exception policy; 0=otherwise 0.30Two-child policy 1=community implements a two-child policy; 0=otherwise 0.25
Percent in agriculture Percent of labor force engaging in agriculture 0.50 0.33Urbanization
City 1=the community is in city; 0=otherwise 0.09Suburb and town 1=the community is in suburb or town; 0=otherwise 0.30Village 1=the community is a village; 0=otherwise 0.62
RegionNorth 0.35Center 0.34South 0.31
Survey year1993 1=1993 survey; 0=otherwise 0.231997 1=1997 survey; 1=otherwise 0.232000 1=2000 survey; 2=otherwise 0.30
Table 1. Variable Construction and Definition for Children Age 13-19
Source: 1993, 1997 and 2000 CHNS.
(by sibling gender and order)
See Figure 1See Figure 2
Sibling Composition
One-child policy Girls-exceptionpolicy
Two-child policy
Single child 38.94 19.97 11.851 sibling
(by sibling gender and order)1 older brother 9.61 11.32 12.391 younger brother 13.86 17.53 16.131 older sister 8.31 9.39 10.471 younger sister 11.36 11.98 11.85
(by sibling density)1 sibling widely spaced 12.24 12.87 13.911 sibling closely spaced 30.90 37.35 36.93
2+ sibling 17.92 29.81 37.31
Girl 48.45 44.90 48.01
N of observations 2165 1352 1308
Source: 1993, 1997 and 2000 CHNS.
Table 2. Cross Tabulation between the Local Variations of the One-Child Policy and SibshipComposition (%) for the Sample of School Enrollment among Children Age 13-19: CHNS1993-2000

Variables PS completion MS completion HS completionSibling composition Single child 72.87 91.79 88.33 40.001 sibling
(by sibling gender and order)1 older brother 53.54 88.04 69.23 33.331 younger brother 65.78 92.04 71.62 23.811 older sister 68.02 88.30 80.00 32.001 younger sister 64.30 84.69 78.08 25.97
(by sibling density)1 sibling widely spaced 61.51 90.08 78.02 30.381 sibling closely spaced 63.61 88.26 72.29 28.33
64.97 17.37
68.85 26.9869.57 27.64
2+ sibling 54.81 82.80Girl
No 61.74 84.89Yes 59.83 83.95
One-child policy strengthOne child policy 68.27 89.95Girl-exception policy 58.95 87.61Two-child policy 60.09 85.78
Source: 1993, 1997 and 2000 CHNS.
82.74 37.0069.51 17.8067.68 19.78
Table 3. Cross Tabulation between Key Predictors and Child Education (%): CHNS 1993-2000
Grade completionSchoolenrollment
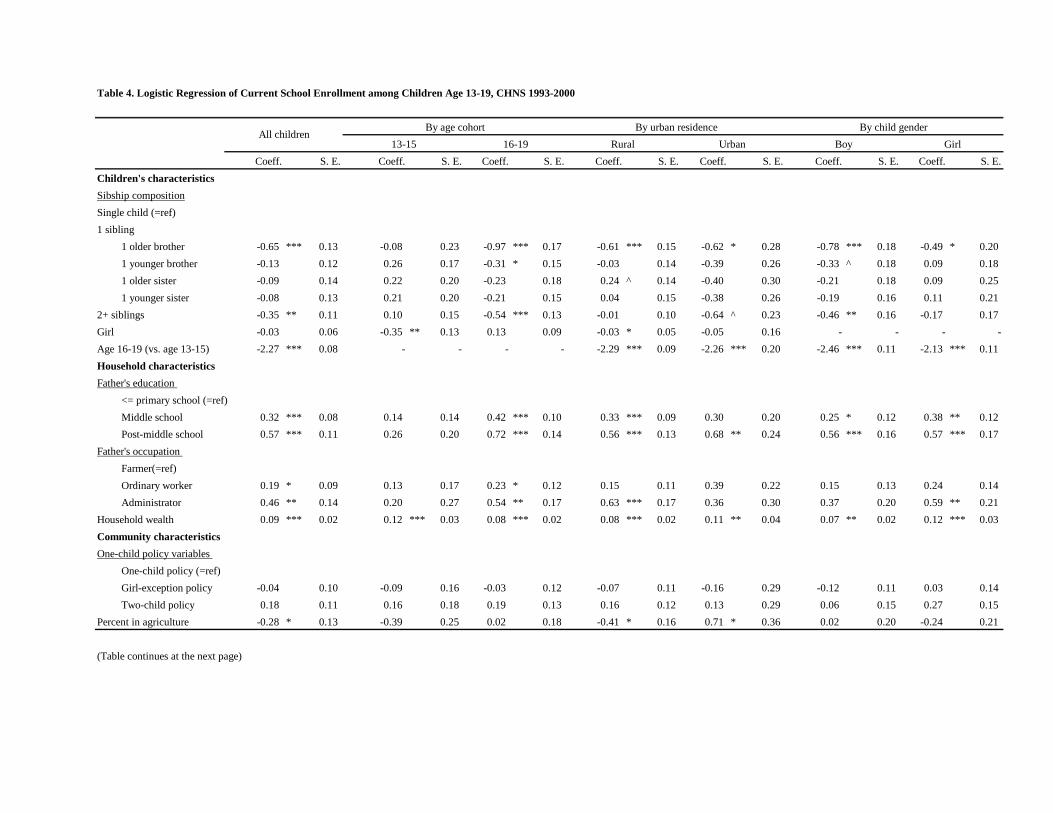
Table 4. Logistic Regression of Current School Enrollment among Children Age 13-19, CHNS 1993-2000
Coeff. S. E. Coeff. S. E. Coeff. S. E. Coeff. S. E. Coeff. S. E. Coeff. S. E. Coeff. S. E.Children's characteristics Sibship compositionSingle child (=ref)1 sibling
1 older brother -0.65 *** 0.13 -0.08 0.23 -0.97 *** 0.17 -0.61 *** 0.15 -0.62 * 0.28 -0.78 *** 0.18 -0.49 * 0.201 younger brother -0.13 0.12 0.26 0.17 -0.31 * 0.15 -0.03 0.14 -0.39 0.26 -0.33 ^ 0.18 0.09 0.181 older sister -0.09 0.14 0.22 0.20 -0.23 0.18 0.24 ^ 0.14 -0.40 0.30 -0.21 0.18 0.09 0.251 younger sister -0.08 0.13 0.21 0.20 -0.21 0.15 0.04 0.15 -0.38 0.26 -0.19 0.16 0.11 0.21
2+ siblings -0.35 ** 0.11 0.10 0.15 -0.54 *** 0.13 -0.01 0.10 -0.64 ^ 0.23 -0.46 ** 0.16 -0.17 0.17Girl -0.03 0.06 -0.35 ** 0.13 0.13 0.09 -0.03 * 0.05 -0.05 0.16 - - - -Age 16-19 (vs. age 13-15) -2.27 *** 0.08 - - - - -2.29 *** 0.09 -2.26 *** 0.20 -2.46 *** 0.11 -2.13 *** 0.11Household characteristics Father's education
<= primary school (=ref)Middle school 0.32 *** 0.08 0.14 0.14 0.42 *** 0.10 0.33 *** 0.09 0.30 0.20 0.25 * 0.12 0.38 ** 0.12Post-middle school 0.57 *** 0.11 0.26 0.20 0.72 *** 0.14 0.56 *** 0.13 0.68 ** 0.24 0.56 *** 0.16 0.57 *** 0.17
Father's occupation Farmer(=ref)Ordinary worker 0.19 * 0.09 0.13 0.17 0.23 * 0.12 0.15 0.11 0.39 0.22 0.15 0.13 0.24 0.14Administrator 0.46 ** 0.14 0.20 0.27 0.54 ** 0.17 0.63 *** 0.17 0.36 0.30 0.37 0.20 0.59 ** 0.21
Household wealth 0.09 *** 0.02 0.12 *** 0.03 0.08 *** 0.02 0.08 *** 0.02 0.11 ** 0.04 0.07 ** 0.02 0.12 *** 0.03Community characteristicsOne-child policy variables
One-child policy (=ref)Girl-exception policy -0.04 0.10 -0.09 0.16 -0.03 0.12 -0.07 0.11 -0.16 0.29 -0.12 0.11 0.03 0.14Two-child policy 0.18 0.11 0.16 0.18 0.19 0.13 0.16 0.12 0.13 0.29 0.06 0.15 0.27 0.15
Percent in agriculture -0.28 * 0.13 -0.39 0.25 0.02 0.18 -0.41 * 0.16 0.71 * 0.36 0.02 0.20 -0.24 0.21
(Table continues at the next page)
All childrenBy age cohort
13-15 16-19 GirlBy urban residence
Rural Urban BoyBy child gender

(Table 4 continues)
Coeff. S. E. Coeff. S. E. Coeff. S. E. Coeff. S. E. Coeff. S. E. Coeff. S. E. Coeff. S. E.Urbanization
City (=ref)Suburb or town -0.07 0.16 -0.20 0.37 -0.01 0.18 0.44 *** 0.12 -0.14 0.20 -0.18 0.23 0.03 0.24Village -0.55 ** 0.17 -0.46 0.39 -0.59 ** 0.20 - - - - -0.71 ** 0.24 -0.36 0.26
RegionCenter (=ref)North -0.10 0.09 -0.27 0.16 0.00 0.11 -0.07 0.10 -0.14 0.20 0.00 0.13 -0.21 0.13South -0.11 0.10 -0.17 0.18 -0.07 0.12 -0.13 0.12 -0.11 0.21 -0.03 0.14 -0.17 0.15
Survey year1993 (=ref)1997 0.57 *** 0.09 0.53 *** 0.16 0.60 *** 0.12 0.57 *** 0.11 0.76 *** 0.21 0.46 *** 0.13 0.69 *** 0.142000 0.20 * 0.09 0.40 ** 0.15 0.38 ** 0.13 0.25 * 0.11 0.76 *** 0.23 0.27 * 0.14 0.42 *** 0.12
Intercept 1.59 *** 0.22 1.69 *** 0.44 -0.76 ** 0.25 1.26 *** 0.20 1.26 ** 0.42 2.12 *** 0.30 0.97 *** 0.32
Wald Chi Square 1381.01 179 410.80 754.75 280.29 754.00 641.57Degree of freedom 21 20 20 20 20 20 20N 4825 2317 2508 3662 1163 2541 2284
Source: 1993, 1997 and 2000 CHNS.
Notes: Coeff. = coefficient; SE = standard error; ***p<0.001; **p<0.01; *p<0.05; ^p<0.10.
Rural All children
By age cohort By urban residence By child gender 16-1913-15 Urban Boy Girl
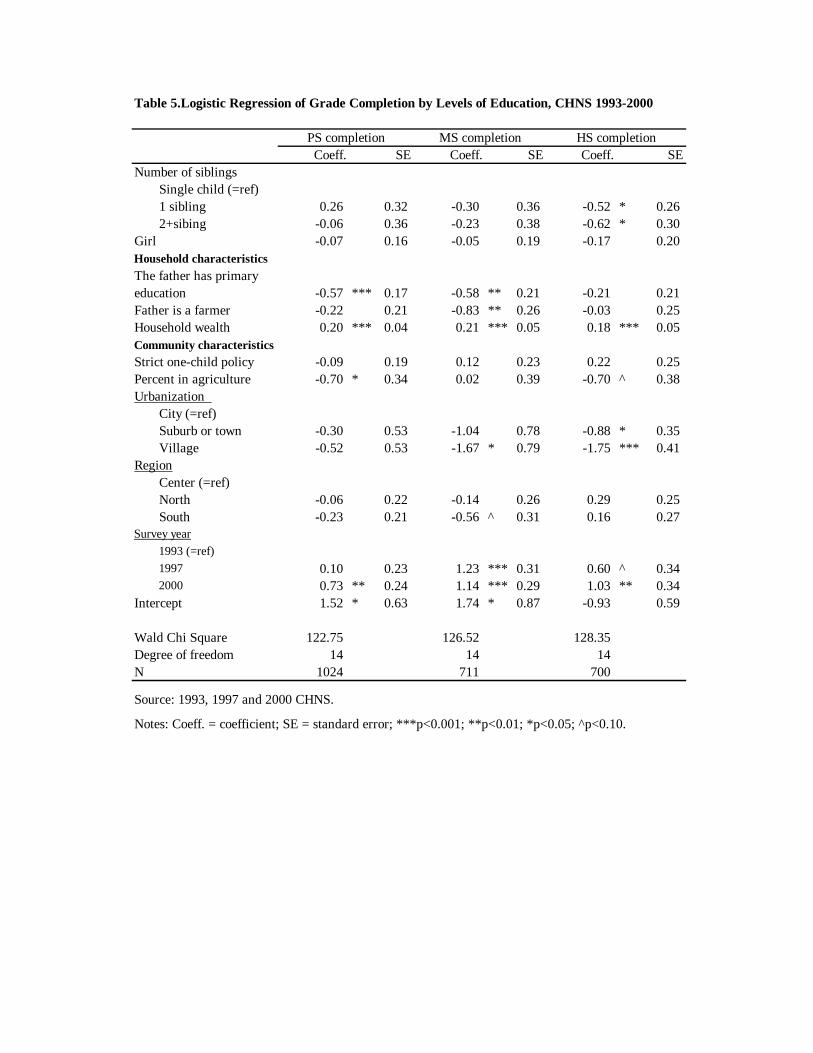
Table 5.Logistic Regression of Grade Completion by Levels of Education, CHNS 1993-2000
Coeff. SE Coeff. SE Coeff. SENumber of siblings
Single child (=ref)1 sibling 0.26 0.32 -0.30 0.36 -0.52 * 0.262+sibing -0.06 0.36 -0.23 0.38 -0.62 * 0.30
Girl -0.07 0.16 -0.05 0.19 -0.17 0.20Household characteristicsThe father has primaryeducation -0.57 *** 0.17 -0.58 ** 0.21 -0.21 0.21Father is a farmer -0.22 0.21 -0.83 ** 0.26 -0.03 0.25Household wealth 0.20 *** 0.04 0.21 *** 0.05 0.18 *** 0.05Community characteristicsStrict one-child policy -0.09 0.19 0.12 0.23 0.22 0.25Percent in agriculture -0.70 * 0.34 0.02 0.39 -0.70 ^ 0.38Urbanization
City (=ref)Suburb or town -0.30 0.53 -1.04 0.78 -0.88 * 0.35Village -0.52 0.53 -1.67 * 0.79 -1.75 *** 0.41
RegionCenter (=ref)North -0.06 0.22 -0.14 0.26 0.29 0.25South -0.23 0.21 -0.56 ^ 0.31 0.16 0.27
Survey year1993 (=ref)1997 0.10 0.23 1.23 *** 0.31 0.60 ^ 0.342000 0.73 ** 0.24 1.14 *** 0.29 1.03 ** 0.34
Intercept 1.52 * 0.63 1.74 * 0.87 -0.93 0.59
Wald Chi Square 122.75 126.52 128.35Degree of freedom 14 14 14N 1024 711 700
Source: 1993, 1997 and 2000 CHNS.
Notes: Coeff. = coefficient; SE = standard error; ***p<0.001; **p<0.01; *p<0.05; ^p<0.10.
MS completion HS completionPS completion
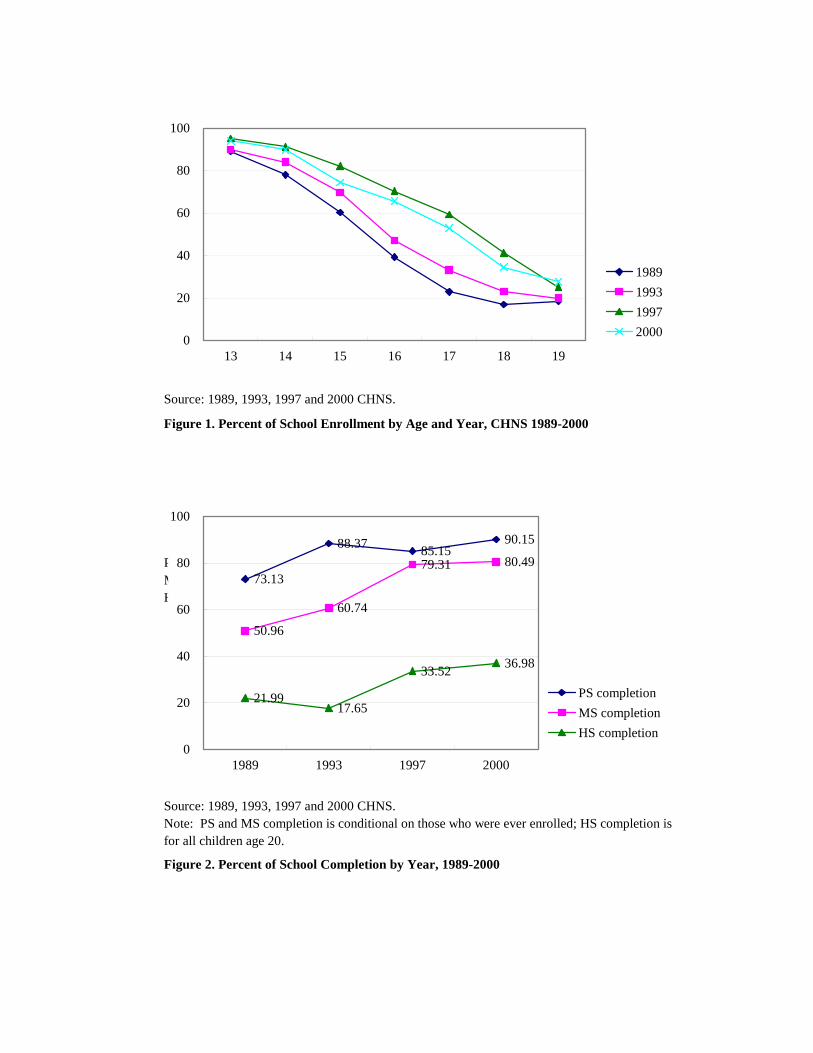
1989 1993 1997 200013 89.11 90.04 95.17 94.0414 77.99 84.11 91.27 89.8515 60.22 69.59 82.07 74.4416 39.26 47.03 70.28 65.6917 22.93 33.13 59.31 52.8518 16.89 22.94 41.24 34.5119 18.44 20.00 25.00 27.55
Source: 1989, 1993, 1997 and 2000 CHNS.
Figure 1. Percent of School Enrollment by Age and Year, CHNS 1989-2000
1989 1993 1997 2000PS completion 73.13 88.37 85.15 90.15MS completion 50.96 60.74 79.31 80.49HS completion 21.99 17.65 33.52 36.98
Source: 1989, 1993, 1997 and 2000 CHNS. Note: PS and MS completion is conditional on those who were ever enrolled; HS completion is for all children age 20.
Figure 2. Percent of School Completion by Year, 1989-2000
0
20
40
60
80
100
13 14 15 16 17 18 19
1989199319972000
73.13
90.1585.1588.37
80.4979.31
60.74
50.96
21.99
36.9833.52
17.65
0
20
40
60
80
100
1989 1993 1997 2000
PS completionMS completionHS completion