Embed Size (px)
Citation preview
1
Educational Stress among Chinese Adolescents: Individual, Family, School and Peer Influences
Jiandong Sun, Michael P. Dunne, Xiang-yu Hou and Ai-qiang Xu
Affiliations
Jiandong Sun: School of Public Health, Queensland University of Technology
(QUT), Brisbane, Australia
Michael P. Dunne: School of Public Health, QUT, Brisbane, Australia
Xiang-yu Hou: School of Public Health, QUT, Brisbane, Australia
Ai-qiang Xu: Shandong Provincial Centre for Disease Control and
Prevention (CDC), Jinan, PR China
Corresponding details
Correspondence concerning this paper should be addressed to Prof. Michael P. Dunne,
School of Public Health, Queensland University of Technology (QUT), Victoria Park Rd,
Kelvin Grove, QLD 4059, Australia. E-mail: [email protected]
2
Abstract
Educational stress is common among school children and adolescents, especially in Asian
countries. This study aims to identify factors associated with perceived educational stress
among students in China. A cross-sectional questionnaire survey was conducted with 1627
students (grades 7-12) from six secondary schools in rural and urban areas of Shandong
Province. A wide range of individual, family, school and peer factors were associated with
stress measured using the Educational Stress Scale for Adolescents (ESSA). Rural school
location, low school connectedness, perceived poor academic grades, female gender, older
age and frequent emotional conflicts with teachers and peers were among the strongest
correlates, and most of them are school or study-related. Unexpectedly, family and parental
factors were found to have little or no association with children’s perceived educational stress.
These findings may offer directions for interventions in secondary school settings.
Keywords: educational stress, risk factor, adolescents, secondary school students,
China
3
Educational Stress among Chinese Adolescents: Individual, Family, School and Peer Correlates
Education has been highly valued in traditional Chinese culture for thousands of years
and is seen as the major pathway to social success. This could be reflected by a Chinese
saying “All are low but reading (learning)”. Although there have been substantial changes in
the past century, the culture of respect for education remains influential in contemporary
China (OECD, 2010). Education for secondary school students is strongly focused on
preparation for examinations, especially for the National College Entrance Examination (Gao
Kao). In part due to the cultural influence and methods employed in the educational system,
Chinese students often achieve high academic outcomes. For example, the results of the
2009 OECD Programme for International Student Assessment (PISA) showed that Chinese
(Shanghai) students outperformed their counterparts from all other surveyed countries or
regions in terms of reading, mathematics and science (Mervis, 2010).
However, high achievement often comes at a personal cost. Chinese students appear
to have a heavy academic burden. An ongoing project led by the Chinese Youth and
Children Research Center (CYCRC) has conducted surveys since 2005 to compare many
aspects of students’ life between Chinese, Japanese, Korean and US high school students (Lei,
Sun, Li, Guo, & Zhang, 2007; Zhao, Zhu, & Ma, 2009). The preliminary results of the most
recent survey with 1868 Chinese, 1314 Japanese, 3379 Korean, and 1020 American high
school students was published on the official website of the Central People’s Government of
the People’s Republic of China (2010) and other media (Beijing Evening, 2010), showing
that Chinese students have the highest academic burden and pressure among the participating
countries. Nearly ninety percent (86.6%) of the Chinese participants felt high or very high
pressure because of academic matters and nearly half (45.2%) reported spending two hours or
more per day completing homework. Similarly in Taiwan, more than 40% of grade 11
4
students spend at least two hours each day on homework (Chen & Lu, 2009). Although
academic matters have been found to be a major source of stress among adolescents
worldwide (Brown, Teufel, Birch, & Kancherla, 2006; Christie & MacMullin, 1998; Dodds
& Lin, 1993; Gallagher & Millar, 1996; Owen-Yeates, 2005;. Huan, See, Ang, & Har, 2008;
Tang & Westwood, 2007), this phenomenon seems to be more pronounced in China and
other Asian countries, such as Singapore, Korea, Japan and Taiwan (Ang, Huan, & Braman,
2007; Crystal et al., 1994; Lee & Larson, 2000; Lei, et al., 2007; Zhao, et al., 2009).
Research into the nature and impact of perceived academic stress in students has been
hampered by some conceptual and methodological problems (Putwain, 2007). For example,
what the term “stress” refers to is not clear in the literature, with some referring it to the
external stimulus or stressors (such as low grades in an examination) while others to the
subjective experience of mental distress. The accumulated number of stressors may not
represent the level of perceived stress because the latter is moderated by the appraisal process
and coping ability of individuals (Lazarus & Folkman, 1984). A methodological concern is
that the domain of “examination stress” which focuses exclusively on (usually important)
examinations and “academic stress” which relates to a broader range of school activities are
not clearly defined (Putwain, 2007). Similar to other studies on the same topic (Ang & Huan,
2006; Bjorkman, 2007; Jones & Hattie, 1991), in this study we defined academic stress as
subjective psychological distress originated from multiple aspects of academic learning rather
than the sum of stressful life events. Our measure relates to perceived pressure, burden,
worry, dissatisfaction with grades and other difficulties. The terms “academic stress” and
“educational stress” are used interchangeably in this study.
Perceived stress or pressure from academic activities varies across gender, ethical
background, and socio-economic status. Females usually report more stress or pressure than
males (Jones & Hattie, 1991; Xie, 2007; Zhao & Yuan, 2006). One reason may be that
5
females are more likely to regard school performance as very important, and worry about
academic failure (Jones & Hattie, 1991). In western countries, students from ethnic minority
groups, especially those with Asian backgrounds, are more likely to be stressed by academic
learning than others (Coney & West, 1979; Jones & Hattie, 1991). Students with
disadvantaged backgrounds have also been found to experience higher educational pressure
(Coney & West, 1979; Li, Feng, Mei, & Yao, 2007; Moshe, 1992).
Generally, students in higher school years experience more subjective academic stress
(Jones & Hattie, 1991; Li, et al., 2007; Zhao & Yuan, 2006). In both junior and senior
secondary schools in China, students in their final years (grade 9 in junior schools and grade
12 in senior schools) report more pressure than non-final year students (Li, et al., 2007; Zhao
& Yuan, 2006), which is considered to be related to the two most important transitional
examinations. Another important factor for educational stress is poor academic performance,
where students with low Grade Point Average (GPA) scores or a low ranking in academic
grades often experience higher levels of perceived stress or pressure (Bjorkman, 2007; Li, et
al., 2007).
Research into the determinants of adolescent stress may provide evidence for
preventive intervention and mental health promotion. Educational stress among students may
be similar to occupational stress among working adults which has been extensively studied
for many decades. According to the Job Demand-Control-Support (JDCS) model (Johnson &
Hall, 1988; Van der Doef & Maes, 1999), stress increases when the demand is high, self-
control is low and social support is poor. The corollary here may be that heavy study
workload, low self-efficacy and poor relationships with parents, teachers and peers have
significant effects on the level of academic stress among students. Previous research from
European countries found that educational stress is linked to the pressure to achieve and fear
of failure, and is associated with a wide range of cognitive and educational factors (Meijer,
6
2007; Putwain, 2009). Ecological system theory (Bronfenbrenner, 1979) is commonly used
in research into risk factors. It is generally believed that many characteristics of students and
their environments including family, school and peers may have an effect on stress.
Although learning burden among children and adolescents is becoming a prominent
concern in China (Lin & Chen, 1995; Lu, 2008) and is widely covered in mass media
(Beijing Evening, 2010; Jia, 2010), little is known about the nature of perceived educational
stress, its social correlates and health effects in the Chinese context. Recent research in East
Asia indicates that authoritarian parenting focused on the child’s academic achievement has
negative effects on their behavioural and emotional well-being (Hesketh et al., 2010; Yang &
Shin, 2008; Zhou et al., 2008), but a converse and controversial position is that such
parenting has many advantages for child development (Chua, 2011). However, much of this
recent debate has not based on empirical research.
This study aims to identify key risk factors for high academic stress perceived by
Chinese adolescents attending secondary schools, and to examine their relative importance, in
order to provide evidence for intervention programs. We examined the effects of some
individual, family, school and peer factors in an exploratory manner, based on known or
expected relationships with adolescent mental health, such as self-efficacy, parental control,
family dysfunction, school connectedness, and inter-personal conflicts.
Methods
Design and Participants
A cross-sectional survey with a self-report questionnaire was conducted in Shandong,
the second most populous province in China, in September and October 2009. Three sites
were chosen to ensure geographic and socioeconomic diversity, including the capital city of
the province, a county city and a rural town. From each site, one junior school (grade 7-9)
and one senior school (grade 10-12) were selected with principal’s approval. Two classes per
7
grade from each of the six participating schools were then randomly chosen. In all, 1,740
students in 36 classes were invited to participate in the survey, of whom, 1690 (97.1%)
agreed to participate.
Measures
Demographics
Ten questions sought information on demographic characteristics, including gender,
age, school year (7-12), school location (capital city/ county city/ rural town), family location
(urban / rural), self-reported family income level (low/ middle/ high), father and mother’s
occupation (farming / non-farming), and father and mother’s education level (junior school or
lower / senior school or higher).
Academic Stress
The Educational Stress Scale for Adolescents (ESSA, (Sun, Dunne, Hou, & Xu, 2011)
was used to estimate the level of perceived academic stress. It contains 16 statements rated
on a 5-point Likert scale ranging from 1 (Strongly disagree) to 5 (Strongly agree). The total
score ranges from 16 to 80 with higher scores indicating greater perceived stress. This scale
has five factors. ‘Pressure from study’ (four items about the perceived pressure from daily
learning, from parents, peer competition and students’ concern about the future), ‘Workload’
(three items regarding perceived burden of homework, school work and examinations),
‘Worry about grades’ (three items regarding stressful emotions due to dissatisfaction with
academic grades), ‘Self-expectation stress’ (three items about stressful feelings when self-
expectations fail to be met) and ‘Despondency’ (three items about dissatisfaction and lack of
confidence and concentration in academic study). This instrument has adequate internal
consistency in this sample with Cronbach’ α = .82 for the total scale, and α=.79, α=.73, α=.69,
α=.65, and α=.64 for the five factors, respectively.
Individual Factors
8
Variables measured included self-efficacy, health status, Body Mass Index (BMI),
and history of physical exercise, internet use, and playing video games in the past 30 days.
Health status was categorised as poor, moderate, and good. BMI was calculated as weight
(Kg) / height (m) 2, based on self-reported weight and height data. Three questions with a
yes/no response format were used to examine the experience of regular physical exercise,
internet use and video game playing in the past 30 days.
Self-efficacy. The Chinese version of the Generalized Self-Efficacy Scale (GSES)
(Zhang & Schwarzer, 1995) was used. Participants rated each of the 10 items on a 4-point
Likert scale ranging from one (Not at all true) to four (Exactly true). Example items include
"I can always manage to solve difficult problems if I try hard enough" and "If someone
opposes me, I can find the means and ways to get what I want". The total score varies from
10 to 40 with higher scores indicating higher levels of self-efficacy. The GSES has been
shown to have high internal consistency with Cronbach alpha ranging from α=.75 to α=.94
across a number of different language versions (Schwarzer & Jerusalem, 1995). The
Cronbach’s alpha calculated on this scale in the present study was α=.88.
Parenting and Family-related Factors.
Parental bonding. The short form (n=20 items) of the Parenting Bonding Instrument
(PBI) (Pedersen, 1994) was used to measure both maternal and paternal parenting style.
Participants rate each statement on a four-point Likert scale ranging from Very like,
Moderately like, Moderately unlike, to Very unlike regarding how well the statements
describe their relationships with mothers and fathers respectively. Each item is scored from 0
to 3. The shortened PBI has four factors: father/mother care and father/mother control (each
with 5 items). Example items for parental care are "My father/mother did not heal me as
much as I needed" (reverse coded) and "My father/mother appeared to understand my
problems and worries". Higher scores on the care scale suggest warmth and understanding;
9
while lower scores indicate “coldness” and rejection. Example items for parental control are
"My father/mother liked me to make my own decisions" (reverse coded) and "My
father/mother tried to control everything I did". Higher scores on the control scale indicate
overprotection; while lower scores suggest parents allowing personal independence. The
Cronbach’s alpha of mother’s care, mother’s control, father’s care, and father’s control) were
found to range from .69 to .78 in the original study (Pedersen, 1994). Unfortunately, when
translated into Chinese, the response format was found to be problematic in the pilot study for
the current project, with many students commenting that it was “ambiguous” or “confusing”.
Therefore, the response format was changed to Never, Sometimes, Often and Always. In this
study, the modified PBI achieved a Cronbach's alpha from α = .66 to α= .70 for the four
subscales, respectively.
Family connectedness. Family connectedness was measured using a 4-item scale
(Hall-Lande, Eisenberg, Christenson, & Neumark-Sztainer, 2007). Participants were asked
“How much do you feel your mother cares about you?”, “How much do you feel your father
cares about you?”, “Do you feel that you can talk to your mother about your problems?” and
“Do you feel that you can talk to your father about your problems?” Answers were given on
a five-point Likert scale ranging from 1 (Not at all) to 5 (Very much). Scores were averaged
to create an overall connectedness score ranging from 1 to 5, with higher scores indicating
greater connectedness to family. In this study, the Cronbach's alpha for the translated scale
was α=.75.
Conflicts with parents. Three types of conflicts with parents were estimated using the
respective questions “Have you ever had a serious quarrel with your parents or other
guardians in the past 12 months?”, “Have you ever been scolded, threatened, or humiliated by
your parents or other guardians in the past 12 months?” and “Have you ever been physically
punished (such as being forced to stand for some time, being beaten with fist or other objects,
10
or being kicked) by your parents or other guardians in the past 12 months?” Three response
options, i.e., “Never”, “Sometimes”, and “Often” were employed. Students who responded
“Sometimes” or “Often” to these questions were categorised as having experienced quarrels
with parents, parents’ emotional punishment and parents’ physical punishment, respectively.
School and Study-related Factors.
School connectedness. This was measured using a 5-item instrument created by
Resnick and colleagues (1997) from the National Longitudinal Study on Adolescent Health in
the USA. It includes statements regarding students’ feelings about their school and teachers:
1) “I feel safe in my school”, 2) “The teachers at this school treat students fairly”, 3) “I am
happy to be at this school”, 4) “I feel like I am part of this school” and 5) “I feel close to
people at this school”. This scale uses a 5-point response format ranging from 0 (Strongly
Disagree) to 4 (Strongly Agree). The total score varies from 0 to 20 where higher scores
indicate higher level of school connectedness. In this study, the scale obtained very good
internal consistency (α = .83).
Conflicts with teachers. Similar to conflicts with parents, three types of conflict with
and punishment by teachers were measured using three individual questions: “Have you ever
had a serious quarrel with your teachers or other staff at school in the past 12 months?”,
“Have you ever been scolded, threatened, or humiliated by your teachers or other staff at
school in the past 12 months?”, and “Have you ever been physically punished (such as being
forced to stand for some time, being beaten with fist or other objects, or being kicked) by
your teachers or other staff at school in the past 12 months?” Reponses to these questions
and categorisation method were the same as questions about conflict with parents.
Study-related factors. Several study related factors were assessed using individual
questions, including perceived academic achievement (low / moderate / high), average
homework hours per day (less than 1 hour / 1-2 hours / more than 2 hours), attendance at
11
extra-curricular classes and private tutoring in the past 12 months. For attendance at extra-
curricular classes and engaging a private tutor, a dichotomous yes/no response was used.
Peer Factors
There were seven peer relationship factors including perceived popularity, social
isolation, romantic relationship and four conflict variables (quarrels with peers, physical
fighting, emotional bullying victimisation and physical bullying victimisation). Participants
were asked to rate their perceived popularity among peers with three response options: low,
medium and high. Students who responded “none” to the question “Do you have one or more
close friends you can talk to about your problems?” were defined as socially isolated with
regard to peers (Hall-Lande, et al., 2007). The experience of romantic relationship was
defined based on the “yes” answer to the question “Have you ever had a boyfriend or
girlfriend?” Four types of peer conflicts were measured using four individual questions:
“Have you ever had a serious quarrel with your fellow students at school in the past 12
months?”, “Have you ever been involved in physical fighting with your fellow students at
school in the past 12 months?” , “In the past 12 months, have any of your fellow students
ever bullied you emotionally at school, such as insulting you, calling your names, teasing you,
threatening you, and humiliating you?”, and “In the past 12 months, have any of your fellow
students ever bullied you physically at school in any kind?” The response format and
categorisation method were the same as the questions of conflicts with parents and teachers.
Statistical Analysis
Means (Ms) and standard deviations (SDs) for ESSA factor and item scores were
calculated and potential differences between junior and senior sectors were tested using
independent sample t-test. Expected associations between ESSA scores and study factors
were tested using correlation analysis, with Pearson’s r for continuous factors (such as age
and self-efficacy score), Point-biserial correlation coefficients for dichotomous factors (such
12
as gender), and Spearman correlation for categorical variables with more than two levels
(such as school location and health status), respectively. To assess the relative influence of
factors on educational stress, all variables significant in bivariate analyses were included in
multiple linear regression models for the total ESSA score as well as for all five subscales.
All analyses were conducted using SPSS for Windows 17.0 (SPSS Inc, Chicago, IL) and
statistical tests were two-tailed with a significance level of p < .05.
Ethics Clearance
This study was granted ethics approval by the Human Research Ethics Committee of
Queensland University of Technology (QUT), Australia and the Preventive Medicine Ethics
Committee of Shandong Centre for Disease Control and Prevention (CDC), China.
Participation was entirely voluntary and anonymous. Written consent to participation was
given by each of the participating schools. Only students who signed a consent form were
included in the survey.
Results
Sample Description
Data analysis was undertaken with 1627 students which accounted for 93.5%
(1627/1740) of all eligible participants and 96.3% (1627/1690) among those who returned a
questionnaire. Sixty-three questionnaires (3.7%) were excluded due to incomplete response.
The demographic characters of the sample are shown in Table 1. The ages ranged from 11 to
20 with a mean of 15.47 years (standard deviation (SD) = 1.85). Almost all students (99.5%,
1618/1627) were ethnic Han Chinese, which is consistent with the total population in
Shandong province (Shandong Provincial Bureau of Statistics, 2007).
ESSA Scores
The total ESSA score ranged from 18 to 80 with a mean of 53.80 (SD = 9.91) and is
normally distributed (Skewness = -0.46, Kurtosis = 0.39). Scores of all subscales also
13
followed normal distribution (Skewness ranges -0.01- 0.74, Kurtosis ranges -0.05 - 0.52).
The ESSA mean scores (SDs) across demographic variables are presented in Table 2. The
mean scores and SDs by school sector (junior and senior) for ESSA factors and items are
presented in Table 2. For almost all factors/items except Worry about grades, senior school
students (years 10-12) reported significantly higher scores than did junior school students
(years 7-9).
Bivariate Associations
The bivariate correlations between study factors and ESSA scores are displayed in
Table 3. All factors except BMI and whether attending extra classes had a significant
correlation with at least one of the scores. For ESSA total score, school connectedness had
the highest coefficient (Pearson’s r = .33), followed by age (r = .25), self-efficacy (r = .24)
and mother control (r = .24).
Multivariate Analysis
All significant factors identified in bivariate analysis were included in the multiple
regression analysis. Considering its perceived importance on academic burden, whether
attending extra classes was also included despite the non-significance in the bivariate analysis.
Table 3 shows the results of multiple regressions for each type of educational stress with all
demographic, individual, family, school and peer factors as independent variables. All
models were statistically significant. For total ESSA score (Adjusted R2 = .28, F(38, 1374) =
14.85, p < .001), 16 factors were found to be statistically significant (Table 3). For Pressure
from study (Adjusted R2 = .27, F(38, 1374) = 14.11, p < .001) and Workload (Adjusted R2
= .27, F(38, 1374) = 14.46, p < .001), each had 14 significant variables; for Worry about
grades (Adjusted R2 = .07, F(38, 1374) = 3.89, p < .001) and Self-expectation (Adjusted R2
= .06, F(38, 1374) = 3.13, p < .001), only 6 variables remained significant; and for
14
Despondency (Adjusted R2 = .36, F(38, 1374) = 21.60, p < .001), 11 variables were
significant (Table 3).
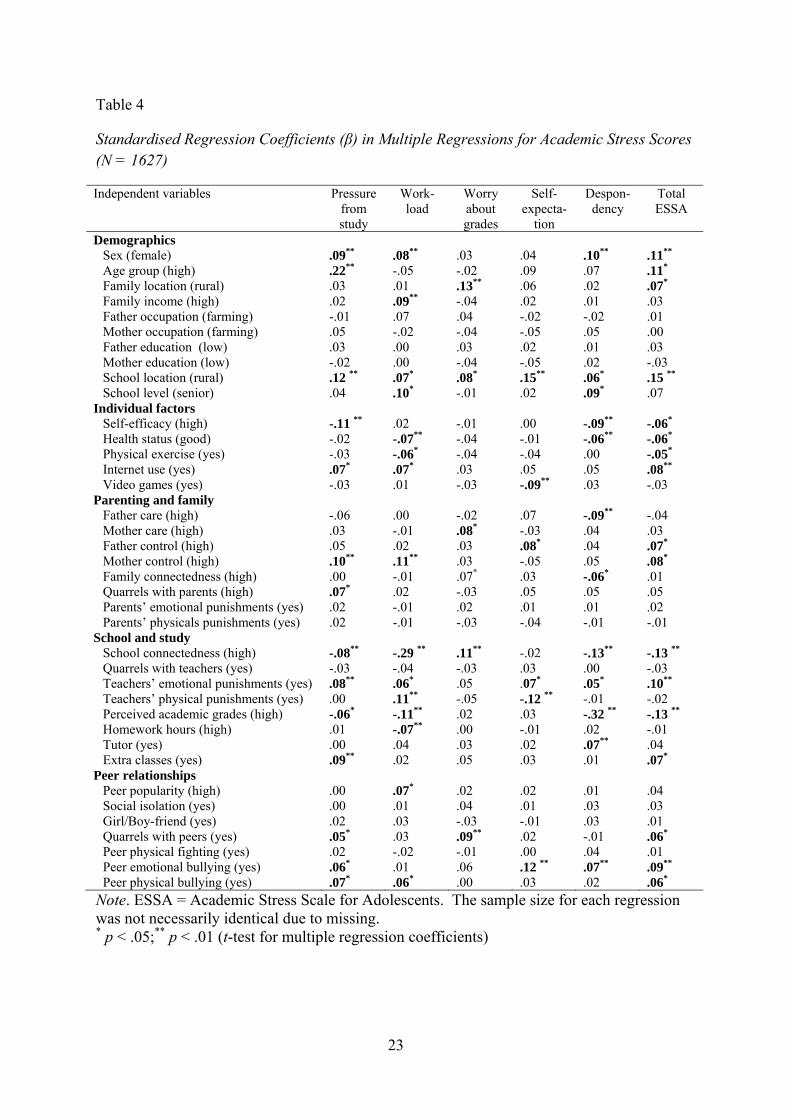
For the total ESSA score, school location (β = .15), school connectedness (β = .13),
academic grades (β = .13), gender (β = .11), age (β = .11), teacher’s emotional punishments
(β = .10), and peer emotional bullying (β = .09) were among the strongest independent
variables (Table 3). Female gender, rural school location, low school connectedness,
teacher’s emotional punishment, low academic grades and peer emotional bullying were also
significantly associated with high scores of three or more factors of the ESSA, except for the
relationship between school connectedness and Worry about grades score in which a reversed
connection was observed. Despite their significant bivariate associations, nine variables,
including father and mother’s occupation, father and mother’s education level, parents’
emotional and physical punishments, social isolation, whether having a girl/boy-friend and
peer physical fighting showed no relationship with any of the subscales of the ESSA when
other factors were taken into account (Table 3).
There were differences between subscales in terms of the relative importance of
independent variables. For example, the most influential factor for Pressure from study was
age (β = .22), for Workload score was school connectedness (β = .29), for Worry about
grades was family location (β = .13), for Self-expectation score was School location (β = .15),
and for Study despondency was academic grades (β = .32, Table 3). For Worry about grades
and Self-expectation score, fewer factors were significant and the explanatory power of the
model is much lower than for other subscales.
Discussion
In an exploratory manner, we have examined a wide range of factors that may be
related to perceived educational stress among a large sample of secondary school students in
China. Most variables examined had a statistically significant relationship with ESSA total
15
score or some subscales. Some have been identified in previous studies, such as female
gender, older age, high school year, low family income, and perceived poor academic grades
(Bjorkman, 2007; Coney & West, 1979; Jones & Hattie, 1991; Li, et al., 2007; Moshe, 1992;
Xie, 2007; Zhao & Yuan, 2006). Some were taken into consideration for the first time
regarding educational stress in Asia, such as family connectedness, school connectedness and
parental bonding. Importantly, the relative contribution of these variables has been assessed
by multiple regressions to minimise confounding due to inter-correlation. For example,
gender was not significantly associated with ESSA total score in the bivariate analysis.
However, when controlled for all other factors, gender became one of the most important
variables for ESSA total score and for three of the subscales (Table 3). .
Rural school location had the strongest association with overall stress and Self-
expectation stress, and was significantly correlated with all other sub-dimensions of
educational stress. In addition to school location, students from rural families experienced
significantly more overall educational stress and specially, worry about grades. Although
school and family location are highly correlated (In this sample, students from rural families
make up 18%, 48% and 98% of all participants attending major city, county city and rural
town schools respectively), the multivariate analyses suggest the two factors have
independent effects on stress arising from academic learning.
There are several plausible cultural and system-level explanations. First, although
academic learning is widely considered to a major path to social success by Chinese
communities, this appears to be more pronounced in rural families (Ang & Huan, 2006; Lin
& Chen, 1995; Lu, 2008). Rural students may have extra pressure to perform as a key
element of the family’s drive to promote their social and economic status in comparison to
their urban counterparts. Second, there has been a huge disparity in educational resources
between urban and rural areas in China (Bao, 2006). Rural schools are usually in poorer
16
condition in terms of both infrastructure and teacher resources. Post-school training
opportunities in rural areas are less than in cities, and therefore competition is greater. These
factors may drive both schools and students to work harder. Moreover, rural schools may be
more likely to conduct “cramming teaching” rather than quality teaching and this may pose
an additional burden (Bao, 2006). Third, although education departments have developed
policies to reduce the learning burden of students (China Ministry of Education, 2009;
Shandong Provincial Education Department, 2009), it may be more difficult for these policies
to be applied to rural areas due to resource limitations.
Favourable family environment, parenting style and parent-child relationship strongly
influence mental health and well-being of children and adolescents (Bhatia & Bhatia, 2007;
Greenberger, Chen, Tally, & Dong, 2000; Hall-Lande, et al., 2007; Pedersen, 1994). The
present data show that parents’ education level and occupation, parental bonding (except
parental control), family connectedness and conflict with parents are not strongly related to
educational stress. In this study, we defined educational stress as stress arising from
academic matters, which occur mainly at the school rather than family. Family factors may
have strong effects on the overall stress but not this particular form of stress. Further, in
countries like China in which filial piety to parents is specially valued, most students may
feel obliged to realise the expectations of their parents on their school performance and thus
might not be stressed specially by parental pressure. Further, secondary school students
spend most of their daytime at school (Anonymous, 2007; China Youth Social Service Center,
2008) and some even live in school dormitories. The lack of time at home and with their
parents may to some degree reduce the familial or parental influence on their stress level,
It is noteworthy that all of the top seven correlates of overall perceived educational
stress, except gender and age, are school or study-related (school location, school
connectedness, academic grades and emotional conflicts with teachers) or mainly occurred in
17
the school (peer emotional bullying), indicating schools or the education system may be
largely responsible for students’ stress and the family pressure may be only a secondary
concern. This emphasises the importance of new policies and school-based intervention
programs as these factors are to some extent preventable or controllable. For example, the
gap in educational resources and teaching style between urban and rural schools could be
diminished by increased investment to rural schools. Improvement of school facilities and
teaching resources may in turn promote school connectedness, which appears to be protective.
It is generally believed in China that heavier workload leads to more perceived stress.
Homework intensity has been used as an indicator of academic burden and related pressure in
many large-scale surveys (All-China Women's Federation, 2008; China Youth Social Service
Centre, 2008; Lei, et al., 2007; Zhao, et al., 2009). Interestingly, this study identified an
inverse association between homework hours and academic stress, especially the stress
arising from perceived workload. It seems that the more time students spend on homework,
the lighter the burden they perceived from workload. Students who have a positive attitude
towards homework or have a conducive home environment may be willing to spend more
time on this task and completion of the work may alleviate stress. These findings indicate
that homework hours per se might not be appropriate to serve as a reliable proxy measure ofr
study burden, at least among Chinese students. However, other workload measures,
including private tutoring and attending extra classes were positively associated with higher
levels of some aspects of educational stress. In contrast to homework hours, such extra work
is often determined by parents and some students may feel coerced to do so and thus may
become more stressed.
The identification of risk factors for perceived educational stress could provide
evidence for policy-making and assist the design of intervention programs. In recent years,
many official documents have been issued by the Ministry of Education and provincial
18
education departments calling for quality education and efforts to lighten the burden on
students (China Ministry of Education, 2009; Shandong Provincial Education Department,
2009). According to this study, such polices should include a special focus on rural schools
and female students should be the priority target group. Schools should pay more attention to
students’ physical and psychological development rather than solely on their academic grades.
Further efforts to prevent emotional and physical corporal punishments by teachers and peer
bullying could effectively reduce students’ academic stress.
This study has limitations. First, the information was collected relying on self-report
and thus some recall bias cannot be avoided. Second, the relationships between factors
cannot be interpreted causally because of the cross-sectional nature of this study. Third, the
sample was chosen conveniently and the findings cannot be generalised to the population,
although it should be noted that the demographic characters of our sample were similar to the
whole population of similar ages in Shandong province in terms of gender, ethnicity, and
family location (Shandong Provincial Bureau of Statistics, 2007). In addition, the factors
examined in this study only account for a modest proportion of the total variance in academic
stress scores, especially into factors that influence worry about grades and self-expectation
stress. Another important limitation is the lack of adequate theorising for some variables
included in this study, especially for individual factors such as health status, BMI and internet
use. The main reason to include them is that these factors have recently become a major
concern among young students in China (Lin, 2002; Zhang, Zhang, Jin, Han, & Ye, 2009).
Therefore findings regarding these factors may provide clues for more in-depth investigations.
Despite these limitations, this study for the first time comprehensively examined a
wide range of social risk factors for perceived academic stress with a large sample of Chinese
students and identified some important correlates. The findings should contribute to the
development of theory in this field and also suggest priority areas for mental health
19
promotion for adolescents in China. Future research should cover more factors for
educational stress and examine its influence on adolescents’ mental health and well-being, as
well as intervention strategies.
20
Table 1
Demographic Characters of the Sample (N = 1627)
Frequency (%) Frequency (%) Sex Father education a Male 890 (55.4) Junior high or lower 822 (53.4) Female 717 (44.6) Senior high or higher 718 (46.6) Age Mother education a 11-13 283 (17.5) Junior high or lower 979 (63.5) 14 243 (15.0) Senior high or higher 564 (36.5) 15 280 (17.3) Family income 16 254 (15.7) Low 157 (9.7) 17 309 (19.1) Middle 1138 (70.2) 18-20 246 (15.2) High 326 (20.1) Family location School location Urban 679 (42.0) Major city 451 (27.7) Rural 939 (58.0) County City 585 (36.0) Father occupation a Rural town 591 (36.3) Farming 575 (35.6) School year level Others 1039 (64.4) 7-9 (junior) 805 (49.5) Mother occupation a 10-12 (senior) 822 (50.5) Farming 657 (40.8) Others 955 (59.2) Note. The sample size for each category did not necessarily equal because of missing. Missing data were not presented in this table. a Reponses of “Don’t know” or “Not applicable” were treated as missing.
21
Table 2
Mean Scores (SDs) of ESSA Factors and Items (N = 1627)
Ms (SDs)
Junior school students (Years 7-9)
Senior school students (Years 10-12)
Total
Factor 1: Pressure from study 13.11 (4.09)** 14.91 (3.33) 14.02 (3.83)
I feel a lot of pressure in my daily studying 3.19 (1.29)** 3.64 (1.07) 3.42 (1.20)
There is too much competition among classmates which brings me a lot of academic pressure
3.35 (1.22)** 3.74 (1.06) 3.55 (1.16)
Future education and employment bring me a lot of academic pressure
3.54 (1.34)** 4.08 (1.03) 3.81 (1.22)
My parents care about my academic grades too much which brings me a lot of pressure
3.03 (1.33)** 3.46 (1.21) 3.25 (1.28)
Factor 2: Workload 9.11 (3.29)** 9.69 (2.57) 9.41 (2.96)
I feel there is too much homework 3.10 (1.38)* 3.26 (1.06) 3.18 (1.23)
I feel that there is too much school work 3.01 (1.29) 3.08 (1.10) 3.05 (1.20)
I feel that there are too many tests /exams in the school 2.99 (1.32)** 3.35 (1.13) 3.18 (1.24)
Factor 3: Worry about grades 11.60 (2.96)* 11.29 (2.60) 11.45 (2.79)
I feel that I have disappointed my teacher when my test/exam results are not ideal
3.77 (1.19)** 3.51 (1.07) 3.64 (1.14)
I feel that I have disappointed my parents when my test/exam results are poor
4.15 (1.05)* 4.25 (0.91) 4.20 (0.98)
Academic grade is very important to my future and even can determine my whole life
3.68 (1.40)* 3.54 (1.37) 3.61 (1.39)
Factor 4: Self-expectation 9.57 (2.65)** 10.02 (2.40) 9.79 (2.53)
I feel stressed when I do not live up to my own standards.
3.26 (1.16)** 3.50 (1.08) 3.38 (1.12)
When I fail to live up to my own expectations, I feel I am not good enough.
3.54 (1.07)** 3.80 (0.94) 3.67 (1.01)
I usually cannot sleep because of worry when I cannot meet the goals I set for myself.
2.76 (1.20) 2.73 (1.12) 2.74 (1.16)
Factor 5: Study despondency 8.51 (2.96)** 9.74 (2.59) 9.13 (2.85)
I always lack confidence with my academic scores 2.41 (1.26)** 2.86 (1.23) 2.64 (1.27)
I am very dissatisfied with my academic grades 3.20 (1.23)** 3.51 (1.19) 3.36 (1.22)
It is very difficult for me to concentrate during classes 2.91 (1.32)** 3.37 (1.12) 3.14 (1.24)
Total ESSA 51.90 (10.67)** 55.65 (8.73) 53.80 (9.91)
Note. M = mean; SD = standard deviation; ESSA = Academic Stress Scale for Adolescents. * p < .05;** p < .01 (Independent sample t-test for differences between junior and senior school students)
22
Table 3
Bivariate Correlation Coefficients between Study Factors and ESSA Scores (N = 1627) a
Value or M (SD) b Pressure from study
Work-load
Worry about grades
Self-expecta-
tion
Despon-dency
Total ESSA
Demographics Sex (1=male, 2=female) .03 -.02 .06* .07** .01 .04 Age 15.47 (1.85) .30** .15** -.05* .11** .27** .25** Family location 1=urban, 2=rural .15** .06* .15** .10** .06* .16** Family income 1=low, 2=middle, 3=high -.11** .01 -.04 -.03 -.12** -.10** Father occupation 0=others, 1=farming .11** .05 .12** .03 .05 .11** Mother occupation 0=others, 1=farming .12** .04 .12** .04 .04 .12** Father education 0=high, 1=low .07** .01 .06* .00 .06* .07** Mother education 0=high, 1=low .07** .00 .04 -.02 .06* .05* School location 1=major city, 2=county
city, 3=rural .14** .09** .19** .11** .02 .18**
School year 1-6 indicates grades 7-12 .27** .14** -.12** .09** .27** .23** Individual factors
Self-efficacy 26.91 (5.95) -.26** -.13** -.01 -.06* -.28** -.24** BMI 19.88 (3.72) .02 .01 -.04 -.04 .05 .00 Health status 1=poor, 2=medium,
3=good -.17** -.12** -.01 -.08** -.21** -.19**
Physical exercise 0=no, 1=yes -.12** -.11** -.05* -.06* -.10** -.14** Internet use 0=no, 1=yes .08** .14** -.11** -.03 .13** .07** Video games 0=no, 1=yes -.02 .09** -.11** -.10** .08** -.01
Parenting and family Father care 11.44 (2.57) -.25** -.19** .09** .02 -.30** -.21** Mother care 12.18 (2.33) -.19** -.17** .11** .02 -.23** -.15** Father control 5.08 (2.79) .22** .18** .02 .06* .20** .22** Mother control 5.35 (2.86) .26** .24** .00 .02 .22** .24** Family connectedness 3.79 (0.68) -.23** -.22** .13** .02 -.30** -.20** Quarrels with parents 0=no, 1=yes .20** .16** -.08** .06* .22** .18** Parents’ emotional punishments
0=no, 1=yes .17** .13** -.06* .02 .19** .15**
Parents’ physicals punishments
0=no, 1=yes .08** .06* -.07** -.03 .07** .04
School and study School connectedness 14.25 (4.11) -.30** -.44** .13** -.05* -.36** -.33** Quarrels with teachers 0=no, 1=yes .08** .13** -.08** .03 .15** .10** Teachers’ emotional punishments
0=no, 1=yes .19** .26** -.03 .02 .19** .20**
Teachers’ physical punishments
0=no, 1=yes .12** .26** -.06* -.07** .13** .13**
Perceived academic grades
1=poor, 2=medium, 3=good
-.12** -.14** .06* .03 -.39** -.19**
Homework hours 1=less than 1 hr, 2=1-2 hrs, 3=more than 2 hrs
-.08** -.18** .03 -.04 -.09** -.12**
Tutor 0=no, 1=yes .03 .07** .00 .02 .11** .07** Extra classes 0=no, 1=yes .01 .00 .04 .00 -.02 .01
Peer relationships Peer popularity 1=low, 2=middle, 3=high -.11** -.04 .02 -.01 -.15** -.09** Social isolation 0=no, 1=yes .05* .07** .02 .02 .11** .08** Girl/Boy-friend 0=no, 1=yes .16** .19** -.08** .04 .19** .16** Quarrels with peers 0=no, 1=yes .15** .14** .06* .04 .11** .16** Peer physical fighting 0=no, 1=yes .08** .13** -.02 -.01 .12** .10** Peer emotional bullying 0=no, 1=yes .19** .14** .04 .11** .21** .21** Peer physical bullying 0=no, 1=yes .09** .11** .00 .04 .08** .10**
Note. M = mean; SD = standard deviation; ESSA = Academic Stress Scale for Adolescents; BMI = Body Mass Index. a Pearson’s r for continuous factors; Point-biserial correlation coefficients for dichotomous factors, and
Spearman correlation for categorical variables with more than two levels b value and coding for categorical variables and M (SD) for continuous variables * p < .05;** p < .01 for correlation coefficients
23
Table 4
Standardised Regression Coefficients (β) in Multiple Regressions for Academic Stress Scores (N = 1627)
Independent variables Pressure from study
Work-load
Worry about grades
Self-expecta-
tion
Despon-dency
Total ESSA
Demographics Sex (female) .09** .08** .03 .04 .10** .11** Age group (high) .22** -.05 -.02 .09 .07 .11*
Family location (rural) .03 .01 .13** .06 .02 .07*
Family income (high) .02 .09** -.04 .02 .01 .03 Father occupation (farming) -.01 .07 .04 -.02 -.02 .01 Mother occupation (farming) .05 -.02 -.04 -.05 .05 .00 Father education (low) .03 .00 .03 .02 .01 .03 Mother education (low) -.02 .00 -.04 -.05 .02 -.03 School location (rural) .12 ** .07* .08* .15** .06* .15 ** School level (senior) .04 .10* -.01 .02 .09* .07
Individual factors Self-efficacy (high) -.11 ** .02 -.01 .00 -.09** -.06* Health status (good) -.02 -.07** -.04 -.01 -.06** -.06* Physical exercise (yes) -.03 -.06* -.04 -.04 .00 -.05*
Internet use (yes) .07* .07* .03 .05 .05 .08**
Video games (yes) -.03 .01 -.03 -.09** .03 -.03 Parenting and family
Father care (high) -.06 .00 -.02 .07 -.09** -.04 Mother care (high) .03 -.01 .08* -.03 .04 .03 Father control (high) .05 .02 .03 .08* .04 .07*
Mother control (high) .10** .11** .03 -.05 .05 .08*
Family connectedness (high) .00 -.01 .07* .03 -.06* .01 Quarrels with parents (high) .07* .02 -.03 .05 .05 .05 Parents’ emotional punishments (yes) .02 -.01 .02 .01 .01 .02 Parents’ physicals punishments (yes) .02 -.01 -.03 -.04 -.01 -.01
School and study School connectedness (high) -.08** -.29 ** .11** -.02 -.13** -.13 ** Quarrels with teachers (yes) -.03 -.04 -.03 .03 .00 -.03 Teachers’ emotional punishments (yes) .08** .06* .05 .07* .05* .10** Teachers’ physical punishments (yes) .00 .11** -.05 -.12 ** -.01 -.02 Perceived academic grades (high) -.06* -.11** .02 .03 -.32 ** -.13 ** Homework hours (high) .01 -.07** .00 -.01 .02 -.01 Tutor (yes) .00 .04 .03 .02 .07** .04 Extra classes (yes) .09** .02 .05 .03 .01 .07*
Peer relationships Peer popularity (high) .00 .07* .02 .02 .01 .04 Social isolation (yes) .00 .01 .04 .01 .03 .03 Girl/Boy-friend (yes) .02 .03 -.03 -.01 .03 .01 Quarrels with peers (yes) .05* .03 .09** .02 -.01 .06*
Peer physical fighting (yes) .02 -.02 -.01 .00 .04 .01 Peer emotional bullying (yes) .06* .01 .06 .12 ** .07** .09** Peer physical bullying (yes) .07* .06* .00 .03 .02 .06*
Note. ESSA = Academic Stress Scale for Adolescents. The sample size for each regression was not necessarily identical due to missing. * p < .05;** p < .01 (t-test for multiple regression coefficients)
24
Acknowledgements
This study was sponsored by a Research Development Grant of Queensland
University of Technology (QUT) and a QUT Grant-in-Aid. This work also gained in-kind
support of Shandong Provincial CDC and Shouguang CDC. The authors thank all
participating students and schools.
25
References
All-China Women's Federation. (2008). National juvenile family education status sampling
survey report. Retrieved from http://www.women.org.cn/allnews/02/1986.html
Ang, R. P., & Huan, V. S. (2006). Academic Expectations Stress Inventory : Development,
factor analysis, reliability, and validity. Educational and Psychological Measurement,
66, 522-539. doi: 10.1177/0013164405282461
Ang, R. P., Huan, V. S., & Braman, O. R. (2007). Factorial structure and invariance of the
Academic Expectations Stress Inventory across Hispanic and Chinese adolescent
samples. Child Psychiatry & Human Development, 38, 73-87. doi: 10.1007/s10578-
006-0044-3
Anonymous. (2007). China's children too busy for playtime. Xinhua News. Retrieved from
http://www.chinadaily.com.cn/china/2007-05/13/content_871182.htm. Retrieved on:
25 Apr 2010.
Bao, C. (2006). Policies for compulsory education disparity between urban and rural areas in
China. Frontiers of Education in China, 1, 40-55.
Beijing Evening. (2010). Survey among Chinese, Japanese, Korean, and American high
school students shows that Chinese students experience the highest academic pressure.
Research in Educational Development(7), 21.
Bhatia, S. K., & Bhatia, S. C. (2007). Childhood and adolescent depression. American Family
Physician, 75(1), 73-80.
Bjorkman, S. M. (2007). Relationships among academic stress, social support, and
internalizing and externalizing behavior in adolescence. (Unpublished Ph.D’s thesis).
Northern Illinois University, Illinois, United States.
Bronfenbrenner, U. (1979). The ecology of human development: Experiments by nature and
design: Cambridge, MA: Harvard University Press. (ISBN 0-674-22457-4)
26
Brown, S. L., Teufel, J. A., Birch, D. A., & Kancherla, V. (2006). Gender, age, and behavior
differences in early adolescent worry. Journal of School Health, 76, 430-437. doi:
10.1111/j.1746-1561.2006.00137.x
Chen, S., & Lu, L. (2009). After-school time use in Taiwan: Effects on educational
achievement and well-being. Adolescence, 44(176), 891.
China Ministry of Education. (2009). Ministry of Education Guidelines about Regulating
Current Administration and Management of Secondary and Primary Schools (Jiao Ji
Yi [2009] #7). Retrieved from
http://www.moe.edu.cn/edoas/website18/06/info1240564452754206.htm. Retrieved
on: 16 Jul 2010.
China Youth Social Service Center. (2008). 2007 China national juvenile internet use survey
report. Retrieved from http://news.qq.com/a/20081020/001953.htm
Christie, E., & MacMullin, C. (1998). What do children worry about? Australian Journal of
Guidance and Counselling, 8, 9-24.
Chua, A. (2011). Why Chinese Mothers Are Superior. The Wall Street Journal (8 Jan 2011). .
Retrieved from
http://online.wsj.com/article/SB10001424052748704111504576059713528698754.ht
ml. Retrieved on: 20 Feb 2011.
Coney, Y., & West, C. K. (1979). Academic pressures and the Black adolescent.
Contemporary Educational Psychology, 4(4), 318-323.
Crystal, D. S., Chen, C., Fuligni, A. J., Stevenson, H. W., Hsu, C.C., Ko, H.J., … Kimura, S.
(1994). Psychological maladjustment and academic achievement: A cross-cultural
study of Japanese, Chinese, and American high school students. Child Development,
65, 738-753. doi: 10.1111/j.1467-8624.1994.tb00780.x
27
Dodds, J., & Lin, C.-d. (1993). Chinese teenagers' concerns about the future: A cross-national
comparison. JAMA: Journal of the American Medical Association, 269(11), 1378.
Gallagher, M., & Millar, R. (1996). A survey of adolescent worry in Northern Ireland.
Pastoral Care in Education, 14, 26-32. doi: 10.1080/02643949609470963
Greenberger, E., Chen, C. S., Tally, S. R., & Dong, Q. (2000). Family, peer, and individual
correlates of depressive symptomatology among US and Chinese adolescents. Journal
of Consulting and Clinical Psychology, 68(2), 209-219.
Hall-Lande, J. A., Eisenberg, M. E., Christenson, S. L., & Neumark-Sztainer, D. (2007).
Social isolation, psychological health, and protective factors in adolescence.
Adolescence, 42(166), 265.
Hesketh, T., Zhen, Y., Lu, L., Dong, Z. X., Jun, Y. X., & Xing, Z. W. (2010). Stress and
psychosomatic symptoms in Chinese school children: cross-sectional survey.
Archives of Disease in Childhood, 95(2), 136-140. doi: 10.1136/adc.2009.171660
Huan, V. S., See, Y. L., Ang, R. P., & Har, C. W. (2008). The impact of adolescent concerns
on their academic stress. Educational Review, 60, 169-178. doi:
10.1080/00131910801934045
Jia, N. (2010). "Comparison study on academic study among Chinese, Japanese, Korean, and
American high school students" has been published. Xinhua News. Retrieved from
http://www.gov.cn/jrzg/2010-04/08/content_1576477.htm. Retrieved on: May 22,
2010.
Johnson, J. V., & Hall, E. M. (1988). Job strain, work place social support, and
cardiovascular disease: a cross-sectional study of a random sample of the Swedish
working population. American journal of public health, 78(10), 1336-1342.
Jones, R. W., & Hattie, J. A. (1991). Academic Stress amongst Adolescents: An Examination
by Ethnicity, Grade, and Sex. Paper presented at the Paper presented at the Annual
28
Conference of the New England Educational Research Organization (Portsmouth, NH,
April 24-26, 1991). Retrieved from
http://gateway.library.qut.edu.au/login?url=http://search.ebscohost.com/login.aspx?dir
ect=true&db=eric&AN=ED336668&site=ehost-live
Lazarus, R., & Folkman, S. (1984). Stress, appraisal, and coping. New York: Springer
Publishing Company.
Lee, M., & Larson, R. (2000). The Korean 'examination hell': Long hours of studying,
distress, and depression. Journal of Youth and Adolescence, 29, 249-271. doi:
10.1023/A:1005160717081
Lei, L., Sun, H., Li, D., Guo, F., & Zhang, G. (2007). Comparison study on life
consciousness between Chinese, Japanese, Korean, and American high school
students. China Youth Study, 7, 1-7.
Li, J.-h., Feng, X.-l., Mei, S.-l., & Yao, D.-l. (2007). Investigation of Study Pressure Effects
on Mental Health of Junior High School Students in Changchun. Medicne and Society,
20(2), 56-57.
Lin, J., & Chen, Q. (1995). Academic pressure and impact on students' development in China.
McGill Journal of Education, 30, 149-168.
Lin, X.-h. (2002). A Brief Introduction to Internet Addiction Disorder. Chinese Journal of
Clinical Psychology, 10(1), 74-76, 80.
Lu, H.D. (2008). Focus on learning stress of Chinese children: The puzzledom and the way
out. Journal of Northeast Normal University (Philosophy and Social Sciences), 6, 24-
28.
Meijer, J. (2007) Correlates of stress in secondary education. Educational Research, 49(1),
21-35.
29
Mervis, J. (2010). Shanghai students world champs on science, math, reading test. Science
News, 7 December 2010. Retrieved from
http://news.sciencemag.org/scienceinsider/2010/12/shanghai-students-world-
champs.html. Retrieved on: 10 Jan 2011.
Moshe, Z. (1992). Sources of academic stress: the case of first year Jewish and Arab college
students in Israel (Vol. 24).
OECD. (2010). Strong performers and successful reformers in education: Lessons from PISA
for the United States. Retrieved from
http://www.oecd.org/dataoecd/32/50/46623978.pdf. Retrieved on: 18 Dec 2010.
doi:10.1787/9789264096660-en
Owen-Yeates, A. (2005). Stress in year 11 students. Pastoral Care in Education, 23(4), 42-51.
Pedersen, W. (1994). Parental relations, mental health, and delinquency in adolescents.
Adolescence, 29(116), 975-975.
Putwain, D. (2007). Researching academic stress and anxiety in students: some
methodological considerations. British Educational Research Journal, 33(2), 207 - 219.
Putwain, D.W. (2009) Assessment and examination stress in Key Stage 4. British Educational
Research Journal, 35(3), 391-411.
Resnick, M. D., Bearman, P. S., Blum, R. W., Bauman, K. E., Harris, K. M., Jones, J., et al.
(1997). Protecting adolescents from harm: Findings from the National Longitudinal
Study on Adolescent Health. JAMA: Journal of the American Medical Association,
278(10), 823-832.
Schwarzer, R., & Jerusalem, M. (1995). Generalized Self-Efficacy scale. In J. Weinman, S.
Wright & M. Johnston (Eds.), Measures in health psychology: A user's portfolio.
Causal and control beliefs (pp. 35-37). Windsor, England: NFER-NELSON.
30
Shandong Provincial Bureau of Statistics. (2007). 2007 Shandong Statistical Yearbook (Vol.
Chapter One: Administrative Division and Natural Resources): China Statistics Press
Shandong Provincial Education Department. (2009). Guidelines on Improvement of Teacher
Virtues and Regulation of Teaching Behaviour in General Secondary and Primary
Schools (Lu Jiao Ji Zi [2009} #20). Retrieved from
http://www.sdpec.edu.cn/sdedu_zxwj/200912/t20091211_61919.htm. Retrieved on:
16 Jul 2010.
Sun, J., Dunne, M. P., Hou, X.-y., & Xu, A.-q. (2011). Educational Stress Scale for
Adolescents: Development, Validity, and Reliability with Chinese Students In press.
Tang, N. Y. Y., & Westwood, P. (2007). Worry, general self-efficacy and school
achievement: An exploratory study with Chinese adolescents. Australian Journal of
Guidance and Counselling, 17, 68-80. doi: 10.1375/ajgc.17.1.68
Van der Doef, M., & Maes, S. (1999). The Job Demand-Control (-Support) Model and
psychological well-being: A review of 20 years of empirical research. Work & Stress,
13(2), 87-114.
Xie, L.N. (2007). Study on Learning Stress, Social Support and their relationship among
Senior High School Students: An Investigation of Two Senior High Schools in
Hennan Province. Unpublished Master Thesis, Huadong Normal University.
Yang, S., & Shin, C. S. (2008). Parental attitudes towards education: What matters for
children's well-being? Children and Youth Services Review, 30(11), 1328-1335. doi:
10.1016/j.childyouth.2008.03.015
Zhang, J. X., & Schwarzer, R. (1995). Measuring optimistic self-beliefs - A Chinese
adaptation of the General Self-Efficacy Scale. [Article]. Psychologia, 38(3), 174-181.

31
Zhang, L., Zhang, Z.., Jin, Y.., Han, H., & Ye, D.. (2009). Correlation Study on Internet
Addiction and Depression among Middle School Students. Chinese Journal Of School
Health, 30(5), 394-395, 398..
Zhao, L.X., & Yuan, L. (2006). Investigation on the current status of acadmic stress among
secondary school students. Journal of Tianjin Academy of Educational Science(2),
18-21,67.
Zhao, X., Zhu, S., & Ma, G. (2009). Comparison study on basic rights between Chinese,
Japanese, Korean, and American high school students. China Youth Study, 6, 1-7.
Zhou, Q., Wang, Y., Deng, X., Eisenberg, N., Wolchik, S. A., & Tein, J.-Y. (2008). Relations
of Parenting and Temperament to Chinese Children’s Experience of Negative Life
Events, Coping Efficacy, and Externalizing Problems. Child Development, 79(3),
493-513. doi: 10.1111/j.1467-8624.2008.01139.x