Embed Size (px)
Citation preview
Has ASEAN Regional Cooperation changed its concentration of trade with APEC?
1
Dr. Marissa Maricosa A. PaderonAssistant Professor
Ateneo de Manila University
Outline
2
Overview of ASEAN and regional cooperation ASEAN and APEC
Intra-regional Trade Bilateral ASEAN-APEC Trade
Trade concentration between ASEAN and APEC: 1995-2013 Trade Entropy Index Bilateral Concentration Indices Bilateral Trade Intensity Index
Conclusions

•ASEAN from 1967 – 1975•PTA in 1976•Asian Financial Crisis and ASEAN: 1997-
98•ASEAN Economic Community in 2015
Overview of ASEAN and Regional Cooperation
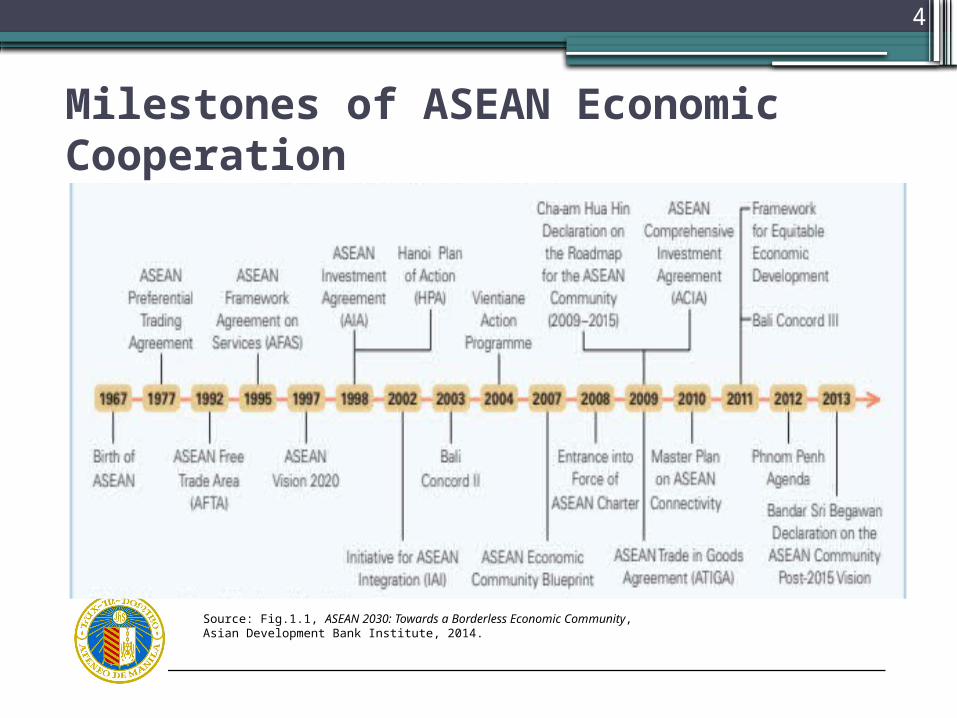
Milestones of ASEAN Economic Cooperation
4
Source: Fig.1.1, ASEAN 2030: Towards a Borderless Economic Community, Asian Development Bank Institute, 2014.
•ASEAN Regional Forum (1994): peace & security
•ASEAN + 3: economic cooperation•ASEAN +1 FTAs: bilateral agreements
▫ China (ACFTA in 2002)▫ Japan (AJCEPA in 2003)▫Republic of Korea (AKFTA in 2005)▫Australia and New Zealand (AANZFTA in
2009)▫India (AIFTA in 2009)
•East Asia Summit (2005): dialogue & partnerships
ASEAN ‘centrality’ in regional cooperation

ASEAN centrality in interregional groups
6
Source: Fig.5.1, ASEAN 2030: Towards a Borderless Economic Community, Asian Development Bank Institute, 2014.

ASEAN centrality in trans-regional groupings
7
Source: Fig.5.1, ASEAN 2030: Towards a Borderless Economic Community, Asian Development Bank Institute, 2014.

ASEAN in Intra-regional trade
8
Brune
i
Cambo
dia
Indo
nesia
Lao D
PR
Mal
aysia
Mya
nmar
Philip
pine
s
Singa
pore
Thaila
nd
Vietn
am
0.05.0
10.015.020.025.030.035.040.045.050.0
Figure 3a. The Share of ASEAN members in Intra-regional Trade (%): 1995-2013
1995 2000 2005 2010 2013

APEC in Intra-regional Trade
9
Austral
ia
Brune
i
Canad
a
Chile
China
Hong
Kong
Indo
nesia
Japa
n
Korea
Mal
aysia
Mex
ico
New Z
eala
nd
Papua
New
Gui
nea
Peru
Philip
pine
s
Russia
Singa
pore
Taipe
i
Thaila
ndUSA
Vietn
am
0.0
5.0
10.0
15.0
20.0
25.0
30.0
19952005
2013
Figure3b. The Share of APEC economies in Intra-regional Trade (%)
1995 2000 2005 2010 2013
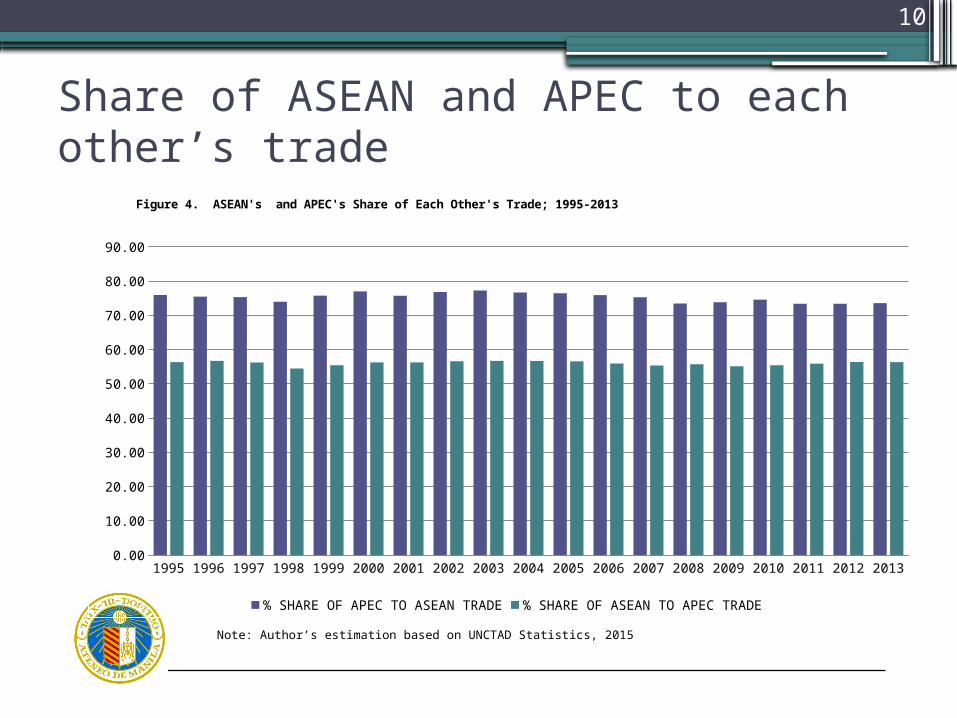
Share of ASEAN and APEC to each other’s trade
10
1995 1996 1997 1998 1999 2000 2001 2002 2003 2004 2005 2006 2007 2008 2009 2010 2011 2012 20130.00
10.00
20.00
30.00
40.00
50.00
60.00
70.00
80.00
90.00
Figure 4. ASEAN's and APEC's Share of Each Other's Trade; 1995-2013
% SHARE OF APEC TO ASEAN TRADE % SHARE OF ASEAN TO APEC TRADE
Note: Author’s estimation based on UNCTAD Statistics, 2015

APEC is a major regional market for ASEAN exports
11
1995
1996
1997
1998
1999
2000
2001
2002
2003
2004
2005
2006
2007
2008
2009
2010
2011
2012
2013
-
200,000,000.00
400,000,000.00
600,000,000.00
800,000,000.00
1,000,000,000.00
1,200,000,000.00
1,400,000,000.00
1,600,000,000.00
1,800,000,000.00
2,000,000,000.00
Fig. 5a. Geographical breakdown of ASEAN Exports: 1995-2013
USA Japan China EU (28) Intra-ASEAN APEC
Source: UNCTAD Statistics, 2015
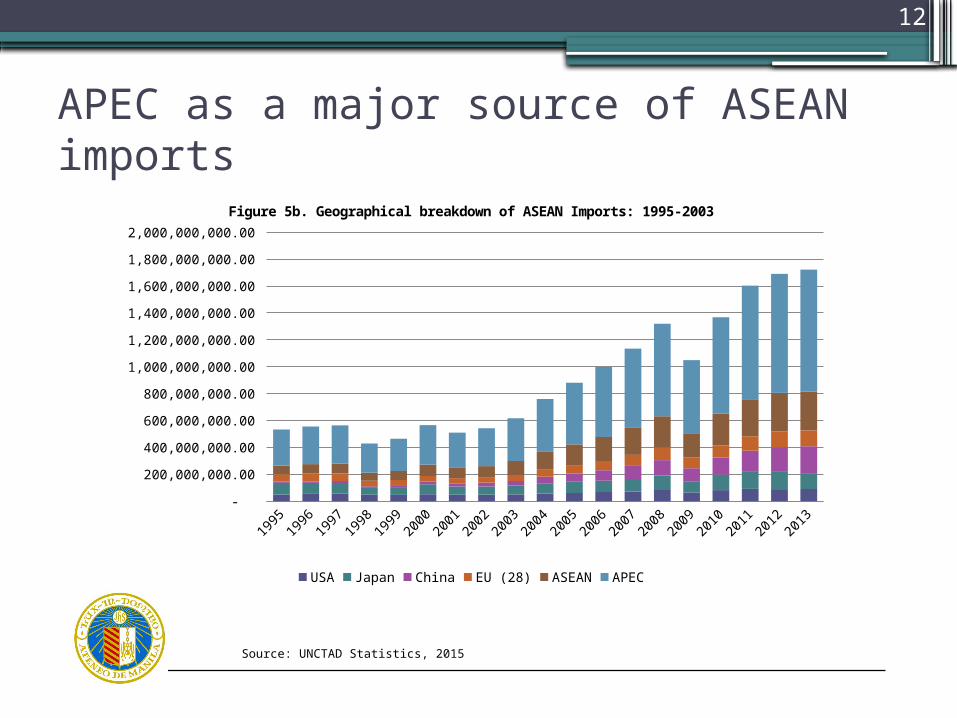
APEC as a major source of ASEAN imports
12
1995
1996
1997
1998
1999
2000
2001
2002
2003
2004
2005
2006
2007
2008
2009
2010
2011
2012
2013
-
200,000,000.00
400,000,000.00
600,000,000.00
800,000,000.00
1,000,000,000.00
1,200,000,000.00
1,400,000,000.00
1,600,000,000.00
1,800,000,000.00
2,000,000,000.00
Figure 5b. Geographical breakdown of ASEAN Imports: 1995-2003
USA Japan China EU (28) ASEAN APEC
Source: UNCTAD Statistics, 2015
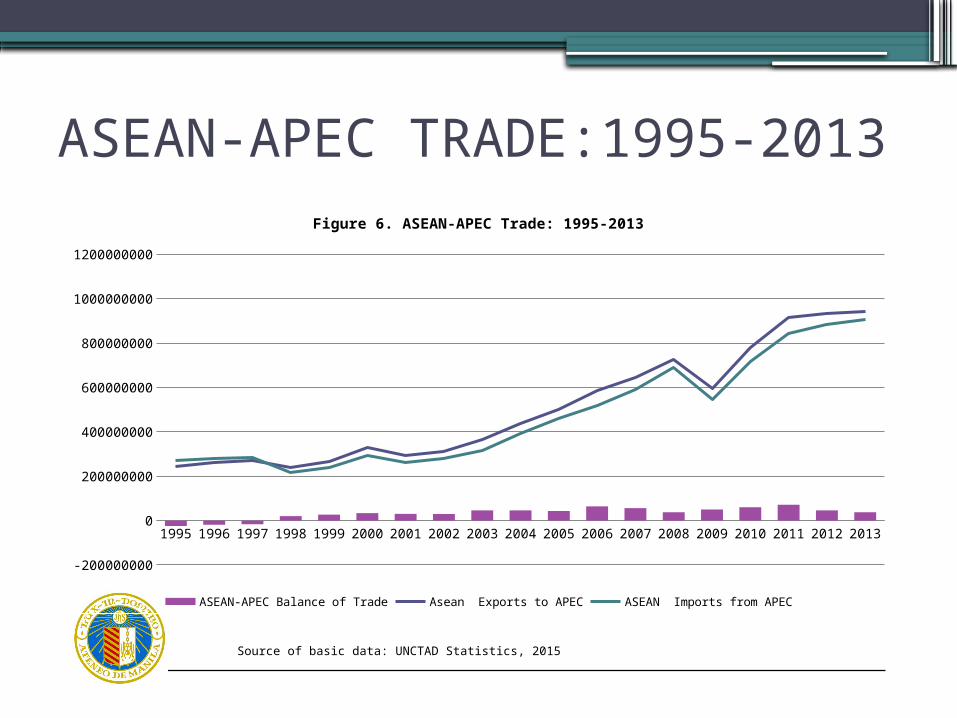
ASEAN-APEC TRADE:1995-2013
1995 1996 1997 1998 1999 2000 2001 2002 2003 2004 2005 2006 2007 2008 2009 2010 2011 2012 2013
-200000000
0
200000000
400000000
600000000
800000000
1000000000
1200000000
Figure 6. ASEAN-APEC Trade: 1995-2013
ASEAN-APEC Balance of Trade Asean Exports to APEC ASEAN Imports from APEC
Source of basic data: UNCTAD Statistics, 2015

Top APEC economies trading partners of ASEAN: 2013
•Exports ▫China (12.1%)▫ Japan (9.7%)▫USA (9.1%)▫Hong Kong (6.4%)▫Malaysia (6.4%)▫Singapore (5.3%)▫ Indonesia (5.2%)▫Korea (4.2%)▫Thailand (3.1%)▫Vietnam ▫Philippines (1.5%)
• Imports▫China (16.5%)▫Japan (9.1%)▫USA (7.3%)▫Singapore (6.8%)▫Korea (6.3%)▫Malaysia (5.9%)▫Chinese Taipei (5.1%)▫Thailand (4.1%)▫Australia (1.8%)▫Vietnam (1.5%)
14
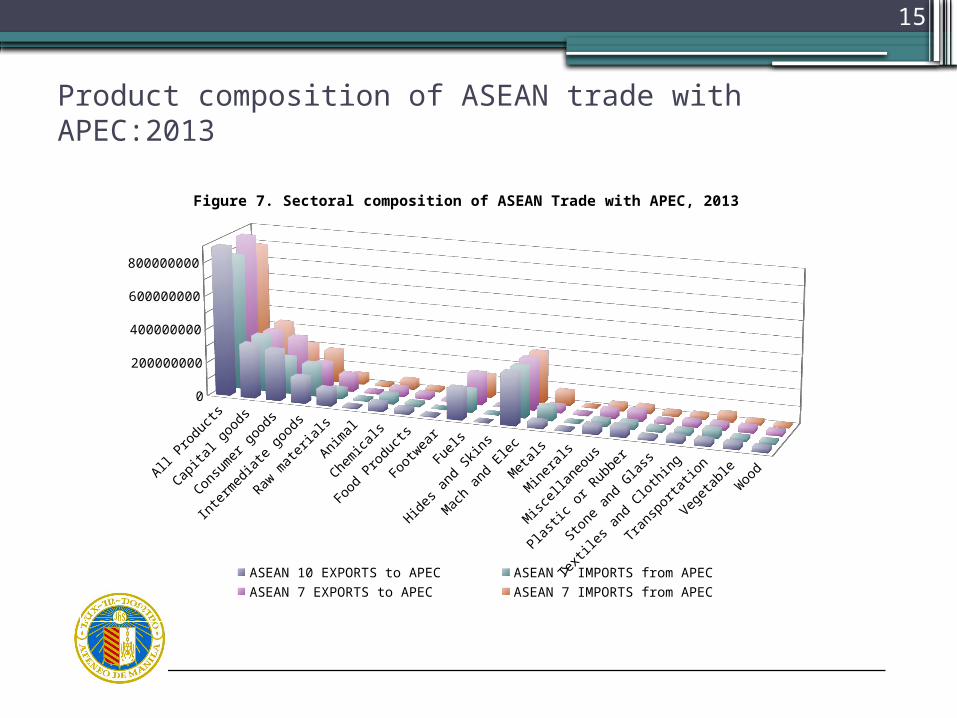
Product composition of ASEAN trade with APEC:2013
15
All
Produ
cts
Capita
l goo
ds
Consu
mer
goo
ds
Inte
rmed
iate
goo
ds
Raw m
ater
ials
Anim
al
Chem
ical
s
Food
Produ
cts
Footw
ear
Fuels
Hides
and
Ski
ns
Mac
h an
d Ele
c
Met
als
Min
eral
s
Misc
ella
neou
s
Plast
ic o
r Rub
ber
Stone
and
Gla
ss
Textil
es a
nd C
loth
ing
Trans
porta
tion
Veget
able
Woo
d
0
100000000
200000000
300000000
400000000
500000000
600000000
700000000
800000000
900000000
Figure 7. Sectoral composition of ASEAN Trade with APEC, 2013
ASEAN 10 EXPORTS to APEC ASEAN 7 IMPORTS from APEC ASEAN 7 EXPORTS to APEC ASEAN 7 IMPORTS from APEC
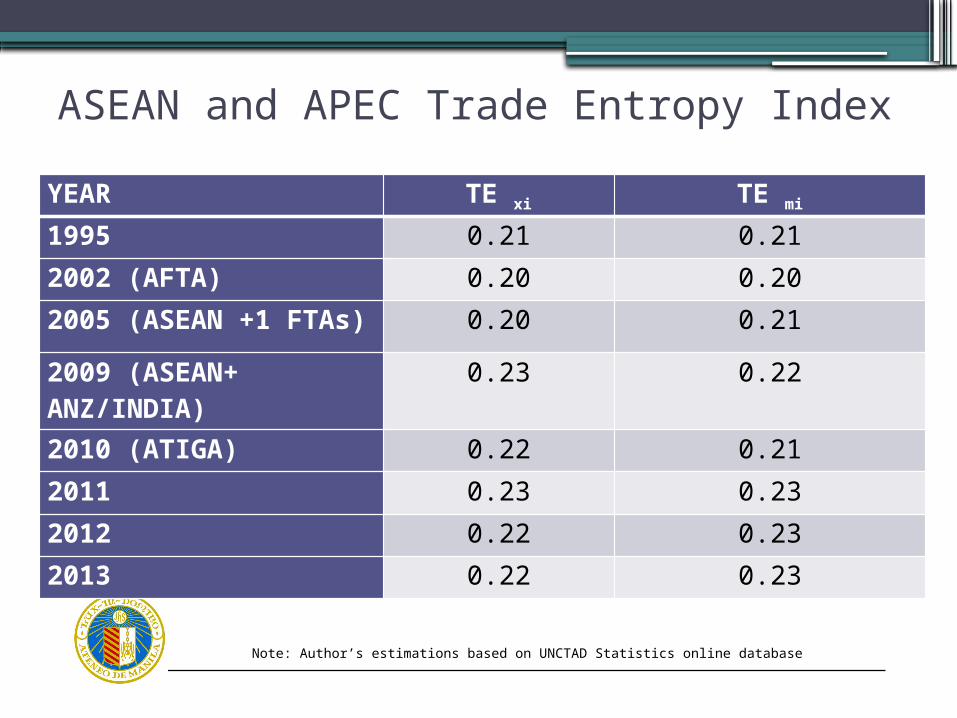
YEAR TE xi TE mi
1995 0.21 0.21
2002 (AFTA) 0.20 0.20
2005 (ASEAN +1 FTAs)
0.20 0.21
2009 (ASEAN+ ANZ/INDIA)
0.23 0.22
2010 (ATIGA) 0.22 0.21
2011 0.23 0.23
2012 0.22 0.23
2013 0.22 0.23
ASEAN and APEC Trade Entropy Index
Note: Author’s estimations based on UNCTAD Statistics online database

ASEAN bilateral concentration index with APEC:1995-2012
17
1995 1996 1997 1998 1999 2000 2001 2002 2003 2004 2005 2006 2007 2008 2009 2010 2011 20120.00
0.05
0.10
0.15
0.20
0.25
Figure 9. Normalized Herfindahl indices of ASEAN with APEC Trade: 1995-2012
Normalized Herfindahl (export) Normalized Herfindahl (import)
Source: UNCTAD Trade Statistics online database

Bilateral trade intensity index
18
YEAR Bilateral Trade Intensity Index
1995 1.66
2002 (AFTA) 1.67
2005 (ASEAN +1 FTAs) 1.72
2009 (ASEAN+ ANZ/INDIA)
1.62
2010 (ATIGA) 1.56
2011 1.58
2012 1.56
2013 1.57Note: Author’s estimations based on UNCTAD Statistics online database.
Trends in ASEAN Exports to APEC
1995-2002 2002-2005 2005-2009 2009-2010 2010-2011 2011-2012 2012-2013
-50.0
0.0
50.0
100.0
150.0
200.0
250.0
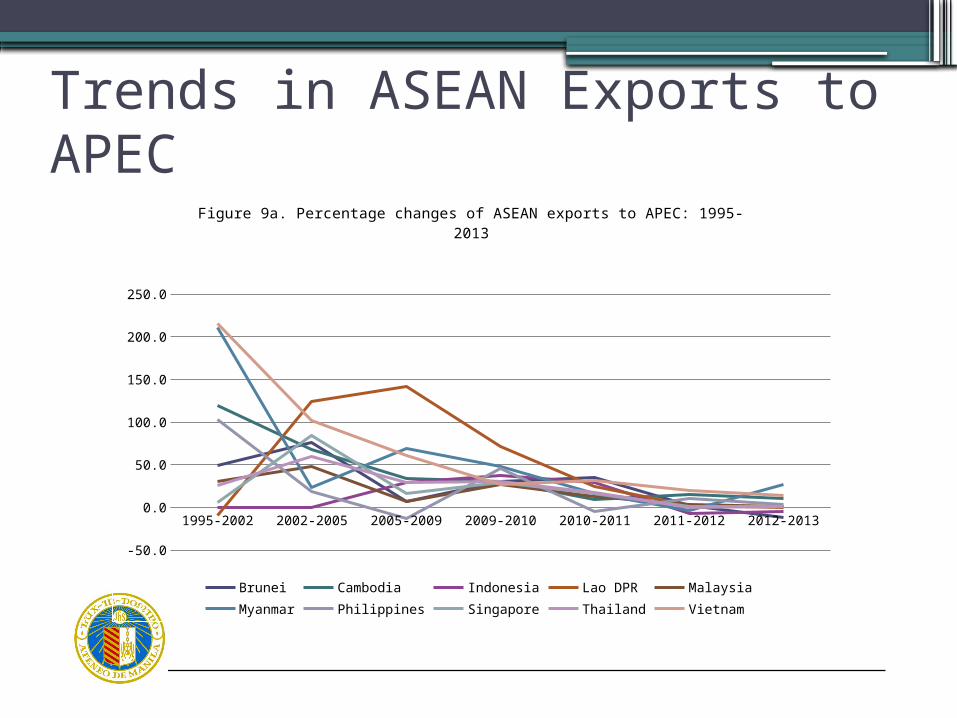
Figure 9a. Percentage changes of ASEAN exports to APEC: 1995-2013
Brunei Cambodia Indonesia Lao DPR MalaysiaMyanmar Philippines Singapore Thailand Vietnam

Trends in ASEAN Imports from APEC
20
1995-2002 2002-2005 2005-2009 2009-2010 2010-2011 2011-2012 2012-2013
-50.0
0.0
50.0
100.0
150.0
200.0
Figure 9b. Percentage changes of ASEAN imports from APEC: 1995-2013
Brunei Cambodia Indonesia Lao DPR Malaysia Myanmar Philippines
Singapore Thailand Vietnam

•ASEAN trade with APEC more concentrated across the years of regional cooperation. ▫trading of ASEAN is restricted only to a
small number of APEC economies as evidenced by the almost constant low values of trade entropy indices for exports and imports.
Conclusions

• Normalized Herfindahl-Hirschmann Index:▫Exports of ASEAN with APEC were concentrated
in a few products or export sectors revealed by higher indices on export side from 1995 until 2000 .
▫Concentration level shifted to higher indices of import side from 2001 to 2003; and tapered off onwards at almost the same values with those of export side. As ASEAN integrates internally with its members
and externally with bilateral partners in East Asia (ASEAN +1 FTAs), ASEAN’s trade with APEC was becoming dispersive rather than less concentrated in a few sectors.
•Bilateral trade intensity index:▫bilateral ASEAN-APEC trade is intensive
from 1995 to 2005 (ASEAN established ASEAN+1 FTAs).
▫bilateral trade indices remained greater than ‘1’ meaning bilateral trade intensity was greater than expected but at a declining trend may imply that ASEAN might have traded
more intensively with other countries than APEC economies.

• Exports of ASEAN APEC generally positive but at a decreasing rate, meaning ASEAN export products are destined to markets other than APEC economies, a trade diversion effect.▫ Intra-ASEAN trade grew by 27% in 2000; 32% in
2010 after the CEPT fast track program and the ATIGA, respectively, indicating trade creation effects of ASEAN integration.
▫ Yet, APEC remains a major market destination of ASEAN exports as evidenced by high country concentration of exports to APEC. APEC’s share to ASEAN exports accounted for an annual average of 74.3% of total ASEAN exports from 1995 to 2013.

• More dynamic import trading relation between APEC & non-APEC economies Lao PDR, Myanmar and Cambodia
• Imports of ASEAN to APEC generally rising until 2005 (AFTA fully implemented), while share of APEC to ASEAN imports slowed a bit in same period.
• After ATIGA implementation in 2010, imports of ASEAN to APEC dropped by 25% from 45% in 2009 (mainly due to the US Financial Crisis). It recovered in 2010 but slowed down onwards. Share of APEC’s to ASEAN’s total imports stood at 82%▫ indicating APEC’s exports highly depend on the
changes in the demand of the ASEAN market and shocks affecting imports and supply of exports.
•The above findings suggest that effects of ASEAN regional cooperation on trade concentration with APEC seem restrictive to a few APEC economies but trade has been dispersive in sectors.

Thank you