Embed Size (px)
Citation preview
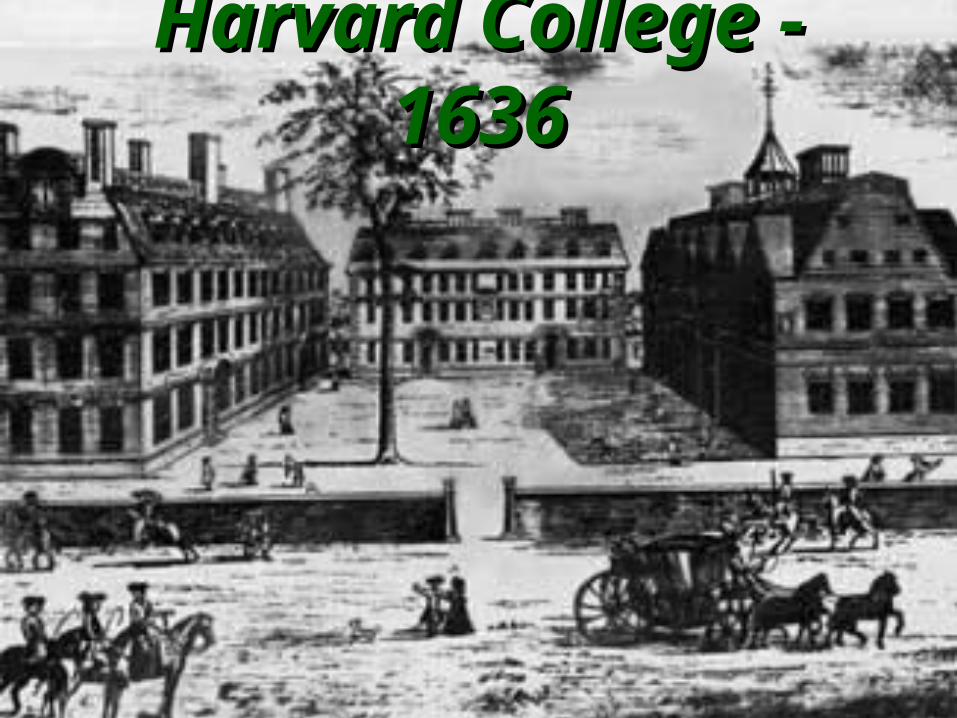
Harvard College - 1636Harvard College - 1636

Harvard University which began in 1636 was the first American College. Harvard also stared the first financial aid system. Harvard had established a student loan program by 1840 and…
had the best-funded scholarship program by 1878.
http://www.chessconsulting.org/financialaid/profession.htm


Thomas Jefferson always has played a prominent role at Mizzou. Founded in 1839, MU was the first public university west of the Mississippi River. The legislative act that created MU more than 160 years ago incorporated some of Jefferson's ideas on higher education. Francis Quadrangle reflects Jefferson's design for the University of Virginia.
1862 1862
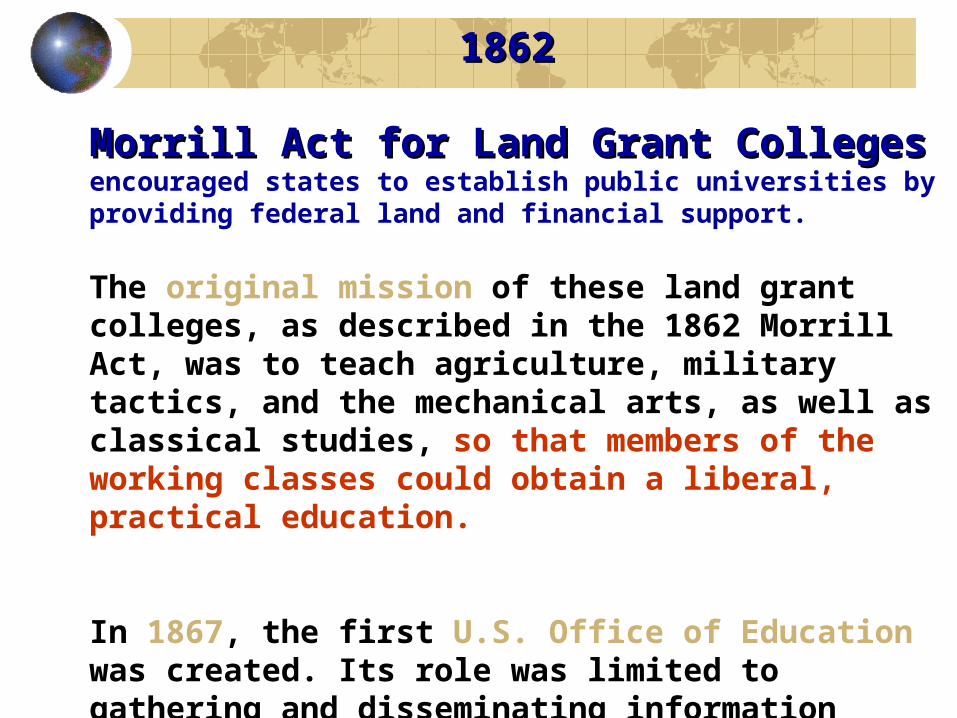
Morrill Act for Land Grant CollegesMorrill Act for Land Grant Colleges encouraged states to establish public universities by providing federal land and financial support.
The original mission of these land grant colleges, as described in the 1862 Morrill Act, was to teach agriculture, military tactics, and the mechanical arts, as well as classical studies, so that members of the working classes could obtain a liberal, practical education.
In 1867, the first U.S. Office of Education was created. Its role was limited to gathering and disseminating information about the status of education.

19401940
1.5 million students are enrolled in
Colleges & universities

GI BILLAct of June 22, 1944
The Servicemen's Readjustment Act of 1944 put higher education within the reach of millions of veterans of World War II and later military conflicts.

1944 1944
First government aid for individual college students: the G.I. Bill for returning veterans of World War II.
The Serviceman's Readjustment Act, popularly known as the G.I. Bill, provided veterans with funds for tuition, fees, books and supplies, and living expenses. This was the first major program to provide student financial aid to individuals instead of to institutions.
The technological and educational advances of the post-World War II era were brought about by this
national investmentnational investment in postsecondary education.
1958 1958
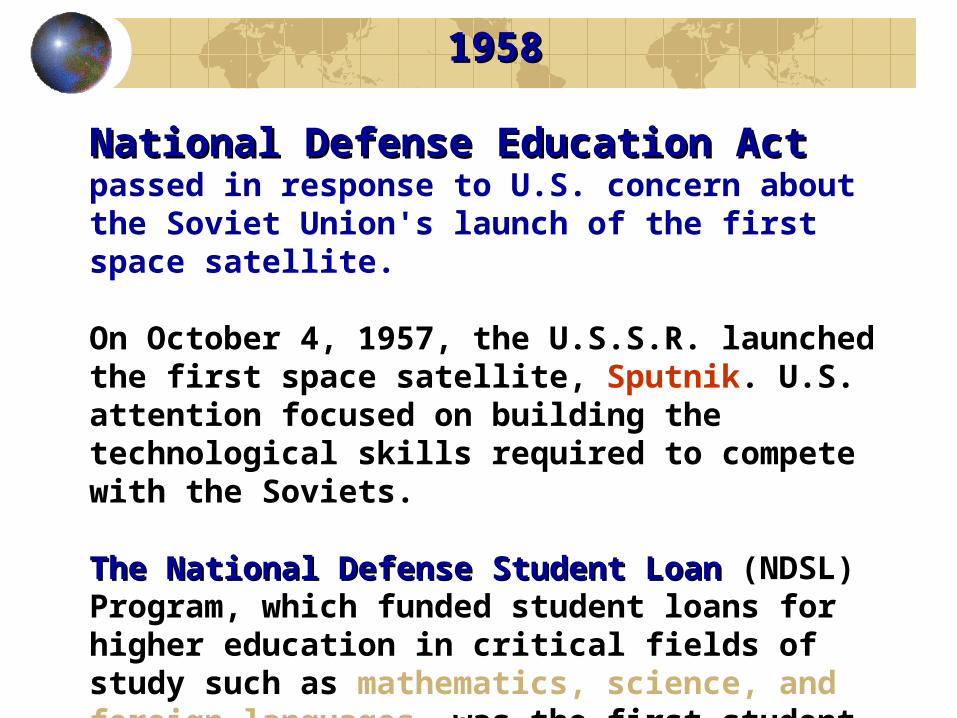
National Defense Education ActNational Defense Education Act passed in response to U.S. concern about the Soviet Union's launch of the first space satellite.
On October 4, 1957, the U.S.S.R. launched the first space satellite, Sputnik. U.S. attention focused on building the technological skills required to compete with the Soviets.
The National Defense Student LoanThe National Defense Student Loan (NDSL) Program, which funded student loans for higher education in critical fields of study such as mathematics, science, and foreign languages, was the first student financial aid program for non-veterans.

19641964
Economic Opportunity ActEconomic Opportunity Act, a Great Society initiative, included College Work-Study (CWS) Program for financially needy students.
Education was a cornerstone of President Education was a cornerstone of President
Lyndon B. Johnson's Lyndon B. Johnson's Great SocietyGreat Society..
The Economic Opportunity Act recognized the economic and social impact of education and created the College Work-Study Program (later renamed the Federal Work-Study ProgramFederal Work-Study Program), which offered students part-time employment opportunities while pursuing their college degrees.

1965 1965
Higher Education ActHigher Education Act (HEA) reauthorized the NDSL and CWS Programs and added• Educational Opportunity Grant (EOG) Program• Guaranteed Student Loan (GSL) Program
Title IV of the HEA authorized, and continues to authorize, most federal student financial aid programs. In 1965 it reauthorized the National Defense Student Loan (NDSL) and College Work-Study (CWS) Programs and added the:
• Educational Opportunity Grant ProgramEducational Opportunity Grant Program, which was intended to increase college opportunities for low- income students. Recipients are selected by colleges, using federal guidelines
• Guaranteed Student LoanGuaranteed Student Loan (GSL) Program, which allowed students with no credit history to borrow from private lenders for college expenses. The loans are guaranteed by the federal government if a borrower defaults
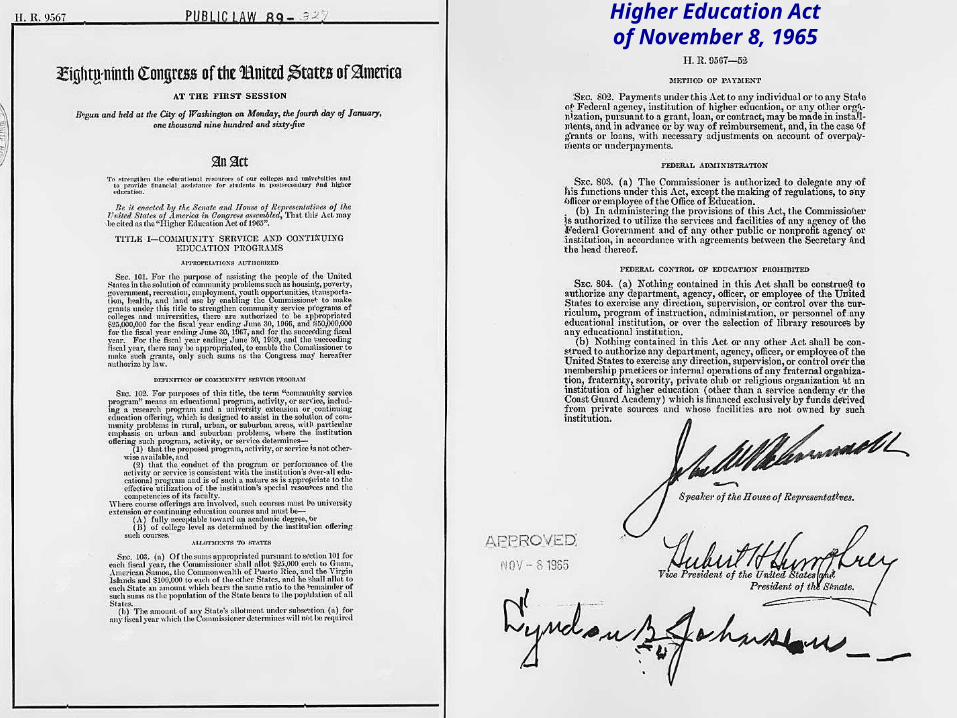
Higher Education Act of November 8, 1965

1972 1972
HEA AmendmentsHEA Amendments • Created Basic Basic Educational Opportunity GrantEducational Opportunity Grant (BEOG) and State Student Incentive Grant (SSIG) Programs• Proprietary schools became eligible for Title IV funds
• National Defense Student Loan Program renamed National Direct Student Loan Program• Extended GSL Program
• A new "portable" grant program, Basic Educational Opportunity Grant (BEOG), was created for use at any eligible postsecondary school by students meeting specific financial need criteria. Unlike other programs, BEOG was not tied to an allocation for a particular campus.

1972 1972
HEA Amendments HEA Amendments
• The Educational Opportunity Grant Program became the Supplemental Educational Opportunity GrantSupplemental Educational Opportunity Grant (SEOG) Program because it now supplemented BEOG.
• The State Student Incentive GrantThe State Student Incentive Grant (SSIG) Program was established to encourage states to share costs of student aid.
• Proprietary (profit-making) schools became eligible to use Title IV funds.
• The College Work-Study Program was reauthorized.
• The Guaranteed Student Loan Program was extended.

1976 1976
HEA Amendments added requirements that students make satisfactory academic progress to receive Title IV funds.
All existing federal student financial aid programs were reauthorized and student eligibility rules were tightened by introducing requirements for satisfactory academic progress.
Student consumer-information provisions were introduced, requiring participating institutions to provide information on topics such as academic progress requirements, job placement for graduates, and financial aid policies and procedures.
In 1978, The Middle Income Student Assistance Act1978, The Middle Income Student Assistance Act (MISAA) provided assistance to middle income parents by expanding Basic Grant eligibility and by lifting the income ceiling on the GSL Program.
19801980
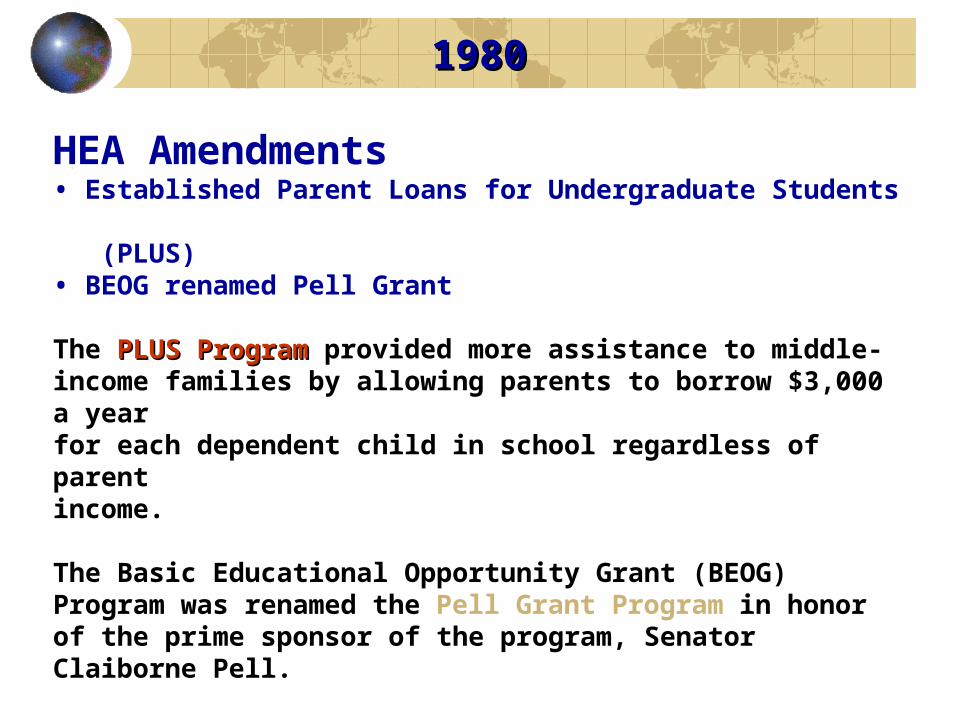
HEA Amendments • Established Parent Loans for Undergraduate Students (PLUS)• BEOG renamed Pell Grant
The PLUS ProgramPLUS Program provided more assistance to middle-income families by allowing parents to borrow $3,000 a year for each dependent child in school regardless of parent income.
The Basic Educational Opportunity Grant (BEOG) Program was renamed the Pell Grant Program in honor of the prime sponsor of the program, Senator Claiborne Pell.

1986 1986
HEA AmendmentsHEA AmendmentsThe Amendments of 1986 included a wide range of changes. They:
• Incorporated two Title IV need-analysis formulas into law
• Tightened standards for academic progress and for students admitted to postsecondary school without high school credentials
• Placed a limit on the number of years a student could get a Pell Grant
• Established a new loan program for independent students
• Renamed the National Direct Student Loan Program as the Federal Perkins Loan Program in honor of the late Congressman Carl D. Perkins
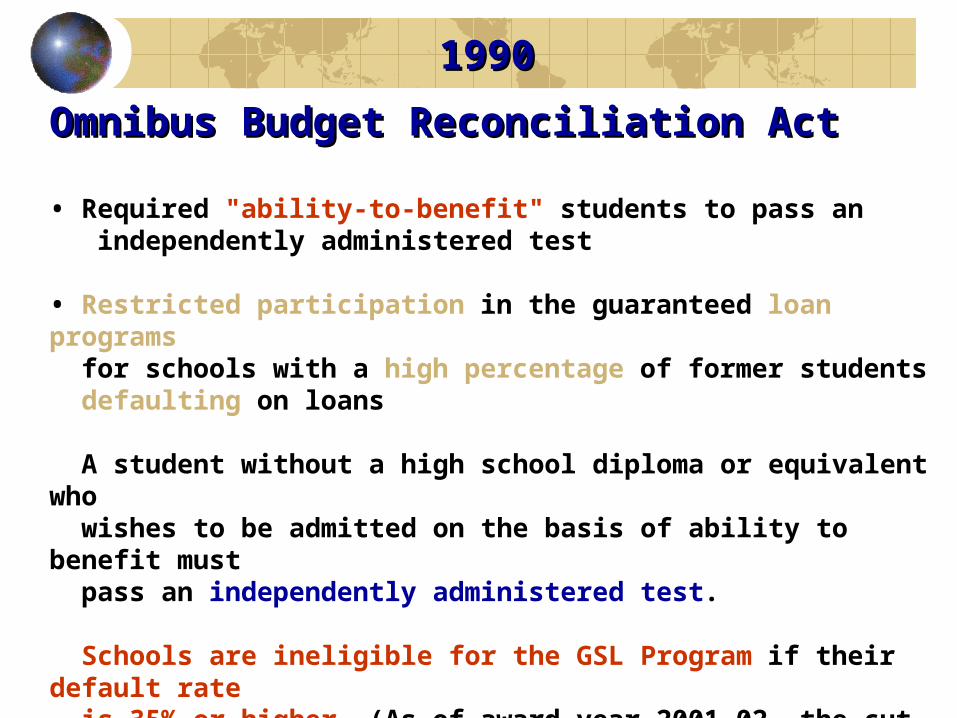
1990 1990
Omnibus Budget Reconciliation Act Omnibus Budget Reconciliation Act
• Required "ability-to-benefit" students to pass an independently administered test
• Restricted participation in the guaranteed loan programs for schools with a high percentage of former students defaulting on loans
A student without a high school diploma or equivalent who wishes to be admitted on the basis of ability to benefit must pass an independently administered test.
Schools are ineligible for the GSL Program if their default rate is 35% or higher. (As of award year 2001-02, the cut-off for most schools is 25%.)

1992 1992
HEA AmendmentsHEA Amendments
• Established a single federal need-analysis formula for all Title IV aid• Required that the application for federal student aid be free for students
• Initiated the Federal Direct Loan Program allowing schools to administer guaranteed loans provided by government funds instead of private funds• Revised and renamed private-lender guaranteed loan programs, establishing the Federal Family Education Loan (FFEL) Program
The 1992 HEA Amendments reauthorized the programs for five years and made many changes, including replacing the two need-analysis formulas with a single federal need-analysis formula.

1997 1997
Taxpayer Relief ActTaxpayer Relief Act
The 1997 tax reliefs for postsecondary students included:
• HOPE Scholarship tax credit (up to $1,500) for each of the first two years of college
• Lifetime Learning tax credit equal to 20% of the first $5,000 of tuition and fees
• Tax deduction for interest paid on student loans
• Education IRAs for tax-free savings for college

1997 1997
Taxpayer Relief ActTaxpayer Relief Act
The 1997 tax reliefs for postsecondary students included:
• Penalty-free withdrawals from existing IRAs for higher education expenses
• Greater flexibility for families saving in qualified state pre- paid tuition plans
• Income exclusion for up to $5,250 in employer education benefits
• Tax-free loan forgiveness for certain community service

Measuring Up 2002Measuring Up 2002NATIONAL - PREPARATIONNATIONAL - PREPARATION
High School Completion
Most states perform well in assuring that young people attain a high school diploma or a General Education Development (GED) diploma by age 24. But there are large gaps in the attainment of different ethnic and income groups within states.
° States range from a high of 95% (Maine) to a low of 74% (Arizona) on the percentage of their residents who earn a high school diploma or a General Education Development (GED) diploma by age 24.
° In 18 states, more than 90% of young people have a high school or GED diploma. In 29 states, more than 80% have one.
° In Arizona, 87% of white young adults have a high school or GED diploma, compared with 59% for all other races.
° In Georgia, 98% of young adults from high-income families have a high school or GED diploma, compared with 61% of young adults from low-income families.
http://measuringup.highereducation.org/2002/stateprofilenet.cfm

Measuring Up 2002Measuring Up 2002MISSOURIMISSOURI
PREPARATIONPREPARATION (B-) (B-) MISSOURI MISSOURI TOP STATES TOP STATES
18 to 24 year-olds with a high school credential 93% 94%
Low income 8th graders scoring at or above “proficiency”on the national assessment exam in math 9% 21%
Number of scores in the top 20% nationally on SAT/ACTcollege entrance exam per 1,000 high school graduates 175 201
Change over Time: In Missouri from 1990 to 2000, the proportion of high school students taking upper-level math courses increased from 36% to 51%.
http://measuringup.highereducation.org/2002/stateprofilenet.cfm
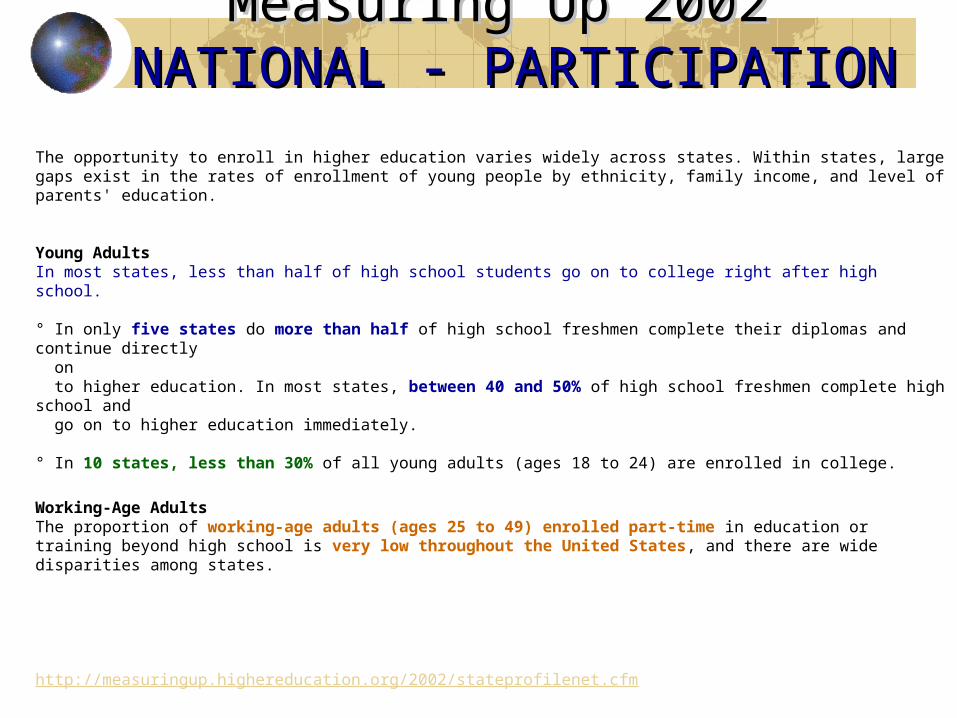
Measuring Up 2002Measuring Up 2002NATIONAL - PARTICIPATIONNATIONAL - PARTICIPATION
The opportunity to enroll in higher education varies widely across states. Within states, large gaps exist in the rates of enrollment of young people by ethnicity, family income, and level of parents' education.
Young AdultsIn most states, less than half of high school students go on to college right after high school.
° In only five states do more than half of high school freshmen complete their diplomas and continue directly on to higher education. In most states, between 40 and 50% of high school freshmen complete high school and go on to higher education immediately.
° In 10 states, less than 30% of all young adults (ages 18 to 24) are enrolled in college.
Working-Age Adults The proportion of working-age adults (ages 25 to 49) enrolled part-time in education or training beyond high school is very low throughout the United States, and there are wide disparities among states.
http://measuringup.highereducation.org/2002/stateprofilenet.cfm

Measuring Up 2002Measuring Up 2002MISSOURIMISSOURI
PARTICIPATION (C+)PARTICIPATION (C+) MISSOURI MISSOURI TOP STATES TOP STATES
YOUNG ADULTS
High school freshman enrolling in college within 4 yearsin any state 39% 54%
18 to 24 year olds enrolling in college 32% 41%
Performance Gaps: In Missouri, of 18 to 24 year olds whose parents have some college education, 55% enroll in college, compared to 19% of those whose parents did not attend college.
http://measuringup.highereducation.org/2002/stateprofilenet.cfm

Measuring Up 2002Measuring Up 2002NATIONAL - AFFORDABILITYNATIONAL - AFFORDABILITY
Family Ability to Pay
A family's ability to pay for college is determined by the share of family income needed to pay for tuition, fees, room and board, and other college expenses-minus financial aid.
° Students and families in Utah pay a smaller portion of their income for college than families in any other state. A combination of low tuitions, substantial financial aid, and solid family incomes means that Utah residents need to devote an average of about 16% of their income to attend public institutions and 21% to attend private institutions.
° The proportion of family income required to pay for higher education at public four-year institutions in Vermont is 38%-compared with 16% in Utah.
° In New York, low-income families would pay 211% of their family income to attend private four-year institutions. High-income families devote just 18% of their income.
http://measuringup.highereducation.org/2002/stateprofilenet.cfm

Measuring Up 2002Measuring Up 2002NATIONAL - AFFORDABILITYNATIONAL - AFFORDABILITY
Strategies for Affordability
Most states make a comparatively low investment in need-based financial aid (aid directed to low-income students and
their families). The average performance of the top five states in providing need-based financial aid is four times the average performance for the rest of the states.
° The top-performing state in providing need-based financial aid, Illinois, provides more grant aid than the federal government to Illinois residents. Pennsylvania, New Jersey, and Minnesota also provide more need-based grant aid than the federal government.
° Four states (Alaska, Georgia, South Dakota, and Wyoming) provide no need-based financial aid to state residents. Only four states (California, Colorado, Illinois, and Virginia) offer both low-cost colleges and high levels of need-based aid.
Reliance on Loans
° In six states, the average loan amount borrowed by undergraduate students is less than $3,000 annually. In one state, the average amount borrowed is above $4,000 per year.
Note: Many states received a lower grade on affordability in Measuring Up 2002 than in 2000. State grades measure how well a state performs in relationship to other states. California's exceptional performance since Measuring Up 2000 resulted in a lower grade for most other states.
http://measuringup.highereducation.org/2002/stateprofilenet.cfm

Measuring Up 2002Measuring Up 2002MISSOURIMISSOURI
AFFORDABILITY (D+)AFFORDABILITY (D+) MISSOURI MISSOURI TOP STATES TOP STATES
FAMILY ABILITY TO PAYPercent of income (avg of all income groups) needed to pay for college expenses minus financial aid:
Community College 17% 16%Public 4-year College/University 22% 18%Private 4-year College/University 47% 32%
STRATEGIES FOR AFFORDABILITYState grant aid targeted to low-income families as a % of federal Pell Grant to low-income families 19% 108%
Share of income that poorest families need to pay for tuition at lowest priced colleges 12% 8%
RELIANCE ON LOANSAvg loan amount that undergraduates borrow each year $3,206 $2,928
http://measuringup.highereducation.org/2002/stateprofilenet.cfm

Measuring Up 2002Measuring Up 2002MISSOURIMISSOURI
INCOME GROUPS USED TO CALCULATE 2002 FAMILY ABILITY TO PAYINCOME GROUPS USED TO CALCULATE 2002 FAMILY ABILITY TO PAY
Percent of income needed to pay for college Community 4-Year 4-Year expenses minus financial aid: Colleges Public Private
for 20% of the population with the lowest income 39% 50% 117%
for 20% of the population with lower-middle income 18% 23% 50%
for 20% of the population with middle income 12% 16% 31%
for 20% of the population with upper-middle income 9% 12% 22%
for 20% of the population with the highest income 6% 7% 15%
http://measuringup.highereducation.org/2002/stateprofilenet.cfm

Measuring Up 2002Measuring Up 2002NATIONAL - BENEFITSNATIONAL - BENEFITS
Educational Achievement
° In Massachusetts, 36% of state residents have a bachelor's degree-double the 18% who have one in West Virginia.
° In 14 states, at least 30% of state residents have a bachelor's degree. In only one state (West Virginia) do less than 20% of state residents have this degree. Large gaps also exist within states.
° In seven states, the percentage of the white population with a bachelor's degree is more than double the percentage for all other residents.
Economic Benefits
° In Maryland, the total amount of personal income generated in the state is increased by 13% due to the population with a bachelor's degree. In Wyoming, the increase is only 5%.
° All education and training beyond high school, even if it does not result in a bachelor's degree, can
have economic benefits for the state. In four states (Michigan, Delaware, Oregon, and California), the total amount of personal income in the state is increased by four percent or more as a result of state residents attending college without attaining a bachelor's degree. In four states (Missouri, Montana, South Dakota, and West Virginia) on the other hand, the increase is less than one percent.
Civic Benefits Some states with more highly educated populations tend to have higher levels of civic benefits, such as voting and charitable giving. http://measuringup.highereducation.org/2002/stateprofilenet.cfm

Measuring Up 2002Measuring Up 2002MISSOURIMISSOURI
COMPLETION (B-)COMPLETION (B-) MISSOURI MISSOURI TOP STATES TOP STATES
PERSISTENCE1st year community college students returning their 2nd year 54% 63%
Freshman at 4-year colleges/univ. returning their 2nd year 75% 83%
COMPLETIONFirst-time, full-time students completing a bachelor’s degreewithin 5 years of high school completion 48% 66%
First-time, full-time students completing a bachelor’s degreewithin 6 year of college entrance 50% 61%
Certificates, degrees and diplomas awarded at all colleges anduniversities per100 undergraduate students 17 21
http://measuringup.highereducation.org/2002/stateprofilenet.cfm
Measuring Up 2002Measuring Up 2002MISSOURIMISSOURI
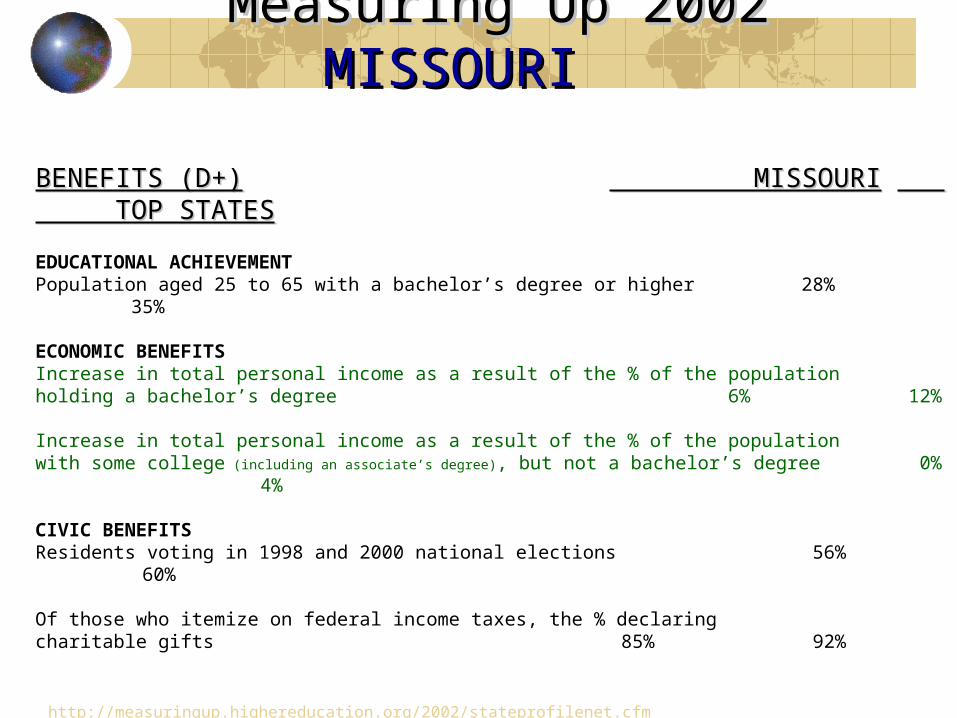
BENEFITS (D+)BENEFITS (D+) MISSOURI MISSOURI TOP STATES TOP STATES
EDUCATIONAL ACHIEVEMENTPopulation aged 25 to 65 with a bachelor’s degree or higher 28% 35%
ECONOMIC BENEFITSIncrease in total personal income as a result of the % of the population holding a bachelor’s degree 6% 12%
Increase in total personal income as a result of the % of the populationwith some college (including an associate’s degree), but not a bachelor’s degree 0% 4%
CIVIC BENEFITSResidents voting in 1998 and 2000 national elections 56% 60%
Of those who itemize on federal income taxes, the % declaring charitable gifts 85% 92%
http://measuringup.highereducation.org/2002/stateprofilenet.cfm

Measuring Up 2002Measuring Up 2002MISSOURIMISSOURI
STATE CONTEXTSTATE CONTEXT MISSOURI MISSOURI STATE RANK STATE RANK
POPULATION (2001) 5,629,707 17
GROSS STATE PRODUCT
(1999) $170,470,000,000 18
http://measuringup.highereducation.org/2002/stateprofilenet.cfm

Measuring Up 2002Measuring Up 2002MISSOURIMISSOURI
LEADING INDICATORSLEADING INDICATORS MISSOURI MISSOURI U.S. U.S.
Projected % change in population 2000-2015 8.4% 12.9%
Projected % change in # of all high school graduates, 1998-2010 3.3% 9.5%
Projected budget surplus/shortfall by 2008 -1.8% -3.8%
Avg income of poorest 20% of population (2000) $ 12,820 $ 11,400
Children in poverty (2000) 16% 17%
% of population with less than a high school diplomaor equivalent 13.4% 15.9%
New economy index (2002)* 58.9% 60.3%
*This index, created by the Progressive Policy Institute, measures the extent to which a state is participating in knowledge-based industries. A higher score means increased participation.
http://measuringup.highereducation.org/2002/stateprofilenet.cfm
Measuring Up 2002Measuring Up 2002MISSOURIMISSOURI
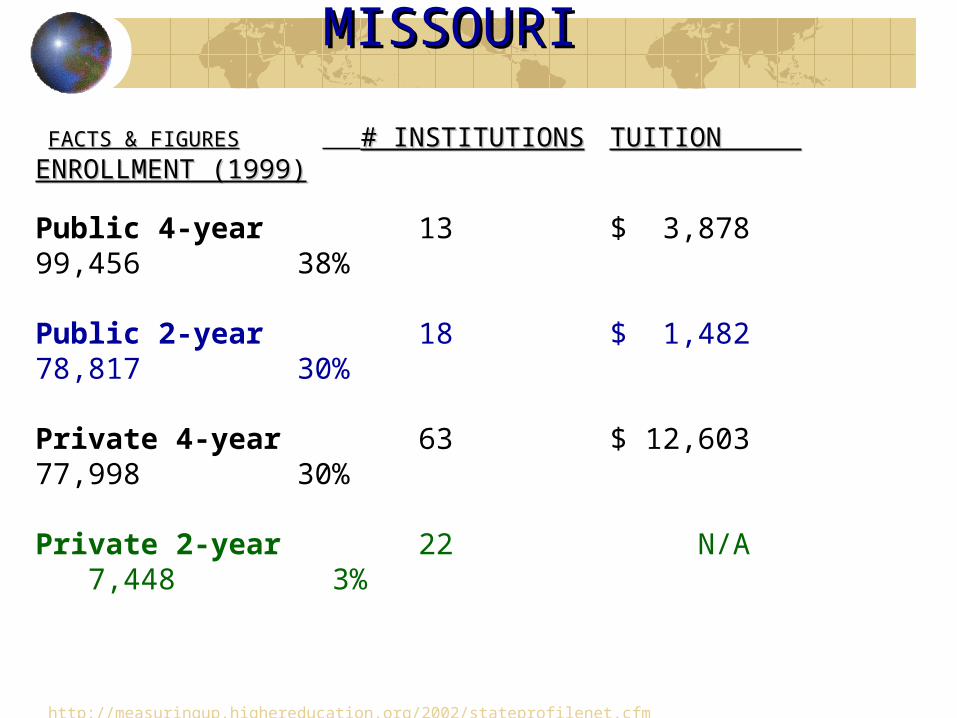
FACTS & FIGURESFACTS & FIGURES # INSTITUTIONS# INSTITUTIONS TUITION ENROLLMENT (1999)TUITION ENROLLMENT (1999)
Public 4-year 13 $ 3,878 99,456 38%
Public 2-year 18 $ 1,482 78,817 30%
Private 4-year 63 $ 12,603 77,998 30%
Private 2-year 22 N/A 7,448 3%
http://measuringup.highereducation.org/2002/stateprofilenet.cfm

Measuring Up 2002Measuring Up 2002MISSOURIMISSOURI
ENROLLMENT LEVELSENROLLMENT LEVELS COUNTCOUNT PERCENT PERCENT
Undergraduate 263,719 83%
Graduate 43,850 14%
Professional 9,911 3%
Full-time 184,948 58%
Part-time 132,532 42%
http://measuringup.highereducation.org/2002/stateprofilenet.cfm

Measuring Up 2002Measuring Up 2002MISSOURIMISSOURI
STATE & LOCAL APPROPRIATIONS FOR HIGHER EDUCATIONSTATE & LOCAL APPROPRIATIONS FOR HIGHER EDUCATION
Per $1,000 of personal income, FY 2001 $ 7.00
Per capita, FY 2001 $ 203.00
Number of GED diplomas issued to young adults, ages 16 – 24, MISSOURI U.S.per 1,000 high school graduates (2001) 137 154
http://measuringup.highereducation.org/2002/stateprofilenet.cfm

Measuring Up 2002Measuring Up 2002MISSOURIMISSOURI
ETHNICITYETHNICITY STATE POPULATIONSTATE POPULATION ENROLLED IN HIGHER EDENROLLED IN HIGHER ED
WHITE 86% 83%
BLACK 11% 10%
HISPANIC 2% 2%
ASIAN 1% 2%
NATIVE AMERICAN 0% 1%
http://measuringup.highereducation.org/2002/stateprofilenet.cfm

Measuring Up 2002Measuring Up 2002MISSOURIMISSOURI
STATE APPROPRIATIONSSTATE APPROPRIATIONS 19991999 20002000
K-12 28% 24% HIGHER EDUCATION 9% 7%
CASH ASSISTANCE 3% 1%
MEDICADE 11% 18%
CORRECTIONS 3% 3%
TRANSPORTATION 9% 9%
ALL OTHER 38% 38%
http://measuringup.highereducation.org/2002/stateprofilenet.cfm
Measuring Up 2002Measuring Up 2002MISSOURIMISSOURI
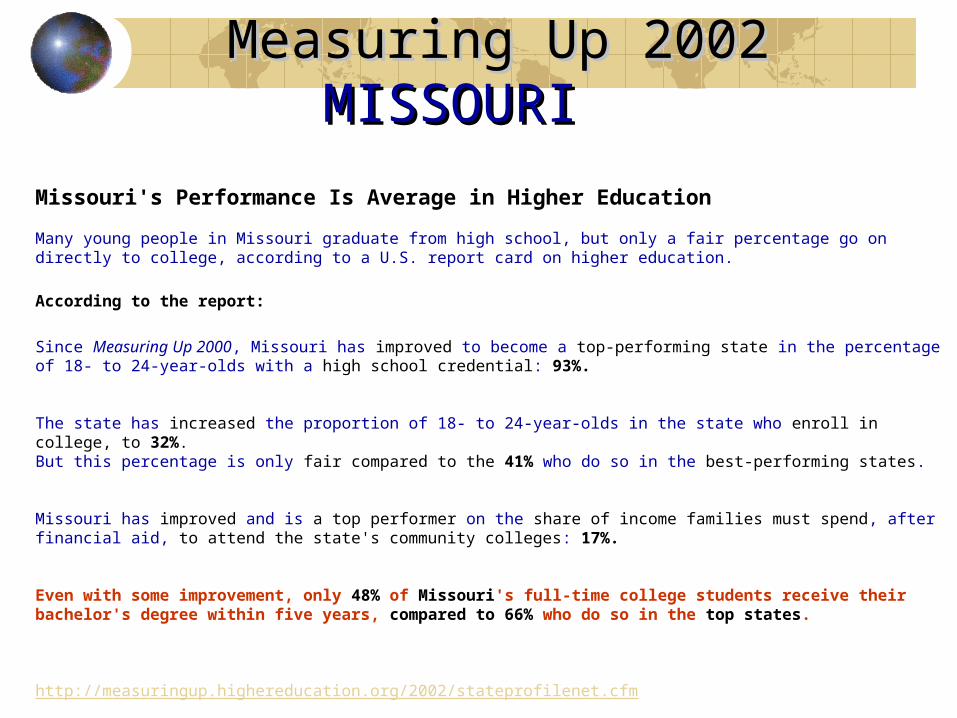
Missouri's Performance Is Average in Higher Education
Many young people in Missouri graduate from high school, but only a fair percentage go on directly to college, according to a U.S. report card on higher education.
According to the report:
Since Measuring Up 2000, Missouri has improved to become a top-performing state in the percentage of 18- to 24-year-olds with a high school credential: 93%.
The state has increased the proportion of 18- to 24-year-olds in the state who enroll in college, to 32%. But this percentage is only fair compared to the 41% who do so in the best-performing states.
Missouri has improved and is a top performer on the share of income families must spend, after financial aid, to attend the state's community colleges: 17%.
Even with some improvement, only 48% of Missouri's full-time college students receive their bachelor's degree within five years, compared to 66% who do so in the top states.
http://measuringup.highereducation.org/2002/stateprofilenet.cfm
Measuring Up 2002Measuring Up 2002MISSOURIMISSOURI
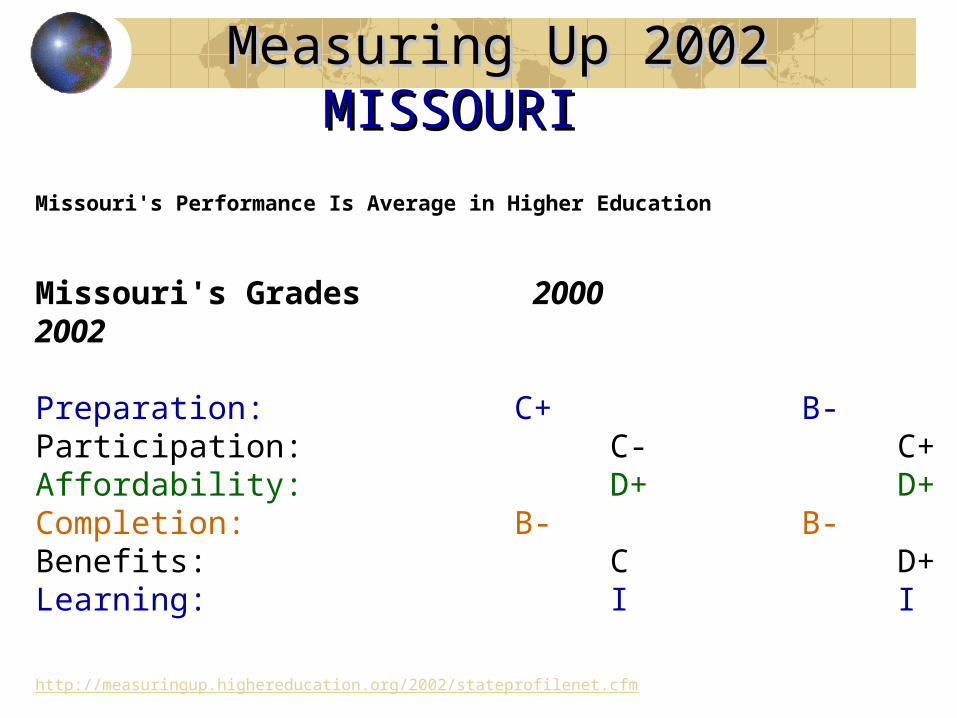
Missouri's Performance Is Average in Higher Education
Missouri's Grades 2000 2002
Preparation: C+ B-Participation: C- C+Affordability: D+ D+Completion: B- B-Benefits: C D+Learning: I I
http://measuringup.highereducation.org/2002/stateprofilenet.cfm

College graduates earned College graduates earned about $41,000 in 1998 about $41,000 in 1998
compared with the $23,000 compared with the $23,000 that high school graduates that high school graduates
earned.earned.
http://www.bls.gov/opub/ooq/2000/Fall/art01.pdf

1998 – 20081998 – 2008
35 to 44-year-old 35 to 44-year-old population shrinks by about population shrinks by about
8%8%
http://www.bls.gov/opub/ooq/2000/Fall/art01.pdf

1998 – 20081998 – 2008
18 to 24-year-old 18 to 24-year-old population grows by about population grows by about
16%16%
13.7 million graduates13.7 million graduateshttp://www.bls.gov/opub/ooq/2000/Fall/art01.pdf
1988 – 19981988 – 1998
55 and older age group 55 and older age group increased by 4.3 millionincreased by 4.3 million
http://www.bls.gov/opub/ooq/2000/Fall/art01.pdf

1998 - 20081998 - 2008
55 and older age group will 55 and older age group will
increased by increased by 1414 million million
http://www.bls.gov/opub/ooq/2000/Fall/art01.pdf

1998 - 20081998 - 2008
1.37 million new graduates 1.37 million new graduates each yeareach year
1.28 million new jobs 1.28 million new jobs each yeareach year
http://www.bls.gov/opub/ooq/2000/Fall/art01.pdf

Although the employment outlook is Although the employment outlook is improving, an average of 90,000 improving, an average of 90,000 college graduates will continue to college graduates will continue to enter positions that do not require enter positions that do not require
skills learned in a bachelor’s degree skills learned in a bachelor’s degree program.program.
http://www.bls.gov/opub/ooq/2000/Fall/art01.pdf

……expectations for high earnings and expectations for high earnings and job satisfaction… are reasonable for job satisfaction… are reasonable for students graduating with majors that students graduating with majors that prepare them to enter fast-growing, prepare them to enter fast-growing,
high demand occupations…high demand occupations…
…competition will remain keen……competition will remain keen…
http://www.bls.gov/opub/ooq/2000/Fall/art01.pdf

……prospective employers evaluate prospective employers evaluate job applicants on…job applicants on…
GPA, internship/work experience, GPA, internship/work experience, evidence of leadership, strong evidence of leadership, strong
communication skills…communication skills…
http://www.bls.gov/opub/ooq/2000/Fall/art01.pdf

If we want to see this….If we want to see this….

We need lots of this…We need lots of this…

Higher education has seen rapid change in the past 50 years as financial aid has matured into a profession. Increases in enrollment, college costs, and funds administered along
with changes in the goals of financial aid, technological advances, and intrusive federal
regulation have made it one of the most dynamic higher education professions.
http://www.chessconsulting.org/financialaid/profession.htm
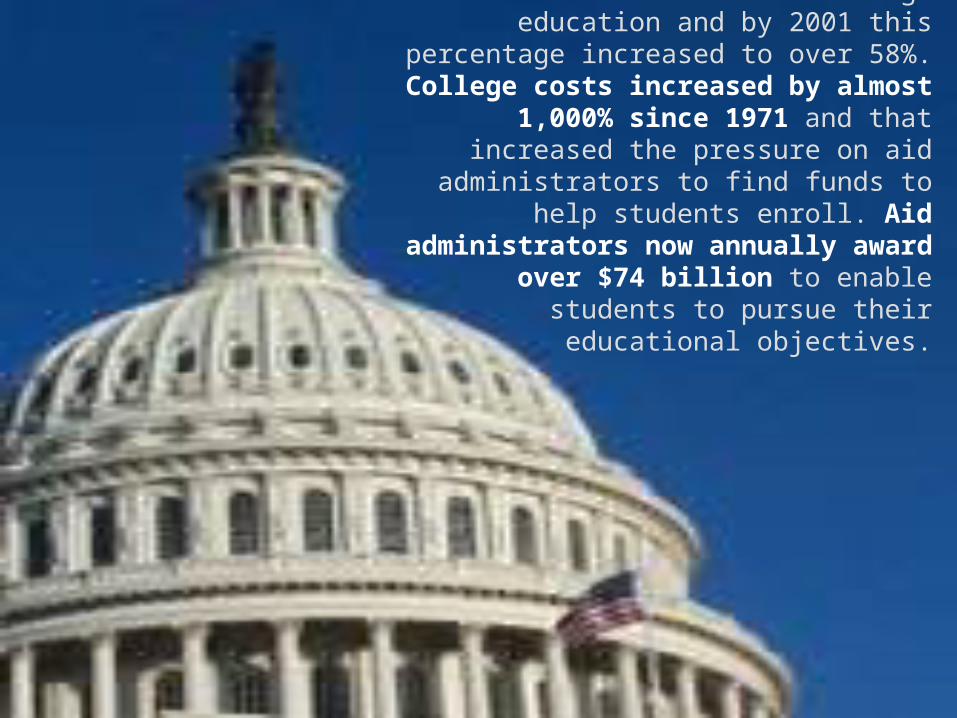
In 1971, 34% of 25–29 year old Americans had some college education and by 2001 this
percentage increased to over 58%. College costs increased by almost 1,000% since
1971 and that increased the pressure on aid administrators to find funds to help students
enroll. Aid administrators now annually award over $74 billion to enable students to
pursue their educational objectives.
http://www.chessconsulting.org/financialaid/profession.htm

At the same time that college enrollments and college costs were exploding, the goals and
purposes of financial aid were expanded. The goals were clear in the simple days at Harvard in the early 1640's, to provide
funds to assist financially needy students. The entanglement of the federal
government, however, has resulted in multiple objectives.
http://www.chessconsulting.org/financialaid/profession.htm

The GI Bill provided funds for students to attend college in part to address concerns about economic
reintegration of almost 16 million veterans returning from WWII and the potential for high
unemployment if they immediately reentered the workforce. The National Defense Act which
created the National Defense Student Loan (now called the Federal Perkins Loan) was created in response to the Soviet Union's launch of Sputnik
and our need to develop scientists who could help us compete with the Russians.
http://www.chessconsulting.org/financialaid/profession.htm

Congress continues to use the aid programs to encourage students to enter certain fields
such as teaching and law enforcement. Using the Constitution's spending clause,
Congress has used financial aid as a means to regulate a number of college
activities and promote public policy concerns such as ensuring the academic integrity of
academic programs, registration for selective service, and denying financial aid to students
with drug convictions.
http://www.chessconsulting.org/financialaid/profession.htm

To meet increased costs, student borrowing increased dramatically and student loan default
rates skyrocketed. In the early 1990s, the national student loan default rate soared to a high of
22.4%. Aid administrators were assigned additional responsibilities by the U.S. Government to prevent defaults. As a result, aid administrators provided
more intensive debt management counseling and became more connected to career planning
and placement activities. Default rates have now fallen below 6%.
http://www.chessconsulting.org/financialaid/profession.htm

Colleges have also begun using the funds as leverage to encourage enrollments of the best
and brightest and special populations such as athletes and underrepresented minority students. In
1988, academic merit was used to award institutional aid at 58% of four-year private colleges
and universities and 14% of four-year public institutions. By 1996, merit was used at 73% of
four-year private institutions and 28% of four-year public colleges and universities. A recent study of
2,554 colleges shows the majority of institutional funds at four year public
universities are awarded on a non-need basis (merit or other factor).
http://www.chessconsulting.org/financialaid/profession.htm
In 1999, NASFAA adopted a Statement of Ethical Principles replacing its Statement of Good
Practices and in doing so removed the expectation that "the aid administrator should
make every effort to redirect [non need-based] funds to assist those students with
demonstrated need." Use of funds to recruit underrepresented minority students has also
created concerns. The current U.S. Supreme Court case involving admissions at the University of
Michigan is expected to significantly impact financial aid.
http://www.chessconsulting.org/financialaid/profession.htm

In the midst of these changes, regulation of the profession has grown significantly. A project by the Office of General
Counsel at the Catholic University of America catalogued over 7,000 regulations affecting colleges and universities. Such regulation has driven some
institutions out of the financial aid programs (e.g., Grove City College).
http://www.wustl.edu/
"To manage the increased workloads, aid administrators have had to become much more process-oriented than they were in 1988. Aid administrators have become much more concerned with following the rules and regulations of aid, rather than with making sure students receive aid packages that meet their needs and safeguard limited funds." As such, aid administrators have used technology extensively to automate these processes.
http://www.wustl.edu/

In 1999, NASFAA adopted a Statement of Ethical Principles replacing its Statement of Good
Practices and in doing so removed the expectation that "the aid
administrator should make every effort to redirect [non need-based] funds to assist those students with
demonstrated need." Use of funds to recruit underrepresented minority
students has also created concerns. The current U.S. Supreme Court case involving admissions at the
University of Michigan is expected to significantly impact financial aid.
http://www.chessconsulting.org/financialaid/profession.htm

As federal regulation and the costs for non-compliance have grown, the
importance of the financial aid office within colleges and universities has
been recognized. Aid administrators are moving up the organizational ladder and involving higher level campus administrators in policy decisions.
http://www.chessconsulting.org/financialaid/profession.htm

The financial aid office is a high financial risk area for the institution and a major factor in its ability to attract and retain
qualified students. A well-run financial aid office is essential to the health of an
institution. As the profession has grown, its people and history have established ethical
principles to guide the future.
http://www.chessconsulting.org/financialaid/profession.htm