Embed Size (px)
Citation preview
1
HARNESSING OF WAVE POWER FROM
HORIZONTAL FLOW DYNAMICS OF
SHALLOW WAVES
A THESIS SUBMITTED IN PARTIAL FULFILLMENT OF
THE
REQUIREMENTS FOR THE DEGREE OF
Bachelor of Technology
In
Electronics & Instrumentation Engineering
By
S. RAMA RAJU SAGIRAJU RANJEET KUMAR
Roll No. : 10507023 Roll No. : 10507025
Under the Guidance of Prof. T. K. DAN
Department of Electronics & Communication Engineering
National Institute of Technology
Rourkela-769008 2009
2
National Institute of Technology Rourkela
CERTIFICATE
This is to certify that the thesis entitled “HARNESSING OF WAVE
POWER FROM HORIZONTAL FLOW DYNAMICS OF SHALLOW
WAVES” submitted by S. Rama Raju, Roll No. - 10507023 in partial fulfillment of the requirements for the award of Bachelor of Technology
degree in Electronics & Communication Engineering at the National
Institute of Technology, Rourkela (Deemed University) is an authentic work carried out by him under my supervision and guidance.
To the best of my knowledge, the matter embodied in the thesis has not been submitted to any other University/Institute for the award of any
Degree or Diploma.
Date: (Prof. T. K. DAN)
3
National Institute of Technology Rourkela
CERTIFICATE
This is to certify that the thesis entitled “HARNESSING OF WAVE
POWER FROM HORIZONTAL FLOW DYNAMICS OF SHALLOW WAVES” submitted by Ranjeet Kumar, Roll No. - 10507025 in partial
fulfillment of the requirements for the award of Bachelor of Technology degree in Electronics & Communication Engineering at the National
Institute of Technology, Rourkela (Deemed University) is an authentic
work carried out by him under my supervision and guidance.
To the best of my knowledge, the matter embodied in the thesis has not
been submitted to any other University/Institute for the award of any Degree or Diploma.
Date: (Prof. T. K. DAN)

4
ACKNOWLEDGEMENT
The most pleasant point of presenting a thesis is the opportunity to thank
those who have contributed their guidance & help to it. I am grateful to
Dept. Of Electronics & Communication Engineering, N.I.T Rourkela, for giving me the opportunity to undertake this project, which is an
integral part of the curriculum in B.Tech program at the National
Institute of Technology, Rourkela. I would like to acknowledge the support of
every individual who assisted me in making this project a success & I
would like to thank & express heartfelt gratitude for my project guide Prof. T. K. Dan, who provided me with valuable inputs at the critical
stages of this project execution along with guidance, support & direction
without which this project would not have taken shape. I am also thankful to the staff of Department
of Electronics & Communication Engineering, N.I.T Rourkela, for co-
operating with me & providing the necessary resources during the course of my project.
S. Rama Raju Sagiraju DATE: Roll No. 10507023
PLACE: Department of Electronics &
Communication Engineering National Institute of Technology, Rourkela

5
ACKNOWLEDGEMENT
The most pleasant point of presenting a thesis is the opportunity to thank
those who have contributed their guidance & help to it. I am grateful to
Dept. Of Electronics & Communication Engineering, N.I.T Rourkela, for giving me the opportunity to undertake this project, which is an
integral part of the curriculum in B.Tech program at the National
Institute of Technology, Rourkela. I would like to acknowledge the support of
every individual who assisted me in making this project a success & I
would like to thank & express heartfelt gratitude for my project guide Prof. T. K. Dan, who provided me with valuable inputs at the critical
stages of this project execution along with guidance, support & direction
without which this project would not have taken shape. I am also thankful to the staff of Department
of Electronics & Communication Engineering, N.I.T Rourkela, for co-
operating with me & providing the necessary resources during the course of my project.
Ranjeet Kumar DATE: Roll No. 10507025
PLACE: Department of Electronics &
Communication Engineering National Institute of Technology, Rourkela
6
ABSTRACT
Harnessing Ocean Wave power is a potential source of renewable form of energy. Our project
was aimed at finding the constraints and proposing a suitable solution to utilize this form of
energy. Ocean Wave Power is the most predictable, periodic and concentrated source among all
renewable sources, but the constraints imposed on its harnessing are a result of its Ocean
environment. Ocean wave dissipates energy in several strata of circular oscillation. But with
depth induced water pressure these circular oscillation are squished into ellipse that approximates
to back & forth motion. Statistically the horizontal oscillation shares the 68% of energy spectrum
of wave energy. But due to irregular flow and variable pressure conventional hydropower
harnessing techniques become improbable. In our project we have proposed a simple solution
that takes the direct advantage of utilizing this energetic horizontal momentum of ocean waves,
without in between conversion.
Our project works in parallel and in tandem with another group
working on this project but deals with a different aspect of the problem. Our project has worked
on finding the depth induced variation of distribution of ocean energy and maximum optimum
depth for harnessing. The suitable components required for conversion from mechanical to
electrical energy were analyzed. The slow rpm speed output needed attention for its conversion
and Axial/Transverse Flux Permanent seemed to be the solution for our scenario.

7
CONTENTS
ITEM TITLE PAGE NO.
CHAPTER – 01 Introduction 11
1.1 Introduction to Ocean Waves 12
1.2 Wave Motion 13
1.3 Wave Climate 14
CHAPTER – 02 Wave Energy Converter 18
2.1 Wave Energy Converter 19
2.2 Turbine Type 19
2.3 Disadvantages of Conventional WEC 21
CHAPTER – 03 Concept and Model 22
3.1 Concept 23
3.2 Description 26
3.3 Working Principle 27
CHAPTER – 04 Turbine Specifications 30
4.1 Turbine 31
4.2 Ossberger Turbine 32
CHAPTER – 05 Implementation and Results 34
5.1 Effect Of Water Depth 35
5.2 Analysis of Suitable Alternator/ Generator
Topology 45
CHAPTER – 06 Conclusion 53
8
LIST OF FIGURES
FIG
NO.
TITLE PAGE
NO.
1 Shape of Individual and Resultant Ocean Waves 12
2 Deep Water Waves versus Shallow Water Waves 13
3 Wave Power Density Graph 16
4 Power per Meter of Wave Front 17
5 Oscillating Wave Column 20
6 Overtopping Wave Energy Converter 21
7 Top View of the proposed WEC Model 23
8 Side View of proposed WEC Model 24
9 Front View of proposed WEC model 25
10 Oblique View of the Model 26
11 Working Principle of the Model 28
12 Block Diagram of the Model 29
13 Classification of Turbine based on Net Head and Flow 31
14 Region of Operation 32
15 Operation Range of Ossberger Turbines 33
9
FIG
NO.
TITLE PAGE
NO.
16 Percentage reduction in incident power of Monochromatic
Waves
37
17 Contour plot showing reduction in Incident power with
Significant Wave height
38
18 Change of Water Particle Amplitude with Water Depth 42
19 Optimum Damping Curve for Wave Energy Converter 43
20 Capture Factor versus Wave Period with Depth 44
21 Measured and Calculated Torque with Different Current 46
22 Measured and Calculated Excitation Voltage at Various
Rotor Speeds
47
23 Variation of Core and Rotational losses at various speeds 47
24 Magnet Weight vs Power of Direct Drive Machines diag. 49
25 Magnet Weight vs. Power for high speed machines 49
26 Efficiency vs Power of Direct Driven Machines 50
27 Total length vs Power of Direct Drive Machines 51

10
LIST OF TABLES
TABLE NO.
TITLE PAGE NO.
1 Wave Nomenclature Used in the project 15
2 Classification of Wave Energy Converter 18

11
CHAPTER 1
INTRODUCTION
12
(1.1) Introduction to Ocean Waves
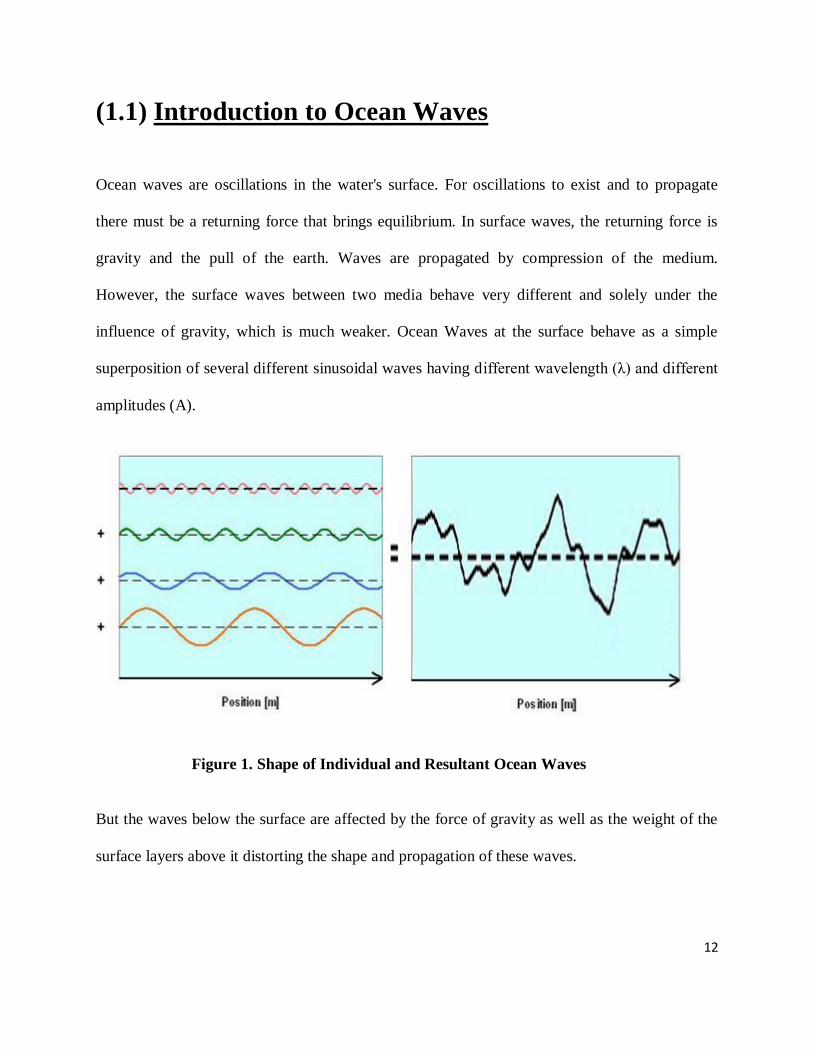
Ocean waves are oscillations in the water's surface. For oscillations to exist and to propagate
there must be a returning force that brings equilibrium. In surface waves, the returning force is
gravity and the pull of the earth. Waves are propagated by compression of the medium.
However, the surface waves between two media behave very different and solely under the
influence of gravity, which is much weaker. Ocean Waves at the surface behave as a simple
superposition of several different sinusoidal waves having different wavelength (λ) and different
amplitudes (A).
Figure 1. Shape of Individual and Resultant Ocean Waves
But the waves below the surface are affected by the force of gravity as well as the weight of the
surface layers above it distorting the shape and propagation of these waves.
13
(1.2) Wave Motion
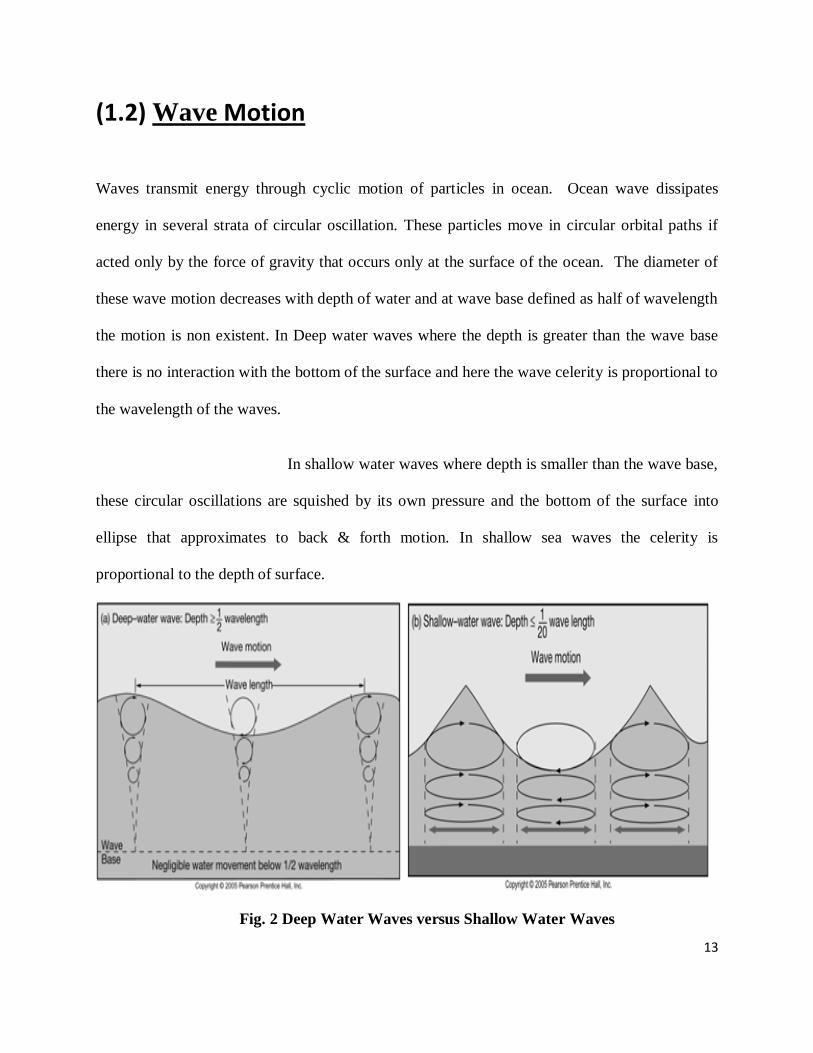
Waves transmit energy through cyclic motion of particles in ocean. Ocean wave dissipates
energy in several strata of circular oscillation. These particles move in circular orbital paths if
acted only by the force of gravity that occurs only at the surface of the ocean. The diameter of
these wave motion decreases with depth of water and at wave base defined as half of wavelength
the motion is non existent. In Deep water waves where the depth is greater than the wave base
there is no interaction with the bottom of the surface and here the wave celerity is proportional to
the wavelength of the waves.
In shallow water waves where depth is smaller than the wave base,
these circular oscillations are squished by its own pressure and the bottom of the surface into
ellipse that approximates to back & forth motion. In shallow sea waves the celerity is
proportional to the depth of surface.
Fig. 2 Deep Water Waves versus Shallow Water Waves
14
As waves enter shallow water they slow down, grow taller and change shape. At depth of half its
wave length, the rounded waves start to rise and their crests become shorter while their troughs
lengthen. Although their frequency stays the same or increases, the waves slow down and their
overall wave length shortens.
By Boltzmann’s Normal Distribution applied to random
phenomena, statistically the energy of these elliptic molecules will be more in horizontal domain.
Gull and Paloni et al “Statistical Interpretation of Wave Data”, 2005 have estimated the
horizontal component to be more than 68% on an average. Shallow waves have an added
advantage of shortening of wavelength and increase of wave height due to wave breaking. The
power in a wave is proportional to the square of its amplitude or wave height as in Ocean waves.
Shallow water waves have higher concentrated power with a increase in frequency that makes
them more attractive for harnessing of energy.
(1.3) Wave Climate
In order to assess an area for wave energy development, the wave climate must be defined. The
wave climate describes an area’s wave height distribution, wave length distribution, and total
mean water depth. From these parameters, one can compute wave power levels.
Wave Energy Calculation
While we know that wave power is more energy dense than wind power and produces power for
a larger percentage of the year, we still do not know how to calculate the power available from a
wave. This is important for the design process of a wave energy converter. First, the power and
15
forces acting on the device should be assessed, and then the device may be sized for the desired
energy output. The next sections explain how to calculate the wave energy and power and how
to size the device for a given power level.
Wave Energy and Power
The following analysis describes a wave’s energy and power characteristics.
Variables
SWL Mean Sea Water Level
Edensity Wave energy density [J/m2]
Ewavefront energy per meter wave front [J/m]
Pdensity wave power density [W/m2]
Pwavefront power per meter wave front [W/m]
H depth below SWL [m]
Ω wave frequency [rad/sec]
Λ wavelength [m] = gT2/(2π)
Ρwater seawater density [1000 kg/m3]
G gravitational constant [9.81 m/s2]
A wave amplitude [m]
H wave height [m]
T wave period [s]
C celerity (wave front velocity) [m/s]
Table 1 Wave Nomenclature Used in the project
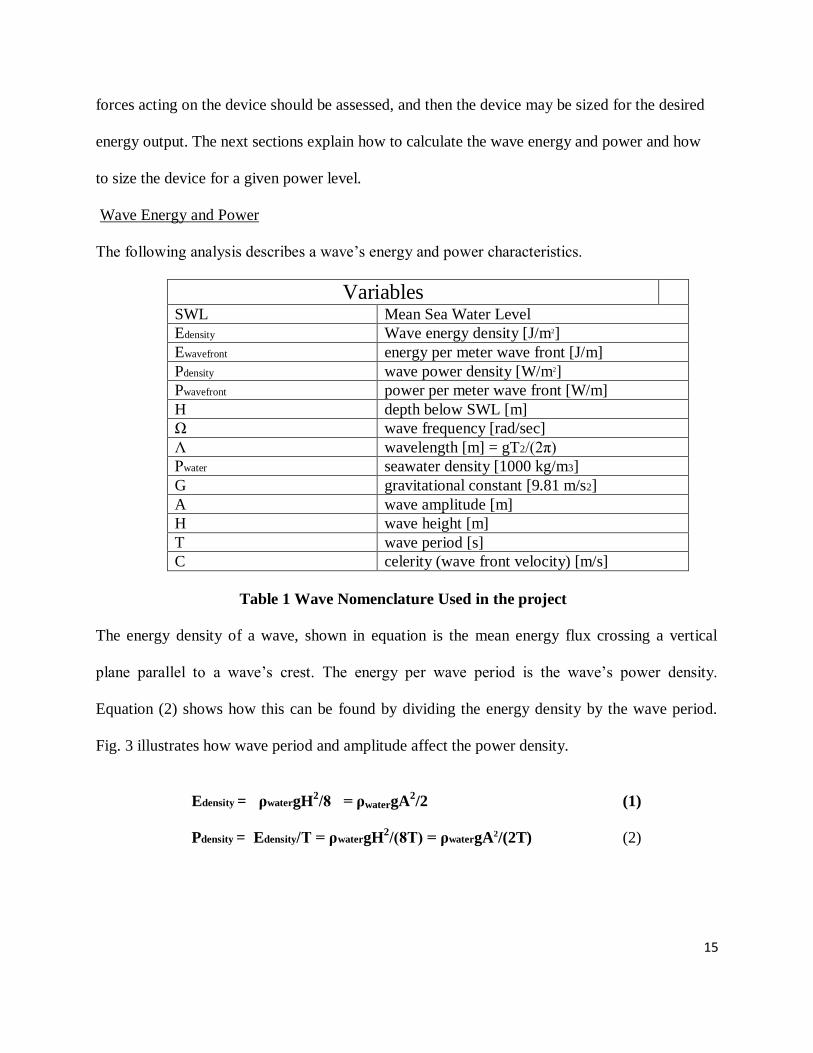
The energy density of a wave, shown in equation is the mean energy flux crossing a vertical
plane parallel to a wave’s crest. The energy per wave period is the wave’s power density.
Equation (2) shows how this can be found by dividing the energy density by the wave period.
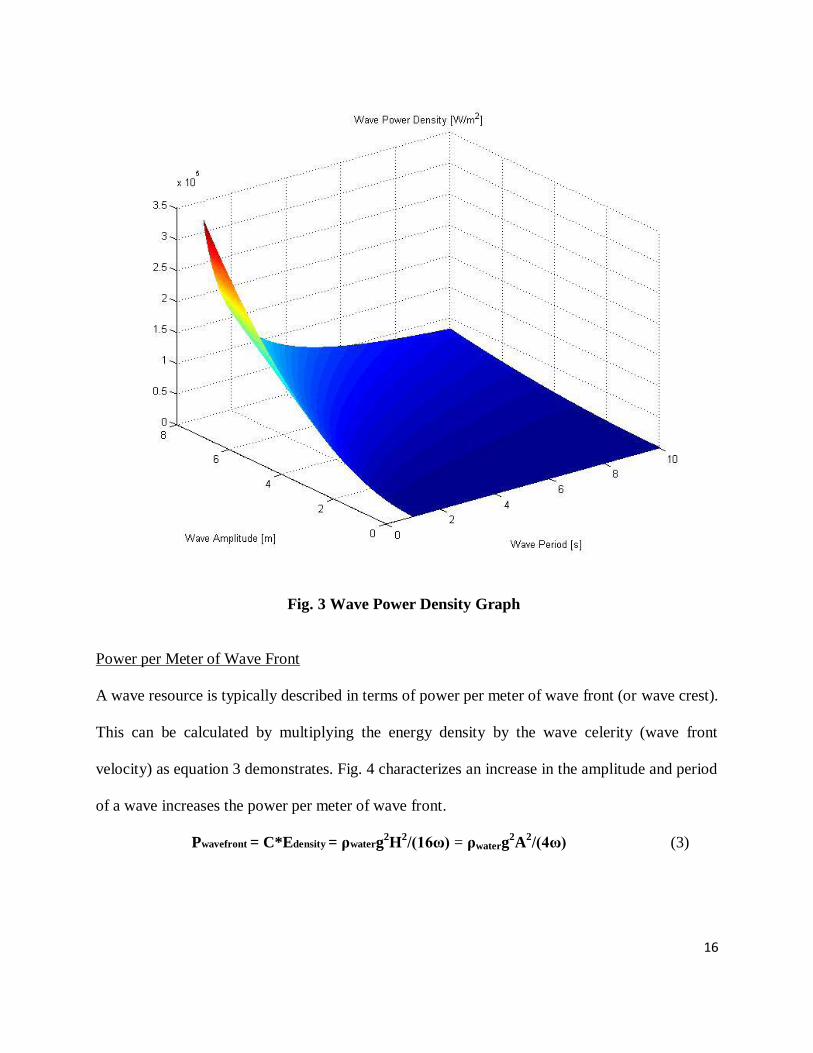
Fig. 3 illustrates how wave period and amplitude affect the power density.
Edensity = ρwatergH2/8 = ρwatergA
2/2 (1)
Pdensity = Edensity/T = ρwatergH2/(8T) = ρwatergA2/(2T) (2)
16
Fig. 3 Wave Power Density Graph
Power per Meter of Wave Front
A wave resource is typically described in terms of power per meter of wave front (or wave crest).
This can be calculated by multiplying the energy density by the wave celerity (wave front
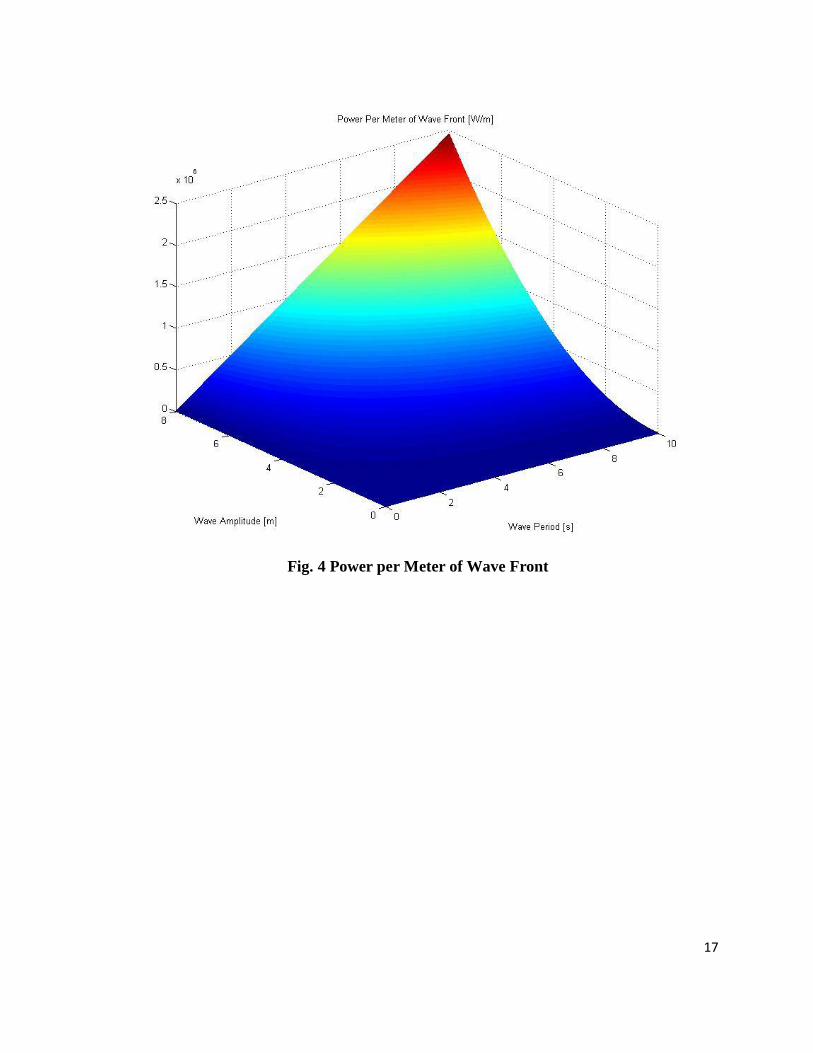
velocity) as equation 3 demonstrates. Fig. 4 characterizes an increase in the amplitude and period
of a wave increases the power per meter of wave front.
Pwavefront = C*Edensity = ρwaterg2H
2/(16ω) = ρwaterg
2A
2/(4ω) (3)
17
Fig. 4 Power per Meter of Wave Front
18
CHAPTER 2
Wave Energy Converter
19
(2.1) Wave Energy Converter
A wave energy converter, as the name implies, converts the mechanical wave energy of sea
waves directly into electric currents or suitable forms of mechanical energy [2]. There are two
fundamental types of Wave Energy Converters (WEC), although some authors have broken
down these types into even more classifications based on their orientation and functionality. The
first type of WEC to get attention from the research community is the turbine-type while buoy-
type converters are a newer idea. [3]
Ocean Wave Energy Converters
Turbine Type
Buoy Type
Oscillating Water Columns (OWC)
Overtopping Wave Energy Converter
Table 2 Classification of Wave Energy Converter
(2.2) Turbine Type
The turbine-type wave energy converter employs a turbine as an energy conversion device.
These come in many different forms, the most prominent being the oscillating water column.
20
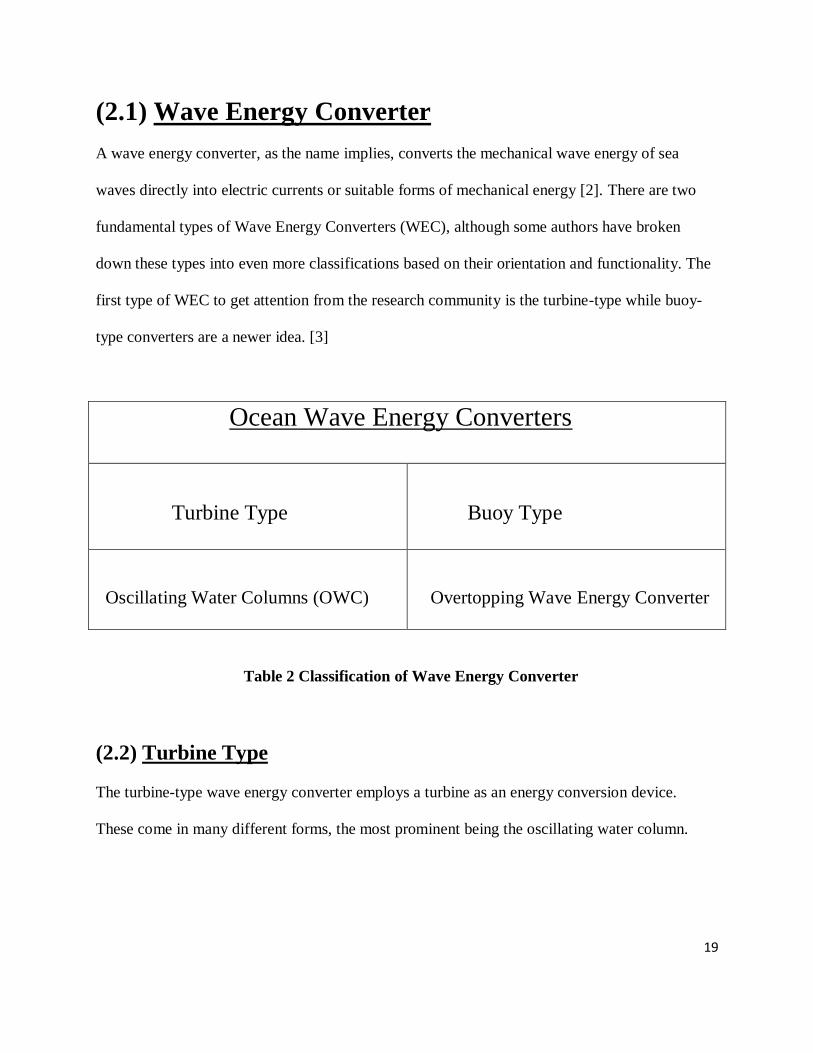
Oscillating Water Column
The oscillating water column (OWC) as illustrated in Fig. 5 operates like a wind turbine via the
principle of wave induced air pressurization. Closed containment housing is placed above the
water and the passage of waves changes the water level within the housing. If the housing is
completely sealed, the rising and falling water level will increase and decrease the air pressure
respectively within the housing. Air will flow into the housing during a wave trough and will
flow out of the housing during a wave crest. Because of this bidirectional air flow, the turbine
must be designed to rotate in only one direction no matter the direction of air flow. The Wells
Turbine was designed for this type of application and is used in most OWC devices today
Fig. 5 Oscillating Wave Column
21
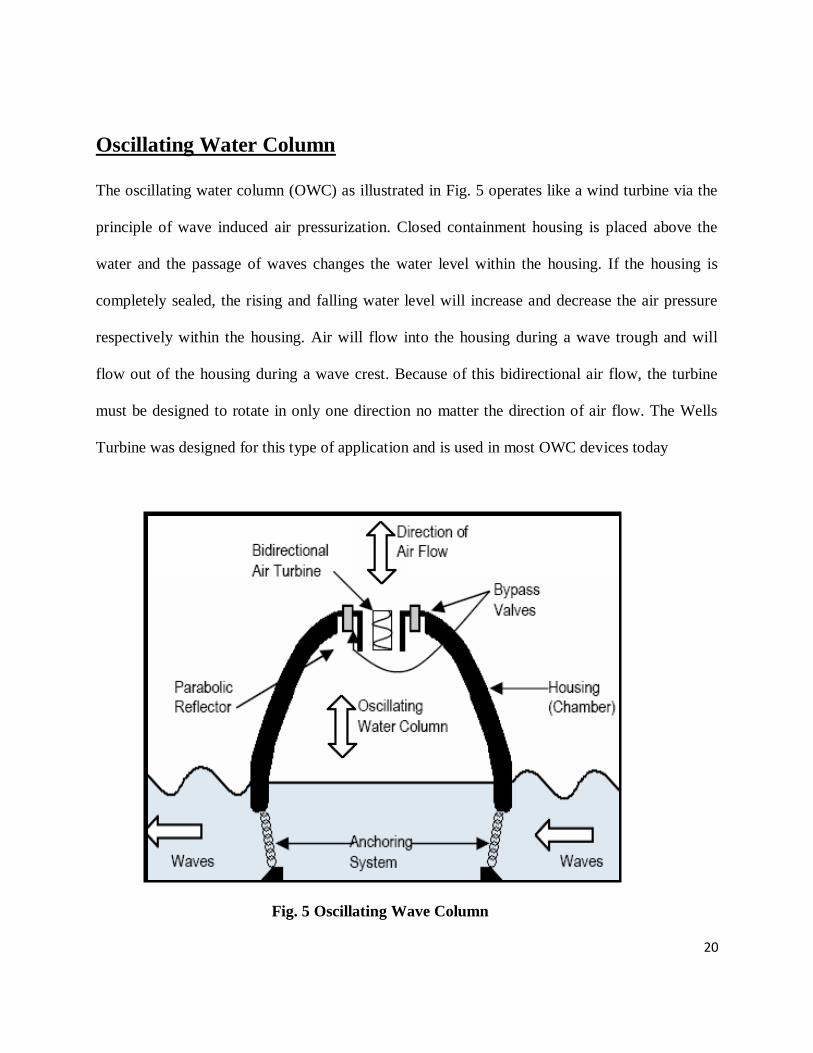
Overtopping Wave Energy Converter
The overtopping wave energy converter works in much the same way a hydroelectric dam
works. Waves roll into a collector which funnels the water into a hydro turbine as depicted in
Fig. 6. The turbines are coupled to generators which produce electricity. After the waves flow
through the turbines, they continue through the ocean. A mesh grid functions to extract trash and
marine debris before the waves pour into the turbine.
Fig. 6 Overtopping Wave Energy Converter
(2.3) Disadvantages of Conventional WEC’s
The central feature of all these WEC’s are they employ the vertical heave and surge of wave that occurs
only at ocean surfaces but leave the enormous amount of energy in layers beneath them. These WEC’s
generally use self rectifying or wind turbines instead of conventional hydro turbines that are more robust
and efficient under these conditions. These cannot tap small but energetic wave power & neither can they
utilize irregular wave movement & current behavior. These cannot be used for hydrokinetic purposes. The
physical constraint imposed upon these design make them improbable for small wave & hydrokinetic
purposes.

22
CHAPTER 3
CONCEPT & MODEL
23
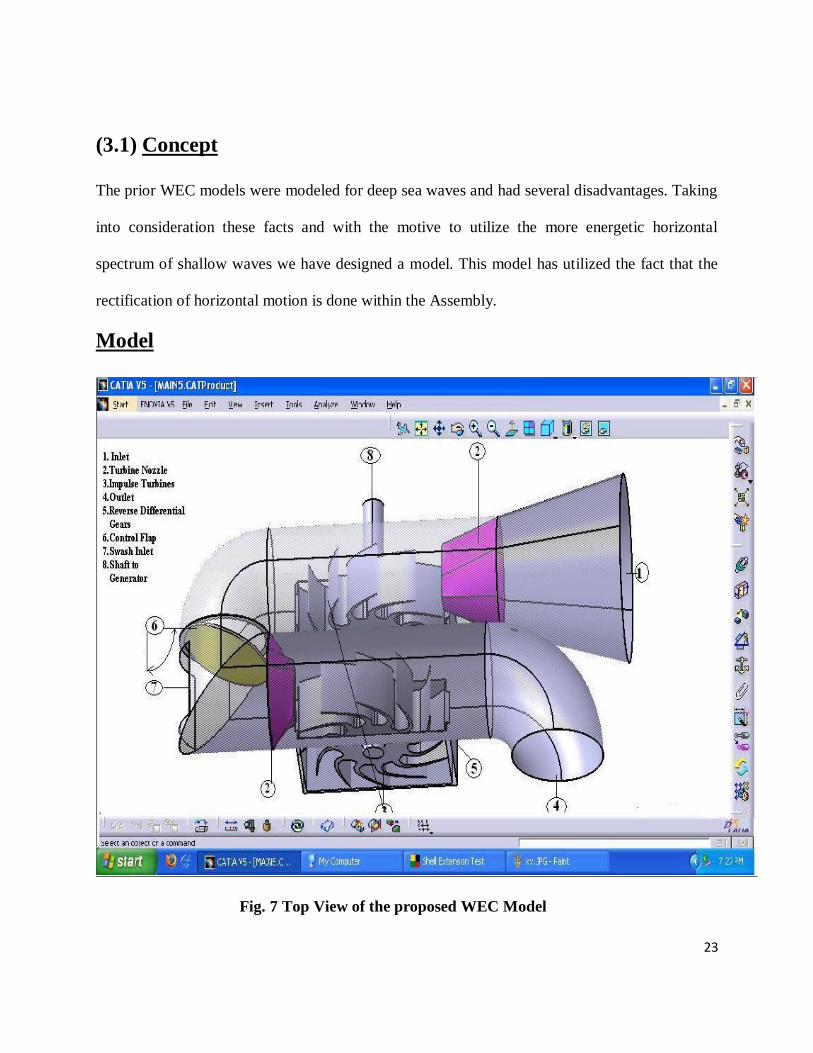
(3.1) Concept
The prior WEC models were modeled for deep sea waves and had several disadvantages. Taking
into consideration these facts and with the motive to utilize the more energetic horizontal
spectrum of shallow waves we have designed a model. This model has utilized the fact that the
rectification of horizontal motion is done within the Assembly.
Model
Fig. 7 Top View of the proposed WEC Model
24
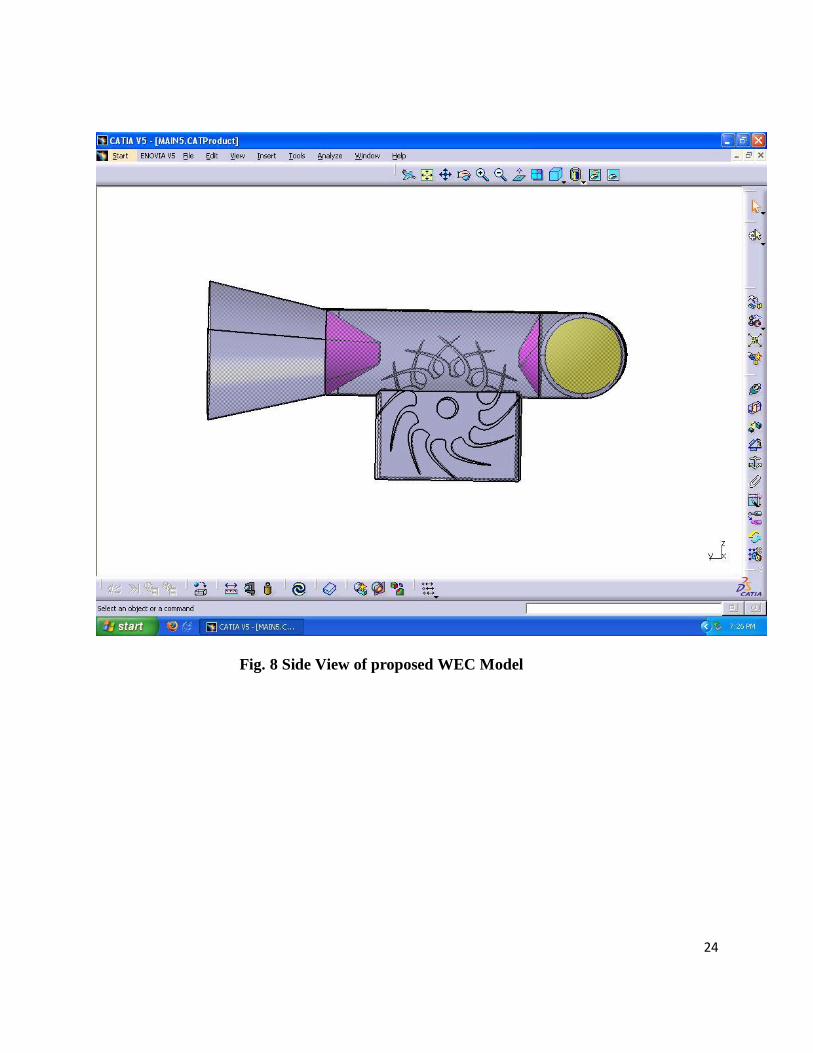
Fig. 8 Side View of proposed WEC Model
25
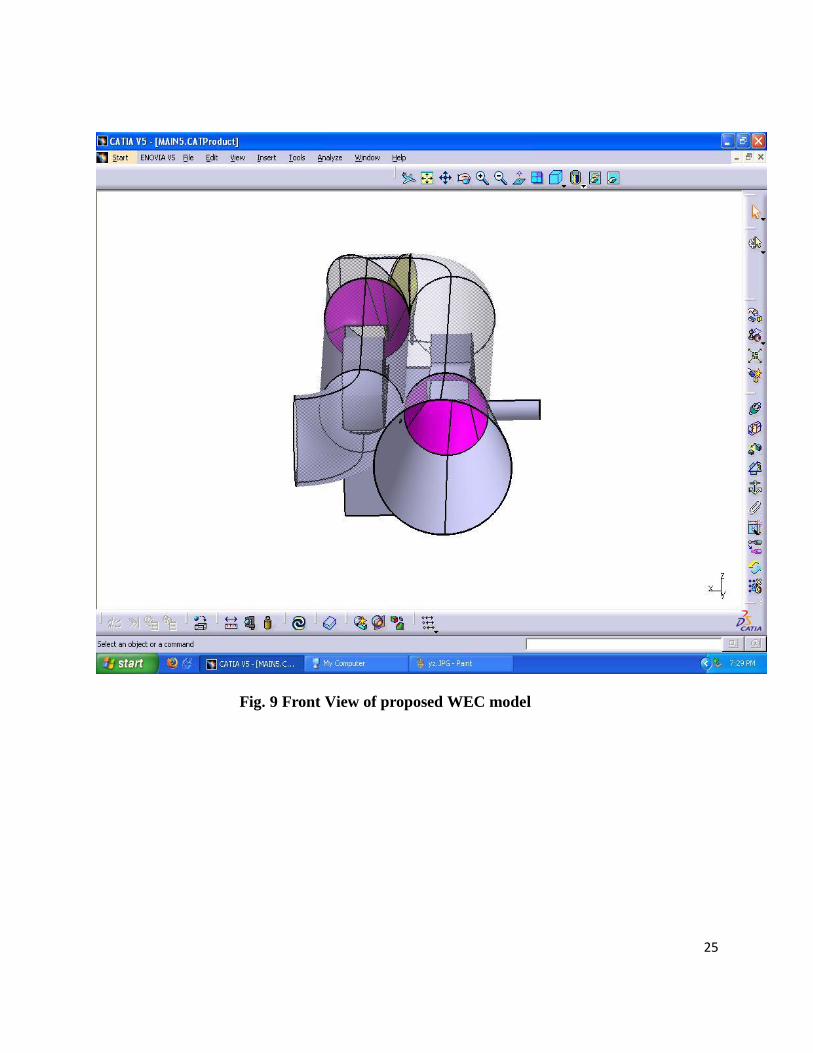
Fig. 9 Front View of proposed WEC model
26
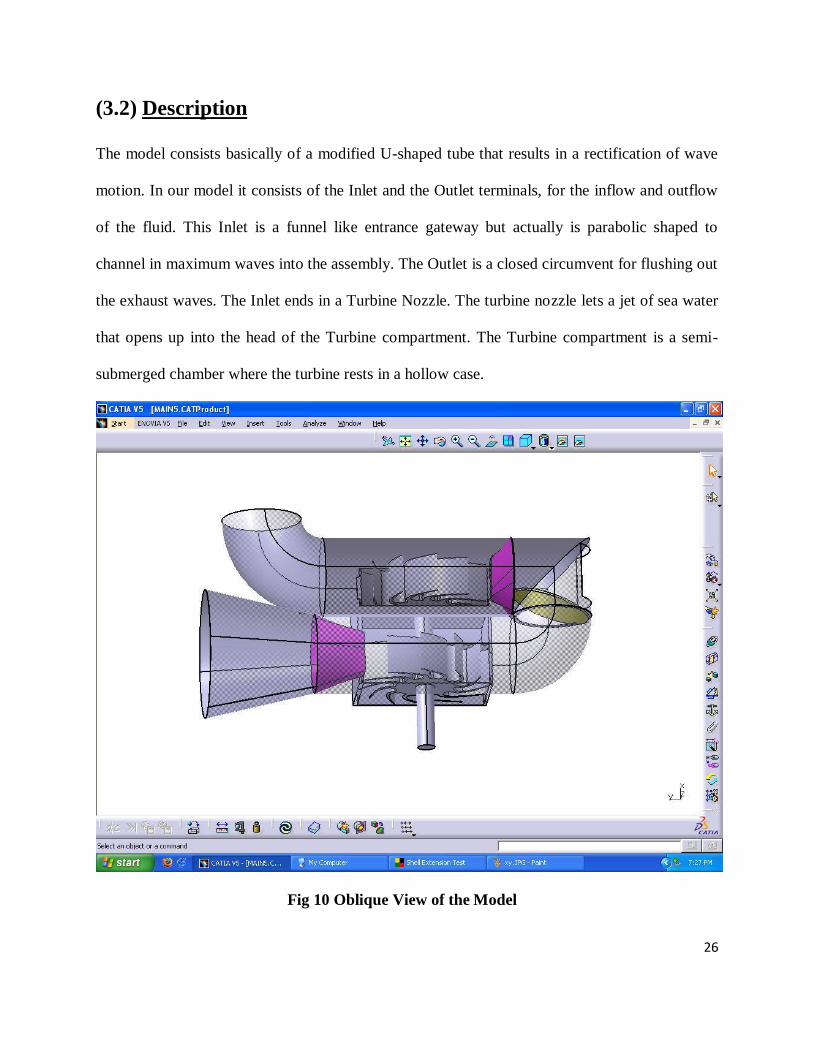
(3.2) Description
The model consists basically of a modified U-shaped tube that results in a rectification of wave
motion. In our model it consists of the Inlet and the Outlet terminals, for the inflow and outflow
of the fluid. This Inlet is a funnel like entrance gateway but actually is parabolic shaped to
channel in maximum waves into the assembly. The Outlet is a closed circumvent for flushing out
the exhaust waves. The Inlet ends in a Turbine Nozzle. The turbine nozzle lets a jet of sea water
that opens up into the head of the Turbine compartment. The Turbine compartment is a semi-
submerged chamber where the turbine rests in a hollow case.
Fig 10 Oblique View of the Model
27
In the U- shaped constriction there is another opening called the swash inlet that allows the
backwash to come inside like the usual waves. In the middle part of the assembly is the control
flap that acts as a mechanical control valve for the system it is hinged to the side of the tube. In
the second lap of the assembly there is another nozzle that jets in the water to a second turbine.
The second turbine is exactly the same like the first turbine but is oriented in different directions.
The two turbine shafts are coupled by anti-planetary gears to couple simultaneously the motions
of the turbines giving the output to the alternator or generator. The second turbine finally opens
itself unto the outlet and to the outside environment.
(3.3) Working Principle
The basic working principle of the model is based on self rectification of the horizontal spectrum
of the waves. The usual sea to land waves approach the assembly and funnels into it through the
Inlet channel that forces it into the Turbine nozzle. The turbine nozzle creates a jet of the flow
forcing the wave to pound on the turbine at a very high speed. The position of the nozzle hits the
head of the turbine to extract maximum output from the turbine. The wave further moves into the
curve here the control flap moves to close the swash inlet and allow the current wave to go
ahead. The wave further moves into the second turbine nozzle and again goes through the same
steps before exiting through the outlet channels.
In case of the unusual back swash currents and the
odd currents that have the direction of motion opposite to the conventional flow i.e from land to
sea these currents close the control flap from allowing the conventional flow from entering the
second turbine gateways. When the non-conventional flow becomes strong enough the control
28
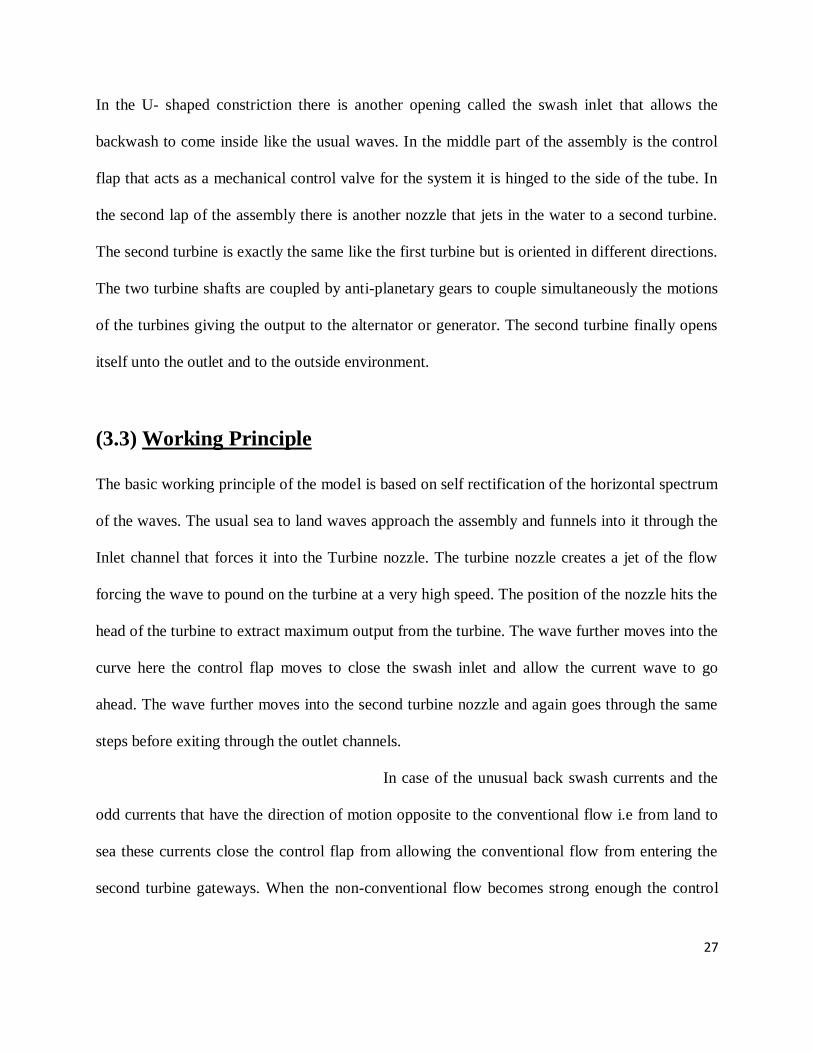
valve closes and the non-conventional currents enter the assembly by the Backswash Inlet and
enter the second turbine nozzle and exit through the outlet channel.
Fig. 11 Working Principle of the Model
In this entire process the non-directional motion of waves have no problem on the assembly
working, because either side of the flow produces an electrical energy. Only the conventional
flow will produce a better effect as compared to a non-conventional wave flow.
29
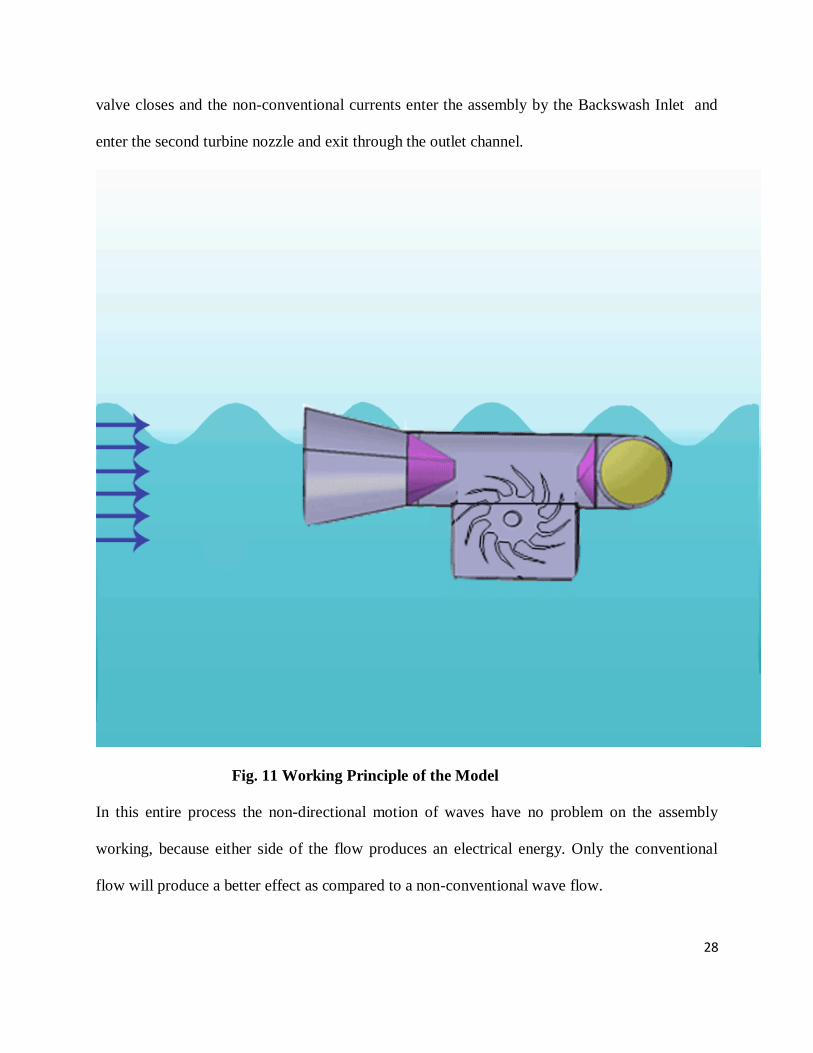
Block Diagram of Model
The entire model of the proposed structure has been represented in block diagram as below
Fig 12 Block Diagram of the Model
Placement in Ocean Environment
The system is placed with buoys and anchored to the surface of the ocean by flexible mooring
system that gives its flexibility and support when need arises.
30
CHAPTER 4
TURBINE SPECIFICATIONS
31
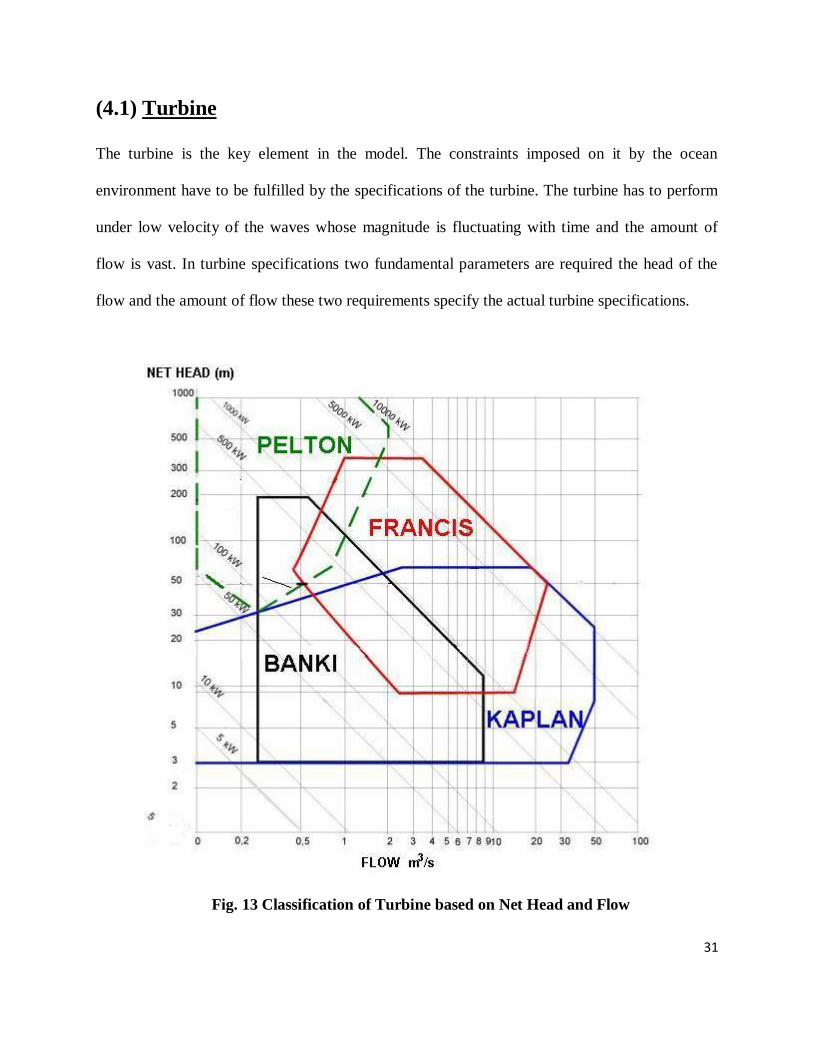
(4.1) Turbine
The turbine is the key element in the model. The constraints imposed on it by the ocean
environment have to be fulfilled by the specifications of the turbine. The turbine has to perform
under low velocity of the waves whose magnitude is fluctuating with time and the amount of
flow is vast. In turbine specifications two fundamental parameters are required the head of the
flow and the amount of flow these two requirements specify the actual turbine specifications.
Fig. 13 Classification of Turbine based on Net Head and Flow
32
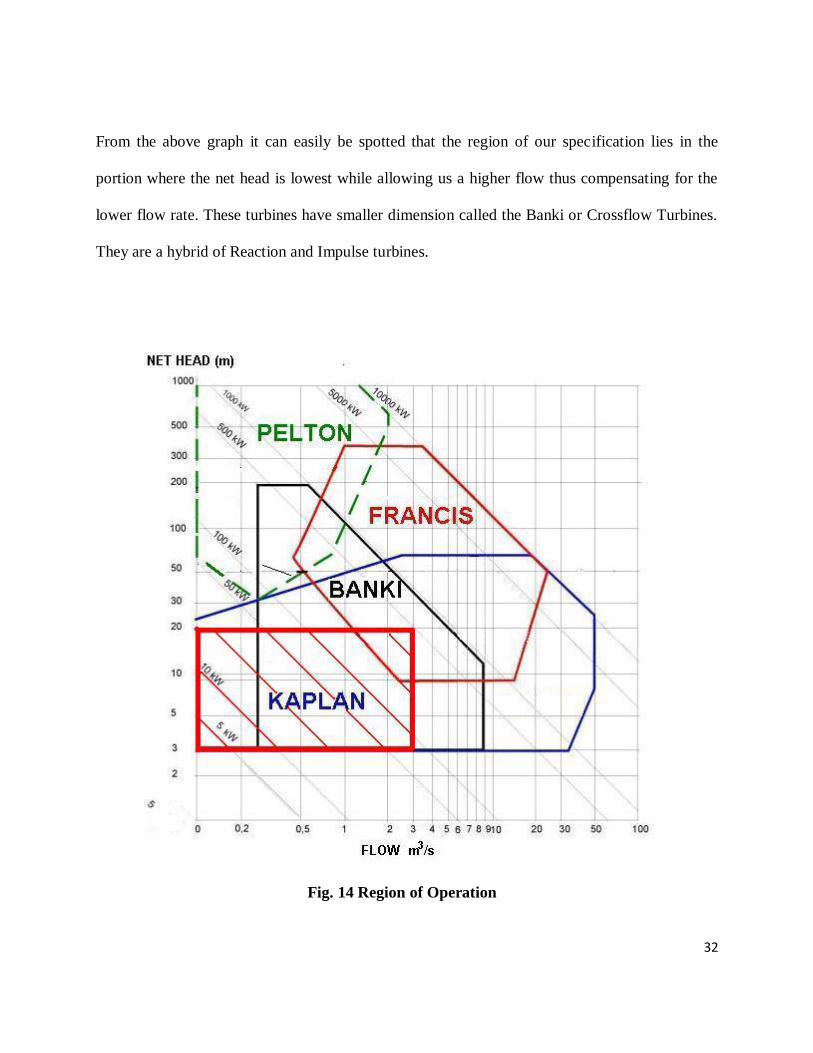
From the above graph it can easily be spotted that the region of our specification lies in the
portion where the net head is lowest while allowing us a higher flow thus compensating for the
lower flow rate. These turbines have smaller dimension called the Banki or Crossflow Turbines.
They are a hybrid of Reaction and Impulse turbines.
Fig. 14 Region of Operation
33
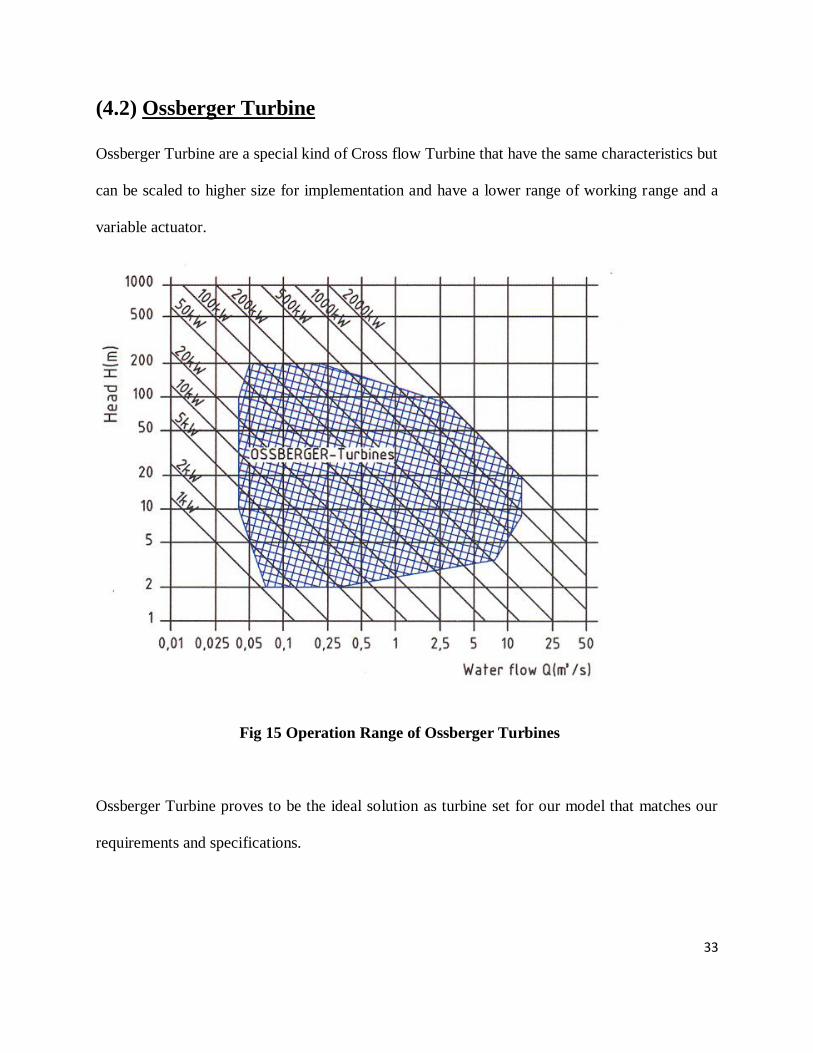
(4.2) Ossberger Turbine
Ossberger Turbine are a special kind of Cross flow Turbine that have the same characteristics but
can be scaled to higher size for implementation and have a lower range of working range and a
variable actuator.
Fig 15 Operation Range of Ossberger Turbines
Ossberger Turbine proves to be the ideal solution as turbine set for our model that matches our
requirements and specifications.

34
CHAPTER 5
IMPLEMENTATION AND RESULTS
35
(5.1) Effect of Water Depth
Effect of Water Depth on Performance
Unlike more mature renewable energy technologies such as wind turbines, there is currently no
commonly accepted generic technological configuration for the extraction of ocean wave energy.
To date the majority of effort has focused on shoreline oscillating water columns (OWC’s) and
offshore floating devices. Shoreline OWC’s have attracted interest because of their fundamental
simplicity of operation (the waves act as a giant reciprocating piston driving air through a self-
rectifying turbine) and good accessibility, due to their location onshore. Offshore floating
devices have attracted interest because of the higher levels of annual average incident wave
power that occur in deep water and the minimal topographical constraints for their deployment.
An area that has received less focus is seabed-mounted active near-shore devices, where near-
shore is defined as having a water depth of between 10 and 20m and will typically be located at a
distance of between 0.5 and 2.0km from the coastline. It would appear that this is primarily
because the near-shore has a lower annual average incident wave power than in deep water, even
though the exploitable resource is often only 5–10% less.
However, devices located in the near-shore
have a number of potential advantages over offshore devices. Being closer to the coast the cost
of the cable(s) bringing power to the shore will be lower for a near-shore device compared to an
offshore device and also the power losses in the cable will be smaller. The closer location to the
36
shoreline and shallower water depth is also likely to reduce the installation and maintenance
costs, with operations being completed in shorter weather windows and with less specialised
equipment. With operations and maintenance
The effect of water depth on incident wave power
Assuming that energy losses from white-capping are insignificant, then the decrease of incident
wave power in shallow water is due to seabed friction and wave breaking. The significant wave
height at typical locations for wave energy converters is typically less than four metres. Depth
induced wave breaking occurs when the wave height is more than approximately 0.78 of the
water depth and so in water depths of 10m or greater, wave breaking will not contribute
significantly to a reduction in the incident wave power. Thus, seabed friction is the major source
of incident wave power reduction at near-shore sites. Although a number of different methods
for estimating the energy loss due to seabed friction have been proposed, a commonly adopted
method approximates the friction as a turbulent boundary layer with a constant drag coefficient,
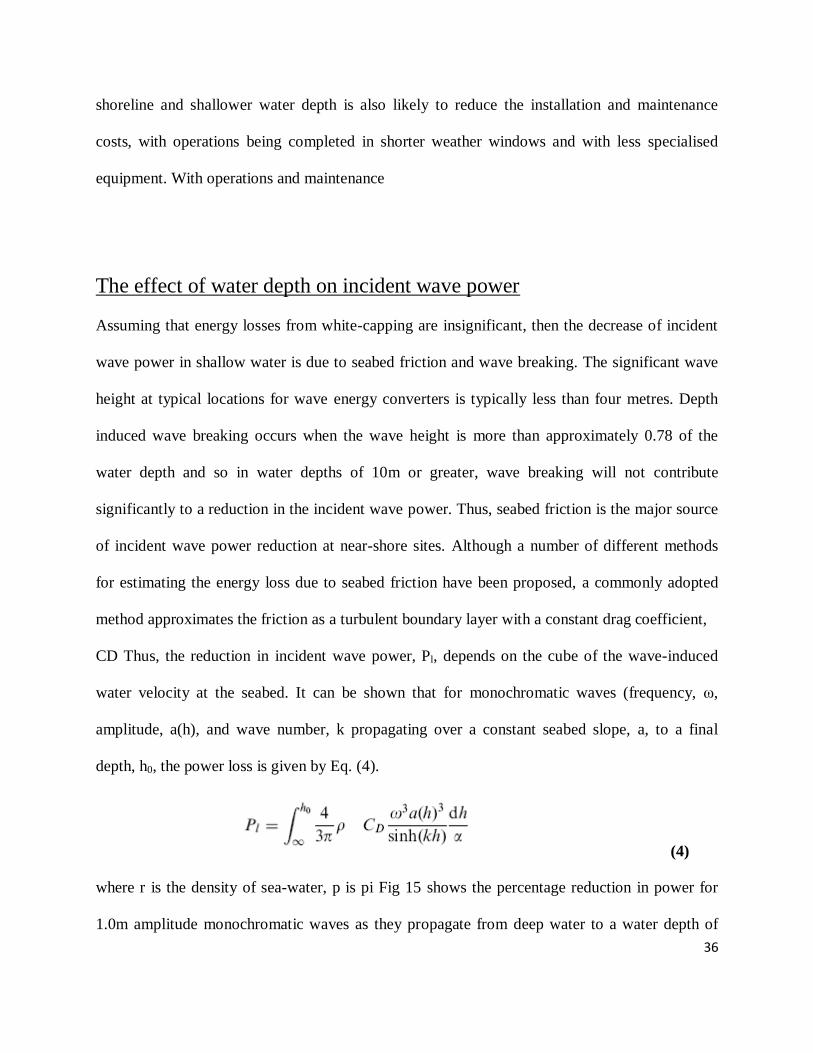
CD Thus, the reduction in incident wave power, Pl, depends on the cube of the wave-induced
water velocity at the seabed. It can be shown that for monochromatic waves (frequency, ω,
amplitude, a(h), and wave number, k propagating over a constant seabed slope, a, to a final
depth, h0, the power loss is given by Eq. (4).
(4)
where r is the density of sea-water, p is pi Fig 15 shows the percentage reduction in power for
1.0m amplitude monochromatic waves as they propagate from deep water to a water depth of
37
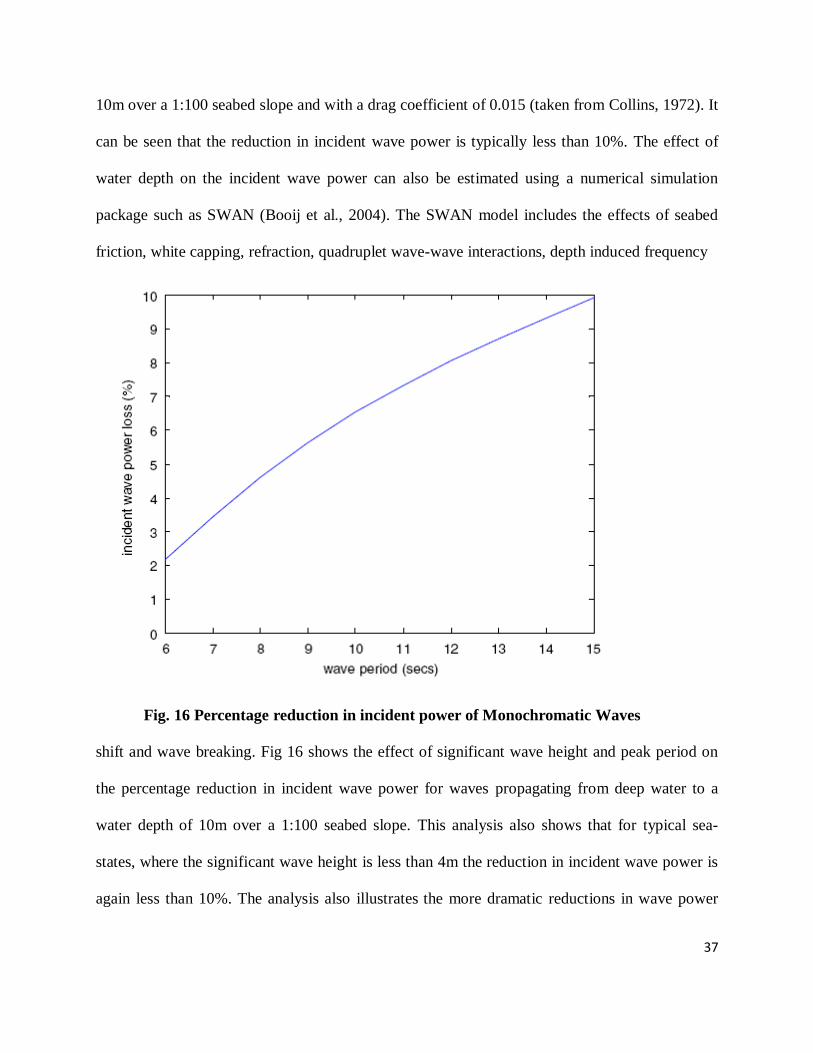
10m over a 1:100 seabed slope and with a drag coefficient of 0.015 (taken from Collins, 1972). It
can be seen that the reduction in incident wave power is typically less than 10%. The effect of
water depth on the incident wave power can also be estimated using a numerical simulation
package such as SWAN (Booij et al., 2004). The SWAN model includes the effects of seabed
friction, white capping, refraction, quadruplet wave-wave interactions, depth induced frequency
Fig. 16 Percentage reduction in incident power of Monochromatic Waves
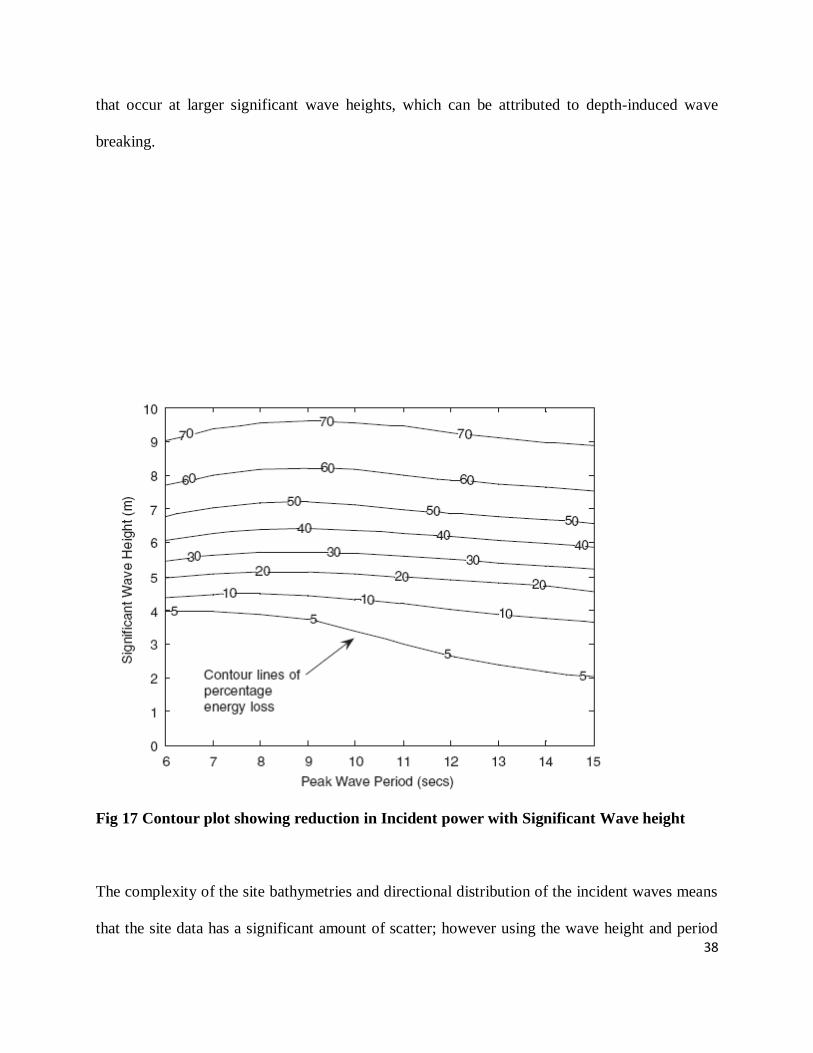
shift and wave breaking. Fig 16 shows the effect of significant wave height and peak period on
the percentage reduction in incident wave power for waves propagating from deep water to a
water depth of 10m over a 1:100 seabed slope. This analysis also shows that for typical sea-
states, where the significant wave height is less than 4m the reduction in incident wave power is
again less than 10%. The analysis also illustrates the more dramatic reductions in wave power
38
that occur at larger significant wave heights, which can be attributed to depth-induced wave
breaking.
Fig 17 Contour plot showing reduction in Incident power with Significant Wave height
The complexity of the site bathymetries and directional distribution of the incident waves means
that the site data has a significant amount of scatter; however using the wave height and period
39
dependent reduction in incident wave power the reduction in annual average incident wave
power is reasonably well estimated.
Effect of Depth on Surge of Device and Energy Capture
During the initial research into the hydrodynamics of wave energy converters it was discovered
that bodies with dimensions small relative to the incident wavelengths could act in a similar way
to an aerial and capture energy from a width greater then their own. This became known as the
point-absorber theory (Evans, 1980, Falnes & Budal, 1978) and equation (5) shows the
maximum power capture, Pmax, of a small body (n = 1 for heave, n = 2 for surge) subjected to a
wave of wavelength, k, and power per unit crest length, Pi, which can be derived from this
theory.
Pmax = nλ/2π Pi (6)
Although, this theory has been shown to be accurate for a small wave energy converter subjected
to small amplitude monochromatic waves in a wave tank, only a fraction of this maximum power
capture has ever been achieved in more realistic seas. Assuming that the wave energy converter’s
motion can be optimally controlled so that it is in phase with water particle velocity, the inability
to capture the maximum power is due to a constraint on the body’s amplitude of motion. For
example, for a 10m diameter floating hemisphere in a 10 s wave the optimum amplitude of
motion is approximately 12 times the incident wave amplitude. Motion constraints arise from
40
two fundamental sources, either from a physical constraint or because of additional power
dissipation due to the body’s motion, typically because of hydrodynamic losses such as vortex
shedding. The effect of physical constraints on a body’s amplitude of motion has been
investigated by Evans (Evans, 1985) who showed that for the ratio of amplitude of motion to
optimum amplitude of motion, r, then the power capture, P, is given by Eq. (7)
P =Pmax(2r - r2) (7)
However, it is insightful to re-write Eq. (3) in terms of the wave force and amplitude of motion
as given by Eq. (8)
P= Fωx(1 – 0.5 r)/2 (8)
Where F is the wave force,
ω is the wave frequency and
x is the amplitude of motion.
Thus, if the motion is highly constrained (r-0) then the power capture is proportional to the wave
force.
The effect of additional power dissipation from the body’s motion can be approximated by
including an additional damping term so that by modification of Evans’ equation for maximum
power capture (Evans, 1976), the power capture is given by Eq. (9)
P = F2/8(B+Bv) (9)
where B is the hydrodynamic added damping coefficient and Bv is the additional, linearised,
parasitic damping coefficient. Thus, in cases where the damping is dominated by the parasitic
41
damping (BvcB) then the power capture is proportional to the wave force squared. It is also
possible to estimate the maximum power capture if the phase of the wave energy converter’s
motion cannot be optimally controlled and if a simple dissipative power take-off mechanism is
used. Eq. (9) shows the maximum power capture assuming that the wave frequency is not close
to the wave energy converter’s natural frequency, xn, and the system’s inertial forces are much
larger than the radiation damping force where M is the total system inertia and K is the system
spring stiffness. As previously with the effect of motion constraints and parasitic losses the
power capture depends on the system dynamics and the incident wave force; in this case the
maximum power capture is approximately proportional to the wave force squared. Because of
the importance of motion constraints and tuning to the maximum power capture of a small
surging wave energy converter, Eq. (6), (7) and (8) are more useful representations of power
capture than Eq. (2). These equations illustrate that power capture depends primarily on the
incident wave force, rather than the incident wave power. This implies that the best locations for
small surging wave energy converters are where the incident surge wave force is largest, and
only depends on the incident wave power in so much as this influences the incident wave force.
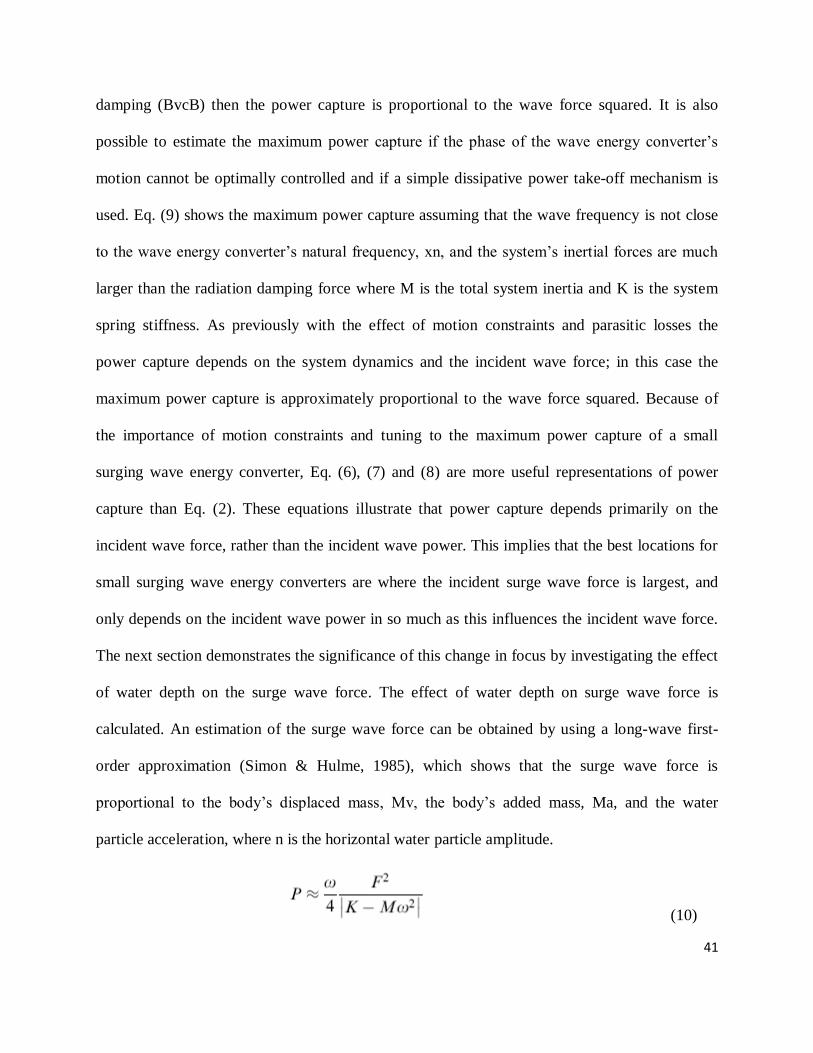
The next section demonstrates the significance of this change in focus by investigating the effect
of water depth on the surge wave force. The effect of water depth on surge wave force is
calculated. An estimation of the surge wave force can be obtained by using a long-wave first-
order approximation (Simon & Hulme, 1985), which shows that the surge wave force is
proportional to the body’s displaced mass, Mv, the body’s added mass, Ma, and the water
particle acceleration, where n is the horizontal water particle amplitude.
(10)
42
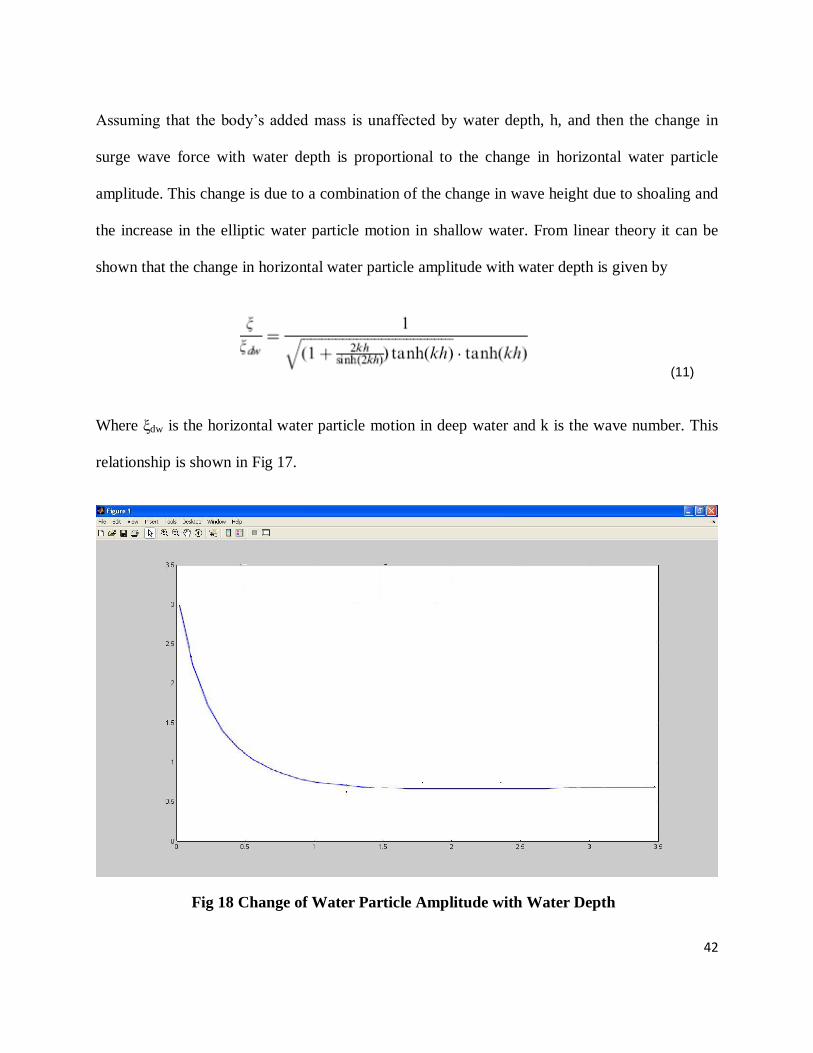
Assuming that the body’s added mass is unaffected by water depth, h, and then the change in
surge wave force with water depth is proportional to the change in horizontal water particle
amplitude. This change is due to a combination of the change in wave height due to shoaling and
the increase in the elliptic water particle motion in shallow water. From linear theory it can be
shown that the change in horizontal water particle amplitude with water depth is given by
(11)
Where ξdw is the horizontal water particle motion in deep water and k is the wave number. This
relationship is shown in Fig 17.
Fig 18 Change of Water Particle Amplitude with Water Depth
43
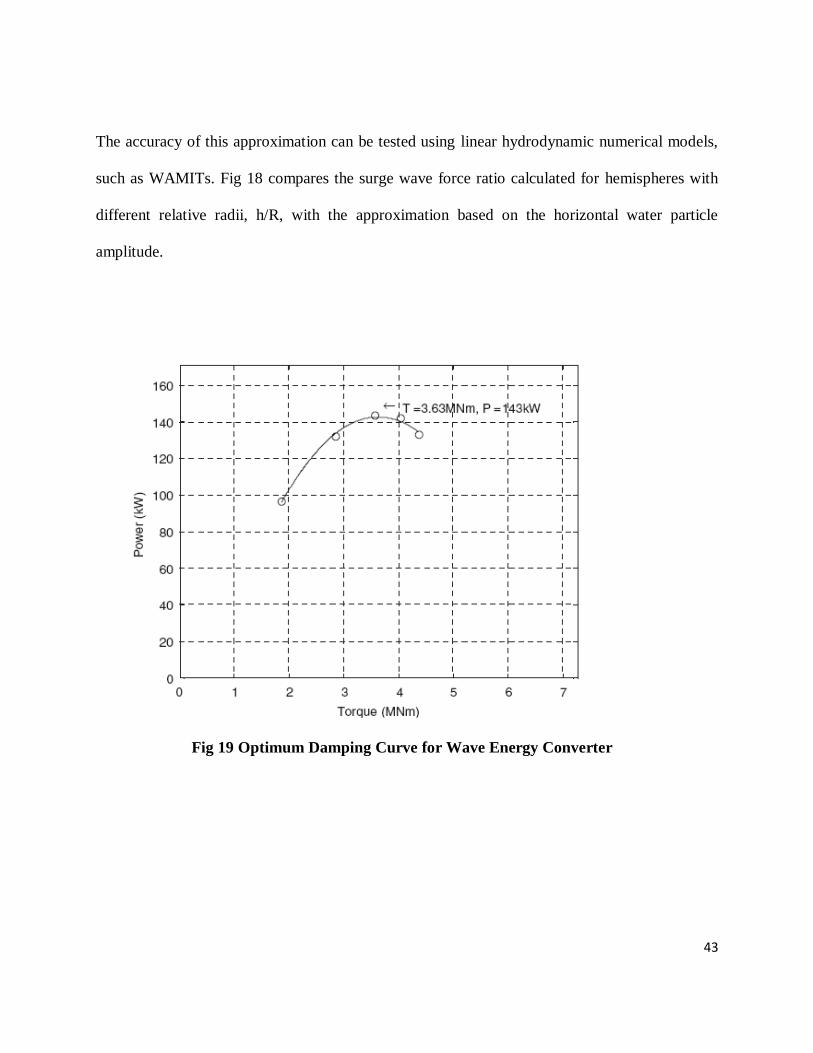
The accuracy of this approximation can be tested using linear hydrodynamic numerical models,
such as WAMITs. Fig 18 compares the surge wave force ratio calculated for hemispheres with
different relative radii, h/R, with the approximation based on the horizontal water particle
amplitude.
Fig 19 Optimum Damping Curve for Wave Energy Converter
44
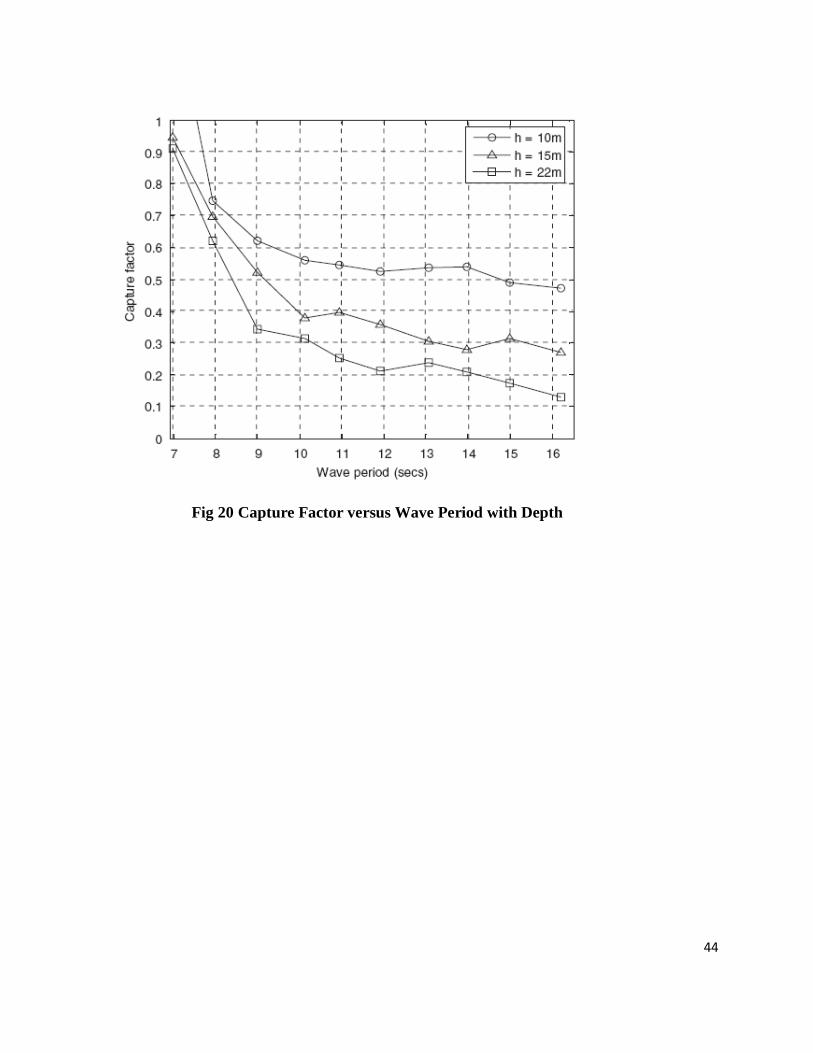
Fig 20 Capture Factor versus Wave Period with Depth
45
(5.2) Analysis of Suitable Alternator/ Generator Topology
To convert wave power into electricity, many types of generator concepts have been used and
proposed. Most of the low speed turbine generators presented is permanent-magnet (PM)
machines. These have advantages of high efficiency and reliability, since there is no need of
external excitation and conductor losses are removed from the rotor [5].
Basically, PM generators can be divided into radial-flux and axial-flux machines, according to
the flux direction in the air gap. Transverse flux machines exist, but do not seem to have gained a
foothold in wind power generation. The availability of modern high energy density magnet
materials, such as NdFeB, has made it possible to design special topologies such as toothless
stators with air gap windings [6]. A comparison of generator topologies for direct-drive wind
turbines has been carried out, using torque density and cost/torque with respect to the machine
outer diameter as the criteria [7].
Several different machine prototypes are compared. However, the study lacks theoretical
background and the data considered deal with different requirements and situations. A
comparison of machines of different topologies is a delicate task. An analytical approach for the
derivation of the torque density and mass of active material has been conducted.
The machine topologies considered in this study include the conventional inner rotor
radial-flux construction, outer rotor radial-flux construction, double stator axial-flux
construction, double rotor axial-flux construction, single sided axial-flux constructions with force
balance stator and force balance rotor, and Torus toothless axial-flux construction. All the
machines compared are built with surface mounted magnets, NdFeB, and grouped into two
46
categories. One has direct-driven generators operating at low speeds of 50 rpm or 100 rpm; the
other has the machines rotating at a high speed of 1200 rpm, where gearboxes are needed.
The results of the comparison are given in graphical form and will be explained in the following sections.
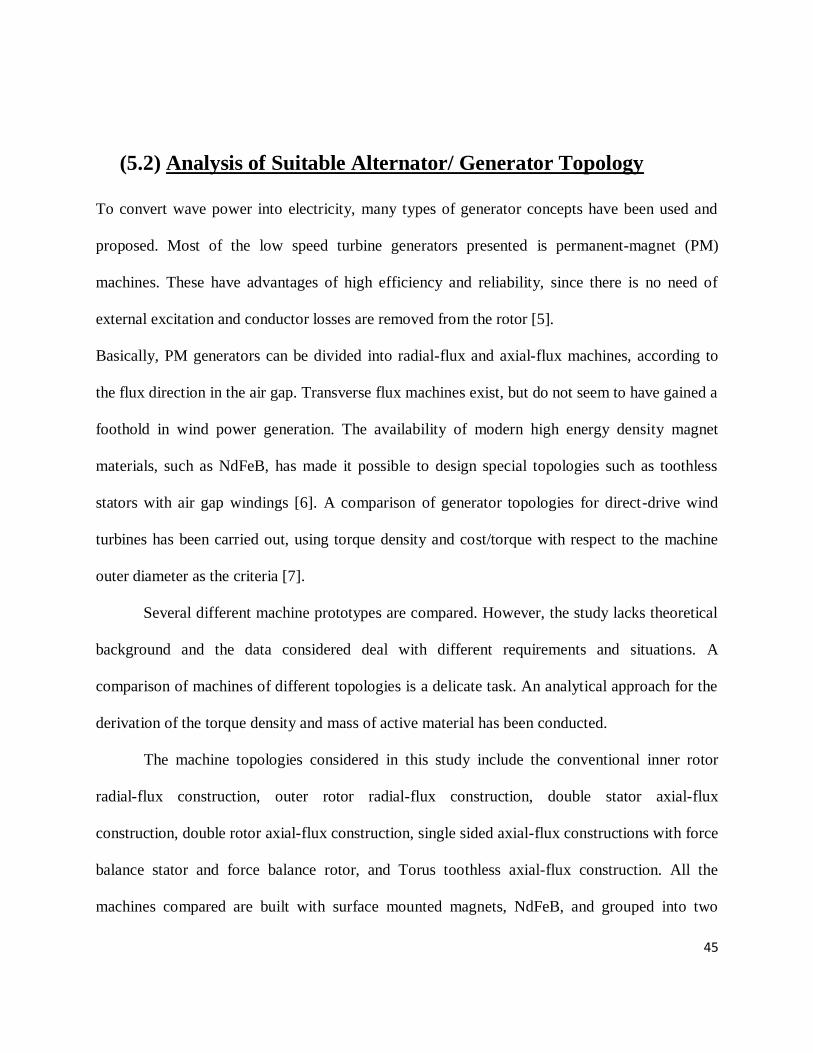
(A) Torque/volume and Torque/weight vs. Power
Torque per volume or torque density is chosen because it is independent of the choice of the
rotational speed. This is true only up to a certain speed, which is far above the typical speeds
found in wind turbines. The torque/volume is defined as the ratio of the developed torque of the
generator to the active volume of the machine. The active volume includes the volume of
magnets, copper conductor, stator teeth and yoke.
Fig. 21 Measured and Calculated Torque with Different Current
47
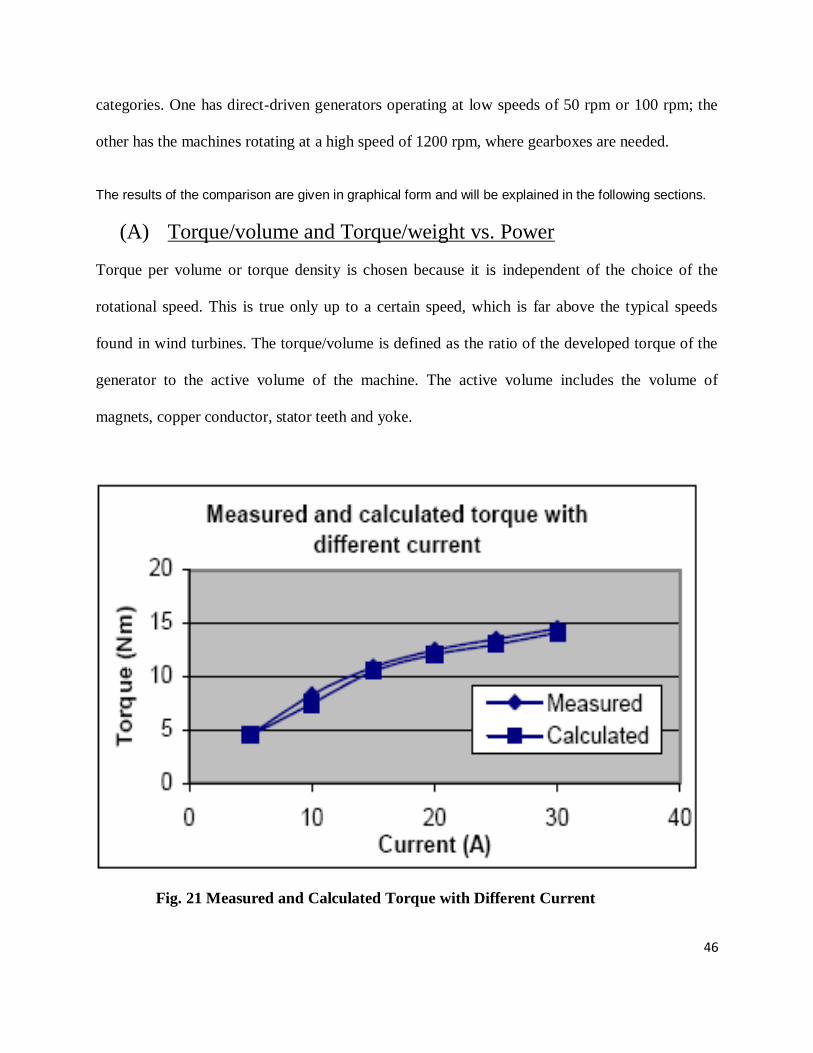
Fig 22 Measured and Calculated Excitation Voltage at Various Rotor Speeds
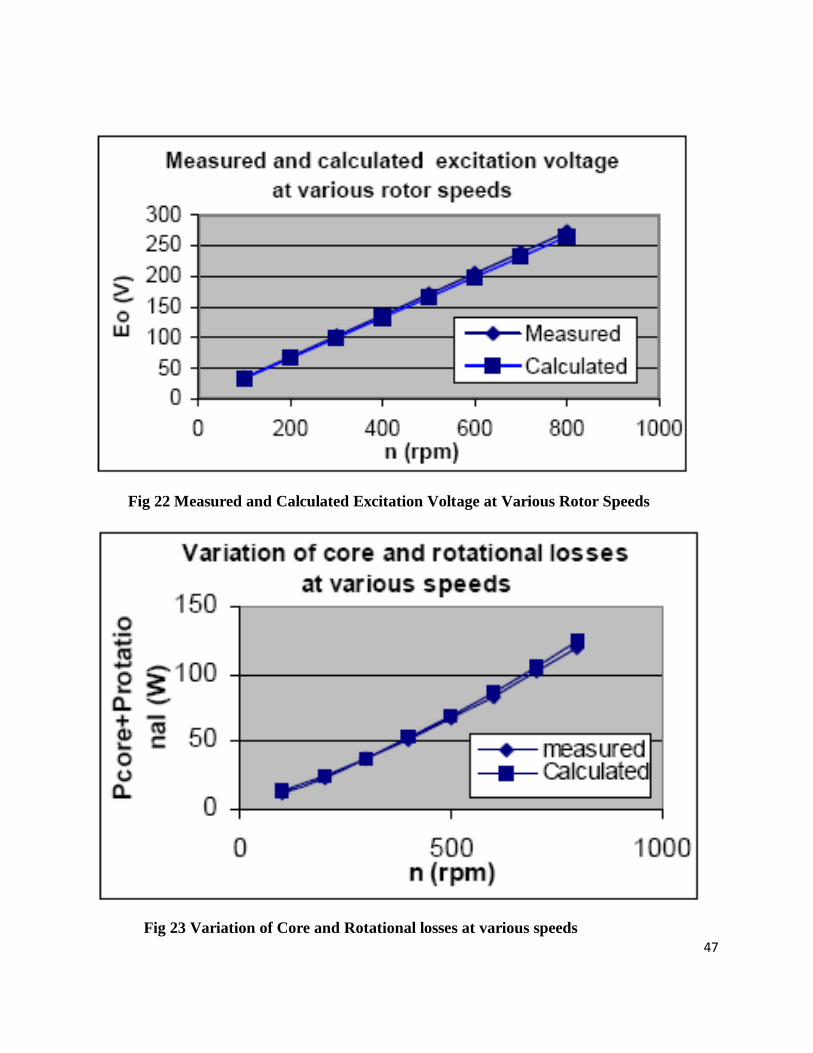
Fig 23 Variation of Core and Rotational losses at various speeds
48
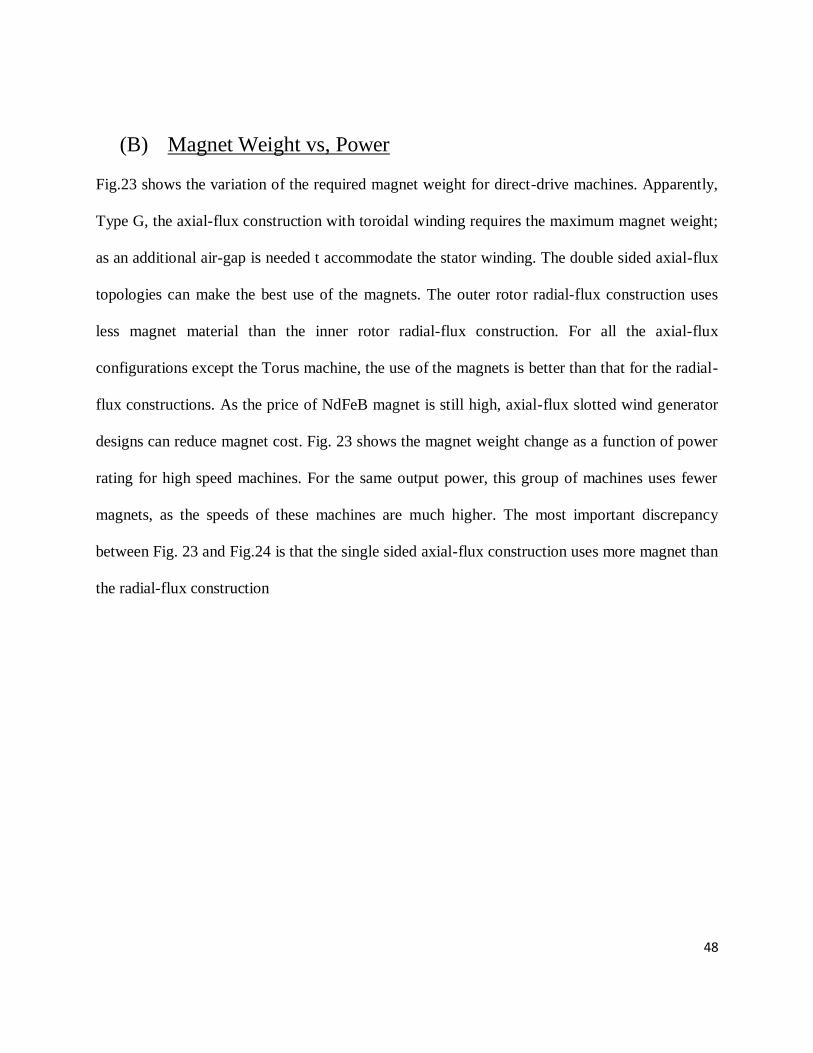
(B) Magnet Weight vs, Power
Fig.23 shows the variation of the required magnet weight for direct-drive machines. Apparently,
Type G, the axial-flux construction with toroidal winding requires the maximum magnet weight;
as an additional air-gap is needed t accommodate the stator winding. The double sided axial-flux
topologies can make the best use of the magnets. The outer rotor radial-flux construction uses
less magnet material than the inner rotor radial-flux construction. For all the axial-flux
configurations except the Torus machine, the use of the magnets is better than that for the radial-
flux constructions. As the price of NdFeB magnet is still high, axial-flux slotted wind generator
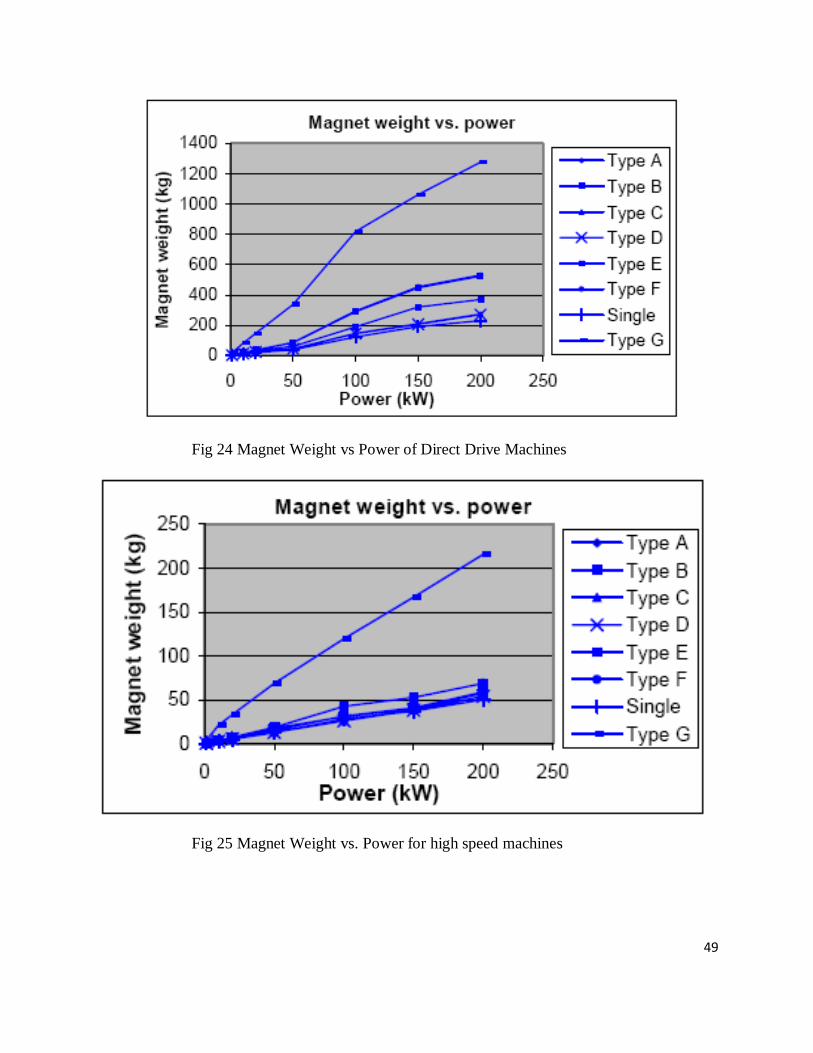
designs can reduce magnet cost. Fig. 23 shows the magnet weight change as a function of power
rating for high speed machines. For the same output power, this group of machines uses fewer
magnets, as the speeds of these machines are much higher. The most important discrepancy
between Fig. 23 and Fig.24 is that the single sided axial-flux construction uses more magnet than
the radial-flux construction
49
Fig 24 Magnet Weight vs Power of Direct Drive Machines
Fig 25 Magnet Weight vs. Power for high speed machines
50
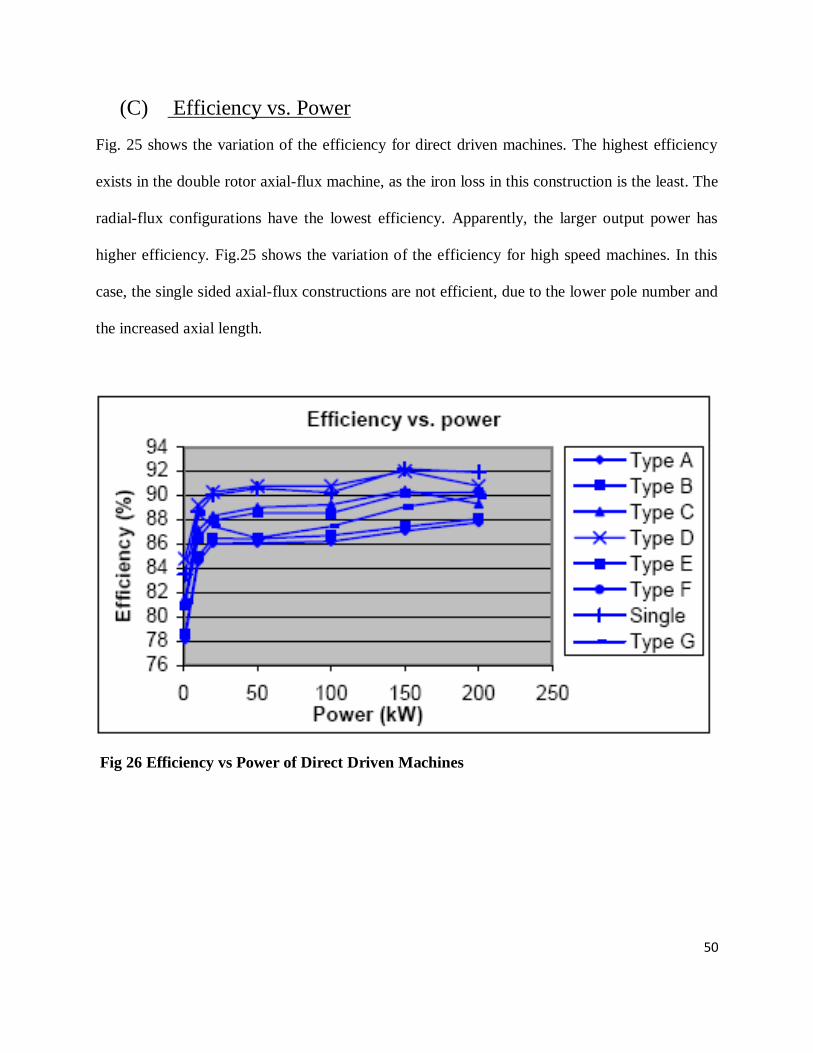
(C) Efficiency vs. Power
Fig. 25 shows the variation of the efficiency for direct driven machines. The highest efficiency
exists in the double rotor axial-flux machine, as the iron loss in this construction is the least. The
radial-flux configurations have the lowest efficiency. Apparently, the larger output power has
higher efficiency. Fig.25 shows the variation of the efficiency for high speed machines. In this
case, the single sided axial-flux constructions are not efficient, due to the lower pole number and
the increased axial length.
Fig 26 Efficiency vs Power of Direct Driven Machines
51
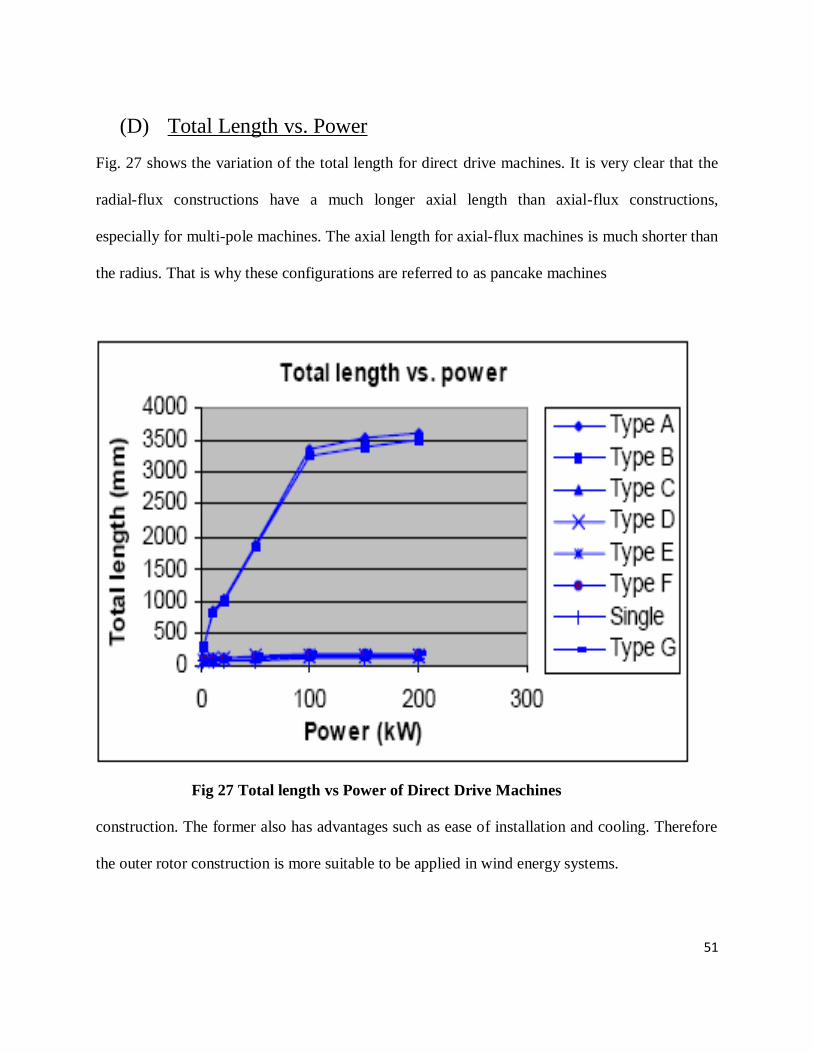
(D) Total Length vs. Power
Fig. 27 shows the variation of the total length for direct drive machines. It is very clear that the
radial-flux constructions have a much longer axial length than axial-flux constructions,
especially for multi-pole machines. The axial length for axial-flux machines is much shorter than
the radius. That is why these configurations are referred to as pancake machines
Fig 27 Total length vs Power of Direct Drive Machines
construction. The former also has advantages such as ease of installation and cooling. Therefore
the outer rotor construction is more suitable to be applied in wind energy systems.

52
The Torus construction is simple and many researches have chosen this configuration.
However, this construction requires more magnet weight because of the presence of the
additional air-gap for accommodating stator windings. As the power rating increases, both the
air-gap and air-gap reluctance due to the magnet and winding become larger. Therefore this
construction is more suitable for low power rating wind generators.
For most of the comparisons, the low speed constructions are superior to the high speed
constructions, which mean that multi-pole PM generators are preferred in the application of
small, gearless, low speed wave system.

53
CHAPTER 6
CONCLUSION
54
Conclusion
In our project we have modeled a wave energy converter on a new line to harness the shallow
waves, predominantly its horizontal spectrum. The model has been evaluated for its feasibility
and efficiency in another project the central theme of our project was to evaluate the implications
of depth on incident wave energy capture at shallow depth and depth induced wave breaking. It
was found that at most sea states the depth although varies with wave amplitude but can be
statistically reliable for long term wave capturing at most depth greater than the wave base.
Another important aspect of the project was to decide whether to
couple the device with direct drive machines or via gears to high speed alternators. Various
parameters of alternator and Generators were used and it was found that the Direct drives having
slow rpm but high torque proved cost effective and efficient under the marine system.
Particularly the Transverse Flux Permanent Magnet topology incorporated direct drive would be
most useful in our project.
55
REFERENCES
1. Demographical Distribution along coastlines 2005” World Meteorological Organization.
2. J.Vining, University of Wisconsin Madison December 2006
3. Department of Energy, US www.energy.gov
4. Heideki Takawachi “Ocean Waves & Currents” International Symposium of Oceanic
Technologies 2005
5. Katsuhara et al., 1987; Neal, 1993; Tan et al., 1995; Ueki et al., 2000
6. Petri Lampola Directly Driven, Low-Speed Permanent-Magnet Generators for Wind Power
Applications, Helsinki University of Technology.
7. M.R Dubois, H. Polinder, J. A. Ferreira, Comparison of generator topologies for direct-drive
wind turbines, Delft University of Technology.
8. M. Folley, T.J.T. Whittaker, A. Henry, Ocean Engineering University of Belfast.
9. Aqua buoy Inc. Pvt Ltd
![Geo 7th Wave Preso ACG (002).pptx [Read-Only] · Not associated with geysers ... Horizontal and Vertical. 1/11/2016 9 Horizontal Racetrack Design ... Difference between the two systems](https://img.pdfslide.us/doc/110x75/5aedb2ee7f8b9a3b2e90f5ec/geo-7th-wave-preso-acg-002pptx-read-only-associated-with-geysers-horizontal.jpg)