Embed Size (px)
Citation preview
Volume 4, Issue 8, August – 2019 International Journal of Innovative Science and Research Technology
ISSN No:-2456-2165
IJISRT19AUG581 www.ijisrt.com 71
Harnessing of Wave Energy as Renewable Energy:
An Overview
Md. Masood Ahmad1 Amit kumar2 Md. Sarfaraj Alam3 Dept. of Civil Engg.
Maulana Azad College of Engineering &Technology, Patna
Abstract:- Wave energy is the most promising form of
ocean energy which during extraction process does not
emit carbon dioxide or produce any waste. It creates no
noise pollution and is environmental friendly. Unlike
other renewable energy sources, it is more predictable.
Till date, only a small part of abundance energy stored in
waves has been utilized. This large untapped source of
energy could meet the global energy demand if technical
and other barriers are overcome and its cost is thereby
reduced. This paper presents an overview in respect of
current status of research and development in harnessing
of wave energy. The article focuses on available
technology to extract power, its estimated potential and
current exploitation level both globally as well as in India.
Further, barriers and obstacles in its deployment and
commercialization and perspective of the cost of
generating power have also been discussed.
Keywords:- Waves, Wave Energy, Wave Energy Converter,
Wave Power.
I. INTRODUCTION
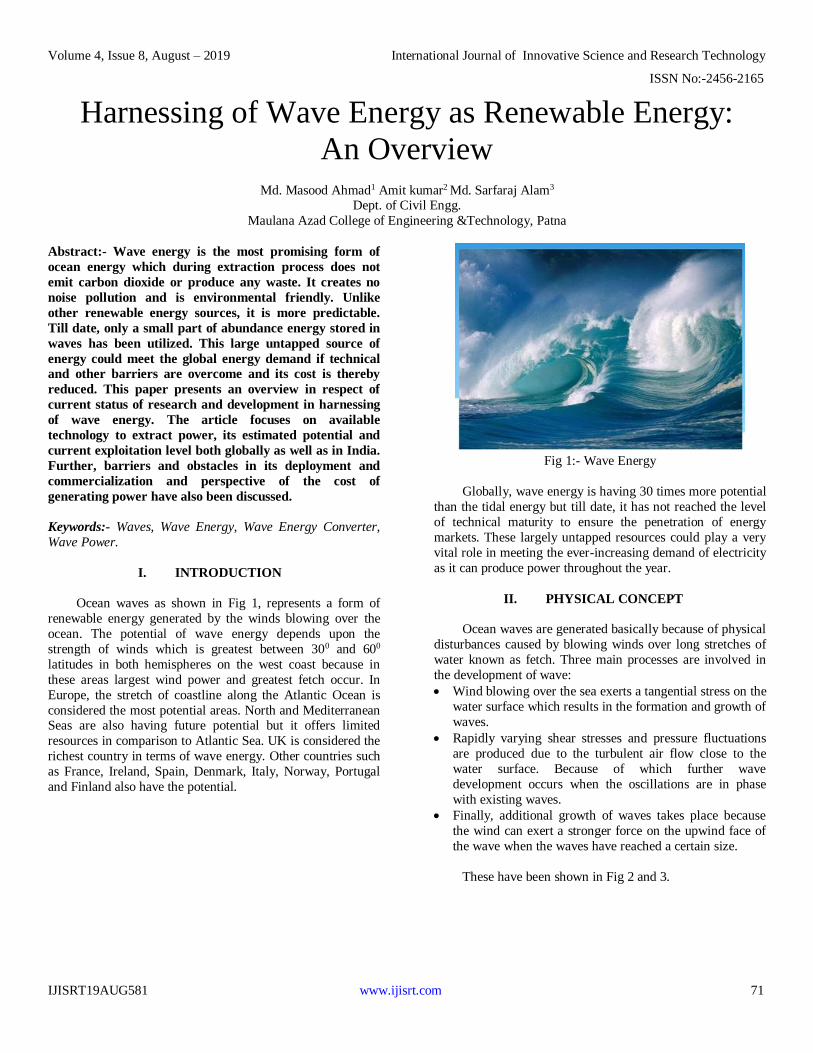
Ocean waves as shown in Fig 1, represents a form of
renewable energy generated by the winds blowing over the
ocean. The potential of wave energy depends upon the
strength of winds which is greatest between 300 and 600
latitudes in both hemispheres on the west coast because in
these areas largest wind power and greatest fetch occur. In
Europe, the stretch of coastline along the Atlantic Ocean is
considered the most potential areas. North and Mediterranean Seas are also having future potential but it offers limited
resources in comparison to Atlantic Sea. UK is considered the
richest country in terms of wave energy. Other countries such
as France, Ireland, Spain, Denmark, Italy, Norway, Portugal
and Finland also have the potential.
Fig 1:- Wave Energy
Globally, wave energy is having 30 times more potential
than the tidal energy but till date, it has not reached the level
of technical maturity to ensure the penetration of energy
markets. These largely untapped resources could play a very
vital role in meeting the ever-increasing demand of electricity
as it can produce power throughout the year.
II. PHYSICAL CONCEPT
Ocean waves are generated basically because of physical
disturbances caused by blowing winds over long stretches of
water known as fetch. Three main processes are involved in
the development of wave:
Wind blowing over the sea exerts a tangential stress on the
water surface which results in the formation and growth of
waves.
Rapidly varying shear stresses and pressure fluctuations
are produced due to the turbulent air flow close to the
water surface. Because of which further wave
development occurs when the oscillations are in phase
with existing waves.
Finally, additional growth of waves takes place because
the wind can exert a stronger force on the upwind face of
the wave when the waves have reached a certain size.
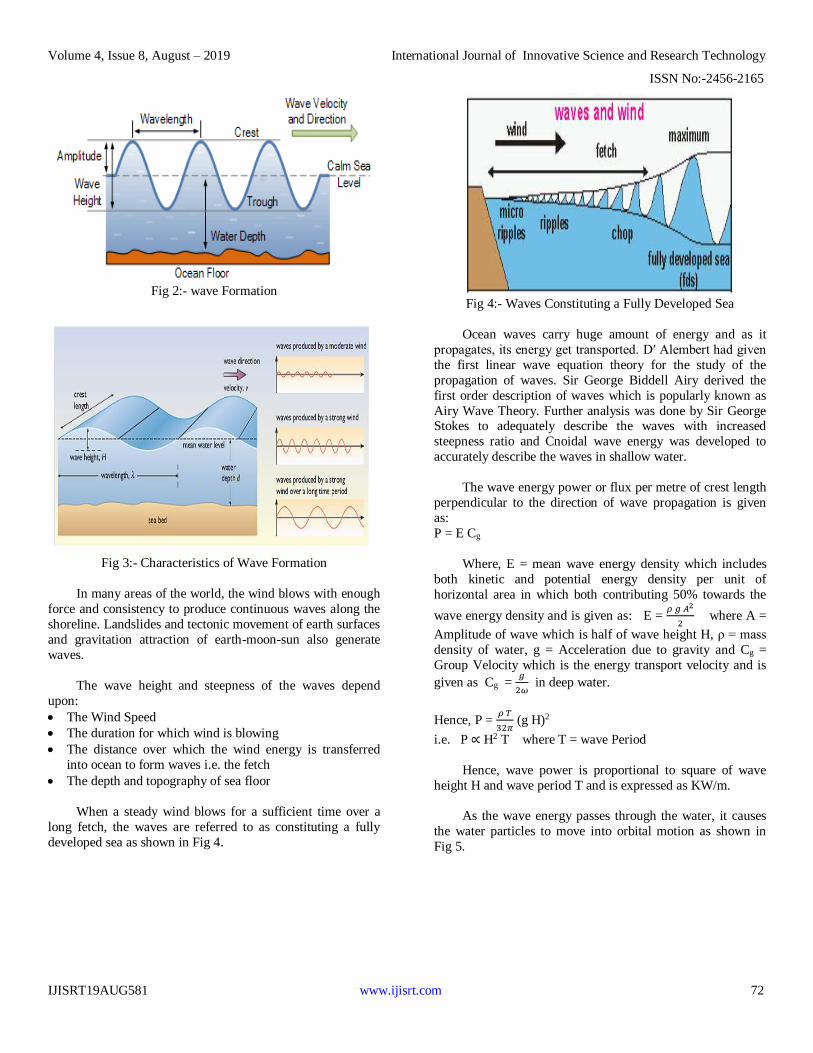
These have been shown in Fig 2 and 3.
Volume 4, Issue 8, August – 2019 International Journal of Innovative Science and Research Technology
ISSN No:-2456-2165
IJISRT19AUG581 www.ijisrt.com 72
Fig 2:- wave Formation
Fig 3:- Characteristics of Wave Formation
In many areas of the world, the wind blows with enough
force and consistency to produce continuous waves along the
shoreline. Landslides and tectonic movement of earth surfaces
and gravitation attraction of earth-moon-sun also generate
waves.
The wave height and steepness of the waves depend
upon:
The Wind Speed
The duration for which wind is blowing
The distance over which the wind energy is transferred
into ocean to form waves i.e. the fetch
The depth and topography of sea floor
When a steady wind blows for a sufficient time over a
long fetch, the waves are referred to as constituting a fully
developed sea as shown in Fig 4.
Fig 4:- Waves Constituting a Fully Developed Sea
Ocean waves carry huge amount of energy and as it
propagates, its energy get transported. D′ Alembert had given
the first linear wave equation theory for the study of the
propagation of waves. Sir George Biddell Airy derived the
first order description of waves which is popularly known as
Airy Wave Theory. Further analysis was done by Sir George Stokes to adequately describe the waves with increased
steepness ratio and Cnoidal wave energy was developed to
accurately describe the waves in shallow water.
The wave energy power or flux per metre of crest length
perpendicular to the direction of wave propagation is given
as:
P = E Cg
Where, E = mean wave energy density which includes
both kinetic and potential energy density per unit of
horizontal area in which both contributing 50% towards the
wave energy density and is given as: E = 𝜌 𝑔 𝐴2
2 where A =
Amplitude of wave which is half of wave height H, ρ = mass
density of water, g = Acceleration due to gravity and Cg =
Group Velocity which is the energy transport velocity and is
given as Cg = 𝑔
2𝜔 in deep water.
Hence, P = 𝜌 𝑇
32𝜋 (g H)2
i.e. P ∝ H2 T where T = wave Period
Hence, wave power is proportional to square of wave
height H and wave period T and is expressed as KW/m.
As the wave energy passes through the water, it causes
the water particles to move into orbital motion as shown in
Fig 5.
Volume 4, Issue 8, August – 2019 International Journal of Innovative Science and Research Technology
ISSN No:-2456-2165
IJISRT19AUG581 www.ijisrt.com 73
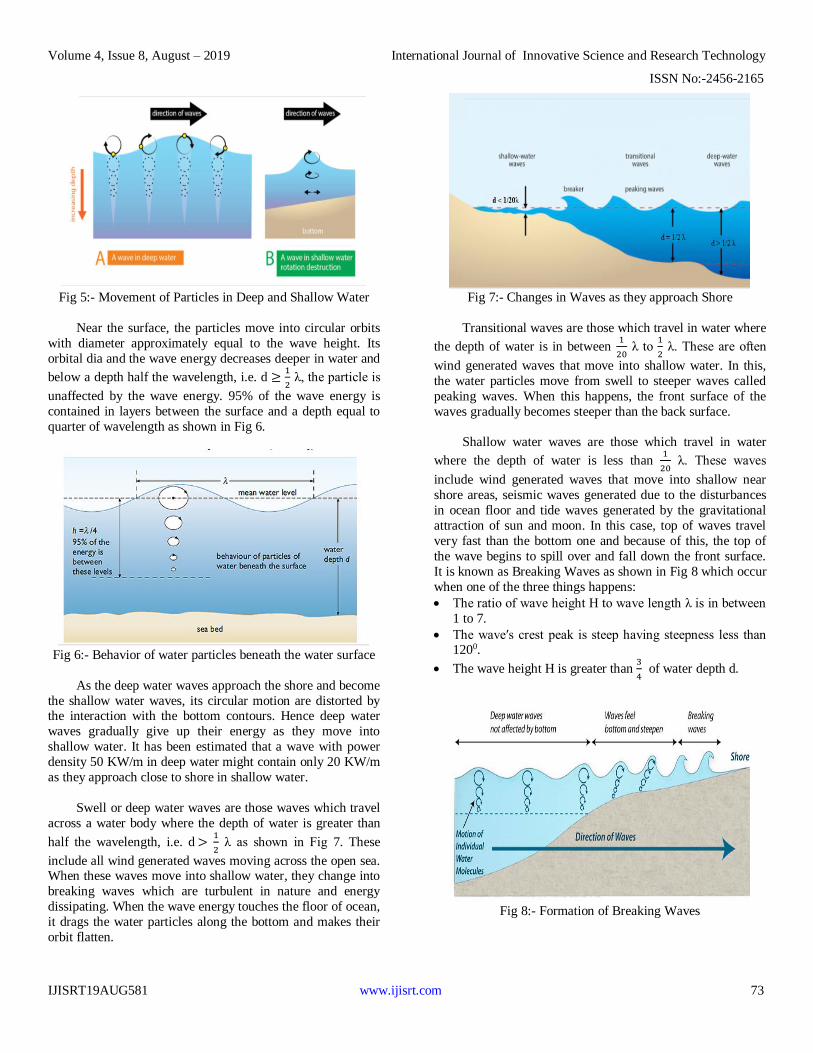
Fig 5:- Movement of Particles in Deep and Shallow Water
Near the surface, the particles move into circular orbits
with diameter approximately equal to the wave height. Its
orbital dia and the wave energy decreases deeper in water and
below a depth half the wavelength, i.e. d ≥ 1
2 λ, the particle is
unaffected by the wave energy. 95% of the wave energy is
contained in layers between the surface and a depth equal to
quarter of wavelength as shown in Fig 6.
Fig 6:- Behavior of water particles beneath the water surface
As the deep water waves approach the shore and become
the shallow water waves, its circular motion are distorted by the interaction with the bottom contours. Hence deep water
waves gradually give up their energy as they move into
shallow water. It has been estimated that a wave with power
density 50 KW/m in deep water might contain only 20 KW/m
as they approach close to shore in shallow water.
Swell or deep water waves are those waves which travel
across a water body where the depth of water is greater than
half the wavelength, i.e. d > 1
2 λ as shown in Fig 7. These
include all wind generated waves moving across the open sea. When these waves move into shallow water, they change into
breaking waves which are turbulent in nature and energy
dissipating. When the wave energy touches the floor of ocean,
it drags the water particles along the bottom and makes their
orbit flatten.
Fig 7:- Changes in Waves as they approach Shore
Transitional waves are those which travel in water where
the depth of water is in between 1
20 λ to
1
2 λ. These are often
wind generated waves that move into shallow water. In this,
the water particles move from swell to steeper waves called
peaking waves. When this happens, the front surface of the
waves gradually becomes steeper than the back surface.
Shallow water waves are those which travel in water
where the depth of water is less than 1
20 λ. These waves
include wind generated waves that move into shallow near
shore areas, seismic waves generated due to the disturbances
in ocean floor and tide waves generated by the gravitational
attraction of sun and moon. In this case, top of waves travel
very fast than the bottom one and because of this, the top of
the wave begins to spill over and fall down the front surface.
It is known as Breaking Waves as shown in Fig 8 which occur
when one of the three things happens:
The ratio of wave height H to wave length λ is in between
1 to 7.
The wave′s crest peak is steep having steepness less than 1200.
The wave height H is greater than 3
4 of water depth d.
Fig 8:- Formation of Breaking Waves
Volume 4, Issue 8, August – 2019 International Journal of Innovative Science and Research Technology
ISSN No:-2456-2165
IJISRT19AUG581 www.ijisrt.com 74
III. TECHNOLOGY
Wave Energy Convertor (WEC) is a device which
captures the kinetic energy and potential energy of waves and
converts it into electricity. A WEC consists of the following
components:
The structure and prime mover which captures the energy
of wave.
The foundation or mooring which keeps the structure and
prime mover in place.
The power take-off which converts mechanical energy
into electrical energy.
The control systems which safeguard and optimize the performance in different operating conditions.
The installation which places the structure and device at
its power generating location.
The connection which connects the power output from the
device to the electric grid.
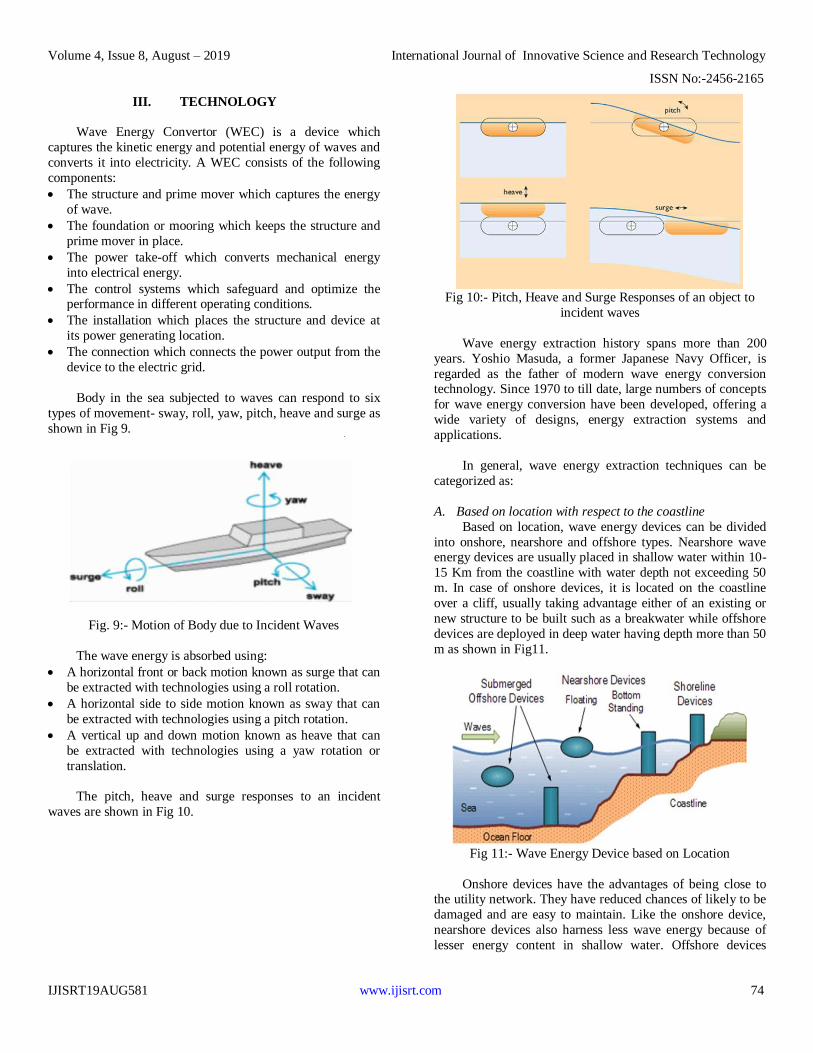
Body in the sea subjected to waves can respond to six
types of movement- sway, roll, yaw, pitch, heave and surge as
shown in Fig 9.
Fig. 9:- Motion of Body due to Incident Waves
The wave energy is absorbed using:
A horizontal front or back motion known as surge that can
be extracted with technologies using a roll rotation.
A horizontal side to side motion known as sway that can
be extracted with technologies using a pitch rotation.
A vertical up and down motion known as heave that can
be extracted with technologies using a yaw rotation or
translation.
The pitch, heave and surge responses to an incident
waves are shown in Fig 10.
Fig 10:- Pitch, Heave and Surge Responses of an object to
incident waves
Wave energy extraction history spans more than 200
years. Yoshio Masuda, a former Japanese Navy Officer, is
regarded as the father of modern wave energy conversion technology. Since 1970 to till date, large numbers of concepts
for wave energy conversion have been developed, offering a
wide variety of designs, energy extraction systems and
applications.
In general, wave energy extraction techniques can be
categorized as:
A. Based on location with respect to the coastline
Based on location, wave energy devices can be divided
into onshore, nearshore and offshore types. Nearshore wave energy devices are usually placed in shallow water within 10-
15 Km from the coastline with water depth not exceeding 50
m. In case of onshore devices, it is located on the coastline
over a cliff, usually taking advantage either of an existing or
new structure to be built such as a breakwater while offshore
devices are deployed in deep water having depth more than 50
m as shown in Fig11.
Fig 11:- Wave Energy Device based on Location
Onshore devices have the advantages of being close to the utility network. They have reduced chances of likely to be
damaged and are easy to maintain. Like the onshore device,
nearshore devices also harness less wave energy because of
lesser energy content in shallow water. Offshore devices
Volume 4, Issue 8, August – 2019 International Journal of Innovative Science and Research Technology
ISSN No:-2456-2165
IJISRT19AUG581 www.ijisrt.com 75
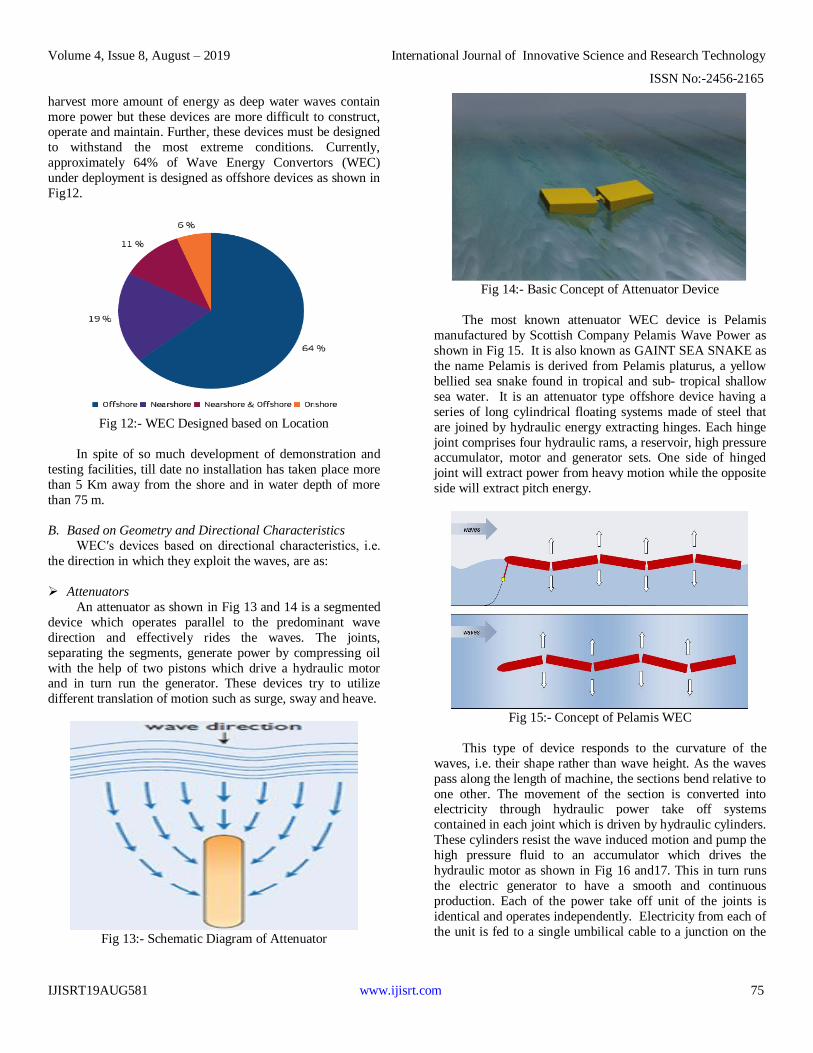
harvest more amount of energy as deep water waves contain
more power but these devices are more difficult to construct, operate and maintain. Further, these devices must be designed
to withstand the most extreme conditions. Currently,
approximately 64% of Wave Energy Convertors (WEC)
under deployment is designed as offshore devices as shown in
Fig12.
Fig 12:- WEC Designed based on Location
In spite of so much development of demonstration and
testing facilities, till date no installation has taken place more
than 5 Km away from the shore and in water depth of more
than 75 m.
B. Based on Geometry and Directional Characteristics
WEC′s devices based on directional characteristics, i.e.
the direction in which they exploit the waves, are as:
Attenuators
An attenuator as shown in Fig 13 and 14 is a segmented
device which operates parallel to the predominant wave
direction and effectively rides the waves. The joints,
separating the segments, generate power by compressing oil
with the help of two pistons which drive a hydraulic motor and in turn run the generator. These devices try to utilize
different translation of motion such as surge, sway and heave.
Fig 13:- Schematic Diagram of Attenuator
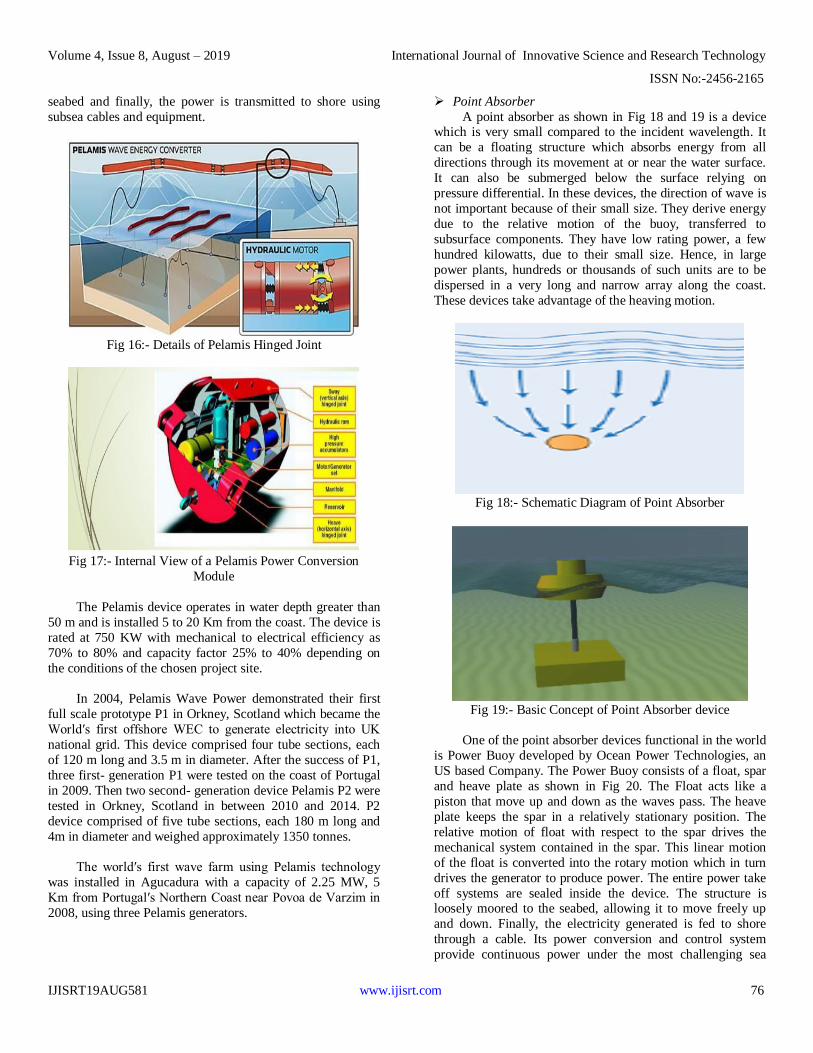
Fig 14:- Basic Concept of Attenuator Device
The most known attenuator WEC device is Pelamis
manufactured by Scottish Company Pelamis Wave Power as
shown in Fig 15. It is also known as GAINT SEA SNAKE as
the name Pelamis is derived from Pelamis platurus, a yellow
bellied sea snake found in tropical and sub- tropical shallow
sea water. It is an attenuator type offshore device having a
series of long cylindrical floating systems made of steel that
are joined by hydraulic energy extracting hinges. Each hinge
joint comprises four hydraulic rams, a reservoir, high pressure accumulator, motor and generator sets. One side of hinged
joint will extract power from heavy motion while the opposite
side will extract pitch energy.
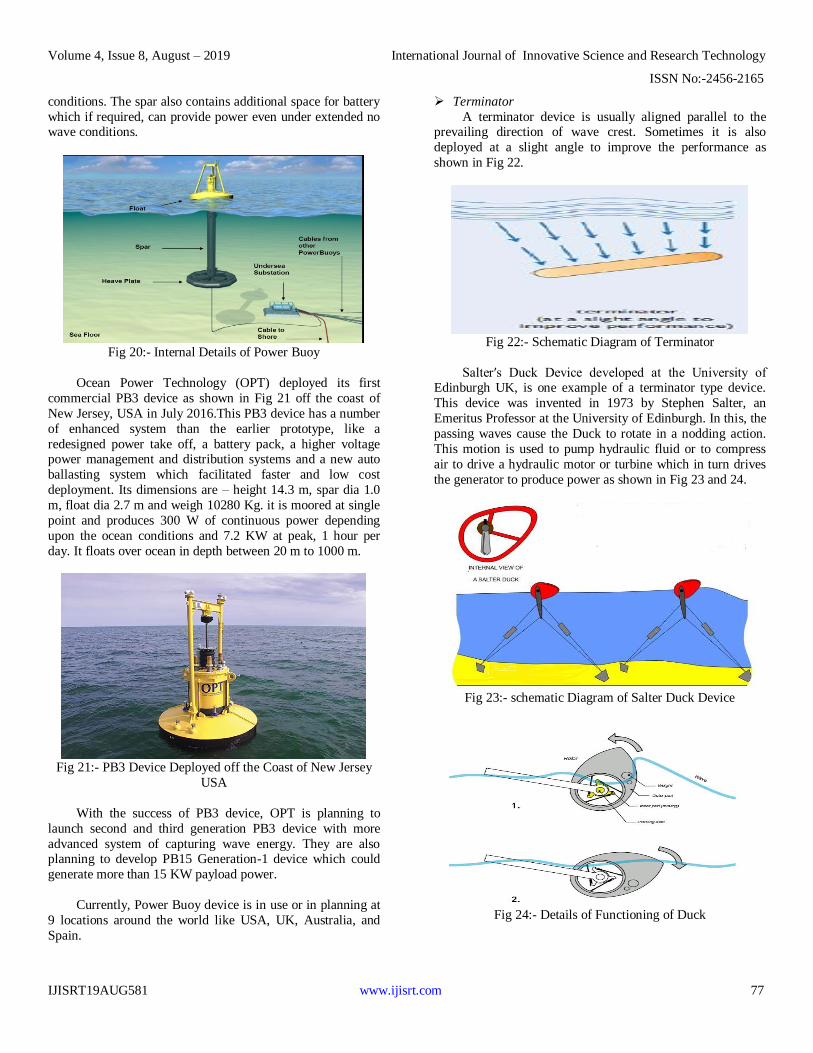
Fig 15:- Concept of Pelamis WEC
This type of device responds to the curvature of the
waves, i.e. their shape rather than wave height. As the waves
pass along the length of machine, the sections bend relative to
one other. The movement of the section is converted into electricity through hydraulic power take off systems
contained in each joint which is driven by hydraulic cylinders.
These cylinders resist the wave induced motion and pump the
high pressure fluid to an accumulator which drives the
hydraulic motor as shown in Fig 16 and17. This in turn runs
the electric generator to have a smooth and continuous
production. Each of the power take off unit of the joints is
identical and operates independently. Electricity from each of
the unit is fed to a single umbilical cable to a junction on the
Volume 4, Issue 8, August – 2019 International Journal of Innovative Science and Research Technology
ISSN No:-2456-2165
IJISRT19AUG581 www.ijisrt.com 76
seabed and finally, the power is transmitted to shore using
subsea cables and equipment.
Fig 16:- Details of Pelamis Hinged Joint
Fig 17:- Internal View of a Pelamis Power Conversion
Module
The Pelamis device operates in water depth greater than
50 m and is installed 5 to 20 Km from the coast. The device is
rated at 750 KW with mechanical to electrical efficiency as
70% to 80% and capacity factor 25% to 40% depending on
the conditions of the chosen project site.
In 2004, Pelamis Wave Power demonstrated their first
full scale prototype P1 in Orkney, Scotland which became the
World′s first offshore WEC to generate electricity into UK
national grid. This device comprised four tube sections, each
of 120 m long and 3.5 m in diameter. After the success of P1,
three first- generation P1 were tested on the coast of Portugal
in 2009. Then two second- generation device Pelamis P2 were
tested in Orkney, Scotland in between 2010 and 2014. P2
device comprised of five tube sections, each 180 m long and
4m in diameter and weighed approximately 1350 tonnes.
The world′s first wave farm using Pelamis technology
was installed in Agucadura with a capacity of 2.25 MW, 5
Km from Portugal′s Northern Coast near Povoa de Varzim in
2008, using three Pelamis generators.
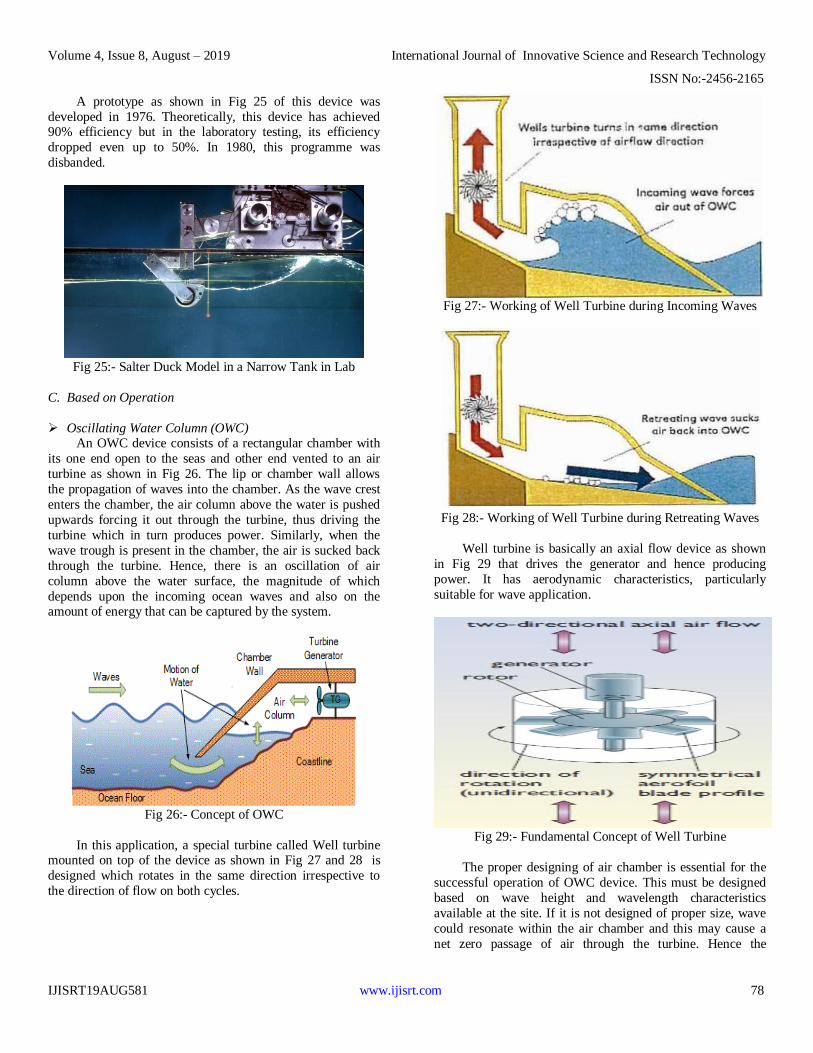
Point Absorber
A point absorber as shown in Fig 18 and 19 is a device which is very small compared to the incident wavelength. It
can be a floating structure which absorbs energy from all
directions through its movement at or near the water surface.
It can also be submerged below the surface relying on
pressure differential. In these devices, the direction of wave is
not important because of their small size. They derive energy
due to the relative motion of the buoy, transferred to
subsurface components. They have low rating power, a few
hundred kilowatts, due to their small size. Hence, in large
power plants, hundreds or thousands of such units are to be
dispersed in a very long and narrow array along the coast.
These devices take advantage of the heaving motion.
Fig 18:- Schematic Diagram of Point Absorber
Fig 19:- Basic Concept of Point Absorber device
One of the point absorber devices functional in the world
is Power Buoy developed by Ocean Power Technologies, an
US based Company. The Power Buoy consists of a float, spar
and heave plate as shown in Fig 20. The Float acts like a
piston that move up and down as the waves pass. The heave
plate keeps the spar in a relatively stationary position. The
relative motion of float with respect to the spar drives the
mechanical system contained in the spar. This linear motion
of the float is converted into the rotary motion which in turn
drives the generator to produce power. The entire power take
off systems are sealed inside the device. The structure is loosely moored to the seabed, allowing it to move freely up
and down. Finally, the electricity generated is fed to shore
through a cable. Its power conversion and control system
provide continuous power under the most challenging sea
Volume 4, Issue 8, August – 2019 International Journal of Innovative Science and Research Technology
ISSN No:-2456-2165
IJISRT19AUG581 www.ijisrt.com 77
conditions. The spar also contains additional space for battery
which if required, can provide power even under extended no wave conditions.
Fig 20:- Internal Details of Power Buoy
Ocean Power Technology (OPT) deployed its first
commercial PB3 device as shown in Fig 21 off the coast of
New Jersey, USA in July 2016.This PB3 device has a number
of enhanced system than the earlier prototype, like a
redesigned power take off, a battery pack, a higher voltage power management and distribution systems and a new auto
ballasting system which facilitated faster and low cost
deployment. Its dimensions are – height 14.3 m, spar dia 1.0
m, float dia 2.7 m and weigh 10280 Kg. it is moored at single
point and produces 300 W of continuous power depending
upon the ocean conditions and 7.2 KW at peak, 1 hour per
day. It floats over ocean in depth between 20 m to 1000 m.
Fig 21:- PB3 Device Deployed off the Coast of New Jersey
USA
With the success of PB3 device, OPT is planning to
launch second and third generation PB3 device with more
advanced system of capturing wave energy. They are also planning to develop PB15 Generation-1 device which could
generate more than 15 KW payload power.
Currently, Power Buoy device is in use or in planning at
9 locations around the world like USA, UK, Australia, and
Spain.
Terminator
A terminator device is usually aligned parallel to the prevailing direction of wave crest. Sometimes it is also
deployed at a slight angle to improve the performance as
shown in Fig 22.
Fig 22:- Schematic Diagram of Terminator
Salter′s Duck Device developed at the University of Edinburgh UK, is one example of a terminator type device.
This device was invented in 1973 by Stephen Salter, an
Emeritus Professor at the University of Edinburgh. In this, the
passing waves cause the Duck to rotate in a nodding action.
This motion is used to pump hydraulic fluid or to compress
air to drive a hydraulic motor or turbine which in turn drives
the generator to produce power as shown in Fig 23 and 24.
Fig 23:- schematic Diagram of Salter Duck Device
Fig 24:- Details of Functioning of Duck
Volume 4, Issue 8, August – 2019 International Journal of Innovative Science and Research Technology
ISSN No:-2456-2165
IJISRT19AUG581 www.ijisrt.com 78
A prototype as shown in Fig 25 of this device was
developed in 1976. Theoretically, this device has achieved 90% efficiency but in the laboratory testing, its efficiency
dropped even up to 50%. In 1980, this programme was
disbanded.
Fig 25:- Salter Duck Model in a Narrow Tank in Lab
C. Based on Operation
Oscillating Water Column (OWC) An OWC device consists of a rectangular chamber with
its one end open to the seas and other end vented to an air
turbine as shown in Fig 26. The lip or chamber wall allows
the propagation of waves into the chamber. As the wave crest
enters the chamber, the air column above the water is pushed
upwards forcing it out through the turbine, thus driving the
turbine which in turn produces power. Similarly, when the
wave trough is present in the chamber, the air is sucked back
through the turbine. Hence, there is an oscillation of air
column above the water surface, the magnitude of which
depends upon the incoming ocean waves and also on the amount of energy that can be captured by the system.
Fig 26:- Concept of OWC
In this application, a special turbine called Well turbine mounted on top of the device as shown in Fig 27 and 28 is
designed which rotates in the same direction irrespective to
the direction of flow on both cycles.
Fig 27:- Working of Well Turbine during Incoming Waves
Fig 28:- Working of Well Turbine during Retreating Waves
Well turbine is basically an axial flow device as shown
in Fig 29 that drives the generator and hence producing
power. It has aerodynamic characteristics, particularly
suitable for wave application.
Fig 29:- Fundamental Concept of Well Turbine
The proper designing of air chamber is essential for the
successful operation of OWC device. This must be designed
based on wave height and wavelength characteristics
available at the site. If it is not designed of proper size, wave
could resonate within the air chamber and this may cause a
net zero passage of air through the turbine. Hence the
Volume 4, Issue 8, August – 2019 International Journal of Innovative Science and Research Technology
ISSN No:-2456-2165
IJISRT19AUG581 www.ijisrt.com 79
dimension of air chamber should be designed to capture
maximum energy. Further the air chamber must also be conducive to air through the turbine. This can be best
achieved by providing funnel shaped air chamber, narrowing
from the water surface level to the turbine. This will increase
the flow through the turbine.
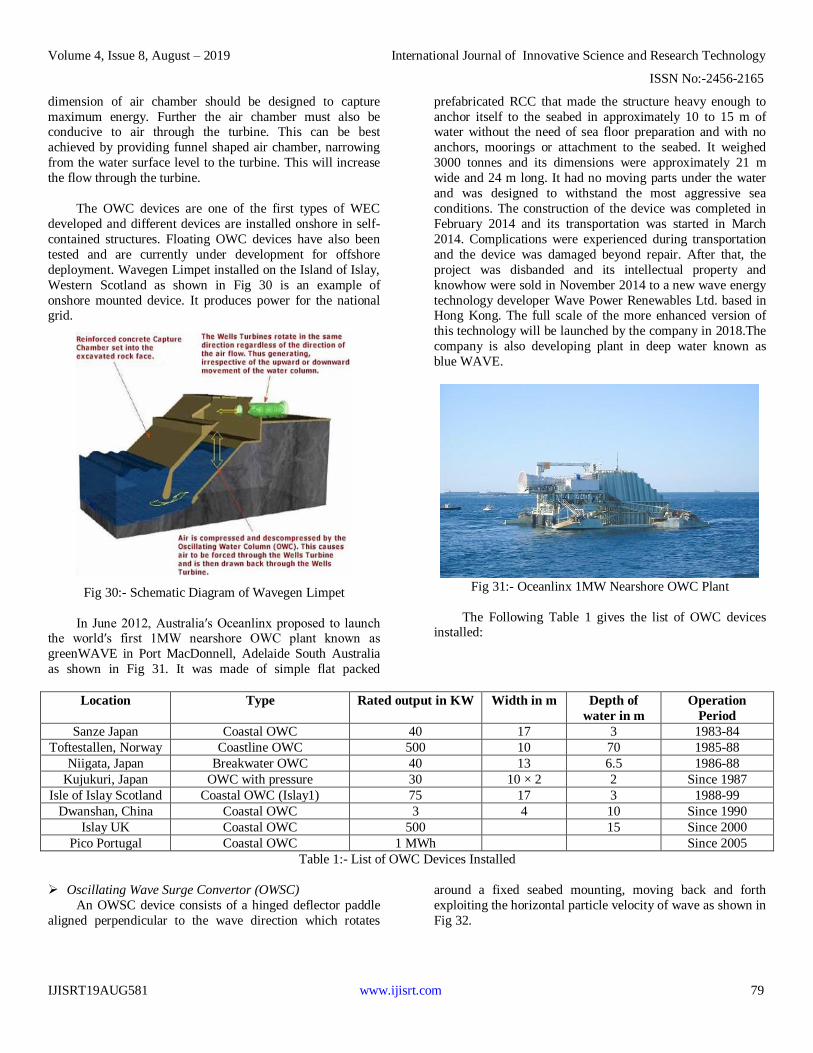
The OWC devices are one of the first types of WEC
developed and different devices are installed onshore in self-
contained structures. Floating OWC devices have also been
tested and are currently under development for offshore
deployment. Wavegen Limpet installed on the Island of Islay,
Western Scotland as shown in Fig 30 is an example of
onshore mounted device. It produces power for the national grid.
Fig 30:- Schematic Diagram of Wavegen Limpet
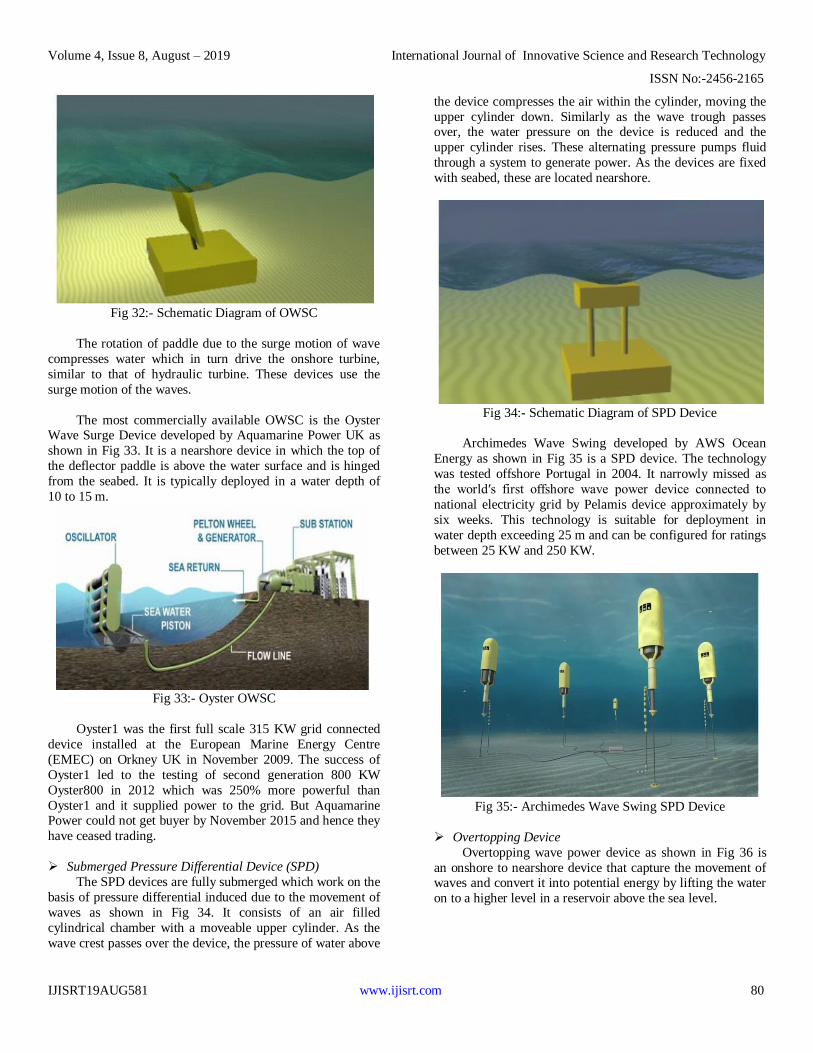
In June 2012, Australia′s Oceanlinx proposed to launch the world′s first 1MW nearshore OWC plant known as
greenWAVE in Port MacDonnell, Adelaide South Australia
as shown in Fig 31. It was made of simple flat packed
prefabricated RCC that made the structure heavy enough to
anchor itself to the seabed in approximately 10 to 15 m of water without the need of sea floor preparation and with no
anchors, moorings or attachment to the seabed. It weighed
3000 tonnes and its dimensions were approximately 21 m
wide and 24 m long. It had no moving parts under the water
and was designed to withstand the most aggressive sea
conditions. The construction of the device was completed in
February 2014 and its transportation was started in March
2014. Complications were experienced during transportation
and the device was damaged beyond repair. After that, the
project was disbanded and its intellectual property and
knowhow were sold in November 2014 to a new wave energy
technology developer Wave Power Renewables Ltd. based in Hong Kong. The full scale of the more enhanced version of
this technology will be launched by the company in 2018.The
company is also developing plant in deep water known as
blue WAVE.
Fig 31:- Oceanlinx 1MW Nearshore OWC Plant
The Following Table 1 gives the list of OWC devices installed:
Location Type Rated output in KW Width in m Depth of
water in m
Operation
Period
Sanze Japan Coastal OWC 40 17 3 1983-84
Toftestallen, Norway Coastline OWC 500 10 70 1985-88
Niigata, Japan Breakwater OWC 40 13 6.5 1986-88
Kujukuri, Japan OWC with pressure 30 10 × 2 2 Since 1987
Isle of Islay Scotland Coastal OWC (Islay1) 75 17 3 1988-99
Dwanshan, China Coastal OWC 3 4 10 Since 1990
Islay UK Coastal OWC 500 15 Since 2000
Pico Portugal Coastal OWC 1 MWh Since 2005
Table 1:- List of OWC Devices Installed
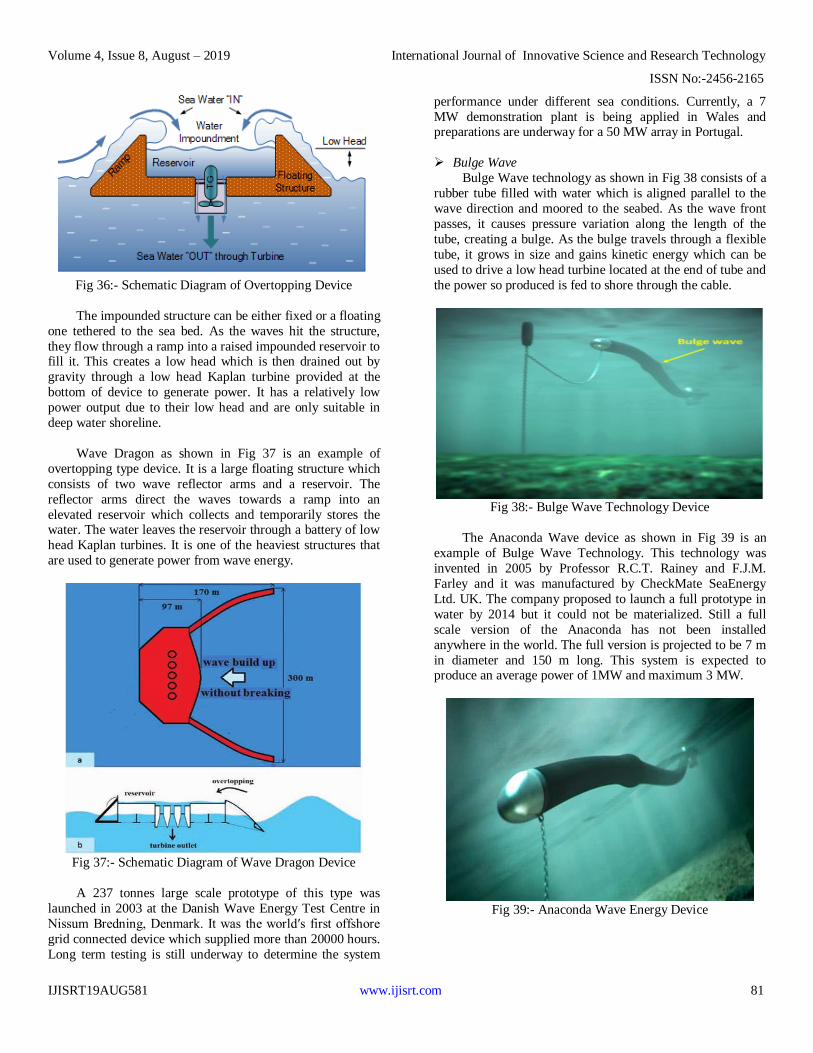
Oscillating Wave Surge Convertor (OWSC)
An OWSC device consists of a hinged deflector paddle
aligned perpendicular to the wave direction which rotates
around a fixed seabed mounting, moving back and forth
exploiting the horizontal particle velocity of wave as shown in
Fig 32.
Volume 4, Issue 8, August – 2019 International Journal of Innovative Science and Research Technology
ISSN No:-2456-2165
IJISRT19AUG581 www.ijisrt.com 80
Fig 32:- Schematic Diagram of OWSC
The rotation of paddle due to the surge motion of wave
compresses water which in turn drive the onshore turbine,
similar to that of hydraulic turbine. These devices use the
surge motion of the waves.
The most commercially available OWSC is the Oyster Wave Surge Device developed by Aquamarine Power UK as
shown in Fig 33. It is a nearshore device in which the top of
the deflector paddle is above the water surface and is hinged
from the seabed. It is typically deployed in a water depth of
10 to 15 m.
Fig 33:- Oyster OWSC
Oyster1 was the first full scale 315 KW grid connected
device installed at the European Marine Energy Centre
(EMEC) on Orkney UK in November 2009. The success of
Oyster1 led to the testing of second generation 800 KW
Oyster800 in 2012 which was 250% more powerful than
Oyster1 and it supplied power to the grid. But Aquamarine Power could not get buyer by November 2015 and hence they
have ceased trading.
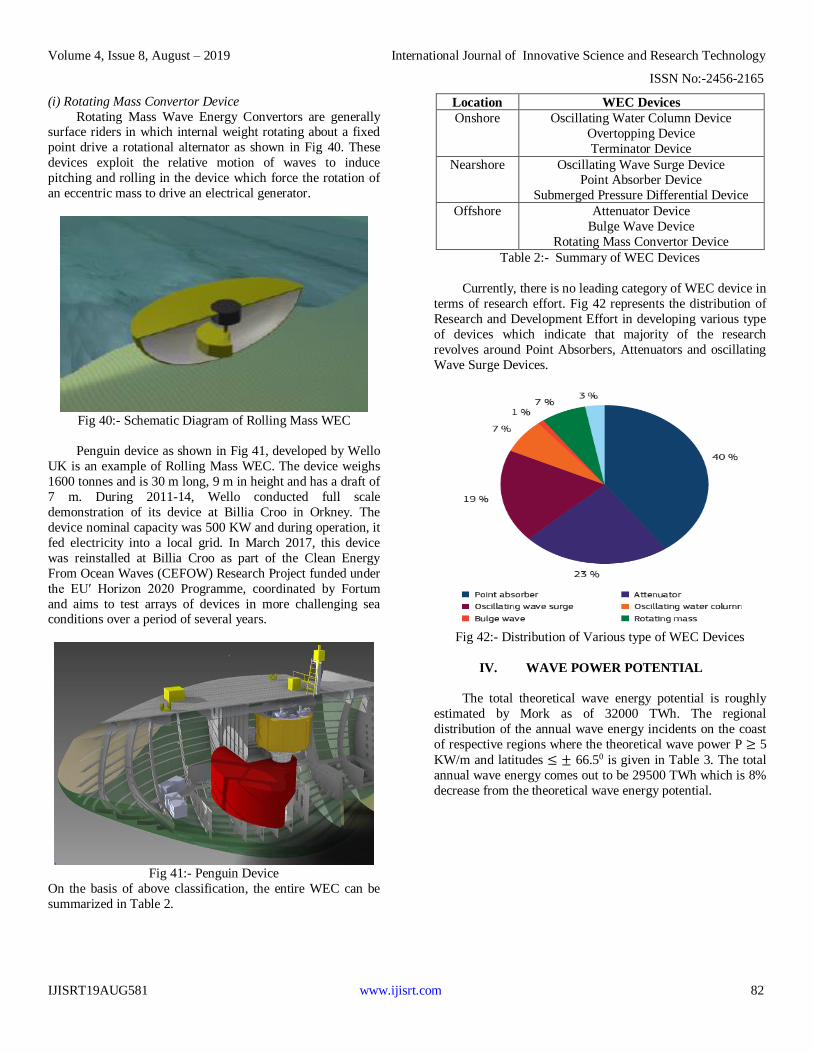
Submerged Pressure Differential Device (SPD)
The SPD devices are fully submerged which work on the
basis of pressure differential induced due to the movement of
waves as shown in Fig 34. It consists of an air filled
cylindrical chamber with a moveable upper cylinder. As the
wave crest passes over the device, the pressure of water above
the device compresses the air within the cylinder, moving the
upper cylinder down. Similarly as the wave trough passes over, the water pressure on the device is reduced and the
upper cylinder rises. These alternating pressure pumps fluid
through a system to generate power. As the devices are fixed
with seabed, these are located nearshore.
Fig 34:- Schematic Diagram of SPD Device
Archimedes Wave Swing developed by AWS Ocean
Energy as shown in Fig 35 is a SPD device. The technology
was tested offshore Portugal in 2004. It narrowly missed as
the world′s first offshore wave power device connected to
national electricity grid by Pelamis device approximately by
six weeks. This technology is suitable for deployment in
water depth exceeding 25 m and can be configured for ratings
between 25 KW and 250 KW.
Fig 35:- Archimedes Wave Swing SPD Device
Overtopping Device
Overtopping wave power device as shown in Fig 36 is
an onshore to nearshore device that capture the movement of waves and convert it into potential energy by lifting the water
on to a higher level in a reservoir above the sea level.
Volume 4, Issue 8, August – 2019 International Journal of Innovative Science and Research Technology
ISSN No:-2456-2165
IJISRT19AUG581 www.ijisrt.com 81
Fig 36:- Schematic Diagram of Overtopping Device
The impounded structure can be either fixed or a floating
one tethered to the sea bed. As the waves hit the structure,
they flow through a ramp into a raised impounded reservoir to fill it. This creates a low head which is then drained out by
gravity through a low head Kaplan turbine provided at the
bottom of device to generate power. It has a relatively low
power output due to their low head and are only suitable in
deep water shoreline.
Wave Dragon as shown in Fig 37 is an example of
overtopping type device. It is a large floating structure which
consists of two wave reflector arms and a reservoir. The
reflector arms direct the waves towards a ramp into an
elevated reservoir which collects and temporarily stores the water. The water leaves the reservoir through a battery of low
head Kaplan turbines. It is one of the heaviest structures that
are used to generate power from wave energy.
Fig 37:- Schematic Diagram of Wave Dragon Device
A 237 tonnes large scale prototype of this type was
launched in 2003 at the Danish Wave Energy Test Centre in
Nissum Bredning, Denmark. It was the world′s first offshore
grid connected device which supplied more than 20000 hours.
Long term testing is still underway to determine the system
performance under different sea conditions. Currently, a 7
MW demonstration plant is being applied in Wales and preparations are underway for a 50 MW array in Portugal.
Bulge Wave
Bulge Wave technology as shown in Fig 38 consists of a
rubber tube filled with water which is aligned parallel to the
wave direction and moored to the seabed. As the wave front
passes, it causes pressure variation along the length of the
tube, creating a bulge. As the bulge travels through a flexible
tube, it grows in size and gains kinetic energy which can be
used to drive a low head turbine located at the end of tube and
the power so produced is fed to shore through the cable.
Fig 38:- Bulge Wave Technology Device
The Anaconda Wave device as shown in Fig 39 is an
example of Bulge Wave Technology. This technology was
invented in 2005 by Professor R.C.T. Rainey and F.J.M.
Farley and it was manufactured by CheckMate SeaEnergy
Ltd. UK. The company proposed to launch a full prototype in
water by 2014 but it could not be materialized. Still a full
scale version of the Anaconda has not been installed
anywhere in the world. The full version is projected to be 7 m
in diameter and 150 m long. This system is expected to produce an average power of 1MW and maximum 3 MW.
Fig 39:- Anaconda Wave Energy Device
Volume 4, Issue 8, August – 2019 International Journal of Innovative Science and Research Technology
ISSN No:-2456-2165
IJISRT19AUG581 www.ijisrt.com 82
(i) Rotating Mass Convertor Device
Rotating Mass Wave Energy Convertors are generally surface riders in which internal weight rotating about a fixed
point drive a rotational alternator as shown in Fig 40. These
devices exploit the relative motion of waves to induce
pitching and rolling in the device which force the rotation of
an eccentric mass to drive an electrical generator.
Fig 40:- Schematic Diagram of Rolling Mass WEC
Penguin device as shown in Fig 41, developed by Wello
UK is an example of Rolling Mass WEC. The device weighs
1600 tonnes and is 30 m long, 9 m in height and has a draft of
7 m. During 2011-14, Wello conducted full scale
demonstration of its device at Billia Croo in Orkney. The
device nominal capacity was 500 KW and during operation, it
fed electricity into a local grid. In March 2017, this device
was reinstalled at Billia Croo as part of the Clean Energy
From Ocean Waves (CEFOW) Research Project funded under
the EU′ Horizon 2020 Programme, coordinated by Fortum
and aims to test arrays of devices in more challenging sea conditions over a period of several years.
Fig 41:- Penguin Device
On the basis of above classification, the entire WEC can be
summarized in Table 2.
Location WEC Devices
Onshore Oscillating Water Column Device
Overtopping Device
Terminator Device
Nearshore Oscillating Wave Surge Device Point Absorber Device
Submerged Pressure Differential Device
Offshore Attenuator Device
Bulge Wave Device
Rotating Mass Convertor Device
Table 2:- Summary of WEC Devices
Currently, there is no leading category of WEC device in
terms of research effort. Fig 42 represents the distribution of
Research and Development Effort in developing various type
of devices which indicate that majority of the research
revolves around Point Absorbers, Attenuators and oscillating
Wave Surge Devices.
Fig 42:- Distribution of Various type of WEC Devices
IV. WAVE POWER POTENTIAL
The total theoretical wave energy potential is roughly
estimated by Mork as of 32000 TWh. The regional
distribution of the annual wave energy incidents on the coast
of respective regions where the theoretical wave power P ≥ 5
KW/m and latitudes ≤ ± 66.50 is given in Table 3. The total
annual wave energy comes out to be 29500 TWh which is 8%
decrease from the theoretical wave energy potential.
Volume 4, Issue 8, August – 2019 International Journal of Innovative Science and Research Technology
ISSN No:-2456-2165
IJISRT19AUG581 www.ijisrt.com 83
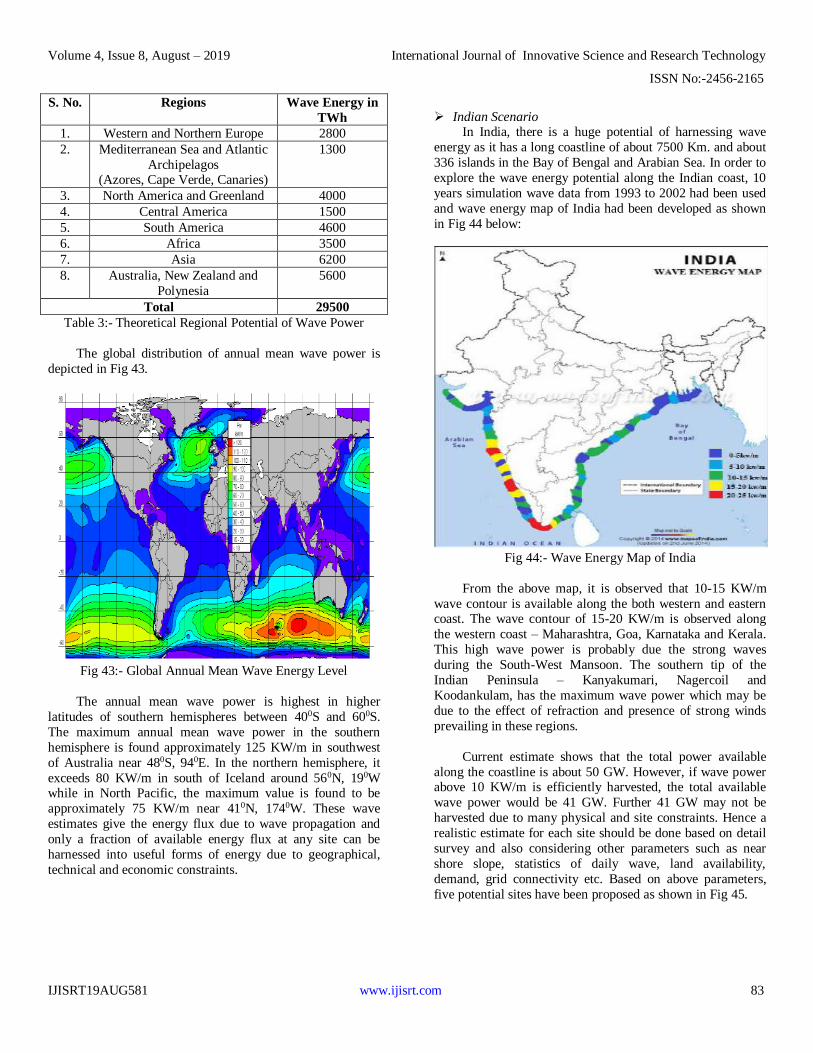
S. No. Regions Wave Energy in
TWh
1. Western and Northern Europe 2800
2. Mediterranean Sea and Atlantic
Archipelagos (Azores, Cape Verde, Canaries)
1300
3. North America and Greenland 4000
4. Central America 1500
5. South America 4600
6. Africa 3500
7. Asia 6200
8. Australia, New Zealand and
Polynesia
5600
Total 29500
Table 3:- Theoretical Regional Potential of Wave Power
The global distribution of annual mean wave power is
depicted in Fig 43.
Fig 43:- Global Annual Mean Wave Energy Level
The annual mean wave power is highest in higher
latitudes of southern hemispheres between 400S and 600S.
The maximum annual mean wave power in the southern
hemisphere is found approximately 125 KW/m in southwest
of Australia near 480S, 940E. In the northern hemisphere, it
exceeds 80 KW/m in south of Iceland around 560N, 190W while in North Pacific, the maximum value is found to be
approximately 75 KW/m near 410N, 1740W. These wave
estimates give the energy flux due to wave propagation and
only a fraction of available energy flux at any site can be
harnessed into useful forms of energy due to geographical,
technical and economic constraints.
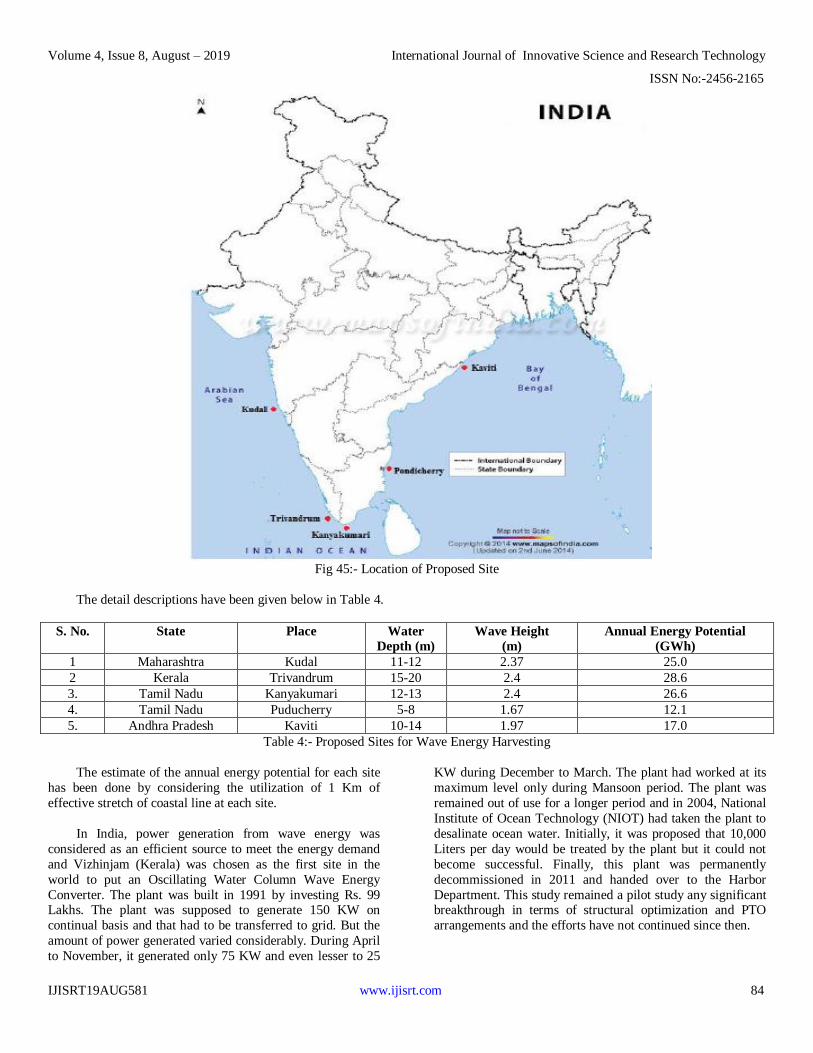
Indian Scenario In India, there is a huge potential of harnessing wave
energy as it has a long coastline of about 7500 Km. and about
336 islands in the Bay of Bengal and Arabian Sea. In order to
explore the wave energy potential along the Indian coast, 10
years simulation wave data from 1993 to 2002 had been used
and wave energy map of India had been developed as shown
in Fig 44 below:
Fig 44:- Wave Energy Map of India
From the above map, it is observed that 10-15 KW/m
wave contour is available along the both western and eastern coast. The wave contour of 15-20 KW/m is observed along
the western coast – Maharashtra, Goa, Karnataka and Kerala.
This high wave power is probably due the strong waves
during the South-West Mansoon. The southern tip of the
Indian Peninsula – Kanyakumari, Nagercoil and
Koodankulam, has the maximum wave power which may be
due to the effect of refraction and presence of strong winds
prevailing in these regions.
Current estimate shows that the total power available
along the coastline is about 50 GW. However, if wave power above 10 KW/m is efficiently harvested, the total available
wave power would be 41 GW. Further 41 GW may not be
harvested due to many physical and site constraints. Hence a
realistic estimate for each site should be done based on detail
survey and also considering other parameters such as near
shore slope, statistics of daily wave, land availability,
demand, grid connectivity etc. Based on above parameters,
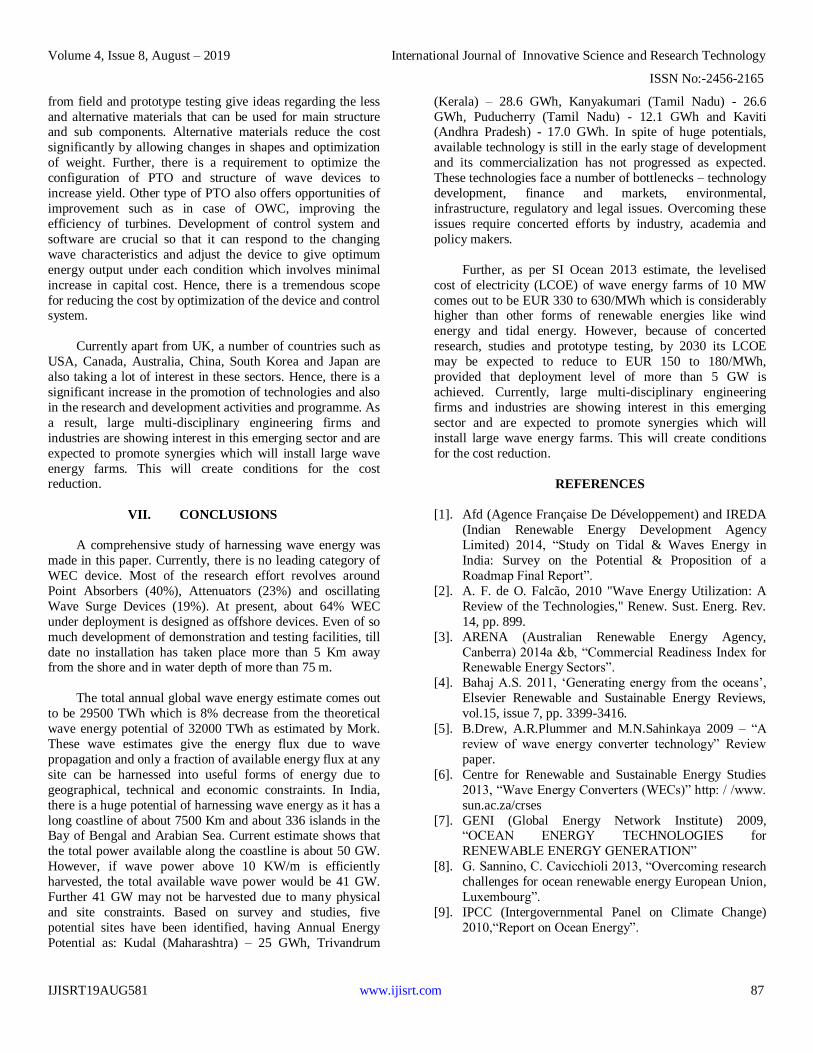
five potential sites have been proposed as shown in Fig 45.
Volume 4, Issue 8, August – 2019 International Journal of Innovative Science and Research Technology
ISSN No:-2456-2165
IJISRT19AUG581 www.ijisrt.com 84
Fig 45:- Location of Proposed Site
The detail descriptions have been given below in Table 4.
S. No. State Place Water
Depth (m)
Wave Height
(m)
Annual Energy Potential
(GWh)
1 Maharashtra Kudal 11-12 2.37 25.0
2 Kerala Trivandrum 15-20 2.4 28.6
3. Tamil Nadu Kanyakumari 12-13 2.4 26.6
4. Tamil Nadu Puducherry 5-8 1.67 12.1
5. Andhra Pradesh Kaviti 10-14 1.97 17.0
Table 4:- Proposed Sites for Wave Energy Harvesting
The estimate of the annual energy potential for each site
has been done by considering the utilization of 1 Km of
effective stretch of coastal line at each site.
In India, power generation from wave energy was
considered as an efficient source to meet the energy demand
and Vizhinjam (Kerala) was chosen as the first site in the
world to put an Oscillating Water Column Wave Energy
Converter. The plant was built in 1991 by investing Rs. 99 Lakhs. The plant was supposed to generate 150 KW on
continual basis and that had to be transferred to grid. But the
amount of power generated varied considerably. During April
to November, it generated only 75 KW and even lesser to 25
KW during December to March. The plant had worked at its
maximum level only during Mansoon period. The plant was
remained out of use for a longer period and in 2004, National
Institute of Ocean Technology (NIOT) had taken the plant to
desalinate ocean water. Initially, it was proposed that 10,000
Liters per day would be treated by the plant but it could not
become successful. Finally, this plant was permanently
decommissioned in 2011 and handed over to the Harbor
Department. This study remained a pilot study any significant breakthrough in terms of structural optimization and PTO
arrangements and the efforts have not continued since then.

Volume 4, Issue 8, August – 2019 International Journal of Innovative Science and Research Technology
ISSN No:-2456-2165
IJISRT19AUG581 www.ijisrt.com 85
V. BARRIER IN THE DEVELOPMENT OF WEC
A. Technological Barrier
Technological barriers represent the most important
issues that need to be addressed in the short and medium term.
The lack of design consensus related to converter technology
and its components constitute as the main hurdles that this
sector should overcome. Further, another factor is related to
the survivability of the devices, particularly in extreme
conditions. A number of WEC devices have been designed to
operate in high resource environment, i.e. wave power greater
than 50 KW/m but most of the deployments have done in the
mild resource environment. It is, therefore, utmost necessary
to employ innovation in designs and materials to ensure long term survivability of the devices. In case of onshore devices
such as OWC, reinforced sulfate-resistant concrete for
structural work and corrosion-resistant steel for turbine blades
should be used. In case of offshore devices, reinforced rubber
membrane should be used for Clams and Heaving Buoys and
inert polymers with high strength anti-corrosion steel material
should be used for rigid structure such as Pelamis. Mooring,
PTO, power electronics gear box etc. also play a significant
role in ensuring the overall reliability of the devices.
Despite of the large research and studies, wave energy harnessing technologies have not achieved its maturity level
and most of the technology developed is still largely unproven
and require further research, innovation and prototype testing
and demonstration to reach the level of commercial stage.
B. Investment Issue
The market of harnessing wave energy is still dominant
by some start-up companies and various research Institutes,
particularly UK Universities. They are focusing on
developing new technologies at pre-commercial stage or
assisting in creating new demonstration site in open sea. The
development of large scale wave farms requires different type of investment policy. Government grant and policy support
are the key to attract investors for large scale deployment. In
between 2006 to 2011, UK Government has funded EUR 20
million on annual basis for developing technologies and
commercial deployment. Further policy measures may
include large capital grants, project equity loan, tax exemption
etc. to attract investors or feed-in-tariffs, power purchase
agreements to attract end-users.
C. Environmental Issues
Wave energy is usually considered as non-polluting renewable source of energy as WEC devices produce no
harmful emission of CO2, NO2 etc. during their normal
operation. As majority of WEC devices are still in the early
stage of development and deployment, little is known
regarding the adverse impact on environment. However based
on research and studies, following impacts are observed:
In case of Onshore Devices-
The construction of devices and the road access causes
some localized damage during construction phase, piling and transport of materials to the site. It also causes
vibration.
Some of the WEC devices produce noise at low frequency
as in case of OWC in Islay which can be heard on long
distances and make it harder to bear.
In some cases, it has been observed that large array of
onshore units affects the endangered species but it is not
found to be very serious problem as the species tend to be
adoptive.
A WEC device has visual intrusion in the local landscape,
the impact of which depends upon the type of device and extent of mitigating landscaping.
Alteration of current and waves of ocean may have an
impact on coastal erosion which is most common during
the construction phase. Once constructed, the device will
slow down the rate of erosion.
In case of Offshore Device –
Archaeological site as shipwreck in some cases could be a
problem for deployment as in case of West Coast of
Europe. These shipwrecks are protected by different laws.
Hence, studies should be done regarding the Archaeological sites before the deploying the device.
Mooring of the devices lie on the seabed using pilings,
concrete blocks, anchors, chains etc. These may cause
local damage to the seabed which depends upon the
number of devices installed and the mooring systems
employed.
Leakage of oil may take place from the devices which
may pollute to the sea water and its quality may be
affected. Biodegradable oil is encouraged as it is more
environment friendly. Uses of anti-corrosion coating and
painting also have impact on marine life.
Wave devices have beneficial effect on fish. Anchor lines, tethers and power cables restrict the use of fish nets while
floating devices provide the new shelter conditions for
some marine species and habitats. However, the fishing
activity may increase outside the boundary of installation.
Marine mammals may be vulnerable to the floating
structure as it acts as a barrier to the marine movement and
migration of flora and fauna to the seabed. Further, the
mooring lines may pose a threat of entanglement for some
animals such as for large whales.
Large offshore devices may cause serious obstacles to
navigation of ships. However, ships use radar and navigation lights.
The large offshore devices may have serious consequences
on wave patterns and sedimentation rate. Changes in water
velocities may cause deposition of coarse sediments such
as pebbles or rocks.

Volume 4, Issue 8, August – 2019 International Journal of Innovative Science and Research Technology
ISSN No:-2456-2165
IJISRT19AUG581 www.ijisrt.com 86
Hence, very comprehensive and in depth analysis are
required right from the development stage to the installation stages in order to develop the new range of technologies,
devices and subsystem to design the mitigation measures.
D. Infrastructure Issues
For successful harnessing of wave energy, appropriate
infrastructure such as grid and array connection and port
facilities are essential. Further, deep water offshore devices
require special substation design to connect arrays and long
distance connections.
Majority of the site lack grid infrastructure except of
European countries where high voltage transmission lines are available closer to shore. Thus, it requires either grid upgrades
or new-built capacity which implies high additional costs.
Further, grid codes for transmission and distribution networks
such as frequency stability, voltage, power factor and
harmonics has to be met in order to guarantee the safe
operation of grid. Hence, adequate control systems for WEC
and arrays have to be developed and further research is
needed in the area of control strategies as it offers a great
reduction in cost due to increased absorbed energy.
Integration of wind energy network and WEC should also be
explored.
For large scale deployment, port facilities are also
important requirements. The operation and maintenance of
devices are expensive as these are to be performed under
severe difficult marine conditions. One of the alternatives of
this problem is to unplug the device from their offshore place
and to perform all the maintenance activities at a dedicated,
safe and more accessible port. Such planning can be made
more efficient by combining this to other functions such as
offshore wind parking servicing, maintenance etc.
E. Regulatory and Legal Issues Regulatory and legal issues are considered as the most
important non-technical barrier for the development of the
ocean energy sector. Ocean energy is usually developed by
Government Agencies as a renewable source of energy to
achieve the target of climate change and energy demand.
Often much attention is not given regarding the regulations
and legal barriers.
According to UN Convention on the law of the sea,
territorial sea comprises the coastal water up to 12 Nautical
Miles (22.224 Km) from a base line which is usually the mean water mark. Territorial sea is the sovereign territory of State
and the State has full authority and rights over water, seabed
and subsoil. The territorial State has the right to set laws and
regulate the use of ocean. Majority of the countries yet do not
have specific legal and regulatory framework and this
uncertainty is one of the major bottleneck in the development.
In USA, more than 23 Federal and State Regulatory Bodies
are involved in the development of ocean energy projects.
Hence, approval processes are very complex.
Maritime Spatial Planning is considered as one of the
solution to overcome these problems. By doing so, over-
regulation and administrative complexity can be reduced. It
will help to avoid user conflicts and improve the integrated
management of marine resource use. In 2013, European
Commission proposed a directive on Marine Spatial Planning
but yet it has not been fully introduced in all EU Members.
Hence, still more research and studies are required regarding
the regulation and legal framework.
VI. COST OF HARNESSING OF WAVE ENERGY
As per SI Ocean 2013 estimate, the levelised cost of
electricity (LCOE) of wave energy farms of 10 MW comes
out to be EUR 330 to 630/MWh. Due to limited commercial
experience, these costs are considerably higher than other
forms of renewable energies like wind energy and tidal
energy. However, because of concerted research, studies and
prototype testing, by 2030 its LCOE may be expected to
reduce to EUR 150 to 180/MWh, provided that deployment
level of more than 5 GW is achieved.
As per SI Ocean 2013 Report, the latest estimates for
European wave energy projects suggest following distribution
of the total lifetime project cost:
PTO System 22%
Installation 18%
Operation and Maintenance 17%
Foundation and Mooring 06%
Grid Connection 05%
Structure, Decommissioning and Others 32%
The reduction in the cost can be achieved with scale and volume, experience and through innovation. Increasing scale
bring down cost by upscaling of devices, installing more
number of devices and increasing the scale of production
through better and higher utilization of equipment,
standardization of processes and buying larger batches of
components.
As more research, studies, prototype testing etc. will be
done, more experiences are gained regarding the optimum
routes for production, installation methodologies and
operation and maintenance techniques. This know-how will help in cost reduction.
Innovation is the key factor in reducing the cost which
involves changes in design concept, processes and materials
to be used in the whole devices and in subsystems. It also
includes the concept of capturing wave energy. All
improvements in the device design are basically aimed to
reduce capital cost and to improve reliability. Data obtained
Volume 4, Issue 8, August – 2019 International Journal of Innovative Science and Research Technology
ISSN No:-2456-2165
IJISRT19AUG581 www.ijisrt.com 87
from field and prototype testing give ideas regarding the less
and alternative materials that can be used for main structure and sub components. Alternative materials reduce the cost
significantly by allowing changes in shapes and optimization
of weight. Further, there is a requirement to optimize the
configuration of PTO and structure of wave devices to
increase yield. Other type of PTO also offers opportunities of
improvement such as in case of OWC, improving the
efficiency of turbines. Development of control system and
software are crucial so that it can respond to the changing
wave characteristics and adjust the device to give optimum
energy output under each condition which involves minimal
increase in capital cost. Hence, there is a tremendous scope
for reducing the cost by optimization of the device and control system.
Currently apart from UK, a number of countries such as
USA, Canada, Australia, China, South Korea and Japan are
also taking a lot of interest in these sectors. Hence, there is a
significant increase in the promotion of technologies and also
in the research and development activities and programme. As
a result, large multi-disciplinary engineering firms and
industries are showing interest in this emerging sector and are
expected to promote synergies which will install large wave
energy farms. This will create conditions for the cost reduction.
VII. CONCLUSIONS
A comprehensive study of harnessing wave energy was
made in this paper. Currently, there is no leading category of
WEC device. Most of the research effort revolves around
Point Absorbers (40%), Attenuators (23%) and oscillating
Wave Surge Devices (19%). At present, about 64% WEC
under deployment is designed as offshore devices. Even of so
much development of demonstration and testing facilities, till
date no installation has taken place more than 5 Km away from the shore and in water depth of more than 75 m.
The total annual global wave energy estimate comes out
to be 29500 TWh which is 8% decrease from the theoretical
wave energy potential of 32000 TWh as estimated by Mork.
These wave estimates give the energy flux due to wave
propagation and only a fraction of available energy flux at any
site can be harnessed into useful forms of energy due to
geographical, technical and economic constraints. In India,
there is a huge potential of harnessing wave energy as it has a
long coastline of about 7500 Km and about 336 islands in the Bay of Bengal and Arabian Sea. Current estimate shows that
the total power available along the coastline is about 50 GW.
However, if wave power above 10 KW/m is efficiently
harvested, the total available wave power would be 41 GW.
Further 41 GW may not be harvested due to many physical
and site constraints. Based on survey and studies, five
potential sites have been identified, having Annual Energy
Potential as: Kudal (Maharashtra) – 25 GWh, Trivandrum
(Kerala) – 28.6 GWh, Kanyakumari (Tamil Nadu) - 26.6
GWh, Puducherry (Tamil Nadu) - 12.1 GWh and Kaviti (Andhra Pradesh) - 17.0 GWh. In spite of huge potentials,
available technology is still in the early stage of development
and its commercialization has not progressed as expected.
These technologies face a number of bottlenecks – technology
development, finance and markets, environmental,
infrastructure, regulatory and legal issues. Overcoming these
issues require concerted efforts by industry, academia and
policy makers.
Further, as per SI Ocean 2013 estimate, the levelised
cost of electricity (LCOE) of wave energy farms of 10 MW
comes out to be EUR 330 to 630/MWh which is considerably higher than other forms of renewable energies like wind
energy and tidal energy. However, because of concerted
research, studies and prototype testing, by 2030 its LCOE
may be expected to reduce to EUR 150 to 180/MWh,
provided that deployment level of more than 5 GW is
achieved. Currently, large multi-disciplinary engineering
firms and industries are showing interest in this emerging
sector and are expected to promote synergies which will
install large wave energy farms. This will create conditions
for the cost reduction.
REFERENCES
[1]. Afd (Agence Française De Développement) and IREDA
(Indian Renewable Energy Development Agency
Limited) 2014, “Study on Tidal & Waves Energy in
India: Survey on the Potential & Proposition of a
Roadmap Final Report”.
[2]. A. F. de O. Falcão, 2010 "Wave Energy Utilization: A
Review of the Technologies," Renew. Sust. Energ. Rev.
14, pp. 899.
[3]. ARENA (Australian Renewable Energy Agency,
Canberra) 2014a &b, “Commercial Readiness Index for Renewable Energy Sectors”.
[4]. Bahaj A.S. 2011, ‘Generating energy from the oceans’,
Elsevier Renewable and Sustainable Energy Reviews,
vol.15, issue 7, pp. 3399-3416.
[5]. B.Drew, A.R.Plummer and M.N.Sahinkaya 2009 – “A
review of wave energy converter technology” Review
paper.
[6]. Centre for Renewable and Sustainable Energy Studies
2013, “Wave Energy Converters (WECs)” http: / /www.
sun.ac.za/crses
[7]. GENI (Global Energy Network Institute) 2009, “OCEAN ENERGY TECHNOLOGIES for
RENEWABLE ENERGY GENERATION”
[8]. G. Sannino, C. Cavicchioli 2013, “Overcoming research
challenges for ocean renewable energy European Union,
Luxembourg”.
[9]. IPCC (Intergovernmental Panel on Climate Change)
2010,“Report on Ocean Energy”.
Volume 4, Issue 8, August – 2019 International Journal of Innovative Science and Research Technology
ISSN No:-2456-2165
IJISRT19AUG581 www.ijisrt.com 88
[10]. IRENA (International Renewable Energy Agency) 2014,
“Ocean energy technology: Innovation, Patents, Market Status and Trends”.
[11]. IRENA (International Renewable Energy Agency) 2014,
“ Wave Energy Technology Brief”.
[12]. J. Callaghan, R. Boud 2006, “Future marine energy –
results of the marine energy challenge: cost
competitiveness and growth of wave and tidal stream
energy” Carbon Trust, London.
[13]. J. Cruz et al 2008, “Ocean Wave Energy: current status
and future prospective”, Chapter 7, pp. 325-328.
[14]. J.P.Kofoed, P.Frigaard, E.Friis-Madsen and H.C.Srensen
2004, “Prototype Testing of the Wave Energy Converter
Wave Dragon” World Renewable Energy Congress VIII. [15]. Magagna D, & Uihlein A 2015, “2014 JRC Ocean
Energy Status Report: Technology, market and
economic aspects of ocean energy in Europe”.
[16]. Magagna D, A. Uihlein 2015, “Ocean energy
development in Europe: current status and future
perspectives” Int J Marine Energy, 11 pp. 84-104.
[17]. R.C. Sharma and Niharika Sharma 2013, “Energy from
the ocean & scope of its utilization in India”,
International Journal of Environmental Engineering and
Management, ISSN 2231-1319, Volume 4, Number 4
pp. 397-404. [18]. SI Ocean (Strategic Initiative for Ocean Energy) 2014,
“Wave and Tidal Energy Strategic Technology Agenda”.
[19]. SI ocean 2013, “Ocean energy: cost of energy and cost
reduction opportunities. Strategic initiative for ocean
energy”.
[20]. World Energy Resources 2016, “Report on Marine
Energy”.


![[He]2s1 Lithium—For Harnessing Renewable Energy 6 · PDF filecesium, and tantalum, ... Lithium—For Harnessing Renewable Energy. ISSN 2327–6932 (online) ... at the top is 1.7](https://img.pdfslide.us/doc/110x75/5aa249487f8b9a1f6d8d08e3/he2s1-lithiumfor-harnessing-renewable-energy-6-and-tantalum-lithiumfor.jpg)


![[PPT]Chapter 18 Renewable Energy 18-1 Renewable …environmentalscienceclass.weebly.com/.../ch_18_notes.ppt · Web viewChapter 18 Renewable Energy 18-1 Renewable Energy Today Renewable](https://img.pdfslide.us/doc/110x75/5b029fb97f8b9a6a2e900bdf/pptchapter-18-renewable-energy-18-1-renewable-envir-viewchapter-18-renewable.jpg)