Embed Size (px)
Citation preview

HARNESSTHE POWEROF MOBILITY--------------------------------------------------
Smith Micro Software2014 Annual Report
HARNESSTHE POWEROF MOBILITY--------------------------------------------------
Smith Micro Software2014 Annual Report
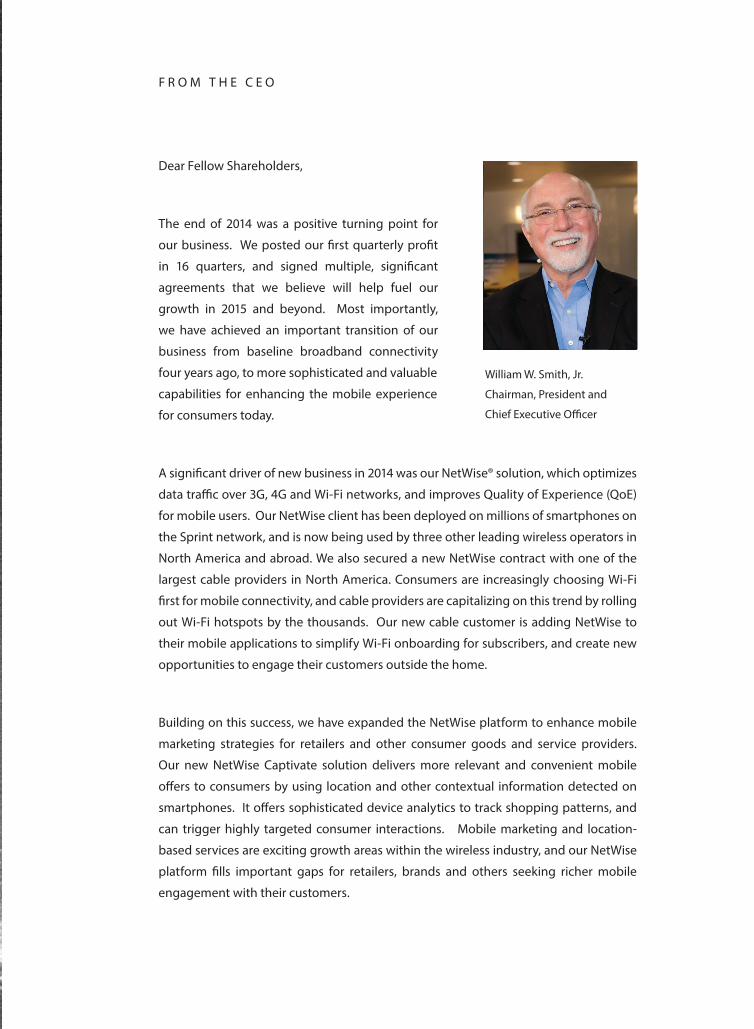
F R O M T H E C E O
Dear Fellow Shareholders,
The end of 2014 was a positive turning point for
our business. We posted our first quarterly profit
in 16 quarters, and signed multiple, significant
agreements that we believe will help fuel our
growth in 2015 and beyond. Most importantly,
we have achieved an important transition of our
business from baseline broadband connectivity
four years ago, to more sophisticated and valuable
capabilities for enhancing the mobile experience
for consumers today.
A significant driver of new business in 2014 was our NetWise® solution, which optimizes
data traffic over 3G, 4G and Wi-Fi networks, and improves Quality of Experience (QoE)
for mobile users. Our NetWise client has been deployed on millions of smartphones on
the Sprint network, and is now being used by three other leading wireless operators in
North America and abroad. We also secured a new NetWise contract with one of the
largest cable providers in North America. Consumers are increasingly choosing Wi-Fi
first for mobile connectivity, and cable providers are capitalizing on this trend by rolling
out Wi-Fi hotspots by the thousands. Our new cable customer is adding NetWise to
their mobile applications to simplify Wi-Fi onboarding for subscribers, and create new
opportunities to engage their customers outside the home.
Building on this success, we have expanded the NetWise platform to enhance mobile
marketing strategies for retailers and other consumer goods and service providers.
Our new NetWise Captivate solution delivers more relevant and convenient mobile
offers to consumers by using location and other contextual information detected on
smartphones. It offers sophisticated device analytics to track shopping patterns, and
can trigger highly targeted consumer interactions. Mobile marketing and location-
based services are exciting growth areas within the wireless industry, and our NetWise
platform fills important gaps for retailers, brands and others seeking richer mobile
engagement with their customers.
William W. Smith, Jr.
Chairman, President and
Chief Executive Officer
Another driver of our business in 2014 was our CommSuite® platform. Sprint continues
to ship our CommSuite Visual Voicemail client on all of their Android devices, generating
strong revenue growth from premium Voice-to-Text subscriptions, as well as from
mobile advertising. In August, Sprint released a new CommSuite Avatar service that
allows subscribers to create animated voice messages using colorful characters and
backgrounds. The service was developed using our award-winning Anime Studio®
graphics product and built on the carrier-grade CommSuite platform. Avatar messaging
is also available as an over-the-top messaging app or via an SDK, allowing integration
with third-party messaging applications. With a diverse and rapidly growing content
library, and a variety of packaging and delivery methods available, we can expand
Avatar capabilities to new channels in 2015 and beyond.
We are also creatively applying our graphics assets to the gaming industry. In August
we announced a new version of our Poser® 3D graphics software optimized for online
and mobile gaming platforms, such as the Unity game engine used by millions of game
developers worldwide. New Poser Pro Game Dev opens the door for our large Poser
community to expand their work into gaming, and also exposing a huge community of
Unity developers to the world-class Poser 3D content library.
Adapting our market-leading technologies to solve new problems is what Smith
Micro has been doing for more than 30 years. As mobile platforms evolve, our proven
QuickLink® connectivity software continues to evolve as well, helping enterprises
and public safety organizations with secure, convenient and reliable access to mobile
broadband service. We also continue to enhance our VIDIO® streaming platform to
support the latest viewing devices, including Internet-enabled TVs, digital signage,
tablets, phablets, and smartphones. Whether consumers are laying by the pool at a
resort or visiting a crowded sports arena, they expect fast access to both live and on-
demand video content. Our latest “1-box” VIDIO solution makes high-performance video
delivery much simpler for hospitality, public venues and other complex environments.
While all of these product and market developments are extremely positive, we
recognize that we must continue to manage our operating expenses very closely. We
have flattened our organization and become more nimble. We have downsized our
facilities at our headquarters in Aliso Viejo, our development center in Pittsburgh, and at
our remote offices in Northern California. We are carefully balancing hiring to support
the pipeline with committed revenues, and we are targeting almost all headcount

Most sincerely yours,
William W. Smith, Jr. Chairman, CEO and President
growth in the more cost-effective areas of Belgrade, Serbia and Pittsburgh. We have
always been proud of our engineering talent, and the outstanding development
organizations we have built in Belgrade and Pittsburgh allows us to more effectively
utilize resources across time zones to deliver innovative new technology at a very rapid
pace.
This is an exciting and pivotal time for Smith Micro. We believe we are well positioned
to build on our 2014 momentum based upon four key strengths of the company:
1. We have the right products at the right time to help our customers capitalize on
the widespread adoption of smartphones, Wi-Fi, 3G and 4G networks, and content-
driven mobile applications.
2. We have the credibility and relationships with executives at Tier 1 operators, cable
providers, device manufacturers, and enterprises to secure new deals and become
trusted advisors for future initiatives.
3. We have significant competitive leverage based on our technical expertise and
operational discipline, allowing us to execute quickly and cost-effectively to
achieve our objectives.
4. We have a healthy balance sheet, supported by a growing base of business that will
allow us to invest in new areas and maintain a leadership position in our markets.
We’ve worked very hard over the past few years to enhance our product portfolio,
streamline our operations, and turn around our business case. Our team is working with
outstanding efficiency and productivity. Our products are proving to offer unmatched
functionality and value to our customers. We are extremely proud to have posted a
profit in the fourth quarter of 2014, and we will continue to push ourselves to build a
balanced, predictable, and profitable business in 2015 and beyond.

UNITED STATES SECURITIES AND EXCHANGE COMMISSION
Washington, D.C. 20549 FORM 10-K
______________ [X] ANNUAL REPORT PURSUANT TO SECTION 13 OR 15(d) OF THE SECURITIES EXCHANGE ACT
OF 1934 For the fiscal year ended December 31, 2014
[ ] TRANSITION REPORT PURSUANT TO SECTION 13 OR 15(d) OF THE SECURITIES EXCHANGE
ACT OF 1934 For the transition period from __________ to __________
Commission File Number 01-35525
SMITH MICRO SOFTWARE, INC. (Exact name of registrant as specified in its charter)
_____________________
Delaware (State or other jurisdiction of incorporation or organization)
33-0029027 (I.R.S. Employer Identification Number)
51 Columbia, Aliso Viejo, CA (Address of principal executive offices)
92656
(Zip Code)
Registrant's telephone number, including area code: (949) 362-5800
Common Stock, $.001 par value (Title of each class)
The NASDAQ Stock Market LLC
(NASDAQ Global Market) (Name of each exchange on which registered)
_____________________
Securities registered pursuant to Section 12(b) of the Act: Common Stock, $.001 par value Securities registered pursuant to Section 12(g) of the Act: None
Indicate by check mark if the registrant is a well-known seasoned issuer, as defined in Rule 405 of the Securities Act.
YES [ ] NO [X] Indicate by check mark if the registrant is not required to file reports pursuant to Section 13 or 15(d) of the Securities
Exchange Act of 1934 YES [ ] NO [X] Indicate by check mark whether the registrant (1) has filed all reports required to be filed by Section 13 or 15(d) of the
Securities Exchange Act of 1934 during the preceding 12 months (or for such shorter period that the registrant was required to file such reports), and (2) has been subject to such filing requirements for the past 90 days. YES [X] NO [ ]
Indicate by check mark whether the registrant has submitted electronically and posted on its corporate Web site, if any, every Interactive Data File required to be submitted and posted pursuant to Rule 405 of Regulation S-T during the preceding 12 months (or for such shorter period that the registrant was required to submit and post such files). YES [X] NO [ ]
Indicate by check mark if disclosure of delinquent filers pursuant to Item 405 of Regulation S-K is not contained herein, and
will not be contained, to the best of registrant's knowledge, in definitive proxy or information statements incorporated by reference in Part III of this Form 10-K or any amendment to this Form 10-K [ ]
Indicate by check mark if whether the registrant is a large accelerated filer, an accelerated filer, or a non-accelerated filer.
See definition of “accelerated filer and large accelerated filer” in Rule 12b-2 of the Exchange Act. (Check one): Large accelerated filer [ ] Accelerated filer [ ] Non-accelerated filer [X] (Do not check if a smaller reporting company) Smaller reporting company [ ] Indicate by check mark whether the registrant is a shell company (as defined in Rule 12b-2 of the Act). YES [ ] NO [X] As of June 30, 2014, the last business day of the registrant’s most recently completed second quarter, the aggregate market
value of the common stock of the registrant held by non-affiliates was $34,209,212 based upon the closing sale price of such stock as reported on the Nasdaq Global Market on that date. For purposes of such calculation, only executive officers, board members, and beneficial owners of more than 10% of the registrant’s outstanding common stock are deemed to be affiliates.
As of February 20, 2015, there were 45,004,146 shares of common stock outstanding.
DOCUMENTS INCORPORATED BY REFERENCE
Portions of the registrant’s Proxy Statement for the 2015 Annual Meeting of Stockholders to be filed under the Securities Exchange Act of
1934 are incorporated by reference in Part III of this report.

SMITH MICRO SOFTWARE, INC. 2014 ANNUAL REPORT ON FORM 10-K
TABLE OF CONTENTS
PART I
Item 1. BUSINESS .................................................................................................................................................... 4
Item 1A. RISK FACTORS ........................................................................................................................................... 10
Item 1B. UNRESOLVED STAFF COMMENTS ........................................................................................................ 19
Item 2. PROPERTIES ............................................................................................................................................... 19
Item 3. LEGAL PROCEEDINGS ............................................................................................................................. 19
Item 4. MINE SAFETY DISCLOSURES ................................................................................................................. 19
PART II
Item 5. MARKET FOR REGISTRANT’S COMMON EQUITY, RELATED STOCKHOLDER MATTERS AND ISSUER PURCHASES OF EQUITY SECURITIES ....................................................... 20
Item 6. SELECTED CONSOLIDATED FINANCIAL DATA ................................................................................. 23
Item 7. MANAGEMENT'S DISCUSSION AND ANALYSIS OF FINANCIAL CONDITION AND RESULTS OF OPERATIONS ............................................................................................................ 24
Item 7A. QUANTITATIVE AND QUALITATIVE DISCLOSURES ABOUT MARKET RISK .............................. 34
Item 8. FINANCIAL STATEMENTS AND SUPPLEMENTARY DATA .............................................................. 35
Item 9. CHANGES IN AND DISAGREEMENTS WITH ACCOUNTANTS ON ACCOUNTING AND FINANCIAL DISCLOSURE ........................................................................................................................ 35
Item 9A. CONTROLS AND PROCEDURES ............................................................................................................. 35
Item 9B. OTHER INFORMATION ............................................................................................................................. 36
PART III
Item 10. DIRECTORS, EXECUTIVE OFFICERS AND CORPORATE GOVERNANCE ....................................... 37
Item 11. EXECUTIVE COMPENSATION ................................................................................................................ 39
Item 12. SECURITY OWNERSHIP OF CERTAIN BENEFICIAL OWNERS AND MANAGEMENT AND RELATED STOCKHOLDER MATTERS ......................................................................................... 39
Item 13. CERTAIN RELATIONSHIPS AND RELATED TRANSACTIONS, AND DIRECTOR INDEPENDENCE ........................................................................................................................................ 39
Item 14. PRINCIPAL ACCOUNTING FEES AND SERVICES................................................................................ 39
PART IV
Item 15. EXHIBITS AND FINANCIAL STATEMENT SCHEDULES .................................................................... 40
SIGNATURES .............................................................................................................................................. 44

3
SPECIAL NOTE REGARDING FORWARD LOOKING STATEMENTS
In this document, the terms “Smith Micro,” “Company,” “we,” “us,” and “our” refer to Smith Micro Software, Inc. and, where appropriate, its subsidiaries. This report contains forward-looking statements regarding Smith Micro which include, but are not limited to, statements concerning projected revenues, expenses, gross profit and income, the competitive factors affecting our business, market acceptance of products, customer concentration, the success and timing of new product introductions and the protection of our intellectual property. These forward-looking statements are based on our current expectations, estimates and projections about our industry, management's beliefs, and certain assumptions made by us. Words such as “anticipates,” “expects,” “intends,” “plans,” “predicts,” “potential,” “believes,” “seeks,” “estimates,” “should,” “may,” “will” and variations of these words or similar expressions are intended to identify forward-looking statements. Forward-looking statements also include the assumptions underlying or relating to any of the foregoing statements. These statements are not guarantees of future performance and are subject to risks, uncertainties and assumptions that are difficult to predict. Therefore, our actual results could differ materially and adversely from those expressed or implied in any forward-looking statements as a result of various factors. Such factors include, but are not limited to, the following:
• our customer concentration given that the majority of our sales depend on a few large client
relationships, including Sprint; • the risk of being delisted from the NASDAQ Global Select Market if we fail to meet any of the listing
requirements; • changes in demand for our products from our key customers and their end-users; • the intensity of the competition and our ability to successfully compete; • the pace at which the market for new products develop; • our ability to hire and retain key personnel; • the availability of third party intellectual property and licenses which may not be on commercially
reasonable terms, or not at all; • our ability to establish and maintain strategic relationships with our customers; • our quarterly revenues and operating results are difficult to predict and could fall below analyst or
investor expectations, which could cause the price of our common stock to fall; • our ability to protect our intellectual property and our ability to not infringe on the rights of others; • our ability to raise additional capital to fund our operations and such capital may not be available to
us at commercially reasonable terms or at all; • security and privacy breaches in our systems may damage client relations and inhibit our ability to
grow; • interruptions or delays in the services we provide from our data center hosting facilities could harm
our business; and • those additional factors which are listed under the section “1A. Risk Factors” beginning on page 10
of this report.
The forward-looking statements contained in this report are made on the basis of the views and assumptions of management regarding future events and business performance as of the date this report is filed with the Securities and Exchange Commission (the “SEC”). We do not undertake any obligation to update these statements to reflect events or circumstances occurring after the date this report is filed.

4
Smith Micro provides software solutions to simplify and enhance the mobile experience. As a leader in wireless connectivity, our applications ensure the best Quality of Experience for mobile users while optimizing networks for wireless service providers and enterprises. Using our intelligent policy-on-device platform, along with premium voice, video and content monetization services, we create new opportunities to engage consumers and capitalize on the growth of connected devices. In addition to wireless and mobility software, Smith Micro develops and distributes personal, professional and educational productivity and graphics products and tools for consumers, artists, animators and designers worldwide.
Over the past three decades, the Company has developed deep expertise in embedded software for networked devices, policy-based management platforms, and highly-scalable mobile applications and hosted services. For organizations struggling to reduce costs and complexity in the fragmented, rapidly evolving mobile market, Smith Micro offers proven solutions that increase reliability and efficiency while accelerating delivery and value of mobile services to consumers.
The proliferation of mobile broadband technology continues to provide new opportunities for Smith Micro on a global scale. Smith Micro’s mission is to help our customers thrive in a connected world with software solutions that:
1. Simplify wireless connectivity to reduce costs and deliver “best-connected” experiences;
2. Optimize network and device resources for maximum performance, efficiency and flexibility;
3. Provide greater insight and control over the quality of service (“QoS”) delivered to users; and
4. Engage and grow high-value relationships with end customers using mobile devices.
The Company was incorporated in California in November 1983, and reincorporated in Delaware in June 1995. Our principal executive offices are located at 51 Columbia, Aliso Viejo, California 92656. Our telephone number is (949) 362-5800. Our website address is www.smithmicro.com. Our NASDAQ symbol is SMSI, and we make our SEC filings available on the Investor Relations page of our website. Information contained on our website is not part of this Annual Report on Form 10-K.
Our operations are organized into two business segments: Wireless and Productivity & Graphics. We do not separately allocate operating expenses, nor do we allocate specific assets to these groups. Therefore, segment information reported includes only revenues and cost of revenues. See Note 6 of Notes to Consolidated Financial Statements for financial information related to our business segments and geographical information.

5
The wireless industry continues to undergo rapid change on all fronts, from the growing expanse of heterogeneous networks, to the vast array of connected devices, to the endless barrage of mobile applications and digital content – especially video – consumed by users who want information and entertainment anytime, anywhere. While most of us think about being “connected” in terms of computers, tablets and smartphones, the emerging Internet of Things (“IoT”) market is creating a world where almost anything can be connected to the wireless internet.
Although the opportunities associated with pervasive connectivity are plenty, so are the challenges:
- Complexity, congestion and spectrum scarcity plague wireless networks, making mobile data access inconsistent, unreliable and expensive for consumers and businesses.
- Mobile Network Operators are being marginalized by over-the-top applications, social networks and Wi-Fi providers as they struggle to differentiate while facing tremendous price pressure.
- Enterprises face increasing pressure to mobilize workforces, operations and customer engagement, but lack the expertise and technologies needed to leverage mobile securely and cost-effectively.
- Consumers - frustrated by complicated, slow and restrictive access to wireless data services – seek simpler, more personalized mobile experiences.
To address these challenges, Smith Micro offers three product families that help our customers connect, control and capitalize on the mobile internet:
QuickLink® – applications for connecting consumer and machine-to-machine (“M2M”) devices to 3G, 4G and Wi-Fi networks, easily and reliably, while managing their data usage.
NetWise® – policy-on-device platform for controlling device behavior, optimizing data traffic, engaging mobile users, and improving quality of experience over wireless networks.
CommSuite® – premium voice, messaging and video services that allow operators and enterprises to flexibly deliver and monetize apps and content.
Our QuickLink connectivity solutions have been shipped on more than 100 million devices worldwide. Many of the world’s largest mobile network operators, including AT&T, Bell Canada, Orange, Sprint, T-Mobile, Verizon Wireless, and Vodafone, have offered QuickLink as a white-label connection management application to their subscribers. QuickLink components are embedded by leading chipset manufacturers and module makers to ensure that connectivity is consistent across device types. QuickLink is also used by enterprises and public sector organizations with mobile workforces to provide enhanced security and configurability over public and private wireless networks.
NetWise provides visibility and control over 3G, 4G and Wi-Fi network connections to ensure the best possible quality of experience for end users. NetWise helps operators reduce congested cellular networks with efficient Wi-Fi offload, while also facilitating Wi-Fi on-load for broadband providers who are extending services outside of the home. Used by several Tier 1 operators and broadband providers in the U.S., Latin America and Asia, NetWise provides the device intelligence and a management platform to maximize service uptake and performance. For retailers and other consumer service providers, NetWise offers a new way to engage consumers with more personalized, context-based mobile promotions.
The CommSuite premium services platform gives operators new ways to drive revenues and better compete with over-the-top (“OTT”) applications. It offers innovative features, such as Voice-to-Text transcription, Avatar messaging, and Videomail, while supporting flexible business models, including “freemium” try-and-buy offers, monthly subscriptions, content purchases, and ad-sponsored user engagement. CommSuite also
6
enables efficient, high-performance streaming of mobile video content for entertainment, hospitality, large venues, and other industries.
Over the past three decades, Smith Micro has developed unmatched expertise in mobile device software, integration to operator services, and wireless industry standards. Our ability to customize solutions that meet stringent reliability and security requirements for Tier 1 operators makes us the preferred choice for any company that wants more out of mobile.
The Productivity & Graphics group develops a variety of software, including graphic design and animation, compression and PC/Mac utilities, for consumers, professional artists, and educators. This group also republishes and markets third-party software that complements the Company’s existing line of products. These products are available through direct sales on Smith Micro websites (smithmicro.com, mysmithmicro.com and contentparadise.com), as well as through affiliate websites, resellers and retail outlets.
The group’s primary focus is its line of graphic titles, in particular Poser®, Anime Studio®, Manga Studio® and MotionArtist™. These products are aimed at digital artists and designers of all skill levels, helping them to produce professional quality animations, comics, and other 2D and 3D art. Poser is the industry leading tool for 3D human figure design and animation. Anime Studio is used by both hobbyists and professional artists working for high-end animation studios in the motion picture industry, and Manga Studio is at the top of the market for comic illustration software, used by famous graphic novelists such as Dave Gibbons, the author of the Watchmen. The group is enhancing and mobilizing these solutions to extend to new markets including gaming, industrial design, digital content, and more.
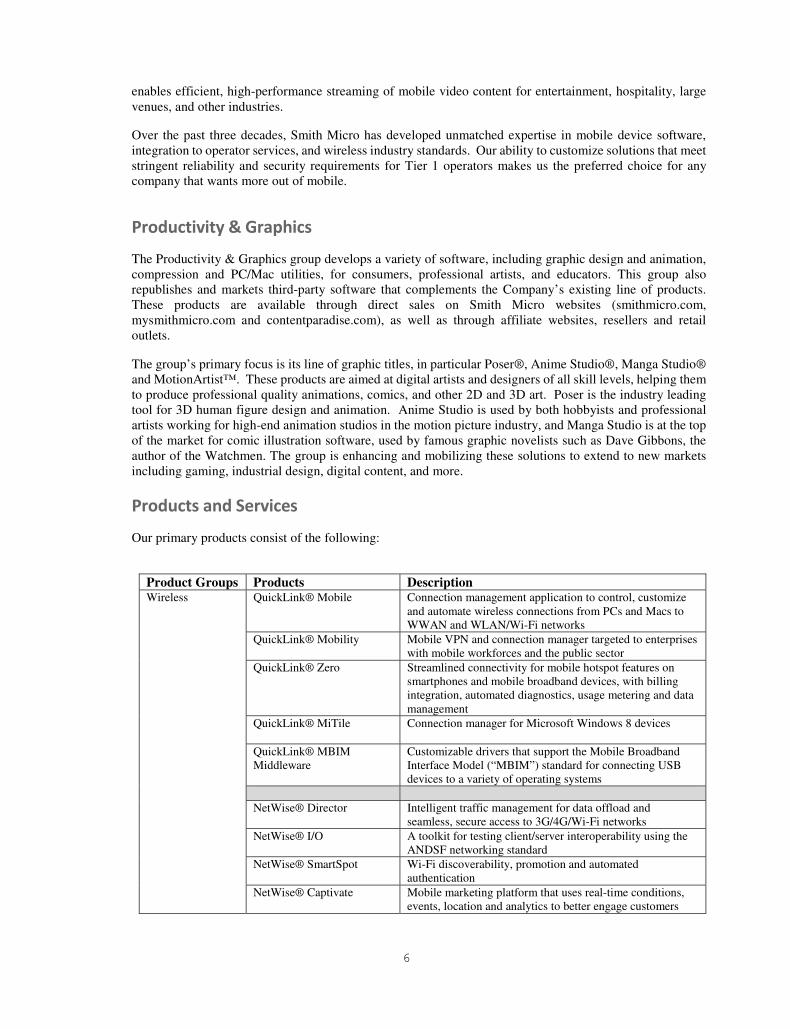
Our primary products consist of the following:
Product Groups Products Description Wireless QuickLink® Mobile Connection management application to control, customize
and automate wireless connections from PCs and Macs to WWAN and WLAN/Wi-Fi networks
QuickLink® Mobility Mobile VPN and connection manager targeted to enterprises with mobile workforces and the public sector
QuickLink® Zero Streamlined connectivity for mobile hotspot features on smartphones and mobile broadband devices, with billing integration, automated diagnostics, usage metering and data management
QuickLink® MiTile Connection manager for Microsoft Windows 8 devices
QuickLink® MBIM Middleware
Customizable drivers that support the Mobile Broadband Interface Model (“MBIM”) standard for connecting USB devices to a variety of operating systems
NetWise® Director Intelligent traffic management for data offload and
seamless, secure access to 3G/4G/Wi-Fi networks NetWise® I/O A toolkit for testing client/server interoperability using the
ANDSF networking standard NetWise® SmartSpot Wi-Fi discoverability, promotion and automated
authentication NetWise® Captivate Mobile marketing platform that uses real-time conditions,
events, location and analytics to better engage customers
7
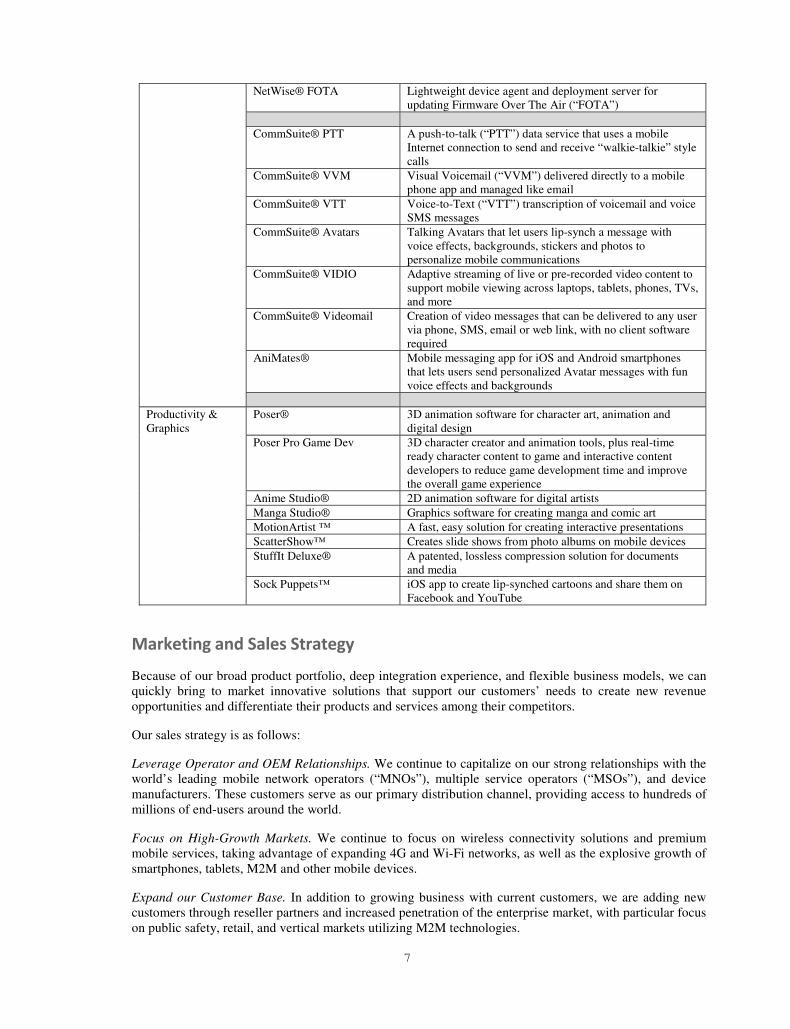
NetWise® FOTA Lightweight device agent and deployment server for updating Firmware Over The Air (“FOTA”)
CommSuite® PTT A push-to-talk (“PTT”) data service that uses a mobile
Internet connection to send and receive “walkie-talkie” style calls
CommSuite® VVM Visual Voicemail (“VVM”) delivered directly to a mobile phone app and managed like email
CommSuite® VTT Voice-to-Text (“VTT”) transcription of voicemail and voice SMS messages
CommSuite® Avatars Talking Avatars that let users lip-synch a message with voice effects, backgrounds, stickers and photos to personalize mobile communications
CommSuite® VIDIO Adaptive streaming of live or pre-recorded video content to support mobile viewing across laptops, tablets, phones, TVs, and more
CommSuite® Videomail Creation of video messages that can be delivered to any user via phone, SMS, email or web link, with no client software required
AniMates® Mobile messaging app for iOS and Android smartphones that lets users send personalized Avatar messages with fun voice effects and backgrounds
Productivity & Graphics
Poser® 3D animation software for character art, animation and digital design
Poser Pro Game Dev 3D character creator and animation tools, plus real-time ready character content to game and interactive content developers to reduce game development time and improve the overall game experience
Anime Studio® 2D animation software for digital artists Manga Studio® Graphics software for creating manga and comic art MotionArtist ™ A fast, easy solution for creating interactive presentations ScatterShow™ Creates slide shows from photo albums on mobile devices StuffIt Deluxe® A patented, lossless compression solution for documents
and media Sock Puppets™ iOS app to create lip-synched cartoons and share them on
Facebook and YouTube
Because of our broad product portfolio, deep integration experience, and flexible business models, we can quickly bring to market innovative solutions that support our customers’ needs to create new revenue opportunities and differentiate their products and services among their competitors.
Our sales strategy is as follows:
Leverage Operator and OEM Relationships. We continue to capitalize on our strong relationships with the world’s leading mobile network operators (“MNOs”), multiple service operators (“MSOs”), and device manufacturers. These customers serve as our primary distribution channel, providing access to hundreds of millions of end-users around the world.
Focus on High-Growth Markets. We continue to focus on wireless connectivity solutions and premium mobile services, taking advantage of expanding 4G and Wi-Fi networks, as well as the explosive growth of smartphones, tablets, M2M and other mobile devices.
Expand our Customer Base. In addition to growing business with current customers, we are adding new customers through reseller partners and increased penetration of the enterprise market, with particular focus on public safety, retail, and vertical markets utilizing M2M technologies.
8
Selectively Pursue Partners with Complementary Products and Services. We continue to pursue partnerships to help us enter new markets and extend our geographic reach. We will engage technology providers and systems integrators to deliver more comprehensive solutions to our customers.
Revenues to Sprint and their respective affiliates in the Wireless business segment accounted for 68.0% of the Company’s total revenues for the fiscal year 2014. Revenues to FastSpring in the Productivity & Graphics business segment accounted for 11.2% of the Company’s total revenues for the fiscal year 2014. Revenues to two customers (Sprint and Verizon Wireless) and their respective affiliates in the Wireless business segment accounted for 53.1% and 13.0%, respectively, of the Company’s total revenues for the fiscal year 2013. Revenues to FastSpring in the Productivity & Graphics business segment accounted for 11.4% of the Company’s total revenues for the fiscal year 2013. In 2012, our two largest customers (Sprint and Verizon Wireless) accounted for 40.7% and 20.5%, respectively, of our total revenues. Our major customers could reduce their orders of our products in favor of a competitor's product or for any other reason. The loss of any of our major customers or decisions by a significant customer to substantially reduce purchases could have a material adverse effect on our business.
We provide technical support and customer service through our online knowledge base, via email and live chat. OEM customers generally provide their own primary customer support functions and rely on us for support to their own technical support personnel.
The software industry, particularly the wireless market, is characterized by rapid and frequent changes in technology and user needs. We work closely with industry groups and customers, both current and potential, to help us anticipate changes in technology and determine future customer needs. Software functionality depends upon the capabilities of the hardware. Accordingly, we maintain engineering relationships with various hardware manufacturers and we develop our software in tandem with their product development. Our engineering relationships with manufacturers, as well as with our major customers, are central to our product development efforts. We remain focused on the development and expansion of our technology, particularly in the wireless space. Research and development expenditures amounted to $14.2 million, $21.3 million, and $24.8 million for the years ended December 31, 2014, 2013 and 2012, respectively.
Although we primarily deliver our software via electronic downloads, we do deliver our software in several other forms. We offer a package or kit that may include CD-ROMs and certain other documentation or marketing material. We also permit selected OEM customers to duplicate our products on their own CD-ROMs, USB devices, or embedded devices, and pay a royalty based on usage. Some OEM business requires that we provide a CD, which includes a soft copy of a user guide. Finally, we grant licenses to certain OEM customers that enable those customers to preload a copy of our software onto a personal computer. With the enterprise sales program, we offer site licenses under which a corporate user is allowed to distribute copies of the software to users within their corporate sites.
Our product development group produces a product master for each product that is then duplicated and packaged into products by the manufacturing organization. All product components are purchased by our personnel in our Aliso Viejo, California facility. Our manufacturing is subcontracted to outside vendors and includes the replication of CD-ROMs and the printing of documentation materials. Assembly of the final package is completed by our Aliso Viejo, California facility.
9
The markets in which we operate are highly competitive and subject to rapid changes in technology. These conditions create new opportunities for Smith Micro, as well as for our competitors, and we expect new competitors to enter the market. We will not only compete with other software vendors for new customer contracts, we will also compete to acquire technology and qualified personnel.
We believe that the principal competitive factors affecting the mobile software market include domain expertise, product features, usability, quality, price, customer service and effective sales and marketing efforts. Although we believe that our products currently compete favorably with respect to these factors, there can be no assurance that we can maintain our competitive position against current and potential competitors. We also believe that the market for our software products has been and will continue to be characterized by significant price competition. A material reduction in the price of our products could negatively affect our profitability.
Many existing and potential customers have the resources to develop products that compete directly with our products. These customers may discontinue the purchase of our products. Our future performance is substantially dependent upon the extent to which existing customers elect to purchase software from us rather than design and develop their own software.
Our success and ability to compete is dependent upon our software code base, our programming methodologies and other intellectual properties. To protect our proprietary technology and intellectual property, we rely on a combination of trade secrets, nondisclosure agreements, patents, copyright and trademark law that may afford only limited protection. As of December 31, 2014, we owned 85 issued U.S. patents and have 20 U.S. patent applications that are currently pending. These patents are intended to provide generalized protection of our intellectual property technology base and we will continue to apply for various patents and trademarks in the future as we deem necessary to protect our intellectual property technology base.
We seek to avoid unauthorized use and disclosure of our proprietary intellectual property by requiring employees and consultants with access to our proprietary information to execute confidentiality agreements with us and by restricting access to our source code. The deterrent steps that we have taken to protect our proprietary technology may not be adequate to deter misappropriation of our proprietary information or prevent the successful assertion of any adverse claim against us relating to software or intellectual property utilized by us. In addition, we may not be able to detect unauthorized use of our intellectual property rights or take effective steps to enforce those rights.
In selling our products, we primarily rely on “shrink wrap” licenses that are not signed by licensees and may be unenforceable under the laws of certain jurisdictions. In addition, the laws of some foreign countries do not protect our proprietary rights to as great an extent as do the laws of the United States. Accordingly, the means we currently use to protect and enforce all of our proprietary rights and intellectual property rights may not be adequate. Moreover, our competitors may independently develop competitive technology similar to ours. We also license technology on a non-exclusive basis from several companies for inclusion in our products and anticipate that we will continue to do so in the future. If we are unable to continue to license these technologies or to license other necessary technologies for inclusion in our products, or such third party technologies become subject to claims directed to or against the third party technologies used by us, or if we experience substantial increases in royalty payments under these third party licenses, our business could be materially and adversely affected.

10
As of December 31, 2014, we had a total of 183 employees within the following departments: 110 in engineering, 37 in sales and marketing, 16 in operations and customer support and 20 in management and administration. We are not subject to any collective bargaining agreement and we believe that our relationships with our employees are good.
Our future operating results are highly uncertain. Before deciding to invest in our common stock or to maintain or increase your investment, you should carefully consider the risks described below, in addition to the other information contained in this report and in our other filings with the SEC, including our reports on Forms 10-K, 10-Q and 8-K. The risks and uncertainties described below are not the only ones we face. Additional risks and uncertainties not presently known to us or that we currently deem immaterial may also affect our business operations. If any of these risks actually occur, that could seriously harm our business, financial condition or results of operations. In that event, the market price for our common stock could decline and you may lose all or part of your investment. We derive a significant portion of our revenues from sales of a small number of products to Sprint, so our revenues and operating results are highly vulnerable to shifts in demand and may decline. In our Wireless business segment, we sell primarily to large carriers, cable operators, and original equipment manufacturers (“OEMs”), so there are a limited number of actual and potential customers for our products, resulting in customer concentration for sales of our products and services. For the year ended December 31, 2014, sales to Sprint and their affiliates comprised 68.0% of our total revenues. Because of our customer concentration, this carrier and other large customers may have significant pricing power over us, and any material decrease in sales to any of them would materially affect our revenues and profitability. Additionally, carriers, cable operators, and OEMs are not the end-users of our products. If any of their efforts to market products and services incorporating our software are unsuccessful in the marketplace, our revenues and profitability could be adversely affected. On July 10, 2013, Softbank and Sprint Nextel completed a merger which could further intensify the competitive pressures that we face. Furthermore, the uncertainties created by this merger could cause it to delay or cancel planned purchases of our products and services, particularly if there are proposed changes or uncertainties in the future management, product offerings and technical specifications of Sprint and its product portfolio.
We also derive a significant portion of our revenues from a few vertical markets, such as wireless carriers, cable operators, and handset manufacturers. In order to sustain and grow our business, we must continue to sell our software products into these vertical markets. Shifts in the dynamics of these vertical markets, such as new product introductions by our competitors, could materially harm our results of operations, financial condition and prospects. To increase our sales outside our core vertical markets, for example to large enterprises, requires us to devote time and resources to hire and train sales employees familiar with those industries. Even if we are successful in hiring and training sales teams, customers in other vertical markets may not need or sufficiently value our current products or new product introductions. In 2014, we announced a restructuring plan and we may take additional restructuring actions in the future that would result in additional charges, which would have a negative impact on our results of operations in the period the action is taken. On May 6, 2014, the Board of Directors approved a plan of restructuring intended to streamline and flatten the Company’s organization, reduce overall headcount by approximately 20% and reduce its overall cost structure by approximately $2.0 million per quarter. This resulted in a special one-time restructuring charge
11
of $1.8 million that was recorded in the fiscal quarter ended June 30, 2014. At the same time, we increased our 2013 restructuring reserve by $0.6 million to update and adjust our lease termination cost assumptions. If the demand for our legacy and new products does not increase, we may need to take additional restructuring actions in future quarters, although we currently do not have any intention to do so. If future restructuring actions are taken, this could have a material adverse effect on our financial condition and results of operations in the period that the action is taken. If we fail to meet the requirements for continued listing on the NASDAQ Global Select Market, our common stock would likely be delisted from trading on the NASDAQ Global Select Market, which could adversely affect the liquidity of our common stock and cause our trading price to decline. Our common stock is currently listed for quotation on the NASDAQ Global Select Market. We are required to meet specified financial requirements in order to maintain our listing on the NASDAQ Global Select Market. If we fail to satisfy the NASDAQ Global Select Market’s continued listing requirements, our common stock would likely be delisted from the NASDAQ Global Select Market, in which case our common stock may trade on the OTC Bulletin Board. Any potential delisting of our common stock from the NASDAQ Global Select Market would likely result in decreased liquidity and increased volatility of our common stock, and would likely cause our trading price to decline. During 2014, the Company no longer met the requirement of NASDAQ Rule 5450(b)(1)(A), which requires companies listed on the NASDAQ Global Select Market to maintain a minimum of $10,000,000 in stockholders’ equity for continued listing (the “Minimum Stockholders’ Equity Rule”). As a result of the proceeds from the Company’s private placement stock offering, the Company regained compliance with the Minimum Stockholders’ Equity Rule. Also in 2014, the Company failed to comply with Nasdaq’s Marketplace Rule 5450(a)(1) because the bid price for the Company’s common stock over a 30 consecutive business day period had closed below the minimum $1.00 per share requirement for continued listing. The Company regained compliance in January 2015 after the stock price closed above $1.00 per share for 10 consecutive business days. There can be no assurance that the Company will in the future maintain compliance with the Minimum Stockholders’ Equity Rule, the minimum $1.00 per share rule, or other requirements for continued listing on NASDAQ.
Our quarterly revenues and operating results are difficult to predict and could fall below analyst or investor expectations, which could cause the price of our common stock to fall.
Our quarterly revenues and operating results have fluctuated significantly in the past and may continue to vary from quarter to quarter due to a number of factors, many of which are not within our control. If our operating results do not meet the expectations of securities analysts or investors, our stock price may decline. Fluctuations in our operating results may be due to a number of factors, including the following:
• the gain or loss of a key customer;
• the size and timing of orders from and shipments to our major customers;
• the size and timing of any product return requests;
• our ability to maintain or increase gross margins;
• variations in our sales channels or the mix of our product sales;
• our ability to anticipate market needs and to identify, develop, complete, introduce, market and produce new products and technologies in a timely manner to address those needs;
• the availability and pricing of competing products and technologies and the resulting effect on sales and pricing of our products;
• acquisitions;
• the effect of new and emerging technologies;

12
• the timing of acceptance of new mobile services by users of our customers’ services;
• deferrals of orders by our customers in anticipation of new products, applications, product enhancements or operating systems; and
• general economic and market conditions.
We have difficulty predicting the volume and timing of orders. In any given quarter, our sales have involved, and we expect will continue to involve, large financial commitments from a relatively small number of customers. As a result, the cancellation or deferral of even a small number of orders would reduce our revenues, which would adversely affect our quarterly financial performance. Also, we have often recorded a large amount of our sales in the last month of the quarter and often in the last week of that month. Accordingly, delays in the closing of sales near the end of a quarter could cause quarterly revenues to fall substantially short of anticipated levels. Significant sales may also occur earlier than expected, which could cause operating results for later quarters to compare unfavorably with operating results from earlier quarters.
Future orders may come from new customers, or from existing customers for new products. The sales cycles may be greater than what we have experienced in the past, increasing the difficulty to predict quarterly revenues.
Because we sell primarily to large carriers and OEM customers, we have no direct relationship with most end-users of our products. This indirect relationship delays feedback and blurs signals of change in the quick-to-evolve wireless ecosystem, and is one of the reasons we have difficulty predicting demand.
A large portion of our operating expenses, including rent, depreciation and amortization, is fixed and difficult to reduce or change. Accordingly, if our total revenue does not meet our expectations, we may not be able to adjust our expenses quickly enough to compensate for the shortfall in revenue. In that event, our business, financial condition and results of operations would be materially and adversely affected.
Due to all of the foregoing factors, and the other risks discussed in this report, you should not rely on quarter-to-quarter comparisons of our operating results as an indication of future performance.
Technology and customer needs change rapidly in our market, which could render our products obsolete and negatively affect our business, financial condition and results of operations.
Our success depends on our ability to anticipate and adapt to changes in technology and industry standards. We will also need to continue to develop and introduce new and enhanced products to meet our target markets’ changing demands, keep up with evolving industry standards, including changes in the Microsoft, Google and Apple operating systems with which our products are designed to be compatible, and to promote those products successfully. The communications and utilities software markets in which we operate are characterized by rapid technological change, changing customer needs, frequent new product introductions, evolving industry standards and short product life cycles. In addition, the technology we market, which has been sold as software in the past, can be integrated at the chipset level by the leading mobile chipset manufacturers. Any of these factors could render our existing products obsolete and unmarketable. In addition, new products and product enhancements can require long development and testing periods as a result of the complexities inherent in today’s computing environments and the performance demanded by customers and called for by evolving wireless networking technologies. If our target markets do not develop as we anticipate, our products do not gain widespread acceptance in these markets, or we are unable to develop new versions of our software products that can operate on future wireless networks and PC and mobile device operating systems and interoperate with other popular applications, our business, financial condition and results of operations could be materially and adversely affected.
Competition within our target markets is intense and includes numerous established competitors and new entrants, which could negatively affect our revenues and results of operations.

13
We operate in markets that are extremely competitive and subject to rapid changes in technology. Because there are low barriers to entry into the software markets in which we participate and may participate in the future, we expect significant competition to continue from both established and emerging software companies in the future, both domestic and international. In fact, our growth opportunities in new product markets could be limited to the extent established and emerging software companies enter or have entered those markets. Furthermore, our existing and potential OEM customers may acquire or develop products that compete directly with our products.
Many of our other current and prospective competitors have significantly greater financial, marketing, service, support, technical and other resources than we do. As a result, they may be able to adapt more quickly than we can to new or emerging technologies and changes in customer requirements or to devote greater resources to the promotion and sale of their products. Announcements of competing products by competitors could result in the cancellation of orders by customers in anticipation of the introduction of such new products. In addition, some of our competitors are currently making complementary products that are sold separately. Such competitors could decide to enhance their competitive position by bundling their products to attract customers seeking integrated, cost-effective software applications. Some competitors have a retail emphasis and offer OEM products with a reduced set of features. The opportunity for retail upgrade sales may induce these and other competitors to make OEM products available at their own cost or even at a loss. We also expect competition to increase as a result of software industry consolidations, which may lead to the creation of additional large and well-financed competitors. Increased competition is likely to result in price reductions, fewer customer orders, reduced margins and loss of market share.
We are entering new, emerging markets in which we have limited experience; if these markets do not develop or we are unable to otherwise succeed in them, our revenues will suffer and the price of our common stock will likely decline.
Our recent and planned product introductions to support new higher speed networking and 4G technologies have allowed us to enter new markets. A viable market for these products may not develop or be sustainable, and we may face intense competition in these markets. In addition, our success in these markets depends on our carrier and MSO customers’ ability to successfully introduce new mobile services enabled by our products and our ability to broaden our carrier customer base, which we believe will be difficult and time-consuming. If the expected benefits from entering new markets do not materialize, our revenues will suffer and the price of our common stock would likely decline. In addition, to the extent we enter new markets through acquisitions of companies or technologies, our financial condition could be harmed or our stockholders could suffer dilution without a corresponding benefit to our company if we do not realize expected benefits of entering such new markets.
If the adoption of and investments in new technologies and services grows more slowly than anticipated in our product planning and development, our operating results, financial condition and prospects may be negatively affected.
If the adoption of and investments in new networking and 4G technologies and services does not grow or grows more slowly than anticipated, we will not obtain the anticipated returns from our planning and development investments. We have introduced new high-speed networking and 4G products, but the pace of the market introduction of such technologies is uncertain. Future sales and any future profits from these and related products are substantially dependent upon the acceptance and use of these new technologies, and on the continued adoption and use of mobile data services by end-users.
Many of our customers and other communications service providers have made and continue to make major investments in next generation networks that are intended to support more complex applications. If communications service providers delay their deployment of networks or fail to deploy such networks successfully, demand for our products could decline, which would adversely affect our revenues. Also, to the extent we devote substantial resources and incur significant expenses to enable our products to be interoperable with new networks that have failed or have been delayed or not deployed, our operating results, financial condition and prospects may be negatively affected.

14
If we are unable to retain key personnel, the loss of their services could materially and adversely affect our business, financial condition and results of operations.
Our future performance depends in significant part upon the continued service of our senior management and other key technical and consulting personnel. We do not have employment agreements with our key employees that govern the length of their service. The loss of the services of our key employees would materially and adversely affect our business, financial condition and results of operations. Our future success also depends on our ability to continue to attract, retain and motivate qualified personnel, particularly highly skilled engineers involved in the ongoing research and development required to develop and enhance our products. Competition for these employees remains high and employee retention is a common problem in our industry. Our inability to attract and retain the highly trained technical personnel that are essential to our product development, marketing, service and support teams may limit the rate at which we can generate revenue, develop new products or product enhancements and generally would have an adverse effect on our business, financial condition and results of operations.
We rely directly and indirectly on third-party intellectual property and licenses, which may not be available on commercially reasonable terms or at all.
Many of the Company’s products and services include third-party intellectual property, which requires licenses from those third parties directly to us or to unrelated companies which provide us with sublicenses and/or execution of services for the operation of our business. These products and services include our wireless suite of products as well as our productivity and graphics products. The Company has historically been able to obtain such licenses on reasonable terms. There is however no assurance that in the future the necessary licenses could be obtained on acceptable terms or at all. If the Company or our third party service providers are unable to obtain or renew critical licenses on reasonable terms, we may be forced to terminate or curtail our products and services which rely on such intellectual property and our financial condition and operating results may be materially adversely affected.
If we fail to continue to establish and maintain strategic relationships with mobile device manufacturers, wireless carriers and network infrastructure manufacturers, market acceptance of our products and our profitability may suffer.
Most of our strategic relationships with mobile device manufacturers are not subject to written contract, but rather are in the form of informal working relationships. We believe these relationships are valuable to our success. In particular, these relationships provide us with insights into product development and emerging technologies, which allows us to keep abreast of, or anticipate, market trends and helps us serve our current and prospective customers. Because these relationships are not typically governed by written agreements, there is no obligation for many of our partners to continue working with us. If we are unable to maintain our existing strategic relationships with mobile device manufacturers or if we fail to enter into additional strategic relationships or the parties with whom we have strategic relationships favor one of our competitors, our ability to provide products that meet our current and prospective customers’ needs could be compromised and our reputation and future revenue prospects could suffer. For example, if our software does not function well with a popular mobile device because we have not maintained a relationship with its manufacturer, carriers seeking to provide that device to their respective customers could choose a competitor’s software over ours or develop their own. Even if we succeed in establishing these relationships, they may not result in additional customers or revenues.
Our growth depends in part on our customers’ ability and willingness to promote services and attract and retain new customers or achieve other goals outside of our control.
We sell our products for use on handheld devices primarily through our carrier customers. Losing the support of these customers may limit our ability to compete in existing and potential markets and could negatively affect our revenues. In addition, the success of these customers and their ability and willingness to market services supported by our products is critical to our future success. Our ability to generate revenues from sales of our software is also constrained by our carrier customers’ ability to attract and retain customers. We
15
have no input into or influence upon their marketing efforts and sales and customer retention activities. If our large carrier customers fail to maintain or grow demand for their services, revenues or revenue growth from our products designed for use on mobile devices will decline and our results of operations will suffer.
Acquisitions of companies or technologies may disrupt our business and divert management attention and cause our current operations to suffer.
We have historically made targeted acquisitions of smaller companies with important technology and expect to continue to do so in the future. As part of any acquisition, we will be required to assimilate the operations, products and personnel of the acquired businesses and train, retain and motivate key personnel from the acquired businesses. We may not be able to maintain uniform standards, controls, procedures and policies if we fail in these efforts. Similarly, acquisitions may cause disruptions in our operations and divert management’s attention from our company’s day-to-day operations, which could impair our relationships with our current employees, customers and strategic partners. Acquisitions may also subject us to liabilities and risks that are not known or identifiable at the time of the acquisition.
We may also have to incur debt or issue equity securities in order to finance future acquisitions. Our financial condition could be harmed to the extent we incur substantial debt or use significant amounts of our cash resources in acquisitions. The issuance of equity securities for any acquisition could be substantially dilutive to our existing stockholders. In addition, we expect our profitability could be adversely affected because of acquisition-related accounting costs, write offs, amortization expenses, and charges related to acquired intangible assets. In consummating acquisitions, we are also subject to risks of entering geographic and business markets in which we have had limited or no prior experience. If we are unable to fully integrate acquired businesses, products or technologies within existing operations, we may not receive the intended benefits of acquisitions.
Our operating income or loss may continue to change due to shifts in our sales mix and increased spending on our research and development.
Our operating income or loss can change quarter to quarter and year to year due to a change in our sales mix and the timing of our continued investments in research and development and infrastructure. We continue to invest in research and development which is the lifeline of our technology portfolio. The timing of these additional expenses can vary significantly quarter to quarter and even from year to year. Our products may contain undetected software defects, which could negatively affect our revenues.
Our software products are complex and may contain undetected defects. In the past, we have discovered software defects in certain of our products and have experienced delayed or lost revenues during the period it took to correct these problems. Although we and our OEM customers test our products, it is possible that errors may be found or occur in our new or existing products after we have commenced commercial shipment of those products. Defects, whether actual or perceived, could result in adverse publicity, loss of revenues, product returns, a delay in market acceptance of our products, loss of competitive position or claims against us by customers. Any such problems could be costly to remedy and could cause interruptions, delays, or cessation of our product sales, which could cause us to lose existing or prospective customers and could negatively affect our results of operations. In addition, some of our software contains open source components that are licensed under the GNU General Public License and similar open source licenses. These components may contain undetected defects or incompatibilities, may cause us to lose control over the development of portions of our software code, and may expose us to claims of infringement if these components are, or incorporate, infringing materials, the licenses are not enforceable or are modified to become incompatible with other open source licenses, or exposure to misappropriation claims if these components include unauthorized materials from a third party.
Regulations affecting our customers and us and future regulations, to which they or we may become subject to, may harm our business.

16
Certain of our customers in the communications industry are subject to regulation by the Federal Communications Commission, which could have an indirect effect on our business. In addition, the United States telecommunications industry has been subject to continuing deregulation since 1984. We cannot predict when, or upon what terms and conditions, further regulation or deregulation might occur or the effect regulation or deregulation may have on demand for our products from customers in the communications industry. Demand for our products may be indirectly affected by regulations imposed upon potential users of those products, which may increase our costs and expenses.
We may be unable to adequately protect our intellectual property and other proprietary rights, which could negatively impact our revenues.
Our success is dependent upon our software code base, our programming methodologies and other intellectual properties and proprietary rights. In order to protect our proprietary technology, we rely on a combination of trade secrets, nondisclosure agreements, patents, and copyright and trademark law. We currently own U.S. trademark registrations for certain of our trademarks and U.S. patents for certain of our technologies. However, these measures afford us only limited protection. Furthermore, we rely primarily on “shrink wrap” licenses that are not signed by the end user and, therefore, may be unenforceable under the laws of certain jurisdictions. Accordingly, it is possible that third parties may copy or otherwise obtain our rights without our authorization. It is also possible that third parties may independently develop technologies similar to ours. It may be difficult for us to detect unauthorized use of our intellectual property and proprietary rights.
We may be subject to claims of intellectual property infringement as the number of trademarks, patents, copyrights and other intellectual property rights asserted by companies in our industry grows and the coverage of these patents and other rights and the functionality of software products increasingly overlap. From time to time, we have received communications from third parties asserting that our trade name or features, content, or trademarks of certain of our products infringe upon intellectual property rights held by such third parties. We have also received correspondence from third parties separately asserting that our products may infringe on certain patents held by each of the parties. Although we are not aware that any of our products infringe on the proprietary rights of others, third parties may claim infringement by us with respect to our current or future products. Additionally, our customer agreements require that we indemnify our customers for infringement claims made by third parties involving our intellectual property embedded in their products. Infringement claims, whether with or without merit, could result in time-consuming and costly litigation, divert the attention of our management, cause product shipment delays or require us to enter into royalty or licensing agreements with third parties. If we are required to enter into royalty or licensing agreements, they may not be on terms that are acceptable to us. Unfavorable royalty or licensing agreements could seriously impair our ability to market our products.
We may raise additional capital through the issuance of additional equity or convertible debt securities or by borrowing money, in order to meet our capital needs. Additional funds may not be available on terms acceptable to us to allow us to meet our capital needs.
We believe that the cash and cash equivalents and short-term investments on hand and the cash we expect to generate from operations will be sufficient to meet our capital needs for at least the next twelve months. However, it is possible that we may need or choose to obtain additional financing to fund our activities in the future. We could raise these funds by selling more stock to the public or to selected investors, or by borrowing money. We may not be able to obtain additional funds on favorable terms, or at all. If adequate funds are not available, we may be required to curtail our operations or other business activities significantly or to obtain funds through arrangements with strategic partners or others that may require us to relinquish rights to certain technologies or potential markets.
In addition, we may file with the SEC a shelf registration statement to sell from time to time additional shares of our common stock in one or more offerings in amounts, at prices and on the terms that we will determine at the time of offering. If we raise additional funds by issuing additional equity or convertible debt securities (whether in a public offering or private placement), the ownership percentages of existing stockholders would be reduced. In addition, the equity or debt securities that we issue may have rights, preferences or privileges

17
senior to those of the holders of our common stock. We currently have no established line of credit or other business borrowing facility in place.
It is possible that our future capital requirements may vary materially from those now planned. The amount of capital that we will need in the future will depend on many factors, including:
• the market acceptance of our products;
• the levels of promotion and advertising that will be required to launch our products and achieve and maintain a competitive position in the marketplace;
• our business, product, capital expenditure and research and development plans and product and technology roadmaps;
• the levels of working capital that we maintain;
• capital improvements to new and existing facilities;
• our ability to meet our headcount hiring commitment to the state of Pennsylvania;
• technological advances;
• our competitors’ response to our products; and
• our relationships with suppliers and customers.
In addition, we may raise additional capital to accommodate planned growth, hiring and infrastructure needs or to consummate acquisitions of other businesses, products or technologies. Our business, financial condition and operating results could be adversely affected as a result of legal, business and economic risks specific to international operations.
In recent years, our revenues derived from sales to customers outside the U.S. have not been material. Our revenues derived from such sales can vary from quarter to quarter and from year to year. We also frequently ship products to our domestic customers’ international manufacturing divisions and subcontractors. In the future, we may expand these international business activities. International operations are subject to many inherent risks, including:
• general political, social and economic instability;
• trade restrictions;
• the imposition of governmental controls;
• exposure to different legal standards, particularly with respect to intellectual property;
• burdens of complying with a variety of foreign laws;
• import and export license requirements and restrictions of the United States and any other country in which we operate;
• unexpected changes in regulatory requirements;
• foreign technical standards;
• changes in tariffs;
• difficulties in staffing and managing international operations;
• difficulties in securing and servicing international customers;
• difficulties in collecting receivables from foreign entities;
• fluctuations in currency exchange rates and any imposition of currency exchange controls; and
• potentially adverse tax consequences.
18
These conditions may increase our cost of doing business. Moreover, as our customers are adversely affected by these conditions, our business with them may be disrupted and our results of operations could be adversely affected.
Security and privacy breaches may harm our business.
The uninterrupted operation of our hosted solutions and the confidentiality and security of third-party information is critical to our business. Any failures in our security and privacy measures, such as “hacking” of our systems by outsiders, could have a material adverse effect on our financial position and results of operations. If we are unable to protect, or our customers perceive that we are unable to protect, the security and privacy of our electronic information, our growth could be materially adversely affected. A security or privacy breach may:
• cause our customers to lose confidence in our solutions;
• harm our reputation;
• expose us to liability; and
• increase our expense from potential remediation costs.
While we believe we use proven applications designed for data security and integrity to process electronic transactions, there can be no assurance that our use of these applications will be sufficient to address changing market conditions or the security and privacy concerns of existing and potential customers. In addition, our customers and end users may use our products and services in a manner which violates security or data privacy laws in one or more jurisdictions. Any significant or high profile data privacy breaches or violations of data privacy laws, whether directly through our hosted solutions or by third parties using our products and services, could result in the loss of business and reputation, litigation against us and regulatory investigations and penalties that could adversely affect our operating results and financial condition.
Interruptions or delays in service from data center hosting facilities could impair the delivery of our service and harm our business.
We currently serve our customers from data center hosting facilities. Any damage to, or failure of, our systems generally could result in interruptions in our service. Interruptions in our service may reduce our revenue, cause us to issue credits or pay penalties, cause customers to terminate their on-demand services and adversely affect our renewal rates and our ability to attract new customers. We may have exposure to additional tax liabilities.
As a multinational corporation, we are subject to income taxes as well as sales, use and other non-income based taxes, in both the United States and various foreign jurisdictions. Significant judgment is required in determining our worldwide provision for income taxes, sales and use taxes, and other tax liabilities. Changes in tax laws or tax rulings may have a significantly adverse impact on our effective tax rate.
We are also subject to non-income based taxes, such as payroll, sales, use, value-added, net worth, property and goods and services taxes, in both the United States and various foreign jurisdictions. We are regularly under audit by tax authorities with respect to these non-income based taxes and may have exposure to additional non-income based tax liabilities. An increasing number of states have considered or adopted laws that attempt to impose obligations on out-of-state retailers to collect sales and use taxes on their behalf. A successful assertion by one or more states or foreign countries requiring us to collect sales and use taxes where we do not do so could result in substantial tax liabilities, including for past sales, as well as penalties and interest.
Although we believe that our income and non-income based tax estimates are reasonable, there is no assurance that our provisions for taxes are correct, or that the final determination of tax audits or tax disputes will not be different from what is reflected in our historical income tax provisions and accruals. If we are required to pay substantially more taxes in the future or for prior periods, our operating results and financial
19
condition could be adversely affected
None.
Our corporate headquarters, including our principal administrative, sales and marketing, customer support and research and development facility, is located in Aliso Viejo, California, where we currently lease and occupy approximately 33,600 square feet of space pursuant to lease that expires on May 31, 2016. We lease approximately 55,600 square feet in Pittsburgh, Pennsylvania under a lease that expires December 31, 2021. We lease approximately 16,000 square feet in Sunnyvale, California under a lease that expires February 28, 2015. Internationally, we lease space in Belgrade, Serbia that expires December 30, 2016.
We lease an additional 19,100 square feet in Aliso Viejo, California under a lease that expires January 31, 2022. In August 2014, we signed an addendum to sublease all of the space commencing on September 15, 2014 for a three year period, with two, two-year renewal options. The remaining lease expense, net of sublease income, has been accrued for in our 2013 restructuring liability account.
We lease approximately 15,300 square feet in Watsonville, California under a lease that expires September 30, 2018. In March 2014, we signed an addendum to sublease all of the space commencing on May 1, 2014. We continued to pay our current monthly rent through June 30, 2014. Beginning on July 1, 2014, we are paying the landlord a minimum amount of rent, with annual escalations, through the end of the lease. This lease expense has been accrued for in our 2013 restructuring liability account. We have moved into a significantly smaller facility in Santa Cruz, California and are paying month-to-month rent.
The Company may become involved in various legal proceedings arising from its business activities. While management does not believe the ultimate disposition of these matters will have a material adverse impact on the Company’s consolidated results of operations, cash flows or financial position, litigation is inherently unpredictable, and depending on the nature and timing of these proceedings, an unfavorable resolution could materially affect the Company’s future consolidated results of operations, cash flows or financial position in a particular period.
Not Applicable.

20
Our common stock is traded on the NASDAQ Global Market under the symbol “SMSI.” The high and low sale prices for our common stock as reported by NASDAQ are set forth below for the periods indicated.
High Low
YEAR ENDED DECEMBER 31, 2014:First Quarter $2.69 $1.44Second Quarter 2.07 0.66 Third Quarter 1.37 0.88 Fourth Quarter 1.23 0.74
YEAR ENDED DECEMBER 31, 2013:First Quarter $1.78 $1.26Second Quarter 1.49 1.06 Third Quarter 1.31 0.88 Fourth Quarter 1.57 0.79
On February 20, 2015, the closing sale price for our common stock as reported by NASDAQ was $1.46.
For information regarding Securities Authorized for Issuance under Equity Compensation Plans, please refer to Item 12.
The following graph and information compares the cumulative total stockholder return on our common stock against the cumulative total return of the S&P Midcap 400 Index and the S&P Midcap Applications Software Index (Peer Group) for the same period.
The graph covers the period from December 31, 2009 through December 31, 2014. The graph assumes that $100 was invested in our common stock on December 31, 2009, and in each index, and that all dividends were reinvested. No cash dividends have been declared on our common stock. Stockholder returns over the indicated period should not be considered indicative of future stockholder returns.

21
12/09 12/10 12/11 12/12 12/13 12/14
Smith Micro Software, Inc.
100.00 172.02 12.35 16.39 16.17 10.60
S&P Midcap 400 100.00 126.64 124.45 146.69 195.84 214.97
S&P MidCap Application Software
100.00 132.83 139.38 167.35 220.04 227.94
As of February 20, 2015, there were approximately 181 holders of record of our common stock based on information provided by our transfer agent.
$0
$50
$100
$150
$200
$250
12/09 12/10 12/11 12/12 12/13 12/14
COMPARISON OF 5 YEAR CUMULATIVE TOTAL RETURN*Among Smith Micro Software, Inc., the S&P Midcap 400 Index, and S&P MidCap Application
Software
Smith Micro Software, Inc. S&P Midcap 400 S&P MidCap Application Software
*$100 invested on 12/31/09 in stock or index, including reinvestment of dividends.Fiscal year ending December 31.
Copyright© 2015 S&P, a division of The McGraw-Hill Companies Inc. All rights reserved.
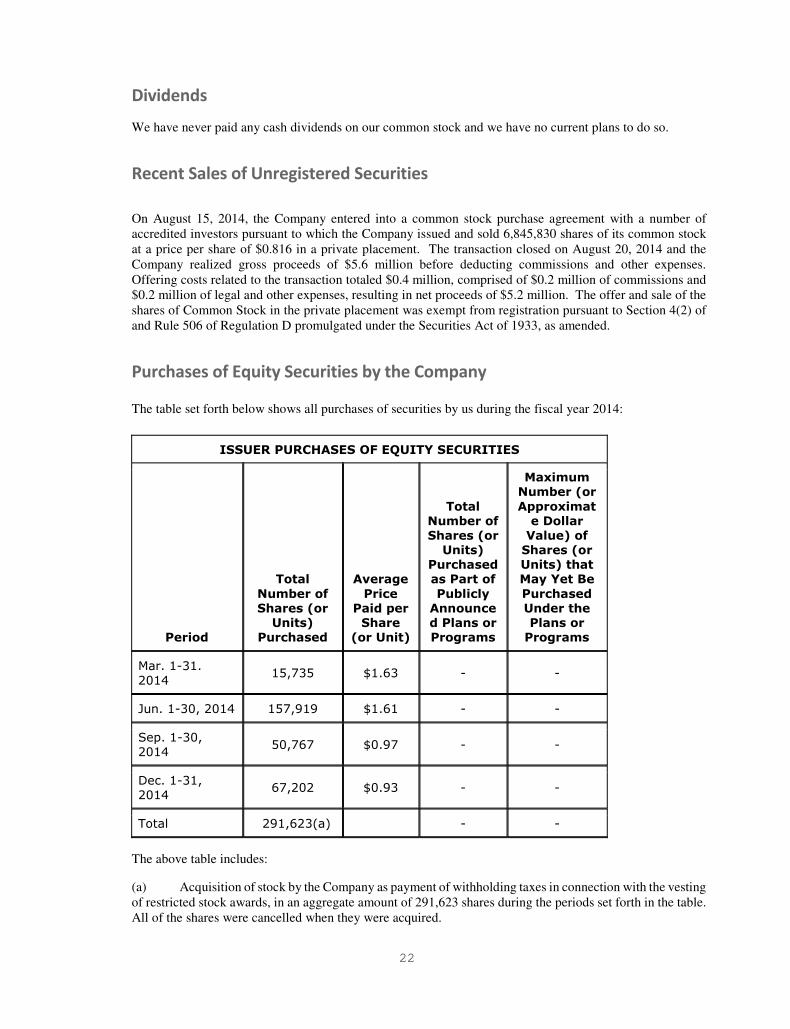
22
We have never paid any cash dividends on our common stock and we have no current plans to do so.
On August 15, 2014, the Company entered into a common stock purchase agreement with a number of accredited investors pursuant to which the Company issued and sold 6,845,830 shares of its common stock at a price per share of $0.816 in a private placement. The transaction closed on August 20, 2014 and the Company realized gross proceeds of $5.6 million before deducting commissions and other expenses. Offering costs related to the transaction totaled $0.4 million, comprised of $0.2 million of commissions and $0.2 million of legal and other expenses, resulting in net proceeds of $5.2 million. The offer and sale of the shares of Common Stock in the private placement was exempt from registration pursuant to Section 4(2) of and Rule 506 of Regulation D promulgated under the Securities Act of 1933, as amended.
The table set forth below shows all purchases of securities by us during the fiscal year 2014:
The above table includes:
(a) Acquisition of stock by the Company as payment of withholding taxes in connection with the vesting of restricted stock awards, in an aggregate amount of 291,623 shares during the periods set forth in the table. All of the shares were cancelled when they were acquired.

23
The following selected consolidated financial data should be read in conjunction with “Management’s Discussion and Analysis of Financial Condition and Results of Operations” and our consolidated financial statements and the related notes thereto appearing elsewhere in this Annual Report. The following selected consolidated statement of comprehensive income (loss) data for the years ended December 31, 2014, 2013 and 2012, and the consolidated balance sheet data at December 31, 2014 and 2013, have been derived from audited consolidated financial statements included elsewhere in this Annual Report. The consolidated statement of comprehensive income (loss) data presented below for the years ended December 31, 2011 and 2010, and the consolidated balance sheet data at December 31, 2012, 2011 and 2010 are derived from audited consolidated financial statements that are not included in this Annual Report.
2014 2013 2012 2011 2010Consolidated Statement of Comprehensive Income (Loss) Data (in thousands, except per share data):Revenues 36,979$ 42,675$ 43,329$ 57,767$ 130,501$
Cost of revenues 9,317 9,707 8,448 13,761 15,507 Gross profit 27,662 32,968 34,881 44,006 114,994 Operating expenses: Selling and marketing 9,559 15,675 16,666 26,594 29,708 Research and development 14,192 21,305 24,767 41,711 42,759 General and administrative 13,218 18,216 20,211 25,279 24,146 Restructuring expenses 2,435 5,602 238 3,184 - Goodwill and long-lived asset impairment - - - 112,904 - Total operating expenses 39,404 60,798 61,882 209,672 96,613 Operating income (loss) (11,742) (27,830) (27,001) (165,666) 18,381 Non-operating income: Change in fair value of contingent liabiltiy - - 1,210 - - Interest and other income (expense), net (8) 30 94 131 130 Income (loss) before provision for income taxes (11,750) (27,800) (25,697) (165,535) 18,511 Provision for income tax expense (benefit) 49 153 (234) (5,929) 6,165 Net income (loss) (11,799) (27,953) (25,463) (159,606) 12,346
Other comprehensive income (loss), before tax:
Unrealized holding gains (losses) on available-
for-sale securities - 7 33 (24) (14)
Income tax expense (benefit) related to items
of other comprehensive income (expense) - - 6 1 (6)
Other comprehensive income (expense), net of tax - 7 27 (25) (8)
Comprehensive income (loss) (11,799)$ (27,946)$ (25,436)$ (159,631)$ 12,338$
Net income (loss) per share:
Basic (0.29)$ (0.76)$ (0.71)$ (4.48)$ 0.36$
Diluted (0.29)$ (0.76)$ (0.71)$ (4.48)$ 0.36$
Weighted average shares: Basic 40,649 36,982 35,849 35,617 34,204
Diluted 40,649 36,982 35,849 35,617 34,615
Year Ended December 31,

24
2014 2013 2012 2011 2010Consolidated Balance Sheet Data (in thousands):Total assets 27,390$ 31,538$ 54,395$ 79,941$ 234,892$ Total liabilities 12,488 13,367 11,733 15,081 16,627 Accumulated comprehensive (deficit) earnings (208,284) (196,485) (168,539) (143,103) 16,528 Total stockholders' equity 14,902$ 18,171$ 42,662$ 64,860$ 218,265$
As of December 31,
The following discussion of our financial condition and results of operations should be read in conjunction with our consolidated financial statements and the related notes and other financial information appearing elsewhere in this Annual Report. Readers are also urged to carefully review and consider the various disclosures made by us which attempt to advise interested parties of the factors which affect our business, including without limitation the disclosures made in Item 1A of Part I of this Annual Report under the caption “Risk Factors.” Risk factors that could cause actual results to differ from those contained in the forward-looking statements include but are not limited to: our dependence upon the large carrier customers for a significant portion of our revenues; deriving revenues from a small number of customers and products; being delisted from the NASDAQ; changes in demand for our products; our failure to successfully compete; changes in technology; our entry into new markets; failure of our customers to adopt new technologies; loss of key personnel; the availability of third party intellectual property and licenses; failure to maintain strategic relationships with our customers; potential fluctuations in quarterly results; our failure to protect intellectual property; exposure to intellectual property claims; our inability to raise more funds to meet our capital needs; undetected software defects; security and privacy breaches in our systems or interruptions or delays in the services we provide which could damage client relations; and doing business internationally.
Smith Micro provides software solutions to simplify and enhance the mobile experience. As a leader in wireless connectivity, our applications ensure the best Quality of Experience for mobile users while optimizing networks for wireless service providers and enterprises. Using our intelligent policy-on-device platform, along with premium voice, video and content monetization services, we create new opportunities to engage consumers and capitalize on the growth of connected devices. In addition to wireless and mobility software, Smith Micro develops and distributes personal, professional and educational productivity and graphics products and tools for consumers, artists, animators and designers worldwide.
Over the past three decades, the Company has developed deep expertise in embedded software for networked devices, policy-based management platforms, and highly-scalable mobile applications and hosted services. For organizations struggling to reduce costs and complexity in the fragmented, rapidly evolving mobile market, Smith Micro offers proven solutions that increase reliability and efficiency while accelerating delivery and value of mobile services to consumers.
For the year ended December 31, 2014, revenues to one customer and their respective affiliates in the Wireless business segment accounted for 68.0% of the Company’s total revenues, and one customer in the Productivity & Graphics business segment accounted for 11.2% of the Company’s total revenues. These two customers accounted for 87% of accounts receivable for the year ended December 31, 2014. For the year ended December 31, 2013, revenues to two customers and their respective affiliates in the Wireless business segment accounted for 53.1% and 13.0% of the Company’s total revenues, and one customer in the Productivity & Graphics business segment accounted for 11.4% of the Company’s total revenues. These three customers accounted for 83% of accounts receivable for the year ended December 31, 2013. For the
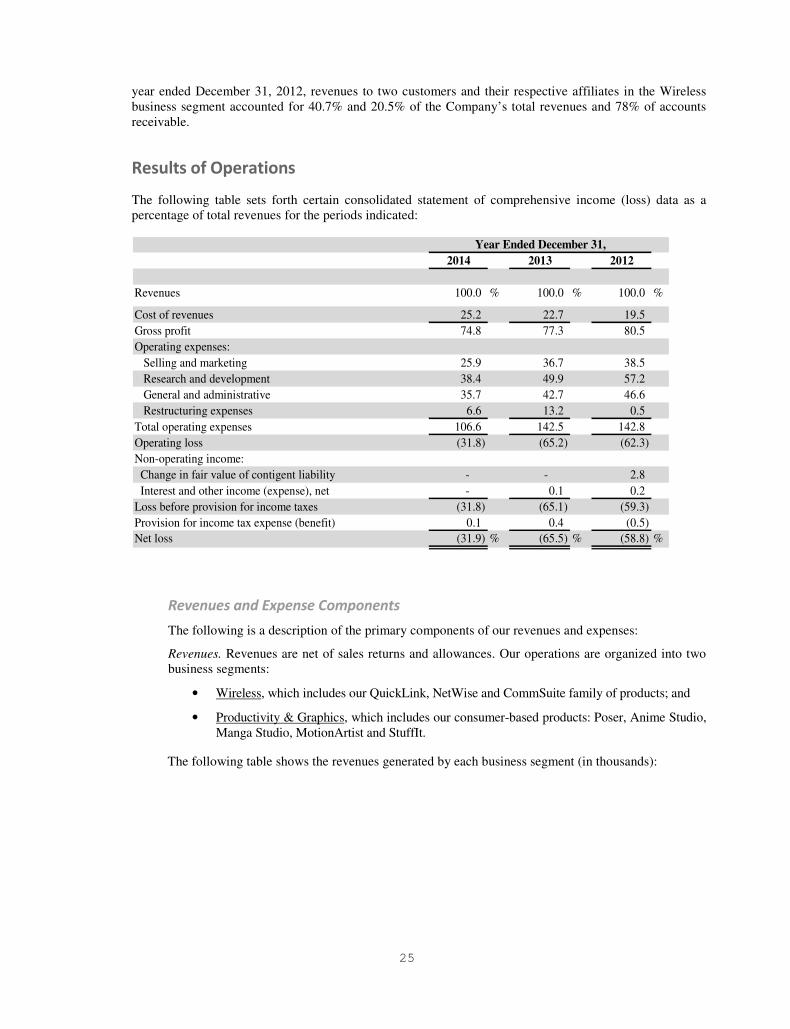
25
year ended December 31, 2012, revenues to two customers and their respective affiliates in the Wireless business segment accounted for 40.7% and 20.5% of the Company’s total revenues and 78% of accounts receivable.
The following table sets forth certain consolidated statement of comprehensive income (loss) data as a percentage of total revenues for the periods indicated:
2014 2013 2012
Revenues 100.0 % 100.0 % 100.0 %
Cost of revenues 25.2 22.7 19.5Gross profit 74.8 77.3 80.5Operating expenses: Selling and marketing 25.9 36.7 38.5 Research and development 38.4 49.9 57.2 General and administrative 35.7 42.7 46.6 Restructuring expenses 6.6 13.2 0.5Total operating expenses 106.6 142.5 142.8Operating loss (31.8) (65.2) (62.3)Non-operating income: Change in fair value of contigent liability - - 2.8 Interest and other income (expense), net - 0.1 0.2Loss before provision for income taxes (31.8) (65.1) (59.3)Provision for income tax expense (benefit) 0.1 0.4 (0.5)Net loss (31.9) % (65.5) % (58.8) %
Year Ended December 31,
The following is a description of the primary components of our revenues and expenses:
Revenues. Revenues are net of sales returns and allowances. Our operations are organized into two business segments:
• Wireless, which includes our QuickLink, NetWise and CommSuite family of products; and
• Productivity & Graphics, which includes our consumer-based products: Poser, Anime Studio, Manga Studio, MotionArtist and StuffIt.
The following table shows the revenues generated by each business segment (in thousands):

26
2012
Wireless 31,276$ 35,853$ 37,154$
Productivity & Graphics 5,703 6,822 6,175
Total revenues 36,979 42,675 43,329 Cost of revenues 9,317 9,707 8,448 Gross profit 27,662$ 32,968$ 34,881$
2014 2013Year Ended December 31,
Cost of revenues. Cost of revenues consists of direct product and assembly, maintenance, and royalty costs.
Selling and marketing. Selling and marketing expenses consist primarily of personnel costs, advertising costs, sales commissions, and trade show expenses. These expenses vary significantly from quarter to quarter based on the timing of trade shows and product introductions.
Research and development. Research and development expenses consist primarily of personnel and equipment costs required to conduct our software development efforts.
General and administrative. General and administrative expenses consist primarily of personnel costs, professional services and fees paid for external service providers, space and occupancy costs, and legal and other public company costs.
Restructuring expenses. Restructuring expenses consist primarily of one-time employee termination benefits, lease and other contract terminations and costs to consolidate facilities and relocate employees.
Change in fair value of contingent liability. This is the return-to-profit of a milestone payment accrual that we did not have to pay.
Interest and other income (expense), net. Interest and other income are primarily related to our average cash and short term investment balances during the period and vary among periods. Our other excess cash is invested in short term marketable equity and debt securities classified as cash equivalents. Interest and other expense are primarily related to the credit-adjusted risk-free interest rate used to measure our operating lease termination liabilities in restructuring.
Provision for income tax expense (benefit). The Company accounts for income taxes as required by Financial Accounting Standards Board (“FASB”) Accounting Standards Codification (“ASC”) Topic No. 740, Income Taxes. This statement requires the recognition of deferred tax assets and liabilities for the future consequences of events that have been recognized in the Company’s financial statements or tax returns. Measurement of the deferred items is based on enacted tax laws. In the event the future consequences of differences between financial reporting bases and tax bases of the Company’s assets and liabilities result in a deferred tax asset, we are required to evaluate the probability of being able to realize the future benefits indicated by such asset. The deferred tax assets are reduced by a valuation allowance if, based upon all available evidence, it is more likely than not that some or all of the deferred tax assets will not be realized. Establishing, reducing or increasing a valuation allowance in an accounting period generally results in an increase or decrease in tax expense in the statement of operations. We must make significant judgments to determine the provision for income taxes, deferred tax assets and liabilities, unrecognized tax benefits and any valuation allowance to be recorded against deferred tax assets. Because of our loss position, the current provision for income tax expense consists of state income tax minimums, foreign tax withholdings and foreign income taxes. After consideration of the Company’s continuing cumulative loss position as of December 31, 2014, the Company retained a valuation allowance related to its U.S.-based deferred tax assets of $75.7 million at December 31, 2014. During fiscal years 2014, 2013 and 2012, the valuation allowance on deferred tax assets increased by $3.2 million, $12.1 million and $7.2 million, respectively.
27
Revenues. Revenues of $37.0 million for fiscal year 2014 decreased $5.7 million, or 13.3%, from $42.7 million for fiscal year 2013. Wireless revenues of $31.3 million decreased $4.6 million, or 12.8%, primarily due to lower sales of our legacy connection manager products of $7.6 million partially offset by higher sales of our CommSuite products of $3.0 million. Productivity & Graphics sales decreased $1.1 million, or 16.4%, primarily due to lower customer demand and fewer new releases this year as we shift our future focus from consumers to new professional markets such as gaming and industrial design. While we have launched new wireless products, they are new to the market and their rate of adoption and deployment is unknown at this time, causing material uncertainty regarding the timing of our future wireless revenues.
Cost of revenues. Cost of revenues of $9.3 million for fiscal year 2014 decreased $0.4 million, or 4.0%, from $9.7 million for fiscal year 2013. Cost reduction savings as a result of our restructuring of $1.2 million was partially offset by increased royalties of $0.4 million due to product mix and $0.4 million of maintenance costs associated with new product releases.
Gross profit. Gross profit of $27.7 million or 74.8% of revenues for fiscal year 2014 decreased $5.3 million, or 16.1%, from $33.0 million, or 77.3% of revenues for fiscal year 2013. The 2.5 percentage point decrease was primarily due to the lower revenues.
Selling and marketing. Selling and marketing expenses of $9.6 million for fiscal year 2014 decreased $6.1 million, or 39.0%, from $15.7 million for fiscal year 2013. This decrease was primarily due cost reduction savings as a result of our restructuring; headcount reductions of $4.4 million and travel and other cost reductions of $1.2 million. Stock-based compensation decreased from $0.8 million to $0.3 million, or $0.5 million.
Research and development. Research and development expenses of $14.2 million for fiscal year 2014 decreased $7.1 million, or 33.4%, from $21.3 million for fiscal year 2013. Lower headcount accounted for the decrease of $6.9 million primarily due to our restructuring. Stock-based compensation decreased from $0.9 million to $0.7 million, or $0.2 million.
General and administrative. General and administrative expenses of $13.2 million for fiscal year 2014 decreased $5.0 million, or 27.4%, from $18.2 million for fiscal year 2013. This decrease was primarily due to lower space and occupancy costs as a result of our restructuring of $1.7 million, headcount and other cost reductions as a result of our restructuring of $1.3 million, lower depreciation of $1.0 million, and lower legal and accounting fees of $0.4 million. Stock-based compensation expense decreased from $2.1 million to $1.5 million, or $0.6 million.
Restructuring expenses. Restructuring expense was $2.4 million for fiscal year 2014 due to one-time employee terminations of $1.3 million of non-cash stock-based compensation and $0.4 million of severance costs, $0.6 million for lease terminations, and $0.1 million of other related expenses. Restructuring expenses were $5.6 million for fiscal year 2013. These charges were for lease/rental terminations of $3.2 million, severance costs for affected employees of $1.2 million, fixed asset write-offs as a result of our lease/rental terminations of $1.0 million and other related costs of $0.2 million.
Interest and other income (expense), net. Interest and other income (expense), net was de minimis for both fiscal years 2014 and 2013.
Provision for income tax expense (benefit). We recorded income tax expense of $49,000 and $153,000 for fiscal years 2014 and 2013, respectively, primarily related to foreign income taxes.
Revenues. Revenues of $42.7 million for fiscal year 2013 decreased $0.6 million, or 1.5%, from $43.3 million for fiscal year 2012. Wireless revenues of $35.9 million decreased $1.3 million, or 3.5%, primarily due to lower sales of our legacy connection manager products of $5.2 million partially offset by higher sales of our CommSuite products of $3.2 million and NetWise products of $0.7 million.
28
Productivity & Graphics sales increased $0.7 million, or 10.5%, primarily due to increases in our core product lines of Poser and Manga Studio. Due to the introduction and market acceptance of mobile hotspot devices, tablets and smartphones capable of functioning as a WWAN hotspot, our legacy connection management products continue to experience lower demand in our North American marketplace. While we have launched new wireless products that address this technology shift, they are new to the market and their rate of adoption and deployment is unknown at this time, causing material uncertainty regarding the timing of our future wireless revenues.
Cost of revenues. Cost of revenues of $9.7 million for fiscal year 2013 increased $1.3 million, or 14.9%, from $8.4 million for fiscal year 2012. The increase was primarily due to the product mix in Wireless of $1.1 million and product mix in Productivity & Graphics of $0.2 million.
Gross profit. Gross profit of $33.0 million or 77.3% of revenues for fiscal year 2013 decreased $1.9 million, or 5.5%, from $34.9 million, or 80.5% of revenues for fiscal year 2012. The 3.2 percentage point decrease was primarily due to the lower revenues and product mix.
Selling and marketing. Selling and marketing expenses of $15.7 million for fiscal year 2013 decreased $1.0 million, or 5.9%, from $16.7 million for fiscal year 2012. This decrease was primarily due to lower personnel related expenses and severance of $0.4 million and lower travel and trade shows of $0.5 million. Stock-based compensation decreased from $0.9 million to $0.8 million, or $0.1 million.
Research and development. Research and development expenses of $21.3 million for fiscal year 2013 decreased $3.5 million, or 14.0%, from $24.8 million for fiscal year 2012. This decrease was primarily due to lower headcount. Stock-based compensation increased from $0.8 million to $0.9 million, or $0.1 million due to stock options being issued to many of the engineers late in fiscal year 2012.
General and administrative. General and administrative expenses of $18.2 million for fiscal year 2013 decreased $2.0 million, or 9.9%, from $20.2 million for fiscal year 2012. This decrease was primarily due to lower space and occupancy costs as a result of our restructuring of $1.3 million and lower legal and accounting fees of $0.6 million partially offset by increased travel and other expenses of $0.2 million. Stock-based compensation expense decreased from $2.4 million to $2.1 million, or $0.3 million.
Restructuring expenses. Restructuring expenses of $5.6 million for fiscal year 2013 were related to lease/rental terminations of $3.3 million, severance costs for affected employees of $1.1 million, equipment and improvements write-offs as a result of our lease/rental terminations of $1.0 million and other related costs of $0.2 million. Restructuring expenses of $0.2 million for fiscal year 2012 were related to one-time employee termination and other costs as a result of headcount reductions.
Change in fair value of contingent liability. When we acquired Core Mobility in October 2009, we established a pre-acquisition contingency made up of two milestone payments that were part of the purchase price of the business. The first milestone was met and $0.6 million was paid in March 2010. The second milestone was not met and therefore not paid. The Core Mobility shareholders disputed the second milestone in a lawsuit which was found in our favor in August 2012. The plaintiffs chose not to appeal the decision. As a result, we reduced the contingent liability of $1.2 million to its fair value of $0 at December 31, 2012.
Interest and other income, net. Interest and other income, net was de minimis for fiscal year 2013 and $0.1 million for fiscal year 2012.
Provision for income tax expense (benefit). We recorded income tax expense of $0.2 million for fiscal year 2013 primarily related to foreign income taxes. We recorded an income tax benefit of $0.2 million for fiscal year 2012 related to state R&D tax credits of $0.7 million, partially offset by state and foreign income taxes of $0.5 million.

29
At December 31, 2014, we had $13.0 million in cash and cash equivalents and short-term investments and $14.0 million of working capital. Capital expenditures were $0.2 million for the fiscal year 2014 versus $0.8 million for the fiscal year 2013. The 2014 expenditures were primarily for computer hardware and software.
In August 2014, the Company entered into a common stock purchase agreement (see Note 9) with a number of accredited investors in a private placement pursuant to which the Company agreed to issue and sell to the investors an aggregate of 6,845,830 shares of its common stock at a price per share of $0.816. The transaction closed on August 20, 2014 and the Company realized gross proceeds of $5.6 million before deducting commissions and other expenses of $0.4 million.
In May 2014, the Board approved a restructuring plan (see Note 2) that was implemented during the fiscal quarter ended June 30, 2014 which lowered our overall cost structure by approximately $2.0 million per quarter.
Based on the Company’s current financial revenue and profit projections, our reduced cost structure as a result of our 2014 restructuring mentioned above, and the proceeds from the sale of our common stock in a private placement mentioned above, management believes that the Company’s existing cash, cash equivalents and short-term investment will be sufficient to fund the its operations through at least the next twelve months.
In 2014, net cash used in operations was $6.8 million primarily due to our net loss adjusted for depreciation, amortization, non-cash stock-based compensation, inventory and accounts receivable reserves of $4.7 million, decreases in accounts payable and accrued expenses of $2.2 million, and an increase in accounts receivable of $1.0 million. This usage was partially offset by an increase in deferred revenue of $1.0 million and a decrease in prepaid expenses of $0.1 million.
In 2013, net cash used in operations was $16.6 million primarily due to our net loss adjusted for depreciation, amortization, write-off of fixed assets related to our restructuring, non-cash stock-based compensation, inventory and accounts receivable reserves, and other assets of $18.7 million. This usage was partially offset by an increase in accounts payable and accrued liabilities of $1.4 million and a decrease in accounts receivable of $0.7 million.
In 2012, net cash used in operations was $12.8 million primarily due to our net loss adjusted for depreciation, amortization, non-cash stock-based compensation, and inventory and accounts receivable reserves of $17.0 million, a decrease of accounts payable and accrued liabilities of $2.2 million, and an increase in accounts receivable of $1.5 million. This usage was partially offset by a decrease of income taxes receivable of $7.6 million and a decrease in prepaid and other assets of $0.3 million.
In 2014, cash used by investing activities was de minimis as the sale of short-term investments of $0.2 million was offset by capital expenditures of $0.2 million.
In 2013, cash provided by investing activities of $9.4 million was due to the sale of short-term investments of $10.2 million, partially offset by capital expenditures of $0.8 million.
In 2012, cash provided by investing activities of $24.9 million was due to the sale of short-term investments of $25.2 million, partially offset by capital expenditures of $0.3 million.

30
In 2014, cash provided by financing activities was $5.3 million. We received $5.2 million from the sale of our common stock in a private placement. We also received $21,000 from the stock sale for the employee stock purchase plan and $6,000 from the exercise of stock options.
In 2013, cash provided by financing activities was $36,000 as a result of cash received from the sale of stock for our employee stock purchase plan.
In 2012, cash used in financing activities of $0.7 million was due to the repurchase of our common stock of $0.8 million which was partially offset by cash received from the sale of stock for our employee stock purchase plan of $0.1 million.
As of December 31, 2014, we had no debt. The following table summarizes our contractual obligations as of December 31, 2014 (in thousands):
Less than More thanContractual obligations: Total 1 year 1-3 years 3-5 years 5 yearsOperating lease obligations 11,734$ 2,188$ 3,424$ 3,042$ 3,080$ Purchase obligations 2,143 2,143 - - -Total 13,877$ 4,331$ 3,424$ 3,042$ 3,080$
Payments due by period
During our normal course of business, we have made certain indemnities, commitments and guarantees under which we may be required to make payments in relation to certain transactions. These include: intellectual property indemnities to our customers and licensees in connection with the use, sale and/or license of our products; indemnities to various lessors in connection with facility leases for certain claims arising from such facility or lease; indemnities to vendors and service providers pertaining to claims based on the negligence or willful misconduct; indemnities involving the accuracy of representations and warranties in certain contracts; and indemnities to directors and officers of the Company to the maximum extent permitted under the laws of the State of Delaware. We may also issue a guarantee in the form of a standby letter of credit as security for contingent liabilities under certain customer contracts. The duration of these indemnities, commitments and guarantees varies, and in certain cases, may be indefinite. The majority of these indemnities, commitments and guarantees may not provide for any limitation of the maximum potential for future payments we could be obligated to make. We have not recorded any liability for these indemnities, commitments and guarantees in the accompanying consolidated balance sheets.
Our corporate headquarters, including our principal administrative, sales and marketing, customer support and research and development facility, is located in Aliso Viejo, California, where we currently lease and occupy approximately 33,600 square feet of space pursuant to lease that expires on May 31, 2016. We lease approximately 55,600 square feet in Pittsburgh, Pennsylvania under a lease that expires December 31, 2021. We lease approximately 16,000 square feet in Sunnyvale, California under a lease that expires February 28, 2015. Internationally, we lease space in Belgrade, Serbia that expires December 30, 2016.
We lease an additional 19,100 square feet in Aliso Viejo, California under a lease that expires January 31, 2022. In August 2014, we signed an addendum to sublease all of the space commencing on September 15, 2014 for a three year period, with two, two-year renewal options. The remaining lease expense, net of sublease income, has been accrued for in our 2013 restructuring liability account.

31
We lease approximately 15,300 square feet in Watsonville, California under a lease that expires September 30, 2018. In March 2014, we signed an addendum to sublease all of the space commencing on May 1, 2014. We continued to pay our current monthly rent through June 30, 2014. Beginning on July 1, 2014, we are paying the landlord a minimum amount of rent, with annual escalations, through the end of the lease. This lease expense has been accrued for in our 2013 restructuring liability account. We have moved into a significantly smaller facility in Santa Cruz, California and are paying month-to-month rent.
As of December 31, 2014, we did not have any off-balance sheet arrangements.
Our discussion and analysis of results of operations, financial condition and liquidity are based upon our consolidated financial statements, which have been prepared in accordance with accounting principles generally accepted in the United States of America. The preparation of these financial statements requires us to make estimates and judgments that affect the reported amounts of assets and liabilities and disclosure of contingent assets and liabilities at the date of the financial statements and the reported amounts of revenues and expenses during the reporting period. We base our estimates on historical experience and on various other assumptions that are believed to be reasonable under the circumstances. Actual results may materially differ from these estimates under different assumptions or conditions. On an on-going basis, we review our estimates to ensure that they appropriately reflect changes in our business or new information as it becomes available.
We believe the following critical accounting policies affect our more significant estimates and assumptions used in the preparation of our consolidated financial statements:
We currently report our net revenues under two operating groups: Wireless and Productivity & Graphics. Within each of these groups software revenue is recognized based on the customer and contract type. We recognize revenue when persuasive evidence of an arrangement exists, delivery has occurred, the price is fixed and determinable, and collectability is probable as required by FASB ASC Topic No. 985-605, Software-Revenue Recognition. We recognize revenues from sales of our software to our customers or end users as completed products are shipped and title passes; or from royalties generated as authorized customers duplicate our software, if the other requirements are met. If the requirements are not met at the date of shipment, revenue is not recognized until these elements are known or resolved. For Wireless sales, returns from customers are limited to defective goods or goods shipped in error. Historically, customer returns have not exceeded the very nominal estimates and reserves. We also provide some technical support to our customers. Such costs have historically been insignificant.
We have a few multiple element agreements for which we have contracted to provide a perpetual license for use of proprietary software, to provide non-recurring engineering, and in some cases to provide software maintenance (post contract support). For these software and software-related multiple element arrangements, we must: (1) determine whether and when each element has been delivered; (2) determine whether undelivered products or services are essential to the functionality of the delivered products and services; (3) determine the fair value of each undelivered element using vendor-specific objective evidence (“VSOE”), and (4) allocate the total price among the various elements. VSOE of fair value is used to allocate a portion of the price to the undelivered elements and the residual method is used to allocate the remaining portion to the delivered elements. Absent VSOE, revenue is deferred until the earlier of the point at which VSOE of fair value exists for any undelivered
32
element or until all elements of the arrangement have been delivered. However, if the only undelivered element is post contract support, the entire arrangement fee is recognized ratably over the performance period. We determine VSOE for each element based on historical stand-alone sales to third parties or from the stated renewal rate for the elements contained in the initial arrangement. In determining VSOE, we require that a substantial majority of the selling prices for a product or service fall within a reasonably narrow pricing range. We have established VSOE for our post contract support services and non-recurring engineering.
On occasion, we enter into fixed fee arrangements, i.e. for trials, in which customer payments are tied to the achievement of specific milestones. Revenue for these contracts is recognized based on customer acceptance of certain milestones as they are achieved. We also enter hosting arrangements that sometimes include up-front, non-refundable set-up fees. Revenue is recognized for these fees over the term of the agreement.
For Productivity & Graphics sales, management reviews available retail channel information and makes a determination of a return provision for sales made to distributors and retailers based on current channel inventory levels and historical return patterns. Certain sales to distributors or retailers are made on a consignment basis. Revenue for consignment sales are not recognized until sell through to the final customer is established. Certain revenues are booked net of revenue sharing payments. Sales directly to end-users are recognized upon shipment. End users have a thirty day right of return, but such returns are reasonably estimable and have historically been immaterial. We also provide technical support to our customers. Such costs have historically been insignificant.
For our Productivity & Graphics sales, the cost of sales incentives the Company offers without charge to customers that can be used in, or that are exercisable by a customer as a result of, a single exchange transaction is accounted for as a reduction of revenue as required by FASB ASC Topic No. 605-50, Revenue Recognition-Customer Payments and Incentives. We use historical redemption rates to estimate the cost of customer incentives. Total sales incentives were $0.5 million, $1.2 million, and $0.9 million for the years ended December 31, 2014, 2013 and 2012, respectively.
We sell our products worldwide. We perform ongoing credit evaluations of our customers and adjust credit limits based upon payment history, the customer’s current credit worthiness and various other factors, as determined by our review of their current credit information. We continuously monitor collections and payments from our customers. We estimate credit losses and maintain an allowance for doubtful accounts reserve based upon these estimates. While such credit losses have historically been within our estimated reserves, we cannot guarantee that we will continue to experience the same credit loss rates that we have in the past. If not, this could have an adverse effect on our consolidated financial statements.
Development costs incurred in the research and development of new software products and enhancements to existing software products are expensed as incurred until technological feasibility has been established. The Company considers technological feasibility to be established when all planning, designing, coding and testing has been completed according to design specifications. After technological feasibility is established, any additional costs are capitalized. Through December 31, 2014, software has been substantially completed concurrently with the establishment of technological feasibility; accordingly, no costs have been capitalized to date.

33
We account for income taxes as required by FASB ASC Topic No. 740, Income Taxes. This Topic clarifies the accounting for uncertainty in income taxes recognized in an enterprise’s financial statements and prescribes a recognition threshold and measurement process for financial statement recognition and measurement of a tax position taken or expected to be taken in a tax return. The Topic also provides guidance on derecognition, classification, interest and penalties, accounting in interim periods, disclosure and transition. The Topic requires an entity to recognize the financial statement impact of a tax position when it is more likely than not that the position will be sustained upon examination. The amount recognized is measured as the largest amount of benefit that is greater than fifty percent likely of being realized upon ultimate settlement. In addition, the Topic permits an entity to recognize interest and penalties related to tax uncertainties either as income tax expense or operating expenses. The Company has chosen to recognize interest and penalties related to tax uncertainties as income tax expense. The Company assesses whether a valuation allowance should be recorded against its deferred tax assets based on the consideration of all available evidence, using a “more likely than not” realization standard. The four sources of taxable income that must be considered in determining whether deferred tax assets will be realized are: (1) future reversals of existing taxable temporary differences (i.e., offset of gross deferred tax liabilities against gross deferred tax assets); (2) taxable income in prior carryback years, if carryback is permitted under the applicable tax law; (3) tax planning strategies and (4) future taxable income exclusive of reversing temporary differences and carryforwards. In assessing whether a valuation allowance is required, significant weight is to be given to evidence that can be objectively verified. A significant factor in the Company’s assessment is that the Company has been in a four-year historical cumulative loss as of the end of fiscal year 2014. These facts, combined with uncertain near-term market and economic conditions, reduced the Company’s ability to rely on projections of future taxable income in assessing the realizability of its deferred tax assets. After a review of the four sources of taxable income as of December 31, 2014 (as described above), and after consideration of the Company’s continuing cumulative loss position as of December 31, 2014, the Company will continue to reserve it’s U.S.-based deferred tax amounts, which total $75.7 million, as of December 31, 2014. The Company is subject to U.S. federal income tax as well as income tax of multiple state jurisdictions. Federal income tax returns of the Company are subject to IRS examination for the 2012 and 2013 tax years. State income tax returns are subject to examination for a period of three to four years after filing. The outcome of tax audits cannot be predicted with certainty. If any issues addressed in the Company’s tax audits are resolved in a manner not consistent with management’s expectations, the Company could be required to adjust its provision for income tax in the period such resolution occurs. We may from time to time be assessed interest or penalties by major tax jurisdictions, although any such assessments historically have been minimal and immaterial to our financial results. It is the Company’s policy to classify any interest and/or penalties in the financial statements as a component of income tax expense.
The Company accounts for all stock-based payment awards made to employees and directors based on their fair values and recognized as compensation expense over the vesting period using the straight-line method over the requisite service period for each award as required by FASB ASC Topic No. 718, Compensation-Stock Compensation.
34
In August 2014, the FASB issued Accounting Standards Update (“ASU”) No. 2014-15, Presentation of Financial Statements-Going Concern (Subtopic 205-40). The Update provides U.S. GAAP guidance on management’s responsibility in evaluating whether there is substantial doubt about a company’s ability to continue as a going concern and about related footnote disclosures. For each reporting period, management will be required to evaluate whether there are conditions or events that raise substantial doubt about a company’s ability to continue as a going concern within one year from the date the financial statements are issued. The amendments in this Update are effective for the annual period ending after December 15, 2016, and for annual periods and interim periods thereafter. Early application is permitted. We will be evaluating the impact of this guidance on our consolidated financial statements.
In May 2014, the FASB issued ASU No. 2014-09, Revenue from Contracts with Customers (Topic 606). The amendments to this Update supersede nearly all existing revenue recognition guidance under U.S. GAAP. The core principle of this Topic is to recognize revenues when promised goods or services are transferred to customers in an amount that reflects the consideration that is expected to be received for those goods or services. This Topic defines a five step process to achieve this core principle and, in doing so, it is possible more judgment and estimates may be required within the revenue recognition process than required under existing U.S. GAAP including identifying performance obligations in the contract, estimating the amount of variable consideration to include in the transaction price and allocating the transaction price to each separate performance obligation. For all entities, the amendments in this Update are effective for annual periods and interim periods within those annual periods beginning after December 15, 2016. Earlier adoption is not permitted. An entity will be able to use either of two adoption methods: (1) retrospective to each prior reporting period presented with the option to elect certain practical expedients as defined within this Topic; or (2) retrospective with the cumulative effect of initially applying this Topic recognized at the date of initial application and providing certain additional disclosures as defined per this Topic. We will be evaluating the impact of this guidance on our consolidated financial statements.
Our financial instruments include cash and cash equivalents and short-term investments. At December 31, 2014, the carrying values of our financial instruments approximated fair values based on current market prices and rates.
While a majority of our business is denominated in U.S. dollars, we do occasionally invoice in foreign currencies. For the three years ended December 31, 2014, 2013 and 2012, our revenues denominated in foreign currencies were $43,000, $0.1 million, and $0.6 million, respectively. Fluctuations in the rate of exchange between the U.S. dollar and certain other currencies may affect our results of operations and period-to-period comparisons of our operating results. We do not currently engage in hedging or similar transactions to reduce these risks. The operational expenses of our foreign entities reduce the currency exposure we have because our foreign currency revenues are offset in part by expenses payable in foreign currencies. As such, we do not believe we have a material exposure to foreign currency rate fluctuations at this time.
35
Our consolidated financial statements and schedule appear in a separate section of this Annual Report on Form 10-K beginning on page F-1 and S-1, respectively.
None.
We conducted an evaluation under the supervision and with the participation of our management, including our Chief Executive Officer and Chief Financial Officer, of the effectiveness of the design and operation of our disclosure controls and procedures (as defined in Rules 13a-15(e) under the Securities Exchange Act of 1934 (“Exchange Act”)) as of December 31, 2014. Based upon that evaluation, our Chief Executive Officer and Chief Financial Officer have determined that as of December 31, 2014, our disclosure controls and procedures were effective to ensure that the information required to be disclosed in our Exchange Act reports is recorded, processed, summarized and reported within the time periods specified in the Securities and Exchange Commission’s rules and forms, and that such information is accumulated and communicated to our management, including our Chief Executive Officer and Chief Financial Officer, as appropriate, to allow timely decisions regarding required disclosure. In designing and evaluating the disclosure controls and procedures, our management recognizes that any controls and procedures, no matter how well designed and operated, can provide only reasonable assurance of achieving the desired control objectives, and our management necessarily is required to apply its judgment in evaluating the cost-benefit relationship of possible controls and procedures.
Our management is responsible for the integrity and objectivity of all information presented in this report. The consolidated financial statements were prepared in conformity with accounting principles generally accepted in the United States of America and include amounts based on management’s best estimates and judgments. Management believes the consolidated financial statements fairly reflect the form and substance of transactions and that the financial statements fairly represent the Company’s financial position and results of operations for the periods and as of the dates stated therein.
The Audit Committee of the Board of Directors, which is composed solely of independent directors, meets regularly with our independent registered public accounting firm, SingerLewak LLP, and representatives of management to review accounting, financial reporting, internal control and audit matters, as well as the nature and extent of the audit effort. The Audit Committee is responsible for the engagement of the independent auditors. The independent auditors have free access to the Audit Committee.

36
There have been no changes in our internal controls over financial reporting during the quarter ended December 31, 2014 that have materially affected, or are reasonably likely to materially affect, our internal controls over financial reporting.
Our management, including the Chief Executive Officer and Chief Financial Officer, is responsible for establishing and maintaining adequate internal control over financial reporting (as defined in Rules 13a-15(f) and 15d-15(f) under the Securities Exchange Act of 1934).
Our management, including the Chief Executive Officer and Chief Financial Officer, assessed the effectiveness of our internal control over financial reporting as of December 31, 2014. Management based this assessment on criteria for effective internal control over financial reporting described in “Internal Control—Integrated Framework 2013” issued by the Committee of Sponsoring Organizations of the Treadway Commission.
Based on this assessment, management determined that, as of December 31, 2014, we maintained effective internal control over financial reporting.
None.

37
The following table sets forth certain information regarding our executive officers and certain key officers as of February 20, 2015:
Name Age Position William W. Smith, Jr. 67 Chairman of the Board, President and Chief Executive Officer Rick Carpenter 51 Senior Vice President, Engineering Carla Fitzgerald 50 Vice President, Chief Marketing Officer Jim Mains 52 Vice President, Chief Strategy Officer
Ken Shebek 52 Vice President, Operations David P. Sperling 46 Vice President, Chief Technology Officer
Steven M. Yasbek 61 Vice President, Chief Financial Officer
Mr. Smith co-founded Smith Micro and has served as the Chairman of the Board, President and Chief Executive Officer since inception in 1982. Mr. Smith was employed by Rockwell International Corporation in a variety of technical and management positions from 1975 to 1984. Mr. Smith served with Xerox Data Systems from 1972 to 1975 and RCA Computer Systems Division from 1969 to 1972 in mainframe sales and pre-sale technical roles. Mr. Smith received a B.A. in Business Administration from Grove City College.
Mr. Carpenter joined the Company in May 2009 as the Vice President of Engineering for the Company’s Connectivity & Security Business Unit and then served as the Vice President and General Manager of the Wireless Business Unit. Mr. Carpenter currently serves as the Senior Vice President of Engineering. Prior to joining Smith Micro, Mr. Carpenter served as a Vice President of Engineering at NextWave Wireless where he was responsible for WiMAX chipset development. From 2000 to 2005, he was Director of Software Engineering for CDMA products at AirPrime, which was ultimately acquired by Sierra Wireless. Mr. Carpenter has also held engineering management positions at Motorola and DENSO Wireless and started his professional career in May of 1986. He holds a BS in Computer Science from the University of Texas, Permian Basin and studied Masters-level Computer Science & Engineering at the University of Texas Arlington.
Ms. Fitzgerald joined the Company in March 2011 as Vice President, Corporate Marketing and has been the Chief Marketing Officer since January 2014. As a veteran of the technology industry, Ms. Fitzgerald has held executive positions in marketing, product management, technical sales and business development positions with Bitfone, WebVisible, LogicalApps, Quest Software, Octave Software and CA (formerly Computer Associates, Systems & Network Management software). She holds a B.A. degree in Economics and Computer Studies from Claremont McKenna College, and sits on the Board of Advisors for the UC Irvine Marketing Extension program.
Mr. Mains joined the Company in November 2009 and has been the Chief Strategy Officer since January 2014. Previously, Mr. Mains has held various positions (Senior Vice President of Products, Solution Engineering, Support, and Program Management) where he focused on innovation and transformation. Prior to joining Smith Micro, Mr. Mains held executive/management positions at Openwave Systems, EMC Corporation, IBM Management Consulting, and several management positions in the Aerospace Industry. He earned his B.S. in Mechanical Engineering at the Pennsylvania State University and M.S. in Interactive Technology and Psychology (AI focus) at the University of Southern California with additional course work at the Wharton School of Business.
Mr. Shebek joined the Company in December 2010 as the Vice President of Operations where he led the Enterprise Mobility Product platform. Mr. Shebek currently is responsible for Information Technology throughout the Company as well as overseeing the Pittsburgh facility. Prior to joining Smith Micro, he was Vice President of Operations for Tollgrade Communications. He also served as Vice President of Supply & Logistics for Ericsson, Inc. and worked for Marconi as Vice President of Supply Chain and served as its Vice President of North American

38
Operations. He joined Fore Systems in 1994, and previously held management positions with IBM. He holds a B.S. in Mechanical Engineering degree from Pennsylvania State University.
Mr. Sperling joined the Company in April 1989 and has been the Director of Software Engineering since April 1992. He assumed the Chief Technology Officer position in September 1999. Mr. Sperling began his professional career as a software engineer with us and he currently has two patents and three patents pending for various telephony and Internet technologies. He holds a B.S. degree in Computer Science and an MBA from the University of California, Irvine.
Mr. Yasbek joined the Company in May 2008 as the Chief Accounting Officer and assumed the Vice President and Chief Financial Officer position in May 2014. Mr. Yasbek has held executive finance and information technology positions with REMEC, Paradigm Wireless Systems, Intellisys Group, Pacific Scientific Company, Symbol Technologies, and TRW. Prior to joining the Company, Mr. Yasbek was the Chief Financial Officer of Alphatec Spine. He holds a B.S. in Accounting and M.B.A from Loyola Marymount University, and is a Certified Public Accountant.
Officers are elected by, and serve at the discretion of, the Board of Directors.
For information about our Directors, please see the section titled “Directors and Executive Officers” appearing in our Proxy Statement for our 2015 Annual Meeting of Stockholders, which is hereby incorporated by reference.
The section titled “Corporate Governance” appearing in our Proxy Statement for our 2015 Annual Meeting of Stockholders is hereby incorporated by reference.
Our Board of Directors has a standing Audit Committee. The members of the Audit Committee are Messrs. Campbell, Gulko and Szabo. Our Board has determined that Mr. Gulko, Chairman of the Audit Committee, is an audit committee financial expert as defined by Item 401(h) of Regulation S-K and that each member of the Audit Committee is independent within the meaning of Nasdaq Marketplace Rule 4200(a)(15).
Section 16(a) of the Exchange Act requires certain of the company’s executive officers, as well as its directors and persons who own more than ten percent (10%) of a registered class of the Company’s equity securities to file reports of ownership and changes in ownership with the Securities and Exchange Commission.
Based solely on its review of the copies of such forms received by the Company, or written representations from certain reporting persons, the Company believes that all filing requirements applicable to our executive officers, directors and more than 10% stockholders were met in a timely manner in 2014, with the exception of a Form 3 for one director that was filed late.
We have adopted a Code of Ethics that applies to all of our employees, including our principal executive officer, our principal financial officer, and all members of our finance department performing similar functions. Our Code of Ethics was filed as Exhibit 14 to the Annual Report on Form 10-K for the year ended December 31, 2003 which was filed on March 25, 2004. In the event of an amendment to, or a waiver from, certain provisions of our Code of Ethics, we intend, to the extent possible, to satisfy Form 8-K disclosure requirements by disclosing this information on our website at www.smithmicro.com.

39
The section titled “Executive Compensation and Related Information” appearing in our Proxy Statement for our 2015 Annual Meeting of Stockholders is hereby incorporated by reference.
The section titled “Ownership of Securities and Related Stockholder Matters” appearing in our Proxy Statement for our 2015 Annual Meeting of Stockholders is hereby incorporated by reference.
The following table provides information as of December 31, 2014 with respect to the shares of common stock that may be issued under our existing equity compensation plans:
(in thousands, except per share amounts)
Number of shares to be issued upon exercise of
outstanding options
Weighted average exercise price of
outstanding options
Number of shares remaining available for future issuance
Equity compensation plan approved by shareholders (1) 2,134 $5.29 1,571
Equity compensation plan not approved by shareholders - - -
Total 2,134 $5.29 1,571
(1) The number of shares to be issued upon exercise includes options granted under both the 1995 Stock Option/Stock Issuance Plan and the 2005 Stock Option/Stock Issuance Plan. The number of shares remaining available for future issuance consists only of the 2005 Plan.
The section titled “Related Party Transactions” and “Director Independence” appearing in our Proxy Statement for our 2015 Annual Meeting of Stockholders is incorporated herein by reference.
The section titled “Ratification of Appointment of Independent Registered Public Accounting Firm – Principal Accountant Fees and Services” appearing in our Proxy Statement for our 2015 Annual Meeting of Stockholders is incorporated herein by reference.

40
Smith Micro’s financial statements appear in a separate section of this Annual Report on Form 10-K beginning on the pages referenced below:
Page
REPORT OF INDEPENDENT REGISTERED PUBLIC ACCOUNTING FIRM ....................................................... F-1
CONSOLIDATED BALANCE SHEETS ..................................................................................................................... F-2
CONSOLIDATED STATEMENTS OF COMPREHENSIVE LOSS .......................................................................... F-3
CONSOLIDATED STATEMENTS OF STOCKHOLDERS’ EQUITY ...................................................................... F-4
CONSOLIDATED STATEMENTS OF CASH FLOWS ............................................................................................. F-5
NOTES TO CONSOLIDATED FINANCIAL STATEMENTS ................................................................................... F-6
Smith Micro’s financial statement schedule appears in a separate section of this Annual Report on Form 10-K on the pages referenced below. All other schedules have been omitted as they are not applicable, not required or the information is included in the consolidated financial statements or the notes thereto.
Page
SCHEDULE II - VALUATION AND QUALIFYING ACCOUNTS ......................................................................... S-1
Exhibit No. Title Method of Filing
3.1 Amended and Restated Certificate of Incorporation.
Incorporated by reference to Exhibit 3.1 to the Registrant's Registration Statement No. 33-95096.
3.1.1 Amendment to Certificate of Incorporation dated July 11, 2000.
Incorporated by reference to Exhibit 3.1.1 to the Registrant’s Quarterly Report on Form 10-Q for the period ended June 30, 2000.
3.1.2 Amendment to Certificate of Incorporation dated August 18, 2005.
Incorporated by reference to Exhibit 3.1.2 to the Registrant’s Annual Report on Form 10-K for the period ended December 31, 2005.

41
Exhibit No. Title Method of Filing
3.1.3 Certificate of Designations of Series A Junior Participating Preferred Stock dated April 25, 2012.
Incorporated by reference to Exhibit 3.1 to the Registrant’s Current Report on Form 8-K filed on April 25, 2012.
3.1.4 Amendment to Certificate of Incorporation dated June 25, 2012.
Incorporated by reference to Appendix B to the Registrant’s Definitive Proxy Statement on Schedule 14A filed on April 27, 2012.
3.2 Amended and Restated Bylaws. Incorporated by reference to Exhibit 3.2 to the Registrant's Registration Statement No. 33-95096.
3.3 Amendment to Amended and Restated Bylaws.
Incorporated by reference to Exhibit 3.3 to the Registrant’s Current Report on Form 8-K filed on October 31, 2007.
4.1 Specimen certificate representing shares of Common Stock.
Incorporated by reference to Exhibit 4.1 to the Registrant's Registration Statement No. 33-95096.
4.2 Stockholder Rights Agreement, dated as of April 24, 2012, between the Registrant and Computershare Trust Company, N.A., as Rights Agent.
Incorporated by reference to Exhibit 4.1 to the Registrant’s Current Report on Form 8-K filed on April 25, 2012.
10.1 Form of Indemnification Agreement. Incorporated by reference to Exhibit 10.1 to the Registrant's Registration Statement No. 33-95096.
10.2 1995 Stock Option/Stock Issuance Plan as Amended and Restated through February 7, 2001.
Incorporated by reference to Appendix to the Registrant’s Definitive Proxy Statement on Schedule 14A filed on April 25, 2001.
10.3 Amended and Restated 2005 Stock Option / Stock Issuance Plan.
Incorporated by reference to Exhibit 10.7 to the Registrant’s Registration Statement on Form S-8 (Reg. No. 333-149222).
10.5 Letter Agreement, dated June 13, 2005, by and between the Registrant and Andrew Schmidt.
Incorporated by reference to Exhibit 10.5 to the Registrant’s Current Report on Form 8-K filed on November 30, 2006.
10.6 Summary of oral agreement dated June 2005 by and between William W. Smith, Jr. and the Registrant.
Incorporated by reference to Exhibit 10.10 to the Registrant’s Quarterly Report on Form 10-Q for the quarter ended June 30, 2009.
10.7
Amended & Restated Employee Stock Purchase Plan.
Incorporated by reference to Exhibit 10.11 to the Registrant’s Registration Statement on Form S-8 (No. 333-169671) filed on September 30, 2010.
10.8 Agreement and Mutual General Release, by and between Andrew C. Schmidt and the Registrant.
Incorporated by reference to Exhibit 99.1 to the Registrant’s Current Report on Form 8-K filed on May 23, 2014.

42
Exhibit No. Title Method of Filing
10.9 Agreement and Mutual General Release, by and between Christopher G. Lippincott and the Registrant.
Incorporated by reference to Exhibit 99.2 to the Registrant’s Current Report on Form 8-K filed on May 23, 2014.
10.10 Agreement and Mutual General Release, by and between Daniel Rawlings and the Registrant.
Incorporated by reference to Exhibit 99.1 to the Registrant’s Current Report on Form 8-K filed on June 9, 2014.
10.11 Form of Common Stock Purchase Agreement dated August 15, 2014
Incorporated by reference to Exhibit 10.1 to the Registrant’s Current Report on Form 8-K filed on August 20, 2014.
10.12 Form of Registration Rights Agreement dated August 15, 2014.
Incorporated by reference to Exhibit 10.2 to the Registrant’s Current Report on Form 8-K filed on August 20, 2014.
14.1 Code of Ethics. Incorporated by reference to Exhibit 14.1 to the Registrant’s Annual Report on Form 10-K for the year ended December 31, 2003.
14.1.1 Attachment 1 to Code of Ethics. Incorporated by reference to Exhibit 14.1.1 to the Registrant’s Annual Report on Form 10-K for the year ended December 31, 2003.
21.1 Subsidiaries. Filed herewith.
23.1 Consent of Independent Registered Public Accounting Firm.
Filed herewith.
31.1 Certification of the Chief Executive Officer pursuant to Section 302 of the Sarbanes-Oxley Act of 2002.
Filed herewith.
31.2 Certification of the Chief Financial Officer pursuant to Section 302 of the Sarbanes-Oxley Act of 2002.
Filed herewith.
32.1 Certifications of the Chief Executive Officer and the Chief Financial Officer pursuant to Section 906 of the Sarbanes-Oxley Act of 2002.
Furnished herewith.
101.INS XBRL Instance Document. Filed herewith.
101.SCH XBRL Taxonomy Extension Schema Document.
Filed herewith.
101.CAL XBRL Taxonomy Extension Calculation Linkbase Document.
Filed herewith.
101.DEF XBRL Taxonomy Extension Definition Linkbase Document.
Filed herewith.
101.LAB XBRL Taxonomy Extension Label Linkbase Document.
Filed herewith.
101.PRE XBRL Taxonomy Extension Presentation Linkbase Document.
Filed herewith.

43
(b) Exhibits The exhibits filed as part of this report are listed above in Item 15(a) (3) of this Form 10-K. (c) Financial Statement Schedule The Financial Statement Schedule required by Regulation S-X and Item 8 of this Form are listed above in Item 15(a)(2) of this Form 10-K.

44
Pursuant to the requirements of Section 13 or 15(d) of the Securities Exchange Act of 1934, the registrant has duly caused this report to be signed on its behalf by the undersigned thereunto duly authorized.
SMITH MICRO SOFTWARE, INC.
Date: February 27, 2015 By:/s/ William W. Smith, Jr. William W. Smith, Jr. Chairman of the Board, President and Chief Executive Officer (Principal Executive Officer) Date: February 27, 2015 By:/s/ Steven M. Yasbek Steven M. Yasbek Vice President and Chief Financial Officer (Principal Financial and Accounting Officer)
Pursuant to the requirements of the Securities Exchange Act of 1934, this report has been signed below by the following persons on behalf of the registrant and in the capacities and on the dates indicated.
Signature Title Date /s/ William W. Smith, Jr. William W. Smith, Jr.
Chairman of the Board, President and Chief Executive Officer (Principal Executive Officer)
February 27, 2015
/s/ Steven M. Yasbek Steven M. Yasbek
Vice President and Chief Financial Officer (Principal Financial and Accounting Officer)
February 27, 2015
/s/ Andrew Arno Andrew Arno
Director February 27, 2015
/s/ Thomas G. Campbell Thomas G. Campbell
Director February 27, 2015
/s/ Steven Elfman Steven Elfman
Director February 27, 2015
/s/ Samuel Gulko Samuel Gulko
Director February 27, 2015
/s/ Gregory J. Szabo Gregory J. Szabo
Director February 27, 2015

F-1
REPORT OF INDEPENDENT REGISTERED PUBLIC ACCOUNTING FIRM To the Board of Directors and Stockholders Smith Micro Software, Inc. We have audited the accompanying consolidated balance sheets of Smith Micro Software, Inc. and subsidiaries (collectively, the “Company”) as of December 31, 2014 and 2013, and the related consolidated statements of comprehensive loss, stockholders’ equity, and cash flows for each of the three years in the period ended December 31, 2014. Our audits also included the financial statement schedule of the Company listed in Item 15(a). These financial statements and financial statement schedule are the responsibility of the Company’s management. Our responsibility is to express an opinion on these financial statements and schedule based on our audits. We conducted our audits in accordance with the standards of the Public Company Accounting Oversight Board (United States). Those standards require that we plan and perform the audit to obtain reasonable assurance about whether the financial statements are free of material misstatement. The Company is not required to have, nor were we engaged to perform, an audit of its internal control over financial reporting. Our audits included consideration of internal control over financial reporting as a basis for designing audit procedures that are appropriate in the circumstances, but not for the purpose of expressing an opinion on the effectiveness of the Company’s internal control over financial reporting. Accordingly, we express no such opinion. An audit also includes examining, on a test basis, evidence supporting the amounts and disclosures in the financial statements, assessing the accounting principles used and significant estimates made by management, as well as evaluating the overall financial statement presentation. We believe that our audits provide a reasonable basis for our opinion. In our opinion, the consolidated financial statements referred to above present fairly, in all material respects, the financial position of the Company as of December 31, 2014 and 2013, and the results of its operations and its cash flows for each of the three years in the period ended December 31, 2014, in conformity with U.S. generally accepted accounting principles. Also, in our opinion, the related financial statement schedule, when considered in relation to the basic consolidated financial statements taken as a whole, presents fairly in all material respects the information set forth therein. /s/ SingerLewak LLP Los Angeles, California February 27, 2015
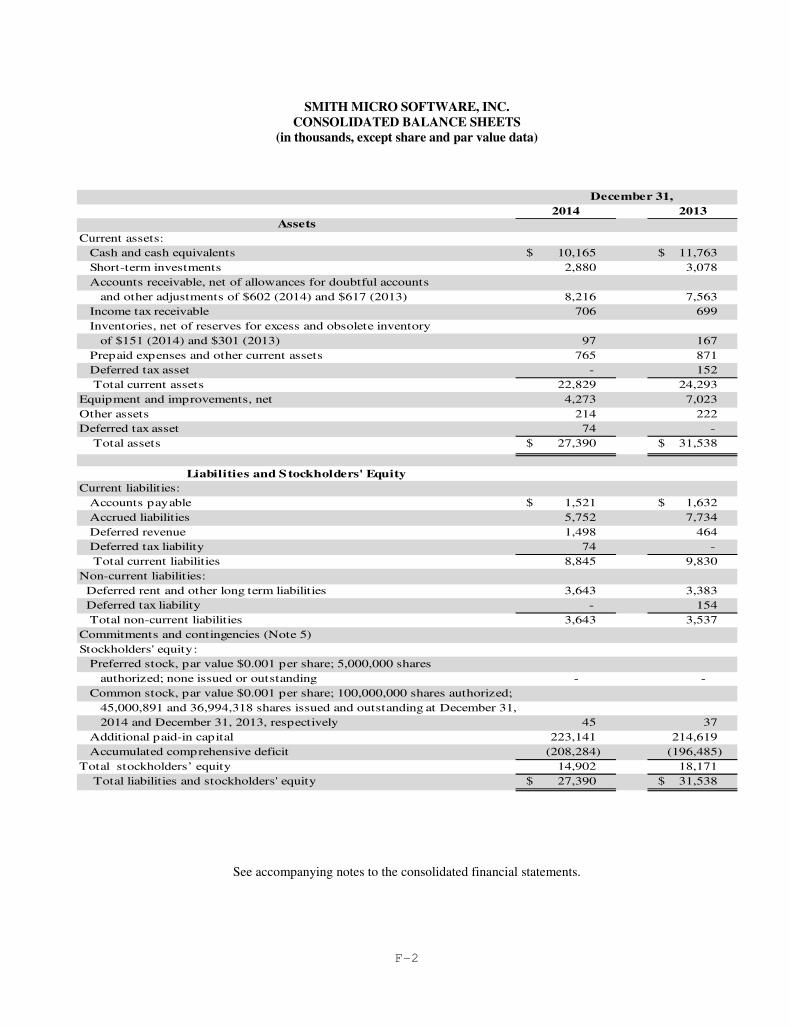
F-2
SMITH MICRO SOFTWARE, INC.
CONSOLIDATED BALANCE SHEETS (in thousands, except share and par value data)
See accompanying notes to the consolidated financial statements.
December 31,2014 2013
AssetsCurrent assets: Cash and cash equivalents 10,165$ 11,763$ Short-term investments 2,880 3,078 Accounts receivable, net of allowances for doubtful accounts and other adjustments of $602 (2014) and $617 (2013) 8,216 7,563 Income tax receivable 706 699 Inventories, net of reserves for excess and obsolete inventory of $151 (2014) and $301 (2013) 97 167 Prepaid expenses and other current assets 765 871 Deferred tax asset - 152 Total current assets 22,829 24,293 Equipment and improvements, net 4,273 7,023 Other assets 214 222 Deferred tax asset 74 - Total assets 27,390$ 31,538$
Liabilities and Stockholders' Equity Current liabilities: Accounts payable 1,521$ 1,632$ Accrued liabilities 5,752 7,734 Deferred revenue 1,498 464 Deferred tax liability 74 - Total current liabilities 8,845 9,830 Non-current liabilities: Deferred rent and other long term liabilities 3,643 3,383 Deferred tax liability - 154 Total non-current liabilities 3,643 3,537 Commitments and contingencies (Note 5)Stockholders' equity: Preferred stock, par value $0.001 per share; 5,000,000 shares authorized; none issued or outstanding - - Common stock, par value $0.001 per share; 100,000,000 shares authorized; 45,000,891 and 36,994,318 shares issued and outstanding at December 31, 2014 and December 31, 2013, respectively 45 37 Additional paid-in capital 223,141 214,619 Accumulated comprehensive deficit (208,284) (196,485) Total stockholders’ equity 14,902 18,171 Total liabilities and stockholders' equity 27,390$ 31,538$
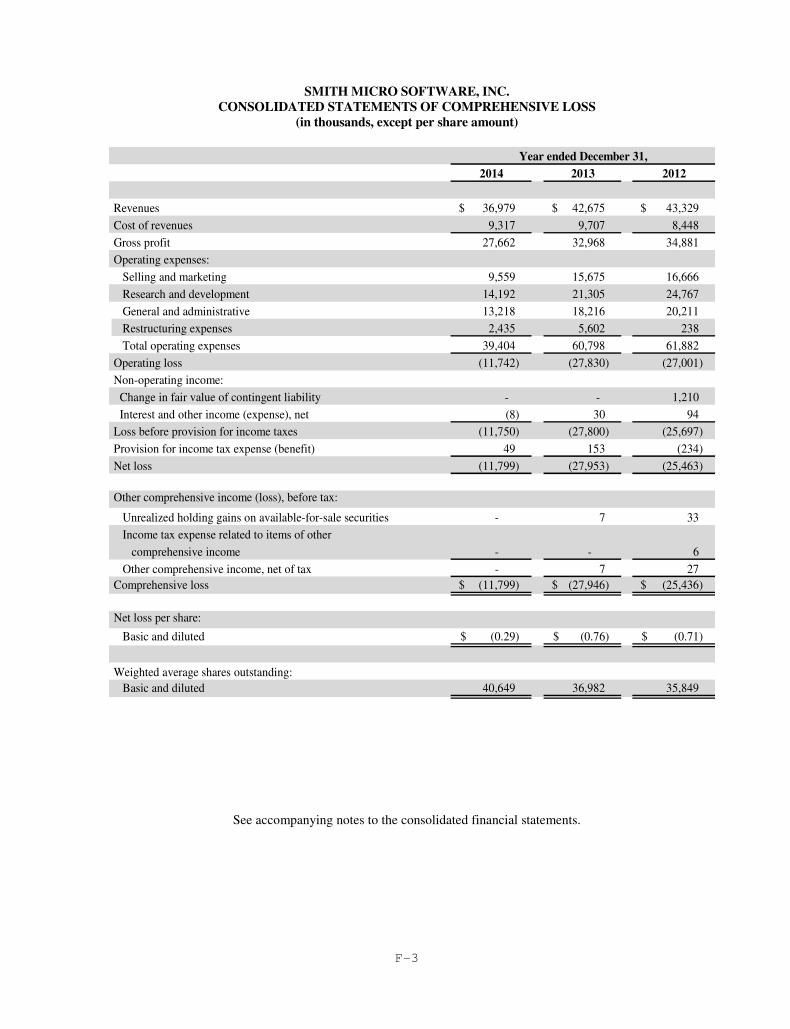
F-3
SMITH MICRO SOFTWARE, INC. CONSOLIDATED STATEMENTS OF COMPREHENSIVE LOSS
(in thousands, except per share amount)
2014 2013 2012
Revenues 36,979$ 42,675$ 43,329$ Cost of revenues 9,317 9,707 8,448 Gross profit 27,662 32,968 34,881 Operating expenses: Selling and marketing 9,559 15,675 16,666 Research and development 14,192 21,305 24,767 General and administrative 13,218 18,216 20,211 Restructuring expenses 2,435 5,602 238 Total operating expenses 39,404 60,798 61,882 Operating loss (11,742) (27,830) (27,001) Non-operating income: Change in fair value of contingent liability - - 1,210 Interest and other income (expense), net (8) 30 94 Loss before provision for income taxes (11,750) (27,800) (25,697) Provision for income tax expense (benefit) 49 153 (234) Net loss (11,799) (27,953) (25,463)
Other comprehensive income (loss), before tax:
Unrealized holding gains on available-for-sale securities - 7 33 Income tax expense related to items of other comprehensive income - - 6 Other comprehensive income, net of tax - 7 27 Comprehensive loss (11,799)$ (27,946)$ (25,436)$
Net loss per share:
Basic and diluted (0.29)$ (0.76)$ (0.71)$
Weighted average shares outstanding: Basic and diluted 40,649 36,982 35,849
Year ended December 31,
See accompanying notes to the consolidated financial statements.

F-4
SMITH MICRO SOFTWARE, INC. CONSOLIDATED STATEMENTS OF STOCKHOLDERS’ EQUITY
(in thousands)
Additional Accumulated paid-in comprehensive
Shares Amount capital income (deficit) Total BALANCE, December 31, 2011 35,612 36$ 207,927$ (143,103)$ 64,860$
Exercise of common stock options 32 - 16 - 16Non cash compensation recognized on stock options and ESPP - - 66 - 66Restricted stock grants, net of cancellations 574 - 3,883 - 3,883Cancellation of shares for payment of withholding tax (23) - (40) - (40)Employee stock purchase plan 53 - 66 - 66Shares repurchased and cancelled (375) - (753) - (753)Comprehensive loss - - - (25,436) (25,436)BALANCE, December 31, 2012 35,873 36$ 211,165$ (168,539)$ 42,662$
Non cash compensation recognized on stock options and ESPP - - 168 - 168Restricted stock grants, net of cancellations 1,179 1 3,364 - 3,365Cancellation of shares for payment of withholding tax (96) - (114) - (114)Employee stock purchase plan 38 - 36 - 36Comprehensive loss - - - (27,946) (27,946)BALANCE, December 31, 2013 36,994 37$ 214,619$ (196,485)$ 18,171$
Exercise of common stock options 4 - 6 - 6
Non cash compensation recognized on stock options and ESPP - - 157 - 157Restricted stock grants, net of cancellations 1,421 1 3,494 - 3,495Cancellation of shares for payment of withholding tax (292) - (391) - (391)Employee stock purchase plan 27 - 21 - 21Issuance of common stock in a private placement 6,846 7 5,235 5,242Comprehensive loss - - - (11,799) (11,799)BALANCE, December 31, 2014 45,000 45$ 223,141$ (208,284)$ 14,902$
Common stock
See accompanying notes to the consolidated financial statements.

F-5
SMITH MICRO SOFTWARE, INC. CONSOLIDATED STATEMENTS OF CASH FLOWS
(in thousands)
Year ended December 31,2014 2013 2012
Operating activities:Net loss (11,799)$ (27,953)$ (25,463)$ Adjustments to reconcile net loss to net cash used in operating activities: Depreciation and amortization 2,931 4,006 4,430 Long-lived assets write-off due to restructuring - 1,011 - Change in fair value of contingent liability - - (1,210) Loss on disposal of fixed assets - - 163 Provision for adjustments to accounts receivable and doubtful accounts 347 730 1,045 Provision for excess and obsolete inventory 124 76 73 Non cash compensation related to stock options and restricted stock 3,652 3,533 3,949 Deferred income taxes (2) - - Change in operating accounts: Accounts receivable (1,000) 660 (1,473) Income tax receivable (7) (18) 7,612 Inventories (54) (67) 60 Prepaid expenses and other assets 114 (9) 268 Accounts payable and accrued liabilities (2,189) 2,429 (2,992) Deferred revenue 1,034 (972) 733 Net cash used in operating activities (6,849) (16,574) (12,805)
Investing activities:Capital expenditures (216) (829) (322) Sales of short-term investments 198 10,257 25,196 Net cash provided by (used in) investing activities (18) 9,428 24,874
Financing activities:
Cash received from issuance of common stock, net of offering costs 5,242 - - Cash received from stock sale for employee stock purchase plan 21 36 66 Cash received from exercise of stock options 6 - 16 Repurchase of common stock - - (753) Net cash provided by (used in) financing activities 5,269 36 (671) Net increase (decrease) in cash and cash equivalents (1,598) (7,110) 11,398 Cash and cash equivalents, beginning of period 11,763 18,873 7,475 Cash and cash equivalents, end of period 10,165$ 11,763$ 18,873$
Supplemental disclosures of cash flow information: Cash paid for income taxes 75$ 165$ 257$
See accompanying notes to the consolidated financial statements.

F-6
SMITH MICRO SOFTWARE, INC. NOTES TO CONSOLIDATED FINANCIAL STATEMENTS
Smith Micro provides software solutions to simplify and enhance the mobile experience. As a leader in wireless connectivity, our applications ensure the best Quality of Experience for mobile users while optimizing networks for wireless service providers and enterprises. Using our intelligent policy-on-device platform, along with premium voice, video and content monetization services, we create new opportunities to engage consumers and capitalize on the growth of connected devices. In addition to wireless and mobility software, Smith Micro develops and distributes personal, professional and educational productivity and graphics products and tools for consumers, artists, animators and designers worldwide.
Over the past three decades, the Company has developed deep expertise in embedded software for networked devices, policy-based management platforms, and highly-scalable mobile applications and hosted services. For organizations struggling to reduce costs and complexity in the fragmented, rapidly evolving mobile market, Smith Micro offers proven solutions that increase reliability and efficiency while accelerating delivery and value of mobile services to consumers.
The proliferation of mobile broadband technology continues to provide new opportunities for Smith Micro on a global scale. Smith Micro’s mission is to help our customers thrive in a connected world with software solutions that:
1. Simplify wireless connectivity to reduce costs and deliver “best-connected” experiences;
2. Optimize network and device resources for maximum performance, efficiency and flexibility;
3. Provide greater insight and control over the quality of service (“QoS”) delivered to users; and
4. Engage and grow high-value relationships with end customers using mobile devices.
The accompanying consolidated financial statements reflect the operating results and financial position of Smith Micro Software, Inc. and its wholly owned subsidiaries in accordance with accounting principles generally accepted in the United States of America. All intercompany amounts have been eliminated in consolidation.
The Company has international operations resulting from acquisitions in prior years. The countries in which the Company has a subsidiary or branch office in are Serbia, the United Kingdom and Canada. The functional currency for all of these foreign entities is the U.S. dollar in accordance with the Financial Accounting Standards Board (“FASB”) Accounting Standards Codification (“ASC”) Topic No. 830-30, Foreign Currency Matters-Translation of Financial Statements. Foreign currency transactions that increase or decrease expected functional currency cash flows is a foreign currency transaction gain or loss that are included in determining net income for the period in which the exchange rate changes. Likewise, a transaction gain or loss (measured from the transaction date or the most recent intervening balance sheet date, whichever is later) realized upon settlement of a foreign

F-7
currency transaction is included in determining net income for the period in which the transaction is settled.
The preparation of consolidated financial statements in conformity with accounting principles generally accepted in the U.S. requires management to make estimates and assumptions that affect the reported amounts in the consolidated financial statements and accompanying notes. Actual results could differ from those estimates.
The Company measures and discloses fair value measurements as required by FASB ASC Topic No. 820, Fair Value Measurements and Disclosures.
The carrying value of accounts receivable, foreign cash accounts, prepaid expenses, other current assets, accounts payable, and accrued liabilities are considered to be representative of their respective fair values because of the short-term nature of those instruments.
Fair value is an exit price, representing the amount that would be received to sell an asset or paid to transfer a liability in an orderly transaction between market participants. As such, fair value is a market-based measurement that is determined based on assumptions that market participants would use in pricing an asset or a liability. As a basis for considering such assumptions, the FASB establishes a three-tier value hierarchy, which prioritizes the inputs used in the valuation methodologies in measuring fair value:
• Level 1 - Observable inputs that reflect quoted prices (unadjusted) for identical assets or liabilities in active markets.
• Level 2 - Include other inputs that are directly or indirectly observable in the marketplace.
• Level 3 - Unobservable inputs which are supported by little or no market activity.
The fair value hierarchy also requires an entity to maximize the use of observable inputs and minimize the use of unobservable inputs when measuring fair value.
As required by FASB ASC Topic No. 820, we measure our cash equivalents and short-term investments at fair value. Our cash equivalents and short-term investments are classified within Level 1 by using quoted market prices utilizing market observable inputs.
As required by FASB ASC Topic No. 825, Financial Instruments, an entity can choose to measure at fair value many financial instruments and certain other items that are not currently required to be measured at fair value. Subsequent changes in fair value for designated items are required to be reported in earnings in the current period. This Topic also establishes presentation and disclosure requirements for similar types of assets and liabilities measured at fair value. As permitted, the Company has elected not to use the fair value option to measure our available-for-sale securities under this Topic and will continue to report as required by FASB ASC Topic No. 320, Investments-Debt and Equity Securities. We have made this election because the nature of our financial assets and liabilities are not of such complexity that they would benefit from a change in valuation to fair value.
For the year ended December 31, 2014, two customers, each accounting for over 10% of revenues, made up 79.2% of revenues and 87% of accounts receivable, and one service provider with more than 10% of purchases totaled 27% of accounts payable. For the year ended December 31, 2013, three customers, each accounting for over 10% of revenues, made up 77.5% of revenues and 83% of accounts receivable, and one service provider with more than 10% of purchases totaled 28% of accounts payable. For the year ended December 31, 2012, two customers, each accounting for over

F-8
10% of revenues, made up 61.2% of revenues and 78% of accounts receivable, and no service provider accounted for more than 10% of purchases.
The Company currently outsources a key information technology service, an important component of one of its products, from one supplier. Although there are a limited number of third party providers for this type of service, management believes that other suppliers could provide similar services on comparable terms. A change in suppliers, however, could cause a disruption or delay in services which could result in a possible loss of revenues and customer confidence, all of which would adversely affect our operating results.
Cash and cash equivalents generally consist of cash, government securities, mutual funds, and money market funds. These securities are primarily held in two financial institutions and are uninsured except for the minimum Federal Deposit Insurance Corporation (“FDIC”) coverage, and have original maturity dates of three months or less. As of December 31, 2014 and 2013, bank balances totaling approximately $9.9 million and $11.6 million, respectively, were uninsured.
Short-term investments consist of corporate notes, bonds, and commercial paper and U.S. government agency and government sponsored enterprise obligations. The Company accounts for these short-term investments as required by FASB ASC Topic No. 320, Investments-Debt and Equity Securities. These debt and equity securities are not classified as either held-to-maturity securities or trading securities. As such, they are classified as available-for-sale securities. Available-for-sale securities are recorded at fair value, with unrealized gains or losses recorded as a separate component of accumulated other comprehensive income in stockholders’ equity until realized.
We sell our products worldwide. We perform ongoing credit evaluations of our customers and adjust credit limits based upon payment history, the customer’s current credit worthiness and various other factors, as determined by our review of their current credit information. We continuously monitor collections and payments from our customers. We estimate credit losses and maintain an allowance for doubtful accounts reserve based upon these estimates. While such credit losses have historically been within our estimated reserves, we cannot guarantee that we will continue to experience the same credit loss rates that we have in the past. If not, this could have an adverse effect on our consolidated financial statements. Allowances for product returns are included in other adjustments to accounts receivable on the accompanying consolidated balance sheets. Product returns are estimated based on historical experience and have also been within management’s estimates.
Inventories consist principally of compact disks (“CDs”), boxes and manuals and are stated at the lower of cost (determined by the first-in, first-out method) or market. The Company regularly reviews its inventory quantities on hand and records a provision for excess and obsolete inventory based primarily on management’s forecast of product demand and production requirements. At December 31, 2014, our net inventory of $0.1 million consisted mostly of components. At December 31, 2013, our net inventory of $0.2 million consisted of $0.1 million of assembled products and $0.1 million of components.
Equipment and improvements are stated at cost. Depreciation is computed using the straight-line method based on the estimated useful lives of the assets, generally ranging from three to seven years.
F-9
Leasehold improvements are amortized using the straight-line method over the shorter of the estimated useful life of the asset or the lease term.
Development costs incurred in the research and development of new software products and enhancements to existing software products are expensed as incurred until technological feasibility has been established. The Company considers technological feasibility to be established when all planning, designing, coding and testing has been completed according to design specifications. After technological feasibility is established, any additional costs are capitalized. Through December 31, 2014, software has been substantially completed concurrently with the establishment of technological feasibility; accordingly, no costs have been capitalized to date.
The long-term liabilities are for deferred rent to account for the difference between straight-line and bargain rents, lease incentives included in deferred rent, restructuring expenses, and sublease deposits.
We currently report our net revenues under two operating groups: Wireless and Productivity & Graphics. Within each of these groups software revenue is recognized based on the customer and contract type. We recognize revenue when persuasive evidence of an arrangement exists, delivery has occurred, the price is fixed and determinable, and collectability is probable as required by FASB ASC Topic No. 985-605, Software-Revenue Recognition. We recognize revenues from sales of our software to our customers or end users as completed products are shipped and title passes; or from royalties generated as authorized customers duplicate our software, if the other requirements are met. If the requirements are not met at the date of shipment, revenue is not recognized until these elements are known or resolved. For Wireless sales, returns from customers are limited to defective goods or goods shipped in error. Historically, customer returns have not exceeded the very nominal estimates and reserves. We also provide some technical support to our customers. Such costs have historically been insignificant.
We have a few multiple element agreements for which we have contracted to provide a perpetual license for use of proprietary software, to provide non-recurring engineering, and in some cases to provide software maintenance (post contract support). For these software and software-related multiple element arrangements, we must: (1) determine whether and when each element has been delivered; (2) determine whether undelivered products or services are essential to the functionality of the delivered products and services; (3) determine the fair value of each undelivered element using vendor-specific objective evidence (“VSOE”), and (4) allocate the total price among the various elements. VSOE of fair value is used to allocate a portion of the price to the undelivered elements and the residual method is used to allocate the remaining portion to the delivered elements. Absent VSOE, revenue is deferred until the earlier of the point at which VSOE of fair value exists for any undelivered element or until all elements of the arrangement have been delivered. However, if the only undelivered element is post contract support, the entire arrangement fee is recognized ratably over the performance period. We determine VSOE for each element based on historical stand-alone sales to third parties or from the stated renewal rate for the elements contained in the initial arrangement. In determining VSOE, we require that a substantial majority of the selling prices for a product or service fall within a reasonably narrow pricing range. We have established VSOE for our post contract support services and non-recurring engineering.
On occasion, we enter into fixed fee arrangements, i.e. for trials, in which customer payments are tied to the achievement of specific milestones. Revenue for these contracts is recognized based on customer
F-10
acceptance of certain milestones as they are achieved. We also enter hosting arrangements that sometimes include up-front, non-refundable set-up fees. Revenue is recognized for these fees over the term of the agreement. For Productivity & Graphics sales, management reviews available retail channel information and makes a determination of a return provision for sales made to distributors and retailers based on current channel inventory levels and historical return patterns. Certain sales to distributors or retailers are made on a consignment basis. Revenue for consignment sales are not recognized until sell through to the final customer is established. Certain revenues are booked net of revenue sharing payments. Sales directly to end-users are recognized upon shipment. End users have a thirty day right of return, but such returns are reasonably estimable and have historically been immaterial. We also provide technical support to our customers. Such costs have historically been insignificant.
For our Productivity & Graphics sales, the cost of sales incentives the Company offers without charge to customers that can be used in, or that are exercisable by a customer as a result of, a single exchange transaction is accounted for as a reduction of revenue as required by FASB ASC Topic No. 605-50, Revenue Recognition-Customer Payments and Incentives. We use historical redemption rates to estimate the cost of customer incentives. Total sales incentives were $0.5 million, $1.2 million and $0.9 million for the years ended December 31, 2014, 2013 and 2012, respectively.
Advertising costs are expensed as incurred. Advertising expenses were $0.3 million, $0.4 million, and $0.6 million for the years ended December 31, 2014, 2013 and 2012, respectively.
The Company accounts for all stock-based payment awards made to employees and directors based on their fair values and recognized as compensation expense over the vesting period using the straight-line method over the requisite service period for each award as required by FASB ASC Topic No. 718, Compensation-Stock Compensation.
The Company calculates earnings per share (“EPS”) as required by FASB ASC Topic No. 260, Earning Per Share. Basic EPS is calculated by dividing the net income available to common stockholders by the weighted average number of common shares outstanding for the period, excluding common stock equivalents. Diluted EPS is computed by dividing the net income available to common stockholders by the weighted average number of common shares outstanding for the period plus the weighted average number of dilutive common stock equivalents outstanding for the period determined using the treasury-stock method. For purposes of this calculation, common stock subject to repurchase by the Company and options are considered to be common stock equivalents and are only included in the calculation of diluted earnings per share when their effect is dilutive.

F-11
Year Ended December 31,2014 2013 2012
Numerator:Net loss available to common stockholders ($11,799) ($27,953) ($25,463)
Denominator:Weighted average shares outstanding - basic 40,649 36,982 35,849
Potential common shares - options (treasury stock method) - - -
Weighted average shares outstanding - diluted 40,649 36,982 35,849
Shares excluded (anti-dilutive) 150 2 174
Shares excluded due to an exercise price greater than weighted average stock price for the period 1,511 2,150 1,453
Net loss per common share: Basic ($0.29) ($0.76) ($0.71)
Diluted ($0.29) ($0.76) ($0.71)
(in thousands, except per share amounts)
In August 2014, the FASB issued Accounting Standards Update (“ASU”) No. 2014-15, Presentation of Financial Statements-Going Concern (Subtopic 205-40). The Update provides U.S. GAAP guidance on management’s responsibility in evaluating whether there is substantial doubt about a company’s ability to continue as a going concern and about related footnote disclosures. For each reporting period, management will be required to evaluate whether there are conditions or events that raise substantial doubt about a company’s ability to continue as a going concern within one year from the date the financial statements are issued. The amendments in this Update are effective for the annual period ending after December 15, 2016, and for annual periods and interim periods thereafter. Early application is permitted. We will be evaluating the impact of this guidance on our consolidated financial statements.
In May 2014, the FASB issued ASU No. 2014-09, Revenue from Contracts with Customers (Topic 606). The amendments to this Update supersede nearly all existing revenue recognition guidance under U.S. GAAP. The core principle of this Topic is to recognize revenues when promised goods or services are transferred to customers in an amount that reflects the consideration that is expected to be received for those goods or services. This Topic defines a five step process to achieve this core principle and, in doing so, it is possible more judgment and estimates may be required within the revenue recognition process than required under existing U.S. GAAP including identifying performance obligations in the contract, estimating the amount of variable consideration to include in the transaction price and allocating the transaction price to each separate performance obligation. For all entities, the amendments in this Update are effective for annual periods and interim periods within those annual periods beginning after December 15, 2016. Earlier adoption is not permitted. An entity will be able to use either of two adoption methods: (1) retrospective to each prior reporting period presented with the option to elect certain practical expedients as defined within this Topic; or (2) retrospective with the cumulative effect of initially applying this Topic recognized at the date of initial application and providing certain additional disclosures as defined per this Topic. We will be evaluating the impact of this guidance on our consolidated financial statements.

F-12
On May 6, 2014, the Board of Directors approved a plan of restructuring intended to streamline and flatten the Company’s organization, reduce overall headcount by approximately 20% and reduce its overall cost structure by approximately $2.0 million per quarter. The restructuring plan resulted in special charges totaling $1.8 million recorded during the three month period ended June 30, 2014. These charges were for non-cash stock-based compensation expense of $1.3 million, severance costs for affected employees of $0.4 million, and other related costs of $0.1 million. The restructuring plan was implemented primarily during the three month period ending June 30, 2014 and resulted in a negative cash impact of approximately $0.4 million through December 31, 2014. Following is the activity in our restructuring liability account through the period ended December 31, 2014 (in thousands).
December 31, 2013 December 31, 2014Balance Provision, net Usage Balance
One-time employee termination benefits -$ 1,697$ (1,697)$ -$ Fixed asset write-offs, transition travel, other - 104 (15) 89 Total -$ 1,801$ (1,712)$ 89$
On July 25, 2013, the Board of Directors approved a plan of restructuring intended to bring the Company’s operating expenses better in line with revenues. The restructuring plan involved a realignment of organizational structures, facility consolidations/closures and headcount reductions of approximately 26% of the Company’s worldwide workforce. The restructuring plan was implemented primarily during the three month period ended September 30, 2013 and resulted in annualized savings of approximately $16.0 million.
The restructuring plan resulted in special charges totaling $5.6 million recorded in the year ended December 31, 2013. These charges were for lease/rental terminations of $3.3 million, severance costs for affected employees of $1.1 million, equipment and improvements write-offs as a result of our lease/rental terminations of $1.0 million and other related costs of $0.2 million. All are cash expenditures except for the equipment and improvements write-offs. Approximately $1.1 million of cash expenditures were paid out in 2014, and the remaining cash expenditures will be paid in future years.
In the year ended December 31, 2014, we increased the reserve by $0.6 million due to changes in our assumptions on future sublease income on our lease terminations of $0.8 million, partially offset by adjustments to our one-time employee termination benefits.
Following is the activity in our restructuring liability for the year ended December 31, 2014 (in thousands):
December 31, 2013 December 31, 2014Balance Provision-net Usage Balance
One-time employee termination benefits 215$ (194)$ (21)$ -$ Lease/rental terminations 3,115 817 (1,132) 2,800Fixed asset write-offs, transition travel, other 38 15 (53) 0 Total 3,368$ 638$ (1,206)$ 2,800$

F-13
We undertook a restructuring in the fiscal year 2012. Following is the activity in our restructuring liability account for the year ended December 31, 2014 (in thousands):
December 31, 2013 December 31, 2014Balance Provision,net Usage Balance
One-time employee termination benefits 4$ (4)$ -$ -$ Total 4$ (4)$ -$ -$
For all of these restructuring liabilities, those to be paid within 12 months are included in the accrued liabilities line item on the balance sheet and total $0.9 million. $2.0 million of restructuring is included in the deferred rent and other long-term liabilities line item on the balance sheet.
Short-term investments consist of U.S. government agency and government sponsored enterprise obligations. The Company accounts for these short-term investments as required by FASB ASC Topic No. 320, Investments-Debt and Equity Securities. These debt and equity securities are not classified as either held-to-maturity securities or trading securities. As such, they are classified as available-for-sale securities. Available-for-sale securities are recorded at fair value, with unrealized gains or losses recorded as a separate component of accumulated other comprehensive income in stockholders’ equity until realized. Available-for-sale securities with contractual maturities of less than 12 months were as follows (in thousands):
December 31, 2014 December 31, 2013
Amortized Gross Amortized Grosscost basis unrealized loss Fair value cost basis unrealized loss Fair value
Corporate bonds and notes 1,000$ (1)$ 999$ 919$ (1)$ 918$ Government securities/money market 1,881 - 1,881 2,160 - 2,160
Total 2,881$ (1)$ 2,880$ 3,079$ (1)$ 3,078$
There were no realized gains (losses) recognized in interest and other income for the years ended December 31, 2014 and 2013. There was a de minimis amount of realized gains recognized for the year ended December 31 2012.
Equipment and improvements consist of the following (in thousands):
December 31,2014 2013
Computer hardware, software, and equipment 16,143$ 16,529$ Leasehold improvements 5,170 5,317 Office furniture and fixtures 1,213 1,213
22,526 23,059 Less accumulated depreciation and amortization (18,253) (16,036)
Equipment and improvements, net 4,273$ 7,023$

F-14
Depreciation and amortization expense on equipment and improvements was $2.9 million, $4.0 million and $4.4 million for the years ended December 31, 2014, 2013 and 2012 respectively.
The Company recorded an impairment charge related to our restructuring against certain equipment and improvements in the amount of $1.0 million for the year ended December 31, 2013. See Note 2 above, “Restructuring.”
These are office rent deposits.
Accrued liabilities consist of the following (in thousands):
December 31,
2014 2013
Salaries and benefits 2,779$ 3,651$
Restructuring 912 1,978
Pennsylvania grant liability 1,000 1,000
Royalties and revenue sharing 835 803
Income taxes 160 176
Marketing expenses, rebates and other 66 126
Total accrued liabilities 5,752$ 7,734$
Deferred rent and other long term liabilities consist of the following (in thousands):
December 31,2014 2013
Deferred rent 1,643$ 1,986$ Restructuring - beyond one year 1,977 1,394Sublease deposits 23 - Deferred revenue - long term - 3Total deferred rent and other long term liabilities 3,643$ 3,383$
Income (loss) before provision for income taxes was generated from the following sources (in thousands):
Year Ended December 31, 2014 2013 2012
Domestic (11,867)$ (27,968)$ (25,269)$ Foreign 117 168 (428) Total income (loss) before provision for income taxes (11,750)$ (27,800)$ (25,697)$

F-15
A summary of the income tax expense is as follows (in thousands):
Year Ended December 31, 2014 2013 2012
Current: Federal $ - $ - 50$ State 5 (19) (440) Foreign 44 172 156 Total current 49 153 (234)
Deferred: Federal - - - State - - - Foreign - - -Total deferred - - -
Total provision 49$ 153$ (234)$
A reconciliation of the provision for income taxes to the amount of income tax expense that would result from applying the federal statutory rate to the profit before income taxes is as follows:
Year Ended December 31, 2014 2013 2012
Federal statutory rate 35% 35% 35%State tax, net of federal benefit (1) 4 3
Equity compensation (7) (3) (2)
R&D tax credit - - -Other - 2 (4)Change in valuation allowance (28) (39) (31)
(1)% (1)% 1%
The major components of the Company’s deferred tax assets and liabilities are as follows (in thousands):

F-16
2014 2013Deferred income tax assetsNet operating loss carry forwards 44,754$ 38,204$ Credit carry forwards 3,708 3,708Fixed Assets 1,466 1,498Intangibles 23,029 26,287Equity based compensation 279 301Nondeductible accruals 2,382 2,485Various reserves 149 162Other 51 36Valuation Allowance (75,744) (72,582)Total deferred income taxes - net 74 99
Deferred income tax liabilitiesPrepaid expenses (74) (101)Total deferred income liabilties (74) (101)
Net deferred income tax assets (liabilities) $ - (2)$
Year Ended December 31,
The Company has federal and state net operating loss (“NOL”) carryforwards of approximately $101.2 million and $110.4 million, respectively, at December 31, 2014, to reduce future cash payments for income taxes. Of the $101.2 million of NOL carryforwards at December 31, 2014, $0.5 million relates to the excess tax benefits from employee restricted stock. Equity will be increased by $0.5 million if and when such excess tax benefits are ultimately realized. These federal NOL carryforwards will expire from 2024 through 2034 and state NOL carryforwards will expire 2015 through 2034. The Company also had $0.5 million of AMT credit carryforwards with an indefinite life, available to offset regular federal income tax requirements.
The Company has federal and state tax credit carryforwards of approximately $2.5 million and $0.7 million, respectively, at December 31, 2014. These tax credits will begin to expire in 2027. To the extent that an ownership change has occurred under Internal Revenue Code Sections 382 and 383, the Company’s use of its loss carryforwards and credit carryforwards to offset future taxable income may be limited. At December 31, 2014 and 2013, the Company had unrecognized tax benefits, including interest and penalties of approximately $0.6 million for both years. The Company’s gross unrecognized tax benefits as of December 31, 2014 and 2013 and the changes in those balances are as follows (in thousands):
2014 2013Beginning Balance 592$ 592$ Increases for tax positions for current year - -
Increases/(Decreases) in tax positions for the prior year - -Gross Unrecognized tax benefits, ending balance 592$ 592$
Year Ended December 31,
We account for income taxes as required by FASB ASC Topic No. 740, Income Taxes. This Topic clarifies the accounting for uncertainty in income taxes recognized in an enterprise’s financial statements and prescribes a recognition threshold and measurement process for financial statement recognition and measurement of a tax position taken or expected to be taken in a tax return. The Topic also provides guidance on derecognition, classification, interest and penalties, accounting in interim periods, disclosure and
F-17
transition. The Topic requires an entity to recognize the financial statement impact of a tax position when it is more likely than not that the position will be sustained upon examination. The amount recognized is measured as the largest amount of benefit that is greater than fifty percent likely of being realized upon ultimate settlement. In addition, the Topic permits an entity to recognize interest and penalties related to tax uncertainties either as income tax expense or operating expenses. The Company has chosen to recognize interest and penalties related to tax uncertainties as income tax expense. The Company assesses whether a valuation allowance should be recorded against its deferred tax assets based on the consideration of all available evidence, using a “more likely than not” realization standard. The four sources of taxable income that must be considered in determining whether deferred tax assets will be realized are: (1) future reversals of existing taxable temporary differences (i.e., offset of gross deferred tax liabilities against gross deferred tax assets); (2) taxable income in prior carryback years, if carryback is permitted under the applicable tax law; (3) tax planning strategies and (4) future taxable income exclusive of reversing temporary differences and carryforwards. In assessing whether a valuation allowance is required, significant weight is to be given to evidence that can be objectively verified. A significant factor in the Company’s assessment is that the Company has been in a three-year historical cumulative loss as of the end of fiscal 2012. In addition, the Company is also in a loss for the year ending December 31, 2013 as well as the year ending December 31, 2014. These facts, combined with uncertain near-term market and economic conditions, reduced the Company’s ability to rely on projections of future taxable income in assessing the realizability of its deferred tax assets. After a review of the four sources of taxable income as of December 31, 2014 (as described above), and after consideration of the Company’s continuing cumulative loss position as of December 31, 2014, the Company recorded a valuation allowance related to its U.S.-based deferred tax assets of $75.7 million at December 31, 2014. During fiscal years 2014, 2013 and 2012, the valuation allowance on deferred tax assets increased by $3.2 million, $12.1 million and $7.2 million, respectively.
We recognized interest and penalties accrued related to unrecognized tax benefits in income tax expense. During the fiscal years 2014 and 2013, we recognized approximately $3,000 of interest and penalties each year. The cumulative interest and penalties at December 31, 2014 and 2013 were $44,000 and $41,000, respectively.
Unrecognized tax benefits of $0.2 million at December 31, 2014 would impact the effective tax rate. We anticipate a decrease in gross unrecognized tax benefits of approximately $0.2 million within the next twelve months based on federal, state, and foreign statute expirations.
The Company is subject to U.S. federal income tax as well as to income tax of multiple state jurisdictions. Federal income tax returns of the Company are subject to IRS examination for the 2012 and 2013 tax years. State income tax returns are subject to examination for a period of three to four years after filing. The Company closed their federal audit of 2011 loss carry back claim during the year with no impact to the financial statements. As of December 31, 2014, the Company had no outstanding tax audits. The outcome of tax audits cannot be predicted with certainty. If any issues addressed in the Company’s tax audits are resolved in a manner not consistent with management’s expectations, the Company could be required to adjust its provision for income tax in the period such resolution occurs.
The Company leases its buildings under operating leases that expire on various dates through 2022. Future minimum annual lease payments under such leases as of December 31, 2014 are as follows (in thousands):

F-18
Year Ending December 31, Operating2015 2,188$ 2016 1,8882017 1,5362018 1,5342019 1,508Beyond 3,080 Total 11,734$
As of December 31, 2014, $5.6 million of the remaining lease commitments expense has been accrued as part of the 2013 Restructuring Plan, partially offset by future estimated sublease income of $3.0 million.
Total rent expense was $1.2 million, $2.4 million and $2.7 million for the years ended December 31, 2014, 2013 and 2012, respectively. As a condition of our new lease in Pittsburgh, the landlord agreed to incentives of $40.00 per square foot, or a total of $2.2 million, for improvements to the space. These costs have been included in deferred rent in our long-term liabilities and are being amortized over the remaining lease term.
On September 26, 2011, we received $1.0 million from the State of Pennsylvania to help fund our agreement to start-up a new facility. The grant carried with it an obligation, or commitment, to employ at least 232 people within a three-year time period that ended on December 31, 2013. We received an extension of time to meet this employment commitment. The new deadline is now February 28, 2015. This grant contains conditions that would require us to return a pro-rata amount of the monies received if we fail to meet these conditions. As such, the monies have been recorded as a liability in the accrued liabilities line item on the balance sheet until we are irrevocably entitled to retain the monies, or until it is determined that we need to return a portion or all of the monies received.
The Company may become involved in various legal proceedings arising from its business activities. While management does not believe the ultimate disposition of these matters will have a material adverse impact on the Company’s consolidated results of operations, cash flows or financial position, litigation is inherently unpredictable, and depending on the nature and timing of these proceedings, an unfavorable resolution could materially affect the Company’s future consolidated results of operations, cash flows or financial position in a particular period.
During its normal course of business, the Company has made certain indemnities, commitments and guarantees under which it may be required to make payments in relation to certain transactions. These include: intellectual property indemnities to the Company’s customers and licensees in connection with the use, sale and/or license of Company products; indemnities to various lessors in connection with facility leases for certain claims arising from such facility or lease; indemnities to vendors and service providers pertaining to claims based on the negligence or willful misconduct of the Company; indemnities involving the accuracy of representations and warranties in certain contracts; and indemnities to directors and officers of the Company to the maximum extent permitted under the laws of the State of Delaware. In addition, the Company has made contractual commitments to employees providing for severance payments upon the occurrence of certain prescribed events. The Company may also issue a guarantee in the form of a standby letter of credit as security for contingent liabilities under certain customer contracts. The duration of these indemnities, commitments and guarantees

F-19
varies, and in certain cases, may be indefinite. The majority of these indemnities, commitments and guarantees may not provide for any limitation of the maximum potential for future payments the Company could be obligated to make. The Company has not recorded any liability for these indemnities, commitments and guarantees in the accompanying consolidated balance sheets.
Public companies are required to report financial and descriptive information about their reportable operating segments as required by FASB ASC Topic No. 280, Segment Reporting. The Company has two primary business units based on how management internally evaluates separate financial information, business activities and management responsibility. Wireless includes our QuickLink, NetWise and CommSuite family of products. Productivity & Graphics includes our consumer-based products: Poser, Anime Studio, Manga Studio, MotionArtist and StuffIt.
The following table shows the revenues generated by each business unit (in thousands):
2012
Wireless 31,276$ 35,853$ 37,154$
Productivity & Graphics 5,703 6,822 6,175
Total revenues 36,979 42,675 43,329 Cost of revenues 9,317 9,707 8,448 Gross profit 27,662$ 32,968$ 34,881$
Year Ended December 31,2014 2013
A summary of the Company’s customers that represent 10% or more of the Company’s net revenues is as follows:
Year Ended December 31,
2014 2013 2012Wireless:Sprint (& affiliates) 68.0% 53.1% 40.7%Verizon Wireless (& affiliates) 7.8% 13.0% 20.5%
Productivity & Graphics:FastSpring 11.2% 11.4% -
The customers listed above comprised 87%, 83% and 78% of our accounts receivable as of December 31, 2014, 2013 and 2012, respectively. Our major customers could reduce their orders of our products in favor of a competitor's product or for any other reason. The loss of any of our major customers or decisions by a significant customer to substantially reduce purchases could have a material adverse effect on our business.
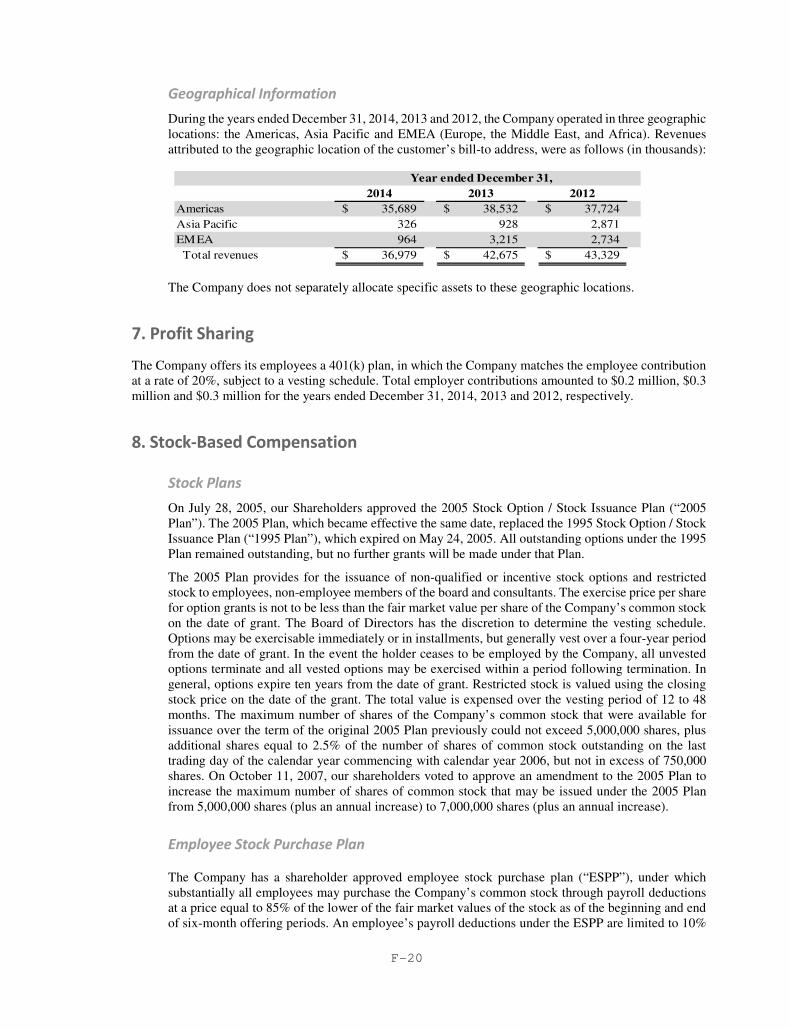
F-20
During the years ended December 31, 2014, 2013 and 2012, the Company operated in three geographic locations: the Americas, Asia Pacific and EMEA (Europe, the Middle East, and Africa). Revenues attributed to the geographic location of the customer’s bill-to address, were as follows (in thousands):
Year ended December 31,2014 2013 2012
Americas 35,689$ 38,532$ 37,724$ Asia Pacific 326 928 2,871EMEA 964 3,215 2,734 Total revenues 36,979$ 42,675$ 43,329$
The Company does not separately allocate specific assets to these geographic locations.
The Company offers its employees a 401(k) plan, in which the Company matches the employee contribution at a rate of 20%, subject to a vesting schedule. Total employer contributions amounted to $0.2 million, $0.3 million and $0.3 million for the years ended December 31, 2014, 2013 and 2012, respectively.
On July 28, 2005, our Shareholders approved the 2005 Stock Option / Stock Issuance Plan (“2005 Plan”). The 2005 Plan, which became effective the same date, replaced the 1995 Stock Option / Stock Issuance Plan (“1995 Plan”), which expired on May 24, 2005. All outstanding options under the 1995 Plan remained outstanding, but no further grants will be made under that Plan.
The 2005 Plan provides for the issuance of non-qualified or incentive stock options and restricted stock to employees, non-employee members of the board and consultants. The exercise price per share for option grants is not to be less than the fair market value per share of the Company’s common stock on the date of grant. The Board of Directors has the discretion to determine the vesting schedule. Options may be exercisable immediately or in installments, but generally vest over a four-year period from the date of grant. In the event the holder ceases to be employed by the Company, all unvested options terminate and all vested options may be exercised within a period following termination. In general, options expire ten years from the date of grant. Restricted stock is valued using the closing stock price on the date of the grant. The total value is expensed over the vesting period of 12 to 48 months. The maximum number of shares of the Company’s common stock that were available for issuance over the term of the original 2005 Plan previously could not exceed 5,000,000 shares, plus additional shares equal to 2.5% of the number of shares of common stock outstanding on the last trading day of the calendar year commencing with calendar year 2006, but not in excess of 750,000 shares. On October 11, 2007, our shareholders voted to approve an amendment to the 2005 Plan to increase the maximum number of shares of common stock that may be issued under the 2005 Plan from 5,000,000 shares (plus an annual increase) to 7,000,000 shares (plus an annual increase).
The Company has a shareholder approved employee stock purchase plan (“ESPP”), under which substantially all employees may purchase the Company’s common stock through payroll deductions at a price equal to 85% of the lower of the fair market values of the stock as of the beginning and end of six-month offering periods. An employee’s payroll deductions under the ESPP are limited to 10%

F-21
of the employee’s compensation and employees may not purchase more than the lesser of $25,000 of stock, or 1,000 shares, for any purchase period. Additionally, no more than 1,000,000 shares may be purchased under the plan.
The Company accounts for all stock-based payment awards made to employees and directors based on their fair values and recognized as compensation expense over the vesting period using the straight-line method over the requisite service period for each award as required by FASB ASC Topic No. 718, Compensation-Stock Compensation.
The assumptions used to compute the share-based compensation costs for the stock options granted during the years ended December 31, 2014, 2013 and 2012, respectively, using the Black-Scholes option pricing model, were as follows:
Year Ended December 31,2014 2013 2012
Weighted average grant-date fair value of stock options $0.57 $0.63 $0.80
AssumptionsRisk-free interest rate (weighted average) 1.2% 0.6% 0.5%Expected dividend yield - - -Weighted average expected life (years) 4 4 4Volatility (weighted average) 82.9% 68.1% 80.0%Forfeiture rate 25.5% 11.4% 13.7%
The risk-free interest rate assumption was based on the United States Treasury’s rates for U.S. Treasury zero-coupon bonds with maturities similar to those of the expected term of the award being valued. The Company assumed no dividend yield because it does not expect to pay dividends for the foreseeable future. The weighted average expected life is the vesting period for those options granted during that period. The average volatility is based on the actual historical volatility of our common stock. The forfeiture rate was based on modified employee turnover.
Grants of restricted stock are valued using the closing stock price on the date of grant. In the year ended December 31, 2014, a total of 50,000 shares of restricted stock, with a total value of $0.1 million, were granted to non-employee members of the Board of Directors. This cost will be amortized over a period of 12 months. In addition, 1.6 million shares of restricted stock, with a total value of $2.8 million, were granted to key officers and employees of the Company. This cost will be amortized over a period of 48 months.
The fair values are estimated at the beginning of each offering period using a Black-Scholes valuation model that uses the assumptions noted in the following table. The risk-free rate is based on the U.S. treasury yield curve in effect at the time of grant. Expected volatility was based on the historical volatility on the day of grant. Following is a schedule of the shares purchased, the fair value per share, and the Black-Scholes model assumptions for each offering period:

F-22
(Ending)O ffering Period Ended March 31, September 30, March 31, September 30, March 31,
2015 2014 2014 2013 2013Shares purchased for offering period 13,619 13,734 19,490 18,594Fair value per share $0.43 $0.83 $0.30 $0.44 $0.65
Assumptions
Risk-free interest rate (average) 0.40% 0.80% 0.40% 0.11% 0.14%Expected dividend yield - - - - -Weighted average expected life (years) 0.5 0.5 0.5 0.5 0.5Volatility (average) 109.0% 74.0% 44.0% 45.0% 74.0%
Stock-based non-cash compensation expenses related to stock options, restricted stock grants and the ESPP were recorded in the financial statements as follows (in thousands):
2014 2013 2012Cost of revenues 13$ 20$ 13$ Selling and marketing 270 766 865 Research and development 659 809 765 General and administrative 1,437 1,938 2,306 Restructuring expense 1,273 - - Total non-cash stock compensation expense 3,652$ 3,533$ 3,949$
Year Ended December 31,
Total share-based compensation for each year includes cash payment of income taxes related to grants of restricted stock in the amounts of $0.2 million, $0.4 million and $0.4 million for the years ended December 31, 2014, 2013 and 2012, respectively.
A summary of the Company’s stock options outstanding under the 2005 Plan as of December 31, 2014 and the activity during the years ended herein are as follows (in thousands except per share amounts):

F-23
Weighted Ave. AggregateShares Exercise Price Intrinsic Value
Outstanding as of December 31, 2011 2,167 11.03$ -$ (2,167 options exercisable at a weighted average exercise price of $11.03)Granted (weighted average fair value of $0.80) 826 1.39$ Exercised (32) 0.50$ Cancelled (686) 12.37$ Outstanding as of December 31, 2012 2,275 7.02$ -$ (1,474 options exercisable at a weighted average exercise price of $10.09)Granted (weighted average fair value of $0.63) 120 1.31$ Exercised - -$ Cancelled (225) 6.52$ Outstanding as of December 31, 2013 2,170 6.76$ -$ (1,573 options exercisable at a weighted average exercise price of $8.81)Granted (weighted average fair value of $0.57) 633 0.95$ Exercised (4) 1.38$ Cancelled (665) 5.98$ Outstanding as of December 31, 2014 2,134 5.29$ -$
Exercisable as of December 31, 2014 1,291 8.04$ -$
Vested and expected to vest at December 31, 2014 1,963 5.66$ -$
During the year ended December 31, 2014, options to acquire 4,000 shares were exercised resulting in cash proceeds to the Company of $6,000. The weighted-average grant-date fair value of options granted during the year ended December 31, 2014 was $0.57. As of December 31, 2014, there is $3.3 million of unrecognized compensation costs related to non-vested stock options and restricted stock granted under the Plan. At December 31, 2014, there were 1.6 million shares available for future grants under the 2005 Stock Issuance / Stock Option Plan.
A summary of the Company’s restricted stock awards outstanding under the 2005 Plan as of December 31, 2014, and the activity during years ended therein, are as follows (in thousands):
Number Weighted averageof shares grant date fair value
Unvested at December 31, 2011 1,355 3.21$ Granted 995 2.64$ Vested (611) 6.42$ Cancelled and forfeited (420) 8.73$ Unvested at December 31, 2012 1,319 4.60$ Granted 1,495 1.70$ Vested (752) 4.43$ Cancelled and forfeited (316) 3.00$ Unvested at December 31, 2013 1,746 2.48$ Granted 1,625 1.79$ Vested (1,442) 2.48$ Cancelled and forfeited (204) 1.79$ Unvested at December 31, 2014 1,725 1.91$
F-24
On August 15, 2014, the Company entered into a common stock purchase agreement with a number of accredited investors (“Investors”) in a private placement pursuant to which the Company issued and sold to the Investors 6,845,830 shares of its common stock at a price per share of $0.816. The transaction closed on August 20, 2014 and the Company realized gross proceeds of $5.6 million before deducting commissions and other expenses. Offering costs related to the transaction totaled $0.4 million, comprised of $0.2 million of commissions and $0.2 million of legal and other expenses, resulting in net proceeds of $5.2 million. The Company filed a registration statement with the SEC providing for the resale of the shares of Common Stock issued pursuant to the Purchase Agreement. The registration statement became effective on September 25, 2014.
In November 2011, the Company announced that its Board of Directors had approved a program authorizing the repurchase of up to five million shares of the Company's common stock over a period of up to two years. The Company repurchased 375,000 shares at a cost of $0.8 million during fiscal year 2012. The Company did not repurchase any shares in fiscal year 2013. The program ended on November 1, 2013.
The Company evaluates and discloses subsequent events as required by ASC Topic No. 855, Subsequent Events. The Topic establishes general standards of accounting for and disclosure of events that occur after the balance sheet date but before the financial statements are issued or are available to be issued.
Subsequent events have been evaluated as of the date of this filing and there are no further disclosures required.

F-25
The following financial information reflects all normal recurring adjustments, which are, in the opinion of management, necessary for a fair statement of the results of the interim periods. Summarized quarterly data for fiscal 2014 and 2013 are as follows (in thousands, except per share data):
1st Quarter 2nd Quarter 3rd Quarter 4th QuarterSelected quarterly financial data:Revenues 8,449$ 8,528$ 9,448$ 10,544$ Gross profit 6,029$ 6,077$ 7,247$ 8,309$ Operating income (loss) (5,134)$ (5,681)$ (1,144)$ 217$ Net income (loss) (5,167)$ (5,695)$ (1,142)$ 205$
Net (loss) per share, basic (1) (0.14)$ (0.15)$ (0.03)$ 0.00$
Weighted average shares outstanding, basic 37,714 38,518 41,225 45,053
Net (loss) per share, diluted (1) (0.14)$ (0.15)$ (0.03)$ 0.00$
Weighted average shares outstanding, diluted 37,714 38,518 41,225 45,053
1st Quarter 2nd Quarter 3rd Quarter 4th QuarterSelected quarterly financial data:Revenues 11,602$ 10,484$ 8,746$ 11,843$ Gross profit 9,158$ 8,083$ 6,254$ 9,473$ Operating (loss) (6,101)$ (7,248)$ (12,980)$ (1,501)$ Net (loss) (6,158)$ (7,244)$ (13,049)$ (1,502)$
Net (loss) per share, basic (1) (0.17)$ (0.19)$ (0.35)$ (0.04)$
Weighted average shares outstanding, basic 36,614 37,247 37,036 37,027
Net (loss) per share, diluted (1) (0.17)$ (0.19)$ (0.35)$ (0.04)$
Weighted average shares outstanding, diluted 36,614 37,247 37,036 37,027
Year ended December 31, 2013
Year ended December 31, 2014
(1) Basic and diluted net (loss) per share is computed independently for each of the quarters presented. Therefore, the sum of the quarterly per share amounts will not necessarily equal the total for the year.

(This Page Intentionally Left Blank)
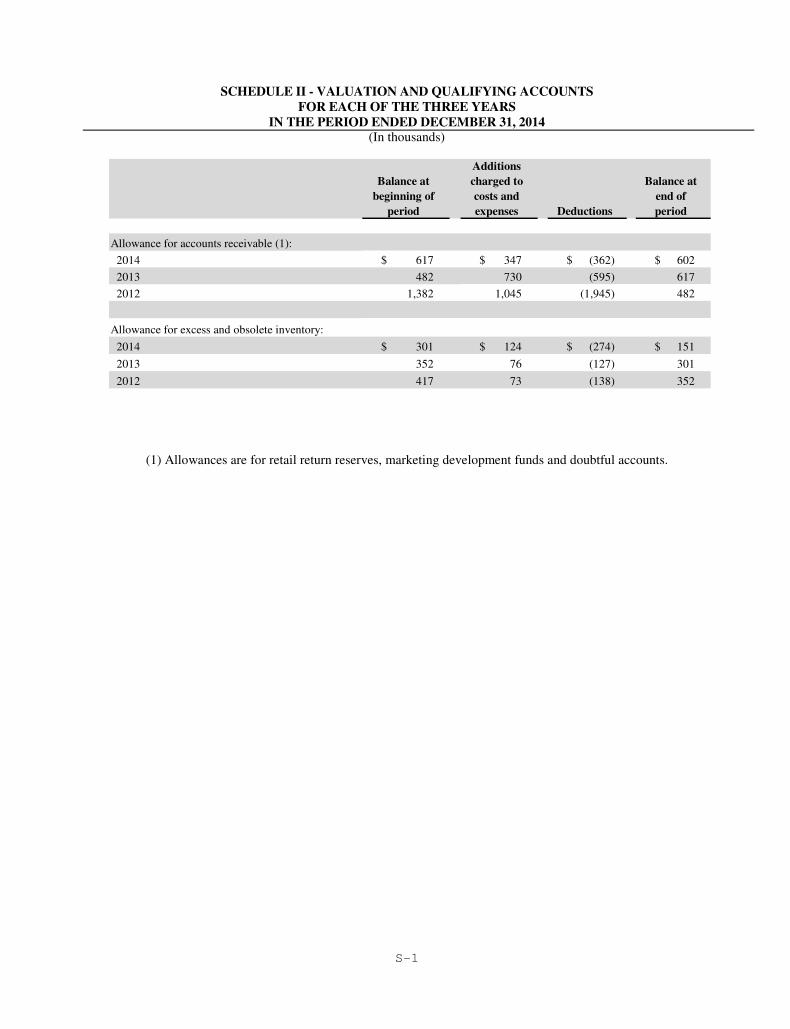
S-1
SCHEDULE II - VALUATION AND QUALIFYING ACCOUNTS FOR EACH OF THE THREE YEARS
IN THE PERIOD ENDED DECEMBER 31, 2014 (In thousands)
Additions Balance at charged to Balance at
beginning of costs and end of period expenses Deductions period
Allowance for accounts receivable (1):
2014 617$ 347$ (362)$ 602$
2013 482 730 (595) 617
2012 1,382 1,045 (1,945) 482
Allowance for excess and obsolete inventory:
2014 301$ 124$ (274)$ 151$
2013 352 76 (127) 301
2012 417 73 (138) 352
(1) Allowances are for retail return reserves, marketing development funds and doubtful accounts.

(This Page Intentionally Left Blank)
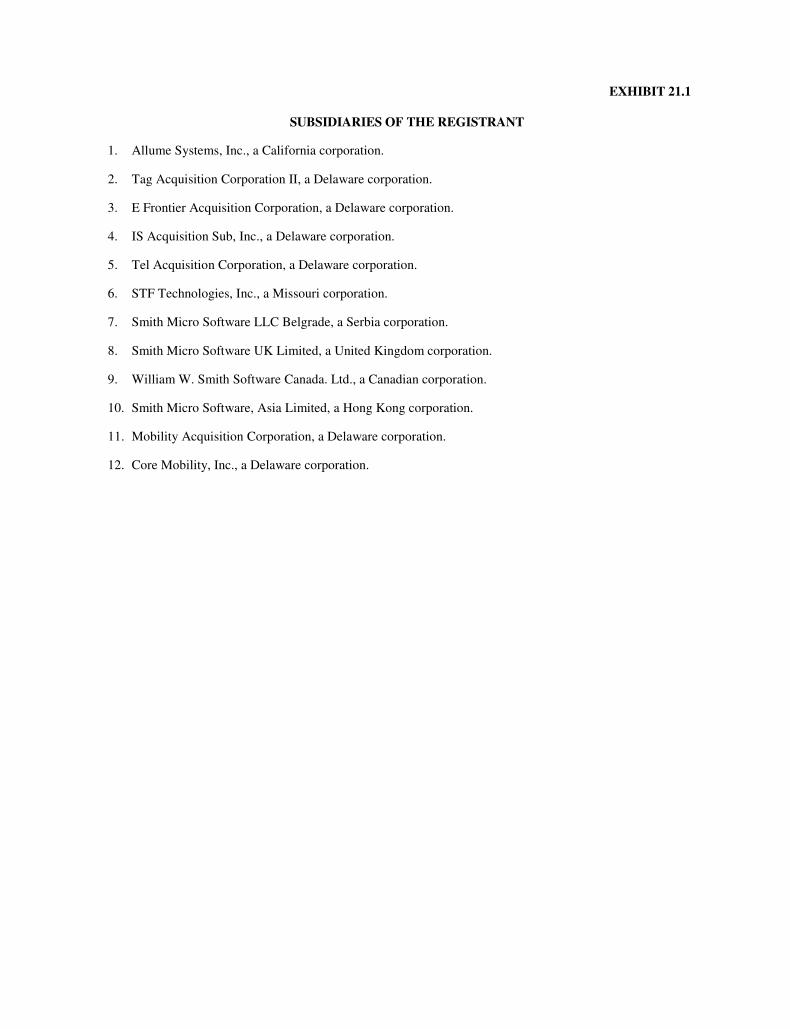
EXHIBIT 21.1
SUBSIDIARIES OF THE REGISTRANT
1. Allume Systems, Inc., a California corporation.
2. Tag Acquisition Corporation II, a Delaware corporation.
3. E Frontier Acquisition Corporation, a Delaware corporation.
4. IS Acquisition Sub, Inc., a Delaware corporation.
5. Tel Acquisition Corporation, a Delaware corporation.
6. STF Technologies, Inc., a Missouri corporation.
7. Smith Micro Software LLC Belgrade, a Serbia corporation.
8. Smith Micro Software UK Limited, a United Kingdom corporation.
9. William W. Smith Software Canada. Ltd., a Canadian corporation.
10. Smith Micro Software, Asia Limited, a Hong Kong corporation.
11. Mobility Acquisition Corporation, a Delaware corporation.
12. Core Mobility, Inc., a Delaware corporation.

(This Page Intentionally Left Blank)

EXHIBIT 23.1
CONSENT OF INDEPENDENT REGISTERED PUBLIC ACCOUNTING FIRM
We consent to the incorporation by reference in Registration Statement (Nos. 333-02418, 333-40106, 333-62134, 333-121330, 333-123042, 333-129132, 333-149222, 333-169671 and 333-179764) on Form S-8 and Registration Statement (Nos. 333-123821, 333-128695, 333-134611, 333-137408 and 333-198728) on Form S-3 and Registration Statement (No. 333-161659) on Form S-4 of Smith Micro Software, Inc. and subsidiaries of our report dated February 27, 2015, relating to our audit of the consolidated financial statements and the financial statement schedule, which appear in this Annual Report on Form 10-K of Smith Micro Software, Inc. and subsidiaries for the year ended December 31, 2014. /s/ SingerLewak LLP Los Angeles, California February 27, 2015

(This Page Intentionally Left Blank)
EXHIBIT 31.1
CERTIFICATION PURSUANT TO SECTION 302 OF THE SARBANES-OXLEY ACT OF 2002
(18 U.S.C. SECTION 1350) I, William W. Smith, Jr., certify that:
1. I have reviewed this annual report on Form 10-K of Smith Micro Software, Inc.;
2. Based on my knowledge, this report does not contain any untrue statement of a material fact or omit to state a material fact necessary to make the statements made, in light of the circumstances under which such statements were made, not misleading with respect to the period covered by this report;
3. Based on my knowledge, the financial statements, and other financial information included in this report, fairly present in all material respects the financial condition, results of operations and cash flows of the registrant as of, and for, the periods presented in this report;
4. The registrant’s other certifying officer(s) and I are responsible for establishing and maintaining disclosure
controls and procedures (as defined in Exchange Act Rules 13a-15(e) and 15d-15 (e)) and internal control over financial reporting (as defined in Exchange Act Rules 13a-15(f) and 15d-15(f)) for the registrant and have:
a. Designed such disclosure controls and procedures, or caused such disclosure controls and procedures to be designed under our supervision, to ensure that material information relating to the registrant, including its consolidated subsidiaries, is made known to us by others within those entities, particularly during the period in which this report is being prepared;
b. Designed such internal control over financial reporting, or caused such internal control over
financial reporting to be designed under our supervision, to provide reasonable assurance regarding the reliability of financial reporting and the preparation of financial statements for external purposes in accordance with generally accepted accounting principles;
c. Evaluated the effectiveness of the registrant’s disclosure controls and procedures and presented in
this report our conclusions about the effectiveness of the disclosure controls and procedures, as of the end of the period covered by this report based on such evaluation; and
d. Disclosed in this report any change in the registrant’s internal control over financial reporting that
occurred during the registrant’s most recent fiscal quarter (the registrant’s fourth fiscal quarter in the case of an annual report) that has materially affected, or is reasonably likely to materially affect, the registrant’s internal control over financial reporting; and
5. The registrant’s other certifying officer(s) and I have disclosed, based on our most recent evaluation of
internal control over financial reporting, to the registrant’s auditors and the audit committee of the registrant’s board of directors (or persons performing the equivalent functions):
a. All significant deficiencies and material weaknesses in the design or operation of internal control over financial reporting which are reasonably likely to adversely affect the registrant’s ability to record, process, summarize and report financial information; and
b. Any fraud, whether or not material, that involves management or other employees who have a
significant role in the registrant’s internal control over financial reporting.
Date: February 27, 2015 /s/ William W. Smith, Jr. William W. Smith, Jr. President and Chief Executive Officer (Principal Executive Officer)

(This Page Intentionally Left Blank)
EXHIBIT 31.2
CERTIFICATION PURSUANT TO SECTION 302 OF THE SARBANES-OXLEY ACT OF 2002
(18 U.S.C. SECTION 1350) I, Steven M. Yasbek, certify that:
1. I have reviewed this annual report on Form 10-K of Smith Micro Software, Inc.;
2. Based on my knowledge, this report does not contain any untrue statement of a material fact or omit to state a material fact necessary to make the statements made, in light of the circumstances under which such statements were made, not misleading with respect to the period covered by this report;
3. Based on my knowledge, the financial statements, and other financial information included in this report, fairly present in all material respects the financial condition, results of operations and cash flows of the registrant as of, and for, the periods presented in this report;
4. The registrant’s other certifying officer(s) and I are responsible for establishing and maintaining disclosure
controls and procedures (as defined in Exchange Act Rules 13a-15(e) and 15d-15 (e)) and internal control over financial reporting (as defined in Exchange Act Rules 13a-15(f) and 15d-15(f)) for the registrant and have:
a. Designed such disclosure controls and procedures, or caused such disclosure controls and procedures to be designed under our supervision, to ensure that material information relating to the registrant, including its consolidated subsidiaries, is made known to us by others within those entities, particularly during the period in which this report is being prepared;
b. Designed such internal control over financial reporting, or caused such internal control over
financial reporting to be designed under our supervision, to provide reasonable assurance regarding the reliability of financial reporting and the preparation of financial statements for external purposes in accordance with generally accepted accounting principles;
c. Evaluated the effectiveness of the registrant’s disclosure controls and procedures and presented in
this report our conclusions about the effectiveness of the disclosure controls and procedures, as of the end of the period covered by this report based on such evaluation; and
d. Disclosed in this report any change in the registrant’s internal control over financial reporting that
occurred during the registrant’s most recent fiscal quarter (the registrant’s fourth fiscal quarter in the case of an annual report) that has materially affected, or is reasonably likely to materially affect, the registrant’s internal control over financial reporting; and
5. The registrant’s other certifying officer(s) and I have disclosed, based on our most recent evaluation of
internal control over financial reporting, to the registrant’s auditors and the audit committee of the registrant’s board of directors (or persons performing the equivalent functions):
a. All significant deficiencies and material weaknesses in the design or operation of internal control over financial reporting which are reasonably likely to adversely affect the registrant’s ability to record, process, summarize and report financial information; and
b. Any fraud, whether or not material, that involves management or other employees who have a
significant role in the registrant’s internal control over financial reporting. Date: February 27, 2015 /s/ Steven M. Yasbek Steven M. Yasbek Vice President and Chief Financial Officer (Principal Financial Officer)

(This Page Intentionally Left Blank)

EXHIBIT 32.1
CERTIFICATIONS OF THE CHIEF EXECUTIVE OFFICER AND CHIEF FINANCIAL OFFICER PURSUANT TO SECTION 906 OF THE SARBANES-OXLEY ACT OF 2002
Each of the undersigned hereby certifies, in accordance with 18 U.S.C. 1350, as adopted pursuant to Section 906 of the Sarbanes-Oxley Act of 2002, in his capacity as an officer of Smith Micro Software, Inc., that, to his knowledge, the Annual Report of Smith Micro Software, Inc. on Form 10-K for the period ended December 31, 2014, fully complies with the requirements of Section 13(a) of the Securities Exchange Act of 1934 and that the information contained in such report fairly presents, in all material respects, the financial condition and results of operation of the company.
Date: February 27, 2015 /s/ William W. Smith, Jr.
William W. Smith, Jr. President and Chief Executive Officer (Principal Executive Officer)
Date: February 27, 2015 /s/ Steven M. Yasbek Steven M. Yasbek Vice President and Chief Financial Officer (Principal Financial Officer)
A signed original of this written statement required by Section 906 has been provided to Smith Micro Software, Inc. and will be retained by Smith Micro Software, Inc. and furnished to the Securities and Exchange Commission or its staff upon request.

(This Page Intentionally Left Blank)


B O A R D O F D I R E C T O R S
William W. Smith, Jr.
Chairman, President &
Chief Executive Officer
Steven L. Elfman
Director
Andrew Arno
Director
Samuel Gulko
Director
Thomas G. Campbell
Director
Gregory J. Szabo
Director
O F F I C E R S & S E N I O R M A N A G E M E N T
Rick Carpenter
Senior Vice President of Engineering
Jim Mains
Chief Strategy Officer
Steven M. Yasbek
Chief Financial Officer
Carla Fitzgerald
Chief Marketing Officer
Ken Shebek
Chief Information Officer
Jeff Hornung
Vice President of
Product Management
David P. Sperling
Chief Technology Officer
C O N T A C T I N F O R M A T I O N
Corporate Headquarters
51 Columbia
Aliso Viejo, CA 92656
(949) 362-5800
Transfer Agent & Registrar
Computershare Trust Company N.A.
250 Royall Street
Canton, MA 02021
(800) 962-4284
www.computershare.com
Legal Counsel
Loeb & Loeb LLP
Los Angeles, CA 90071
Auditors
SingerLewak
Los Angeles, CA 90024
A D D I T I O N A L I N F O R M A T I O N
Smith Micro maintains an investor relations program. If you have any questions or would like
additional information concerning the operations or financial statements, please contact:
Todd Kehrli
MKR Group, Inc.
12198 Ventura Blvd., Suite 200
Los Angeles, CA 91604
(323) 468-2300

Smith Micro Software, Inc. • 51 Columbia, Aliso Viejo, California 92656 USA • +1 949 362 5800 • www.smithmicro.com • NASDAQ: SMSI