Embed Size (px)
Citation preview

Haptic Display Device
John MacDuffie Woodburn
Michael Vitale
Thomas Santoro – Team Leader
Villanova University

Agenda
• Purpose• Theory• Design• Testing• Results• Conclusions• Acknowledgements• Questions

Purpose
•Medical Field•Console Games
•Visually Handicapped
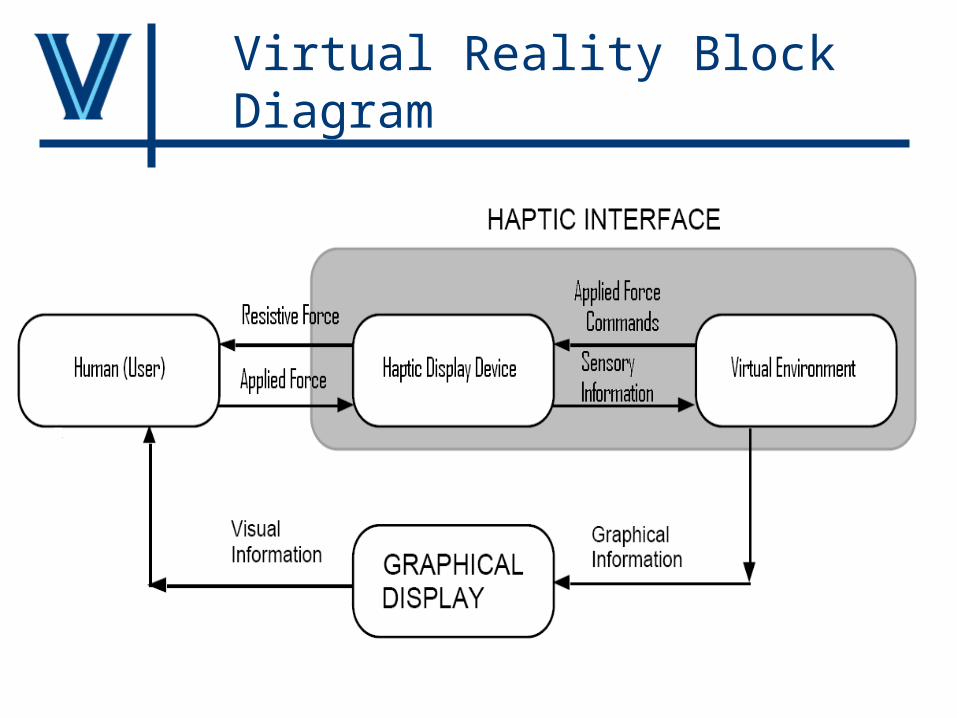
Virtual Reality Block Diagram
Theory, Active vs Passive
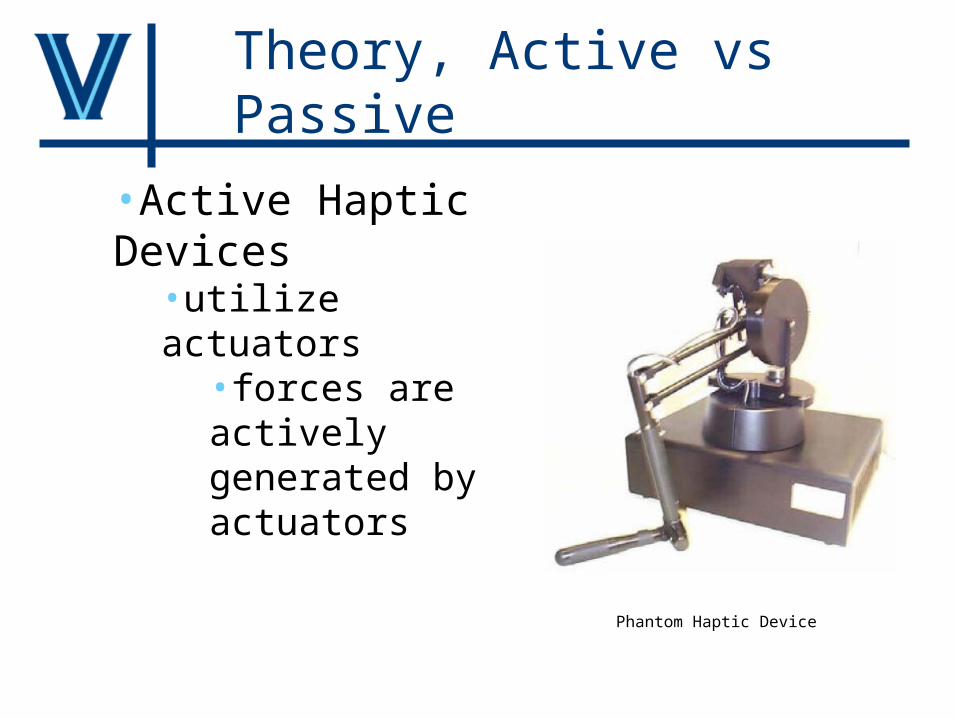
•Active Haptic Devices
•utilize actuators•forces are actively generated by actuators
Phantom Haptic Device
Theory, Active vs Passive
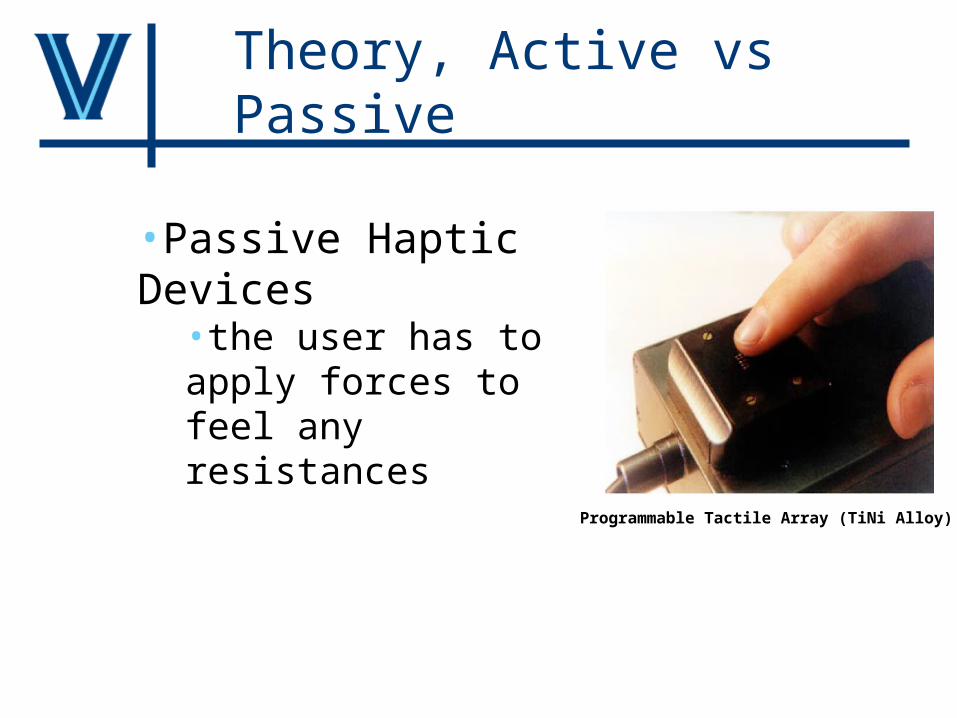
•Passive Haptic Devices
•the user has to apply forces to feel any resistances
Programmable Tactile Array (TiNi Alloy)
Theory
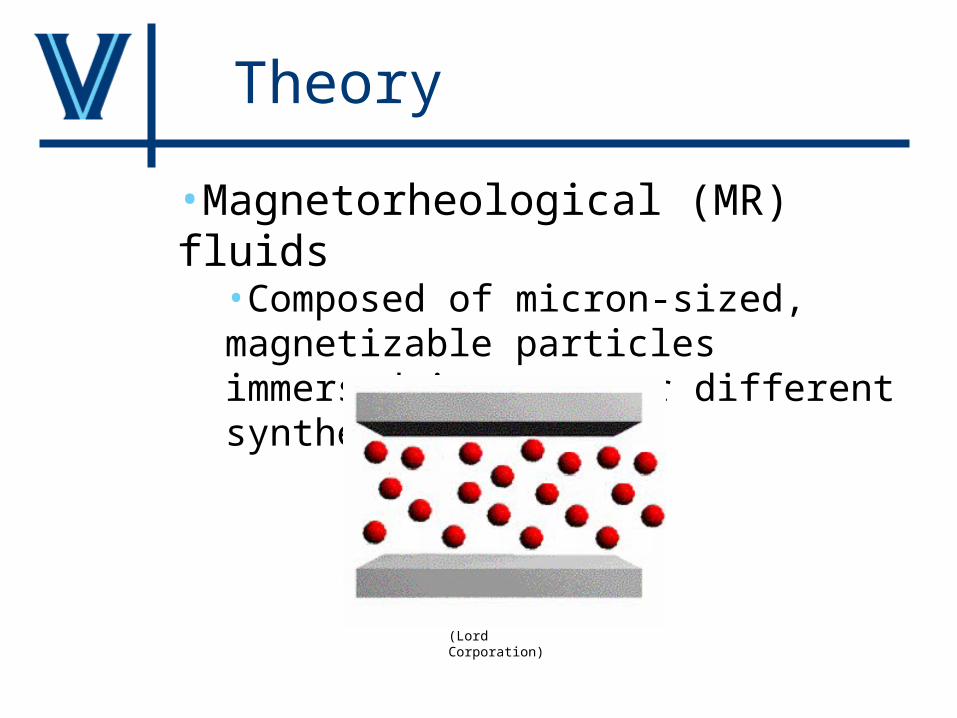
•Magnetorheological (MR) fluids•Composed of micron-sized, magnetizable particles immersed in water or different synthetic oils
(Lord Corporation)

Theory
•Magnetorheological (MR) fluids when a magnetic field is applied
(Lord Corporation)

Theory
•Magnetorheological (MR) fluids•Exposure to an external magnetic field, induces in the fluid, a change in rheological behavior
(Lord Corporation)
Theory
•Device is similar to a damper •Cylinder is used as a core for the coil of the electromagnet
• Electrical current is applied to the coil• An electromagnet changes the density of the MR fluid
•Stiffening of the fluid changes the resistance felt by the user as he/she.
Design
•Requirements and limitations:•Heat generation by the electromagnet•Creating an electromagnet that will affect the viscosity of the MR fluid•Simple Design for manufacturing

Preliminary Designs

Preliminary Designs

Final Design
•Equilibrium State of Design
Outside View Inside View

Final Design
•Design Compressed
Outside View Inside View
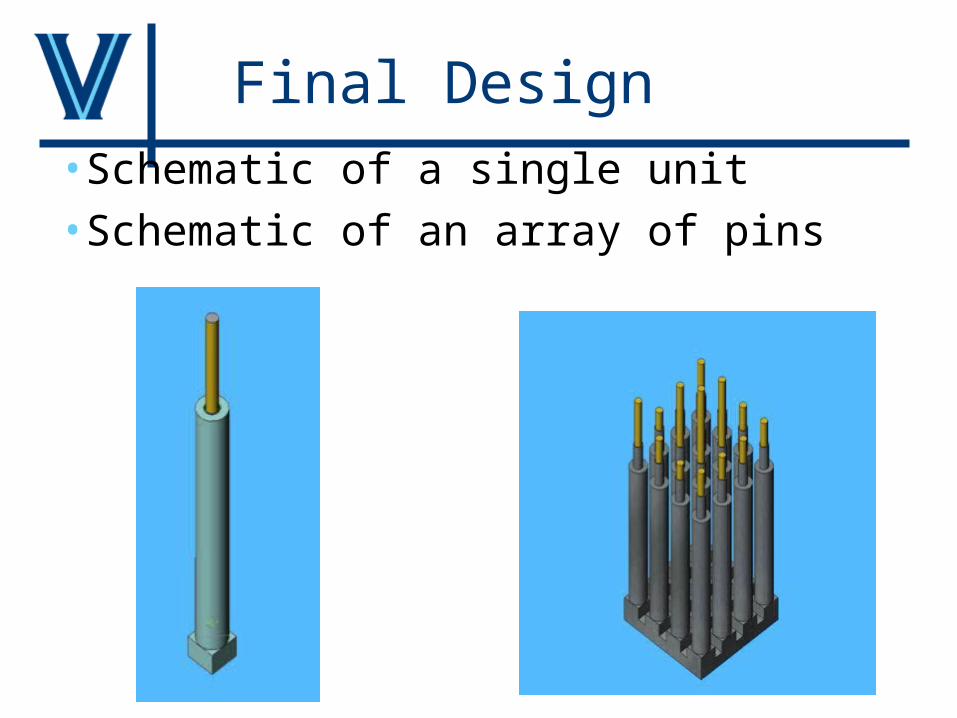
Final Design•Schematic of a single unit•Schematic of an array of pins
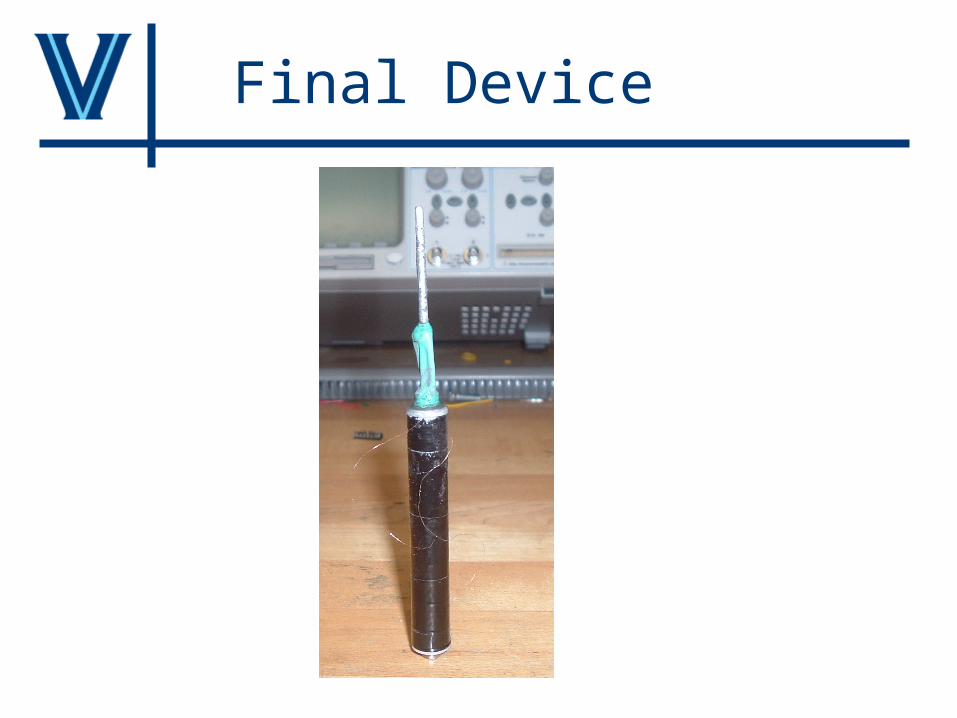
Final Device
Device Working
•As weight is applied the pin moves down with no applied current•As weight is applied it is harder to move the pin down as the applied current is increased

Testing•Achieve a characterization that will give the input-output relationship from the current/voltage to the resistance offered. •This information can be used for resistance generation to provide haptic interactions.
Testing
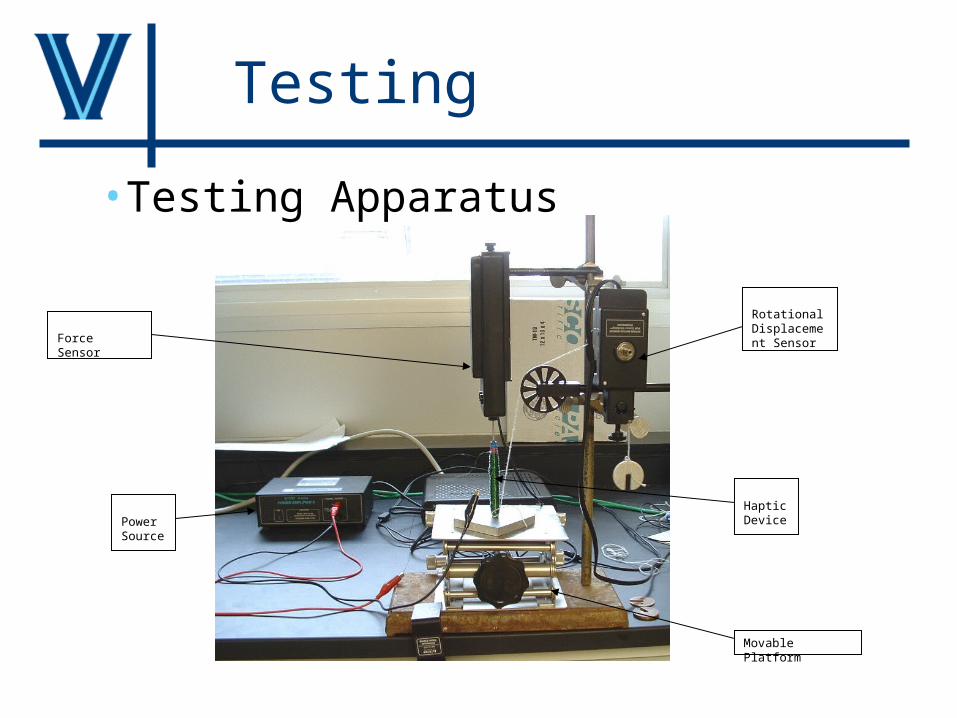
Force Sensor
Rotational Displacement Sensor
Power Source
Haptic Device
Movable Platform
•Testing Apparatus
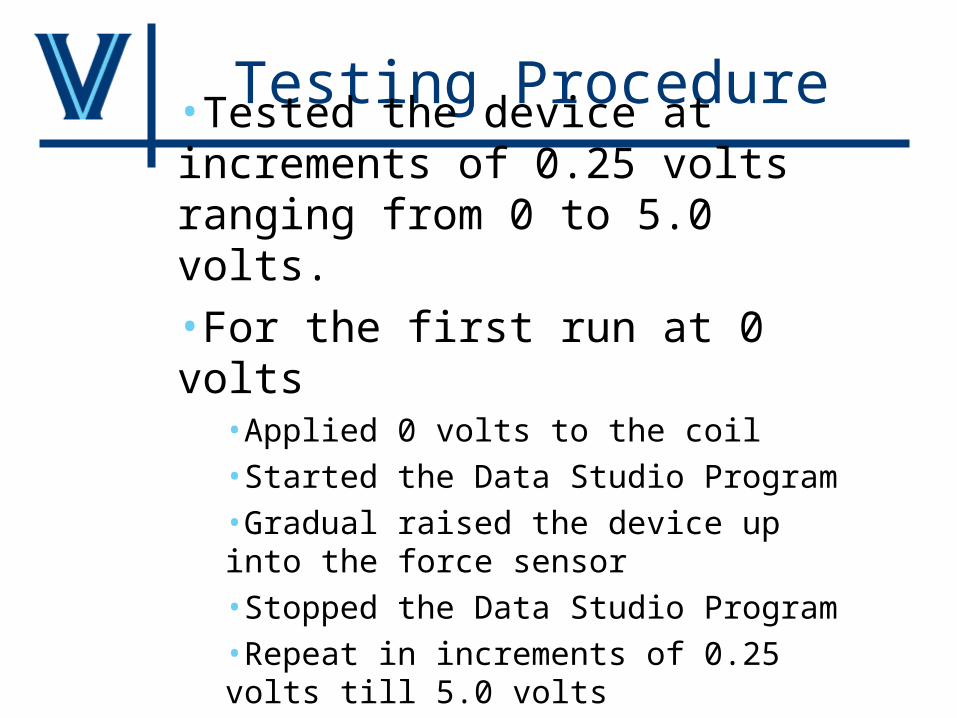
Testing Procedure•Tested the device at increments of 0.25 volts ranging from 0 to 5.0 volts. •For the first run at 0 volts
•Applied 0 volts to the coil•Started the Data Studio Program•Gradual raised the device up into the force sensor•Stopped the Data Studio Program•Repeat in increments of 0.25 volts till 5.0 volts
Testing Procedure
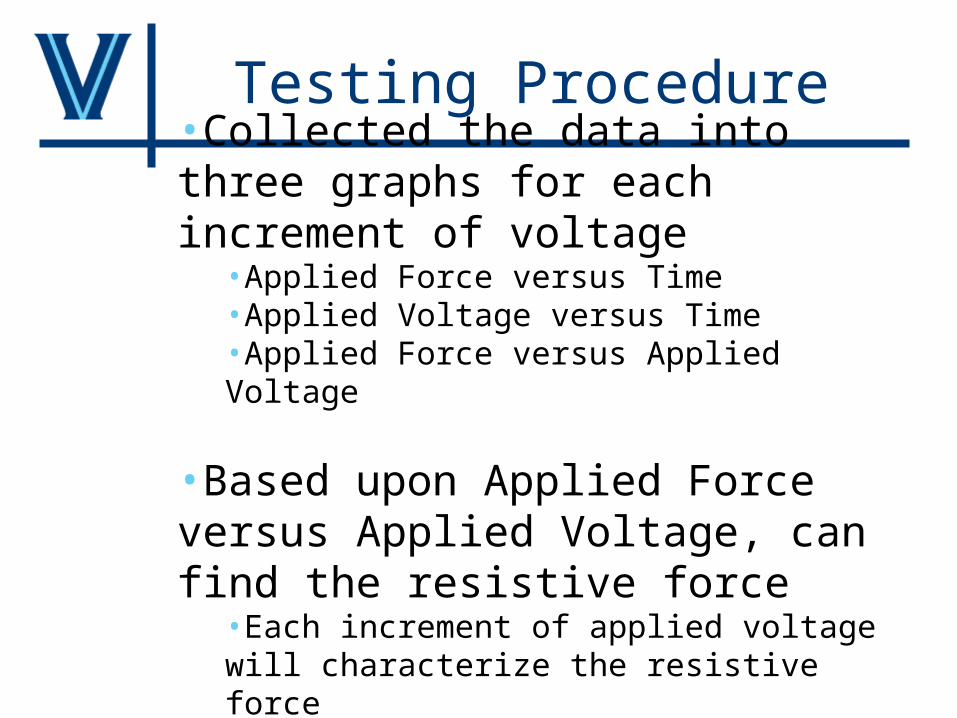
•Collected the data into three graphs for each increment of voltage
•Applied Force versus Time•Applied Voltage versus Time•Applied Force versus Applied Voltage
•Based upon Applied Force versus Applied Voltage, can find the resistive force
•Each increment of applied voltage will characterize the resistive force

Testing Parameters
•Need to measure the applied force to the pin for a constant applied voltage, Fv
•Need to measure the displacement of the pin for a constant applied voltage, Dv
•Need to record the applied voltage for each trial
Data
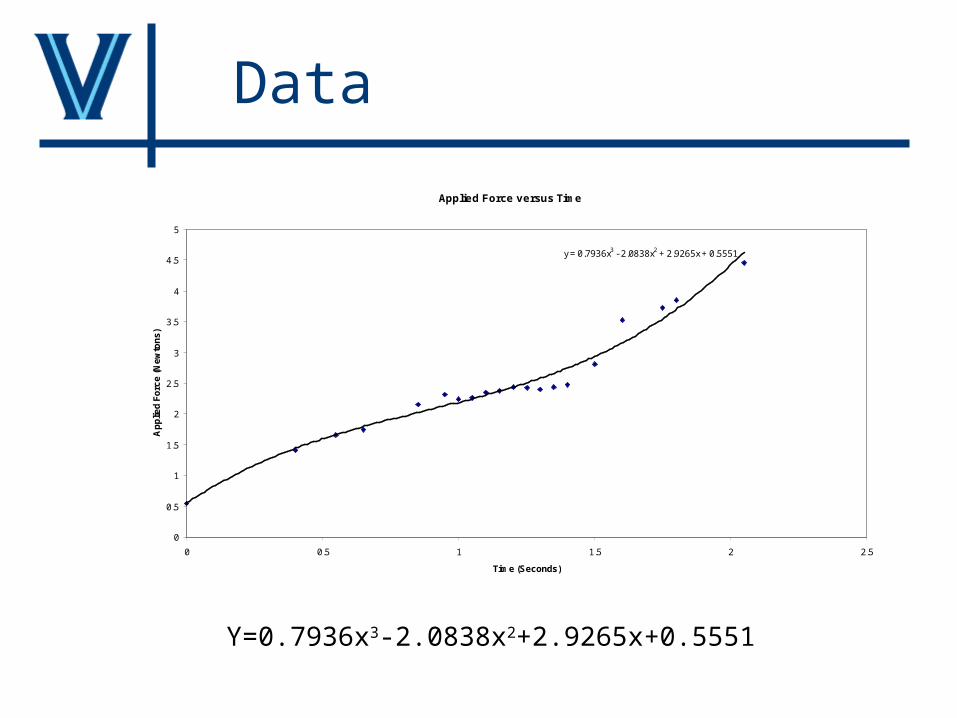
Applied Force versus Time
y = 0.7936x3 - 2.0838x2 + 2.9265x + 0.5551
0
0.5
1
1.5
2
2.5
3
3.5
4
4.5
5
0 0.5 1 1.5 2 2.5
Time (Seconds)
Ap
plie
d F
orc
e (
Ne
wto
ns
)
Y=0.7936x3-2.0838x2+2.9265x+0.5551

Data
Y=-9.4759x3+31.597x2-15.525x+1.038
Displacement versus Time
-5
0
5
10
15
20
25
0 0.5 1 1.5 2 2.5
Time (Second)
Dis
pla
ce
me
nt
(De
gre
es
)

Data
Applied Force versus Displacement (Applied 2.5 volts)
0
0.5
1
1.5
2
2.5
3
3.5
4
4.5
0 5 10 15 20 25
Displacement (Degrees)
Ap
pli
ed
Fo
rce
(N
ew
ton
s)

Results
Applied Voltage (Volts)
Applied Force (Newtons)
0 0.01
0.25 0.46
0.5 0.48
0.75 0.63
1 0.7
1.25 0.77
1.5 1
1.75 0.92
2 1.35
2.25 1.03
2.5 1.41
2.75 1.46
3 1.95
3.25 2.14
3.5 2.47
3.75 2.56
4 2.69
4.25 3.62
Y=0.0625x3-0.2698x2+0.8014x+0.1248
Applied Force versus Applied Voltage
0
0.5
1
1.5
2
2.5
3
3.5
4
0 0.5 1 1.5 2 2.5 3 3.5 4 4.5
Applied Voltage (Volts)
Ap
plie
d F
orc
e (
Ne
wto
ns
)
Conclusion
• Accomplished our goals
•Able to Characterize the MR fluid for the use of Haptic Display Device
• Simple part design for mass production

Acknowledgements
•Professor Dougherty - Advisor•Professor Rungun Rama Nathan•Professor Kroos•Chris Townend and Zack Nowosad •Art Viescas and Professor Vassiliou

Questions?
Thank you for your time and have a good
day


![Woodburn Firehouse Cookoff[1]](https://img.pdfslide.us/doc/110x75/55949d441a28ab41758b46a2/woodburn-firehouse-cookoff1.jpg)