Embed Size (px)
Citation preview
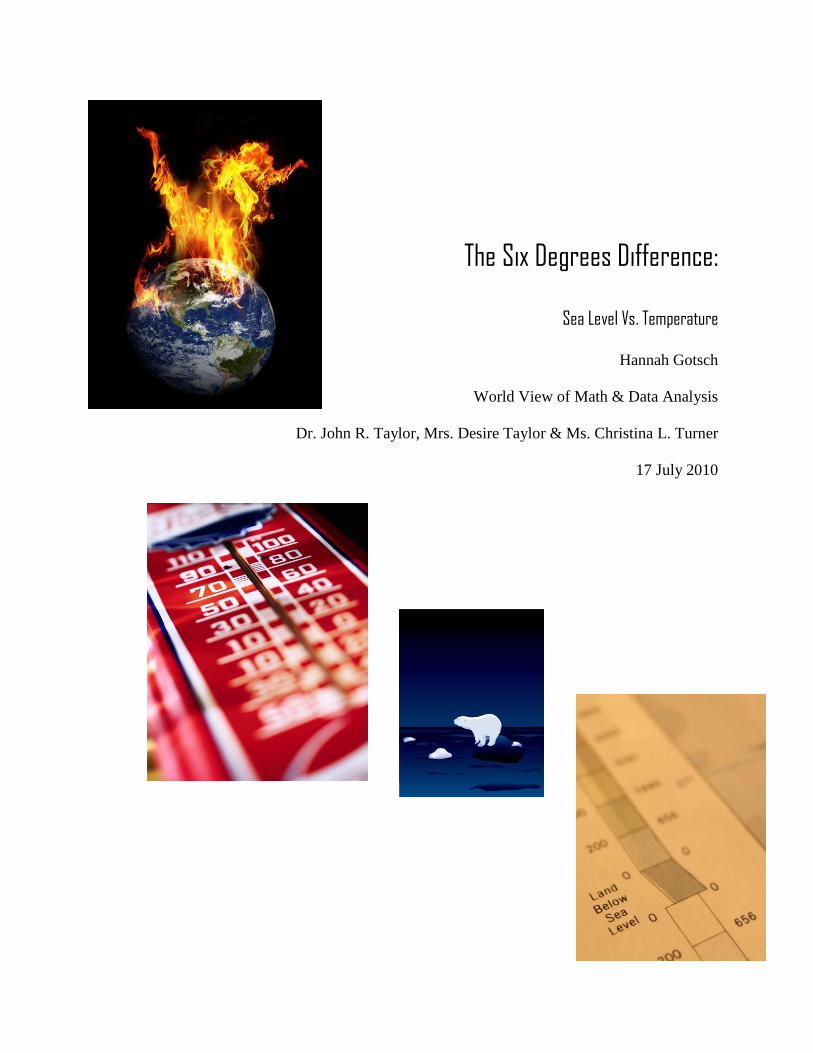
The Six Degrees Difference:
Sea Level Vs. Temperature
Hannah Gotsch
World View of Math & Data Analysis
Dr. John R. Taylor, Mrs. Desire Taylor & Ms. Christina L. Turner
17 July 2010
Six Degrees Difference 1
Abstract:
In this day and age, global warming has become a part of the biased world and an on-
going debated issue between doubters and believers. Concerns like whether a company was
polluting the water and air with greenhouse gases that are creating the greenhouse effect
therefore melting the glaciers and raising sea levels was never a concern fifty years ago. It has
not been until recently that it has become full blown and entered the daily lives of average
citizens and exited the theoretical world, unknown to all but scientific researchers. The real
question is: Is there really a trend of increased temperature and sea levels over the course of the
years that human industrial research has become prominent or is it just cyclical and there is not
enough evidence to prove that there truly is a positive linear regression of global temperatures
and sea level?
Six Degrees Difference 2
Background:
The issue on global warming—and whether it is a real matter that might result in the
down fall for the human race and all that it stands for as the “guardians” of this planet— has
become a hot political topic of this century. Green is the new black, as the saying goes, as more
and more people take it as just another trend. But what happens when they discover that there is
more to this issue than spoken through the pop media?
The idea of global warming, according to NASA was built upon Svante Arrhenius’s
investigation of carbon dioxide and its effects in 1904 (PBS, 2005). But not until the 1960’s did
it become a part of politics. Then once Al Gore began his campaign against global warming in
the 1980’s, the concept of global warming had become just that, GLOBAL.
Later, oceanographer, Roger Revelle became the man who specifically brought up the
belief that the global sea levels are rising, in his article from the Scientific American, and that
this was partially the effect of glacier melts, as well as, the warming of the surface of the earth
from carbon dioxide. The IPCC agrees with Roger Revelle’s claim and specifically states that
since 1961 to 2003 the global mean for sea level has ascended (United States, 2008).
It has come to the attention of many United States government agencies now that the
rising sea level is gradually increasing. However, it is argued against that there is an actual
pattern of rise and fall which cycles over the course of a certain number of decades (Asher, 2008)
except this time the contributions to this climb now include “thermal expansion…and loss of
mass from glaciers…” (United States, 2008) The inclusion of these issues is called “the human
factor;” it is the question of whether or not humans are top contributors to the global changes
being seen or if it is just another pattern in natures’ cycles. As a result of these other factors, the
Six Degrees Difference 3
sea level rise cannot be fully accounted for, as too many variables come in to play, like manmade
ground water pumps and reservoirs, and deforestation (United States, 2008). “Oceanographer Gary
Mitchum of the University of South Florida, says making any judgment from the limited data available is
"statistically so uncertain as to be meaningless." Others disagree.” (Asher, 2008)
Even with the questionable causes for sea level augmentation, it is easy to see the final
consequences of it. The coast is eroding, and more vulnerable to the smallest of natural disasters
that could cause flooding as the shoreline begins to get eaten by the ocean. Sea salt also becomes
a problem as ground and surface water is contaminated by increased salinity which harms the
surrounding land and it living organisms (United States, 2008).
Research Question:
For this experiment, the exploration of whether there is a correlation between global air
temperature and ocean levels is revealed. There are many skeptics that still do not believe in the
concept of global warming or at least do not believe it is an issue to worry about. This test will
help to clear up some of the incredulous thinking by discovering if the sea level relies on
temperature. Since rising temperatures have become a big part of the global warming fiasco
known as six degrees (Celsius), it has come to the attention of many that it is resulting in glacier
melts; if this is true than a change in temperature would alter the sea levels in a linear regression.
There are two variables in this experiment. These variables are the global sea level in
millimeters, and the global air temperature, both over the course of the years 1960 to 2010. The
sea level will be examined as the “X”, variable, and the temperature will be evaluated as the “Y”
Six Degrees Difference 4
variable on a graph. The question within the function of the graph is whether or not there is any
connection between them in which they affect each other.
In addition, the underlying question is: is the change of sea level a result of the observed
temperature increases, and if so, does this mean that global warming is real? The most popular
view on this is that there is a glacier melting predicament because the global temperatures are
escalating as the greenhouse effect takes flight (National Snow and Ice Data Center, 2008).
Method:
It is always better to have the population size, but it is impossible to collect the sea level
data and temperature at a global scale, so rather than struggle with the concept of measure every
corner of the globe, a sample size of each region is taken. All of the data used to compare the two
variables came from the National Snow and Ice Center in the form of a graph (as shown on Fig
1) therefore the numbers are a rough estimate of the original (National Snow and Ice Data
Center, 2009).
Forty-five dots were graphed for each line, on showing temperature and the other sea
level over a fifty year period. The first step was to convert these to a table format before the data
could be examined. This was carefully done by comparing spaces between dots as well as adding
a halfway line between each number, on the two individual y-axis’s, while observing the separate
lines as singular entities.
The product of the divided variables was then explored statistically by finding the r-
value, and the line of regression. To prove how the data could be used for future needs, a random
measurement for a number within the data set that was not logged in the data table was chosen

Six Degrees Difference 5
from the sea level (in mm) to find an unknown temperature. This can be taken the other direction
as well, therefore afterward the step was repeated but the unknown became a random sea level
measurement and the given was the temperature.
Results:
Sample statistics used to find population parameter are always more reliable, the larger
the sample size. The division line between data that is more reliable than others is if the sample
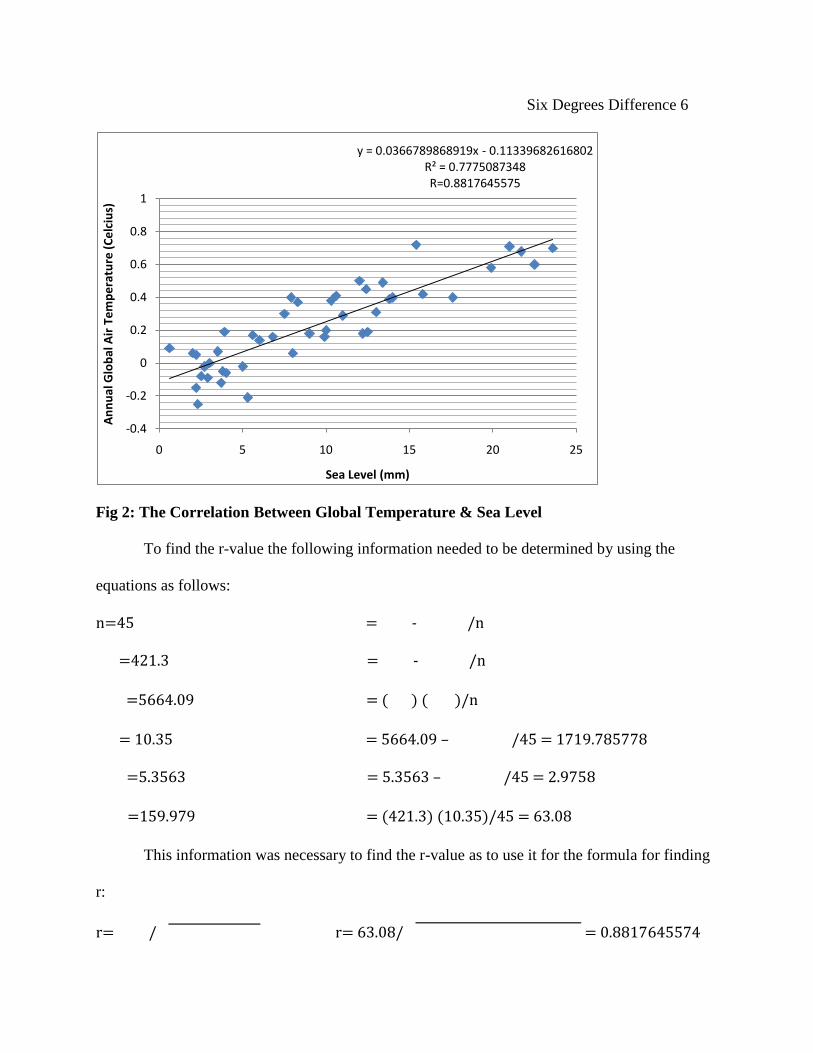
sizes are at least larger than thirty. Using the graph in Fig. 1, two separate tables were made (as
seen in appendix) to form a new graph that compared the variables as shown in Fig. 2.
Fig 1: Original Graph
Six Degrees Difference 6
Fig 2: The Correlation Between Global Temperature & Sea Level
To find the r-value the following information needed to be determined by using the
equations as follows:
n=45 = - /n
=421.3 = - /n
=5664.09 = ( ) ( )/n
= 10.35 = 5664.09 – /45 = 1719.785778
=5.3563 = 5.3563 – /45 = 2.9758
=159.979 = (421.3) (10.35)/45 = 63.08
This information was necessary to find the r-value as to use it for the formula for finding
r:
r= / r= 63.08/ = 0.8817645574
y = 0.0366789868919x - 0.11339682616802R² = 0.7775087348R=0.8817645575
-0.4
-0.2
0
0.2
0.4
0.6
0.8
1
0 5 10 15 20 25
An
nu
al G
lob
al A
ir T
em
pe
ratu
re (
Ce
lciu
s)
Sea Level (mm)
Six Degrees Difference 7
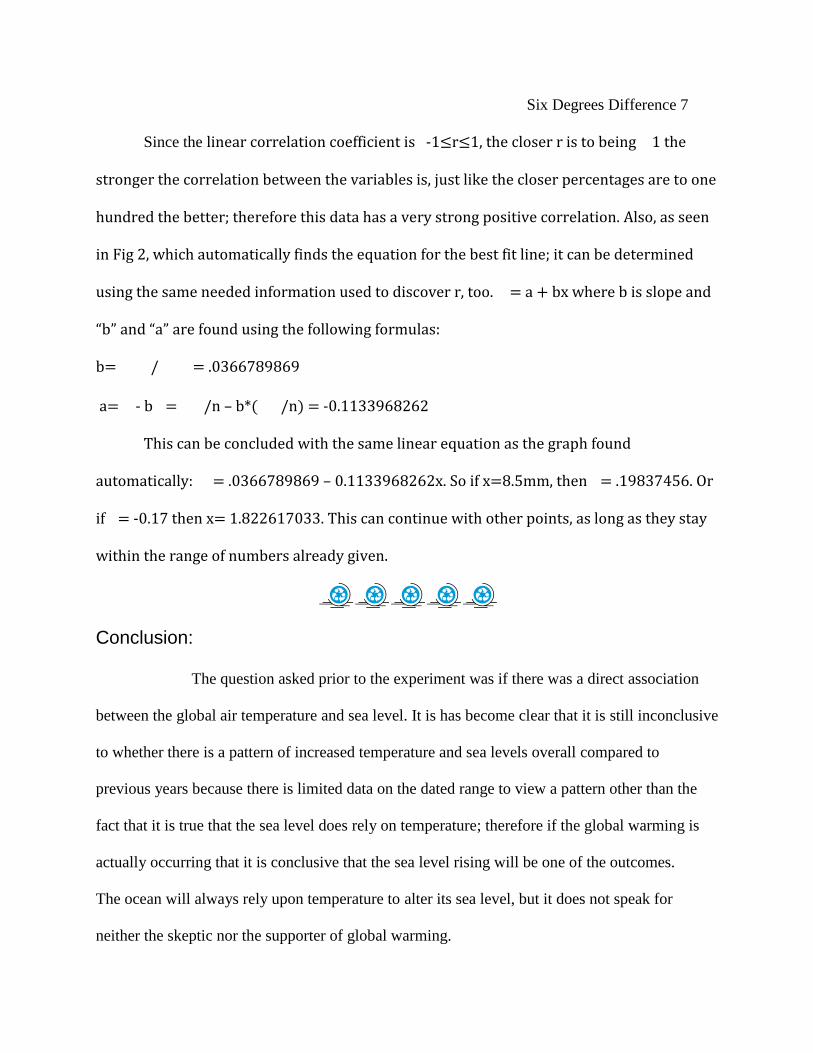
Since the linear correlation coefficient is -1≤r≤1, the closer r is to being 1 the
stronger the correlation between the variables is, just like the closer percentages are to one
hundred the better; therefore this data has a very strong positive correlation. Also, as seen
in Fig 2, which automatically finds the equation for the best fit line; it can be determined
using the same needed information used to discover r, too. = a + bx where b is slope and
“b” and “a” are found using the following formulas:
b= / = .0366789869
a= - b = /n – b*( /n) = -0.1133968262
This can be concluded with the same linear equation as the graph found
automatically: = .0366789869 – 0.1133968262x. So if x=8.5mm, then = .19837456. Or
if = -0.17 then x= 1.822617033. This can continue with other points, as long as they stay
within the range of numbers already given.
Conclusion:
The question asked prior to the experiment was if there was a direct association
between the global air temperature and sea level. It is has become clear that it is still inconclusive
to whether there is a pattern of increased temperature and sea levels overall compared to
previous years because there is limited data on the dated range to view a pattern other than the
fact that it is true that the sea level does rely on temperature; therefore if the global warming is
actually occurring that it is conclusive that the sea level rising will be one of the outcomes.
The ocean will always rely upon temperature to alter its sea level, but it does not speak for
neither the skeptic nor the supporter of global warming.

Six Degrees Difference 8
For further study on global warming myth versus truth, statisticians should dig deeper in
the comparison of data for variables believed to be involved, like sea level and temperature, by
using a longer timeline for comparison which would create a larger pool of data to work with.
Also, other comparisons should be made to see a better web of the connections because the link
between sea level and temperature is just a small portion of the whole.
Six Degrees Difference 9
Reference:
Asher, Michael (2008). “Defying Predictions, Sea Level Rise Begins to Slow.” DailyTech.
Retrieved from:
http://www.dailytech.com/Defying+Predictions+Sea+Level+Rise+Begins+to+Slow/arti
cle13679.htm.
Mandia, Scott A. (2010). “Global Warming: Man or Myth?” Retrieved from:
http://www2.sunysuffolk.edu/mandias/global_warming/images/10_years_no_cooling.jpg.
National Snow and Ice Data Center (2008). “State of The Cryosphere: is the cryosphere sending
signals about climate change?” University of Colorado at Boulder. Retrieved from:
http://nsidc.org/sotc/glacier_balance.html.
National Snow and Ice Data Center (2009). “State of The Cryosphere: is the cryosphere sending
signals about climate change?” University of Colorado at Boulder. Retrieved from:
http://nsidc.org/sotc/sea_level.html.
PBS JumpStart Productions (2005). “Science and Health: The Plitical Climate”. Now.
Retrieved from: http://www.pbs.org/now/science/climatechange.html.
United States (2008). U.S. Envirnomental Protection Agency. National Water Program Strategy:
Response to Climate Change. Retrieved from:
www.epa.gov/water/climatechange/docs/3-27-08_ccdraftstrategy_final.pdf.
Six Degrees Difference 10
Appendix:
Table1: Sea Level, mm (x)
Table 2: Temperature (y)
1960’s 1970’s 1980’s 1990’s 2000’s
0.6 3.5 7.5 12.0 17.6
2.0 3.7 7.9 12.4 19.9
2.2 3.8 8.0 12.2 21.0
2.3 3.9 8.3 12.5 21.7
2.2 4.0 9.0 13.0 22.5
2.5 5.0 9.9 13.4 23.6
2.7 5.3 10.0 13.8
2.9 5.6 10.3 14.0
3.0 6.0 10.6 15.4
6.8 11 15.8
1960’s 1970’s 1980’s 1990’s 2000’s
0.09 0.07 0.30 0.50 0.40
0.06 -0.12 0.40 0.45 0.58
0.05 -0.05 0.06 0.18 0.71
-0.25 0.19 0.37 0.19 0.68
-0.15 -0.06 0.18 0.31 0.60
-0.08 -0.02 0.16 0.49 0.70
-0.02 -0.21 0.20 0.39
-0.09 0.17 0.38 0.40
0.00 0.14 0.41 0.72
0.16 0.29 0.42
Six Degrees Difference 11
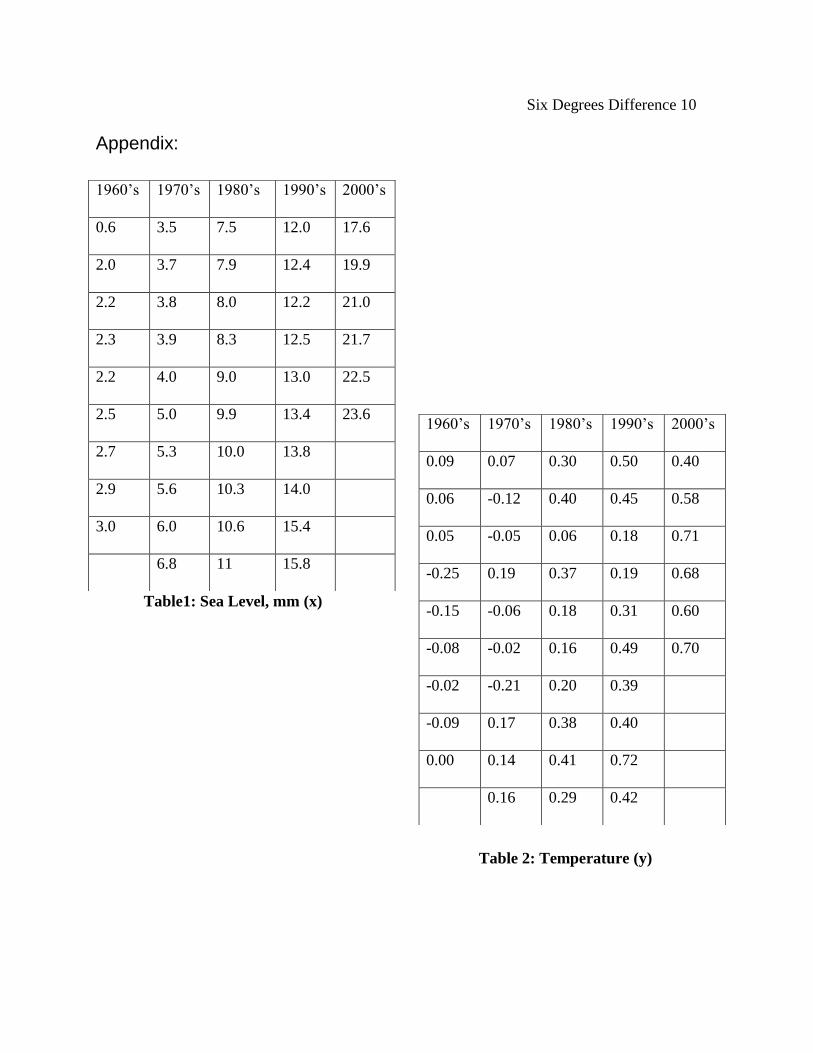
Fig 3: Change in Sea Level Over Time
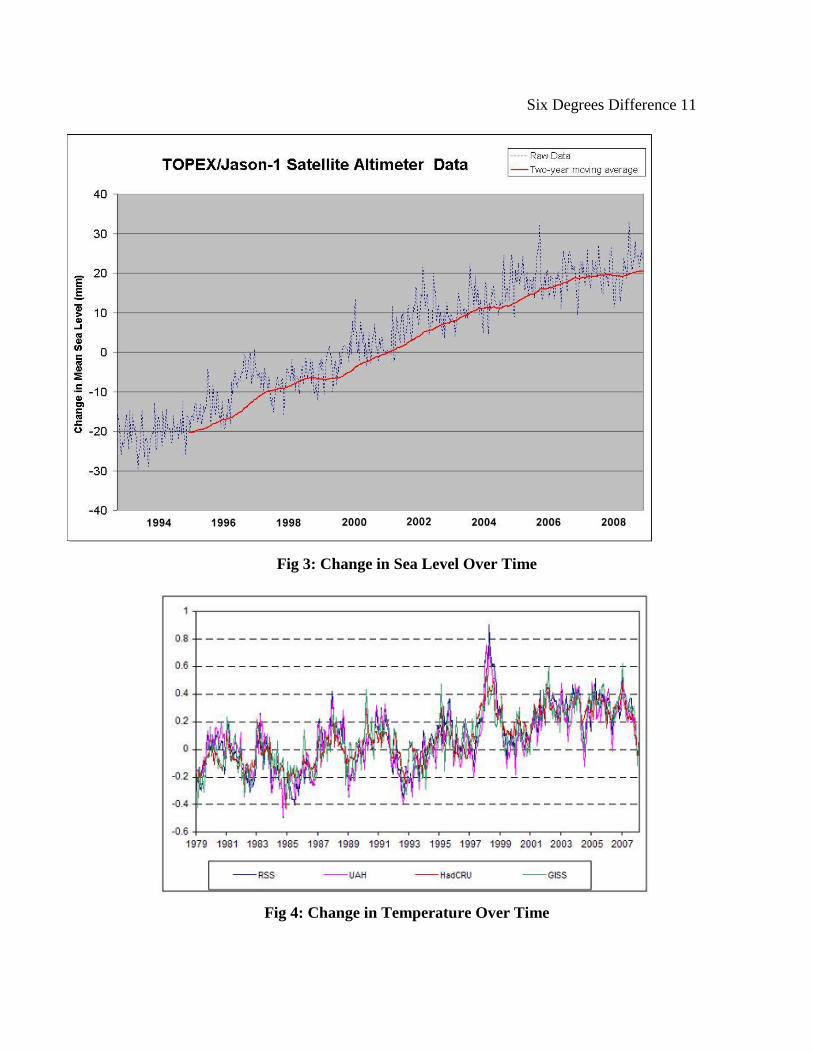
Fig 4: Change in Temperature Over Time


![[PVG] Hannah Montana - Hannah Montana 3](https://img.pdfslide.us/doc/110x75/56d6bf381a28ab30169562c0/pvg-hannah-montana-hannah-montana-3.jpg)