Embed Size (px)
Citation preview
1
HandWave: Design and Manufacture of a
Wearable Wireless Skin Conductance
Sensor and Housing
by
Marc D Strauss
SUBMITTED TO THE DEPARTMENT OF MECHANICAL ENGINEERING IN
PARTIAL FULFILLMIENT OF THE REQUIREMENTS FOR THE DEGREE OF
BACHELOR OF SCIENCE
AT THE
MASSACHUSETTS INSTITUTE OF TECHNOLOGY
JUNE 2005
© 2005 Massachusetts Institute of Technology
All rights reserved
The author hereby grants to MIT permission to reproduce and to distribute
publicly paper and electronic copies of this thesis document in whole or in part.
Signature of Author: . . . . . . . . . . . . . . . . . . . . . . . . . . . . . . . . . . . . .
Department of Mechanical Engineering
May 6, 2005
Certified by: . . . . . . . . . . . . . . . . . . . . . . . . . . . . . . . . . . . . . . . . .
Peter So
Associate Professor of Mechanical Engineering
Thesis Supervisor
Accepted by: . . . . . . . . . . . . . . . . . . . . . . . . . . . . . . . . . . . . . . . . .
Ernest G. Cravalho
Professor of Mechanical Engineering
Chairman of the Undergraduate Thesis Committee
2 2
HandWave: Design and Manufacture of a
Wearable Wireless Skin Conductance
Sensor and Housing
by
Marc D Strauss
Submitted to the Department of Mechanical Engineering
May 6, 2005 in Partial Fulfillment of the
Requirements for the Degree of Bachelor of Science in
Mechanical Engineering
Abstract
This thesis report details the design and manufacture of HandWave, a wearable wireless
Bluetooth skin conductance sensor, and dedicated housing. The HandWave collects
Electrodermal Activity (EDA) data by measuring skin conductance over a pair of
electrodes. The EDA data signal is used to infer the excitement level of the subject. The
injection-molded housing is affixed to the wrist of the subject, and the electrodes are
positioned on the fingers and/or palm.
The HandWave amplification board utilizes a PIC to sample the EDA signal level with an
analog-to-digital converter (ADC), control the gain of the amplification circuitry, and pass
the data to a Bluetooth module. The Bluetooth module manages the wireless connection to
a remote base-station and streams the EDA data over this link. Driver software on the
base-station recomposes the EDA signal into standard units of conductance for display or
further analysis.
Thesis Supervisor: Peter So
Title: Associate Professor of Mechanical Engineering
3 3
Table of Contents
Title Page . . . . . . . . . . . . . 1
Abstract . . . . . . . . . . . . . 2
Table of Contents . . . . . . . . . . . . . 3
Introduction to EDA . . . . . . . . . . . . . 4
HandWave Electronics Detail . . . . . . . . . . . . . 5
HandWave Housing Detail . . . . . . . . . . . . . 9
HandWave Software Detail . . . . . . . . . . . . . 14
HandWave Development Overview . . . . . . . . . . . . . 18
Appendix A: Photographs . . . . . . . . . . . . . 20
Appendix B: Schematic & Partlist . . . . . . . . . . . . . 29
Appendix C: User’s Guide . . . . . . . . . . . . . 32
Appendix D: Paper submitted to UbiComp 2005
Seventh International Conference on Ubiquitous Computing
September 11-14, 2005. Tokyo, Japan . . . . . . . . . . . . . 35
Acknowledgements . . . . . . . . . . . . . 47
References . . . . . . . . . . . . . 48
4 4
Electrodermal Activity (EDA)
When one becomes mentally, emotionally, or physically aroused, a response is
triggered in one’s skin. Known as the electrodermal response (EDR), this response can be
used as an indicator of one’s level of excitement. This phenomenon is known as the
sympathetic response, and is commonly referred to as “Fight or Flight.” During excitation, in
accordance with the sympathetic response, sweat glands in the skin fill with sweat, a weak
electrolyte and good conductor. This results in many low-resistance parallel pathways,
thereby increasing the conductivity of the skin [6].
The opposite process, known as the parasympathetic response, is initiated through
relaxation, and is commonly referred to as “Rest and Digest” [12]. During relaxation, the
conductive pathways in the skin are diminished, and the skin conductivity is thereby reduced.
The sympathetic and parasympathetic responses are two opposing causes of changes in skin
conductivity.
By applying a conventional 0.5 Volts across the skin and measuring changes in the
corresponding conductance, the emotional state of the subject can be inferred. It is important
to note, however, that fluctuations in skin conductivity are resultant of many types of arousal.
By observing only these changes, it is impossible to deduce without prior knowledge whether
the subject has become happy, startled, physically active, etcetera.
EDA consists of two components: tonic and phasic [4]. The tonic component is a low
frequency baseline conductivity level, which can oscillate over the course of days. The phasic
component rides on top of the tonic component, exhibits more rapid fluctuations, and
generally increases when a person is aroused. Problematically, each person has a different
tonic conductivity, so in order to infer the arousal level of the subject, the relative changes in
EDA must be analyzed over a period of time. Furthermore, skin conductance (measured in
units of siemens; formerly mhos) depends on the skin path length between the two electrodes
contacts, even for subjects with identical skin conductivity (measured in units of
siemens/meter). It is for these reasons that it is crucial to analyze the temporal variations of
the EDA signal. The subject should be prompted with stimuli to elicit EDR in order to gather
operative EDA data.
5 5
Electronics Detail
The basic purpose of the extensive circuitry on the HandWave amplification board is
to convert skin conductance measurements to voltage levels. The conductance of the skin and
the corresponding voltage are continuous signals, but the PIC microcontroller samples
periodically at discrete points in time. There are two stages of amplification that serve to
convert the conductance between the two electrodes into the EDA signal, which refers to the
voltage at the input of the analog-to-digital converter on the PIC. Both of these stages are
based around non-inverting operational amplifier configurations. The operational amplifiers
have rail-to-rail output capabilities.
The circuitry on the amplification board is powered by a voltage regulator (labeled
REG1 on the schematic found in Appendix B) that outputs a constant 3.3 V at a maximum of
100 mA. Experimentally, the HandWave draws about 75 mA. With this current draw, at
room temperature (25 °C), the regulator has an input voltage of 3.3 to 9.5 V, allowing for a
wide range of power options for the HandWave. The regulator output powers all elements of
the circuit, including the Bluetooth module. The analog (VCC) and digital (VDD) voltage buses
are split by a low-pass filter in order to attenuate any noise due to operation of the PIC or
Bluetooth microprocessors. The Bluetooth module consumes the majority of the power in the
circuit, so the digital power bus is fixed directly to the regulator output. The analog circuitry
draws a small current for biasing purposes, but this results in a voltage drop on the low-pass
filter of less than 0.2 mV. This is small enough in comparison to the 3.3 V supply to neglect.
The amplification board is designed to withstand reverse polarity applied to the power
input terminals. During normal operation, the diode (D1) is reversed biased, and serves no
function. However, if the HandWave is plugged in backwards, the diode turns on,
discharging the applied voltage through a 1Ω resistor (R17). A 9V battery will scorch this
resistor with about 70 Watts, so the resistor immediately burns up. This not only protects the
rest of the circuitry on the board, it stops current flow altogether. This safety mechanism has
performed well when unavoidable occasional human error has occurred.
VCC supplies a 2.5 V reference (REF1) which provides the initial EDA signal of 0.5 V
by means of a voltage divider (R2, R6). The signal will pass through two stages of
amplification before reaching the PIC ADC (pin 20). The gains of these stages is controlled
6 6
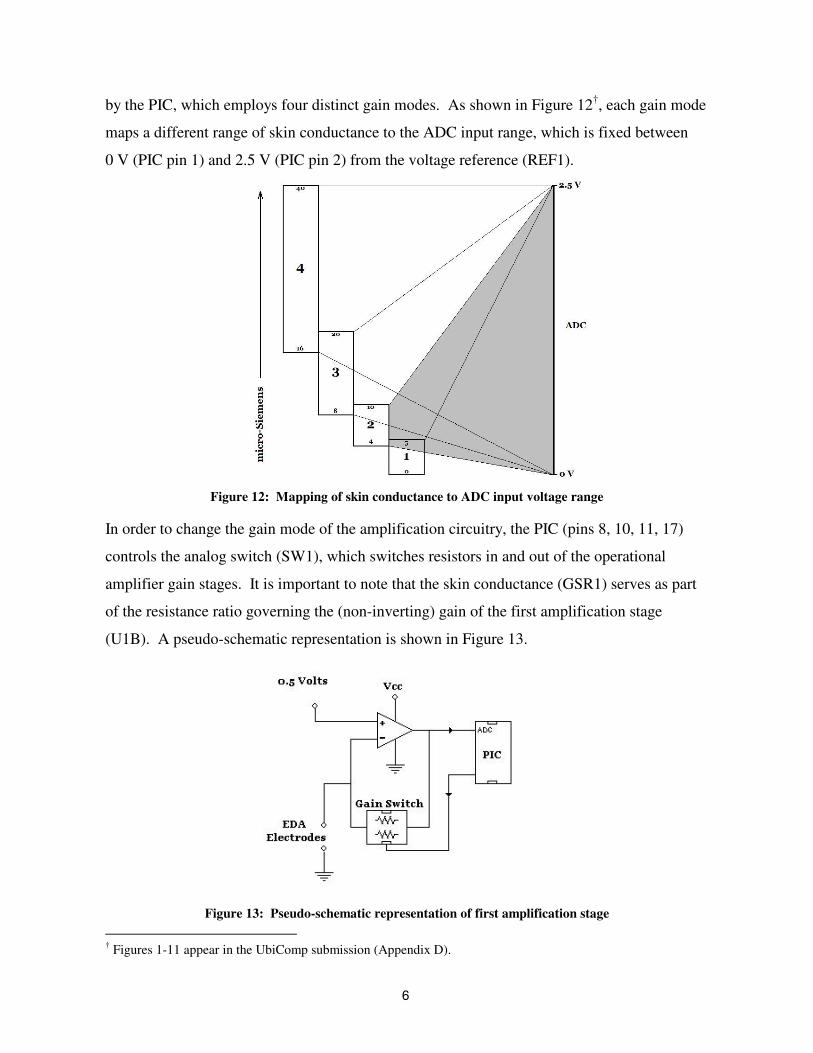
by the PIC, which employs four distinct gain modes. As shown in Figure 12†, each gain mode
maps a different range of skin conductance to the ADC input range, which is fixed between
0 V (PIC pin 1) and 2.5 V (PIC pin 2) from the voltage reference (REF1).
Figure 12: Mapping of skin conductance to ADC input voltage range
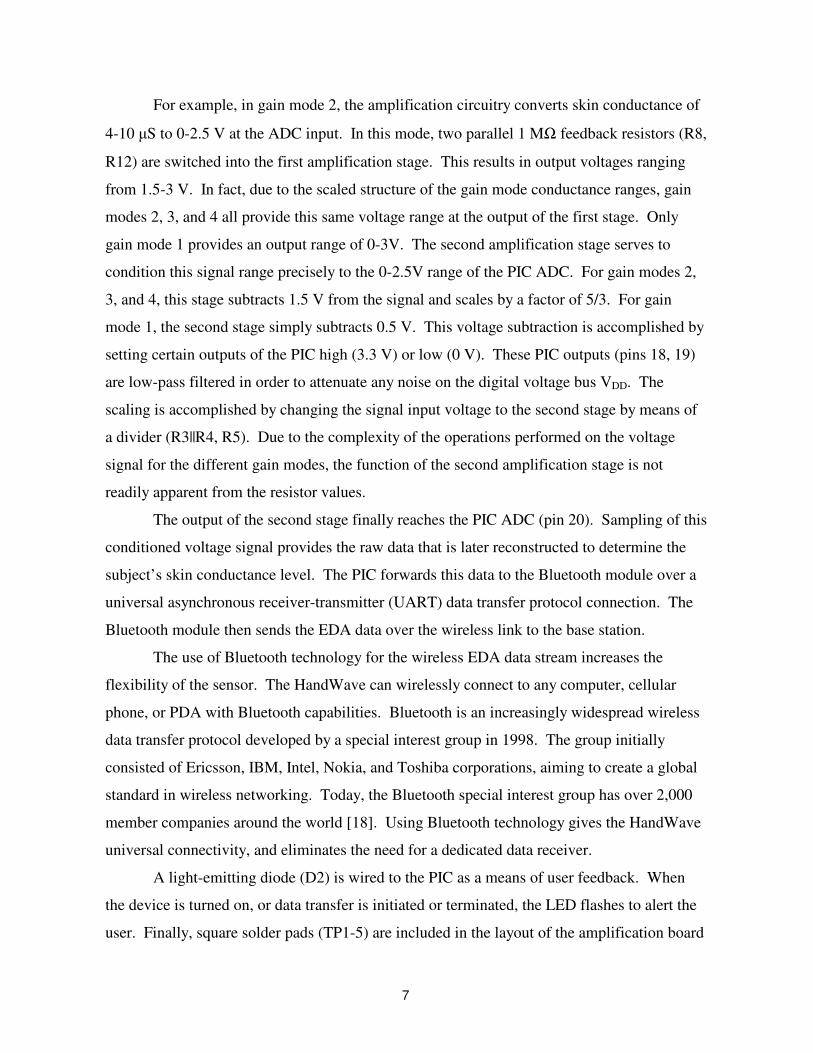
In order to change the gain mode of the amplification circuitry, the PIC (pins 8, 10, 11, 17)
controls the analog switch (SW1), which switches resistors in and out of the operational
amplifier gain stages. It is important to note that the skin conductance (GSR1) serves as part
of the resistance ratio governing the (non-inverting) gain of the first amplification stage
(U1B). A pseudo-schematic representation is shown in Figure 13.
Figure 13: Pseudo-schematic representation of first amplification stage
† Figures 1-11 appear in the UbiComp submission (Appendix D).
7 7
For example, in gain mode 2, the amplification circuitry converts skin conductance of
4-10 µS to 0-2.5 V at the ADC input. In this mode, two parallel 1 MΩ feedback resistors (R8,
R12) are switched into the first amplification stage. This results in output voltages ranging
from 1.5-3 V. In fact, due to the scaled structure of the gain mode conductance ranges, gain
modes 2, 3, and 4 all provide this same voltage range at the output of the first stage. Only
gain mode 1 provides an output range of 0-3V. The second amplification stage serves to
condition this signal range precisely to the 0-2.5V range of the PIC ADC. For gain modes 2,
3, and 4, this stage subtracts 1.5 V from the signal and scales by a factor of 5/3. For gain
mode 1, the second stage simply subtracts 0.5 V. This voltage subtraction is accomplished by
setting certain outputs of the PIC high (3.3 V) or low (0 V). These PIC outputs (pins 18, 19)
are low-pass filtered in order to attenuate any noise on the digital voltage bus VDD. The
scaling is accomplished by changing the signal input voltage to the second stage by means of
a divider (R3||R4, R5). Due to the complexity of the operations performed on the voltage
signal for the different gain modes, the function of the second amplification stage is not
readily apparent from the resistor values.
The output of the second stage finally reaches the PIC ADC (pin 20). Sampling of this
conditioned voltage signal provides the raw data that is later reconstructed to determine the
subject’s skin conductance level. The PIC forwards this data to the Bluetooth module over a
universal asynchronous receiver-transmitter (UART) data transfer protocol connection. The
Bluetooth module then sends the EDA data over the wireless link to the base station.
The use of Bluetooth technology for the wireless EDA data stream increases the
flexibility of the sensor. The HandWave can wirelessly connect to any computer, cellular
phone, or PDA with Bluetooth capabilities. Bluetooth is an increasingly widespread wireless
data transfer protocol developed by a special interest group in 1998. The group initially
consisted of Ericsson, IBM, Intel, Nokia, and Toshiba corporations, aiming to create a global
standard in wireless networking. Today, the Bluetooth special interest group has over 2,000
member companies around the world [18]. Using Bluetooth technology gives the HandWave
universal connectivity, and eliminates the need for a dedicated data receiver.
A light-emitting diode (D2) is wired to the PIC as a means of user feedback. When
the device is turned on, or data transfer is initiated or terminated, the LED flashes to alert the
user. Finally, square solder pads (TP1-5) are included in the layout of the amplification board
8 8
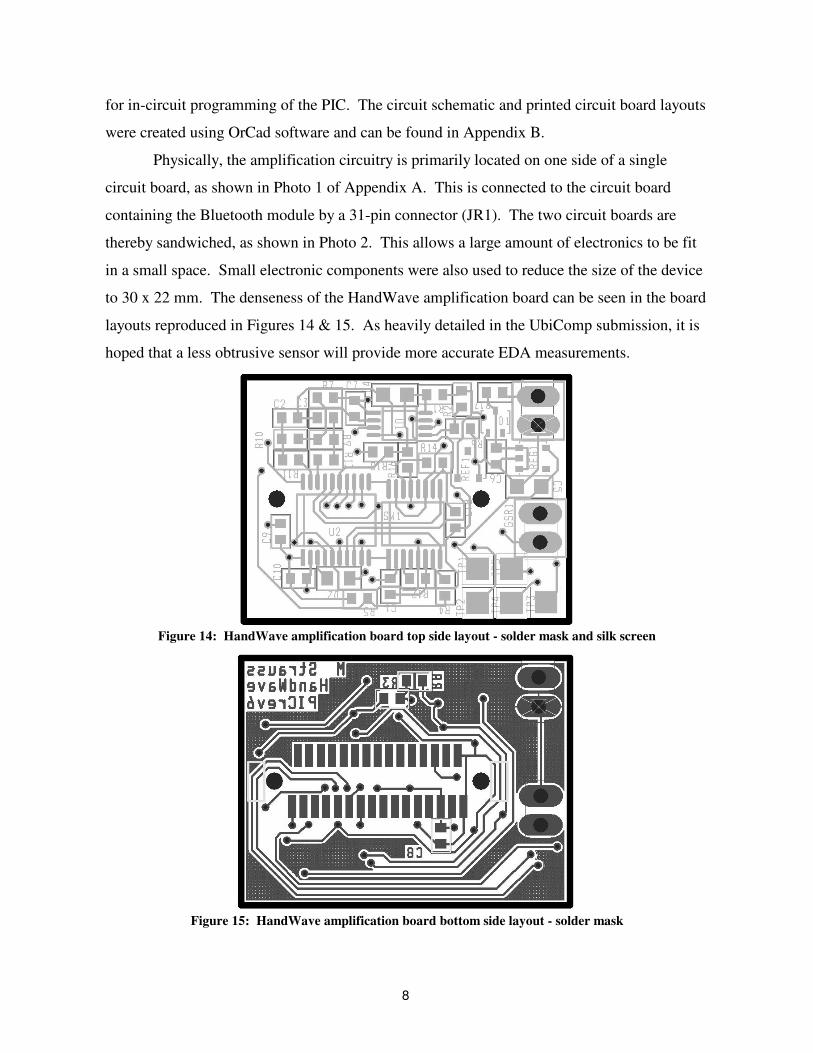
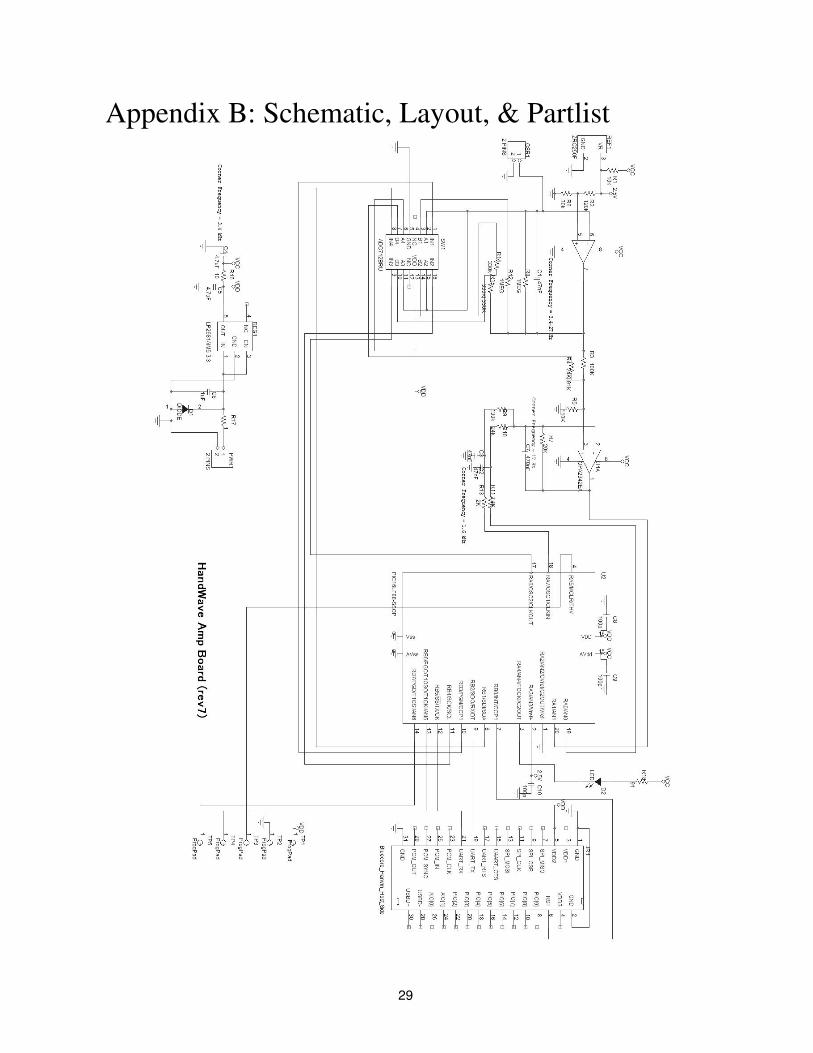
for in-circuit programming of the PIC. The circuit schematic and printed circuit board layouts
were created using OrCad software and can be found in Appendix B.
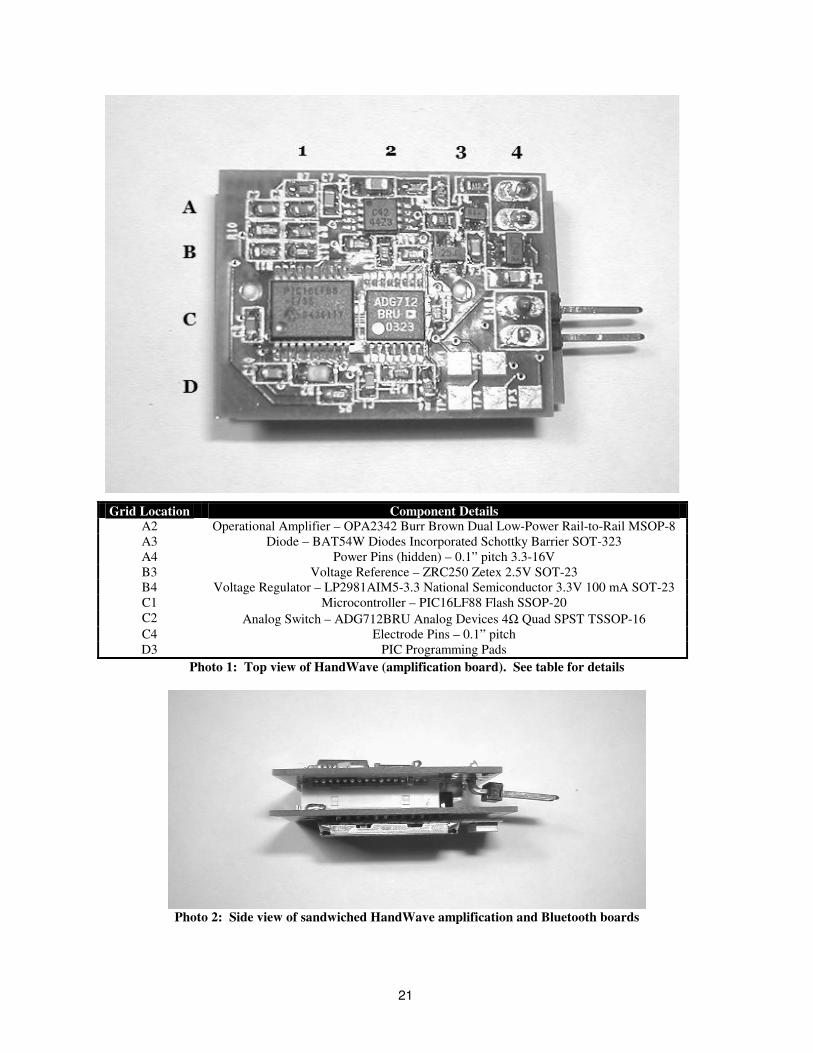
Physically, the amplification circuitry is primarily located on one side of a single
circuit board, as shown in Photo 1 of Appendix A. This is connected to the circuit board
containing the Bluetooth module by a 31-pin connector (JR1). The two circuit boards are
thereby sandwiched, as shown in Photo 2. This allows a large amount of electronics to be fit
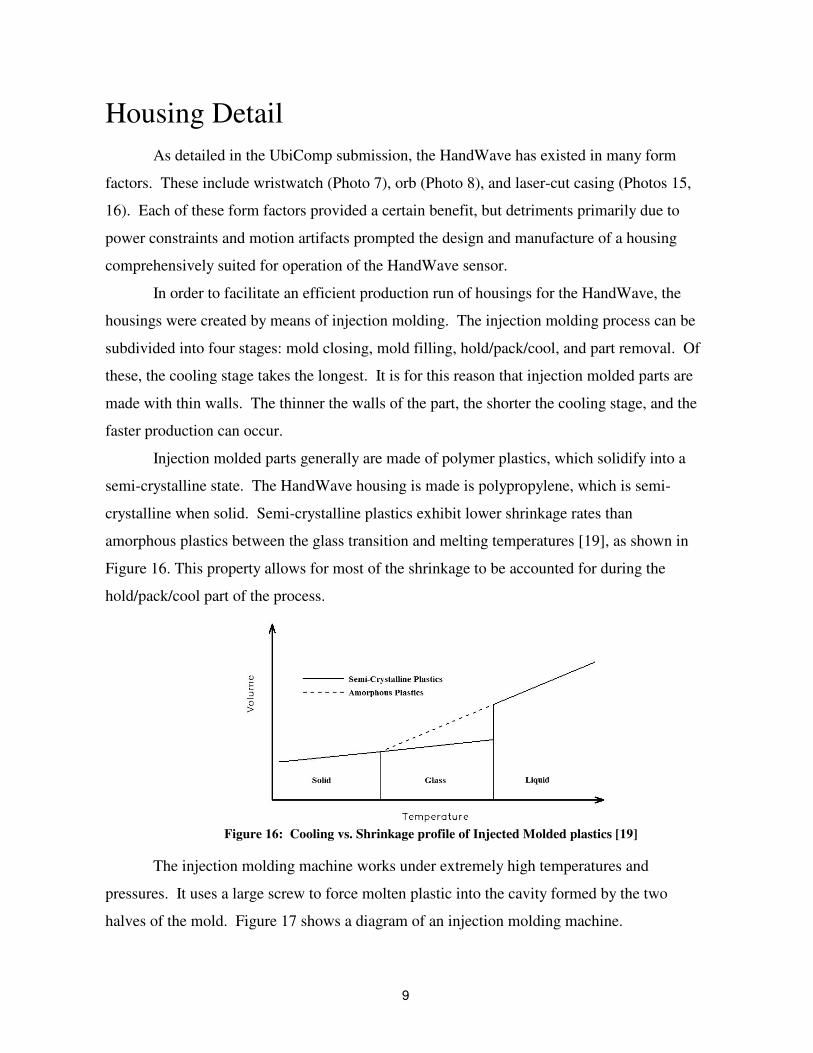
in a small space. Small electronic components were also used to reduce the size of the device
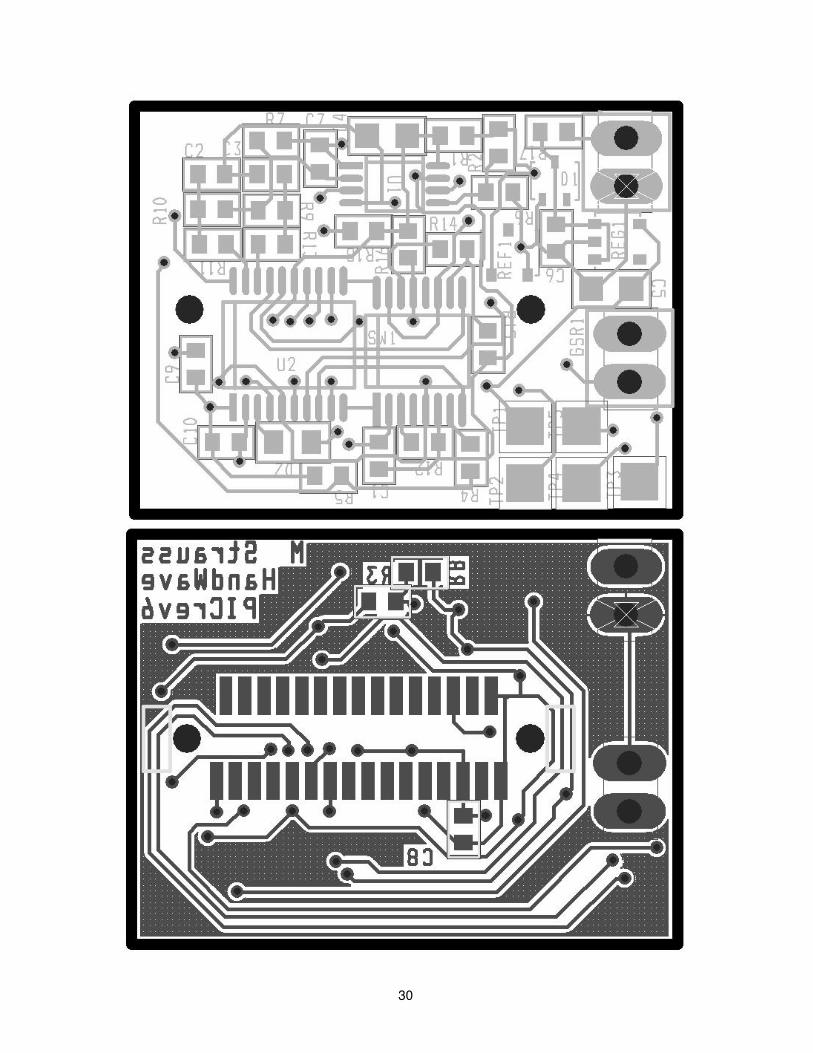
to 30 x 22 mm. The denseness of the HandWave amplification board can be seen in the board
layouts reproduced in Figures 14 & 15. As heavily detailed in the UbiComp submission, it is
hoped that a less obtrusive sensor will provide more accurate EDA measurements.
Figure 14: HandWave amplification board top side layout - solder mask and silk screen
Figure 15: HandWave amplification board bottom side layout - solder mask
9 9
Housing Detail
As detailed in the UbiComp submission, the HandWave has existed in many form
factors. These include wristwatch (Photo 7), orb (Photo 8), and laser-cut casing (Photos 15,
16). Each of these form factors provided a certain benefit, but detriments primarily due to
power constraints and motion artifacts prompted the design and manufacture of a housing
comprehensively suited for operation of the HandWave sensor.
In order to facilitate an efficient production run of housings for the HandWave, the
housings were created by means of injection molding. The injection molding process can be
subdivided into four stages: mold closing, mold filling, hold/pack/cool, and part removal. Of
these, the cooling stage takes the longest. It is for this reason that injection molded parts are
made with thin walls. The thinner the walls of the part, the shorter the cooling stage, and the
faster production can occur.
Injection molded parts generally are made of polymer plastics, which solidify into a
semi-crystalline state. The HandWave housing is made is polypropylene, which is semi-
crystalline when solid. Semi-crystalline plastics exhibit lower shrinkage rates than
amorphous plastics between the glass transition and melting temperatures [19], as shown in
Figure 16. This property allows for most of the shrinkage to be accounted for during the
hold/pack/cool part of the process.
Figure 16: Cooling vs. Shrinkage profile of Injected Molded plastics [19]
The injection molding machine works under extremely high temperatures and
pressures. It uses a large screw to force molten plastic into the cavity formed by the two
halves of the mold. Figure 17 shows a diagram of an injection molding machine.

10 10
Figure 17: Diagram of injection molding machine [19]
There were many advantages to using the injection molding process. The injection molding
machine is able to operate in automatic mode, which produced parts at a rate of about one unit
per minute. Furthermore, injection molded polypropylene is quite durable, which provides a
strong, protective housing. Finally, the fact that only one set of molds needed to be machined
allowed for efficient production of parts with complicated geometry.
When designing an injection molded part, there are constraints that are imposed on the
design due to the manufacturing procedure. For instance, the flow path ratio limits the length-
to-thickness ratio of any part of the housing. Furthermore, the molds must be made larger
than the desired final product to account for shrinkage. Finally, other factors such as parting
line placement and draft angle must be considered. The parting line is the plane where the
two halves of the mold meet. The draft angle allows the part to be more easily removed from
the cavity mold after cooling.
The housing for the HandWave was injection molded from polypropylene in the Lab
for Manufacturing and Productivity. The lab has an injection molding machine and various
colors of polypropylene available for student use. The design was drawn in MasterCAM Mill
for EZTraks in the adjacent Ralph Cross CAD/CAM laboratory.
The housing itself has one cavity for the HandWave circuit boards, one cavity for a 9V
battery, and one cavity for a power switch. There is also a single port on the side of the
housing for connecting the electrodes to the amplifier board. The housing lid attaches to the
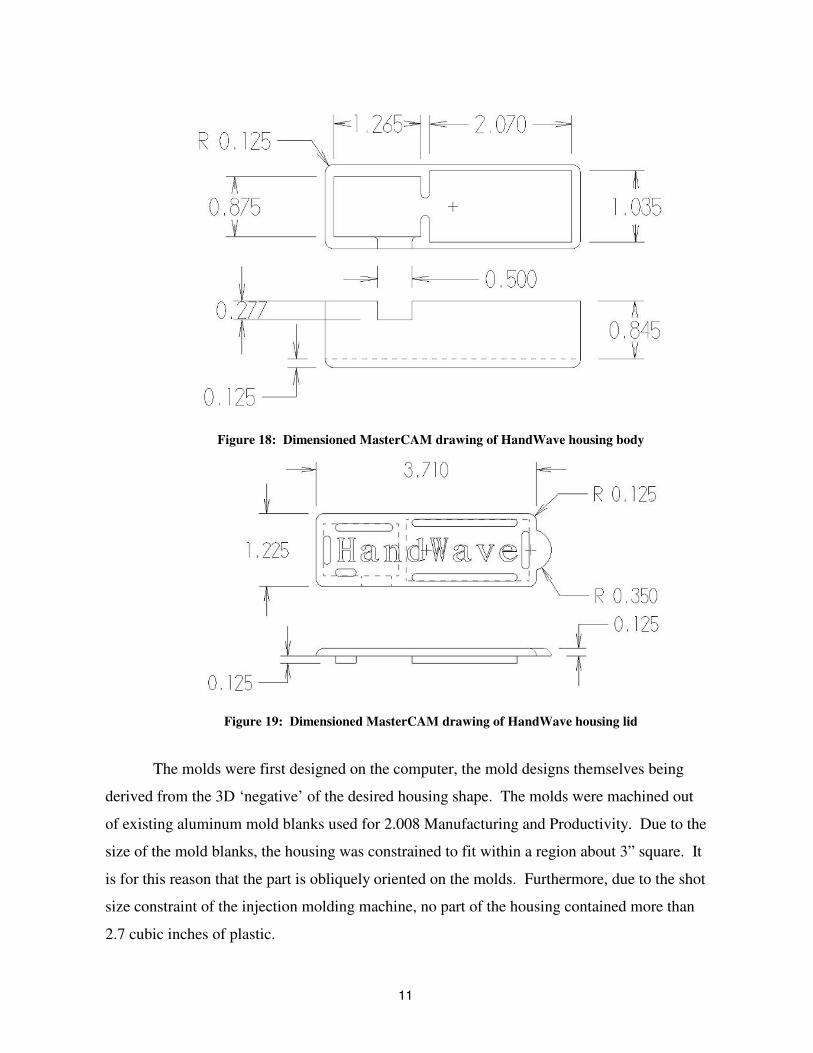
housing body through a snap fit with an interference of about .010”. The lid features 3D
embossed text that reads: “HandWave”. Dimensioned drawings of the housing body and lid
are shown in Figures 18 and 19. All measurements are in inches.
11 11
Figure 18: Dimensioned MasterCAM drawing of HandWave housing body
Figure 19: Dimensioned MasterCAM drawing of HandWave housing lid
The molds were first designed on the computer, the mold designs themselves being
derived from the 3D ‘negative’ of the desired housing shape. The molds were machined out
of existing aluminum mold blanks used for 2.008 Manufacturing and Productivity. Due to the
size of the mold blanks, the housing was constrained to fit within a region about 3” square. It
is for this reason that the part is obliquely oriented on the molds. Furthermore, due to the shot
size constraint of the injection molding machine, no part of the housing contained more than
2.7 cubic inches of plastic.
12 12
Due to the viscosity of polypropylene, the flow path ratio was limited to under 200.
Polypropylene has been found to shrink 1-3%, so the molds were designed slightly larger than
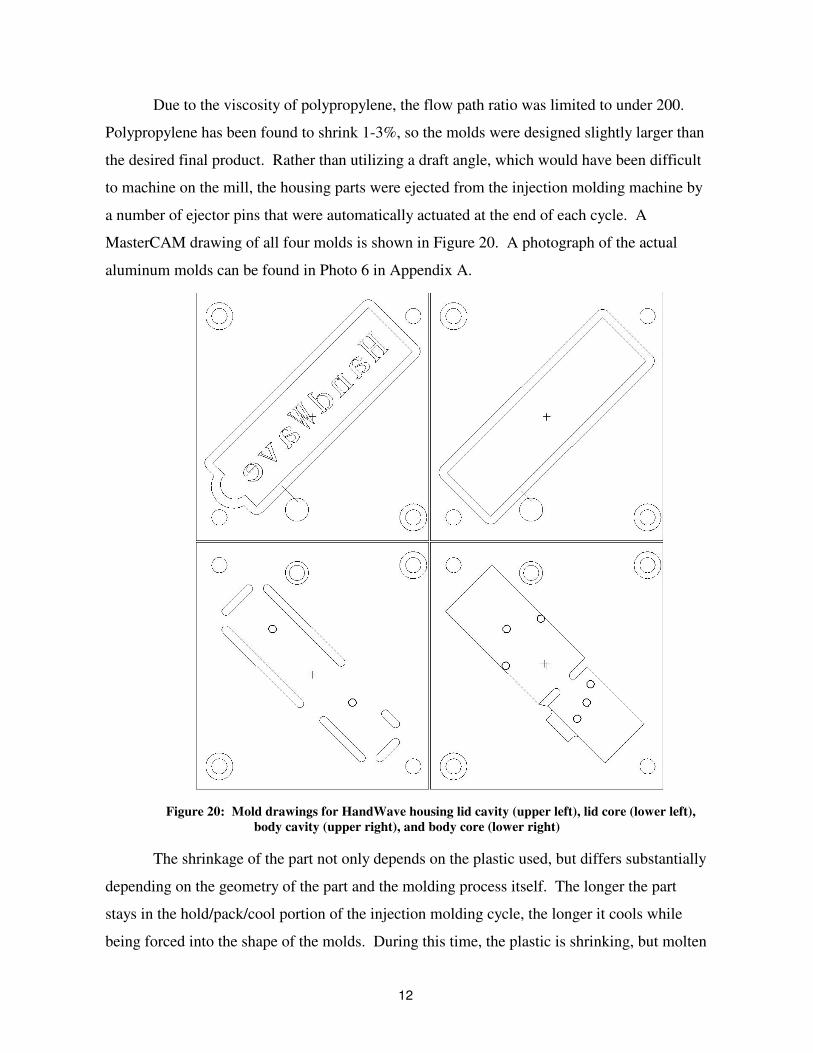
the desired final product. Rather than utilizing a draft angle, which would have been difficult
to machine on the mill, the housing parts were ejected from the injection molding machine by
a number of ejector pins that were automatically actuated at the end of each cycle. A
MasterCAM drawing of all four molds is shown in Figure 20. A photograph of the actual
aluminum molds can be found in Photo 6 in Appendix A.
Figure 20: Mold drawings for HandWave housing lid cavity (upper left), lid core (lower left),
body cavity (upper right), and body core (lower right)
The shrinkage of the part not only depends on the plastic used, but differs substantially
depending on the geometry of the part and the molding process itself. The longer the part
stays in the hold/pack/cool portion of the injection molding cycle, the longer it cools while
being forced into the shape of the molds. During this time, the plastic is shrinking, but molten
13 13
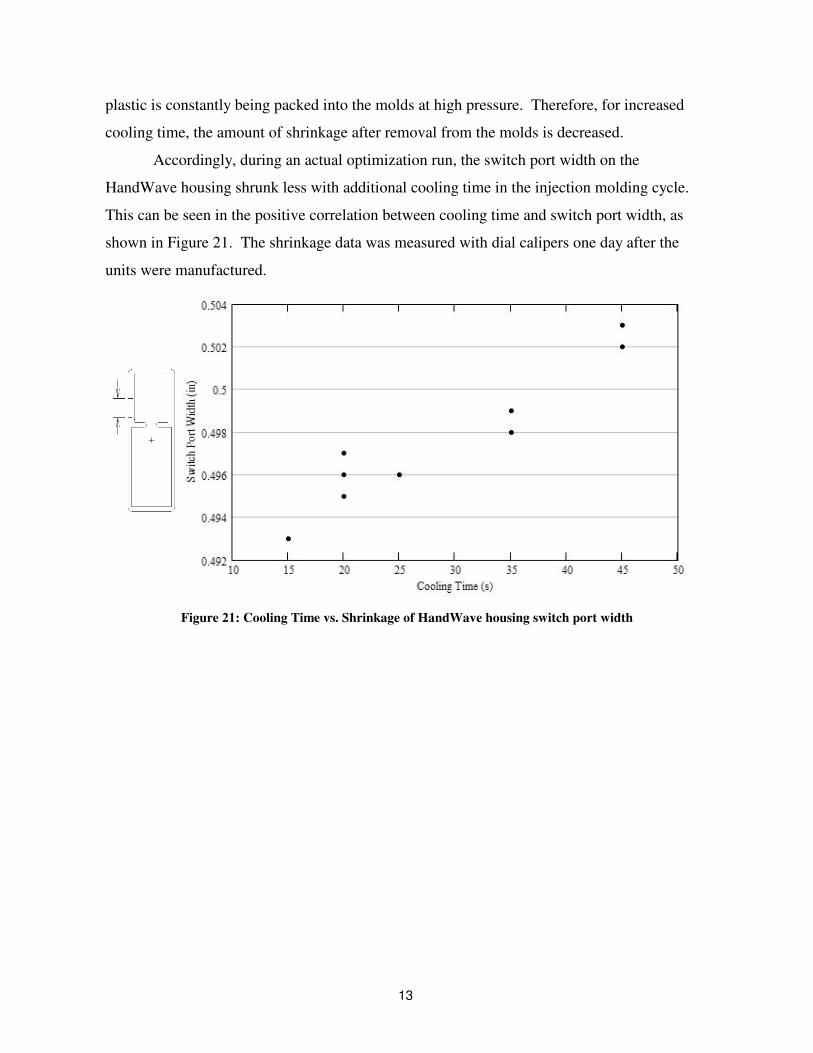
plastic is constantly being packed into the molds at high pressure. Therefore, for increased
cooling time, the amount of shrinkage after removal from the molds is decreased.
Accordingly, during an actual optimization run, the switch port width on the
HandWave housing shrunk less with additional cooling time in the injection molding cycle.
This can be seen in the positive correlation between cooling time and switch port width, as
shown in Figure 21. The shrinkage data was measured with dial calipers one day after the
units were manufactured.
Figure 21: Cooling Time vs. Shrinkage of HandWave housing switch port width
14 14
Software Detail
Within the HandWave system, there exist three software applications. One application
runs on the Bluetooth module microprocessor, one runs on the amplification board PIC, and
one runs on the base station receiving data.
The application on the Bluetooth module was developed with the BlueLab software
package from Cambridge Silicon Radios. Written in C, this program manages the Bluetooth
connection between the HandWave and the base station. The code is compiled with Cygwin,
and flashed onto the Bluetooth module using a programmer board designed by Stephen
Hughes at the Media Lab Europe. Photo 11 in Appendix A shows a top view of the
programmer. Programmed over the parallel port, the Bluetooth modules are fully operational
while on the programmer, which allows for debugging over the serial port.
At startup, and whenever not connected, the application on the Bluetooth module
scans for connection requests. When a connection request is found, the module prompts for a
PIN code. If the correct PIN code is returned, pairing between the Bluetooth devices occurs,
and a wireless data connection is made. The HandWave adheres to a standardized serial port
profile, which is sometimes referred to as cable replacement, since the connection can be
treated as a virtual serial port on the base station.
When connected, the Bluetooth module application streams data bi-directionally
between the PIC and the wireless link. Generally, this implies streaming of EDA data from
the PIC over the link. However, commands from the base station are also conferred to the
PIC. Specifically, start and stop commands can control the flow of data without terminating
the wireless connection.
The application on the PIC was developed in MPLAB, and is also written in C. The
code is compiled using a HI-TECH PICC compiler plug-in, and flashed onto the PIC using a
Microchip PIC in-circuit debugger/programmer over a USB cable. The HandWave requires a
specialized programming jig to make electrical contact with the programming pads on the
amplification board. This jig is made from laser-cut acrylic layers, and uses spring-loaded
contact probes. Photo 12 in Appendix A shows the programming jig.
The application on the PIC periodically samples the onboard 10-bit ADC. The PIC
samples at 1280 Hz, summing every 32 samples, and sending this data at 40 Hz. This is
15 15
tantamount to sending an averaged reading 40 times per second. The PIC monitors the EDA
data, and changes the gain mode if the signal approaches the limit of the ADC input voltage
range. Overlap is built into the four gain modes on the HandWave, and the PIC application
accounts for this in order to prevent repeated mode switches, which cause transients in the
EDA signal. Importantly, the gain mode is sent along with each ADC reading so that the
conductance signal can be reconstructed at the base station.
The base station application is written in Python and uses a serial port library to access
the virtual serial port to receive data over the wireless link. Once the base station and
HandWave have paired, the Python application is capable of opening a connection, initiating
data transfer, reconstructing the conductance signal from raw data, and passing on the data in
standard units of conductance (micro-siemens). The data can simply be written to a text file
for later analysis, or passed through a socket to a graphical display such as the ‘thermometer’
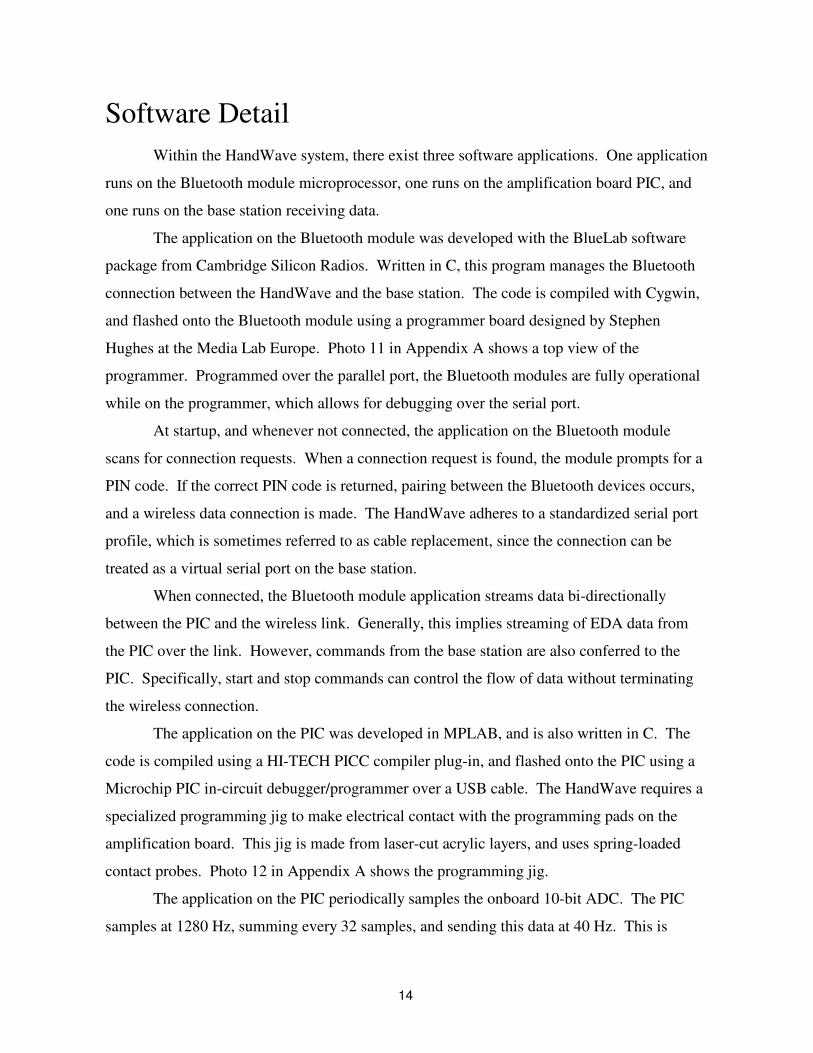
display seen in Photo 14. The EDA signal is fairly smooth, and effects of stimuli are often
quite apparent. Figure 22 shows a dramatic increase in skin conductance shortly after the
subject was startled by a loud noise.
Figure 22: Plot of skin conductance when the subject was startled by a loud noise
The only anomaly in the EDA signal occurs when the gain mode is changed. During
this transient, a discrepancy exists between the sensor hardware and software. Whereas the
application on the PIC changes gain modes instantaneously, the voltage signal must move
from near the top of the ADC range to the bottom for an increase in gain, or vice-versa for a
decrease in gain. This voltage transient on the ADC (pin 20) is subject to an RC time constant
of 9.4 ms (R7*C7). As per the PIC software, the signal moves about nine tenths of the ADC
16 16
range, requiring 7 time constants (65 ms) to stabilize to a value less than one least significant
bit of the ADC (9/10*1024*e-7
< 1). Experimentally, this transient length is quite accurate.
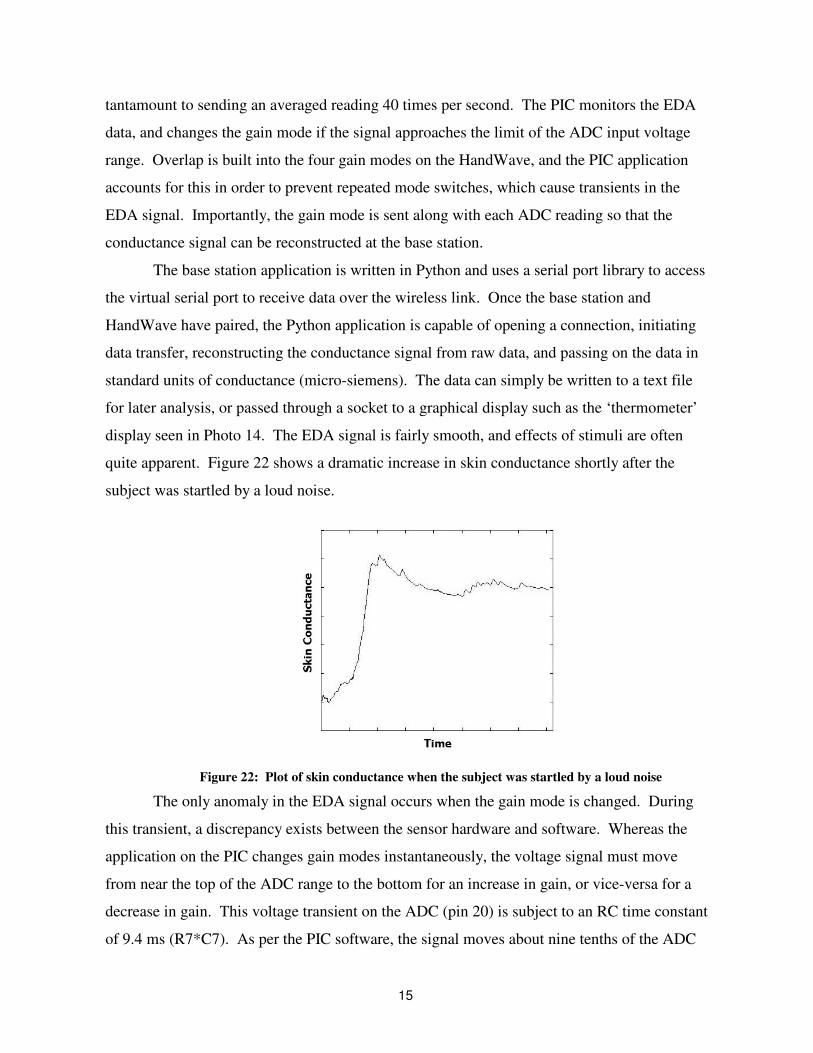
A demonstration of the signal passing between gain stages is shown in Figure 23. Note that at
40 Hz, the data points are spaced 25 ms apart in time. Therefore, the 65 ms gain switch
effects only are seen in the successive 2-3 data points.
Figure 23: Real data gathered over a change in gain mode. The signal recovers from the transient fairly
quickly—only the 2-3 data points following the mode change are affected
Conveniently, gain mode changes only occur at the three conductance levels in
between gain mode ranges. Since these levels are predetermined in software, gain mode
transients can usually easily be identified. Finally, these transients can be filtered out easily in
the driver software. For the three data points immediately following a gain mode change, the
driver simply hangs on the last known reliable conductance measurement.
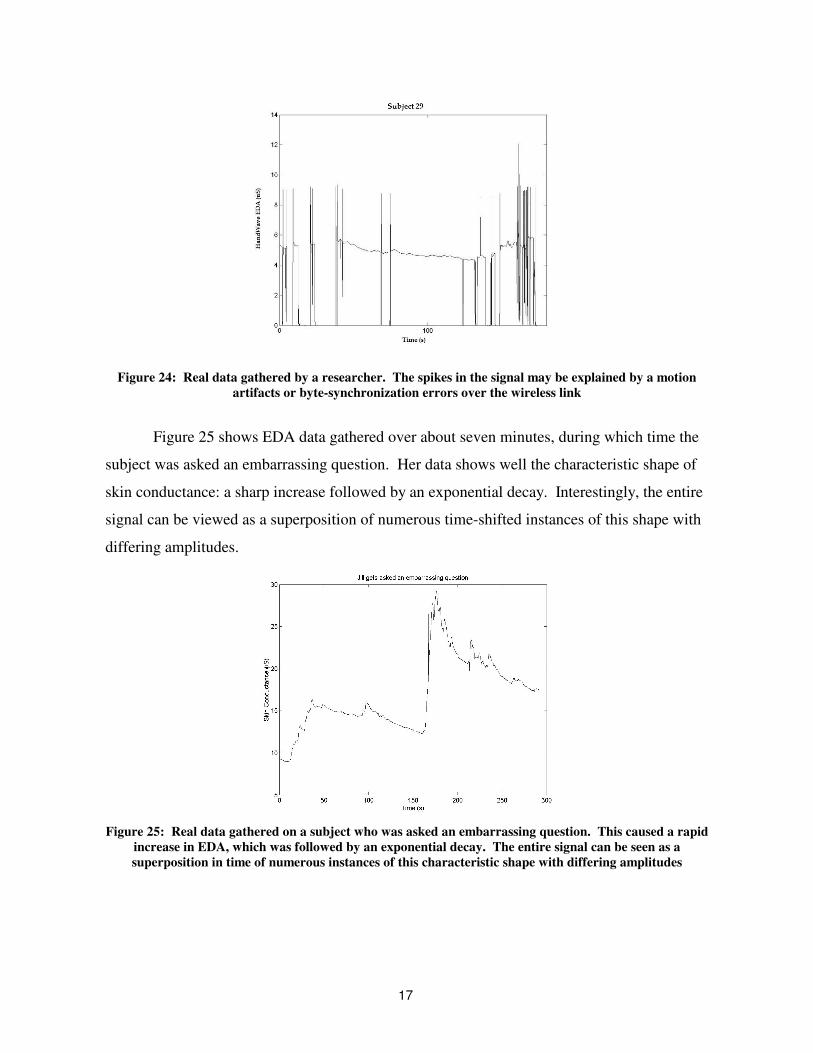
Unfortunately, the signal data gathered by the HandWave is not always so smooth.
This can be due to motion artifacts or byte-synchronization errors over the wireless link. One
researcher gathered data with a staggering amount of spiking, as shown in Figure 24. Purely
from observing the data, it appears as if the EDA voltage level at the ADC drops to zero on
occasion. Each time this occurs, the device switches to the lowest gain mode, and the PIC
must seek out the correct gain mode. This results in the down-up spikes that appear
throughout the data sample. During fully functional operation, the EDA reading will only
exhibit this behavior when the device begins data collection.
17 17
Figure 24: Real data gathered by a researcher. The spikes in the signal may be explained by a motion
artifacts or byte-synchronization errors over the wireless link
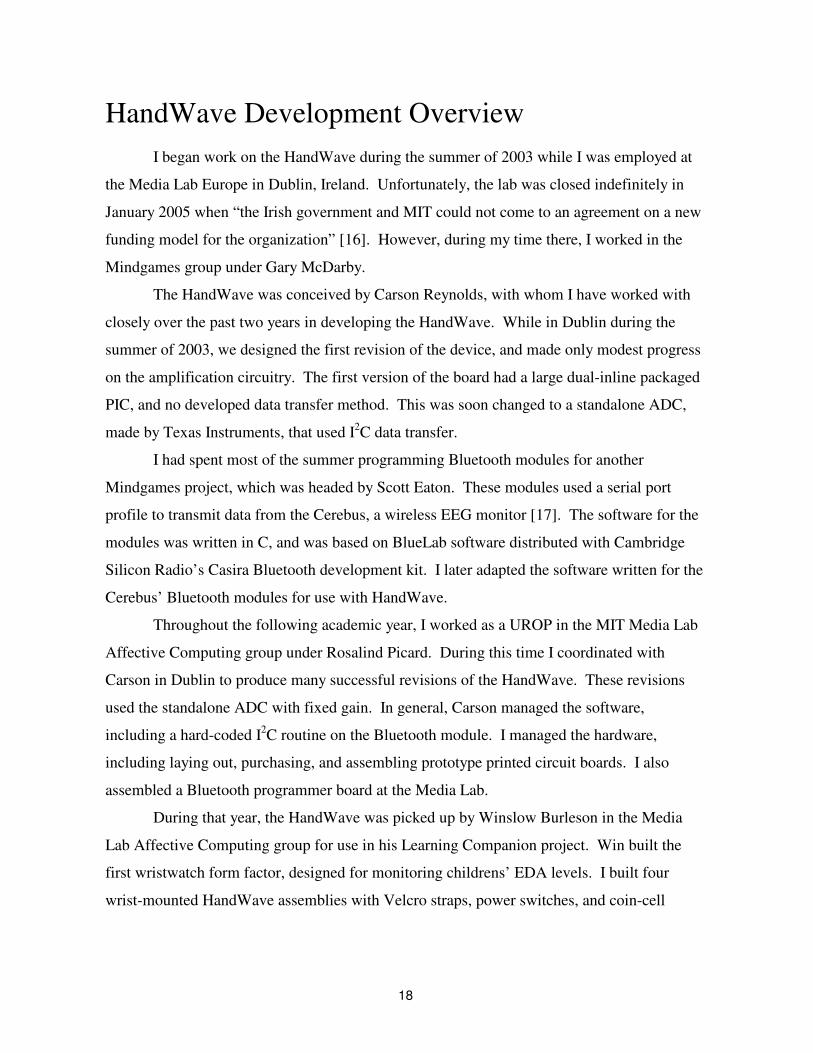
Figure 25 shows EDA data gathered over about seven minutes, during which time the
subject was asked an embarrassing question. Her data shows well the characteristic shape of
skin conductance: a sharp increase followed by an exponential decay. Interestingly, the entire
signal can be viewed as a superposition of numerous time-shifted instances of this shape with
differing amplitudes.
Figure 25: Real data gathered on a subject who was asked an embarrassing question. This caused a rapid
increase in EDA, which was followed by an exponential decay. The entire signal can be seen as a
superposition in time of numerous instances of this characteristic shape with differing amplitudes
18 18
HandWave Development Overview
I began work on the HandWave during the summer of 2003 while I was employed at
the Media Lab Europe in Dublin, Ireland. Unfortunately, the lab was closed indefinitely in
January 2005 when “the Irish government and MIT could not come to an agreement on a new
funding model for the organization” [16]. However, during my time there, I worked in the
Mindgames group under Gary McDarby.
The HandWave was conceived by Carson Reynolds, with whom I have worked with
closely over the past two years in developing the HandWave. While in Dublin during the
summer of 2003, we designed the first revision of the device, and made only modest progress
on the amplification circuitry. The first version of the board had a large dual-inline packaged
PIC, and no developed data transfer method. This was soon changed to a standalone ADC,
made by Texas Instruments, that used I2C data transfer.
I had spent most of the summer programming Bluetooth modules for another
Mindgames project, which was headed by Scott Eaton. These modules used a serial port
profile to transmit data from the Cerebus, a wireless EEG monitor [17]. The software for the
modules was written in C, and was based on BlueLab software distributed with Cambridge
Silicon Radio’s Casira Bluetooth development kit. I later adapted the software written for the
Cerebus’ Bluetooth modules for use with HandWave.
Throughout the following academic year, I worked as a UROP in the MIT Media Lab
Affective Computing group under Rosalind Picard. During this time I coordinated with
Carson in Dublin to produce many successful revisions of the HandWave. These revisions
used the standalone ADC with fixed gain. In general, Carson managed the software,
including a hard-coded I2C routine on the Bluetooth module. I managed the hardware,
including laying out, purchasing, and assembling prototype printed circuit boards. I also
assembled a Bluetooth programmer board at the Media Lab.
During that year, the HandWave was picked up by Winslow Burleson in the Media
Lab Affective Computing group for use in his Learning Companion project. Win built the
first wristwatch form factor, designed for monitoring childrens’ EDA levels. I built four
wrist-mounted HandWave assemblies with Velcro straps, power switches, and coin-cell
19 19
batteries. I also wrote graphical client-side software resembling an EDA thermometer in
C++. These were all used in real-time demonstrations to lab sponsors.
In the summer of 2004, I continued my work with the Mindgames group at Media Lab
Europe. It was during this summer that I worked with Stephen Hughes of the Palpable
Machines group to design and build the final revision of the HandWave. This final revision
incorporates a PIC microcontroller, dynamic variable gain, and is in many ways a
considerable improvement over previous revisions. I also worked with MLE software
developer Morgan Brickley and provided hardware for Collective Calm.
By the end of the summer, the HandWave was approaching completion. I again
secured a UROP in Rosalind Picard’s group at the MIT Media Lab for the academic year, and
made the first production run of HandWaves. This involved extended hours soldering
components, programming, and testing numerous devices. Throughout the academic year, the
HandWaves were distributed to researchers such as Kyoung Park at the Digital Media Lab in
Korea, and numerous others at MIT. Carson finally got to use a HandWave to gather EDA
data for his doctoral thesis.
During IAP (January) of 2005, I completed the majority of work on the injection
molded housing for the final HandWave revision. This was primarily motivated by the lack
of a suitable casing for the device. The design and manufacture of the housing also served to
fulfill my 2A undergraduate thesis requirement. I worked in MIT’s Lab for Manufacturing
and Productivity to design and machine the molds for the housing. As a final step, I made a
production run of 30 injection molded housings.
The biggest challenge currently facing the success of the HandWave is my imminent
graduation. Before leaving the Institute, I plan to compile a HandWave kit for anyone who
desires to use the device for research purposes. The kit may include directions for building,
programming, installing, and/or using the HandWave system. Part of the kit, the HandWave
User’s Guide, is included in this thesis report as Appendix C. Hopefully, this will provide
some stability for use of the HandWave after I have left MIT.
20 20
Appendix A: Photographs
Photograph Index
Photo 1: HandWave top view and details . . . . . . . . . . . . . 21
Photo 2: HandWave side view . . . . . . . . . . . . . 21
Photo 3: HandWave bottom view . . . . . . . . . . . . . 22
Photo 4: Final HandWave assembly . . . . . . . . . . . . . 22
Photo 5: Injected-molded housing . . . . . . . . . . . . . 23
Photo 6: Housing molds . . . . . . . . . . . . . 23
Photo 7: Wristwatch Form Factor . . . . . . . . . . . . . 24
Photo 8: Orb Form Factor . . . . . . . . . . . . . 24
Photo 9: Collective Calm screenshot . . . . . . . . . . . . . 25
Photo 10: Collective Calm hardware . . . . . . . . . . . . . 25
Photo 11: Bluetooth programmer board . . . . . . . . . . . . . 26
Photo 12: PIC programming jig . . . . . . . . . . . . . 26
Photo 13: HandWave Evolution . . . . . . . . . . . . . 27
Photo 14: Promotional poster . . . . . . . . . . . . . 27
Photo 15: Laser-cut housing (orthogonal) . . . . . . . . . . . . . 28
Photo 16: Laser-cut housing (plan) . . . . . . . . . . . . . 28
21 21
Grid Location Component Details A2 Operational Amplifier – OPA2342 Burr Brown Dual Low-Power Rail-to-Rail MSOP-8
A3 Diode – BAT54W Diodes Incorporated Schottky Barrier SOT-323
A4 Power Pins (hidden) – 0.1” pitch 3.3-16V
B3 Voltage Reference – ZRC250 Zetex 2.5V SOT-23
B4 Voltage Regulator – LP2981AIM5-3.3 National Semiconductor 3.3V 100 mA SOT-23
C1 Microcontroller – PIC16LF88 Flash SSOP-20
C2 Analog Switch – ADG712BRU Analog Devices 4Ω Quad SPST TSSOP-16
C4 Electrode Pins – 0.1” pitch
D3 PIC Programming Pads
Photo 1: Top view of HandWave (amplification board). See table for details
Photo 2: Side view of sandwiched HandWave amplification and Bluetooth boards
22 22
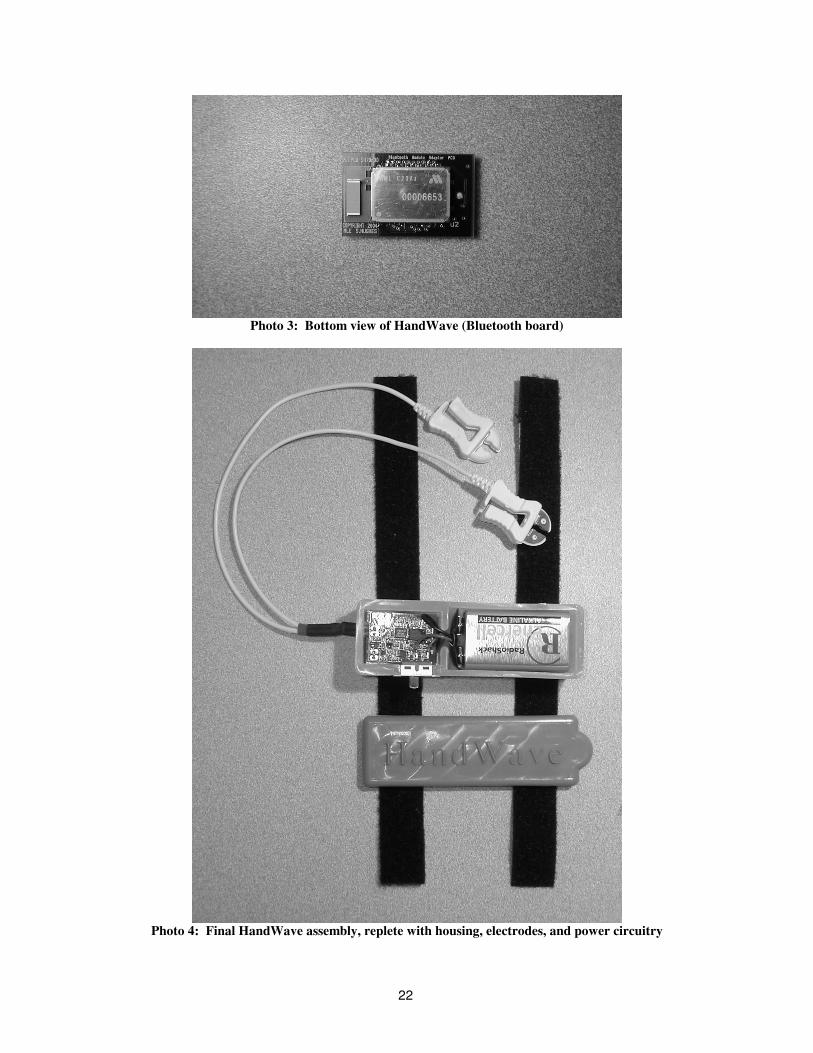
Photo 3: Bottom view of HandWave (Bluetooth board)
Photo 4: Final HandWave assembly, replete with housing, electrodes, and power circuitry
23 23
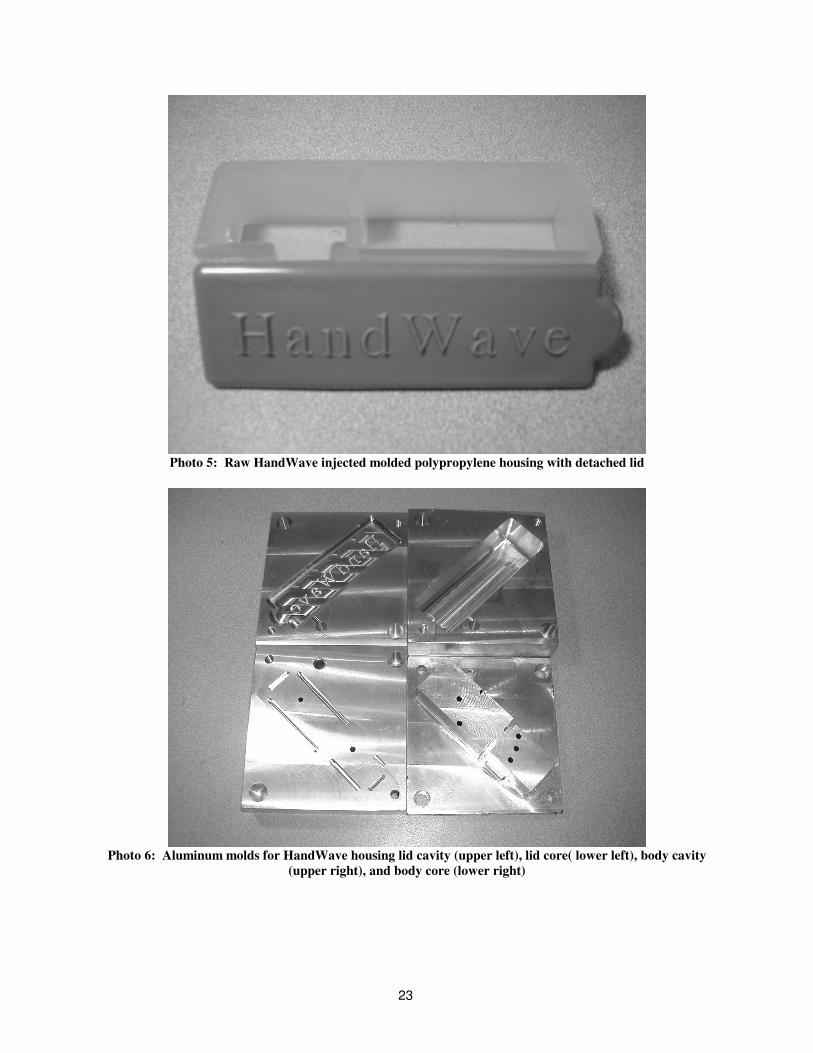
Photo 5: Raw HandWave injected molded polypropylene housing with detached lid
Photo 6: Aluminum molds for HandWave housing lid cavity (upper left), lid core( lower left), body cavity
(upper right), and body core (lower right)
24 24
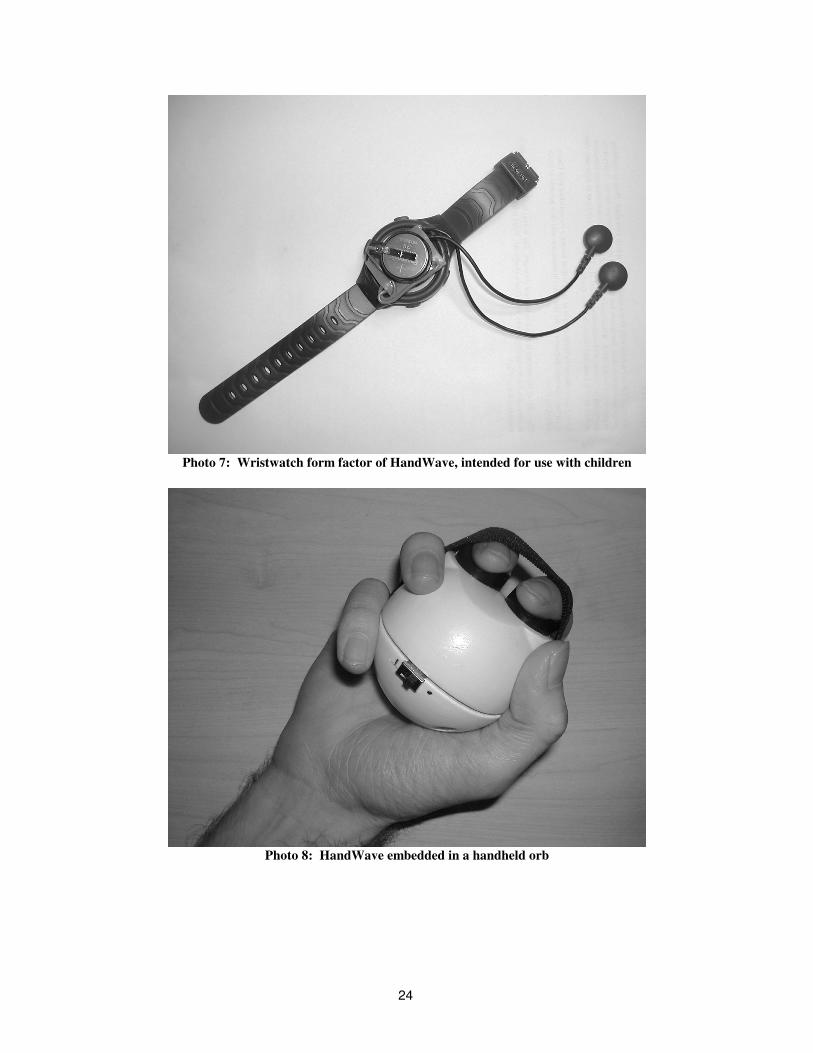
Photo 7: Wristwatch form factor of HandWave, intended for use with children
Photo 8: HandWave embedded in a handheld orb
25 25
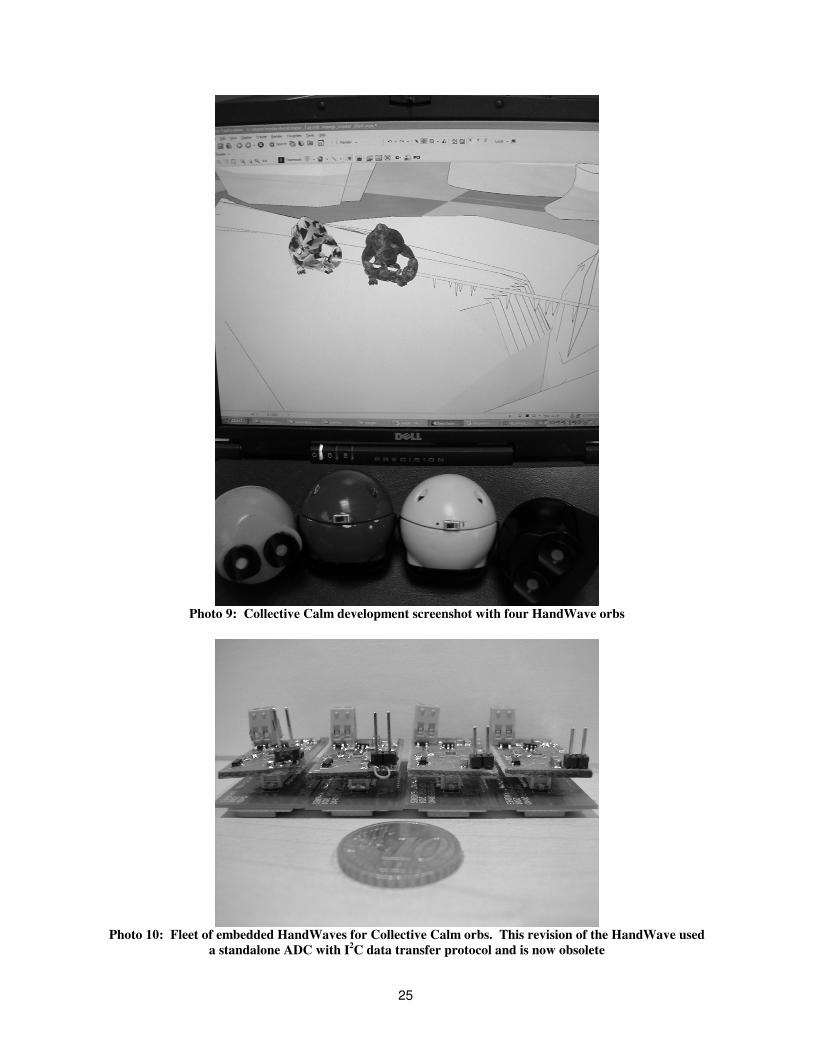
Photo 9: Collective Calm development screenshot with four HandWave orbs
Photo 10: Fleet of embedded HandWaves for Collective Calm orbs. This revision of the HandWave used
a standalone ADC with I2C data transfer protocol and is now obsolete
26 26
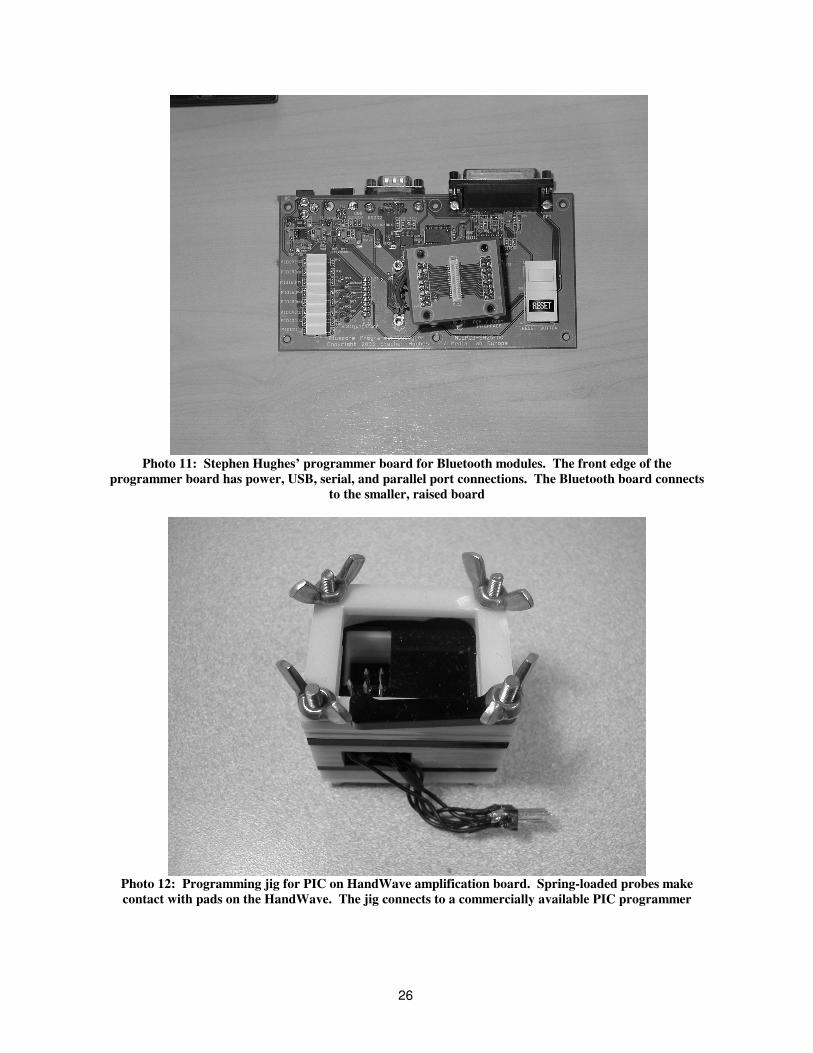
Photo 11: Stephen Hughes’ programmer board for Bluetooth modules. The front edge of the
programmer board has power, USB, serial, and parallel port connections. The Bluetooth board connects
to the smaller, raised board
Photo 12: Programming jig for PIC on HandWave amplification board. Spring-loaded probes make
contact with pads on the HandWave. The jig connects to a commercially available PIC programmer
27 27
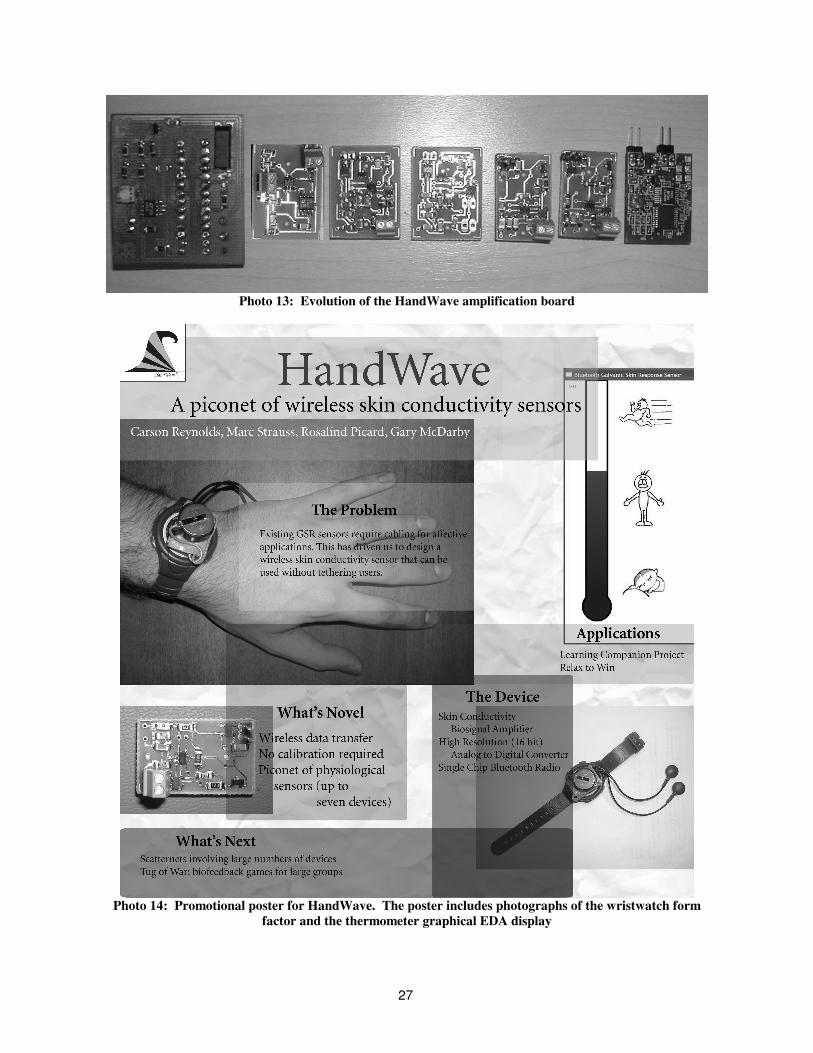
Photo 13: Evolution of the HandWave amplification board
Photo 14: Promotional poster for HandWave. The poster includes photographs of the wristwatch form
factor and the thermometer graphical EDA display
28 28
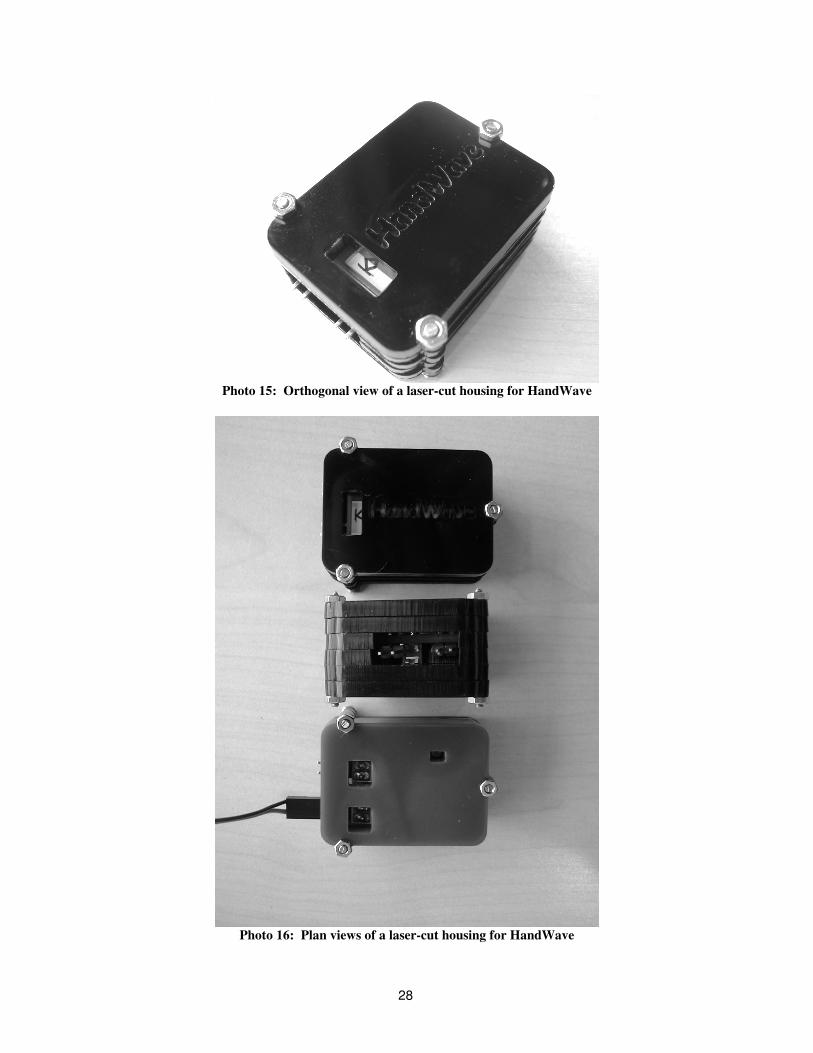
Photo 15: Orthogonal view of a laser-cut housing for HandWave
Photo 16: Plan views of a laser-cut housing for HandWave
29 29
Appendix B: Schematic, Layout, & Partlist
30 30
31 31
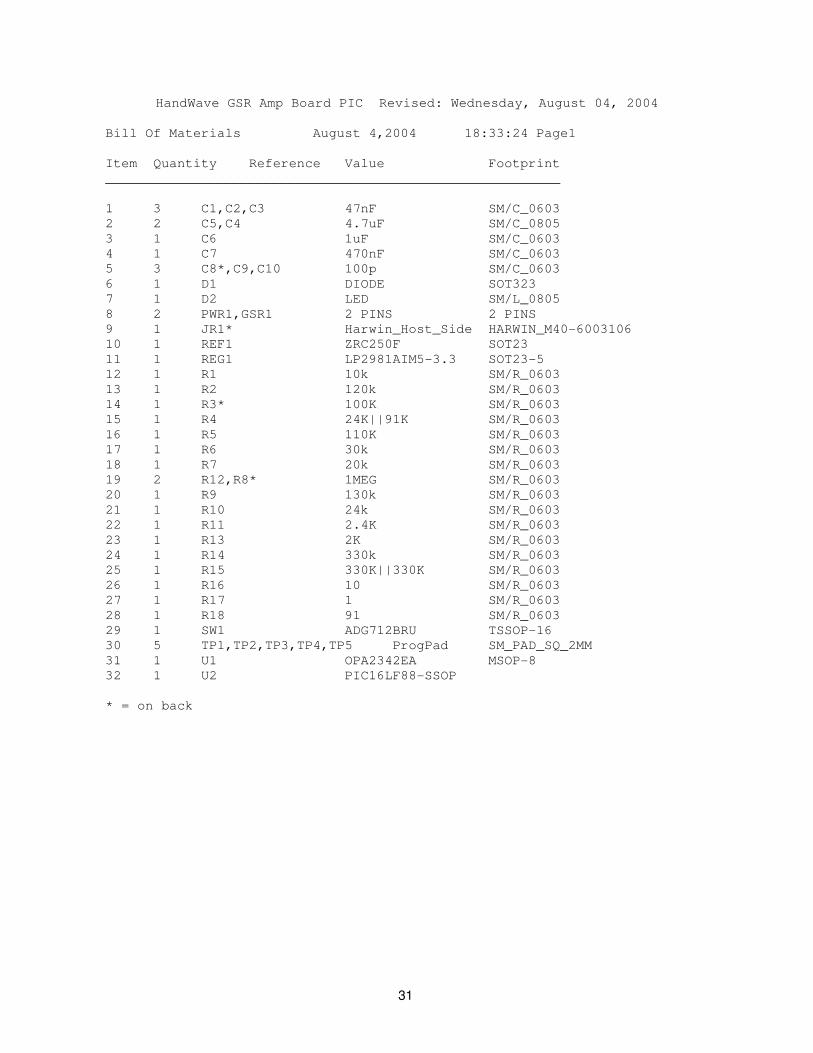
HandWave GSR Amp Board PIC Revised: Wednesday, August 04, 2004
Bill Of Materials August 4,2004 18:33:24 Page1
Item Quantity Reference Value Footprint
_________________________________________________________
1 3 C1,C2,C3 47nF SM/C_0603
2 2 C5,C4 4.7uF SM/C_0805
3 1 C6 1uF SM/C_0603
4 1 C7 470nF SM/C_0603
5 3 C8*,C9,C10 100p SM/C_0603
6 1 D1 DIODE SOT323
7 1 D2 LED SM/L_0805
8 2 PWR1,GSR1 2 PINS 2 PINS
9 1 JR1* Harwin_Host_Side HARWIN_M40-6003106
10 1 REF1 ZRC250F SOT23
11 1 REG1 LP2981AIM5-3.3 SOT23-5
12 1 R1 10k SM/R_0603
13 1 R2 120k SM/R_0603
14 1 R3* 100K SM/R_0603
15 1 R4 24K||91K SM/R_0603
16 1 R5 110K SM/R_0603
17 1 R6 30k SM/R_0603
18 1 R7 20k SM/R_0603
19 2 R12,R8* 1MEG SM/R_0603
20 1 R9 130k SM/R_0603
21 1 R10 24k SM/R_0603
22 1 R11 2.4K SM/R_0603
23 1 R13 2K SM/R_0603
24 1 R14 330k SM/R_0603
25 1 R15 330K||330K SM/R_0603
26 1 R16 10 SM/R_0603
27 1 R17 1 SM/R_0603
28 1 R18 91 SM/R_0603
29 1 SW1 ADG712BRU TSSOP-16
30 5 TP1,TP2,TP3,TP4,TP5 ProgPad SM_PAD_SQ_2MM
31 1 U1 OPA2342EA MSOP-8
32 1 U2 PIC16LF88-SSOP
* = on back
32 32
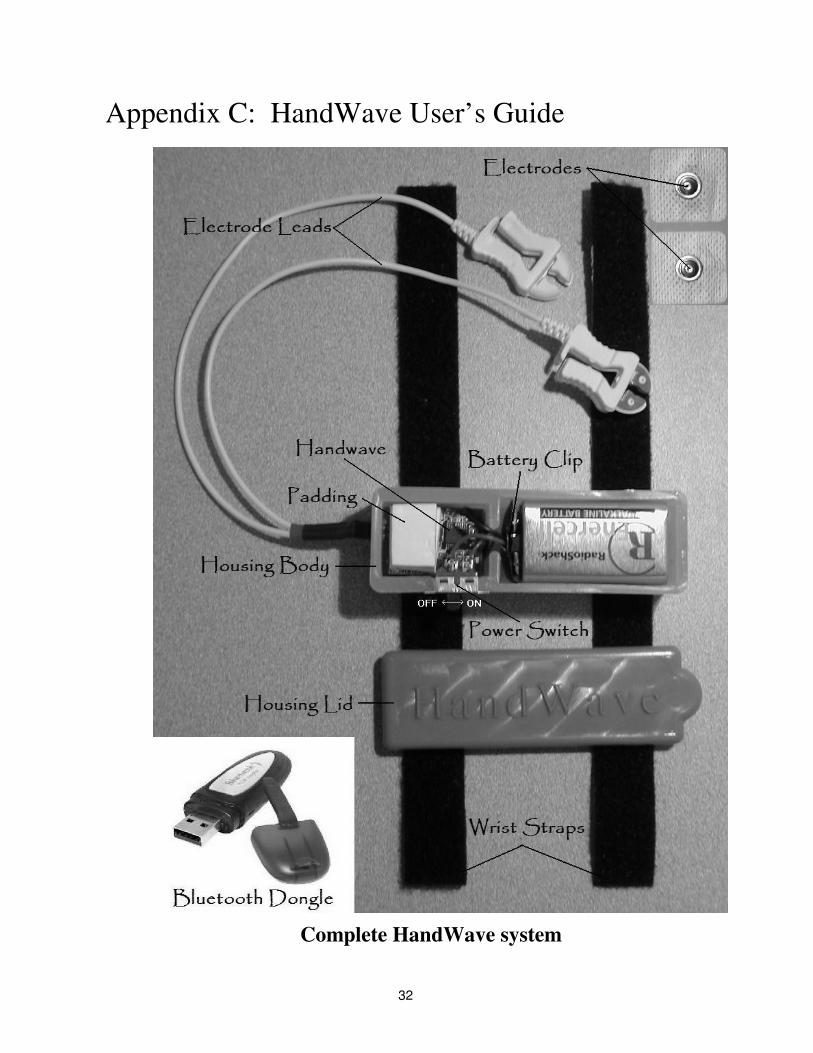
Appendix C: HandWave User’s Guide
Complete HandWave system
33 33
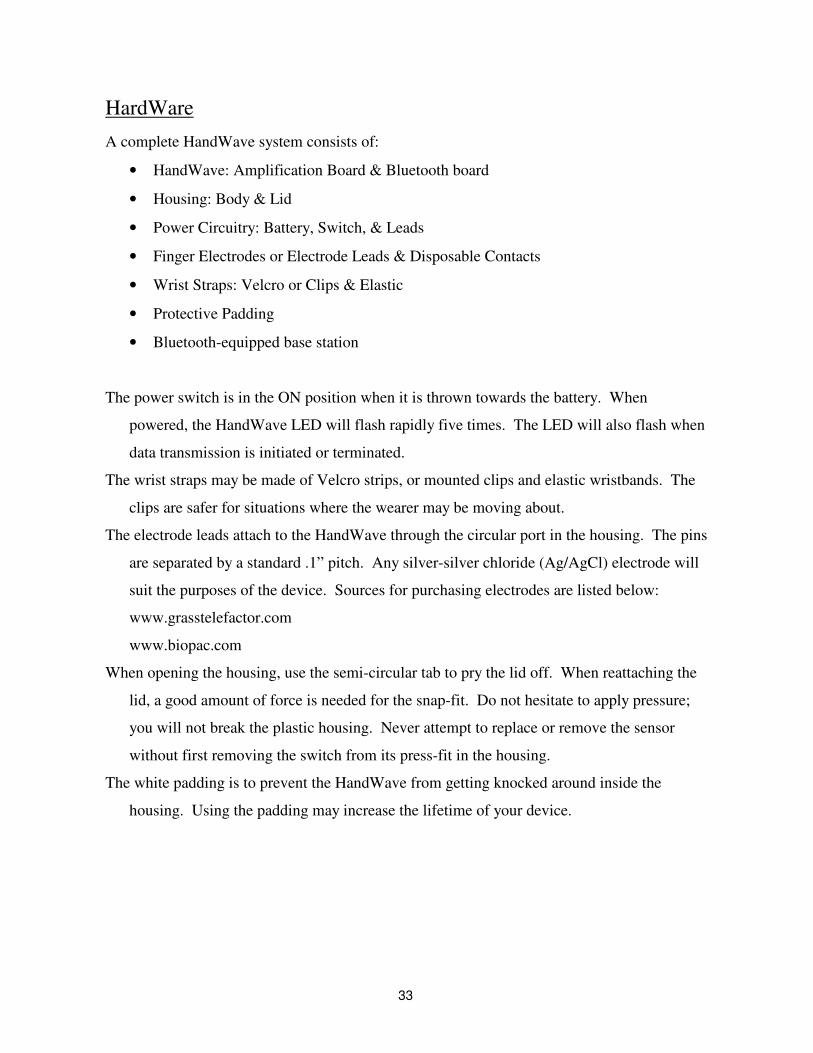
HardWare
A complete HandWave system consists of:
• HandWave: Amplification Board & Bluetooth board
• Housing: Body & Lid
• Power Circuitry: Battery, Switch, & Leads
• Finger Electrodes or Electrode Leads & Disposable Contacts
• Wrist Straps: Velcro or Clips & Elastic
• Protective Padding
• Bluetooth-equipped base station
The power switch is in the ON position when it is thrown towards the battery. When
powered, the HandWave LED will flash rapidly five times. The LED will also flash when
data transmission is initiated or terminated.
The wrist straps may be made of Velcro strips, or mounted clips and elastic wristbands. The
clips are safer for situations where the wearer may be moving about.
The electrode leads attach to the HandWave through the circular port in the housing. The pins
are separated by a standard .1” pitch. Any silver-silver chloride (Ag/AgCl) electrode will
suit the purposes of the device. Sources for purchasing electrodes are listed below:
www.grasstelefactor.com
www.biopac.com
When opening the housing, use the semi-circular tab to pry the lid off. When reattaching the
lid, a good amount of force is needed for the snap-fit. Do not hesitate to apply pressure;
you will not break the plastic housing. Never attempt to replace or remove the sensor
without first removing the switch from its press-fit in the housing.
The white padding is to prevent the HandWave from getting knocked around inside the
housing. Using the padding may increase the lifetime of your device.
34 34
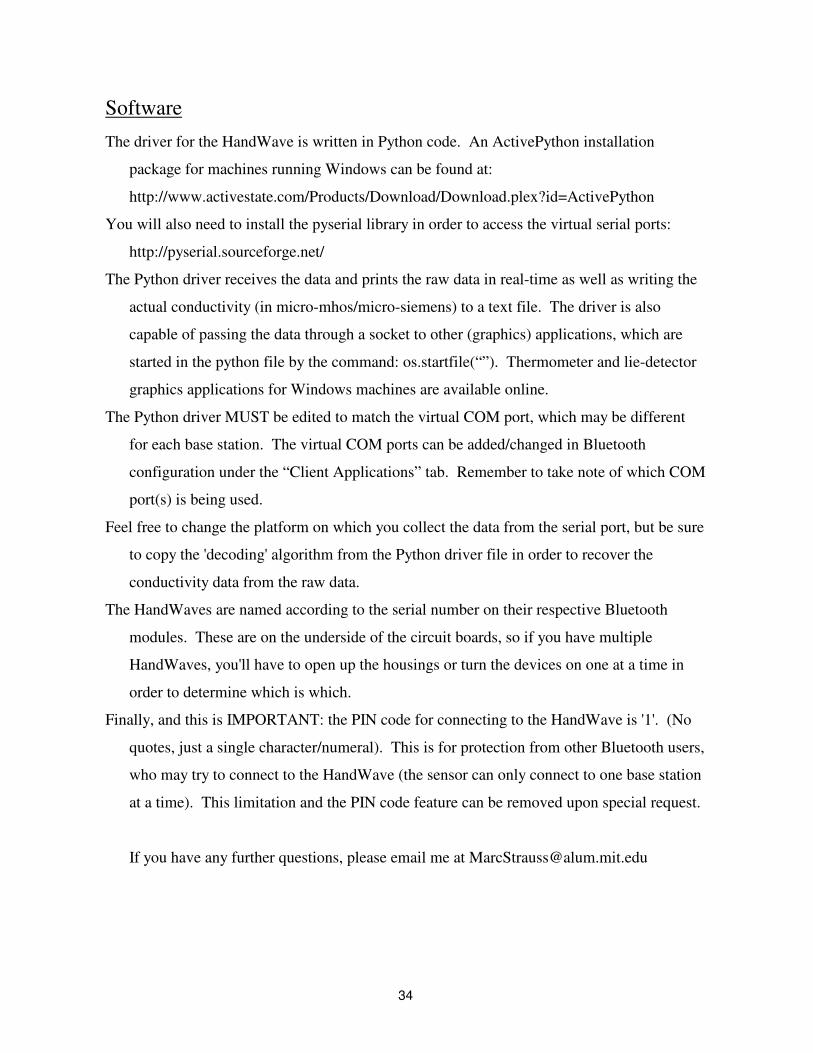
Software
The driver for the HandWave is written in Python code. An ActivePython installation
package for machines running Windows can be found at:
http://www.activestate.com/Products/Download/Download.plex?id=ActivePython
You will also need to install the pyserial library in order to access the virtual serial ports:
http://pyserial.sourceforge.net/
The Python driver receives the data and prints the raw data in real-time as well as writing the
actual conductivity (in micro-mhos/micro-siemens) to a text file. The driver is also
capable of passing the data through a socket to other (graphics) applications, which are
started in the python file by the command: os.startfile(“”). Thermometer and lie-detector
graphics applications for Windows machines are available online.
The Python driver MUST be edited to match the virtual COM port, which may be different
for each base station. The virtual COM ports can be added/changed in Bluetooth
configuration under the “Client Applications” tab. Remember to take note of which COM
port(s) is being used.
Feel free to change the platform on which you collect the data from the serial port, but be sure
to copy the 'decoding' algorithm from the Python driver file in order to recover the
conductivity data from the raw data.
The HandWaves are named according to the serial number on their respective Bluetooth
modules. These are on the underside of the circuit boards, so if you have multiple
HandWaves, you'll have to open up the housings or turn the devices on one at a time in
order to determine which is which.
Finally, and this is IMPORTANT: the PIN code for connecting to the HandWave is '1'. (No
quotes, just a single character/numeral). This is for protection from other Bluetooth users,
who may try to connect to the HandWave (the sensor can only connect to one base station
at a time). This limitation and the PIN code feature can be removed upon special request.
If you have any further questions, please email me at [email protected]
35 35
HandWave:
A Wearable Wireless Bluetooth Skin Conductance
Sensor
Marc Strauss1, Carson Reynolds1, Stephen Hughes2, Kyoung Park3,
Gary McDarby2, and Rosalind W. Picard1
1 MIT Media Laboratory, 20 Ames Street, Cambridge, Massachusetts, 02139 USA mstrauss, carsonr, [email protected]
2 Media Lab Europe, Sugar House Lane, Bellevue, Dublin 8, Ireland
Stephen.Hughes, [email protected]
3 Digital Media Lab, 517-10 Dogok-Dong, Gangnam-gu, Seoul, Korea
Abstract. HandWave is a small, wireless, networked skin conductance sensor for affective computing applications. It is used to detect information related to
emotional, cognitive, and physical arousal of mobile users. Many existing
affective computing systems make use of sensors that are inflexible and often
physically attached to supporting computers. In contrast, HandWave allows an
additional degree of flexibility by providing ad-hoc wireless networking
capabilities to a wide variety of Bluetooth devices as well as adaptive biosignal
amplification. As a consequence, HandWave is used in a variety of affective
computing applications such as games, tutoring systems, experimental data
collection, and augmented journaling. This paper describes the novel design
attributes of this handheld sensor, its development, and various form factors. Future work includes an extension of this approach to other biometric signals of
interest to affective computing researchers.
Author Keywords: Sensors, Affective Computing, Electrodermal Activity
(EDA), Skin Conductance, Emotion Recognition, Wearable Computing,
Bluetooth, Wireless Sensing.
ACM Classification Keywords: I.2.9.j Sensors B.4.3.h [Wireless systems]; H.5.2 [Information Interfaces and Presentation]: User Interfaces - theory and
methods
1 Untethered Affect
Much of the work on ubiquitous and perceptual computing has focused on ways in
which individuals can interact with computers in less constrained contexts than typing on a keyboard at a fixed desk. Indeed, affective computing ("computing that relates to, arises from, or deliberately influences emotion" [1]) is motivated in part by the
potential for more human-like and natural communication with computers. Ironically,
Appendix D: UbiComp 2005 Submission
36 36
many current affective computing prototypes require that users be tethered in an
unnatural, and often cumbersome, manner. The HandWave device provides an example of a noticeably more flexible approach to sensing for affect, viewed from the standpoint of both users and application developers.
1.1 Affect Sensing
An affect sensor is a device that receives an input signal and processes it in order to detect some evidence of emotions. There are many techniques and modalities used to detect affect: physiological sensors, facial expression recognition, speech prosody
recognition, and pressure sensors [2] have all been applied to the problem. Affect sensors are often coupled with algorithms that are specifically designed to distinguish
and classify patterns associated with emotional states [3]. Among physiological signals, electrodermal activity [4], respiration, eletrokardiogram (EKG), and eyeblink rates have already been investigated by psychophysiology researchers.
Of these, the electrodermal activity is one of the more straightforward to work with as it is easy to collect and interpret. Electrodermal activity (EDA) is a broad term which has been used to describe the electrical properties of the skin, which give
evidence of psychophysiological activity [5]. Electrodermal response (EDR) and galvanic skin response (GSR) are terms used by the psychophysiology community to describe the changes which take place on the stratum corneum layer of the skin in
response to the sympathetic nervous system [6]. It is thought that the autonomic functions of the brain control the output of sweat glands and that the electrodermal activity varies with psychological changes such as increased arousal or anxiety [7].
1.2 Existing Electrodermal Activity Devices
A variety of devices and circuit designs already exist for detecting electrodermal activity. Three of the designs discussed below require that the user be cabled to a host computer. The last design, which uses Bluetooth, is similar to the HandWave, but is
proprietary and closed.
ProComp. Biofeedback data acquisition devices have been used by a number of
researchers to capture physiological data for affective computing applications. In addition to skin conductance, the ProComp series from Thought Technology Ltd. [8]
is capable of capturing eight other channels that can be configured to collect "EEG, EKG, RMS EMG, ... heart rate, blood volume pulse, respiration, goniometry, force, and voltage input." The device communicates to a host computer using a fiber-optic
cable, requiring the user to be tethered.
BioPac. The BioPac MP [9] is a modular system for collecting a variety of
physiological signals for research or educational purposes. The system provides a data-acquisition board that can be connected to a host computer by USB or Ethernet cable. A variety of amplifier modules can be purchased for a wide variety of
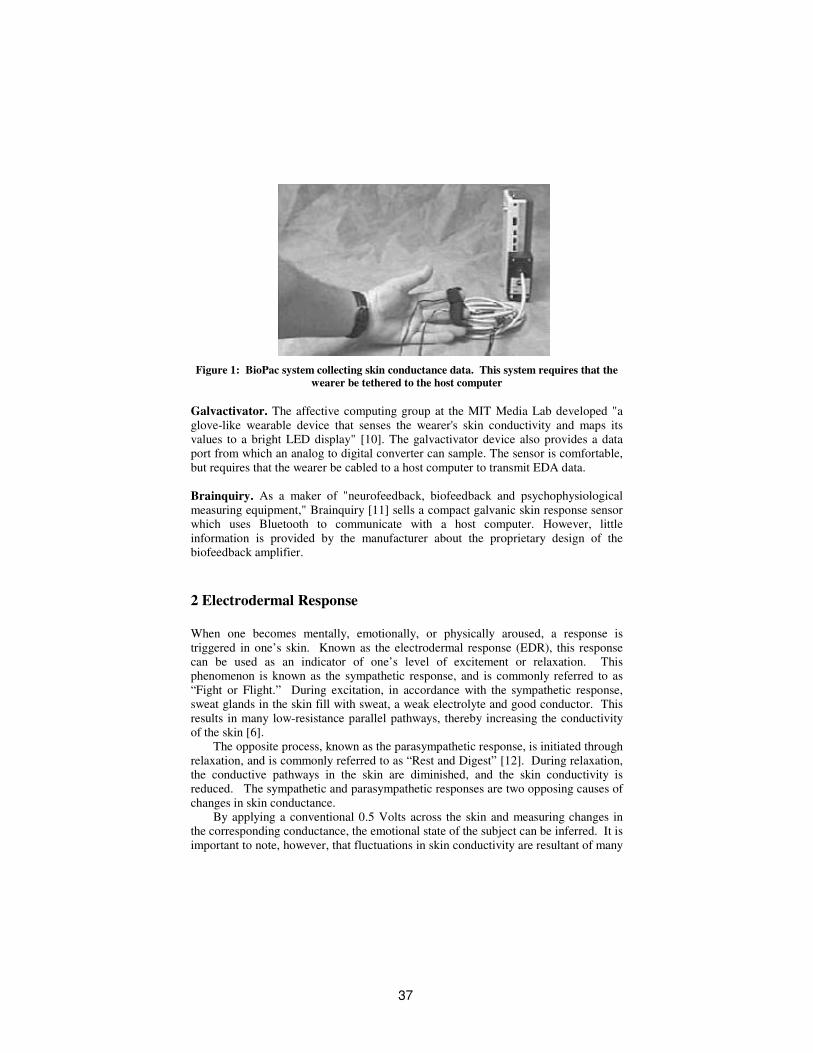
physiological signals including skin conductance. Figure 1 shows the BioPac system collecting skin conductance data.
37 37
Figure 1: BioPac system collecting skin conductance data. This system requires that the
wearer be tethered to the host computer
Galvactivator. The affective computing group at the MIT Media Lab developed "a
glove-like wearable device that senses the wearer's skin conductivity and maps its values to a bright LED display" [10]. The galvactivator device also provides a data port from which an analog to digital converter can sample. The sensor is comfortable,
but requires that the wearer be cabled to a host computer to transmit EDA data.
Brainquiry. As a maker of "neurofeedback, biofeedback and psychophysiological
measuring equipment," Brainquiry [11] sells a compact galvanic skin response sensor which uses Bluetooth to communicate with a host computer. However, little
information is provided by the manufacturer about the proprietary design of the biofeedback amplifier.
2 Electrodermal Response
When one becomes mentally, emotionally, or physically aroused, a response is
triggered in one’s skin. Known as the electrodermal response (EDR), this response can be used as an indicator of one’s level of excitement or relaxation. This phenomenon is known as the sympathetic response, and is commonly referred to as
“Fight or Flight.” During excitation, in accordance with the sympathetic response, sweat glands in the skin fill with sweat, a weak electrolyte and good conductor. This
results in many low-resistance parallel pathways, thereby increasing the conductivity of the skin [6].
The opposite process, known as the parasympathetic response, is initiated through
relaxation, and is commonly referred to as “Rest and Digest” [12]. During relaxation, the conductive pathways in the skin are diminished, and the skin conductivity is reduced. The sympathetic and parasympathetic responses are two opposing causes of
changes in skin conductance. By applying a conventional 0.5 Volts across the skin and measuring changes in
the corresponding conductance, the emotional state of the subject can be inferred. It is
important to note, however, that fluctuations in skin conductivity are resultant of many
38 38
types of arousal. By observing only these changes, it is impossible to deduce without
prior knowledge, whether the subject has become happy, startled, or physically active. EDA consists of two components: tonic and phasic [4]. The tonic component is a
low frequency baseline conductivity level, which can oscillate over the course of days.
The phasic component rides on top of the tonic component, is of higher frequency, and generally increases when a person is aroused. Problematically, each person has a
different tonic conductivity, so in order to infer the arousal level of the subject, the relative changes in EDA must be analyzed over a period of time. Furthermore, skin conductance (measured in units of siemens; formerly mhos) depends on the skin path
length between the two electrodes contacts, even for subjects with identical skin conductivity (measured in units of siemens/meter). It is for these reasons that it is crucial to analyze the temporal variations of the EDA signal. The subject should be
prompted with stimuli to elicit EDR in order to gather operative EDA data.
3 HardWare
The core of the HandWave consists of two sandwiched printed circuit boards, one
containing amplification circuitry, and one containing the Bluetooth module. The amplifier board provides the power connections and the terminal for the pair of electrodes. The device resides within an injection molded polypropylene housing,
which includes an external power switch and electrode connection port. We have designed the HandWave electronics and periphery in order to facilitate
ease of use. For such a technology to become widespread, universality is essential.
We decided to use Bluetooth technology and a standard battery size in order to increase the universality of the HandWave. These features allow the HandWave to be an off-the-shelf device, equipped for maximum operation with minimal support.
3.1 Amplifier Board The amplification circuitry resident on the HandWave is centered around a PIC 16LF88 microcontroller. The PIC collects the EDA data, communicates with the
processor embedded in the Bluetooth module, and controls the gain of the amplification circuitry. The analog-to-digital converter on the PIC is used to gather the EDA data. During operation, if the EDA signal approaches the limit of the ADC
range, the PIC will adjust the amplification gain accordingly. The HandWave uses this adjustable gain to initially center and continually adjust the gain mode in order to increase EDA data resolution.
The signal amplification on the HandWave has two stages, implemented on a dual-package operational amplifier. The first stage of amplification uses a 0.5 Volt reference to maintain a constant voltage across the skin. In accordance with an
inverting amplifier configuration, the voltage gain of this stage is controlled by a resistance ratio. One of these resistances is provided by the subject’s skin, as
measured between a pair of electrodes. The other is subject to alteration by an analog switch, controlled by the PIC, which provides four different gain modes by switching different resistors into the circuit. The schematic for this first amplification stage is
39 39
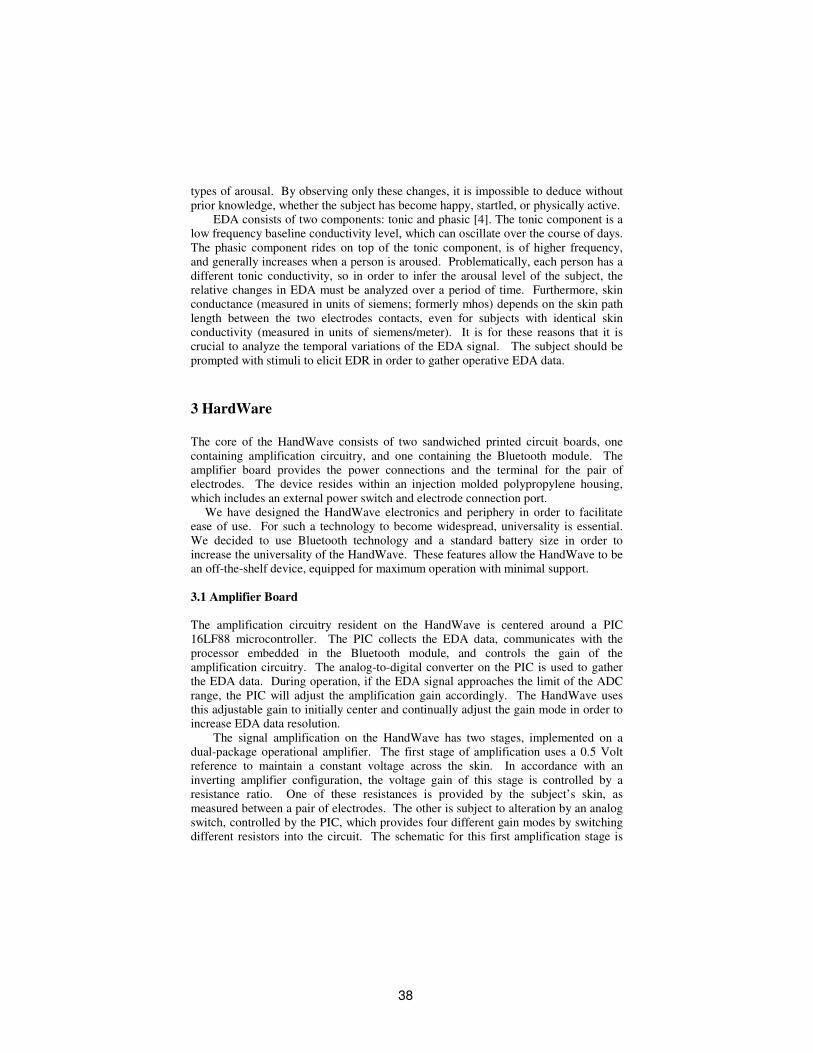
shown in Figure 2. The second amplification stage is used to invert, scale, and shift
the EDA signal in order to match the PIC ADC usable voltage range. The HandWave can measure skin conductance levels between 0 and 40 micro-
siemens (µS). The four gain modes have ranges of 0-5, 4-10, 8-20, and 16-40 µS. The
gain mode information is transferred in parallel with ADC readings so the receiving computer can reconstruct the absolute measured skin conductance level.
Figure 2: First EDA signal amplification stage. The PIC can adjust the gain if the signal
approaches the limit of the ADC range. Four gain modes are implemented in this way
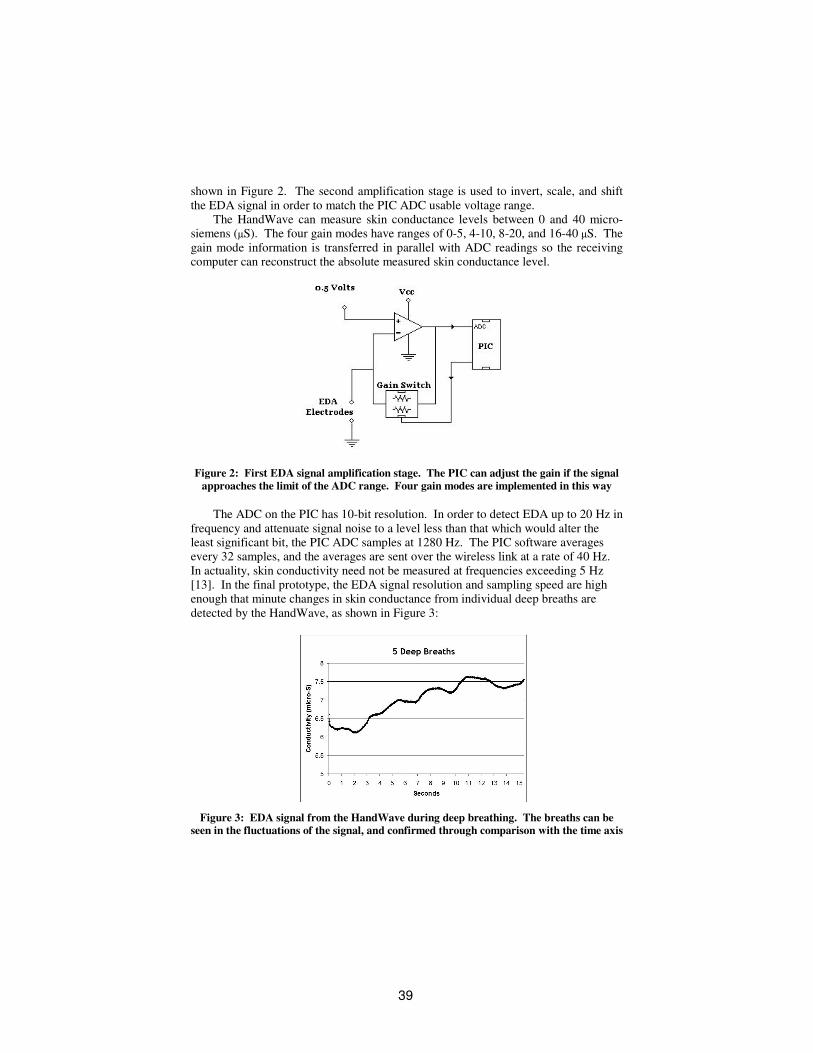
The ADC on the PIC has 10-bit resolution. In order to detect EDA up to 20 Hz in
frequency and attenuate signal noise to a level less than that which would alter the least significant bit, the PIC ADC samples at 1280 Hz. The PIC software averages every 32 samples, and the averages are sent over the wireless link at a rate of 40 Hz.
In actuality, skin conductivity need not be measured at frequencies exceeding 5 Hz [13]. In the final prototype, the EDA signal resolution and sampling speed are high enough that minute changes in skin conductance from individual deep breaths are
detected by the HandWave, as shown in Figure 3:
Figure 3: EDA signal from the HandWave during deep breathing. The breaths can be
seen in the fluctuations of the signal, and confirmed through comparison with the time axis
40 40
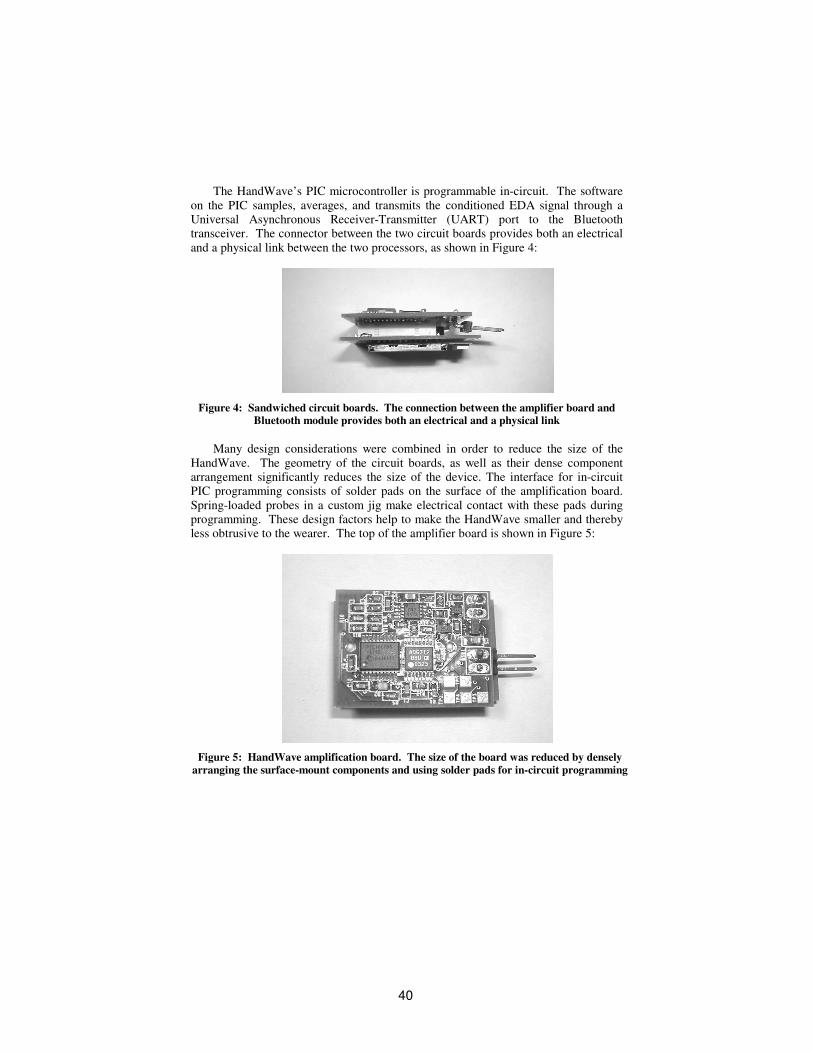
The HandWave’s PIC microcontroller is programmable in-circuit. The software
on the PIC samples, averages, and transmits the conditioned EDA signal through a Universal Asynchronous Receiver-Transmitter (UART) port to the Bluetooth transceiver. The connector between the two circuit boards provides both an electrical
and a physical link between the two processors, as shown in Figure 4:
Figure 4: Sandwiched circuit boards. The connection between the amplifier board and Bluetooth module provides both an electrical and a physical link
Many design considerations were combined in order to reduce the size of the
HandWave. The geometry of the circuit boards, as well as their dense component arrangement significantly reduces the size of the device. The interface for in-circuit PIC programming consists of solder pads on the surface of the amplification board.
Spring-loaded probes in a custom jig make electrical contact with these pads during programming. These design factors help to make the HandWave smaller and thereby less obtrusive to the wearer. The top of the amplifier board is shown in Figure 5:
Figure 5: HandWave amplification board. The size of the board was reduced by densely
arranging the surface-mount components and using solder pads for in-circuit programming
41 41
3.2 Bluetooth Board
The Bluetooth transceiver used for the HandWave is a Mitsumi WML-C20A module.
This module is integrated with an antenna and a processor with 512 kB of flash ROM. During normal operation, the module streams the EDA output received from the PIC over the wireless link to a nearby Bluetooth-equipped computer. Being a
class-1 module, the WML-C20A is specified to be able to maintain connections at up to 100 meters. The Bluetooth module can also send information received over the wireless link to the PIC, resulting in bi-directional data transfer capabilities.
The majority of the programming on the Bluetooth module processor is dedicated to managing the wireless link. The HandWave conforms to the serial port profile, a Bluetooth data transfer protocol that mimics a physical serial port. Any software on
the receiving end of the link can simply address the Bluetooth connection by means of a (virtual) serial port. The bi-directional nature of the communications link allows
starting and stopping the stream of EDA data through the use of start and stop codes sent through the virtual serial port over the wireless link.
The Bluetooth module is programmed by means of the connector that otherwise
holds it to the amplification board. The programmer board is modeled after the Casira development kit available from Cambridge Silicon Radios. The system allows C-style software to be compiled and flashed onto the Bluetooth module through a
parallel port. Furthermore, the module can fully function while on the programmer board, so both wireless and UART (serial port) communications are available.
3.3 Power and electrodes
The HandWave can be powered by any voltage source between 3.3 and 16 Volts. The
device has been measured to draw approximately 70 mA of current during normal operation. The majority of the current is drawn by the Bluetooth module, which is specified to consume up to 150 mA.
The voltage source provides power to a 3.3 Volt regulator on the amplification board. The power terminals are incorporated with a diode in such a way that if power
is provided backwards to the device, a resistor burns out and the rest of the HandWave’s electronics are protected. This has proved to be an effective solution to unavoidable occasional human error.
Medical-grade electrodes are used in conjunction with conductive gel to provide a reliable electrical connection to the subject’s skin. We have used Ag/AgCl electrodes placed either on two adjacent fingers or on opposite sides of the palm. These
configurations both provide skin path lengths on the order of four inches.
3.4 Housing
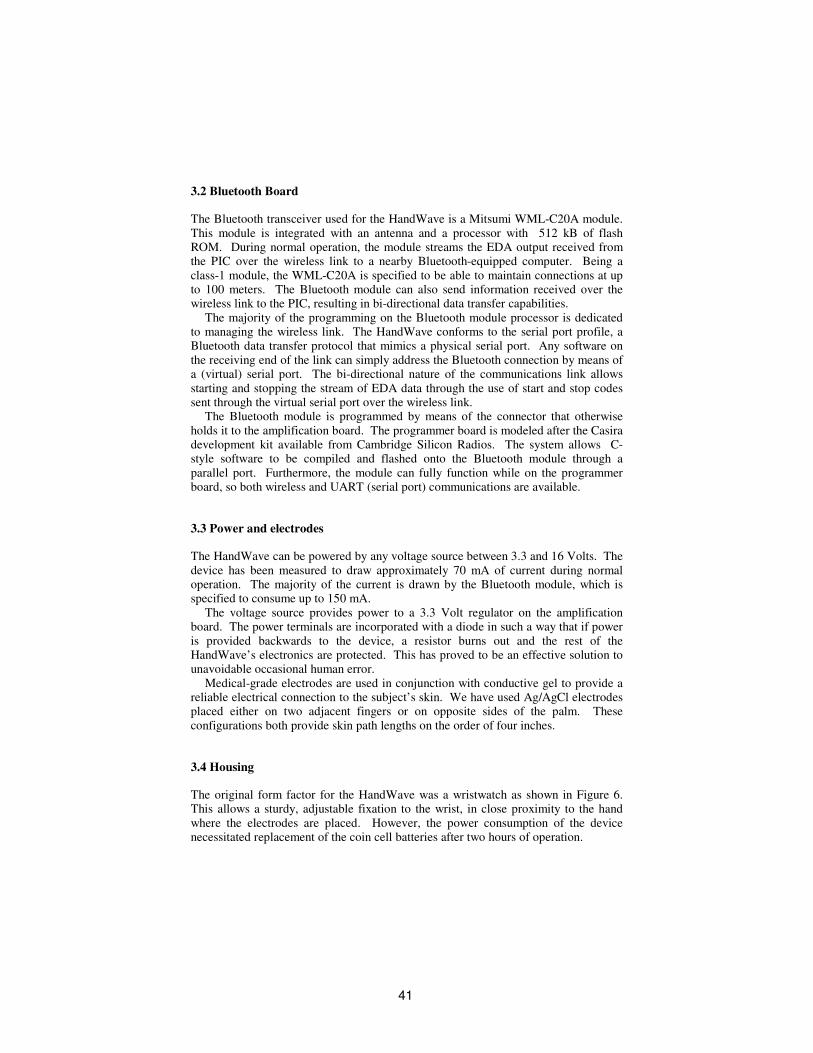
The original form factor for the HandWave was a wristwatch as shown in Figure 6. This allows a sturdy, adjustable fixation to the wrist, in close proximity to the hand
where the electrodes are placed. However, the power consumption of the device necessitated replacement of the coin cell batteries after two hours of operation.
42 42
Figure 6: Wristwatch form factor. The power consumption of the device necessitated
frequent replacement of the coin cell batteries seen in the photograph
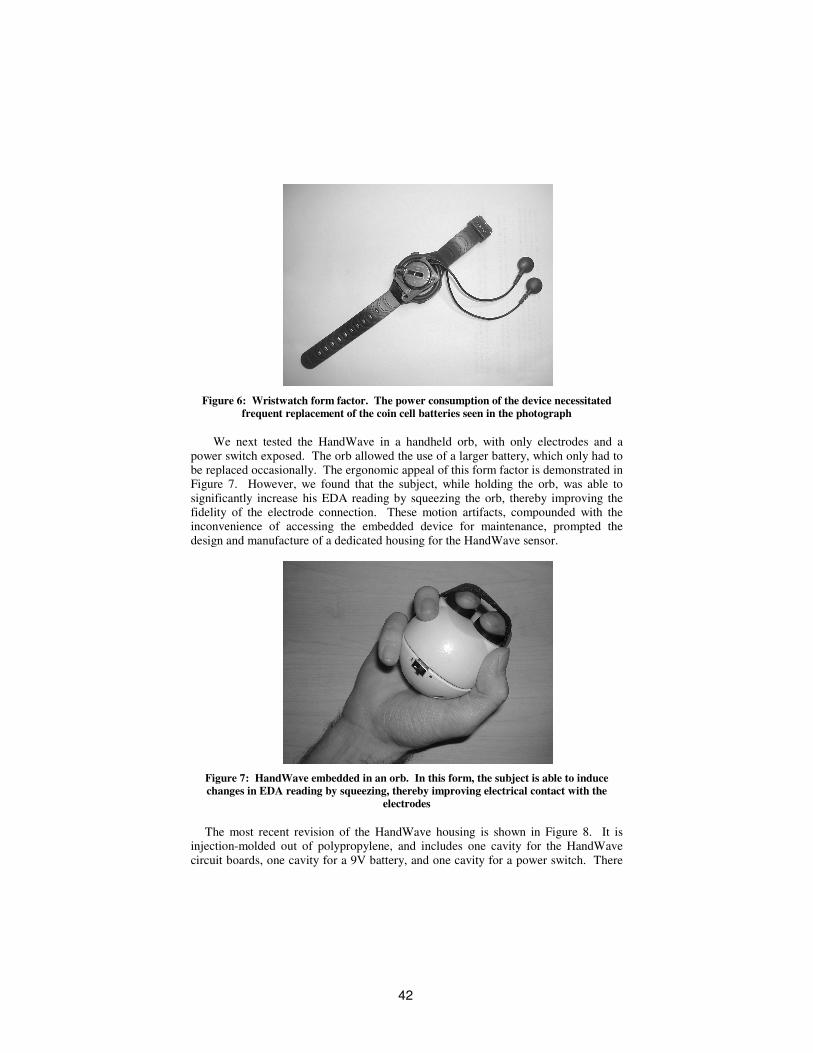
We next tested the HandWave in a handheld orb, with only electrodes and a
power switch exposed. The orb allowed the use of a larger battery, which only had to be replaced occasionally. The ergonomic appeal of this form factor is demonstrated in Figure 7. However, we found that the subject, while holding the orb, was able to
significantly increase his EDA reading by squeezing the orb, thereby improving the fidelity of the electrode connection. These motion artifacts, compounded with the inconvenience of accessing the embedded device for maintenance, prompted the
design and manufacture of a dedicated housing for the HandWave sensor.
Figure 7: HandWave embedded in an orb. In this form, the subject is able to induce
changes in EDA reading by squeezing, thereby improving electrical contact with the
electrodes
The most recent revision of the HandWave housing is shown in Figure 8. It is injection-molded out of polypropylene, and includes one cavity for the HandWave
circuit boards, one cavity for a 9V battery, and one cavity for a power switch. There

43 43
is also a single port on the side of the housing for connecting the electrodes to the
amplifier board. The housing can be mounted on the wrist with Velcro straps or clips. The lid attaches to the housing body by means of a snap fit, and the power switch, circuit boards, and battery are press-fit into their respective cavities.
Figure 8: The HandWave, replete with housing, battery, wrist straps, and electrode leads
This housing has solved our previous problems, while presenting only minor issues. The 9V battery provides power for approximately 10 hours of operation, and the
press/snap fit assembly allows easy access to the interior elements. Finally, the electrodes are not situated on the housing itself, which prevents the wearer from inducing significant motion artifacts in the EDA signal.
4 Applications
The HandWave device is currently being used in a variety of different applications. This is due in part to the ease with which the device can be integrated into existing systems: the use of Bluetooth technology gives the HandWave universal connectivity,
and the standard battery size and easy-access housing make it user-friendly. This
44 44
allows the HandWave to transmit EDA data to preexisting computers, PDAs, mobile
phones, or any other device which is equipped with a Bluetooth transceiver.
4.1 Existing Applications
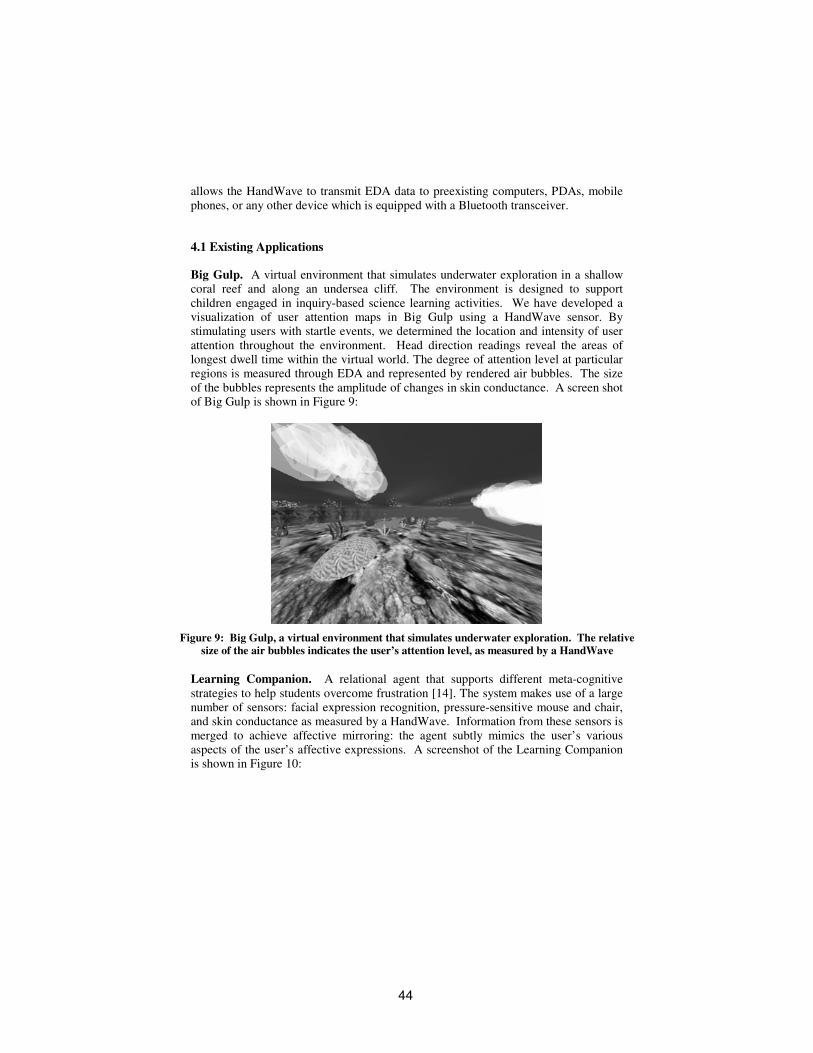
Big Gulp. A virtual environment that simulates underwater exploration in a shallow coral reef and along an undersea cliff. The environment is designed to support
children engaged in inquiry-based science learning activities. We have developed a visualization of user attention maps in Big Gulp using a HandWave sensor. By stimulating users with startle events, we determined the location and intensity of user
attention throughout the environment. Head direction readings reveal the areas of longest dwell time within the virtual world. The degree of attention level at particular regions is measured through EDA and represented by rendered air bubbles. The size
of the bubbles represents the amplitude of changes in skin conductance. A screen shot of Big Gulp is shown in Figure 9:
Figure 9: Big Gulp, a virtual environment that simulates underwater exploration. The relative
size of the air bubbles indicates the user’s attention level, as measured by a HandWave
Learning Companion. A relational agent that supports different meta-cognitive
strategies to help students overcome frustration [14]. The system makes use of a large number of sensors: facial expression recognition, pressure-sensitive mouse and chair, and skin conductance as measured by a HandWave. Information from these sensors is
merged to achieve affective mirroring: the agent subtly mimics the user’s various aspects of the user’s affective expressions. A screenshot of the Learning Companion is shown in Figure 10:
45 45
Figure 10. Learning Companion, a relational agent that supports different meta-cognitive
strategies to help students overcome frustration
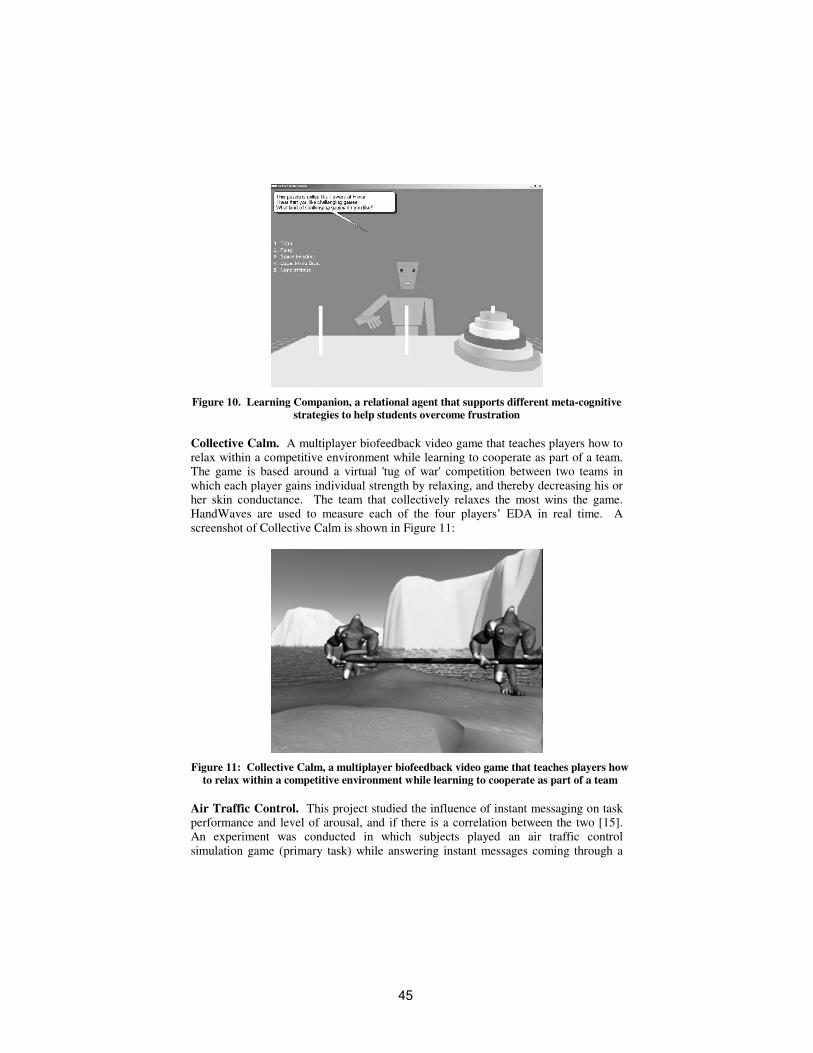
Collective Calm. A multiplayer biofeedback video game that teaches players how to relax within a competitive environment while learning to cooperate as part of a team. The game is based around a virtual 'tug of war' competition between two teams in
which each player gains individual strength by relaxing, and thereby decreasing his or her skin conductance. The team that collectively relaxes the most wins the game. HandWaves are used to measure each of the four players’ EDA in real time. A
screenshot of Collective Calm is shown in Figure 11:
Figure 11: Collective Calm, a multiplayer biofeedback video game that teaches players how
to relax within a competitive environment while learning to cooperate as part of a team
Air Traffic Control. This project studied the influence of instant messaging on task performance and level of arousal, and if there is a correlation between the two [15]. An experiment was conducted in which subjects played an air traffic control
simulation game (primary task) while answering instant messages coming through a
46 46
classical chat interface (secondary task). Task performance, time delay to respond to
IM, and skin conductance were measured during successive scenarios involving different levels of workload and flows of IM.
4.2 Ongoing Work
A number of projects are in progress to further the development and application of the
HandWave sensor. Numerous researchers at the Massachusetts Institute of Technology continue to use the HandWave to collect EDA data for affective computing research. Motorola Inc. has been developing mobile phone prototypes
based on the HandWave design. Educational games incorporating biofeedback by means of a HandWave sensor are being further developed in order to study how game
players react to stimuli.
5 Conclusions
We have described a wearable wireless skin conductance sensor, HandWave, and applications. The HandWave’s small, unobtrusive form factor and use of wireless
data transfer provide an additional degree of flexibility when compared to tethered skin conductance sensors. The use of Bluetooth technology and a standard battery size allows for portability and quick system integration.
Future possibilities for the HandWave include creation of similar EKG, pulse rate, respiration, and other biosignal amplifiers for use with Bluetooth wireless data
transfer. Furthermore, EDA sensors can be installed in existing handheld devices such as cellular phones, which already possess wireless capabilities.
47 47
Acknowledgments
THANK YOU,
Carson Reynolds and Stephen Hughes, with whom I worked most closely in developing the
HandWave. Without your guidance and constant support, this project would never have
left the ground.
Rosalind Picard and Gary McDarby, my group leaders at the Media Lab and MLE
respectively, who always had faith in the successful creation of the HandWave.
Peter So, my 2A advisor and undergraduate thesis advisor.
Mark Belanger, David Dow, and Patrick McAtamney, the LMP shop guys who were always
willing to lend a hand…or a bandage.
Media Lab & MIT UROP programs, which kept me funded during the academic year.
Scott Eaton, Morgan Brickley, Aidan Corbett, Ross O’Neill, Damini Kumar, and the rest of
the MindGames group – cheers lads, pints at MacGruders wouldn’t have been the same
without you.
Win Burleson, Phil Davis, Kyoung Park, and any future researchers who use HandWave.
All of my MIT professors, TAs, and LAs, who have taught me an immeasurable amount
throughout my four years at the Institute.
48 48
References
[1] Picard R.W. (1997). Affective Computing (MIT Press, Cambridge, MA).
[2] Reynolds, C. (2001). The sensing and measurement of frustration with computers. Master's
Thesis. Massachusetts Institute of Technology , Cambridge , MA.
[3] Qi, Y. and Picard, R.W. (2002). Context-sensitive Bayesian Classifiers and Application to
Mouse Pressure Pattern Classification, in Proceedings of International Conference on Pattern
Recognition, August 2002, Quebec City, Canada.
[4] Boucsein, W. (1992). Electrodermal Activity, Plenum Series in Behavioral
Psychophysiology and Medicine, Plenum Press.
[5] Fuller, G. D. (1977). Biofeedback Methods and Procedures in clinical practice.
[6] Malmivuo, J. Plonsey, R. "Bioelectromagnetism." The Electrodermal Response. Oxford
University Press: New York. 1995.
[7] Fenz, W. D. and Epstein, S. (1967). Gradients of Physiological Arousal in Parachutists as a
Function of an Approaching Jump. Psychosomatic Med., vol. 29, no. 1, Jan.-Feb. 1967, pp.
33-51.
[8] Thought Technology Ltd. (2005). Biofeedback Equipment: ProComp Infiniti Hardware.
http://www.thoughttechnology.com/procomp.htm
[9] BioPac Systems, Inc. (2005). MP System Features.
http://www.biopac.com/mp100_features.htm
[10] Picard, R. W. and Scheirer, J. (2001). The Galvactivator: A Glove that Senses and
Communicates Skin Conductivity. Proceedings 9th Int. Conf. on HCI, 2001, New Orleans,
USA, 2001.
[11] Brainquiry, BV. (2005). PET-GSR Wireless. http://www.brainquiry.nl/shop.php?pId=24
[12] Marchello, E. (2005). The Autonomic Nervous System
http://microvet.arizona.edu/Courses/VSC401/autonomicNervous.html
[13] Geddes L.A., Baker L.E. (1989). Principles of Applied Biomedical Instrumentation, 3rd ed.,
John Wiley, New York, N.Y.
[14] Burleson, W. and R. W. Picard (2004). Affective Agents: Sustaining Motivation to Learn
Through Failure and a State of Stuck. Social and Emotional Intelligence in Learning
Environments Workshop In conjunction with the 7th International Conference on Intelligent
Tutoring Systems, Maceio - Alagoas, Brasil, August 31st, 2004.
[15] Bruni, S. (2004). The role of instant messaging on performance and level of arousal.
http://courses.media.mit.edu/2004spring/mas630/04.projects/sbruni/
49 49
[16] Rivoire, Kelly. “Papers Released On Media Lab in Ireland.” The Tech. Volume 125,
Number 11. Tuesday, March 8, 2005.
[17] Eaton, Scott. “Cerebus.” http://mindgames.mle.ie/projects/cerebus/projectCerebus.htm
[18] “Bluetooth SIG Members.” http://www.bluetooth.com/about/members.asp
[19] Chun, Jung-Hoon. “Injection Molding.” Lecture Slides, 2.008 Manufacturing and
Productivity. Fall 2004, Massachusetts Institute of Technology.