Embed Size (px)
Citation preview

Handicraft Products: Identify the Factors that Affecting the
Buying Decision of Customers
(The Viewpoints of Swedish Shoppers)
Authors: Godwin De Silver
Palash Kumar Kundu
Supervisor: Peter Hulten
Student
Master‟s in Business Development and
Internationalization
Umeå School of Business and Economics
Spring Semester 2012
Master thesis, One-year, 15 hp

Page | i
Acknowledgement
It‟s been a great experience doing this thesis. We would like to thank all of those who have
helped us in the writing process. We are grateful to our representatives from Stockholm Mr.
Younus Hossain and from Malmö Mr. Joynul Abedin, who made it possible to conduct the
survey from different cities of Sweden.
We would like to give a special thanks to our supervisor; Peter Hulten for his guidance and
continuous direction with valuable suggestions and feedback.
Thanks to all of our friends and classmates who always cheered us up and encouraged us.
We also appreciate the support provided by Umeå University library in helping us to find
journal and books, also for the short introduction on “End Note” referencing system which
helped us a lot for the referencing.
Lastly but not the least, we would like to thank our families for their unconditional support
and encouraging in full-filling our vision.
Umeå, June 07, 2013
Godwin De Silver
Palash Kumar Kundu

Page | ii
Abstract
Handicrafts have a traditional value which holds the indigenous ethnicity of a particular
region. The skills to produce those products has continues flow from generation to
generation. Though in the modern world, the industrial product has taken over the market
still it has the popularity. The purpose of our research is to find out the factors that
influence the Swedish customers‟ purchase decision of handmade crafts. Hence, this study
was done in Sweden.
Our research question is based on Theory of Planed Behavior (TPB) and Theory of
Reasoned Action (TRA). These two theories are relevant when assesses the human
behavior in question and the influential factors behind the behavior. To conduct this
research the quantitative method has been chosen. From the three cities of Sweden we
collected a total of 320 responses from people of different gender, income, age and
occupation.
With the help of the TPB and TRA we have developed our hypotheses. Each of our
hypotheses is based on the each element of TPB. From the analysis it is seen that different
factors influence the Swedish customers‟ purchase decision of handicraft products. Such as
- product‟s authenticity, genuineness, artistic value, origin of the craft, their income level
etc. They give value to the opinions of their important referent groups too. However,
among different influential factors it is confirmed that opinions of friends and family have
the highest influence on the purchase decision. Product appearance and showing up the
shoppers‟ social status are the next two most influential factors respectively.
Although our research shows only three most influential factors, there are lot other factors
that create impact on making decision of handicrafts purchase. Such as - cultural, social,
economic, environmental, political etc. To explore those influential factors we think that
further research is required.
Key words: Factors, Purchase Behavior, Handicrafts, TRA, TPB, Appearances and Status

Page | iii
Table of Contents
Figure 1: Outline of the Thesis ………………………………………………………... ............................................... vi
Figure 2: The equation for Theory of Reasoned Action (TRA) ……………………... .................................. vi
Figure 3: Theory of Reasoned Action ……………………………………………….. ............................................. vi
Figure 4: Theory of Planed Behavior …………………………………………………. ............................................. vi
Figure 5: Proposed model originated from TPB …………………………………….... ...................................... vi
Figure 6: Deductive Approach ………………………………………………………. ................................................ vi
Figure 7: Proposed model originated from TPB …………………………………….. ....................................... vi
Chapter 1: Introduction ....................................................................................................................... 1
1. Problem Background: .................................................................................................................. 1
1.1 Definition of Handicrafts: .................................................................................................... 1
1.2 Problem background: Handicrafts in the Global Context ......................................................... 3
1.3 Problem Definition: Factors Affecting Purchase Decisions ....................................................... 4
1.4 Purpose of the Thesis: ............................................................................................................... 5
1.5 Research Question: ................................................................................................................... 5
1.6 Delimitations: ............................................................................................................................ 6
1.7 Outline of the Thesis: ................................................................................................................ 6
Chapter 2: Literature Review .............................................................................................................. 8
2.1 Crafts and Tradition: .................................................................................................................. 8
2.2 Swedish Handicrafts Tradition .................................................................................................. 8
2.3 Researches on Crafts: ................................................................................................................ 9
2.3.1 Craft Education: .................................................................................................................. 9
2.3.2 Crafts in E-commerce: ...................................................................................................... 10
2.3.3 Handicrafts and Tourist: ................................................................................................... 10
2.3.4 Marketing Handicrafts:..................................................................................................... 11
2.4 Theory of Reasoned Action and Theory of Planed Behavior: ................................................. 13
2.4.1 Theory of Reasoned Action: ............................................................................................. 13
2.4.2 Theory of Planned Behavior: ............................................................................................ 14
2.5 Hypothesis Construction and Model Development: ............................................................... 15

Page | iv
Chapter 3: Methodology ................................................................................................................... 17
3.1 Choice of topic:........................................................................................................................ 17
3.2 Preconceptions: ....................................................................................................................... 18
3.3 Research Philosophy: .............................................................................................................. 19
3.4 Research Approach: ................................................................................................................ 20
3.5 Research Design: ..................................................................................................................... 22
3.6 Data Collection: ....................................................................................................................... 22
3.7 Sampling Procedures and Respondents: ................................................................................. 24
3.8 Pilot Test: ................................................................................................................................. 24
3.9 Construction of the Research Questionnaire: ......................................................................... 25
3.10 Analysis of Variables: ............................................................................................................. 25
3.11 Reliability and Validity: .......................................................................................................... 26
Chapter 4: Empirical Findings ............................................................................................................ 29
4.1 Demographic Information: ...................................................................................................... 29
4.1.1 Gender: ............................................................................................................................. 29
4.1.2 Age:................................................................................................................................... 29
4.1.3 Occupation: ...................................................................................................................... 30
4.1.4 Income: ............................................................................................................................. 30
4.1.5 Gender and Income: ......................................................................................................... 31
4.1.6 Variables, Means, Gender and Income Groups: .............................................................. 31
Chapter 5: Analysis ............................................................................................................................ 34
5.1 Regression Analysis: ................................................................................................................ 34
5.1.1 Checking Multicollinearity Assumption: .......................................................................... 34
5.1.2 Evaluating the Model: ...................................................................................................... 35
5.1.3 Evaluating Individual Variable: ......................................................................................... 36
5.1.4 Hypothesis Testing: .......................................................................................................... 37
5.2 Result of Independent Sample T-Test: .................................................................................... 37
5.3 Result of one way between - groups ANOVA with post-hoc Test: .......................................... 39
Chapter 6: Discussion ........................................................................................................................ 42
6.1 Discussion: ............................................................................................................................... 42
6.1.1 Opinion of Friends and Family: ........................................................................................ 42
6.1.2 Product Appearances: ...................................................................................................... 43

Page | v
6.1.3 Showing Status: ................................................................................................................ 44
6.2 Contribution of TPB and TRA: ................................................................................................. 44
6.3 Managerial Implication: .......................................................................................................... 46
6.4 Conclusion: .............................................................................................................................. 47
6.5 Limitation of Research: ........................................................................................................... 48
6.6 Further Research: .................................................................................................................... 48
References: ........................................................................................................................................ 49
Appendix I: Regression Analysis (Correlations) ................................................................................. 56
Appendix II: Regression Analysis (Model Summaryb) ....................................................................... 58
Appendix III: Regression Analysis (ANOVAa) ..................................................................................... 58
Appendix IV: Regression Analysis (Coefficientsa) .............................................................................. 59
Appendix V: Independent Samples T-Test (Independent Samples Test) .......................................... 60
Appendix VI: Eta Squared calculation ............................................................................................... 64
Appendix VII: ANOVA (ANOVA) ......................................................................................................... 65
Appendix VIII: ANOVA (Multiple Comparisons) ................................................................................ 69
Appendix IX: Questionnaire .............................................................................................................. 77

Page | vi
List of Figures
Figure 1: Outline of the Thesis ………………………………………………………...06
Figure 2: The equation for Theory of Reasoned Action (TRA) ……………………... 12
Figure 3: Theory of Reasoned Action ……………………………………………….. 12
Figure 4: Theory of Planed Behavior ………………………………………………….14
Figure 5: Proposed model originated from TPB ……………………………………....15
Figure 6: Deductive Approach ………………………………………………………. 19
Figure 7: Proposed model originated from TPB …………………………………….. 41
List of Tables
Table 1: Variable Analysis Framework ………………………………………………..23
Table 2: Reliability Test ……………………………………………………………... 25
Table 3: Monthly Income of the Respondents …………………………………………27
Table 4: Gender and Income Levels …………………………………………………...28
Table 5: Variables Mean, Gender and Income Groups …………………………….... 29
Table 6: Correlation ………………………………………………………………….. 31
Table 7: Model Summaryb ……………………………………………………………..31
Table 8: ANOVAa ……………………………………………………………………..32
Table 9: Coefficient …………………………………………………………………....32
Table 10: Independent Samples Test …………………………………………………..34
Table 11: ANOVA ……………………………………………………………………..35
Table 12: Multiple Comparisons …………………………………………………….. 36

Page | 1
Handicrafts Products: Identifying the Factors that Affecting the Buying Decision of
Customers
(The Viewpoints of Swedish Shoppers)
Chapter 1: Introduction
In this introductory chapter we present the background of handicraft products and the
buying decision of consumer towards such products. Our research outline will be
explained, as well as the reason why it is especially relevant to examine factors that affect
purchase of handicraft product. The purpose of our research and the research questions
will be generated from the problem discussion.
1. Problem Background:
1.1 Definition of Handicrafts:
Handicrafts have aesthetic value and it is not necessarily required that handicrafts must be
used for physical purpose. However, a clear demarcation does not exist where artistic value
and utility depart (Deepak, 2008, p. 197). In reality, the hallmark of good craftsmanship
ensures the object‟s functionality and appeal to subtler forms of intellection. The
complexity of defining handicraft is also addressed by UNCTAD/GATT, International
Trade Centre (1989, cited in RP Ang and JC Teo,1995,p.4) in the following words:
„„One general problem that we face in studying this sector is the fact that there is really no
separate product classification for handicrafts…… Because there is no universally accepted
definition of the term "handicrafts", it has been used to refer to a very wide range of items,
including a broad spectrum of "gift items", house ware, home furnishings, products of craft
industries, and fashion accessories‟‟
Again, According to UNESCO/ITC (1997) '‟Artisanal products are those produced by
artisans, either completely by hand, or with the help of hand tools or even by mechanical
means, as long as the direct manual contribution of the artisan remains the most substantial
component of the finished product. The special nature of the finished products derives from
their distinctive features, which can be utilitarian, aesthetic, creative, culturally attached,
decorative, functional, traditional, religiously and socially symbolic and significant” (1997,
cited in Ghosh, 2012, p. 67).
Furthermore, the Indian task force on handicrafts also have tried to define the handicrafts in
1989 in the following words: „'Handicrafts are items made by hand, often with the use of
simple tools, and …. generally artistic and / or traditional in nature. They include objects of
utility and objects of decoration‟‟ defined by the Indian task force on handicrafts in 1989
(Jena, 2008, p. 19; Ghosh, 2012, p. 67).

Page | 2
Traditional handicrafts have their utilitarian roots to be assessed and they have developed
out of basic human necessity. Interestingly, man‟s weapon was the very first item that was
able to draw artistic attention of human rather than his dwelling. It represents a society‟s
cultural enrichment in its regular activities and reflects the sensitivity in the society‟s
cultural reaction to material changes (Deepak, 2008, p. 197)
So, from the above definitions it can be said that handy-crafts are those kinds of products
which are made by hand and also by the help of some easy small tools. They have various
uses in our daily life. Usually people use it to decorate the room and for its utility value,
like - the rug for decorating either drawing room floor or bed room floor, dolls for the little
kids, wall mat hanged on the wall for presenting drawing room more beautifully etc.
Handicraft products are unique by their nature, design, materials used in them and they
also reflect the artistic interest and feelings. According to Dash (2011, p. 241) handicrafts
are the unique symbol of a particular community or culture through indigenous
craftsmanship and material. Due to the increased globalization, handicraft products are
competing very intensively with goods from different corners of the world.
Undoubtedly, handicrafts are made by hand rather than complex technological machine, it‟s
a bit luxury and it‟s requiring a lot of craft-skills. However, in some cases some machines
are also used which are mostly operated by hand. It incorporates a very high labor and the
cost of labor is higher than the material and fuel. The value of artistry of handicraft is also
higher than its utility value. Furthermore, though the handicrafts are highly produced in less
developed countries, they are more demandable in developed countries (Bal and Dash,
2010, P. 24).
Lot of skills and equipment‟s are required for producing handicrafts, such as - needlework,
lace making, weaving, printed textiles, ornamental working, woodworking, basketry,
pottery, leather working, stained glass making etc. The skills required for particular
handicraft product transfer from generation to generation and these skills come by a
traditional way. Some areas are developed for a particular handicrafts product and the skills
are generated from that particular area as well. Moreover, as handicrafts are made of
different kinds of material, based on the availability of these raw material in different
places the particular skill of making handicrafts by those raw materials are developed in
those particular areas too (Girón et al, 2007, P.16). There is no theoretical way to learn
these skills; all have to learn from practice. The skills that are most common as a hobby are
sewing, weaving, card making, origami, screen printing, flower design, pottery etc. All this
skills are basically the reflection of the particular culture, community and tradition. A study
made by Mutua et al., (2008, p. 109) shows that in Botswana 50% of the respondents agree
that handicrafts shows the country culture and tradition.

Page | 3
1.2 Problem background: Handicrafts in the Global Context
Dhamija, J. (1975, p. 462) explains that because of the high quality product, good market
reputation, product promotion, etc. it is quite tough to find a market for new kind of
products in industrialized country. However, still a market for traditional handicrafts exists
in developed countries and these countries have excess industrialized products, surplus
purchasing power and an attraction for exotic handmade crafts.
According to Bal and Dash (2010, p.25) high income people living in urban areas are more
likely to buy handicrafts with religious interpretations, low income people living in rural
areas are more likely to buy handicrafts with non-religious interpretations. Furthermore,
their analysis shows that there is a positive correlation between the income and likelihood
of buying handicrafts in general. Thus, the place of residence and the income of people are
two important influential factors regarding the buying intention of handicrafts. In the
similar way a study made in Mexico by (Girón et el., 2007, p. 21) shows that price of the
handmade product is the most important for the customer. Person to person relation or
recommendation and product appearances are the next two important factors respectively.
On the other hand Bal and Dash (2010, p. 30) suggests that most of the people make their
handicrafts buying decision by themselves rather than influenced by someone else. Such
kind of purchasing decision of handicrafts is highly influenced by their impulse buying
behavior. In this decision making process the artistic value of handicrafts plays the primary
role in motivating customers toward any handicraft buying. There are other motivations to
buy handicrafts like - utility value, customer‟s status associated with the particular
handicraft and the likeliness for owning luxury as well. In many cases, handicrafts are
highly preferred as a gift item (Bal and Dash, 2010, P. 33).
According to Dash (2011, p. 241) handicrafts are substantially associated with home
accessory market. Among many other factors the financial condition of final customers,
their fashion trend and buying pattern are the most influential factors of home accessory
market. Though commoditization is increasing very rapidly, people buy different kinds of
handicrafts simply because of having an emotion of being associated with a particular
community, their custom, culture, values and so on. Moreover, in some cases if people like
any particular handmade crafts very deeply they pay premium price for that product even it
exceeds the normal price of it (Dash, 2011, p. 241).
As a souvenir item handicrafts are also very attractive among the tourist. For example: In
Thailand, it has been found that tourists buy Thai silk (a handicraft product) by taking the
following five factors into account: 1. Culture including the social and community forces,
different divisions of culture, the way of living in a groups in the society, social norms and
values, peer groups, family and households; 2. Psychological forces are incentive, views,
knowledge, personality and approach; 3. In terms of information dissemination the two
major factors are commercial and social; 4. Situation also has an influence on consumers
purchasing decision of handicrafts. Situation can be defined by the following factors for
consumers‟ purchasing decision: when, where, why consumers buy and circumstances

Page | 4
under which they buy; 5. Last of all the marketing mixes, the 4p‟s, have a very high degree
of influence on customers buying decision of handicrafts (Vadhanasindhu & Yoopetch,
2006, pp. 19 - 20).
According to Wiboonpongse et al., (2007, p. 472) earlier handcraft products were mainly
home use things. When factory made products contributes a lot in advancing our life style,
handicrafts have become expensive goods in many nations. In Thailand, customers are
reluctant to pay high price for handicraft for being a product handicraft only. Rather other
features of the particular handicraft like gracefulness, style, appropriate color, innovative
design etc. are highly valued by the handicraft customers.
1.3 Problem Definition: Factors Affecting Purchase Decisions
According to Milin et al., (2010, p. 388) consumer behavior reveals that human behavior is
an element of both the economic setting and human cells. Behavior itself is full of
complexities. These complexities can be described by many factors and have a direct or
indirect influence upon customers‟ decision making process of buying. Not only the simple
physical needs (food, shelter, and clothing) of customers‟ but also there are other issues that
determine their buying behavior. In addition, these factors depend on many other variables
including customers‟ purchase power (price, income). In most theories, consumer behavior
is regarded as a function determined by socio-cultural factors and personal traits.
In terms of consumption, social science literature has been dominated by two views about
customers for a long period. Based on the economic theory one view considers that by
allocating scarce resources wisely customers make their buying decision to optimize the
utility. They are usually active, calculative and rational actor. On the other hand, the other
view believes that consumers are the passive, manipulated and exploited topic of market
force, and they are forced to consume in the way that they do (Slater, 1997, cited in
Campbell, 2005, p. 23-24). However, recently another view of customers emerges opposing
the above two views. This new view explains that customers intentionally manipulate the
symbolic product meaning. They consciously use these meanings for creating a particular
identity or lifestyle (Featherstone, 1991, cited in Campbell, 2005, p. 24).Thus, research on
consumer behavior is widely spread in the area of marketing. The objectives of both the
firm and customer are met through using appropriate marketing tools. Marketing of cultural
products like arts can be facilitated through the acquired Knowledge about a market and its
components. In any market, every customer doesn‟t buy the same product. Handicraft
products are not outside of this statistical truth (Colbert, 2003, p. 31-32).
The link between sami people and handicraft is very strong. The handicraft tradition has
been continued from one generation to the next among Sami society. Almost every
Handicraft bears some symbolic value which plays an important role for Sami identity is
highly linked with their daily lifestyle.
Some of the Sami handicrafts produced by the Sami artisans are having the world‟s best
quality with a very high price in European market. Sami people achieved their authorized
handicraft trademark, Sámi Duodji, in the year 1982. Duodji means doing creative works

Page | 5
using different materials by hand. It bears the Sami identity and Sami culture as well. This
trademark is used for the authenticity of the products produced for the travelers and also for
handicraft business. Since the acquisition of Sámi Duodji the trademark is highly dignified
and symbolized as a proud in the history of Sami handicrafts.
At present clothing is one of the important handmade crafts for fashion world. Sami people
usually make their own apparatuses and cloths by themselves. Their way of life and
lifestyle highly specify the materials and requirements of making their clothes. Due to the
influence of post war modernization many changes took place in Sami society.
Consequently the importance of Duodji has also been changed and affected as the Sami
have been influenced from outside pressure. Nowadays the so called family tradition of
handicrafts making at home from one generation to the next is not sustained in many Sami
families. Apart from home there are more opportunities for learning handicraft for Sami
people through different institutions like schools, college, training centers etc. Although the
modern fashion styles and the resources are common in Sápmi, the Sami artisans still
produce the fashionable cloths using different folkloric signs about gender and locations for
local people. And these traditional clothing styles are easily distinguishable by the tourists.
Thus, the Sámi People has minimized the gap between old lifestyles and modern society by
linking the traditional culture with modern society in many ways. (Lehtola, 2004, cited in
Wheelersburg 2005, pp. 314-315; Samiskt Informationscentrum, 2006)
1.4 Purpose of the Thesis:
Our study sets out to increase the understanding of those factors that influences the Swedish
consumers’ buying decision of handicrafts; in this manner further information will be
interesting for formulating effective marketing strategies aimed at Swedish customers.
Using the Theory of Reasoned Action (Ajzen and Fishbein, 1975) and Theory of Planned
Behavior (Ajzen, 1985) our main purpose of the thesis is to explore the determinant factors
which influence the Swedish customers‟ decision to buy handicrafts.
1.5 Research Question:
Which factors influence/ affect the Swedish customers‟ decision to purchase
handicraft products?
Through our research questionnaire survey we shall be able to increase our understanding
about the Swedish customers‟ views regarding handicrafts. In addition, we think that the
findings from the research questionnaire might be significant for the marketers‟ current
marketing actions.

Page | 6
1.6 Delimitations:
In our thesis there are some prominent limitations that we think should be mentioned. Our
main limitation is that, we only focused on handicraft products in general. As we have not
focused on any particular handicraft product or category, the use of the findings of our
thesis is limited to some extent. Our second limitation is that, Swedish customers may
possess different views for specific products but our findings can only provide some
general implications for marketers rather than providing product specific implication.
Besides that, our research was limited in geographical aspect as it only takes into account
the customers in three cities: Stockholm, Malmö and Umeå. Moreover, our survey
questionnaires were in English only. Although all respondents were quite confident and ok
in responding in English language, the results are limited to a certain segment of the
Swedish population.
1.7 Outline of the Thesis:
In order to get better understanding of our research study we divided our thesis in to six
different chapters. Different issues are covered by different chapters that are separated from
each other. Although each chapter covers its own topic, they are interlinked through main
topic. The outline of our thesis is shown below:
Chapter 1: In this chapter we introduce the topic of our research and the reason why we
choose the topic with our background information. We develop the research
question focusing on the objectives of our study.
Chapter 2: This chapter introduces the relevant literature on handicrafts, previous theories
to address the purchase behavior and its linkage with different influential
factors.
Chapter 3: Here we present the overview of the research approaches and methods that we
used to conduct our research.
Chapter 4: This chapter provides the overall finding form the field survey that we
conducted from the three cities of Sweden.
Chapter 5: Our findings are analyzed in this chapter. We have measured the influential
factors by the SPSS software and also interpreted them. We tested our
hypothesis in this chapter as well.
Chapter6: Last of all we discuss the analysis, answer the research question and draw a
conclusion from the analysis and discussion. Further we bring forth suggestions
for the future research.

Page | 7
Figure 1: Outline of the Thesis
Research Method
Analysis
Discussion &
Conclusion
Literature Review
Empirical Findings
Introduction

Page | 8
Chapter 2: Literature Review
In this chapter we will review the ideas and findings from the previous research related to
our topic. It also includes the existing information and concepts that are known about
handicrafts, customer buying behavior and so on. We will justify through reviewing
existing literature that our research topic has a potential for further study.
2.1 Crafts and Tradition:
Based on region the handicrafts have their own history. American, European, Asian and
African nations have different cultures and their own moral values. Handicrafts are just the
reflection of those values, norms, environmental and social heritage. Wool is one of the
widely used materials for the last four century, especially for the northern cold country
(Catarina & Wilhelm, 2007, p. 3). Knitting was also popular as handicrafts before 18th
century in the Europe and other part of the world. But the scenario has been changed after
British people have changed it to industrial product during 18th
century (McIntosh, 2011, p.
37). However handicrafts are not only the wool and knitting, it includes various kinds of
materials. It requires variety of skills which already have been discussed in the introductory
chapter.
Handicrafts are the products which are made by hand and with the use of some small tools.
Handicrafts business had begun as a hobby or some associational work. The working
method and tools differ a little due to region. According to Vainio-Korhonen (2000, p. 42)
a growing number of inhabitants in Turku city earned their livelihood through handicrafts
productions during the time of pre-industrial handmade production. According to Barbara
Brabec (Barbara Brabec World, 2011) crafts business started exploring worldwide around
1940‟s. She also mentioned that during 1970‟s when the sales increase there is a need of
marketing and organizing that stuffs. For organizing and marketing the strategy has been
made differently by different firm. There are varieties of handmade product base on the
natural resources, where what is available. Also the skills for the particular craft differ due
to different culture, tradition and custom (Girón et al., 2007, p.16). For this variety of
handicrafts product form worldwide, people have different attitude and intentions, so the
factors that effecting buyers to buy the product is an important issue to become successful
in the market.
2.2 Swedish Handicrafts Tradition:
According to Muller et al., (2001, p. 9) Sami is one of the indigenous people groups in
Sweden. Within Swedish tourism industry, they are famous for their cultural heritage and
also for their handicraft products. Usually indigenous people produce the handicrafts for
selling purpose and display rather than their own use. Worldwide the economic pressure is
increasing. It is affecting the interest among indigenous groups of people and without the
support from the local authority it is hard to expand their economic actions. Indigenous
people are producing large amount of handicrafts now-a-days and adapting to the demand

Page | 9
of tourists. Thus the indigenous tourism business is highly contributed by the indigenous
Handicraft sales (Muller & Pettersson, 2006, p. 56).
Although all the regulations regarding craft were eliminated during the years between 1846
-1864, the apprenticeship system still controls the supply of handicraft creating skills to a
great extent in Sweden (Soderberg 1965, Lindell 1992, cited in Anders Nilsson, 2008, p.
81) where people get a very low payment in exchange of learning chance. According to
Hans Thorbjörnsson (2006, p. 11) Swedish educational sloyd (slöjd in Swedish) was
developed by the leader Otto Salomon at Nääs sloyd teacher training college during 1880s.
Being influenced by Uno Cygneus from Finland, Swedish handicraft education focused not
only creating stuffs by using tools and woods but also developing total personality. In order
to develop aesthetical sense through bringing excellence in product development, it
emphasized students on learning integrity, carefulness, attentiveness and learning how to
appreciate and enjoy physical work.
There are many researchers who have done research on the E-commerce retail practices
(Giyar & Pareek, 2011; Batchelor & Webb, 2002), craft knowledge development (Klein,
2000; Garber, 2002; Arvidsson, 1989; by Nedelcheva et al. 2011), marketing the
handicrafts product (Nagori & Saxena, 2012; Colbert, 2003), women empowerment
through handicrafts in rural area (Wilkinson-Weber, 2004; Ericsson, 2001), tourist
tendency towards handicrafts product (Müller & Pettersson, 2001) etc. However there are
few researches have been conducted on customer buying behavior of handmade crafts,
especially on Swedish customer. That is why we have chosen the Swedish customer to
identify the factors that influence them to buy hand made products. Swedish people are
very much traditional and eco-friendly (Kyoung E. 2010, p. 8), more over they wants to
retain their heritage. That‟s why we feel that this area will be more interesting for us to
conduct our research.
2.3 Researches on Crafts:
There are many researchers who have done research on the E-commerce retail practices,
craft knowledge development, market the handicrafts product, women empowerment
through handicrafts in rural area, tourist tendency towards handicrafts product etc.
However, there are few researches that have been conducted focusing the factors that
influence customers‟ buying decision towards handicrafts. That is the reason why we
choose the Swedish customer to identify the factors that influence their buying decision
towards hand made products. In the first chapter it has been mentioned that handicrafts are
traditional, look more genuine and to some extent they are eco-friendly (Bradley, 2009, p
357).
2.3.1 Craft Education:
The crafts and its education in Sweden were started in 18th
century. In Arvidsson (1989, p.
157 - 158) a study on Swedish crafts and craft education, it is found that in late 18th
century
an effort has taken to include in elementary school, aiming to introduce the basic of crafts
tools and general familiarity. From a study in Finland by Garber (2002, p. 134), we have
seen that there are crafts center where government funded as it is a part of the education
Page | 10
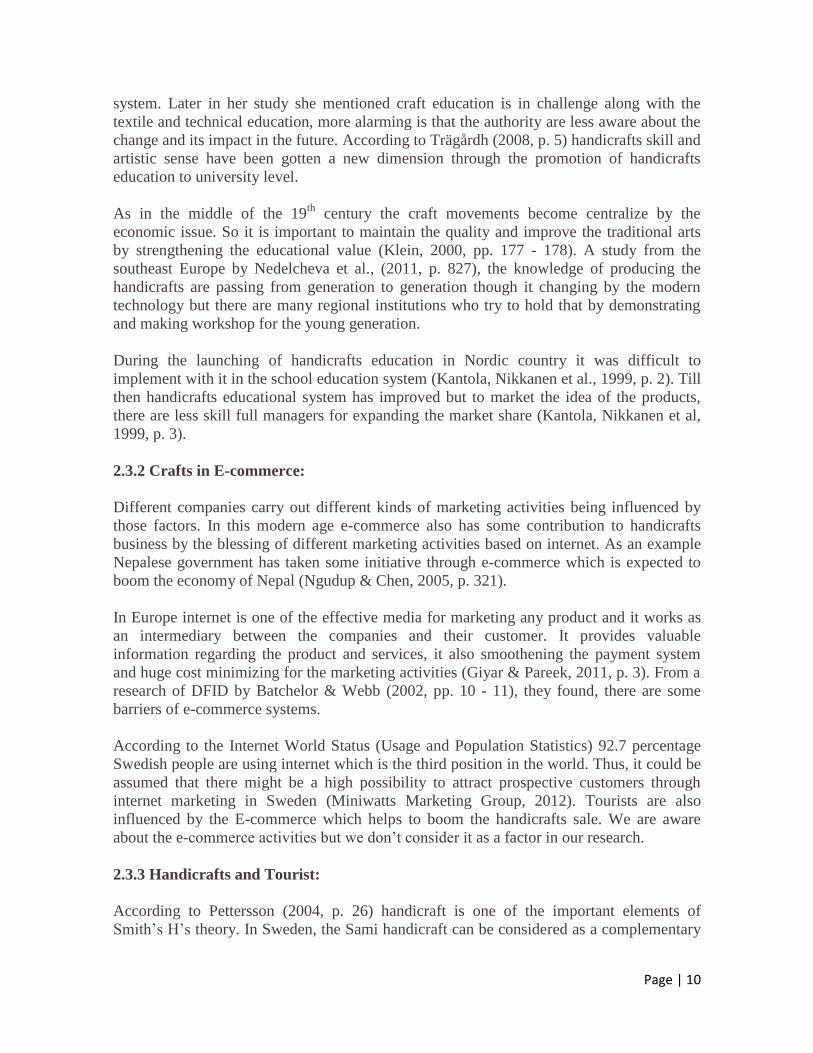
system. Later in her study she mentioned craft education is in challenge along with the
textile and technical education, more alarming is that the authority are less aware about the
change and its impact in the future. According to Trägårdh (2008, p. 5) handicrafts skill and
artistic sense have been gotten a new dimension through the promotion of handicrafts
education to university level.
As in the middle of the 19th
century the craft movements become centralize by the
economic issue. So it is important to maintain the quality and improve the traditional arts
by strengthening the educational value (Klein, 2000, pp. 177 - 178). A study from the
southeast Europe by Nedelcheva et al., (2011, p. 827), the knowledge of producing the
handicrafts are passing from generation to generation though it changing by the modern
technology but there are many regional institutions who try to hold that by demonstrating
and making workshop for the young generation.
During the launching of handicrafts education in Nordic country it was difficult to
implement with it in the school education system (Kantola, Nikkanen et al., 1999, p. 2). Till
then handicrafts educational system has improved but to market the idea of the products,
there are less skill full managers for expanding the market share (Kantola, Nikkanen et al,
1999, p. 3).
2.3.2 Crafts in E-commerce:
Different companies carry out different kinds of marketing activities being influenced by
those factors. In this modern age e-commerce also has some contribution to handicrafts
business by the blessing of different marketing activities based on internet. As an example
Nepalese government has taken some initiative through e-commerce which is expected to
boom the economy of Nepal (Ngudup & Chen, 2005, p. 321).
In Europe internet is one of the effective media for marketing any product and it works as
an intermediary between the companies and their customer. It provides valuable
information regarding the product and services, it also smoothening the payment system
and huge cost minimizing for the marketing activities (Giyar & Pareek, 2011, p. 3). From a
research of DFID by Batchelor & Webb (2002, pp. 10 - 11), they found, there are some
barriers of e-commerce systems.
According to the Internet World Status (Usage and Population Statistics) 92.7 percentage
Swedish people are using internet which is the third position in the world. Thus, it could be
assumed that there might be a high possibility to attract prospective customers through
internet marketing in Sweden (Miniwatts Marketing Group, 2012). Tourists are also
influenced by the E-commerce which helps to boom the handicrafts sale. We are aware
about the e-commerce activities but we don‟t consider it as a factor in our research.
2.3.3 Handicrafts and Tourist:
According to Pettersson (2004, p. 26) handicraft is one of the important elements of
Smith‟s H‟s theory. In Sweden, the Sami handicraft can be considered as a complementary

Page | 11
part of Sami tourism. Both the production process and sales point of Sápmi handicrafts are
attract by the tourists
Authenticity is a very influential factor for tourist to buy any handicrafts. However,
sometimes their buying decision of handicrafts depends on the negotiation between the
authenticity and their wishes, expectations and incentives to buy handicrafts (Markwick,
2001, p. 34). However, in order to attach economic value, sometimes changes might take
place in handicrafts‟ making and this change doesn‟t hamper its authenticity. Indeed,
economic value and authenticity are considered as an entangled notion (Glassier, 1995;
Moreno and Littrell, 2001; Grünewald, 2002 citeed in Maruyama et al., 2008, p. 45).
2.3.4 Marketing Handicrafts:
According to Biggs et al., (1996, P. 6-11) in home product category, the demand of
handicraft and cultural products is upward. In Europe, customers spend a significant
amount of their earnings on their home decoration. They like to present their personal style
through creating their home environment comfortable. Moreover, these handmade crafts
also suit with their simple and bit conservative lifestyle too. Thus, their home decoration
can be personalized through handmade crafts. Due to the economic crisis in mid 1990s in
Europe consumers are more concentrated on basic products rather than decorative
housewares. Furthermore, the increased divorce rates among European families and
relatively more active participation of women in European labor market have impacted
negatively towards the traditional family concepts in Europe. Consequently, less people
were involved in creating entertaining or decorative products. Thus, due to having both the
quality of individual craftsmanship and exclusive design, relatively cheaper handicrafts
from developing nations were in a better off position in European market. Though the new
household formation is one of the key factors for the growth of market of decorative home
product, the probability of new household formation in Europe is not that much significant
in near future. In Europe home socializing with friends and family members is one of the
major parts of enjoying leisure time by middle aged people. Furthermore these middle aged
people were increasing significantly in Europe. Thus, it can be assumed that these older
people might purchase more housewares in a relaxed way in future to upgrade their
household stuffs. And the value for money might play the central role to attract the older
European customer to buy decorative handicrafts for home decoration. Environmental
friendliness is another important aspect of handicraft that influences the demand among
European consumer of handicraft.
From the above discussion on handicrafts it has been seen that the Handicraft education,
adoption of e-commerce, the way from production to marketing handmade products,
development of tourism industry, product demand etc. have been changed a lot from past.
Because of these changes there are lot of creative and different indigenous handicrafts
product are available in the market. Undoubtedly Globalization plays a vital role to spread
different handicrafts product all around the world. However, due to the globalization, mass
production has changed the means of craft production in many cases. Consequently, some
artisanal crafts are getting separated from the real artisans as these crafts are produced in
factory rather than by the hands of real artisans (Scrase, 2003, p. 459). Although there are
different indigenous handicrafts products are available in Sweden, many companies like -

Page | 12
Fair Trade Import AB, North and South Fair Trade AB, La Maison Afrique AB, Wholesale
Dealers etc. also import hand made products in Sweden from different countries (Shaw,
2006, p. 52).
Although, marketing seems to be a complex issue and it is too difficult to invest more
money and time on marketing by the craft and design entrepreneurs, reaching customers is
really a vital issue to make the business successful (Luutonen, 2009, p.119). A research
conducted by Paige & Littrell (2002, pp. 327 - 328) on 1000 craft retailers shows that the
two biggest groups among the four groups of crafts retailers (personally expressive goal
seekers and culture broker goal seekers) highly focus on educating consumer about crafts,
crafts producers, local tradition etc. These clusters also highly emphasized on customer
services to satisfy their customers. In addition they have given more emphasize on the
advertisement and sent direct email to the individual customers for becoming closer to
them. Äyväri (2000, pp. 5, 17) also emphasized on the importance of how well the craft
entrepreneurs are communicating about their products with the potential individual
customers. In this regard he suggested that the craft or design entrepreneurs should take
well planned marketing activities to spread out their product message to the potential
individual buyers.
According to Sheth (1985, p. 6) individual customers had gotten the focus of attention by
market researchers in early 1940‟s. In order to get better understanding about
individual customer, researchers started to rely on behavioral science rather than
considering social sciences. As the driving force of human behavior, cognitive process is
emphasized by social psychology. That is why Social psychology has stared to be
considered as a fruitful way to get better understanding of consumer psychology.
Ultimately, a common belief regarding consumers‟ buying behavior became very famous
that is - consumers were driven psychologically rather than logically. Theory of Reasoned
Action (TRA) and Theory of Planed Behavior (TPB) deal with a large variety of behaviors
and emphasize on a limited number of psychological elements which can have an impact on
a behavior. For example: intention, attitude, subjective norms etc. (Fishbein et al., 1992
cited in Albarracin et al, 2001, p. 142 - 143). It has been found that these theories are more
useful than any other behavioral theories to explain the individual beliefs and underlying
influences to perform a behavior (Madden et. al., 1992, p. 3). Considering this view we
have chosen the theories of reasoned action for our thesis.
The theories of reasoned action includes both The Theory of Reasoned Action (TRA) and
The Theory of Planned Behavior (TPB) .The underlying assumption of the theories of
reasoned action is that human beings are rational and before making a decision of executing
a behavior people take into account the implications of their activities (Ajzen & Fishbein
1980, p. 5; 2005, p. 192) TPB and TRA are as follows:
Page | 13
2.4 Theory of Reasoned Action and Theory of Planed Behavior:
2.4.1 Theory of Reasoned Action:
Ajzen and Fishbein (1980, pp. 5-7) explain that the determinants of the behavior in question
need to be examined before predicting an individual‟s behavior. The TRA specifies that a
person‟s behavior intention directly determines what behavior a person actually performs.
Behavior intention is such a thing that has a very strong ability to predict the volitional
behavior. It is formed by the combined influences of individual influences and normal
influences. A person‟s attitude toward performing the volitional behavior is called the
individual influence and subjective norm is called normative influence (Fishbein & Ajzen,
1975, p. 301). The following mathematical equation represents the TRA in the simplest
way:
B ~I = (AB) W1 + (SN) W2
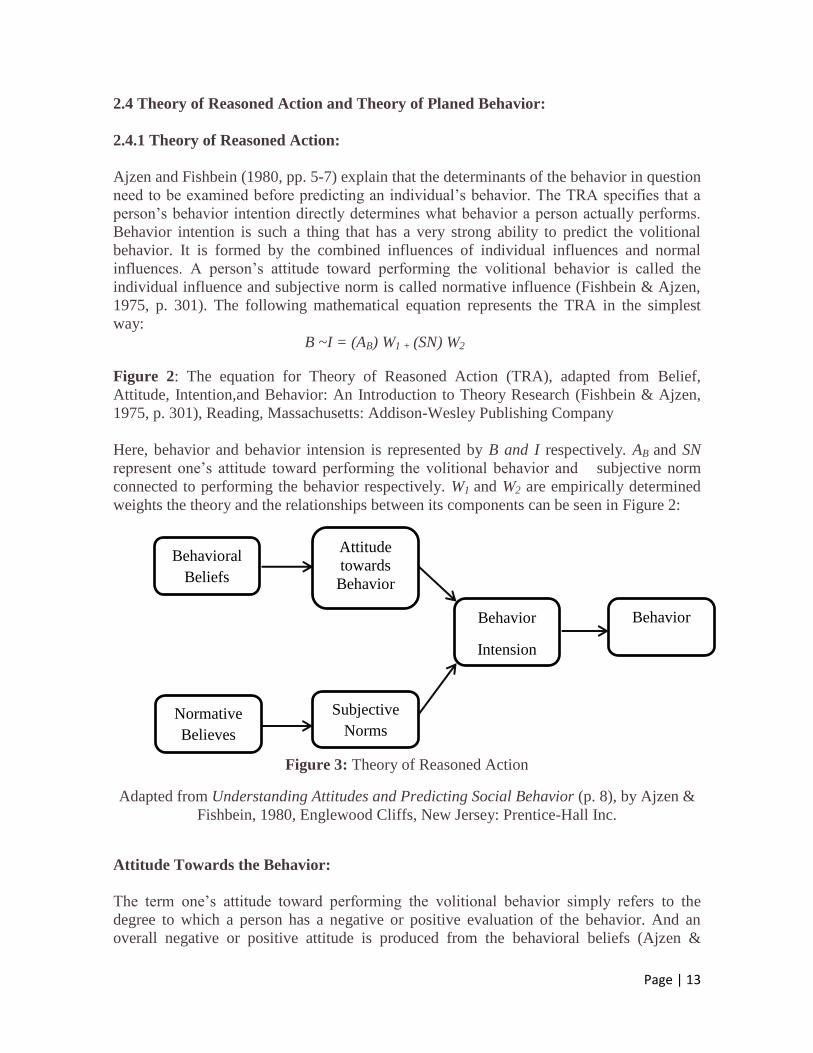
Figure 2: The equation for Theory of Reasoned Action (TRA), adapted from Belief,
Attitude, Intention,and Behavior: An Introduction to Theory Research (Fishbein & Ajzen,
1975, p. 301), Reading, Massachusetts: Addison-Wesley Publishing Company
Here, behavior and behavior intension is represented by B and I respectively. AB and SN
represent one‟s attitude toward performing the volitional behavior and subjective norm
connected to performing the behavior respectively. W1 and W2 are empirically determined
weights the theory and the relationships between its components can be seen in Figure 2:
Figure 3: Theory of Reasoned Action
Adapted from Understanding Attitudes and Predicting Social Behavior (p. 8), by Ajzen &
Fishbein, 1980, Englewood Cliffs, New Jersey: Prentice-Hall Inc.
Attitude Towards the Behavior:
The term one‟s attitude toward performing the volitional behavior simply refers to the
degree to which a person has a negative or positive evaluation of the behavior. And an
overall negative or positive attitude is produced from the behavioral beliefs (Ajzen &
Behavioral
Beliefs
Attitude
towards
Behavior
Behavior
Intension
Behavior
Normative
Believes
Subjective
Norms

Page | 14
Fishbein, 2005 p. 193). Expectancy-value model of attitudes, an indirect way of measuring
the overall attitude of an individual, (EVM) suggests that one‟s attitude toward performing
the behavior is supposed to be a function of an individual‟s beliefs or perceived
consequences of performing the behavior in question and the evaluative aspects of those
beliefs (Fishbein & Ajzen, 1975, p. 29, Ajzen, 1991, p.191). Thus a person‟s beliefs and
evaluative aspects of those beliefs are formed to be the behavioral beliefs that create
attitude toward performing the behavior. Consequently one may more likely to have a
positive attitude toward purchasing handicrafts products if one believes that he or she can
show or maintain their position in the society by purchasing expensive hand made products.
Subjective Norm:
According to Ajzen and Fishbein (1980, pp.73 - 195; 1975, p. 302) subjective norms are
produced from normative beliefs. It is the person‟s perception that most individuals or
groups who are important to him think he or she should or should not perform the behavior
in question. So, subjective norms refer to the general social pressures which arise from
accomplishing or not accomplishing a behavior. For example, a person might feel pressure
from his/her family members or friends or colleagues to purchase handmade crafts and it
can be considered as a subjective norm. Subjective norms can be measured by the
perceived expectations of specific referents and by the person‟s motivation to fulfil with
those expectations.
2.4.2 Theory of Planned Behavior:
TPB has been applied in various fields. Kim & Karpova (2010) use TPB to understand the
underlying meaning of behavioral control, subjective norms and consumer attitude towards
purchase fashionable goods. Some study shows TPB‟s explanatory capability of newly
introduced behavior in the context of marketing (Bamberg, 2002, p. 575; Armitage &
Conner 2001, P. 473). According to Chiou (2000) in the context of family restaurant
business TPB can effectively predict the extent to which the customers current purchase
behavior will be repeated in future.
Through the Theory Planed Behavior we will figure out the relation between the underlying
beliefs and personal attitudes. It also describes how the demographic characteristic and the
surroundings factors impact on buying attitude (Ajzen & Fishben, 1980). More over TPB
also explain direct and indirect effects on behavior by the performances that incorporate
how easy or difficult it likes to be (Ajzen, 1985, sited in Blue, 1995, p. 107). The positive
attitude and stronger intention smoothen the reflection of actual control over norms to
perform perceived behavior (Ajzen, 1988).
So by the Theory of Planed Behavior, both the direct and indirect effect on behavioral
intention can be measured and how it is controlled by individual or not that will be found
out through the theory. The factors that affect purchase intention and attitude will be
described by the TPB. Furthermore TPB also answer behavioral control of intention and
behavior (Ajzen & Fishben, 1980, cited in Blue, 1995, P 107).

Page | 15
The Theory of planned behavior (TPB) is the extended version of TRA. Ajzen developed
TPB in order to predict not only volitional behavior but also those behaviors that are not
under complete volitional control. Although TPB includes all the components of TRA,
Ajzen added the new variable of perceived behavioral control (PBC) in TPB. Thus, TPB
eliminates the limitations of TRA by enhancing the predicting capability of both the
volitional and non-volitional behavior (Ajzen, 1991, p.181).The Theory of Planned
Behavior can be illustrated by the following figure 2:
Figure 4: Theory of Planed Behavior
Adapted from The Theory of Planned Behavior (p. 194), by Ajzen & Fishbein, 2005
Perceived Behavior Control:
According to Ajzen (1991, p. 188) PBC refers to a person‟s perceived ease or difficulty of
performing the behavior. The more resources and opportunities a person believes they have,
and fewer obstacles they anticipate, the greater should be their PBC over the behavior. Thus
beliefs about resources and opportunities are regarded as underlying PBC (Ajzen, 1991,
pp.196 - 197).
2.5 Hypothesis Construction and Model Development:
Until now we have discussed the normative beliefs that are concerned with the likelihood
that important referent individuals or groups will approve or disapprove the performing
behavior in question (Ajzen & Fishben, 1980, p. 195). So, one may also purchase
handmade crafts due to the social pressure from important referent individuals or groups.
Thus, based on the normative beliefs that result in subjective norms we developed the
following hypothesis:
Attitude
Towards
Behavior
Intention Behavior
Normative
Believes
Subjective
Norms
Perceived
Behavioral
Control
Control
Believes
Behavioral
Beliefs

Page | 16
H1: Opinion of friends, families and other peoples has an influence on buying decision of
handicrafts products.
From the TPB and TRA it has been clarified that beliefs related with consequences of
behaviour are viewed as determining attitudes toward that behaviour (Ajzen, 1991, p.197).
Thus, because of the different attributes of handmade crafts like - genuineness, artistic
value, uniqueness etc. consumers might have some favorable beliefs toward those related
attributes. Therefore, those consumer beliefs may result an overall positive feeling
(attitude) in consumers mind (Hansen et. al., 2004, p. 542). For example – handicrafts are
more exciting, they look genuine and they are very pleasant etc. Ultimately, such positive
feeling (attitude) may influence consumers toward performing positive behavior
(purchasing handmade crafts).Thus, based on the behavioral beliefs that result in attitude
toward behavior our second hypothesis has been developed.
H2: Appearances of the handmade crafts influence people to buy.
According to TPB beliefs about resources and opportunities are viewed as perceived
behavioral control toward the behavior in question (Ajzen, 1991, p.197). So, if we consider
that a person has available resources then according to the above belief it can be assumed
that a person may have a very favorable decision toward purchasing handmade items, if
he/she believes that buying those expensive handicrafts helps them to enhance their prestige
in their society. Thus, based on the controls beliefs that result in perceived behavioral
control our third hypothesis is given below:
H3: Status is shown by the people through buying handicrafts.
Finally, based on our above three hypothesis the following model has been developed:
H1
H2
H3
Figure 5: Proposed model originated from TPB
Opinion
Appearance
Status
Action

Page | 17
Chapter 3: Methodology
This chapter presents the process and approaches considered to conduct the research study
and complete this thesis. In the beginning, the reason for choosing our thesis topic and
preconceptions will be discussed. Including these two, the use of ontology and
epistemology will be explained. Afterwards, the use of deductive approach and quantitative
research method is justified.
3.1 Choice of topic:
The choice of our thesis topic was decided based on our common interest and
understanding in the field of business administration. Both of us have an education in
business administration; marketing and business development in particular. Although we
have knowledge in these fields, we are especially curious and more interested in the area of
consumer behavior; their intension and attitude as well.
Swedish govt. policies are very much supportive for the consumers to become environment
friendly. Historically Swedish approaches are always towards environment improvement.
And recently they have given the most attention than any other country (Jamison & Baark,
1999, p. 204 – 205). Sweden is so active in reducing environmental impact both globally
and locally. It is trying to be a model for worldwide ecological sustainable development.
The Swedish Government is very much conscious about environment friendly sustainable
development. (Sterner, E., 2002, p. 3)
While visiting some big cities in Sweden like Stockholm, Lund, Malmo etc we found that a
variety of Bangladeshi handicrafts items are sold in some handicraft shops; like - sense
gusto in Stockholm, Granit in Lund. It was a matter of curiosity for us after observing that
many Swedish customers are buying crafts from those shops and many of those crafts were
from Bangladesh too. Another interesting matter for us was to discover that a Swedish
company - redQ AB has their own community based organization to produce handicrafts in
a remote place of Bangladesh. This company brings different kinds of handmade crafts to
Sweden from Bangladesh. This handmade crafts are made by poor rural women and these
handmade crafts are environment friendly too (redQ, 2012). At this point we became more
curious about Swedish handicrafts customer as they are totally different from Bangladeshi
people in every aspect in general like- their societal orientation, attitude, behavior, culture,
tradition, taste, norms, values, food habit, clothing and so on. In addition, as we are
studying in the field of business, we have a keen interest to develop a handicraft retailing
business in Sweden too.
Reading literature about consumer behavior we have found that keeping the assumption in
mind: consumers‟ behavior and attitude may vary based on time, place, product category;

Page | 18
situation etc. is important for people in the field of marketing indeed. Being curious and
interested by this assumption we narrowed our concentration in the area of those products
that include both utility and artistic value and that are made by hand too. According to Dash
M. (2011, p.255) handicraft product market is highly dependent on buyers‟ taste and
preference. Even, customers‟ may pay higher price than the usual price for a handmade
product if he or she likes that. However, different customers have different intention and
attitude toward different products. Thus, we have decided to narrow our concentration to
handicraft products.
Different theory provides different outcomes considering how they handle a problem. There
are lots of variables that explain consumers‟ behavior and attitude such as socio-economy,
socio-culture, demography and many more. While attending in consumer behavior course
we found two theories: the theory of planned behavior given by Fishben and Icek Ajzen
and the theory of reasoned action given by Icek Ajzen; are very much renowned to explain
consumer behavior and attitude as well. After a lot of reading about these two theories, we
came to a common opinion that TPB might be interesting and important for our thesis.
We found that, there are few numbers of researches have done on behavior of handicrafts
customer. And most of these studies are focused on consumers of India. As example Bal
and Dash (2010) research and Dash research (2011). However, we didn‟t find any article
about Swedish customer and handicraft. Thus, we feel the importance of working on issue
of identifying those factors that affect the handicraft buying intension of Swedish customers
3.2 Preconceptions:
As we are from same country with same language, a lot of similarities exist between us in
many aspects such as our background, social norms and values, culture, undergraduate and
high school system etc. Although we have lots of similarities between us, we have lots of
differences too in terms of our point of view and understanding as well about Swedish
people, society, culture, economy and many more. According to Saunders et al. (2007, p. 8)
researcher‟s own views and approaches have an influence upon the research. That is why
we have tried to explain our preconception here.
Our perceptions have been shown and have influenced our decision making, thinking and
process throughout the research process. Such as our high degree of interest in handicraft
products has influenced our direction of research and also influenced our work directed
toward providing the answer for our research questions. While working together, our
differences in preconceptions had been revealed and we learned to collaborate.
On the way of doing our thesis we will learn about consumer intentions and buying
behavior of the handicrafts product, which help us for our future work. Both of us were
well aware about the handicrafts production and its market in our own country. But neither
of us have knowledge about the market size and business policy, more specifically the
consumer view towards the handicrafts product and there buying intentions in Sweden. We

Page | 19
don‟t have any clue about the increase or decrease of handicrafts business in Sweden. From
our two year living experience in Sweden, we assume that market for the handicrafts are
small and there are not such well-known handicrafts brands in Sweden.
For further information, none of us are aware about the theory that we are going to use for
ours research purpose. However, we find The Theory of Plan Behavior is very important to
analysis our research question. We found this theory from the articles of The Theory of
Planed Behavior by Ajzen (1991, p. 181). In most of the researches on handicrafts we have
found that they are based on the tourist and their attitudes of buying on the cultural products
in the visited country, buying handicrafts by adopting new technology etc. We become
more familiar by reading articles on the theory of TPB‟s different implication. We read
those articles and try to figure out own way and implement in our research by the view of
our understanding and perceptions.
Because we are from different department of business study, one from Marketing
department and one from Entrepreneurship department, each of us want to interpreted
certain issue in our own way, so we use to have some argument on different issue. But we
adjust them easily as we have experience to work with the customer directly in our country
so it‟s become easy to put our thought together and solve it. Though there are lot of
variation on customer attitude and intention due to place, environment, culture, economy,
weather etc. But our experience motivates us to overcome variation and go with the
research. AS because of its variance make us more careful about the process of the research
and take each decision, which incises the quality of our thesis.
3.3 Research Philosophy:
Basically our research philosophy is based on our preconception. Essentially research
philosophy includes important assumptions about our way of viewing the social world.
These assumptions reinforce the research strategy and the methods we use for that strategy.
The social entities and its existences also viewed by the philosophical aspect. Thus,
research philosophies enrich our understanding of the way and also influence the way in
which we think about the research process (Saunders, et al. 2007, p.101-102).
Before we go for further discussion it needs to be clear about the research question and
match with the philosophical assumption. The research question is “(1) which factors
influence/ affect the consumer decision to purchase handicraft products?” The theory we
used here is “The Theory of Planned Behavior (TPB) by Icek Ajzen which will be used to
analysis and answer the research question of our study.
An individual‟s likelihood-ness executing a certain behavior is determined some
motivational factors. The theoretical framework related with individual motivational factors
gets the prime focus in TPB (Montano & Kasprzyk, 2008, p. 67).
It seems that Icek Ajzen viewed and describes the social worlds with the same assumptions
as natural science, and thus he followed the principles and techniques of natural science.
However, recognizing the contribution of TPB, in answering our research question we

Page | 20
decided to adopt TPB as it was created by Icek Ajzen rather than emphasizing on our
preconceptions. So, it can be stated that for finding answers to our study matches the
positivism of the epistemology. (Saunders, et al., 2007, pp. 102 - 108). As we are generate
the hypothesis from the theories and use the statistical data for test, analysis and review the
theories form the result (Bryman & Bell, 2011, P. 15).
In other hand Ontology deals with the nature of reality. According to the social
constructionism reality is constructed socially from the perceptions and actions of social
actors. From our point of view, customers‟ and their behavior create the social reality. Due
to the changes of customers‟ own perception in behavior and also the changes of other
social entities, the behavior is in a constant change. As in our research, the social actors are
independent from their everyday action so it‟s more likely that it support the Objectivism of
the Ontological position (Bryman & Bell, 2011, P. 21).
As future workers in field of marketing, we think that the social world should not be
viewed in congruence with the natural sciences always. Our argument to favor our opinion
is that the social world is different. So, adapting the doctrines of natural science with the
social world will not be suitable.
3.4 Research Approach:
In general, every research has two basic approaches which are Deductive and Inductive.
This two are the most common research approach in the scientific research (Bryman &
Bell, 2011, p.11). Deductive approach is based on testing theory and hypothesis through
analysis, at the end theory has revised by the findings (Bryman & Bell, 2011, P. 11). Our
study is also followed by testing the hypothesis from the gathered data and by analyzing the
findings we will review with the theory, so it seems more likely that our research following
the deductive approach. It is common that answering the research question in deductive
approach, mostly follow the quantitative method for the research. And our research
question and the theory led us to conduct the research in quantitative method. On the other
hand Inductive approach interpret and examine the social world and view the relation with
the theory and research (Bryman & Bell, 2011, p. 386).

Page | 21
In our research our aim is to find out the buying intention of the customer from the field
survey. Sometime it is confusing that which approach should be appropriate or match with
the research topic or research question. As we are going to make survey and find the
consumer behavior on buying attitude and intention, it‟s confirmed that we are going to
apply the quantitative method and use the statistical tool to find the buying intention of
Swedish customer. From our research we will also figure out the relation between different
variables, for example Swedish consumers attitudes and purchase intensions etc. on
handicrafts products. It is well known that conducting research in quantitative method,
Statistical Package for Social Sciences (SPSS) is widely using for the interpretation and
analysis the data.
Figure 6: Deductive Approach
Adapted from (Bryman & Bell, 2011, p. 11)
As our research findings will be the buying intention of the consumer, where the “Theory
of Planed Behavior” and “The Theory of Reasoned Action” linked between the attitude and
behavior, it also describes the consequences of belief associated with behavior and attitude
(Ajzen, 1991, p. 191). We find lot of similarity between the theories and our research
question. So for find out the research question we are going to use the TPB and TRA. With
the help of this theory and our research question we will develop our questionnaire and then
collect the data.
Deductive Approach
Create a Hypothesis
Data Collection
Findings
Reject of Confirm
Hypothesis
Revision of Theory
Developing a Theory

Page | 22
According to the Bryman and Bell (2011, p. 9) deductive approach use the hypothesis to
test whether it can be accepted or not. But our research questions will focus on broader
perspective to find the valuable information regarding the business opportunity in Sweden,
which will increase the validity and reliability of our research. It also improves our
analyzing from the findings and measure the way we planned. In our research we formulate
the buying factors based on the theory to draw a conclusion.
3.5 Research Design:
In research design research frame work being establish. The basic structured a research
develop by three type of research design. According to Shiu et al., (2009, p.61) and
Saunders et al., (2003, p.96) there are three different type of research design, they are -
Exploratory Study, Descriptive Study and last one is Explanatory Studies.
According to Sandurs et al. (2012, p 171) Exploratory research is a research design, by
which it discovers about a topic of interest and clarify by understanding of a problem. This
research design is more suitable with the open question or individual or focused group
interview. Here researchers have the flexibility to make necessary change with the behave
of the data. On the other hand the Descriptive research deals with the exact situation, place
or event. In this research design there have to be a clear view of those particular phenomena
on which the data going be collect (Sandurs et al., 2012, p 171). It creates the exact
summary of a particular events and situation (Robson, 2002 p. 59 cited in Saunders et al,
2009, p. 139-140). By the Sandurs et al. (2012, p 172), Explanatory research highlight on
study a situation or a problem.
In our research we will discover how the customer preferences on handicrafts products.
Neither we are going to deal with exact situation of a particular place or event to get deeper
understanding of that situation nor we going to highlight any situation or problem. But we
are interested to find how the consumer prefers to buy handicrafts products. So in that
prospective our research is Exploratory by nature and we try to synthesis from our findings.
3.6 Data Collection:
As we have stated in section 3.4 that our research will comply with the quantitative method,
it requires data collection (Saunders et al.2009, p.151). Generally there are varieties of
approaches of collecting data for survey. Widely used survey procedures in quantitative
method are person-administrated, self-administrated, telephone survey and online survey
(Shui et al., 2009, p.237).
For our research we have chosen self-administrated survey technique. In this technique the
questionnaire sends to the respondents through internet, postal services or by hand. After
completing up those questionnaire respondents return it through internet, post or by the
selected representative. The respondents read and fill up the survey question by his or her
own self in the absence of any representatives of researcher or researcher itself (Saunders et

Page | 23
al., 2009, p. 362 – 363; Shui et al., 2009, p. 247). Although there are some disadvantages
of self-administrated survey like - lack of in-depth data, high degree of non-response rate,
response error, takes much time to collect data, lack of monitoring etc., we think that this
data collection technique is much appropriate for our research study. This data collection
method have several advantages like - it‟s very less expensive as it doesn‟t require any
interviewer or any technical device; the respondents are not influenced by the interviewer‟s
gesture and posture so there is no chance of being biased by the researcher; the respondents
feel very much comfortable in providing their true and sensitive responses by keeping
themselves anonymous and they are also in control of pace, place and time regarding
filling up the questionnaires and so on. That‟s why we have decided to incorporate self-
administrated survey technique in this research.
There are four different types of self-administrated survey method such as - mail survey,
mail panel survey, drop off survey and fax survey. In our case we have followed the drop
off survey method. According to this method we have sent our survey questionnaire to two
of our representatives in Stockholm and Malmö. Our representatives have provided that
survey questionnaire to every sample unit of our target population and let them to complete
those questions. During the time of completing the questionnaire our representatives were
not presented at that place to ignore the biasness. After the completion of the questionnaire
they collected each questionnaire from each respondent by themselves and returned back to
us. In Umeå city we have followed the same procedure by our own selves instead of the
representatives.
Our target population is Swedish people whose age is above 18 years. We exclude the
children because they are not really the handicrafts customer; though lot of handicrafts
things they buy by their parents. For our convenience we have chosen Malmö - represents
southern Sweden, Stockholm - represents central Sweden and Umeå - represent northern
part of the Sweden. We, from Umeå and our representative in Stockholm and Malmö
collected the data from many different places like – Bus/Train Station, Shopping mall,
Handicrafts shops, Restaurant, University, hospital and some other places that are
convenient for us. We have chosen those places because people of different ages, gender
and income level are available in those places. In these places, we and our representatives
met each of our sample unit and explained the purpose of our survey. In most cases, the
questioners were filled up by the Swedish Speaking people that include both the native and
immigrant Swedish too.
We haven‟t faced that many difficulties to grab the respondents‟ attention to fill up our
questioners. Although we got responses from different age group, gender and income level
people, most of the women and young Swedish seemed to be much more co-operative to us
compare to aged. Even some of the young respondents instantly helped us to hand out our
questionnaires among their group members and some women handicraft customers
appreciated our work too while filling up the survey papers. However, there are some
exceptions too. For example – we found some people who denied filling up our survey
questionnaires while they were seemed to be busy walking across the roadside or waiting
for their bus/train, we don‟t have any exact number of rejection but we assume that 40 to 45
people refused to co-operate with us.

Page | 24
In total we got 320 fully completed responses from 320 respondents from the three
selective cities. Mostly we have got the data from Stockholm and Umeå. Comparing with
these two cities we got far less responses from Malmö. So the result might curve mostly by
Umeå and Stockholm survey data.
3.7 Sampling Procedures and Respondents:
There are two kinds of sampling techniques. One is probability sampling technique and the
other one is non-probability sampling technique. For the probability sampling technique,
the probability of being selected of every sample unit from the target population is known.
Whereas, the probability of being selected of each sample unit from the target population is
unknown for non-probability sampling technique population (Shiu et al., 2009, p.470;
Saunders et al., 2009, p.214 & 233; Gilbert et al.2005, p.324). For our thesis we have
determined that non-probability sampling technique is most appropriate and that‟s why we
have chosen this technique.
Furthermore, Non-probability technique is classified in different categories such as -
convenience, quota, judgmental, self-selection, snowball sampling etc. (Shiu et al., 2009,
p.469; Saunders et al., 2009, p.241) and we think that convenience sampling technique is
much applicable for our thesis. According to Sanuders et al, (2009, p. 241) and Shui et al,
(2009, p. 480) convenience sampling is such a technique in which researcher select samples
according to his or her own convenience. In addition, researcher chose his or her own
convenient place and time too to collect the sample until his or her requirement is met. For
example - shopping complex, bus / train station, any occasion etc., where researcher or
representatives of researcher can collect bulk amount of data at a time so that it minimize
the time and cost as well. The people who felt interesting to complete our questioners we
have distributed the questioners to them. After completing the questioners they returned
back to us. In this way we collected data from our sample units. Information of our sample
unit is presented in section 4.1.4.
3.8 Pilot Test:
The purpose of the pilot study is to clarifying the questionnaire and gets the feedback of the
question. More specifically, to find out whether there is any unclear question or any wrong
combination/ordering of questions. We have conducted this pilot test in Skellefteå among
10 people as according to Bryman and Bell (2011, p. 263) the pre-test should not be carried
out in those cities which we selected to get our sample.
By the pilot test the research question becomes more valid and reliable. Often researchers
use experts to judge the questionnaire before they go for survey (Saunders et al., 2009,
p.394). In our case we have checked our questionnaire by our supervisor and did several
changes in the questionnaire. But after the pilot test we found that there is one question
which is misunderstood by the respondents. So in the main survey questionnaire we have
changed the language to make it clear for the respondents. During the pilot test we found
that sometimes respondents may ask the surveyors for the clarification of some questions.

Page | 25
For example in the question 15 there is a term “independent authority” and in section C
“Income Group” might need some clarification.
3.9 Construction of the Research Questionnaire:
We construct our research question by the nature of descriptive format. We will examine
the variables to explain the handicrafts purchase decision attached with the influential
factor. Following is the questionnaire we prepared for the survey where we have two
separate part to identify the attitude, intention and factors. The questionnaire also contains
some question to know the basic information of the respondent‟s. This will help us to
differentiate the different group of respondent‟s views and factors that influences them to
buy handmade product. We prepare the questionnaire in English and to identify the
respondents‟ answers we used five point Likert scale set (Bryman & Bell, 2011, p. 240).
We consider „1‟ as strongly agrees and „5‟ as strongly disagree.
To design our questionnaire we followed the structured method. We put our self into
respondent‟s side and we made the questionnaire as flexible as possible so that respondents
can easily understand and replay accordingly.
3.10 Analysis of Variables:
The following table 1 presents the variables with the respective question number which we
have used to formulate the hypotheses in our study. In the table we use the same question
numbers that we have in our survey questionnaire. The tools for the statistical analysis we
used for the measurement are also mentioned, so that the variables are clearly
understandable in our analysis part (Chapter 5).
Specific Question Analytical
Method
Dependent
Variable
Action
(Buying
Handicrafts)
Q. 1: When I go shopping, I sometimes
buy handicrafts that I had not intended
to purchase
Q. 2: When I see any handicraft that
really interests me, I usually buy it
without thinking the consequences
Q. 3: I sometimes like to buy
handicrafts spontaneously
Regression
Analysis
Independent
Variable
Opinion
(Friends &
Family)
Q. 4: It is important that other people
like the handicraft I buy
Q. 5: My Friends and Family whose

Page | 26
opinions are important when I purchase
handicrafts
Q. 6: I rarely purchase any handicrafts
until my Friend and Family approve to
them
Q. 7: To make sure I buy the genuine
handicraft, I always observe what others
are buying
Appearance
(Handicrafts)
Q. 9: I buy handicrafts because I think
handicrafts look more genuine than
those produced in factories
Q. 10: I buy handicrafts because of its
artistic value only
Q. 12: I buy handicrafts because I know
what I get from it as functional value
Status
Q. 11: Although it is more expensive I
buy handicrafts to show my status to
others
Q. 13: I buy handicrafts because I prefer
to have luxury item at home
Table: 1 Variable Analysis Framework
We will conduct the independent sample T-test for exploring the mean difference between
male and female and one way ANOVA test for exploring the mean difference among three
different income groups. In addition with one way ANOVA, we will also go for Post Hoc
GT2 test to identify the specific income groups for which the mean difference exist.
3.11 Reliability and Validity:
Reliability is the measurement of the quantitative research to find the stability and
consistencies, which main concern is to formulate the business research more reliable
(Bryman & Bell, 2007, p. 41). Here it‟s providing the index of correlations between two
same concepts (Gilbert et al., 2005, p. 295). As reliability main objective is to minimize the
error by measuring the respondent feedbacks in two points and the result is correlating
(Aaker et al, 2004, p. 304). We have collected the data from various places and different

Page | 27
age and income group of the selected region to avoid the errors. For our representative we
instructed the same so that we have the similarity among all the selective regions.
According to Pallant (2005, P. 90) among different indicators cronbach‟s alpha coefficient
is commonly used for measuring the scales internal consistency. The result of cronbach‟s
alpha coefficient finds the acceptances rate of the data. It‟s a widely used tool in the social
sciences research to find the correlation and the internal reliability of the data. The value of
cronbach‟s alpha coefficient test varies between 0 and 1, here 0 means that the data are not
internally reliable on the other hand 1 represent the strongest reliability. Bryman and Bell
(2003, p. 77) mention that 0.80 is the acceptable level to go for the farther analysis.
According to George and Mallery (2003, p. 231) any scale greater than 0.7 is acceptable.
But the minimum range that can be accepted for the primary level of research is 0.5 to 0.6
(Kent, 2007, p. 142-143). To measure the consistency of our research, we find the
reliability for cronbach‟s alpha coefficient. We use the multi-item scale variables and the
result we found is following:
Variable Cronbach's Alpha Number of Items Measure
Peoples‟ Choice and
Opinion 0.814 4 Acceptable
Product Appearance 0.705 3 Acceptable
Show Status 0.763 2 Acceptable
Action 0.786 3 Acceptable
Table 2: Reliability Test
Validity deals, whether or not the concept can be measured by the indicator or the set of the
indicators (Bryman & Bell, 2007, p. 165). It represents the different reflection of the
objective which measures the scores of the characteristic (Gilbert et al., 2005, p. 293).
Validity applies the concept of social sciences; connect by the conclusion of the research in
quantitative research (Bryman & Bell, 2007, p. 42). We applied two types of validity to
establish high overall validity of our research.
Face validity is such a measurement where the research questions are shown through the
content of the research. In order to measure face validity we conducted a pilot study of our
questionnaire. In addition, we have taken into account the valuable advice of our thesis
supervisor and the suggestions provided by the participations while making some changes
in our questionnaire (Bryman & Bell, 2007, p. 165).
In our research study we have used recent articles and scientific journals to develop our
theoretical background. We were very much careful in selecting those scientific journals
and articles to ensure that these are scholarly peer reviewed and relevant. Furthermore,
statistical analysis tools have been used in testifying our hypothesis. Above all, in order to
minimize the error and biasness we have used non-probability sampling and Likert scale in

Page | 28
our questionnaire. Thus, we followed concurrent validity by using relevant theories in the
research study too (Bryman & Bell, 2007, p. 165).
The sampling errors occur during the data collection and coding the raw data into the
analysis software, which relay on the accuracy of data (Shiu et al., 2009, p. 456). We took
the sample of 320 respondents, before that we conducted a pilot test to find out the most
reliable way of collecting data and more accurate format of the questionnaire for an
acceptable validity of our sample.

Page | 29
Chapter 4: Empirical Findings
This chapter will describe the overview of findings from the primary data survey. The
questionnaire for the survey was designed under quantitative method. The graphical
representations of demographic information are described here.
4.1 Demographic Information:
Demographic information is followed by the responses from the survey and the output of
SPSS program. In our questionnaire we have three parts, first part contains the questions
regarding attitude and intention towards handmade crafts, second part contains the factors
that affect buying handicrafts and last part contains the general information (Age, Gender,
Occupation and Income Level) of the respondents. We distributed our questionnaire and
conducted the survey in three selective cities; Stockholm, Malmö and Umeå. We got in
total 320responses; from Stockholm we got 120 responses, from Malmö 40 responses and
from Umeå 160 responses.
During our thesis work we had a time limit. So, we managed to distribute only three cities
in Sweden. Our intention was to cover Sweden by choosing one city from most south, one
form the middle and a last one is from northern Sweden. Though our intention is full filled,
we got relatively less responses from Malmö and the overall responses are satisfactory.
Here we present all the data from different levels of age, gender, occupation and income
group.
4.1.1 Gender:
Handicraft could be decorative type and furniture type of products so both male and female
have their interest to buy it. In table 3 the analysis shows that we get slightly less than half
of responses from the female which is 47.81 percent (153 female respondents) and 52.19
percent (167 male respondents) from male respondents.
4.1.2 Age:
In our questionnaire we have grouped the age in five different categories. Through this we
tried to figure out the purchase decision and factors that influences those age groups. We
started at age 18 and made a new category each 10 years. We got 119 responses from the
first group “18 – 27”, 92 responses from the second group “28 - 37”, 56 responses from the
third group “38 - 47”, 37 responses from the fourth group “48 - 57” and the last group are
all people above 58, where we got only 16 responses. From the cumulative percentage of
responses we can see that 65.94 percent responses we got are from the first two groups.

Page | 30
4.1.3 Occupation:
To identify the impact on purchase decision and factors on handicraft products by
occupation, we classified it in four groups. The groups are student, employee, pensioner
and unemployed. From the survey we get 36.25 percent (116 persons) student responds,
51.25 percent (164 persons) responds from employee, 4.38 percent (14 persons) responses
from Pensioner and 8.13 percent (26 persons) responds from the unemployed people.
4.1.4 Income:
We classified the income group to find out which group has which type of purchase pattern.
From the survey we got 10.31 percent responses from the high income group, 38.13 percent
from the middle income group and 51.56 percent from the low income group. We assumed
that the low income group income range is 8,000 – 17,000 SEK, middle income group
range is 18,000 – 28,000 SEK and the high income group are above 28,000 SEK.
Type of Variable
Variables in
Groups
Percentage
%
Num of
Respondents
Gender Male 52.19 % 167
Female 47.81 % 153
Age 18 – 27 37.19 % 119
28 – 37 28.75 % 92
38 – 47 17.50 % 56
48 – 57 11.56 % 37
58+ 5.00 % 16
Occupation Student 36.25 % 116
Employee 51.25 % 164
Pensioner 4.38 % 14
Unemployed 8.13 % 26
Income High 10.31 % 32
Middle 38.13 % 122
Low 51.56 % 164
Table 3: Monthly Income of the Respondents

Page | 31
4.1.5 Gender and Income:
From table 4 it has been seen that the responses between male and female with the income
levels are almost similar. It means from each income level we got almost similar male and
female responses. In the high income we got 5.00 percent male and 5.31 percent female
responses, in middle income group we got17.5 percent male and 20.63 percent female
responses and at last from the low income group we got 25.31 percent male and 26.25
percent female responds.
Type of Variable Variales Groups Percentage
%
Num of
Respondents
Gender and Income Male
High Income
Middle
Income
Low Income
5.00 %
17.50 %
25.31 %
16
56
81
Female
High Income
Middle
Income
Low Income
5.31 %
20.63 %
26.25 %
17
66
84
Table 4: Gender and Income Levels
4.1.6 Variables, Means, Gender and Income Groups:
From the figure 5 it has been seen that in high income group the mean values for male and
female is 1.69 and 2.24 respectively for ACTION. It refers that both the male and female
usually buy the handicrafts product. On the other hand, in middle income group the mean
values of male and female are 2.81 and 3.04 respectively. Furthermore, in low income
group the mean value of male and female are 2.80 and 2.90 respectively. It shows that both
the middle and low income groups buy the handmade products some times.
For OPINIONS, in high income group the mean value for male is 1.88 and female is 2.60.
The mean value of male in the high income group shows that they give more value to
others opinions while buying any handmade product. On the other hand we found that in
middle income group the mean value for male and female is 3.34 and 3.10 respectively; in
low income groups for male and female is 3.10 and 3.10 respectively. It means that both the
male and female in middle and low income groups also sometimes give value to others
opinion when they buy any handicrafts and vice versa.
The mean values of male (1.81) and female (2.21) for product appearance in high income
group shows that both the male and female give more importance to product appearance
while they buy handmade crafts. But in middle income group the male (2.67) and female
(2.69) shows that they also give some importance towards the product appearances. In low
income group the mean value of male (2.61) and female (2.35) shows that as in the middle

Page | 32
income group, the low income group also gives importance towards the product appearance
when they buy the handicrafts product.
The mean values of the high income group for male (2.20) and female (2.00) shows both of
them do agree that they buy handmade products to express their status. The mean of middle
income group for male (2.13) and female (2.11) also shows that both of them buy
handmade crafts to show their status in the society. Finally, the mean value for low
income group for male (4.13) and female (4.29) respectively express that both male and
female from low income group disagree that they buy handicrafts to show their status.
Mean, Gender
and Income Action Opinions
Appe-
arance Status
Mean of Male
1.69 1.88 1.81
2.20 High Income
Middle
Income 2.81 3.34 2.67 2.13
Low Income 2.80 3.10 2.61 4.13
2.236
Mean of Female
High Income 2.603 2.215 2.00
Middle
Income 3.04 3.10 2.69 2.11
Low Income 2.90 3.10 2.35 4.29
Table 5: Variables Mean, Gender and Income Groups
4.2 Background Variables:
Type of Measurement
Variable
Mean SD
Dependent Variable Action (Buying Handicrafts)
- When I go shopping, I sometimes buy handicrafts that I had
not intended to purchase
- When I see any handicraft that really interests me, I usually
buy it without thinking the consequences
- I sometimes like to buy handicrafts spontaneously
2.68
2.79
2.92
1.38
1.38
1.43

Page | 33
Independent Variables
Opinion (Friends & Family)
- It is important that other people like the handicraft I buy
- My Friends and Family whose opinions are important when I
purchase handicrafts
- I rarely purchase any handicrafts until my Friend and Family
approve to them
- To make sure I buy the genuine handicraft, I always observe
what others are buying
Appearance (Handicrafts)
- I buy handicrafts because I think handicrafts look more
genuine than those produced in factories
- I buy handicrafts because of its artistic value only
- I buy handicrafts because I know what I get from it as
functional value
Status
- Although it is more expensive I buy handicrafts to show my
status to others
- I buy handicrafts because I prefer to have luxury item at home
2.89
3.05
3.21
3.04
2.34
2.59
2.59
4.04
3.88
1.38
1.39
1.43
1.40
1.20
1.29
1.36
1.04
0.98
- It‟s mostly up to me whether or not I purchase Handicrafts
product
- I find handicrafts product from other countries are more
interesting than those from Sweden
- For me it is important to know that this product is authentic
through a seal of approval of an independent authority
- For me it is important to get the information about the artisans
who made that
2.53
2.63
3.94
4.04
1.46
1.23
0.86
.091
Above are the findings from the field survey. For deeper understanding those data will be
analyzed in the analysis chapter.
Page | 34
Chapter 5: Analysis
In this section we will analysis all the data that have collected through questionnaire
survey. The evaluation of hypothesis will be tested by using different structured statistical
technique. For the significance level of statistical analysis we set ≤0.05 which is acceptable
in the social sciences research (Shiu et al. 2009, p. 538).
5.1 Regression Analysis:
In chapter 2 (Literature Review), we have only mentioned our variables and formulation of
those variables. Our first independent variable is OPINION which is constructed by friends
and family opinion and approval (Q. 5 & Q. 6 in the questionnaire) and other people likings
and observation (Q. 4 & Q. 7 in the questionnaire). Our second variable is APPEARANCE
which is constructed by the product genuineness (Q. 9 in the questionnaire), artistic value
(Q. 10 in the questionnaire) and functional value (Q. 12 in the questionnaire). Our last
independent variable is STATUS which is constructed by show status (Q. 11 in the
questionnaire) and prefer luxury item at home (Q. 13 in the questionnaire). Finally our
dependent variable is ACTION. It includes that the Swedish shoppers buy the handicrafts
either in a unplanned way (Q. 1 in the questionnaire) or buy from the real interest (Q. 2 in
the questionnaire) or buy spontaneously (Q. 3 in the questionnaire).
5.1.1 Checking Multicollinearity Assumption:
From the correlations table (table: 6) of regression analysis we find that the Pearson
correlation between ACTION (dependent variable) and OPINIONS, APPEARANCE AND
STATUS (independent variables) are 0.637, 0.602, and 0.399 respectively. According to
Pallant (2005, P.149) in terms of relationship between dependent and independent variables
above 0.3 is preferable. In our case all the correlation values between independent variables
and dependent variable are above 0.3, so all the independent variables (OPINIONS,
APPEARANCE AND STATUS) correlates substantially with the dependent variable
(ACTION).
On the other hand the correlations in between independent variables: OPINION and
APPEARANCES, OPINION and STATUS, APPEARANCE and STATUS are not more
than 0.7 (See table 6). It means the correlation between each of the independent variables is
not too high (Tabachnick & Fidell, 2001, p.84; Cited in Pallant, 2005, P.150).
From the coefficient table (table: 9) we see that the tolerance values for OPPONION,
APPEARANCE and STATUS are 0.422, 0.622 and 0.883 respectively. Furthermore the
VIF values for the OPPONION, APPEARANCE and STATUS are 2.372, 1.606 and 1.132
respectively.

Page | 35
So all the tolerance values of independent variables (OPPONION, APPEARANCE and
STATUS) are above 0.1 and all the VIF values are below 10. Thus it can be said that our
model have not violated the multicollinearity assumption (Pallant, 2005, P.150).
In addition, table: 6 also shows that the significant level for each specific correlation among
the four variables (ACTION, OPINIONS, APPEARANCE and STATUS) is 0.000, 0.000,
0.000, 0.000, 0.000 and 0.000 which are less than 0.05. So it can be said that all the
correlations among four variables are statically significant too.
ACTION OPINIONS APPEARAN
CE
STATUS
Pearson
Correlati
on
ACTION 1.000 .637 .602 .399
OPINIONS .637 1.000 .588 .311
APPEARANC
E .602 .588 1.000 .226
STATUS .399 .311 .226 1.000
Sig. (2-
tailed)
ACTION . .000 .000 .000
OPINIONS .000 . .000 .000
APPEARANC
E .000 .000 . .000
STATUS .000 .000 .000 .
**. Correlation is significant at the 0.01 level (2-tailed).
Table 6: Correlation
5.1.2 Evaluating the Model:
From the model summary table (table: 7) we find that the R Square value is 0.533. It means
that 53.3 % of ACTION can be explained by the three independent variables (OPINIONS,
APPEARANCE AND STATUS) in our model. Furthermore from the ANOVA table we
find that the significant level is 0.000, which is less than 0.05. So it can be said our model is
statistically significant. It means that the model works is nineteen times out of twenty.
Mode
l
R R Square Adjusted R
Square
Std. Error of
the Estimate
1 .730a .533 .522 .80800
a. Predictors: (Constant), APPEARANCE, STATUS,
OPINIONS
b. Dependent Variable: ACTION
Table 7: Model Summaryb

Page | 36
a. Dependent Variable: ACTION
b. Predictors: APPEARANCE, STATUS, OPINIONS
Table 8: ANOVAa
5.1.3 Evaluating Individual Variable:
Once again in the coefficient table (table: 9) we find that APPEARANCE has the highest
Standardized Coefficient Beta value is 0.340, which means this standardized coefficient
beta value describes that APPEARANCE has the strongest unique contribution for
explaining the dependent variable ACTION, when the variances described by all other
variables in our model is controlled for. Standardized Coefficient Beta value for OPINION
is very slightly lower than APPEARANCE which is 0.332. It refers that OPINION has little
less contribution to explain the dependent variable than APPEARANCE. Finally STATUS
has the lowest Standardized Coefficient Beta value in the model that is 0.206. Science it has
the lowest Beta value, it makes least contribution to explain the ACTION.
From table (table: 9), we find that all the three independent variables‟ (OPINIONS,
APPEARANCE AND STATUS) Sig. values are less than 0.05 which is statistically
significant at 95 % confidence level. It means that the probability of appearing the same
outcome is nineteen times out of twenty times. Thus, these three independent variables
(OPINIONS, APPEARANCE AND STATUS) have made statically significant
contribution to predict dependent variable (ACTION).
Model Sum of
Squares
Df Mean Square F Sig.
1
Regression 232.153 7 33.165 50.799 .000b
Residual 203.695 312 .653
Total 435.848 319
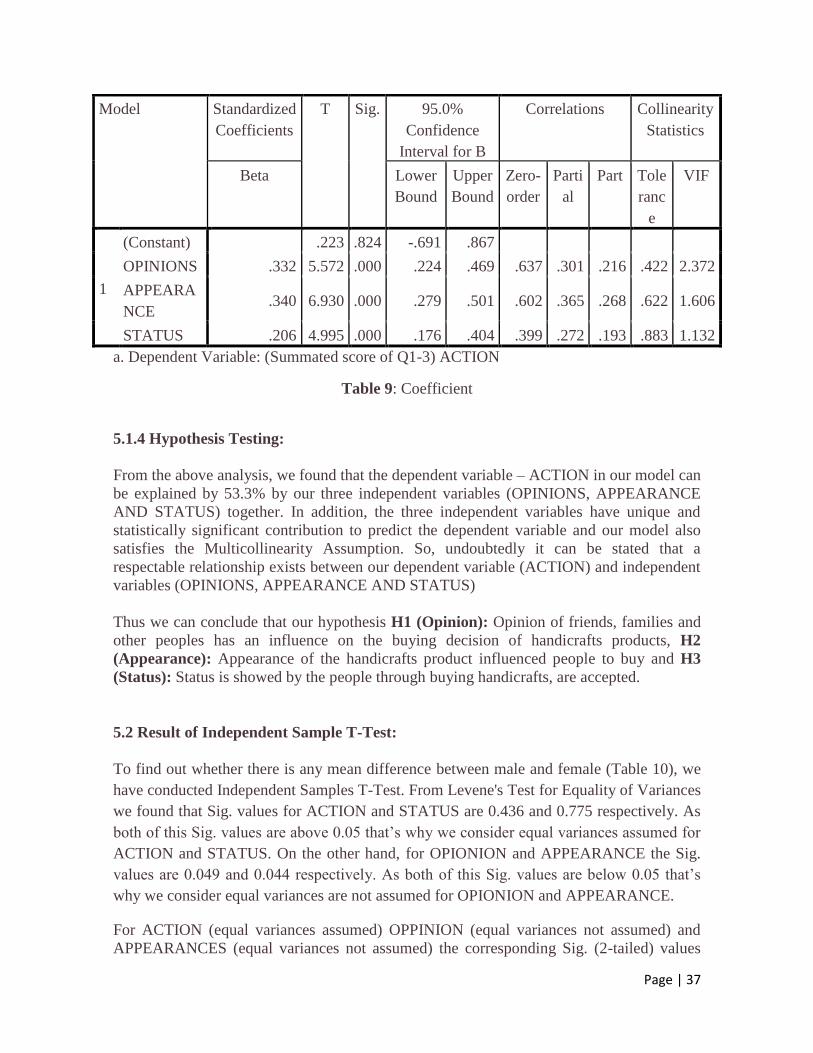
Page | 37
Model Standardized
Coefficients
T Sig. 95.0%
Confidence
Interval for B
Correlations Collinearity
Statistics
Beta Lower
Bound
Upper
Bound
Zero-
order
Parti
al
Part Tole
ranc
e
VIF
1
(Constant) .223 .824 -.691 .867
OPINIONS .332 5.572 .000 .224 .469 .637 .301 .216 .422 2.372
APPEARA
NCE .340 6.930 .000 .279 .501 .602 .365 .268 .622 1.606
STATUS .206 4.995 .000 .176 .404 .399 .272 .193 .883 1.132
a. Dependent Variable: (Summated score of Q1-3) ACTION
Table 9: Coefficient
5.1.4 Hypothesis Testing:
From the above analysis, we found that the dependent variable – ACTION in our model can
be explained by 53.3% by our three independent variables (OPINIONS, APPEARANCE
AND STATUS) together. In addition, the three independent variables have unique and
statistically significant contribution to predict the dependent variable and our model also
satisfies the Multicollinearity Assumption. So, undoubtedly it can be stated that a
respectable relationship exists between our dependent variable (ACTION) and independent
variables (OPINIONS, APPEARANCE AND STATUS)
Thus we can conclude that our hypothesis H1 (Opinion): Opinion of friends, families and
other peoples has an influence on the buying decision of handicrafts products, H2
(Appearance): Appearance of the handicrafts product influenced people to buy and H3
(Status): Status is showed by the people through buying handicrafts, are accepted.
5.2 Result of Independent Sample T-Test:
To find out whether there is any mean difference between male and female (Table 10), we
have conducted Independent Samples T-Test. From Levene's Test for Equality of Variances
we found that Sig. values for ACTION and STATUS are 0.436 and 0.775 respectively. As
both of this Sig. values are above 0.05 that‟s why we consider equal variances assumed for
ACTION and STATUS. On the other hand, for OPIONION and APPEARANCE the Sig.
values are 0.049 and 0.044 respectively. As both of this Sig. values are below 0.05 that‟s
why we consider equal variances are not assumed for OPIONION and APPEARANCE.
For ACTION (equal variances assumed) OPPINION (equal variances not assumed) and
APPEARANCES (equal variances not assumed) the corresponding Sig. (2-tailed) values
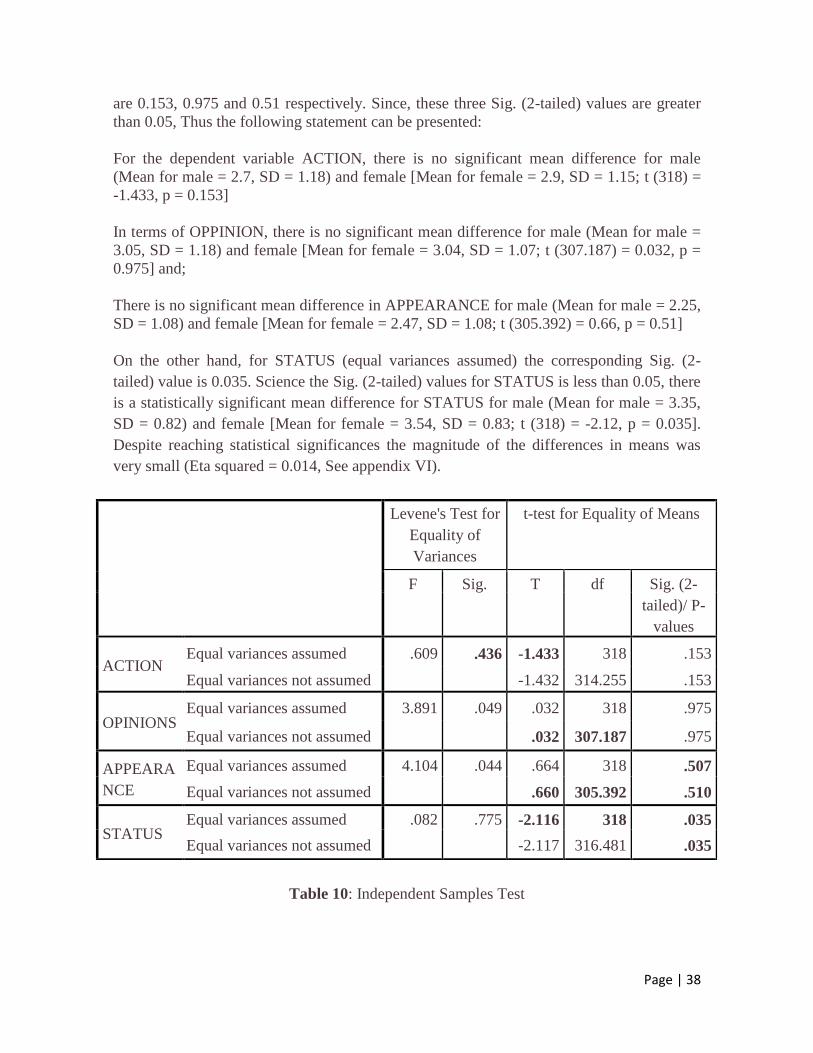
Page | 38
are 0.153, 0.975 and 0.51 respectively. Since, these three Sig. (2-tailed) values are greater
than 0.05, Thus the following statement can be presented:
For the dependent variable ACTION, there is no significant mean difference for male
(Mean for male = 2.7, SD = 1.18) and female [Mean for female = 2.9, SD = 1.15; t (318) =
-1.433, p = 0.153]
In terms of OPPINION, there is no significant mean difference for male (Mean for male =
3.05, SD = 1.18) and female [Mean for female = 3.04, SD = 1.07; t (307.187) = 0.032, p =
0.975] and;
There is no significant mean difference in APPEARANCE for male (Mean for male = 2.25,
SD = 1.08) and female [Mean for female = 2.47, SD = 1.08; t (305.392) = 0.66, p = 0.51]
On the other hand, for STATUS (equal variances assumed) the corresponding Sig. (2-
tailed) value is 0.035. Science the Sig. (2-tailed) values for STATUS is less than 0.05, there
is a statistically significant mean difference for STATUS for male (Mean for male = 3.35,
SD = 0.82) and female [Mean for female = 3.54, SD = 0.83; t (318) = -2.12, p = 0.035].
Despite reaching statistical significances the magnitude of the differences in means was
very small (Eta squared = 0.014, See appendix VI).
Table 10: Independent Samples Test
Levene's Test for
Equality of
Variances
t-test for Equality of Means
F Sig. T df Sig. (2-
tailed)/ P-
values
ACTION Equal variances assumed .609 .436 -1.433 318 .153
Equal variances not assumed -1.432 314.255 .153
OPINIONS Equal variances assumed 3.891 .049 .032 318 .975
Equal variances not assumed .032 307.187 .975
APPEARA
NCE
Equal variances assumed 4.104 .044 .664 318 .507
Equal variances not assumed .660 305.392 .510
STATUS Equal variances assumed .082 .775 -2.116 318 .035
Equal variances not assumed -2.117 316.481 .035

Page | 39
5.3 Result of one way between - groups ANOVA with post-hoc Test:
To explore the impact of income on the four variables (OPPINION, APPEARANCES,
STATUS and ACTION) in our model we conducted a one-way between-groups analysis of
variances. In our research we categories our respondents into three income groups (first:
Low Income Group, second: Middle Income Group and last one is High Income Group).
From the ANOVA (table 11) we found Sig. values for OPPINION, APPEARANCES,
STATUS and ACTION are 0.000, 0.004, 0.000, 0.001 respectively. Since all these Sig.
values for the four variables (OPPINION, APPEARANCES, STATUS and ACTION) are
less than 0.05, so it can be said that – there is a statistically significant difference at the
p < 0.05 level in the scores of OPINION [F (2, 317) = 10.321, p = 0.000],
APPEARANCES [F (2, 317) = 5.736, p = 0.004], STATUS [F (2, 317) = 83.132, p =
0.000], and ACTION [F (2, 317) = 7.039, p = 0.001] for the three income groups.
Furthermore we also have found (see appendix VII) that the Sig. value for the question no 8
and 14 are 0.000 and 0.004 respectively. Science both the Sig. values are less than 0.05,
there is a statistically significant difference at the p < 0.05 level in the scores of question no
8 (making the buying decision individually) and question 14 (other countries product are
more interesting) for the three income groups.
Sum of
Squares
Df Mean
Square
F Sig.
OPINIONS
Between Groups 24.445 2 12.222 10.321 .000
Within Groups 375.398 317 1.184
Total 399.843 319
APPEARANCE
Between Groups 11.565 2 5.783 5.736 .004
Within Groups 319.546 317 1.008
Total 331.111 319
STATUS
Between Groups 75.655 2 37.828 83.132 .000
Within Groups 144.244 317 .455
Total 219.899 319
ACTION
Between Groups 18.534 2 9.267 7.039 .001
Within Groups 417.314 317 1.316
Total 435.848 319
Table 11: ANOVA
Post hoc:
After seeing the statistically significant difference at the p < 0.05 level in the scores of
OPPONION, APPEARANCE, STAUTS and ACTION in three different income groups
from the result of one way between groups ANOVA, we have conducted post hoc

Page | 40
comparisons using Hochberg GT 2 test to identify the specific income groups within
which the mean difference exists.
From the Multiple Comparisons table 12 we found that:
o For OPINION, the mean score for high income group (M = 2.25, SD = 1.15) is
significantly different from middle income group (M = 3.21, SD = 1.07) and
low income group (M= 3.08, SD = 1.09). But the low income group does not
significantly different from middle income group.
o For APPEARNACE, the mean score for high income group (M = 2.02, SD =
0.91) is significantly different from middle income group (M = 2.68, SD =
1.04). But the low income group does not significantly different from high
income group and middle income group.
o For STATUS the mean score of each income group is significantly different
from each other [high income group (M = 2.27, SD = 0.63), middle income
group (M = 3.24, SD = 0.61) and low income group (M = 3.84, SD = 0.72)].
o For ACTION, the mean score for high income group (M = 2.01, SD = 1.08) is
significantly different from middle income group (M = 2.93, SD = 1.14) and
low income group (M= 2.83, SD = 1.17). But the low income group does not
significantly different from middle income group.
Hochberg
Dependent
Variable
(I) Q 20.
Income
(J) Q 20. Income Mean
Differenc
e (I-J)
Std. Error Sig. 95% Confidence
Interval
Lower
Bound
Upper
Bound
OPINIONS
High
Income
Middle Income -.96107* .21352 .000 -1.4735 -.4486
Low Income -.83182* .20752 .000 -1.3299 -.3338
Middle
Income
High Income .96107* .21352 .000 .4486 1.4735
Low Income .12925 .12994 .686 -.1826 .4411
Low Income High Income .83182
* .20752 .000 .3338 1.3299
Middle Income -.12925 .12994 .686 -.4411 .1826
APPEARAN
CE
High Income Middle Income -.65809
* .19700 .003 -1.1309 -.1853
Low Income -.45509 .19146 .053 -.9146 .0044
Middle
Income
High Income .65809* .19700 .003 .1853 1.1309
Low Income .20300 .11988 .249 -.0847 .4907
Low Income High Income .45509 .19146 .053 -.0044 .9146

Page | 41
Middle Income -.20300 .11988 .249 -.4907 .0847
STATUS
High Income
Middle Income -.96908* .13236 .000 -1.2867 -.6514
Low Income -
1.56364*
.12863 .000 -1.8724 -1.2549
Middle
Income
High Income .96908* .13236 .000 .6514 1.2867
Low Income -.59456* .08054 .000 -.7879 -.4013
Low Income High Income 1.56364
* .12863 .000 1.2549 1.8724
Middle Income .59456* .08054 .000 .4013 .7879
ACTION
High
Income
Middle Income -.83376* .22513 .001 -1.3741 -.2935
Low Income -.73358* .21879 .003 -1.2587 -.2085
Middle
Income
High Income .83376* .22513 .001 .2935 1.3741
Low Income .10019 .13700 .846 -.2286 .4290
Low Income High Income .73358
* .21879 .003 .2085 1.2587
Middle Income -.10019 .13700 .846 -.4290 .2286
*. The mean difference is significant at the 0.05 level.
Table 12: Multiple Comparisons
So, an overall scenario of our above analysis is presented here. First of all, R2 value (0.533)
from the regression model shows that the independent variables can explain the dependent
variables (ACTION) by 53.3% and due to having the Sig value of 0.000 of our regression
model it confirms that the model is statistically significant. Secondly, from the evaluation
of individual variables it has been found that the Sig. value for three independent variables
(OPINIONS, APPEARANCE AND STATUS) of regression model is less than 0.05 which
refers that the probability of occurring the same outcome is 95% out of 100%.That is why
we can say that OPINIONS, APPEARANCE AND STATUS have made a statically
significant contribution to predict the dependent variable (ACTION) of proposed model.
We have proposed a model based on our three hypotheses in the literature review chapter.
Thirdly, through regression analysis as discussed above, we have found that a respectable
relationship exist between our dependent variable (ACTION) and the three independent
variables (OPINIONS, APPEARANCE AND STATUS) of our proposed model. That‟s
why we would like to state that all the three hypothesis are accepted.
Fourthly, we go through the independent sample T-test to get whether there is any mean
difference between male and female. The result of independent sample T-test shows that
there is no significant mean difference between male and female for ACTION, OPPONION
and APPEARANCES. On the other hand it has been found that a significant mean
difference exist between male and female for STATUS.
Fifthly, from the result of one way between – groups ANOVA we have found that there is a
statistically significant difference at the p < 0.05 level in the scores of OPINION,
APPEARANCES, STATUS and ACTION for the three incomes groups (High, Middle and
Low). Lastly in order to specify the income groups within which the mean difference exists
we executed post-hoc comparisons.

Page | 42
Chapter 6: Discussion
Our objective of this research is to find out the factors that influence the handicraft buying
behavior of Swedish customers. As hand made products are more natural and sustainable
so people might more interested to buy it. We think that our findings might help the
Managers to make marketing. There are other aspects that may influence the buying
decision which has been discussed in the further research section.
6.1 Discussion:
The objective of our research was to find out the determinant factors that influence buyers‟
to purchase handicrafts products. Through our analysis we have found that opinion of
friends & family, product appearance and showing status are the determinant factors that
influence Swedish customers while making any buying decision of handmade crafts. In
addition we have found some research studies that also support in favor of our findings
which are presented here:
6.1.1 Opinion of Friends and Family:
According to Haque et al., (1997, p. 389) social groups can have effects on individual
behavior. Their opinions or information regarding any specific products or services can
influence customer decision.
We have found some studies which describe the family influences over customer purchase
decision. Gilbert et al., (1979, p. 27) explains that parents and peers influence works
differently to different birth order. For example first born people communicate more
frequently with their parents regarding their consumption issues. On the other hand, the
later born babies interact more frequently with their peers than their parents regarding
consumption matter. In addition, Gilbert et al., also argued that people from lower income
families may not get adequate chance of consuming a certain product or service compare to
the people who belong to upper class. According to Riesman and Roseborough (1955, cited
in Gilbert et al., 1979, pp. 27 - 28) goal- oriented" or "rational" aspects of consumption
are learned by the young people from their parents. The frequency of communication
regarding consumption between people and their parents is positively linked to the strength
of customers monetary incentive for consumption.As a result, the family or peer influence
may vary from individual to individual based on their social class too. For example - Du
Plessis and Rousseau (2003, p. 9) reveal that the decision making process for purchasing a
services or a product is influenced by the individual, family or organization. Based on the
family condition every family has someone who has an impact on information flow and
buying decision. More specifically decision making for the shopping has four processes,
they are „husband-dominant, wife-dominant, automatic and syncretic decision making‟
(Lamb et al., 2004, p. 98; Du Plessis and Rousseau, 2003, p. 379). According to Childers
and Rao (1992, p, 200) peer influence is very strong for privately consumed luxury

Page | 43
products and family members‟ influence on the brand for such products is very high as
they are used at home and this influence is much higher in the extended family than nuclear
family.
According to Ajzen (2005, p.124-125) individual‟s normative belief can be created by their
closest and important referent groups like their parents and friends. In fact, due to the the
social pressure from those referent groups, normative beliefs are created in individual‟s
mind. Being influenced by those normative beliefs sometimes consumers decide whether
s/he will do or not do the behavior in question and eventually, an individual‟s subjective
norm for a certain behavior is produced by that subjective belief.
Based on the correlation result we acknowledge the importance of Opinion of Friends and
Family on the dependent variable action. The Correlation between the Opinion of Friends
and Family and action is positive and both variables have the highest value (r =.637, Sig. =
000) compared to other variables. So, Opinion of Friends and Family has been found to be
the more influential factor on Swedish customers buying decision of handicrafts than
product appearance and showing status. Therefore, the result suggests us to support our first
hypothesis (H1).
6.1.2 Product Appearances:
A study conducted by Bal & Dash (2010, p. 33) on 1000 customer in Orissa (Province of
India) reveals that the key motivation for purchasing handicrafts was the artistic nature of
the product. In addition, among four types of handmade products Applique was the most
popular craft item. A religious interpretation in handicrafts item was another important
aspect to purchase the handmade product. Another research conducted by Wiboonpongse et
al. (2007, p. 475) among 723 local and tourist buyer in two largest northern cities in
Thailand depicts that the most important reasons for buying handicrafts are having the
reflection of Thai identity in the product, purchasing to assist handicrafts sector, artistic
value of the product, representation of local life style in the product. Kung et.al (2012, p.
1387) finds that the novelty and uniqueness of handmade crafts has significant influence on
tourists to purchase handicrafts.
Stoddard et al. (2012, pp. 97 - 98) postulates that the arts and crafts are hedonic by nature
and purchasing of these arts and crafts products are also hedonic to a large extend.
Furthermore it is very difficult to evaluate the significance of purchasing handmade
product. Consumer purchase behavior regarding arts and crafts products differs from the
utilitarian products too. Though it is difficult to evaluate, Yu and Littrell (2003, p. 143)
classified consumer purchasing style into two categories – „Product Orientated‟ and
„Process Orientated‟. Product Oriented consumer emphasized on workmanship and
aesthetic quality of the crafts, on the other hand process oriented consumer emphasized on
linking culture and artisan through communicating with craftsman and sellers.
According to Montaño and Kasprzyk (2008, p.71) individual‟s beliefs about the outcome of
performing a certain behavior is called behavioral belief. An individual may have a very
positive attitude toward performing a certain behavior if s/he holds a strong belief about the

Page | 44
outcome or attributes of that behavior along with positive evaluation of the outcome.
Hence, consumers may have positive attitude toward any certain behavior or decision if
their beliefs about the outcomes or attributes are supported by positive evaluation too
(Hansen et. al., 2004, p. 542)
In this thesis, we have focused our own findings generated by SPSS. According the Pearson
Correlation (see table 6) the correlation between handicraft appearance & Action
(handicraft purchase) is not only positive but also strong (r = .602, Sig. = .000) .Thus, this
strong relation between the two variables indicate that our second hypothesis (H 2) is
supported.
6.1.3 Showing Status:
According to Scrase (2003, pp. 450 - 453), European buyers want to know more about the
artisan and products when they buy any handmade products. To integrate themselves with a
particular tradition, they buy handicrafts in order to support the straggling community of
artisan, there daily activity and the artistic skill. The whims of global customer demand
largely determine the success of artisanal crafts in local and foreign markets and from the
macro perspective artisan crafts divided into two classes. One is for daily uses for mass
customer around the globe; Scrase (2003, pp.453-454) named this type - „quotidian‟ crafts‟.
Quotidian crafts includes a lot of varieties like women‟s bag made by cloth, leather wallets,
handbags, floor rugs, some dress jewellery etc. On the other hand, the second one is only
for the elite customers of the society which is namely „elite crafts‟. Basically these elite
crafts are purchased by those elite customers who would like to show their status in their
society by possessing superior quality, uncommon and or with great artistic beauty
handicrafts. These elite customers often try to connect stories regarding the handicraft like
– back ground history of the product, how it is made, the location from where it is, the
artists who made it etc. Thus, by owning elite crafts they feel comfort to show their social
status. According to Weber (cited in Blumberg, 1974, p. 481) this status is a subjective
measurement of social class, degree of respect, honor and social value associated with the
individual by his surrounding people. Often the symbol of status of an individual is shown
by owning a material item that is both desirable and rare. These products also ensure of its
owners social value in the society.
Correlation analysis between showing up status and action (purchase decision) the purchase
intention shows that a positive correlation(r =.399, Sig. = .000) exists. Although the
relationship strength between these two variables is low, the result of correlation and
multiple regression analysis presents positive relationship between these two variables.
Therefore, the result suggests us to uphold our third hypothesis ( H3)
6.2 Contribution of TPB and TRA:
From the correlation analysis we found that the relationship between opinion of friends &
family members and action (purchase decision) is very strong and positive. According to
Ajzen (1991, p.188 & p.195) subjective norm is a direct determinant of an individual‟s
intension and behavior. The subjective norm comes from normative beliefs. This normative

Page | 45
belief deals with the perceived social pressure that determine whether an individual will
perform a certain behavior or not and such social pressure may come from the important
referent groups of the individuals. Based on our correlation result it can be stated that
friends and family members (social groups) are the creator of normative beliefs to
determine handicraft purchase decision. So our first hypothesis (Opinion of friends &
family members) is also well connected with normative belief and in this way the
explanation of our first hypothesis (H1) is contributed by the subjective norm of TPB.
According to Ajzen (1991, p. 191) an individual‟s behavioral belief determines that
person‟s attitude toward performing certain behavior. If an individual strongly beliefs that
performing a certain behavior may result a positive outcome then s/he may hold a favorable
attitude toward performing that particular behavior. On the other hand, if an individual
strongly beliefs that performing a certain behavior may result a negative outcome then s/he
may hold a negative attitude toward performing that particular behavior. The positive
correlation indicates the existence of positive relation between product appearance and
action (purchase decision).So, the positive beliefs regarding Product appearance resembles
with the first element of the Theory of planned behavior (TPB) and in this way our second
hypothesis (H2) is contributed by attitude toward behavior of TPB.
Our third hypothesis was constructed based on the assumption that people beliefs that they
can show up their status in their society by having expensive handmade crafts while they
hold available resources and opportunities. Our correlation analysis shows that there is a
positive correlation between showing status and action (Purchasing decision).According to
Ajzen (1991, p.188 & p.195) Perceive behavioral control deals with the likelihood of
performing a certain behavior that depends on perceived opportunities or difficulties. This
Perceived behavioral control generated from control believes. So we state that our assumed
belief regarding the third hypothesis is directly linked with perceived control beliefs. Thus,
our third hypothesis is contributed by the third component (perceived behavioral control) of
TPB too.
Although we have not found any literature about friends and family members‟ direct
influence on handicraft purchase decision, our analysis presents that the three hypotheses
based on product appearance, friends and family opinion and status are statistically
significant. Thus, to sum up it can be said that our following proposed model has a good fit
with this research study.
Figure 7: Proposed model originated from TPB
Age
Gender
Opinion
Appearanc
e
Status
Action

Page | 46
In addition, while comparing the mean differences between the each income groups
through post hoc gt 2 we found friends & family members and other peoples opinion has
identical influence on middle and low income group. In contrary, comparing the mean
differences of high income group with middle and then low income group we found that
opinion influences differently on the purchase decision of high income group than middle
and also low income group . In terms of influence by product appearance we saw that it
differs between high and middle income groups purchase decision. Furthermore, it has been
found that status influences differently for three different income groups.
In a similar way, while comparing the mean differences between each age groups for
Action through post hoc gt 2 we found 18 – 27 has significant mean difference buying
decision than 48 – 57 and 58+. Furthermore, age group 28 – 37 has also significance mean
difference buying behavior than groups 48 – 57 and 58+. Finally, 38 – 47 has different
buying decision than 48 – 57. Considering gender it has seen through independent sample T
test, there is no significant difference between Male and Female handicrafts buying
decision. But to do the action there are slight significant mean difference between male and
female by the appearance of a product and the opinions of friends and family.
6.3 Managerial Implication:
Understanding the factors that influence the Swedish shoppers on their buying decision on
hand made product can have greater interest to the retailer as well as the whole seller.
Specifically the marketers might be benefited by our study findings in making their
marketing strategy for targeting the Swedish customers.
For instance to market handmade crafts among tourists our findings might have some
impact too. According to Pettersson (2004, p. 32 - 34) supply of Swedish Sami tourism
attractions and activities are in a growing trend as well as there is a high demand for Sami
tourism among the tourists visiting in northern Sweden. Those tourism activities are mostly
attracted by the middle-aged, well educated women, previously visited people etc. So, in
order to target these tourist groups‟ marketers can also take into account our research
findings in building their marketing strategy.
As our research findings postulate that Swedish consumer are influenced by the friends &
family, social status and by the product itself, the importer, showroom owner and the
manufacturer can take necessary action too. As an importer the findings of product
appearances could help them to select the crafts around the world, attach with that friends
and family‟s liking will also help them to categories the crafts for different age, gender and
income level people. These findings could also implement by the showroom owner, where
the social status and friend and family‟s findings particularly by gender and income level
would help them to arrange the product placement in the showroom. At the end
manufacturer might design the product more unique and luxury way as the Swedish people
has the demand of showing the social status, more over a basic design of handmade product
and general acceptance of its product might help from our findings as because they give
value to the friends and family opinion. Similarly these findings might help the new
entrepreneur to start business in Sweden. As there are some basic phenomena and their
Page | 47
consequences on Swedish shoppers has find out, these findings will help new comer to start
the business in Sweden.
In addition according to Danajaya & Gisijayanto (2010, p. 266) the design, raw material
and the quality of the product influences the consumer to take the decision. Similarly the
group (friends and family) also has influences to buy a product. As it has seen that in
general the factors we have studied have influences on buying decision and in our findings
we have seen that Swedish people are influences to buy handmade product by the three, so
the manager could rely on our findings and take decision based on that.
We think that there are few important issues which need to be addressed herein our
research paper. According to Dhingra and Dhingra (2012, p. 105) handicraft industry is not
only highly environment friendly but it also consumes low energy .Unlike developing
countries Swedish govt. and people are also conscious about the environment. So, there is
no negative impact on environment rather handicraft business indirectly plays a supportive
role to make the society more favorable to live and marketers can promote this issue in
Sweden.
Secondly, According to Bal and Dash (2010, P. 24) handicrafts are highly produced in less
developed countries and exported to developed countries as they are hugely demandable
in developed countries. According to Dhingra and Dhingra (2012, p. 105) there are thirteen
million people are working in Handicrafts industry in India. So, we assume that if the
marketers can create more demand for handmade craft in developed countries, this industry
may have more positive impact in the less developed societies by generating more
employment among marginalized segments of the society in under developed countries.
The working environment and health conditions are also an important point to be note out.
According to Gani and Shah (1998, p. 356 - 361) in the handicrafts industry there are lot of
child labor in India which age are 7 years. They are often works 14 – 16 hours a day and
the working conditions are unhygienic, crowded, poor light etc. which causes lot of
common physical problems like – joint pain, eyes etc.
6.4 Conclusion:
The aim of our study was to identify the factors that influence the Swedish consumer to
purchase handicrafts product that is represented by our research question - “What are the
determinant factors that influence their decision to purchase handicrafts product?”. As the
research is designed for the exploratory purpose so the idea has been generated and
followed by hypothesis and ended up with the result from the primary data. So, from the
result of our study it is clear that each of the hypothesized factors have influences on
making consumers decision about purchasing handicrafts which has its own interpretation.
The summary of the interpretation of the result of our three hypothesis shows that our
research question is answered.
From our study we explored that friends and family have the highest influences on their
decision making while Swedish customers purchase any hand made products,. The product
appearance also has an impact on their decision making but compare with the friends and

Page | 48
family influences product appearance has lower impact. In addition, we have discovered
that Swedish people buy hand-made product to show up their social status too. These three
influential factors are described and supported by three key elements of theory of planed
behavior. First of all, normative belief shows that Swedish customers are motivated by the
social pressures from important social groups. Secondly, behavioral believe explains that
they are also motivated by the outlook and the quality of handmade crafts. Last but not the
least, Swedish handicraft customers judgment about their social level is described by the
control belief too.
From the correlation analysis it has been proved that among the three factors the friends
and family has the highest relation with the purchase decision (action); appearances of the
product has the second highest and showing status has third highest relation. Although
showing status has the lowest correlation, ANOVA analysis presents that there are
significant differences within some income groups regarding showing status.
6.5 Limitation of Research:
There are some critical issues which have been raised the option for conducting a research
in the future. First of all this research had been conducted only in three big cities of Sweden
but there are many more handicrafts customers in other big cities too. Most of the data had
been collected from Umeå and Stockholm and small number of data from Malmö. So, the
total number of sample size was quite insufficient to get the clear picture about handicrafts
buying behavior of overall Swedish consumer. In addition, we were dependent on our
fellow representative in Stockholm and Malmö which might have created some limitation
to collect the data from the representative. Science we have tried to identify the factors that
affecting the buying decision of customers (The Viewpoints of Swedish Shoppers), factor
analysis could be more appropriate for this research than regression analysis.
Finally, although our proposed model is based on the Theories of Plan Behavior (TPB and
TRA) in this research study, the behavioral intention hasn‟t been measured to predict
handicraft buying behavior of Swedish customer.
6.6 Further Research:
We have focused on only three factors to find out our research question. But there are lots
of other factors (social, economic, environmental, political etc.) which influence to buy the
handmade product. Moreover our research has been done on overall handicrafts product but
there could be more research on category specific (Furniture, Home Decoration, Ornament,
Clothing etc.) handicrafts purchase decision. Following that different country have different
kind of culture, so there could be more research whether the influential factors varies from
culture to culture or country to country.
In those above case researchers can choose some other consumer behavior theory rather
than Theory of Planed Behavior. Is because the Theory of Planed Behavior only deals with
the intention and attitude, where the research mentioned above need the focus on influential
factors.

Page | 49
References:
Aaker, D. A., Kumar. V., & Day. G.S. (2004). Marketing Research. 8th Edition. Hoboken,
N.J.: Wiley & Sons, Inc.
Ajzen, I. (1988). Attitudes', personality, and behavior. Chicago: Dorsey Press.
Ajzen, I. (1991). The Theory of Planned Behavior. Organizational behavior and human
decision processes, University of Massachusetts at Amherst, 50, 179-211.
Ajzen, I., & Fishbein, M. (1980). Understanding attitudes and predicting social behavior.
Englewood Cliffs, N.J.: Prentice-Hall.
Ajzen, I., & Fishbein M. (2005). The influence of attitudes on behavior. In D. Albarracín,
B.T. Johnson, & M.P. Zanna, ed. The Handbook of Attitudes. Mahwah: Lawrence
Erlbaum Associates.
Armitage, C. J. & Conner M. (2001). EYcacy of the Theory of Planned Behaviour: A meta-
analytic review. British Journal of Social Psychology, 40, 471–499
Aug, R. P. & Teo, J. C. (1995). Philippine Export Promotion Policies and Their
Responsiveness to European Market Conditions: A Case Study of Philippine
Handicraft Exports to Belgium and Germany. In: Ateneo, de Manila University,
Philippian, Sep 1 – 18.
Bal, R. K. & Dash, M. (2010). A Study on Factors Determining Buying Behavior of
Handicraft Items - With Reference to Handicrafts of Orissa. IUP Journal of
Management Research, 2 (2), 24 – 34.
Bamberg, S., (2002). Implementation Intention versus Monetary Incentive Comparing the
Effects of Interventions to Promote the Purchase of Organically Produced Food.
Journal of Economic Psychology, 23 (5), 573 – 587.
Barbara, B. (2011). A Brief History of the Crafts Industry.
<http://www.barbarabrabec.com/homebiz/history-of-the-crafts-industry.htm>
[Retrieved: 10-04-2012].
Batchelor, S. J. and Webb M. (2010). E-commerce Options for Third World Craft
Production. DFID Knowledge and Research Project R7782.

Page | 50
Biggs, T., Miller M., Otto, C., and Tyler, G. (1996). Africa can compete!: export
opportunities and challenges in garments and home products in the European
market. Washington D.C.: World Bank Publications.
Bleakley, A., & Hennessy M. (2012). The Quantitative Analysis of Reasoned Action
Theory. The ANNALS of the American Academy of Political and Social Science,
640, 28 - 41.
Blue, C.L. (1995). The predictive capacity of the theory of reasoned action and the theory
of planned behavior in exercise behavior: An integrated literature review. Research
in Nursing & Health, 18, 105 - 121.
Blumberg, P. (1974). The Decline and Fall of the Status Symbol: Some Thoughts on Status
in a Post-Industrial Society. Society for the Study of Social Problem, 21 (4), 480-
498.
Bradley, K., (2009). Planning for eco-friendly living in diverse societies. Department of
Urban Planning and Environment, Royal Institute of Technology. Local
Environment, 14 (4), 347–363.
Bryman, A. & Bell, E. (2007). Business Research Methods. (2nd Edition ed.). New York:
Oxford University Press.
Bryman, A. & Bell, E. (2011). Business Research Methods (3rd Edition ed.). NewYork:
Oxford University Press.
Cannière, M. H. D., Pelsmacker P. D. & Geuens M. (2009). Relationship Quality and the
Theory of Planned Behavior models of behavioral intentions and purchase behavior.
Journal of Business Research 62, 82–92.
Campbell, C. (2005). The craft consumer. Journal of Consumer Culture, 5 (1), 23 – 4.
Childers, T. L. & Rao, A. R. (1992). The Influence of Familial and Peer-Based Reference
Groups on Consumer Decisions. Journal of Consumer Research, 19 (2), 198-211.
Chiou, J. S. (2000). Antecedents and moderators of behavioral intention: Differences
between U.S. and Taiwanese students. Genetic, Social, and General Psychology
Monographs, 126 (1), 105-124.
Colbert, F.(2003). Entrepreneurship and leadership in marketing the arts. International
Journal of Arts Management, 1009 (5), 30-39.
Dash, M. (2011). Buyers‟ Preferences of Product Design for Purchase Of Selected Indian
Handicrafts with Special Reference to Orissa State. Asia Pacific Journal of
Research in Business Management, 2 (6), 240 – 257.

Page | 51
Dananjaya, I. & Gisijanto, H. A. (2010). Analysis of factors associated with ecisions in
purchasing wayang motif leather craft (chisel decoration) by foreign tourist (case
research at central industrial village of bantul regency yogyakarta). In: Global
Management Conference – Bal. Indonesia, April-May 2010.
De, C., Marie, H., De, P. P., & Geuens, M. (2009). Relationship quality and the theory of
planned behavior models of behavioral intentions and purchase behavior. Journal of
Business Research, 62 (1), 82 – 92.
Deepak, J. S. (2008). Protection of Traditional Handicrafts under India Intellectual Property
Laws. Journal of Intellectual Property Right,13, pp. 197 – 207.
Dhamija, J. (1975). Handicrafts: a source of employment for women in developing rural
economies. Int'l Lab. Rev., 112, 459 - 465.
Dhingra, V. & Dhingra, M. (2012). Factors Affecting Quality of Work Life of Handicraft
Workers- A Study of Handicraft Units in and around Moradabad. New York Science
Journal, 5 (10), 105 – 113.
Du Plessis, P., J. & Rousseau, G., G. (2003), Buyer Behaviour: A Multi-cultural Approach.
Oxford University Press, Cape Town.
Ericsson, T. (2001). Women, family, and small business in late nineteenth century Sweden.
The History of the Family, 6 (2), 225 – 239.
Favle, J. & Bouquet M. (2006). Europe‟s eCommerce Forecast: 2006 To 2011, Includes
Consumer Technology Adoption Study data. Forrester Research, Inc., Cambridge.
PP 1 – 7.
Fishbein, M., Ajzen, I. (1975). Belief, attitude, intention and behaviour: An introduction to
theory and research. Reading, Mass: Addison-Wesley.
Gani, A. & Shah, M. A. (1998). Child Labour in Carpet Industry of Kashmir. Indian
Journal of Industrial Relations, 33 (3), pp. 349-366
Garber, E. (2002). Craft Education in Finland: Definitions, Rationales and the Future.
International Journal of Art & Design Education, 21 (2), 132–145.
George, D., & Mallery, P. (2003). SPSS for Windows step by step: A simple guide and
reference. 11.0 update (4th Ed.). Boston: Allyn & Bacon.
Ghosh, A., (2012). TRIGGERING INNOVATION AND CREATIVITY IN
TRADITIONAL HANDICRAFTS SECTORS - AN INDIAN PERSPECTIVE.
Global Institute of Management & Technolog, 8 (1), p 67 – 71.

Page | 52
Gilbert, A, Churchill. Jr, & George, P., M. (1979). Television and Interpersonal Influences
on Adolescent Consumer Learning. Journal of Consumer Research, 6 (1) 23-35.
Gilbert, A, Churchill. Jr, & Iacobucci. D. (2005). Marketing Research methodological
foundations, 9th Edition, South - Westernm, Thomson Corporation.
Girón, J., P., H., Hernández, M., L., D. and Castañeda, M., C. (2007). Strategy and factors
for success: The Mexican handicraft sector. Performance Improvement, 46 (8), 16 –
26.
Hansen, T., Jensen J. M. & Solgaard, H. S. (2004). Predicting online grocery buying
intention: a comparison of the theory of reasoned action and the theory of planned
behavior. International Journal of Information Management, 24, 539–550.
Haque, A., Khatibi, A., and Rahman, S. (2009). Factors Influencing Buying Behavior of
Piracy Products and its Impact to Malaysian Market. International Review of
Business Research Papers, 5 (2), 383-401.
Holme, I. M., & Solvang, B. K. (2006). Forsknings metodik, Om kvalitativa och kvantiativa
metoder, 2 upl. Studentlitteratur. IUP Journal of Management Research, Oct 2010, 9
(6),38-56.
Jena, P. K. (2008). Globalization of Indian Handicrafts: A Human Development Approach.
Orissa Review, 19-25.
Kantola, J., Nikkanen, P., Kari, J. & Kananoja, T. (1999). International Relations of Uno
Cygnaeus and development of Handicrafts Education in the Nordic Countries
Jyväskylä University. Institute for educational research. pp. 9 – 17.
Kennedy, C. (2008). American Artisanry. Gifts & Decorative Accessories, 109 (4), 43 – 46.
Kent, R. (2007). Marketing Research, Approaches, Methods and Applications in Europe,
London: Jennifer Pegg.
Kim, H. & Karpova E. (2010). Consumer Attitudes Toward Fashion Counterfeits:
Application of the Theory of Planned Behavior. Clothing and Textiles Research
Journal, 28, 79 – 94.
Klein, B. (2000). The Moral Content of Tradition: Homecraft, Ethnology, and Swedish Life
in the Twentieth Century. Western States Folklore Society, 59 (2), 171-195.
Kung, R., H., Liu, J,. C., Chang, C. T. & Chen P. T. (2012). Exploring the Relationships
Among Shopping Motivation, Shopping Behavior and Post Purchasing of Mainland
Tourists Toward Taipei Night Markets. World Academy of Sciences and
Technology, 68, 1383 – 1388.

Page | 53
Kyoung, E. (2010). Study on the communication strategy to increase the awareness of
fabric Hanji in Swedish market. Master Thesis. Borås: University of Borås.
Lamb, W., C., Hair, J., F., McDaniel, C., Boshoff, C. & Terblanche, N., S. (2004),
Marketing, Second South African Edition. Cape Town.: Oxford University Press.
Lee, H. & Whitley, E., A. (2002), Time and Information Technology: Temporal Impacts on
Individuals, Organizations, and Society. The Information Society, 18, PP. 235–240.
Maruyama, N. U., Yen, T. H. & Stronza, A. (2008). Perception of authenticity of tourist art
among Native American artists in Santa Fe, New Mexico. International Journal of
Tourism Research, 10 (5), 453 – 466.
Milin, I. A., Merce, I. I., Iancu, T., Brad, I. & Pet, E. (2010). Handicraft cooperatives and
development aspects of the consumption in Romania during 2009–2013.
Universitatea de Ştiinţe Agricole şi Medicină Veterinară Iaşi, 53, 388 – 390.
Miniwatts Marketing Group (2012, May) Internet World Stats: Usage and Population
Statistics <http://www.internetworldstats.com/top25.htm#links> [Retrieved 2012-
07-20].
Montano, D. E. & Kasprzyk D. (2008). Theory of Reasoned Action, Theory of Planed
Behaviour, and the Integrated Behavioral Mole followed by Glanz, K., Rimer, B.
K., and Viswanath, K., Hlealth Behavior and Health Education, 4th
edition. USA:
Jossey – Bass.
Mutua, K., Massimo, S. K. and Mburu, P. T. (2008). An Empirical Study of the Botswana
Handicraft Market. Journal of African Business, 5 (2), 93-112
Müller, D. K. and Pettersson, R. (2001). Access to Sami tourism in northern Sweden.
Scandinavian Journal of Hospitality and Tourism, 1 (1), 5 – 18.
Müller, D.K. and Pettersson, R. (2006). Sámi heritage at the winter festival in Jokkmokk,
Sweden. Scandinavian Journal of Hospitality and Tourism, 6 (1), 54 – 69.
Nagori, N. and Saxena K. (2012). Marketing Of Rural Handicraft Products Through Retail
Format: A Synthetic Review. Annals of Management Research, 2 (1), 45 – 59.
Nedelcheva, A., Dogan Y., Obratov-Petkovic D., Padure I. M. (2011). The Traditional Use
of Plants for Handicrafts in Southeastern Europe. Springer Science+Business
Media., 39, 813–828
Ngudup, P. & Chen J. C. H., (2005). E-commerce in Nepal: a case study of an
underdeveloped country. Int. J. Management and Enterprise Development, 2 (3/4),
306 – 324.
Page | 54
Nilsson, A. (2008) Vocational education and training in Sweden 1850-2008-a brief
presentation. Bulletin of Institute of Vocational and Technical Education, 5, 78 –
91.
Pallant, J. (2005), SPSS Survival Manual: A Step by Step Guide to Data Analysis Using
SPSS for Windows (Version 12), 2nd
Edition. Allen & Unwin. (We have the ref. but
need to fix it)
Perivoliotis, M. C. (2001). The Management and Marketing of Craft Textiles. Journal of
the Textile Institute. 92 (1), 31 – 39.
Pettersson, R. (2004). Sami Tourism in Northern Sweden: Supply, Demand and Interaction.
Doctoral Dissertation: Umeå & Östersund, Umeå University & Mid-Sweden
University.
redQ AB (2012, September). Om redQ. redQ web site < http://redq.se/om-redq/>
[Retrieved 2013-08-20].
Samiskt Informationscentrum (2006, September) Tradition and modern thinking .Samiskt
web site <http://www.eng.samer.se/servlet/GetDoc?meta_id=1001> [Retrieved
2012-07-22].
Saunders, M., Lewis, P., & Thornhil A. (2007). Research methods for business students,
3rd edition. Harlow: Prentice Hall, Cop.
Saunders, M., Lewis P. and Thornhill A. (2009) Research Methods for business students
4th edition. Harlow: Prentice Hall, Cop.
Saunders, M., Lewis P. & Thornhill A. (2012). Research Method for Business Students, 6th
Edition. Harlow: Prentice Hall, Cop.
Scrase, T. J (2003) Precarious Production: Globalisation and Artisan Labour in the Third
World. Third World Quarterly, 24, 3, pp. 449-461
Shaw, L. (2006). Co-operation, social responsibility and fair trade in Europe. Manchester:
Co-operative College.
Sheth, J. N. (1985). History of Consumer Behavior: A Marketing Perspective. Historical
Perspective in Consumer Research: National and International Perspectives. 5 -7.
(End note)
Shiu, E., Hair, J., Bush, R. & Ortinau, D., (2009). Marketing research, European Edition.
London, UK: McGraw - Hill Higher Education.
Sterner, E. (2002). Green Procurement of Buildings. Estimation of life-cycle cost and
environmental impact. Doctoral Thesis. Luleå: Luleå University.

Page | 55
Stoddard J. E., Evens A. R. & Shao X., (2012). Marketing Arts and Crafts: Exploring the
connection Between Dedonic Consumption Decission Channel and Consumption.
International Journal of Hospitality and Tourism, 13 (2), 95 – 108.
Thorbjörnsson, H. (2006). Swedish educational sloyd–an international success. Tidskrift för
lärarutbildning och forskning, 10 (33), 2 – 181.
Trägårdh, B. (2008). Trespassing entrepreneurship: bridging business and community
development. Göteborg: Handelshögskolan vid Göteborgs universitet.
Vadhanasindhu, p. & Yoopetch, C. (2006) A Study on Factors Affecting Purchasing
Decision on Thai Silk Handicraft of International Tourists in Bangkok. Masters.
Bangkok, School of Business, University of the Thai Chamber of Commerce.
Vainio-Korhonen, K. (2000). Handicrafts as professions and sources of income in late
eighteenth and early nineteenth century Turku (Åbo). Scandinavian Economic
History Review, 48 (1), 40-63.
Wheelersburg, R. P. (2005). The Sámi People: Traditions In Transition. Arctic, 58 (3) 314 –
316.
Wiboonpongse, A., Sriboonchitta, S. and Chaovanapoonphol, Y. (2007). Modeling a
Hedonic Price of Northern Thai Handicraft Products. ASIMMOD, 472 – 478.
Yu, H. & Littrel, M. A. (2003). Product and Process Orientations to Tourism Shopping.
Journal of Travel Research, 42, 140 – 150.

Page | 56
Appendix I: Regression Analysis (Correlations)
Correlations
(Summated
score of Q1-3)
ACTION
(Summated score
of Q4-7)
OPINIONS
(Summated score of
Q9,10, 12)
APPEARANCE
(Summated score
of Q11, 13)
STATUS
Pearson
Correlation
(Summated score of Q1-3) ACTION 1.000 .637 .602 .145
(Summated score of Q4-7) OPINIONS .637 1.000 .588 .155
(Summated score of Q9,10, 12)
APPEARANCE .602 .588 1.000 .090
(Summated score of Q11, 13) STATUS .145 .155 .090 1.000
Q 8. Mostly Up to Me -.431 -.600 -.294 -.090
Q 14. Other Countries are More Interesting .303 .441 .356 .130
Q 15. Authentic by a Seal of Authority -.159 -.176 -.131 .049
Q 16. Importent to Know Who Made It -.045 -.165 .002 .006
Sig. (1-tailed)
(Summated score of Q1-3) ACTION . .000 .000 .005
(Summated score of Q4-7) OPINIONS .000 . .000 .003
(Summated score of Q9,10, 12)
APPEARANCE .000 .000 . .054
(Summated score of Q11, 13) STATUS .005 .003 .054 .
Q 8. Mostly Up to Me .000 .000 .000 .054
Q 14. Other Countries are More Interesting .000 .000 .000 .010
Q 15. Authentic by a Seal of Authority .002 .001 .010 .189
Q 16. Importent to Know Who Made It .211 .002 .485 .458

Page | 57
N
(Summated score of Q1-3) ACTION 320 320 320 320
(Summated score of Q4-7) OPINIONS 320 320 320 320
(Summated score of Q9,10, 12)
APPEARANCE 320 320 320 320
(Summated score of Q11, 13) STATUS 320 320 320 320
Q 8. Mostly Up to Me 320 320 320 320
Q 14. Other Countries are More Interesting 320 320 320 320
Q 15. Authentic by a Seal of Authority 320 320 320 320
Q 16. Importent to Know Who Made It 320 320 320 320
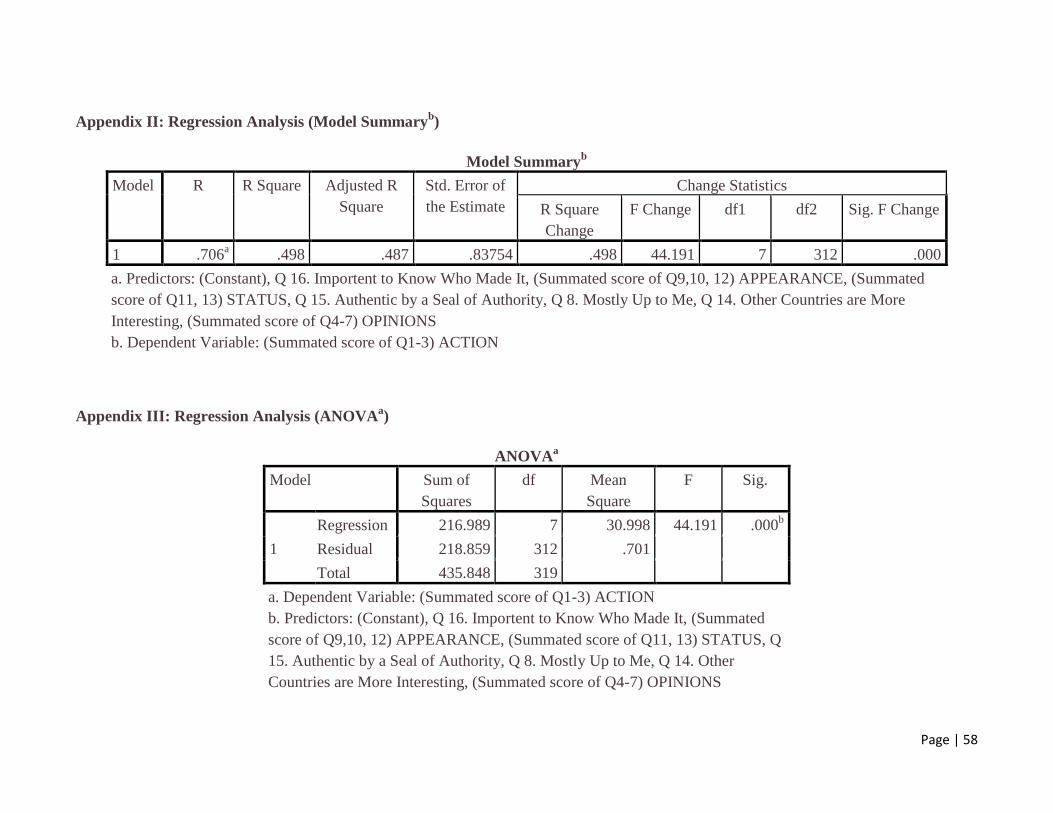
Page | 58
Appendix II: Regression Analysis (Model Summaryb)
Model Summaryb
Model R R Square Adjusted R
Square
Std. Error of
the Estimate
Change Statistics
R Square
Change
F Change df1 df2 Sig. F Change
1 .706a .498 .487 .83754 .498 44.191 7 312 .000
a. Predictors: (Constant), Q 16. Importent to Know Who Made It, (Summated score of Q9,10, 12) APPEARANCE, (Summated
score of Q11, 13) STATUS, Q 15. Authentic by a Seal of Authority, Q 8. Mostly Up to Me, Q 14. Other Countries are More
Interesting, (Summated score of Q4-7) OPINIONS
b. Dependent Variable: (Summated score of Q1-3) ACTION
Appendix III: Regression Analysis (ANOVAa)
ANOVAa
Model Sum of
Squares
df Mean
Square
F Sig.
1
Regression 216.989 7 30.998 44.191 .000b
Residual 218.859 312 .701
Total 435.848 319
a. Dependent Variable: (Summated score of Q1-3) ACTION
b. Predictors: (Constant), Q 16. Importent to Know Who Made It, (Summated
score of Q9,10, 12) APPEARANCE, (Summated score of Q11, 13) STATUS, Q
15. Authentic by a Seal of Authority, Q 8. Mostly Up to Me, Q 14. Other
Countries are More Interesting, (Summated score of Q4-7) OPINIONS

Page | 59
Appendix IV: Regression Analysis (Coefficientsa)
Coefficientsa
Model Unstandardized
Coefficients
Standardized
Coefficients
t Sig. Collinearity
Statistics
B Std. Error Beta Tolerance VIF
1
(Constant) .641 .412 1.557 .121
(Summated score of Q4-7)
OPINIONS .378 .064 .362 5.882 .000 .424 2.356
(Summated score of Q9,10, 12)
APPEARANCE .406 .058 .354 6.966 .000 .624 1.602
(Summated score of Q11, 13)
STATUS .066 .052 .052 1.266 .206 .964 1.037
Q 8. Mostly Up to Me -.090 .041 -.113 -
2.205 .028 .617 1.621
Q 14. Other Countries are More
Interesting -.020 .043 -.021 -.454 .650 .776 1.288
Q 15. Authentic by a Seal of
Authority -.054 .057 -.039 -.947 .344 .927 1.079
Q 16. Importent to Know Who Made
It .054 .054 .042 .990 .323 .909 1.100
a. Dependent Variable: (Summated score of Q1-3) ACTION

Page | 60
Appendix V: Independent Samples T-Test (Independent Samples Test)
Independent Samples Test
Levene's Test
for Equality of
Variances
t-test for Equality of Means
F Sig. t df Sig. (2-
tailed)
Mean
Differen
ce
Std.
Error
Differen
ce
95% Confidence
Interval of the
Difference
Lower Upper
Q 1. Not Inted to Purches
Equal variances
assumed .372 .542 -.425 318 .671 -.066 .154 -.369 .238
Equal variances
not assumed
-.426
316.98
0 .671 -.066 .154 -.368 .237
Q 2. Buy with Out
Thinking
Equal variances
assumed 2.895 .090 -1.295 318 .196 -.200 .154 -.504 .104
Equal variances
not assumed
-1.300
317.98
2 .195 -.200 .154 -.503 .103
Q 3. Buy Spontaneously
Equal variances
assumed 1.362 .244 -1.849 318 .065 -.295 .160 -.609 .019
Equal variances
not assumed
-1.845
312.04
9 .066 -.295 .160 -.610 .020
(Summated score of Q1-3)
ACTION
Equal variances
assumed .609 .436 -1.433 318 .153 -.18718 .13060 -.44412 .06976
Equal variances
not assumed
-1.432
314.25
5 .153 -.18718 .13072 -.44437 .07001

Page | 61
Q 4. Other People Like
Equal variances
assumed .420 .518 -.103 318 .918 -.016 .155 -.320 .288
Equal variances
not assumed
-.102
311.37
8 .919 -.016 .155 -.321 .289
Q 5. Friends and Families
Opinion
Equal variances
assumed 2.800 .095 .510 318 .610 .080 .156 -.227 .386
Equal variances
not assumed
.509
311.37
9 .611 .080 .156 -.228 .387
Q 6. Friend & Family
Approve
Equal variances
assumed .777 .379 -.875 317 .382 -.140 .160 -.454 .175
Equal variances
not assumed
-.873
312.42
7 .383 -.140 .160 -.455 .175
Q 7. Observe Other
Equal variances
assumed 3.519 .062 .463 318 .644 .072 .157 -.236 .380
Equal variances
not assumed
.462
310.91
2 .645 .072 .157 -.236 .381
(Summated score of Q4-7)
OPINIONS
Equal variances
assumed 3.891 .049 .032 318 .975 .00397 .12549 -.24292 .25086
Equal variances
not assumed
.032
307.18
7 .975 .00397 .12604 -.24404 .25199
Q 8. Mostly Up to Me
Equal variances
assumed .871 .351 1.707 318 .089 .278 .163 -.042 .598
Equal variances
not assumed
1.703
311.86
8 .090 .278 .163 -.043 .599
Q 9. Look Genuine Equal variances
assumed 5.258 .022 1.113 318 .267 .149 .134 -.114 .412

Page | 62
Equal variances
not assumed
1.106
302.29
2 .270 .149 .135 -.116 .414
Q 10. Artistic Value Only
Equal variances
assumed .573 .450 .010 318 .992 .001 .145 -.283 .286
Equal variances
not assumed
.010
312.78
8 .992 .001 .145 -.284 .287
Q 11. Show My Status
Equal variances
assumed .018 .893 -2.335 318 .020 -.240 .103 -.443 -.038
Equal variances
not assumed
-2.335
315.56
4 .020 -.240 .103 -.443 -.038
Q 12. Know the Functional
Value
Equal variances
assumed 1.277 .259 .502 318 .616 .077 .153 -.224 .377
Equal variances
not assumed
.501
311.95
3 .617 .077 .153 -.224 .377
(Summated score of Q9,10,
12) APPEARANCE
Equal variances
assumed 4.104 .044 .664 318 .507 .07573 .11412 -.14879 .30025
Equal variances
not assumed
.660
305.39
2 .510 .07573 .11470 -.14997 .30143
Q 13. Prefer Luxury Item at
Home
Equal variances
assumed .424 .515 -1.428 318 .154 -.151 .105 -.358 .057
Equal variances
not assumed
-1.429
316.39
3 .154 -.151 .105 -.358 .057
(Summated score of Q11,
13) STATUS
Equal variances
assumed .082 .775 -2.116 318 .035 -.19551 .09241 -.37733 -.01369
Equal variances
not assumed
-2.117
316.48
1 .035 -.19551 .09234 -.37718 -.01384

Page | 63
Q 14. Other Countries are
More Interesting
Equal variances
assumed 4.354 .038 .856 318 .393 .117 .137 -.153 .387
Equal variances
not assumed
.851
305.04
8 .395 .117 .138 -.154 .389
Q 15. Authentic by a Seal
of Authority
Equal variances
assumed .034 .854 -.182 318 .856 -.017 .096 -.206 .171
Equal variances
not assumed
-.182
315.56
7 .856 -.017 .096 -.206 .171
Q 16. Importent to Know
Who Made It
Equal variances
assumed .905 .342 -1.823 318 .069 -.184 .101 -.383 .015
Equal variances
not assumed
-1.817
309.64
9 .070 -.184 .101 -.383 .015

Page | 64
Appendix VI: Eta Squared calculation
t2
Eta squared =
t2 + (N1 + N2 – 2)
(-2.116)2
Eta squared =
(-2.116)2+ (153 + 167 – 2)
Eta squared = 0.014

Page | 65
Appendix VII: ANOVA (ANOVA)
ANOVA
Sum of
Squares
df Mean Square F Sig.
Q 1. Not Inted to Purches
Between
Groups 12.245 2 6.123 3.283 .039
Within Groups 591.242 317 1.865
Total 603.488 319
Q 2. Buy with Out
Thinking
Between
Groups 27.109 2 13.554 7.384 .001
Within Groups 581.863 317 1.836
Total 608.972 319
Q 3. Buy Spontaneously
Between
Groups 17.842 2 8.921 4.446 .012
Within Groups 636.045 317 2.006
Total 653.888 319
(Summated score of Q1-3)
ACTION
Between
Groups 18.534 2 9.267 7.039 .001
Within Groups 417.314 317 1.316
Total 435.848 319
Q 4. Other People Like
Between
Groups 20.794 2 10.397 5.621 .004
Within Groups 586.378 317 1.850
Total 607.172 319

Page | 66
Q 5. Friends and Families
Opinion
Between
Groups 19.438 2 9.719 5.154 .006
Within Groups 597.762 317 1.886
Total 617.200 319
Q 6. Friend & Family
Approve
Between
Groups 33.652 2 16.826 8.670 .000
Within Groups 613.276 316 1.941
Total 646.928 318
Q 7. Observe Other
Between
Groups 31.755 2 15.878 8.521 .000
Within Groups 590.717 317 1.863
Total 622.472 319
(Summated score of Q4-7)
OPINIONS
Between
Groups 24.445 2 12.222 10.321 .000
Within Groups 375.398 317 1.184
Total 399.843 319
Q 8. Mostly Up to Me
Between
Groups 41.315 2 20.657 10.257 .000
Within Groups 638.432 317 2.014
Total 679.747 319
Q 9. Look Genuine
Between
Groups 9.522 2 4.761 3.381 .035
Within Groups 446.350 317 1.408
Total 455.872 319
Q 10. Artistic Value Only
Between
Groups 33.759 2 16.880 10.749 .000
Within Groups 497.791 317 1.570

Page | 67
Total 531.550 319
Q 11. Show My Status
Between
Groups 77.827 2 38.913 62.962 .000
Within Groups 195.920 317 .618
Total 273.747 319
Q 12. Know the
Functional Value
Between
Groups 2.227 2 1.114 .599 .550
Within Groups 589.323 317 1.859
Total 591.550 319
(Summated score of
Q9,10, 12)
APPEARANCE
Between
Groups 11.565 2 5.783 5.736 .004
Within Groups 319.546 317 1.008
Total 331.111 319
Q 13. Prefer Luxury Item
at Home
Between
Groups 73.633 2 36.816 55.426 .000
Within Groups 210.567 317 .664
Total 284.200 319
(Summated score of Q11,
13) STATUS
Between
Groups 75.655 2 37.828 83.132 .000
Within Groups 144.244 317 .455
Total 219.899 319
Q 14. Other Countries are
More Interesting
Between
Groups 16.096 2 8.048 5.511 .004
Within Groups 462.904 317 1.460
Total 479.000 319
Q 15. Authentic by a Seal
of Authority
Between
Groups 2.775 2 1.388 1.911 .150

Page | 68
Within Groups 230.212 317 .726
Total 232.987 319
Q 16. Importent to Know
Who Made It
Between
Groups .486 2 .243 .295 .745
Within Groups 260.902 317 .823
Total 261.388 319

Page | 69
Appendix VIII: ANOVA (Multiple Comparisons)
Multiple Comparisons
Hochberg
Dependent
Variable
(I) Q 20.
Income
(J) Q 20.
Income
Mean
Difference
(I-J)
Std.
Error
Sig. 95% Confidence Interval
Lower
Bound
Upper
Bound
Q 1. Not
Inted to
Purches
High Income
Middle
Income -.682
* .268 .034 -1.33 -.04
Low Income -.582 .260 .076 -1.21 .04
Middle
Income
High
Income .682
* .268 .034 .04 1.33
Low Income .100 .163 .902 -.29 .49
Low Income
High
Income .582 .260 .076 -.04 1.21
Middle
Income -.100 .163 .902 -.49 .29
Q 2. Buy
with Out
Thinking
High Income
Middle
Income -.995
* .266 .001 -1.63 -.36
Low Income -.915* .258 .001 -1.54 -.30
Middle
Income
High
Income .995
* .266 .001 .36 1.63
Low Income .080 .162 .946 -.31 .47
Low Income High
Income .915
* .258 .001 .30 1.54

Page | 70
Middle
Income -.080 .162 .946 -.47 .31
Q 3. Buy
Spontaneo
usly
High Income
Middle
Income -.823
* .278 .010 -1.49 -.16
Low Income -.703* .270 .029 -1.35 -.05
Middle
Income
High
Income .823
* .278 .010 .16 1.49
Low Income .120 .169 .857 -.29 .53
Low Income
High
Income .703
* .270 .029 .05 1.35
Middle
Income -.120 .169 .857 -.53 .29
(Summated
score of
Q1-3)
ACTION
High Income
Middle
Income -.83376
* .22513 .001 -1.3741 -.2935
Low Income -.73358* .21879 .003 -1.2587 -.2085
Middle
Income
High
Income .83376
* .22513 .001 .2935 1.3741
Low Income .10019 .13700 .846 -.2286 .4290
Low Income
High
Income .73358
* .21879 .003 .2085 1.2587
Middle
Income -.10019 .13700 .846 -.4290 .2286
Q 4. Other
People
Like
High Income
Middle
Income -.881
* .267 .003 -1.52 -.24
Low Income -.782* .259 .008 -1.40 -.16
Middle
Income
High
Income .881
* .267 .003 .24 1.52

Page | 71
Low Income .099 .162 .903 -.29 .49
Low Income
High
Income .782
* .259 .008 .16 1.40
Middle
Income -.099 .162 .903 -.49 .29
Q 5.
Friends and
Families
Opinion
High Income
Middle
Income -.749
* .269 .017 -1.40 -.10
Low Income -.836* .262 .005 -1.46 -.21
Middle
Income
High
Income .749
* .269 .017 .10 1.40
Low Income -.088 .164 .932 -.48 .31
Low Income
High
Income .836
* .262 .005 .21 1.46
Middle
Income .088 .164 .932 -.31 .48
Q 6. Friend
& Family
Approve
High Income
Middle
Income -1.138
* .274 .000 -1.79 -.48
Low Income -.861* .266 .004 -1.50 -.22
Middle
Income
High
Income 1.138
* .274 .000 .48 1.79
Low Income .277 .167 .264 -.12 .68
Low Income
High
Income .861
* .266 .004 .22 1.50
Middle
Income -.277 .167 .264 -.68 .12
Q 7.
Observe High Income
Middle
Income -1.105
* .268 .000 -1.75 -.46

Page | 72
Other Low Income -.848* .260 .004 -1.47 -.22
Middle
Income
High
Income 1.105
* .268 .000 .46 1.75
Low Income .257 .163 .310 -.13 .65
Low Income
High
Income .848
* .260 .004 .22 1.47
Middle
Income -.257 .163 .310 -.65 .13
(Summated
score of
Q4-7)
OPINIONS
High Income
Middle
Income -.96107
* .21352 .000 -1.4735 -.4486
Low Income -.83182* .20752 .000 -1.3299 -.3338
Middle
Income
High
Income .96107
* .21352 .000 .4486 1.4735
Low Income .12925 .12994 .686 -.1826 .4411
Low Income
High
Income .83182
* .20752 .000 .3338 1.3299
Middle
Income -.12925 .12994 .686 -.4411 .1826
Q 8.
Mostly Up
to Me
High Income
Middle
Income 1.261
* .278 .000 .59 1.93
Low Income .982* .271 .001 .33 1.63
Middle
Income
High
Income -1.261
* .278 .000 -1.93 -.59
Low Income -.279 .169 .271 -.69 .13
Low Income High
Income -.982
* .271 .001 -1.63 -.33

Page | 73
Middle
Income .279 .169 .271 -.13 .69
Q 9. Look
Genuine
High Income
Middle
Income -.602
* .233 .030 -1.16 -.04
Low Income -.509 .226 .073 -1.05 .03
Middle
Income
High
Income .602
* .233 .030 .04 1.16
Low Income .093 .142 .883 -.25 .43
Low Income
High
Income .509 .226 .073 -.03 1.05
Middle
Income -.093 .142 .883 -.43 .25
Q 10.
Artistic
Value Only
High Income
Middle
Income -1.078
* .246 .000 -1.67 -.49
Low Income -.636* .239 .024 -1.21 -.06
Middle
Income
High
Income 1.078
* .246 .000 .49 1.67
Low Income .441* .150 .010 .08 .80
Low Income
High
Income .636
* .239 .024 .06 1.21
Middle
Income -.441
* .150 .010 -.80 -.08
Q 11.
Show My
Status
High Income
Middle
Income -.943
* .154 .000 -1.31 -.57
Low Income -1.570* .150 .000 -1.93 -1.21
Middle
Income
High
Income .943
* .154 .000 .57 1.31

Page | 74
Low Income -.627* .094 .000 -.85 -.40
Low Income
High
Income 1.570
* .150 .000 1.21 1.93
Middle
Income .627
* .094 .000 .40 .85
Q 12.
Know the
Functional
Value
High Income
Middle
Income -.292 .268 .619 -.93 .35
Low Income -.218 .260 .786 -.84 .41
Middle
Income
High
Income .292 .268 .619 -.35 .93
Low Income .074 .163 .957 -.32 .46
Low Income
High
Income .218 .260 .786 -.41 .84
Middle
Income -.074 .163 .957 -.46 .32
(Summated
score of
Q9,10, 12)
APPEARA
NCE
High Income
Middle
Income -.65809
* .19700 .003 -1.1309 -.1853
Low Income -.45509 .19146 .053 -.9146 .0044
Middle
Income
High
Income .65809
* .19700 .003 .1853 1.1309
Low Income .20300 .11988 .249 -.0847 .4907
Low Income
High
Income .45509 .19146 .053 -.0044 .9146
Middle
Income -.20300 .11988 .249 -.4907 .0847
Q 13.
Prefer High Income
Middle
Income -.995
* .160 .000 -1.38 -.61

Page | 75
Luxury
Item at
Home
Low Income -1.558* .155 .000 -1.93 -1.18
Middle
Income
High
Income .995
* .160 .000 .61 1.38
Low Income -.562* .097 .000 -.80 -.33
Low Income
High
Income 1.558
* .155 .000 1.18 1.93
Middle
Income .562
* .097 .000 .33 .80
(Summated
score of
Q11, 13)
STATUS
High Income
Middle
Income -.96908
* .13236 .000 -1.2867 -.6514
Low Income -1.56364* .12863 .000 -1.8724 -1.2549
Middle
Income
High
Income .96908
* .13236 .000 .6514 1.2867
Low Income -.59456* .08054 .000 -.7879 -.4013
Low Income
High
Income 1.56364
* .12863 .000 1.2549 1.8724
Middle
Income .59456
* .08054 .000 .4013 .7879
Q 14.
Other
Countries
are More
Interesting
High Income
Middle
Income -.768
* .237 .004 -1.34 -.20
Low Income -.703* .230 .007 -1.26 -.15
Middle
Income
High
Income .768
* .237 .004 .20 1.34
Low Income .065 .144 .958 -.28 .41
Low Income High
Income .703
* .230 .007 .15 1.26

Page | 76
Middle
Income -.065 .144 .958 -.41 .28
Q 15.
Authentic
by a Seal
of
Authority
High Income
Middle
Income .285 .167 .244 -.12 .69
Low Income .133 .163 .797 -.26 .52
Middle
Income
High
Income -.285 .167 .244 -.69 .12
Low Income -.152 .102 .356 -.40 .09
Low Income
High
Income -.133 .163 .797 -.52 .26
Middle
Income .152 .102 .356 -.09 .40
Q 16.
Importent
to Know
Who Made
It
High Income
Middle
Income .009 .178 1.000 -.42 .44
Low Income .085 .173 .947 -.33 .50
Middle
Income
High
Income -.009 .178 1.000 -.44 .42
Low Income .076 .108 .862 -.18 .34
Low Income
High
Income -.085 .173 .947 -.50 .33
Middle
Income -.076 .108 .862 -.34 .18
*. The mean difference is significant at the 0.05 level.

Page | 77
Appendix IX: Questionnaire
Questionnaire
Dear-Participant,
We are the student of Umeå University. We are using this survey to collect data for our Master‟s thesis on the purchase intention and factors
affecting Swedish customer towards the Handicrafts product. Your responses are very important for our thesis. It will take few minutes to
answer the questions. We request you to take your time and answer the questions so that your answer reflects what you really think about
these issues. Your answers will be handled confidentially and the data will only be used for academic research.
Please let us know your opinion about those statements by putting a ( × ) mark.
(1 = Strongly Agree, 3 = Neutral and 5 = Strongly Disagree)
Section A: Attitude and intention towards buying handicraft
1. When I go shopping, I sometimes buy handicrafts that I had not intended to purchase
Strongly Agree 1☐ 2☐ 3☐ 4☐ 5☐ Strongly Disagree
2. When I see any handicraft that really interests me, I usually buy it without thinking the consequences
Strongly Agree 1☐ 2☐ 3☐ 4☐ 5☐ Strongly Disagree
3. I sometimes like to buy handicrafts spontaneously
Strongly Agree 1☐ 2☐ 3☐ 4☐ 5☐ Strongly Disagree
4. It is important that other people like the handicraft I buy
Strongly Agree 1☐ 2☐ 3☐ 4☐ 5☐ Strongly Disagree
5. My Friends and Family whose opinions are important when I purchase handicrafts
Strongly Agree 1☐ 2☐ 3☐ 4☐ 5☐ Strongly Disagree
6. I rarely purchase any handicrafts until my Friend and Family approve to them

Page | 78
Strongly Agree 1☐ 2☐ 3☐ 4☐ 5☐ Strongly Disagree
7. To make sure I buy the genuine handicraft, I always observe what others are buying
Strongly Agree 1☐ 2☐ 3☐ 4☐ 5☐ Strongly Disagree
8. It‟s mostly up to me whether or not I purchase Handicrafts product
Strongly Agree 1☐ 2☐ 3☐ 4☐ 5☐ Strongly Disagree
Section B: Influential factors towards buying handicraft 9. I buy handicrafts because I think handicrafts look more genuine than those produced in factories
Strongly Agree 1☐ 2☐ 3☐ 4☐ 5☐ Strongly Disagree
10. I buy handicrafts because of its artistic value only
Strongly Agree 1☐ 2☐ 3☐ 4☐ 5☐ Strongly Disagree
11. Although it is more expensive I buy handicrafts to show my status to others
Strongly Agree 1☐ 2☐ 3☐ 4☐ 5☐ Strongly Disagree
12. I buy handicrafts because I know what I get from it as functional value
Strongly Agree 1☐ 2☐ 3☐ 4☐ 5☐ Strongly Disagree
13. I buy handicrafts because I prefer to have luxury item at home
Strongly Agree 1☐ 2☐ 3☐ 4☐ 5☐ Strongly Disagree
14. I find handicrafts product from other countries are more interesting than those from Sweden
Strongly Agree 1☐ 2☐ 3☐ 4☐ 5☐ Strongly Disagree
15. For me it is important to know that this product is authentic through a seal of approval of an independent authority
Strongly Agree 1☐ 2☐ 3☐ 4☐ 5☐ Strongly Disagree

Page | 79
16. For me it is important to get the information about the artisans who made that
Strongly Agree 1☐ 2☐ 3☐ 4☐ 5☐ Strongly Disagree
Section- C: Classification Question
Your gender: ☐ Male ☐ Female
Your Age (In Years): ☐ 18-27 ☐ 28-37 ☐ 38-47 ☐ 48-57 ☐ 58+
Your Occupation: ☐ Student ☐ Employee ☐ Pensioner ☐ Unemployed
Your Income Group:
☐ High Income Group ☐ Middle Income Group ☐ Low Income Group
Thank you for your participation!

Page | 80
Umeå School of Business Umeå University
SE-901 87 Umeå, Sweden
www.usbe.umu.se