Embed Size (px)
Citation preview

Half-yearly Financial Report at 30 June
from 1850
2018
FSI Investimenti S.p.A.
Ligestra Due S.r.l.
AnsaldoEnergia S.p.A.
Trevi FinanziariaIndustriale S.p.A.
Rocco ForteHotels Ltd
ValvitaliaFinanziaria S.p.A.
FSI SGR S.p.A.
Kedrion S.p.A.
IQ Made in ItalyInvestment Company S.p.A.
FSIA Investimenti S.r.l.
SIA S.p.A.Inalca S.p.A.
Open Fiber S.p.A.
B.F. S.p.A.
QuattroR SGR S.p.A.
RisparmioHolding S.p.A.
SACE BT S.p.A.
SACE FCT S.p.A.
SACE do Brasil
SACE Srv S.r.l.
African TradeInsurance Company
ENI S.p.A.
CDP EquityS.p.A.
FintecnaS.p.A.
Poste Italiane S.p.A.
Telecom Italia S.p.A.
SIMEST S.p.A.
Saipem S.p.A.
SACE S.p.A.CDP
ImmobiliareS.r.l.
Fondo Italianod’Investimento
SGR S.p.A.
Terna S.p.A.
SNAM S.p.A.
Italgas S.p.A.
CDP RETIS.p.A.
European Investment Fund
FoF Private Debt
FoF Venture Capital
Fondo Italiano d’Investimento Fondo di Fondi
Fondo Italiano d’Investimento FII Venture
Italian Recovery Fund
Fondo Atlante
Fondo QuattroR
FSI Mid Market Growth Equity Fund
Fondo Innovazione e Sviluppo
Fondo FII Tech Growth
F2i - Fondi Italiani per le Infrastrutture SGR S.p.A.
F2i - Terzo Fondo per le Infrastrutture
XXI Aprile S.r.l.
Fincantieri S.p.A.
Fondo Investimenti per la Valorizzazione Extra
Fondo Investimenti per la Valorizzazione Plus
Fondo Investimenti per l’Abitare (FIA)
Fondo Investimenti per il Turismo (FIT)
Fondo FIA 2
Fondo Federal District
Inframed Infrastructure S.A.S. à capital variable (Fondo Inframed)
Connecting Europe Broadband Fund SICAV RAIF
Bonafous S.p.A. (i.l.)
Cinque Cerchi S.p.A. (i.l.)
M.T. ManifatturaTabacchi S.p.A.
ManifattureMilano S.p.A.
PentagrammaPerugia S.p.A.
PentagrammaPiemonte S.p.A.
ResidenzialeImmobiliare 2004 S.p.A.
Alfiere S.p.A.
F2i - Secondo Fondo Italiano per le Infrastrutture
2020 European Fund for Energy, Climate Change and Infrastructure SICAV-FIS S.A. (Fondo Marguerite)
Hotelturist S.p.A.
Marguerite II SCSp (Fondo Marguerite II)
Oltre II SICAF EuVECA S.p.A. (***)
HI CrescItalia PMI
Elite S.p.A.
i.l.: in liquidazione
Istituto per il Credito Sportivo
Fondo PPP Italia
CDPInvestimentiSGR S.p.A.
Istituto della Enciclopedia Italiana fondata da Giovanni Treccani S.p.A.
Fondo SviluppoExport
Vertis Venture 3 Technology Transfer (**)
Europrogetti &Finanza S.r.l. (i.l.)
INVESTMENT VEHICLES
ENTERPRISES
INTERNATIONAL EXPANSION
INFRASTRUCTURE
REAL ESTATE
Business sectors
INVESTMENT FUNDS
FUNDS MANAGEMENT RELATIONSHIP
CONTROL
DE FACTO CONTROL
SIGNIFICANT INFLUENCE
Type of control/influence
JOINT CONTROL
25.76% 100%
20.00%
100%
OTHER EQUITY INVESTMENTS
43.00%
35.00%
4.933%
40.00%
39.00%
31.8%
62.5%
76.69%
20.83%
20.83%
100%
12.9%
1.11%
75.47%
11.77%
Fincantierigroup
71.64%
100%
Consortiumsand other
59.94%
16.86%
23.00%
0.50%(*)
28.40%
25.06%
50% 70%
49.48%
50.00%
12.55%
77.12%
2.87%
97.13%
19.98%
76.01%
100%
100%
100%
100%
4.43%
100%
Consortiumsand other
100%
50%
100%
100%
90.91%
50%
50%
50%
74.47%
100%
70%
3.83%
Fondo Immobiliare di Lombardia - Comparto Uno (formerly Abitare Sociale 1)
100%
100%
49.31%
100%
100%
100%
Ternagroup
Italgasgroup
SNAMgroup
29.85%
30.37%
26.04%
13.50%
59.10%
A shares 8.05%
14.01%
C shares 0.02%
4.36%
11.90%
2.21%
14.58%
14.08%
A shares 10.54%B shares 1.66%
A shares 38.92%B shares 0.0012%
European Energy Efficiency Fund S.A., SICAV-SIF (EEEF Fund)
45.95%
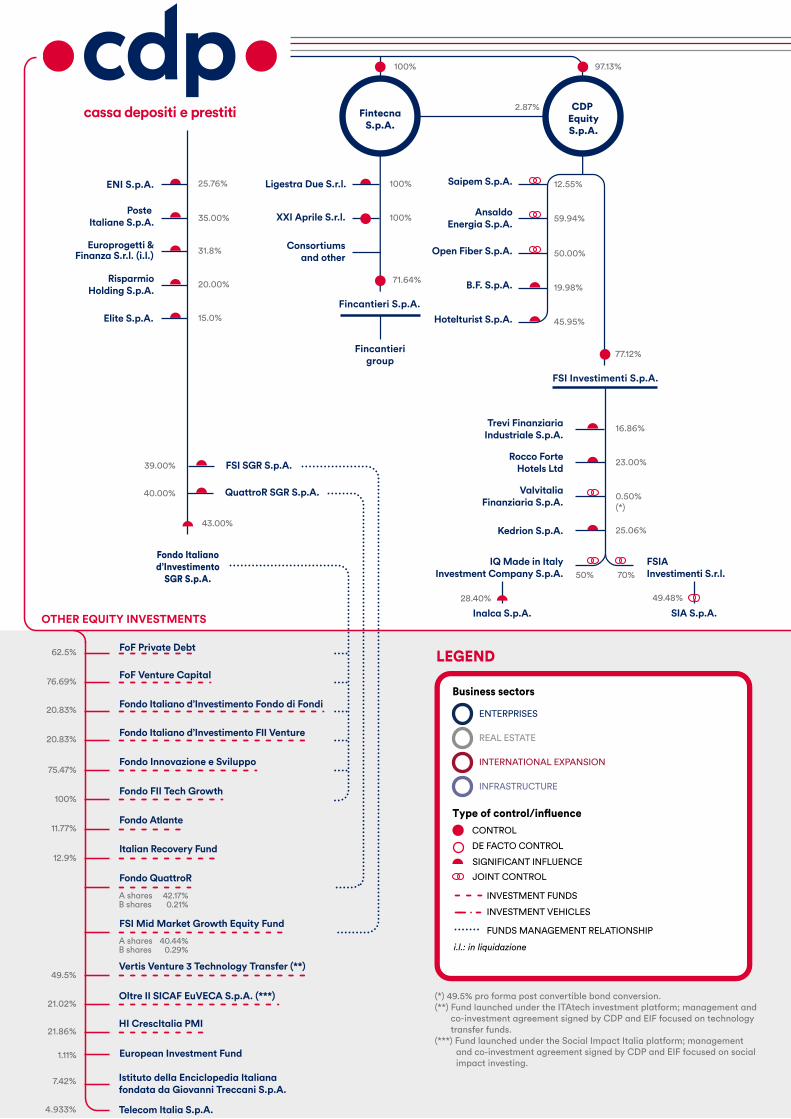
Group structureat 30 June 2018
(*) 49.5% pro forma post convertible bond conversion.(**) Fund launched under the ITAtech investment platform; management and
co-investment agreement signed by CDP and EIF focused on technology transfer funds.
(***) Fund launched under the Social Impact Italia platform; management and co-investment agreement signed by CDP and EIF focused on social impact investing.
15.0%
13.42%
LEGEND
21.02%
21.86%
7.42%
100%
0.21%42.17%
B sharesA shares
0.29%40.44%
B sharesA shares
49.5%
PentagrammaRomagna S.p.A. (i.l. single shareholder)

FSI Investimenti S.p.A.
Ligestra Due S.r.l.
AnsaldoEnergia S.p.A.
Trevi FinanziariaIndustriale S.p.A.
Rocco ForteHotels Ltd
ValvitaliaFinanziaria S.p.A.
FSI SGR S.p.A.
Kedrion S.p.A.
IQ Made in ItalyInvestment Company S.p.A.
FSIA Investimenti S.r.l.
SIA S.p.A.Inalca S.p.A.
Open Fiber S.p.A.
B.F. S.p.A.
QuattroR SGR S.p.A.
RisparmioHolding S.p.A.
SACE BT S.p.A.
SACE FCT S.p.A.
SACE do Brasil
SACE Srv S.r.l.
African TradeInsurance Company
ENI S.p.A.
CDP EquityS.p.A.
FintecnaS.p.A.
Poste Italiane S.p.A.
Telecom Italia S.p.A.
SIMEST S.p.A.
Saipem S.p.A.
SACE S.p.A.CDP
ImmobiliareS.r.l.
Fondo Italianod’Investimento
SGR S.p.A.
Terna S.p.A.
SNAM S.p.A.
Italgas S.p.A.
CDP RETIS.p.A.
European Investment Fund
FoF Private Debt
FoF Venture Capital
Fondo Italiano d’Investimento Fondo di Fondi
Fondo Italiano d’Investimento FII Venture
Italian Recovery Fund
Fondo Atlante
Fondo QuattroR
FSI Mid Market Growth Equity Fund
Fondo Innovazione e Sviluppo
Fondo FII Tech Growth
F2i - Fondi Italiani per le Infrastrutture SGR S.p.A.
F2i - Terzo Fondo per le Infrastrutture
XXI Aprile S.r.l.
Fincantieri S.p.A.
Fondo Investimenti per la Valorizzazione Extra
Fondo Investimenti per la Valorizzazione Plus
Fondo Investimenti per l’Abitare (FIA)
Fondo Investimenti per il Turismo (FIT)
Fondo FIA 2
Fondo Federal District
Inframed Infrastructure S.A.S. à capital variable (Fondo Inframed)
Connecting Europe Broadband Fund SICAV RAIF
Bonafous S.p.A. (i.l.)
Cinque Cerchi S.p.A. (i.l.)
M.T. ManifatturaTabacchi S.p.A.
ManifattureMilano S.p.A.
PentagrammaPerugia S.p.A.
PentagrammaPiemonte S.p.A.
ResidenzialeImmobiliare 2004 S.p.A.
Alfiere S.p.A.
F2i - Secondo Fondo Italiano per le Infrastrutture
2020 European Fund for Energy, Climate Change and Infrastructure SICAV-FIS S.A. (Fondo Marguerite)
Hotelturist S.p.A.
Marguerite II SCSp (Fondo Marguerite II)
Oltre II SICAF EuVECA S.p.A. (***)
HI CrescItalia PMI
Elite S.p.A.
i.l.: in liquidazione
Istituto per il Credito Sportivo
Fondo PPP Italia
CDPInvestimentiSGR S.p.A.
Istituto della Enciclopedia Italiana fondata da Giovanni Treccani S.p.A.
Fondo SviluppoExport
Vertis Venture 3 Technology Transfer (**)
Europrogetti &Finanza S.r.l. (i.l.)
INVESTMENT VEHICLES
ENTERPRISES
INTERNATIONAL EXPANSION
INFRASTRUCTURE
REAL ESTATE
Business sectors
INVESTMENT FUNDS
FUNDS MANAGEMENT RELATIONSHIP
CONTROL
DE FACTO CONTROL
SIGNIFICANT INFLUENCE
Type of control/influence
JOINT CONTROL
25.76% 100%
20.00%
100%
OTHER EQUITY INVESTMENTS
43.00%
35.00%
4.933%
40.00%
39.00%
31.8%
62.5%
76.69%
20.83%
20.83%
100%
12.9%
1.11%
75.47%
11.77%
Fincantierigroup
71.64%
100%
Consortiumsand other
59.94%
16.86%
23.00%
0.50%(*)
28.40%
25.06%
50% 70%
49.48%
50.00%
12.55%
77.12%
2.87%
97.13%
19.98%
76.01%
100%
100%
100%
100%
4.43%
100%
Consortiumsand other
100%
50%
100%
100%
90.91%
50%
50%
50%
74.47%
100%
70%
3.83%
Fondo Immobiliare di Lombardia - Comparto Uno (formerly Abitare Sociale 1)
100%
100%
49.31%
100%
100%
100%
Ternagroup
Italgasgroup
SNAMgroup
29.85%
30.37%
26.04%
13.50%
59.10%
A shares 8.05%
14.01%
C shares 0.02%
4.36%
11.90%
2.21%
14.58%
14.08%
A shares 10.54%B shares 1.66%
A shares 38.92%B shares 0.0012%
European Energy Efficiency Fund S.A., SICAV-SIF (EEEF Fund)
45.95%
Group structureat 30 June 2018
(*) 49.5% pro forma post convertible bond conversion.(**) Fund launched under the ITAtech investment platform; management and
co-investment agreement signed by CDP and EIF focused on technology transfer funds.
(***) Fund launched under the Social Impact Italia platform; management and co-investment agreement signed by CDP and EIF focused on social impact investing.
15.0%
13.42%
LEGEND
21.02%
21.86%
7.42%
100%
0.21%42.17%
B sharesA shares
0.29%40.44%
B sharesA shares
49.5%
PentagrammaRomagna S.p.A. (i.l. single shareholder)

Company bodies
Board of Directors ChairmanVice ChairmanCEO Directors
Massimo TononiLuigi PaganettoFabrizio PalermoFrancesco Floro Flores Valentino GrantFabrizia LapecorellaFabiana Massa FelsaniMatteo MelleyAlessandra Ruzzu
Supplementary Membersfor Administration of Separate Account(Article 5.8, Decree Law 269/2003, ratified with amendments by Law 326/03)
Deputy Director General of the Treasury (1)
State Accountant General (2)
Antonio DecaroDavide Carlo Caparini
Board of Directors (3) ChairmanAuditors
Alternate Auditors
Carlo CorradiniInes RussoLuciano Barsotti Giusella FinocchiaroAlessandra dal VermeGiandomenico GentaAngela Salvini
Manager in charge with preparing the Company’s financial reports
Fabrizio Palermo
Parliamentary Supervisory Committee (4) ChairmanMembers
(Senator) Anna Cinzia Bonfrisco(Senator) Bruno AstorreStefano Fantini (Council of State)Pancrazio Savasta (Council of State)
Judge of the State Audit Court (5)
(Art. 5, para. 17, D.L. 269/2003)
OrdinaryAlternate
Angelo BuscemaGiovanni Comite
Independent Auditors PricewaterhouseCoopers S.p.A.
(1) Giuseppe Maresca.(2) Roberto Ferranti, delegate of the State Accountant General.(3) On 25 January 2017, the Board of Directors assigned to the Board of Statutory Auditors the duties of the Supervisory Body (pursuant to Legislative Decree 231
of 8 June 2001) starting from 27 February 2017. (4) The Parliamentary Supervisory Commission for oversight of the Separate Account of Cassa depositi e prestiti in the 18th Parliamentary Term has yet to be
established. The Commission appointed for the 18th Parliamentary Term will remain in office for the reference period, pursuant to the combined provisions of art. 14 of Legislative Decree No. 1058 of 23 March 1919 and art. 3 of Royal Decree No. 453 of 2 January 1913.
(5) Article 5, paragraph 17, of Decree Law 269/03 – attends meetings of the Board of Directors and the Board of Statutory Auditors.
COMPANY BODIES AT 27 JULY 2018
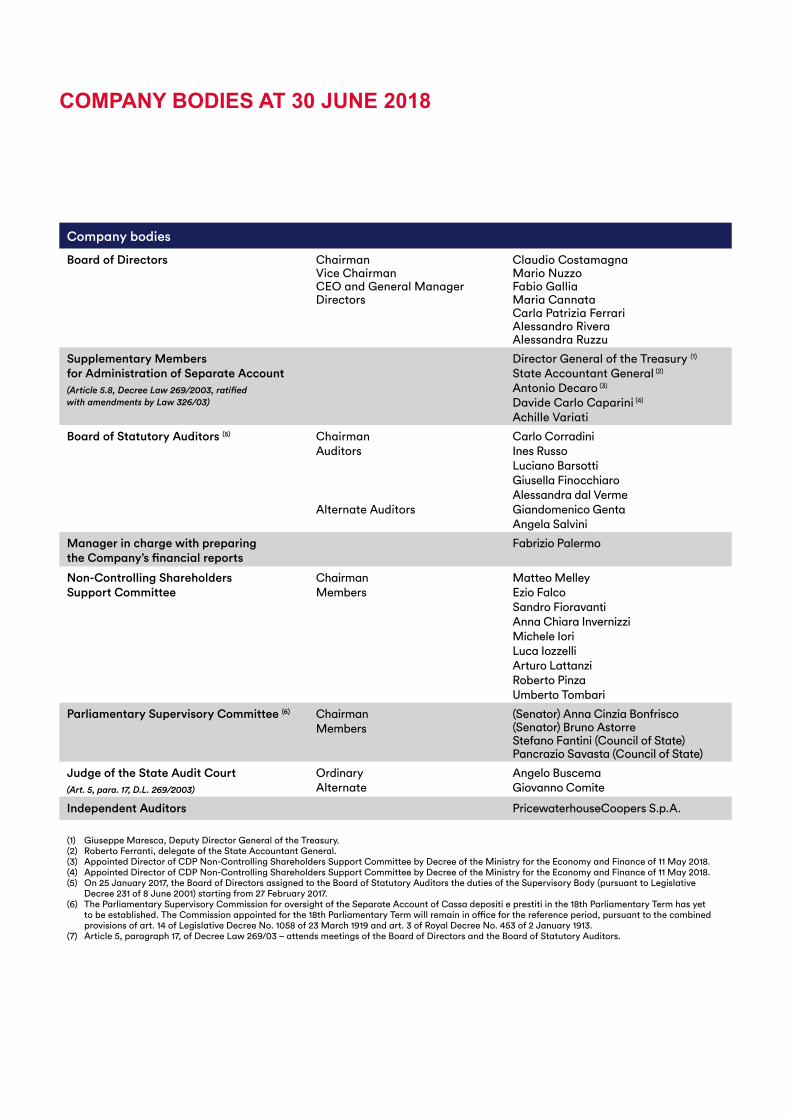
Company bodies
Board of Directors ChairmanVice ChairmanCEO and General ManagerDirectors
Claudio CostamagnaMario NuzzoFabio GalliaMaria CannataCarla Patrizia Ferrari Alessandro RiveraAlessandra Ruzzu
Supplementary Membersfor Administration of Separate Account(Article 5.8, Decree Law 269/2003, ratified with amendments by Law 326/03)
Director General of the Treasury (1)
State Accountant General (2)
Antonio Decaro (3)
Davide Carlo Caparini (4)
Achille Variati
Board of Statutory Auditors (5) ChairmanAuditors
Alternate Auditors
Carlo CorradiniInes RussoLuciano Barsotti Giusella FinocchiaroAlessandra dal VermeGiandomenico GentaAngela Salvini
Manager in charge with preparing the Company’s financial reports
Fabrizio Palermo
Non-Controlling Shareholders Support Committee
Chairman Members
Matteo Melley Ezio FalcoSandro FioravantiAnna Chiara InvernizziMichele IoriLuca IozzelliArturo LattanziRoberto PinzaUmberto Tombari
Parliamentary Supervisory Committee (6) ChairmanMembers
(Senator) Anna Cinzia Bonfrisco(Senator) Bruno AstorreStefano Fantini (Council of State)Pancrazio Savasta (Council of State)
Judge of the State Audit Court(Art. 5, para. 17, D.L. 269/2003)
OrdinaryAlternate
Angelo BuscemaGiovanno Comite
Independent Auditors PricewaterhouseCoopers S.p.A.
(1) Giuseppe Maresca, Deputy Director General of the Treasury.(2) Roberto Ferranti, delegate of the State Accountant General.(3) Appointed Director of CDP Non-Controlling Shareholders Support Committee by Decree of the Ministry for the Economy and Finance of 11 May 2018.(4) Appointed Director of CDP Non-Controlling Shareholders Support Committee by Decree of the Ministry for the Economy and Finance of 11 May 2018.(5) On 25 January 2017, the Board of Directors assigned to the Board of Statutory Auditors the duties of the Supervisory Body (pursuant to Legislative
Decree 231 of 8 June 2001) starting from 27 February 2017. (6) The Parliamentary Supervisory Commission for oversight of the Separate Account of Cassa depositi e prestiti in the 18th Parliamentary Term has yet
to be established. The Commission appointed for the 18th Parliamentary Term will remain in office for the reference period, pursuant to the combined provisions of art. 14 of Legislative Decree No. 1058 of 23 March 1919 and art. 3 of Royal Decree No. 453 of 2 January 1913.
(7) Article 5, paragraph 17, of Decree Law 269/03 – attends meetings of the Board of Directors and the Board of Statutory Auditors.
COMPANY BODIES AT 30 JUNE 2018

We promote Italy’s future by contributing to economic development and investing in competitiveness
(Translation from the Italian original which remains the definitive version)

SUMMARY
1. PRESENTATION OF THE CDP GROUP ................................................................................................2The CDP Group, role and mission .........................................................................................................4
2. HALF-YEARLY REPORT ON OPERATIONS .........................................................................................81. Composition of the CDP Group ...................................................................................................... 10
2. Financial aggregates and performance indicators ....................................................................... 17
3. Macroeconomic scenario and market context .............................................................................. 19
4. Performance of the CDP Group ...................................................................................................... 26
3. HALF-YEARLY CONDENSED CONSOLIDATED FINANCIAL STATEMENTS AT 30 JUNE 2018... 92Consolidated Financial statements at 30 June 2018 ........................................................................ 97
Notes to the consolidated financial statements .............................................................................. 105
Annexes ............................................................................................................................................... 214
Independent Auditors’ Report ........................................................................................................... 227
Certification of the half-yearly condensed consolidated financial statements pursuant to article 154 bis of legislative decree no. 58/1998 .............................................................................. 228

1.Presentation of CDP Group


THE CDP GROUP, ROLE AND MISSION
Presentation of the CDP Group
Created in 1850 as an institution purposed to receive deposits as a “place of public trust”, CDP has seen its role change
over the years. During the past decade, it has assumed a key role in the industrial policies of Italy.
From being an institution created to support public economy in Italy largely by financing public entities, CDP has
expanded its scope of action to the private sector, while always operating in a medium/long-term development
perspective. CDP can play numerous roles, from lender to anchor investor, constantly geared to increasingly innovative
and flexible instruments with a view to meeting investment requirements.
It uses tools ranging from loans for public investments, infrastructure, and support of business – always taking an anti-
cyclical approach and medium/long-term view – to investments in venture capital and Real Estate.
In 2012, after the Ministry of the Economy and Finance (MEF) acquired SACE, Simest, and Fintecna, the CDP Group
was created with renewed ambitions to support the international expansion of Italian enterprises, by operating in synergy
with the banking system and supporting international cooperation.
However, CDP has not forgotten its traditional public and social role towards public entities and local constituencies.
Among the several activities in support of the public sector, it develops its property assets by drawing on the resources
and expertise of CDP Immobiliare, invests in social housing with the Fondo Investimenti per l’Abitare (“FIA”), develops
the real estate assets owned by public entities through the FIV fund, and manages cash advances on the payments of
debts owed by the Public Administration (PA).
In 2015 the Italian Government and the European Union designated CDP as a National Promotional Institution, thereby
becoming:
the entry point for funding under the Juncker Plan for Italy;
financial advisor to the Public Administration for a more efficient and effective use of domestic and European funds.
The “Italian Centre for Export and International Expansion” of the Group was strengthened in 2016 through transfer by
CDP of the equity investment in Simest to Sace. That transaction confirms a major step forward in the implementation of
the CDP Group’s 2016-2020 Business Plan, with the creation of a system to support the growth and international
competitiveness of the Italian production system. The objective is to offer Italian businesses an integrated system in
support of export and international expansion.
The role of CDP has been expanded, by adding the characteristics of an active promoter of initiatives in support of
growth to its typical characteristics of a medium/long-term investor.
4 1. Presentation of the CDP Group

Historic Events
5The CDP Group, role and mission
1850
1857
1875
1898
1924
1983
2003
2005
2006
2007
2009
2010
2011
2012
2013
2014
2015
2016
2017
SpA
S E C T O R S
Public Entities& Local Bodies
Infrastructure Enterprises Strategicassets
Loans to Local Authorities
Fondo Investimento per l’Abitare
(FIA)
European Energy
E�ciency Fund (EEEF)
FondoInvestimenti
Valorizzazione (FIV)
Advances on General
Government trade payables
Fondo Investimenti per il Turismo (FIT)
Suburban areas Redevelopment
Loan
Juncker Large Infrastructure
Platform
Ordinary Account
Fondo F2i
Marguerite Fund
Inframed Infrastructure
Fund
Terna acquisition
Fondo Rotativo Imprese (FRI)
Plafond PMIExport Banca
Agreement
Fondo Italiano d’Investimento
(FII)
Fondo Strategico Italiano
Fondo Kyoto
Fintecna, SACE, Simest
acquisitions
FSI InvestimentiJV Qatar/FSI per
il Made in Italy
Funds to support economy
FII - Private DebtFII - Venture
Capital
Equity investment
in ENI
Fincantieri,SNAM
acquisitions
EXCLUSIVE FOCUS ON PUBLIC ENTITIES
PRIVATISATION AND DEVELOPMENT OF INFRASTRUCTURE
SEGMENT
EXPANSIONOF MISSIONTO INCLUDE ENTERPRISES
TRANSFORMATION AND
DEVELOPMENT IN GLOBALISATION AND VENTURE
CAPITAL
Historic events
Cassa Depositi e Prestitiis founded in Turin
Postal passbook savings accounts are created
CDP becomes a Directorate General of the Italian Treasury
Postal savings bonds are created
CDP obtains legal personality
Privatisation of CDP, which becomes a “S.p.A.” (joint-stock company) and
infrastructure development
CDP becomes subject to the reserve requirement regime
Expansion of mission to include SMEs, Export and Social Housing
CDP adopts a new operating approach
The CDP Group is created
CDP becomes the new Italian �nancial institution for
development cooperation
CDP becomes National Promotion Institution
5-years new Business Plan
Poste Italiane becomes partof CDP Group
Agreement with Poste Italiane for the postal savings service
First “social” bond issue
Historic phases
Equity investments
in OpenFiber.EFSI SMEsplatform
Plafond to support Central Italy territories
hit by 2016
CDP Corporate Investment
Platform
Equity investment in Saipem
Italgas spin-o�

CDP’s business model
The CDP Group works to support Italy’s growth and deploys its resources, mainly funded through postal savings, to
support the development of local areas and domestic companies, to promote their growth and international expansion.
Over the last decade, CDP has taken on a central role in supporting the country’s industrial policies, also thanks to the
adoption of new operating methods. In particular, in addition to traditional debt instruments such as loans and
guarantees, CDP has also adopted equity instruments. The main investments are in energy, transport networks and real
estate, in addition to supporting the growth and international development of SMEs and strategically-important
enterprises. These instruments are in addition to third-party fund management and subsidised instruments to promote
research and the international expansion of companies.
Lenders and recipients
6 1. Presentation of the CDP Group
Equity
Bonds
Guarantees
Loans
Third party accounts
Subsidies
Financing bodies
Tools
Beneficiaries
FUNDS
Bondholders Shareholders Postal savers
Real Estate Public entities and local bodies
Enterprises Infrastructure

CDP Group simplified structure
7The CDP Group, role and mission
ENI
FINTECNA
CDPEQUITY SACECDP
IMMOBILIARE
CDPINVESTIMENTISGR
FSIINVESTIMENTI
POSTEITALIANE
ANSALDOENERGIA
SAIPEM
SIA
SNAM
TERNA
ITALGAS
SIMEST
FINCANTIERI
REAL ESTATE
OPENFIBER
CDPRETI
INTERNATIONAL EXPANSIONENTERPRISES INFRASTRUCTURE
Other investments
Direct investments
Indirect investments
• European Investment Fund• FoF Private Debt• FoF Venture Capital• Fondo Atlante• Fondo FII Tech Growth• Fondo Innovazione e Sviluppo• Fondo Italiano d’Investimento FII Venture• Fondo Italiano d’Investimento Fondo di Fondi• Fondo QuattroR• FSI Mid Market Growth Equity Fund• HICrescItalia PMI• Istituto della Enciclopedia Italiana fondata
da Giovanni Treccani• Italian Recovery Fund (formerly Fondo
Atlante 2)• Vertis Venture 3 Technology Transfer• Oltre II SICAF EuVECA• Telecom Italia
• Fondo FIA 2• Fondo Investimenti per il Turismo (FIT)• Fondo Investimenti per l’Abitare (FIA)• Fondo Investimenti per la Valorizzazione
(Comparto Extra, Comparto Plus)• Fondo Immobiliare di Lombardia -
Comparto Uno• Fondo Federal District
• 2020 European Fund for Energy Climate Change and Infrastructure(Fondo Marguerite)
• Connecting Europe Broadband Fund• European Energy E�ciency Fund• F2i - Fondi Italiani per le Infrastrutture SGR• F2i - Terzo Fondo per le Infrastrutture• Fondo PPP Italia• Inframed Infrastructure• Istituto per il Credito Sportivo• Marguerite II SCSp (Fondo Marguerite II)

2.Half-yearly report on operations

2.Half-yearly report on operations

1. COMPOSITION OF THE CDP GROUP
1.1 PARENT COMPANY
Cassa depositi e prestiti (“CDP”) was established over 165 years ago (law 1097 of 18 November 1850) as an agency for
the protection and management of postal savings, investment in works of public utility and the financing of government
and public entities.
CDP has always played a fundamental institutional role in supporting household savings and promoting economic growth
in Italy in a sustainable way and in the public interest.
Over the course of its history, CDP’s sphere of action has widened significantly, with the focus shifted from local
authorities and postal savings (1850-2003) to infrastructure development (2003-2009), and then to the development of
the business sector, exports, international expansion and equity instruments (2009-2016).
CDP’s privatisation in 2003 marked the start of a rapid transformation that would lead it to become the Group that it is
today – a major player that invests, through debt and equity capital, in infrastructure, in the growth and international
expansion of enterprises, and in the acquisition of equity investments in Italian companies of national and international
importance.
In particular:
in 2003, with its transformation into a joint-stock company, bank foundations became shareholders of CDP. The
Ministry of the Economy and Finance (“MEF”), however, remains the main shareholder of CDP, with an equity interest
of 80.1% of the share capital;
in 2006, CDP became subject to a minimum reserve requirement by the Bank of Italy;
from 2009, CDP was authorised to finance initiatives of public interest, also in partnership with private-sector entities,
without drawing on public finances, and to provide support for SMEs in the form of targeted funding through the
banking industry;
in 2011, CDP’s operations were broadened further with the establishment of Fondo Strategico Italiano - FSI (now CDP
Equity), of which CDP is the pivotal investor;
in 2012, the expanded structure of the CDP GROUP consists of Cassa depositi e prestiti S.p.A. and the companies
subject to its management and coordination;
in 2014, CDP’s remit was extended again to encompass international cooperation, infrastructure financing and
investments in research, drawing on both government-backed funding and unsecured funding (decree law 133/2014 –
the “Sblocca Italia” decree – and law 125/2014). In particular, since 2014 CDP has been authorised to:
o finance international development cooperation projects designed for public or private-sector entities;
o draw on government-backed funding (postal savings funds) also to finance initiatives in favour of private entities
in sectors of “general interest”, as identified by decree of the Minister of the Economy and Finance;
o draw on non-government-backed funding to finance works, facilities, networks and equipment not only for the
provision of public services and reclamation works, but as part of wider initiatives of public utility;
o draw on non-government-backed funding to finance investments in research, development, innovation, the
protection and development of cultural heritage assets, the promotion of tourism, the environment, energy
efficiency and the green economy.
in 2015, with the approval of the 2016 Stability Law, CDP was assigned the role of “national promotional institution”
(article 1, paragraph 826, of law 208 of 28 December 2015). CDP’s designation as national promotional institution for
the intents and purposes of the EU regulation concerning strategic investments and as an eligible implementer of the
financial instruments receiving structural funds, authorises it to engage in the activities contemplated by the regulation,
also by drawing on Separate Account funds. As such, CDP has become:
o the entry point for funding under the Juncker Plan for Italy;
o financial advisor to government entities for a more efficient and effective use of domestic and European funds;
In 2016, the CDP Group’s “Italian Centre for Export and International Expansion” was expanded with the transfer of
CDP’s equity interest in Simest to Sace. That transaction confirms a major step forward in the implementation of the
CDP Group’s 2016-2020 Business Plan, with the creation of a system to support the growth and international
competitiveness of the Italian production system. The objective is to offer Italian businesses “one-door” access to all
they need to meet their export and international expansion requirements. In this way, CDP’s core role of medium/long-
term investor has been expanded to include the active promotion of growth initiatives. On 20 October 2016, CDP
10 2. Half-yearly report on operation

increased its share capital through a rights issue reserved to the MEF, which was subscribed by the MEF through the
contribution of a 35% equity interest in Poste Italiane S.p.A.. As a result of the transaction, the MEF’s equity interest in
CDP increased from 80.1% to 82.8%;
In 2017, CDP and Poste Italiane signed an agreement referring to the postal savings service for the three-year period
2018-2020. This new agreement consolidates the century-old alliance under which the savings of Italians act as a
catalyst for growth and development, contributing to strategic investments and to improving the country’s
competitiveness. In fact, CDP and Poste Italiane intend to re-launch postal savings with the repositioning of Bonds
and Passbook Accounts, with increased investment in technology, communications, promotion and training, in order
to reach an increasingly wide range of investors, for whom these products represent an opportunity for savings and
investment. Additionally, to renew its commitment to sustainable growth, CDP successfully issued a 500-million euro
“Social Bond” during the year. This will support SMEs located in economically deprived areas or in areas affected by
natural disasters.
All CDP’s operations are carried on within a framework that ensures the separation of the organisational and accounting
activities of the organisational units and thus the distinction between Separate Account and Ordinary Account assets,
thereby ensuring long-term economic and financial equilibrium whilst also ensuring returns for shareholders.
In terms of supervision, in accordance with article 5, paragraph 6 of decree law 269/2003, the provisions of Title 5 of the
Consolidated Law on Banking concerning the supervision of non-banking financial intermediaries apply to CDP, taking
into account the characteristics of the supervised entity and the special regulations applicable to the Separate Account.
CDP is also subject to oversight by a Parliamentary Supervisory Committee and the Court of Auditors.
At 30 June 2018, CDP was structured as follows.
The following report to the Board of Directors:
the Chief Executive Officer and General Manager;
the Chief Audit Officer.
The following report to the Chief Executive Officer and General Manager:
Public Affairs;
Group Identity & Communications and Sustainability;
the Chief Legal Officer;
the Chief Operating Officer;
the Chief Risk Officer;
the Chief Financial Officer;
the Chief Business Officer;
Group Real Estate;
the Chief Strategic Equity Officer.
The CDP organisational chart, as at 30 June 2018, is as follows:
11
Half-yearly Financial Report 2018
1. Composition of the CDP Group

As at 30 June 2018, CDP employed 776 people, including 81 senior managers, 356 middle managers, 323 office
workers and 16 employees seconded from another organisation.
In 2018, CDP personnel grew both in number and quality, with 60 new hires against 20 people leaving the organisation.
Compared to last year, the average age of employees remained basically unchanged, around 44 years, and the
proportion of employees with a tertiary education (bachelor’s or master’s degree, doctorate or other post-graduate
qualification) remained stable at 73%.
The companies subject to management and coordination by CDP employed 2,063 people at 30 June 2018, an increase
of 3%, or 60 people, on the figure at 31 December 2017.
12 2. Half-yearly report on operation
Statutory/BoDCommittees
ManagementCommittees
Chief Audit Officer
Chief Legal
Officer
Chief Business Officer
Chief Operating
Officer
GroupReal
Estate
Chief Financial Officer
Chief Strategic
Equity Officer
Chief Risks
Officer
PublicAffairs
GroupIdentity &
Communicationse Sustainability
of Statutory
Chairman
Board of Directors
CEOand
GeneralManager
ParliamentarySupervisoryCommittee
Board
Auditors
SupervisoryBoard

1.2 COMPANIES SUBJECT TO MANAGEMENT AND COORDINATION BY CDP
SACE GROUP
Brief description and shareholding structure
SACE was established in 1977 as a public entity under the supervision of the Ministry of the Economy and Finance
(MEF). In 2004, it was transformed into a joint-stock company, wholly owned by the MEF. On 9 November 2012, CDP
acquired the entire share capital of SACE from the MEF.
The SACE Group is an insurance and finance group operating in the areas of export credit, credit insurance, investment
protection, financial guarantees, sureties and factoring.
Specifically, the business purpose of SACE includes insurance, reinsurance, co-insurance and the provision of
guarantees against risks linked to political events and natural catastrophes, economic, trade and exchange-rate risk, as
well as any other related risks to which companies are exposed in their business dealings with foreign countries. SACE
also provides guarantees and insurance cover to foreign companies in transactions that are of strategic importance to
the Italian economy in terms of international expansion and economic security.
The SACE Group consists of SACE and the following companies:
SIMEST (76% stake), specialised in acquiring equity investments, financing operations of Italian enterprises
abroad and providing technical assistance and advisory services to Italian enterprises that choose to expand their
operations abroad;
SACE BT, established in 2004, engaged in the insurance of short-term credit;
SACE FCT, established in 2010, engaged in trade receivables financing;
SACE SRV, established in 2007, a subsidiary of SACE BT, specialised in business information solutions,
application management and debt recovery;
SACE Do Brasil, established in 2012.
Organisation and personnel
At 30 June 2018, the SACE Group employed 935 people, including 58 senior managers, 410 officials and 467 office
workers. Compared to 31 December 2017, the headcount increased by 23 employees.
CDP EQUITY
Brief description and shareholding structure
CDP Equity is the new name adopted, as of 31 March 2016, by Fondo Strategico Italiano, a company established on 2
August 2011. Following the Bank of Italy’s withdrawal from its entire equity investment (20%), 97.1% of the share capital
is now held by CDP and the remainder by Fintecna.
CDP Equity operates by acquiring equity investments, usually non-controlling interests, in companies of “major national
interest” that have a stable economic and financial position and are capable of generating value for investors.
13
Half-yearly Financial Report 2018
1. Composition of the CDP Group
CDPIMMOBILIARE SACE SIMEST FINTECNA
CDPINVESTIMENTI
SGR
CDPEQUITY
CDPRETI
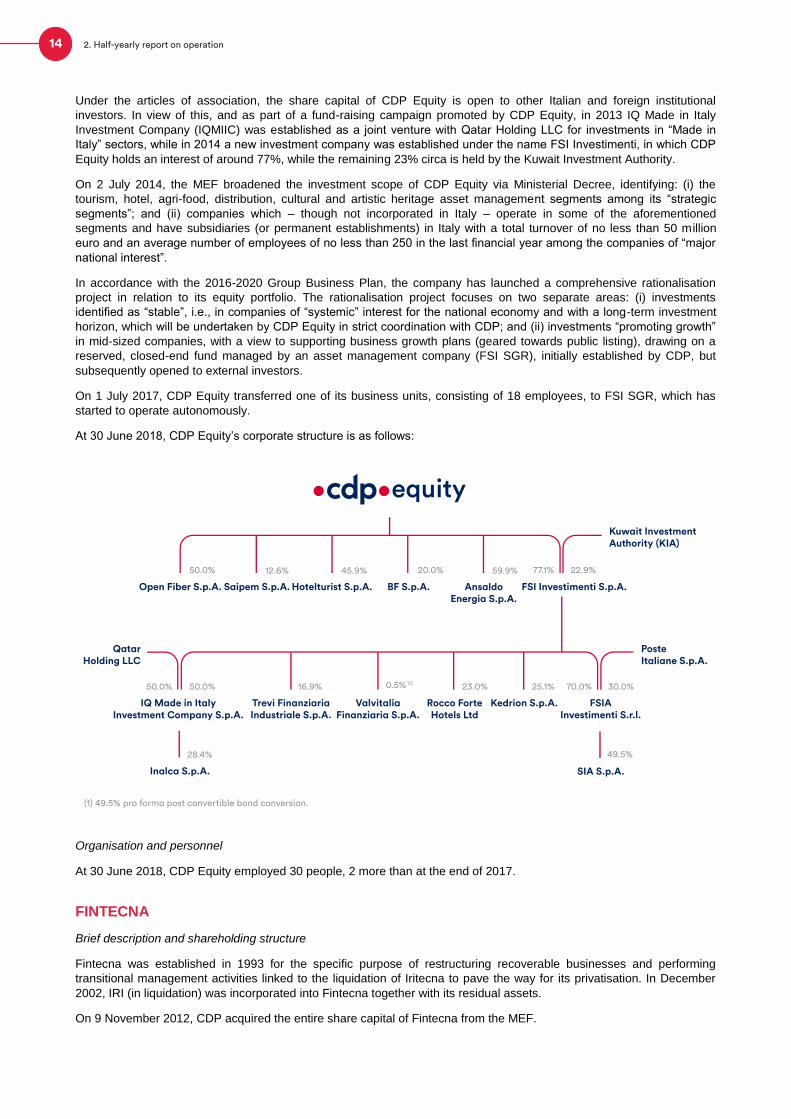
Under the articles of association, the share capital of CDP Equity is open to other Italian and foreign institutional
investors. In view of this, and as part of a fund-raising campaign promoted by CDP Equity, in 2013 IQ Made in Italy
Investment Company (IQMIIC) was established as a joint venture with Qatar Holding LLC for investments in “Made in
Italy” sectors, while in 2014 a new investment company was established under the name FSI Investimenti, in which CDP
Equity holds an interest of around 77%, while the remaining 23% circa is held by the Kuwait Investment Authority.
On 2 July 2014, the MEF broadened the investment scope of CDP Equity via Ministerial Decree, identifying: (i) the
tourism, hotel, agri-food, distribution, cultural and artistic heritage asset management segments among its “strategic
segments”; and (ii) companies which – though not incorporated in Italy – operate in some of the aforementioned
segments and have subsidiaries (or permanent establishments) in Italy with a total turnover of no less than 50 million
euro and an average number of employees of no less than 250 in the last financial year among the companies of “major
national interest”.
In accordance with the 2016-2020 Group Business Plan, the company has launched a comprehensive rationalisation
project in relation to its equity portfolio. The rationalisation project focuses on two separate areas: (i) investments
identified as “stable”, i.e., in companies of “systemic” interest for the national economy and with a long-term investment
horizon, which will be undertaken by CDP Equity in strict coordination with CDP; and (ii) investments “promoting growth”
in mid-sized companies, with a view to supporting business growth plans (geared towards public listing), drawing on a
reserved, closed-end fund managed by an asset management company (FSI SGR), initially established by CDP, but
subsequently opened to external investors.
On 1 July 2017, CDP Equity transferred one of its business units, consisting of 18 employees, to FSI SGR, which has
started to operate autonomously.
At 30 June 2018, CDP Equity’s corporate structure is as follows:
Organisation and personnel
At 30 June 2018, CDP Equity employed 30 people, 2 more than at the end of 2017.
FINTECNA
Brief description and shareholding structure
Fintecna was established in 1993 for the specific purpose of restructuring recoverable businesses and performing
transitional management activities linked to the liquidation of Iritecna to pave the way for its privatisation. In December
2002, IRI (in liquidation) was incorporated into Fintecna together with its residual assets.
On 9 November 2012, CDP acquired the entire share capital of Fintecna from the MEF.
14 2. Half-yearly report on operation
50.0% 12.6% 45.9%
Open Fiber S.p.A. Saipem S.p.A. Hotelturist S.p.A. BF S.p.A. AnsaldoEnergia S.p.A.
Rocco Forte Kedrion S.p.A.Hotels Ltd
ValvitaliaFinanziaria S.p.A.
Trevi Finanziaria Industriale S.p.A.
Inalca S.p.A.
IQ Made in Italy Investment Company S.p.A.
QatarHolding LLC
77.1% 22.9%
FSI Investimenti S.p.A.
FSIAInvestimenti S.r.l.
SIA S.p.A.
Kuwait Investment Authority (KIA)
PosteItaliane S.p.A.
50.0%50.0% 16.9% 0.5% (1)
20.0%
23.0%
59.9%
25.1%
28.4%
30.0%
49.5%
70.0%
equity
(1) 49.5% pro forma post convertible bond conversion.

The Fintecna Group’s operations are presently focused on the following lines of business:
- management of equity investments through steering, coordination and control activities;
- management of liquidation procedures;
- management of litigation, mainly arising from the incorporated companies;
- other operations, including support initiatives for the communities affected by the earthquakes in Emilia in 2012
and in central Italy in 2016.
Pursuant to Law No. 205 of 27 December 2017 (2018 Stability Law), Fintecna’s operating scope has been expanded to
include the management of assets of state-owned companies and entities under liquidation, to be assigned on an annual
basis by decree of the Ministry of the Economy and Finance.
It should be noted that Fintecna holds, inter alia, a controlling interest in Fincantieri (71.64%) but does not exercise
management and coordination powers over the company following its listing on the stock exchange.
Organisation and personnel
At 30 June 2018, Fintecna employed 130 people, including 13 senior managers, 1 more than at the end of 2017. In
detail, in the first half of 2018, 2 employees left the company and 3 new employees were hired.
CDP IMMOBILIARE
Brief description and shareholding structure
CDP Immobiliare (formerly Fintecna Immobiliare) was established in 2007 by the Fintecna Group as part of the
restructuring plan for the Construction & Civil and System Engineering division of the former IRI Group. In November
2013, following the demerger of Fintecna’s real estate assets, all equity investments held by Fintecna in CDP
Immobiliare and Quadrante (the latter subsequently merged by incorporation into CDP Immobiliare) were transferred to
CDP.
Over the years, CDP Immobiliare has acquired specific expertise in the field of urban transformation and development,
which it has transferred to the broader real estate sector through its property management, construction and selling
businesses. The mission of the company today is to leverage its real estate assets through local urban growth and
redevelopment projects, also in partnership with private investors.
In detail, at 30 June 2018, the company’s real estate assets totalled approximately 1,057 million euro, including directly
owned assets valued at 221 million euro and assets held through 14 investment vehicles in partnership with leading
Italian companies, worth 836 million euro.
Organisation and personnel
At 30 June 2018, CDP Immobiliare employed 123 people, including 19 senior managers, 45 middle managers and 59
office workers, 5 more than at the end of 2017.
CDP INVESTIMENTI SGR
Brief description and shareholding structure
CDP Investimenti SGR (CDPI SGR) was established on 24 February 2009 by CDP together with Associazione delle
Fondazioni Bancarie e Casse di Risparmio (ACRI) and the Italian Banking Association (ABI). The company is registered
in Rome and has share capital of 2 million euro, 70% of which is subscribed by CDP.
CDPI SGR operates in the real estate investment sector, specifically in the promotion, establishment and management of
closed-end funds reserved to qualified investors in specific real estate market segments. At 30 June 2018, CDPI SGR
managed six real estate funds:
- Fondo Investimenti per l’Abitare (“FIA”), which invests in a network of local real estate funds active in the private
social building sector (social housing projects, mid-range between public housing and the private property market);
- Fondo Investimenti per la Valorizzazione (“FIV”), a real estate umbrella fund set up to acquire real estate with
unexpressed potential value that can be leveraged through change in use, upgrading or rental;
- Fondo Investimenti per il Turismo (“FIT”), focused on real estate investments in the tourism, hotel, hospitality and
recreational sectors;
- Fondo Turismo 1 (“FT1”), focused on aggregating a diversified portfolio by acquiring real estate assets and renting
these out to hotel operators;
15
Half-yearly Financial Report 2018
1. Composition of the CDP Group

- FIA 2, focused on real estate investments in housing and private services of public utility in the smart housing and
smart working sectors;
- Fondo Federal District (“FFD”), launched in June to invest in real estate property intended mainly or exclusively for
use as offices/services facilities, already leased or to be leased to General Government entities (or their investees).
Organisation and personnel
At 30 June 2018, the company employed 62 people (11 senior managers, 31 middle managers and 20 office workers).
The headcount increased by 5 employees compared with the end of 2017, following the exit of 2 employees and the
entry of 7 new staff members under part-time secondment contracts.
OTHER COMPANIES SUBJECT TO MANAGEMENT AND COORDINATION BY CDP
CDP RETI
Brief description and shareholding structure
CDP RETI was set up as an investment vehicle in October 2012 to support the development of the infrastructure of
natural gas transportation, dispatching, regasification, storage and distribution and of electricity transmission. It achieves
this purpose by acquiring equity investments of systemic importance.
After the share capital was opened to outside investors in November 2014, the company’s present shareholders are:
CDP (59.1%), State Grid Europe Limited (35.0%) and other institutional Italian investors (with a collective interest of
5.9%).
At 30 June 2018, the company owned equity investments in Snam (30.371%), Terna (29.85%) and Italgas (26.04%).
Organisation and personnel
At 30 June 2018, CDP RETI employed 5 people, 1 of which under part-time secondment from the Parent Company. To
conduct its business, the company also relies on the operational support of the Parent Company CDP, which is provided
under contractual arrangements made at arm’s length.
1 On 7 may 2018, SNAM S.p.A. communicated the cancellation of 31,599,715 treasury shares in its portfolio without reduction of share capital. As a result of the cancellation of the shares (approved by the Extraordinary Shareholders’ Meeting of Snam S.p.A. on 24 April 2018), in the first half of 2018 CDP RETI’s equity interest in the company has increased from 30.10% to 30.37%.
16 2. Half-yearly report on operation

2. FINANCIAL AGGREGATES AND PERFORMANCEINDICATORS
CDP S.p.A. - Financial aggregates2 and performance indicators (millions of euro; %)
2 Reclassified (see par.4.2.1)
17
Half-yearly Financial Report 2018
2. Financial aggregates and performance indicators
30/06/201731/12/201730/06/2018
Changes
Overall %
-646 -0.2%
-12,425 -7.1%
-1,097 -1.1%
759 2.3%
-98 n.s.
-734 -3.0%
33 2.1%
318 20.7%
285 19.6%
160 13.1%
Total assets
Equity
Net incomefor the period
Net impaired loans/Net loans to banks and customers (*)
(*) Exposure includes Loans, Disbursement commitments and Financial assets at far value with impact on equity. Net exposure is calculated net of the provision for impaired loans. Figures related to 2017 are at 31/12/2017.
Funding
Operating income
ROE
Equity investments
Gross income
Cost/incomeratio
Loans
Net interestincome
Net interestincome spread
Cash and cash equivalents
366,619
162,855
100,676
33,057
1,612
1.1%
340,399
1,853
4.6%
23,701
1,736
11.3%
1,382
0.072%
367,265
175,280
101,773
32,298
1,578
1.0%
340,498
1,535
4.8%
24,435
1,452
10.5%
1,222
0.215%

CDP Group - Financial aggregates3 and performance indicators (millions of euro; %)
3 Reclassified (see par.4.2.2)
18 2. Half-yearly report on operation
30/06/201731/12/201730/06/2018
Changes
Overall %
618 0.1%
-13,879 -7.8%
1,338 1.2%
379 1.9%
586 0.2%
-513 -1.4%
-354 -1.5%
45 3.0%
180 12.3%
-58 -1.4%
-253 -10.3%
Total assets
Equity
Net income
Funding
Operating income
of which pertaining to shareholders of the Parent Company
Equity investments
Gross income
Loans
Net interestincome
Cash and cash equivalents and other lending
420,152
164,901
109,560
20,149
1,536
364,609
1,646
35,408
3,981
22,707
2,192
419,534
178,780
108,222
19,770
1,491
364,023
1,466
35,921
4,039
23,061
2,445

3. MACROECONOMIC SCENARIO AND MARKET CONTEXT
3.1 MACROECONOMIC SCENARIO
According to recent estimates of the International Monetary Fund (IMF)4, the growth rate of the global economy is
expected to accelerate to 3.9% in 2018, up from 3.7% in 2017. Similar performance is also projected in the eurozone,
with growth to rise to 2.4% in 2018 (+0.1% on 2017). Foreign demand continues to be a driving factor in Eurozone
growth and the contribution from investments has also risen sharply. However, in the international context, economic
growth is expected to be weaker in the eurozone than in the US, which is projected to grow by 2.9% in 2018.
In this scenario, the Italian economy is expected to grow more slowly in 2018, at a rate of 1.3% (down from 1.6% in
2017). Growth will be affected by weaker household consumption (estimated at 1.0% against 1.4% in 2017) and by
exports, which continue to see significant growth rates (3.8% in 2018) but have slowed compared to the peak hit in 2017
(6.0%)
Real GDP growth rate
(% change year-on-year)
Data source: Istat
With regard to the labour market, further progress was made in 2018, in line with the persisting expansionary trend of the
economic cycle. Employment is projected to grow by 0.8%, alongside a slight decrease in the unemployment rate (to
11.0% from 11.2% in 2017), partly due to higher labour market participation among women and in the Southern Italy
area5.
Prices are expected to increase by 1.3% in 2018, in line with the trend recorded in 2017.
4 IMF, World Economic Outlook, June 20185 Istat, Employment and unemployment February 2018.
19
Half-yearly Financial Report 2018
3. Macroeconomic scenario and market context
2.0
1.5
1.0
0.5
020162015 2017 F2018
0.8
1.6
1.3
0.9

Inflation rate
(% annual change NIC index)
Data source: Bank of Italy
3.2 THE CREDIT SECTOR
3.2.1 MONETARY POLICIES AND INTEREST RATES
In mid-July 2018, the European Central Bank (ECB) announced an extension of the deadline of the asset purchase
programme (APP), from September to December. In light of the end of quantitative easing, in line with the recovery in
credit transactions, the monthly pace of net asset purchases will be halved, down to 15 billion euro in the last quarter of
the year. The policy of reinvesting in maturing securities is confirmed, as are the main and marginal rates on deposits
and refinancing. Generally speaking, the ECB has decided to maintain an expansionary policy stance for the whole year,
supported by the latest Eurosystem projections on inflation (rising, but still below the target level) and GDP growth (down
in 2018).
Funding in the banking sector remained relatively stable in the first half of the year, also reflected in the lower use of
financing from the Central Bank. Funding requested from the ECB totalled around 248 billion euro in June, dropping by
approximately 9 billion euro on the same month of the previous year. In particular, Long Term Refinancing Operations
(LTRO) amounted to around 246 billion euro, while funding requested via Main Refinancing Operations (MRO) amounted
to around 1 billion euro, well below the 12 billion euro borrowed up to mid-2017.
With the monetary policy stance still accommodating, market rates remained very low. Indeed, the 3-month Euribor rate
dropped slightly to -0.32% in June (against -0.33% at the beginning of the year), while the Eonia rate went from -0.35%
to -0.36%.
In 2018, the political instability caused by the uncertain outcome of the elections led to high volatility in the sovereign
debt market. In detail, in the first half of the year, the spread between the Italian 10-year bond and comparable German
and French bonds widened significantly to 238 and 202 basis points at the end of June (rising by around 81 points from
the beginning of the year)6. At the same time, the Rendistato general index gradually rose to 1.49% in May 2018,
increasing by around 24 basis points with respect to the value at the beginning of the year and by around 44 basis points
on the same month of the previous year7.
6 Based on Thomson Reuters - Datastream figures.
7 Based on Thomson Reuters - Datastream figures.
20 2. Half-yearly report on operation
1.5
1.2
0.9
0.6
0.3
0
-0.32014 2015 2016 2017 F2018
0.2
-0.1
0.1
1.3 1.3

Main interest rates (%)
Data source: Based on Reuters figures
In March 2018, bank lending to the private sector and to General Government entities decreased by 1.9% on an annual
basis. However, performance is relatively more positive when considering figures adjusted to take into account
securitisations and other receivables transferred and derecognised from banks’ financial statements. In fact, loans to the
private sector increased by 2.4% as a result of the strong performance of loans to households (+2.8% on an annual
basis) and loans to enterprises returning to growth (+1.2%). However, loans to Italian companies are still far below the
eurozone average. Indeed, while the eurozone as a whole recorded a 3.1% growth, the increase was much higher in
Germany and France (respectively 5.5% and 5.0%).
With regard to the main bank interest rates, in the first few months of 2018, the average rate on funding from resident
customers fell steadily in the period, to 0.4% in March (-1.5 basis points compared to the same month of the last year).
The impact of the average interest rate on bank bonds was especially strong, decreasing by 18 basis points year-on-
year, to 3.0% in March. The average rate on deposits was essentially unchanged, standing at 0.5% in March (+0.3%
basis points). The interest rate on loans to households and non-financial businesses recorded a further decrease, to
2.2% in March (-29 basis points with respect to the same month of the previous year)8.
3.2.2 LENDING AND FUNDING IN CDP’S REFERENCE MARKET
The volume of loans to private and public sectors is expected to rise at a rate of 2.6% in 2018, marking an improvement
on 2017. However, the growth rate is slightly lower, at 2.5%, if only loans to enterprises and households are considered,
thus highlighting the considerable weight on aggregate figures of lending to the public sector.
The prospects of bad loans held by Italian banks have also improved in light of the expansionary economic cycle. In
2018, gross bad debts are expected to fall by around 16.9%, in line with the rate seen in 2017 - a turning point in the
Italian non-performing loans market. Gross bad debts are estimated to amount to 140 billion euro at the end of the year,
against 167 billion euro at year-end 2017.
8 See AFO - Abi Financial Outlook, April 2018.
21
Half-yearly Financial Report 2018
3. Macroeconomic scenario and market context
2014
10-year GVT Bond
2012
Rendistato Index3m Euribor
2011
8
7
6
5
4
3
2
1
0
-120152013 2016 2017 1H2018

Gross bad debts
(% chg. stock)
Household financial assets
(% chg. stock)
Data source: Bank of Italy, ABI and Prometeia
In terms of funding, with particular regard to CDP’s reference market segments, the projected growth rate for the stock of
household financial assets is 2.5%, totalling approximately 4.5 billion euro. This increase reflects the positive trend of
household finances and their financial investments.
3.3 PUBLIC FINANCE
Key public finance figures improved in the first quarter compared to the same period of last year. In fact, General
Government net borrowing was equal to 3.5% of GDP in the first quarter of 2018 - 0.5% lower than in the same quarter
of 2017. The General Government's primary balance (borrowing net of interest expense) was negative, with an impact on
GDP of 0.2% (-1.4% in the first quarter of 2016). The General Government's current balance was also negative, with an
impact on GDP of 1.7% (-0.3% in the first quarter of 2017). The tax burden was 38.2%, down by 0.2 percentage points
on the same period of the previous year.
The stability programme presented in April by the Government in its Economy and Finance Document was generally
endorsed by the European Commission in the Country Specific Recommendations issued at the end of May. However,
the Italy-specific recommendations highlighted the inadequacy of the adjustment to public finances for 2018 and a further
structural adjustment of at least 0.6% of GDP was requested for 2019. In this context, according to estimates of the
European Commission9, the deficit is expected to fall considerably to 1.7% of GDP in 2017 and the public debt/GDP ratio
is expected to decrease slightly (130.7%).
9 European Commission, Spring 2018 Economic Forecast, 2018.
22 2. Half-yearly report on operation
5%
0
-5%
-10%
-15%
-20%2016 2017 F2018
0.1%
-16.6% -16.9%
5%
4%
3%
2%
1%
02016 2017 F2018
0.2%
4.4%
2.5%

Public finance debts and balances
(right: billion euro; left % of GDP)
Data source: AMECO
3.4 THE REAL ESTATE SECTOR
The real estate sector continued its slow recovery in the first half of 2018, despite the macroeconomic context being less
favourable than a few months ago. The economic growth rate showed modest signs of slowing, with inflation still at 1%.
However, the easing of the expansionary impetus at the end of 2017 and at the beginning of 2018 appears to be
transitory, judging by the new acceleration seen in recent months. Demand is no longer driven only by needs suppressed
during the crisis but also by a rediscovered investment appetite, following a ‘wait and see’ period.
In the first quarter of 2018, the Italian real estate market saw a stronger recovery in terms of transaction volumes. At
overall level, after the initial leap forward in 2016, growth rates are now down to single digit. While the latent demand for
real estate exploded massively on the market in 2016 - taking advantage of credit coverage and the general climate of
confidence - it appeared to be slightly weaker in 2017, leaving room for a more cautious assessment of the weakness
factors that still characterise the country’s social and economic context.
The markets monitored by Nomisma indicate dynamic performance above the national average for the housing segment,
but a still heavily unfavourable situation for the non-residential segment, with transactions falling to 45.2%. The Italian
property market is essentially running at two speeds: the residential market has now reached a turning point, while the
non-residential market, though slowly recovering lost ground, is still seeing higher price drops and longer selling times.
After seeing a year-on-year increase of +16% in 2016, growth in the real estate segment was more modest in 2017, at
+4.9% (with sale-purchase transactions equivalent to 542 thousand units). Looking at the trends of the residential market
in the different macro regions, we see the growth in transaction volume led mainly by the South (+5.5%) and the North
(+4.7%), but slowing in the central regions (+2.5%).
Year-on-year growth was 4.3% in the first quarter of 2018, with differing trends at individual city level. In Genoa and
Bologna, transaction volumes fell respectively by 3.0% and 2.7%, while the decrease was less pronounced in Rome (-
1.9%) and Florence (-1.1%); only Naples saw double-digit growth (+11.8%), while Milan, Palermo and Turin also
recorded an increase on the previous quarter.
Despite the gradual recovery of transaction volumes, real estate prices are still falling, even if only marginally (-0.4%
against -1.2% in the previous year). One new factor - a proxy among the unequivocal signs of improvement in the real
estate market - is the recovery in the investment property segment which, after grinding to a halt in recent years, now
accounts for 15.4% of expressions of interest to purchase properties, representing around 400 thousand households
(against only 6.1% in 2017). Stimulus from this segment will be decisive in bringing prices back to positive territory, not
so much in terms of the size of the demand but in terms of the spending power of part of that demand.
Regarding the services-commercial sector, although the central and southern regions of Italy saw moderate growth,
(respectively +4.6% and +2.3% year-on-year), the increase in sale-purchase volumes was mainly driven by the northern
area of the Country, with growth in the North-East and North-West standing at +10.9% and +5.4% respectively.
Lending in the real estate sector, including both home mortgages and credit facilities for businesses, account for a large
portion of bank loans. The fall in disbursements was certainly more marked in the crisis period and the building sector as
23
Half-yearly Financial Report 2018
3. Macroeconomic scenario and market context
Debt/GDPBudget balancePrimary balance
-2.9%
2013
2%
1%
0
-1%
-2%
-3%
— 135
— 132
— 129
— 126
— 123-3.0%2014 2015 2016 2017 F2018
1.7%1.4% 1.4%
-2.6%
1.3%
-2.5%
1.7%
-2.3%
1.9%
-1.7%
whole was more heavily affected than others by the restrictive conditions of supply. There is still a significant imbalance
between the performance of loans to households and lending to the services and industrial sectors, notwithstanding the
slight improvement recorded at the end of 2017.
In the first quarter of 2018, the stock of mortgage loans granted to consumer households grew by 0.5% (315 billion euro)
and disbursements of mortgages to consumer households performed in line with the trend of the stock. In detail,
disbursements amounted to 11.2 billion euro, in line with the same period of the previous year (11.7 billion euro).
The outlook for the real estate sector must necessarily take into account changes in the lending context: after increasing
for three years, disbursements to purchase homes grinded to a halt in 2017. In the three-year period 2018-2020,
mortgage disbursements will certainly grow at a more modest rate than in the past and will decrease progressively (+4%
in 2018 and +2.9% in 2019), reflecting the lower expansionary impetus.
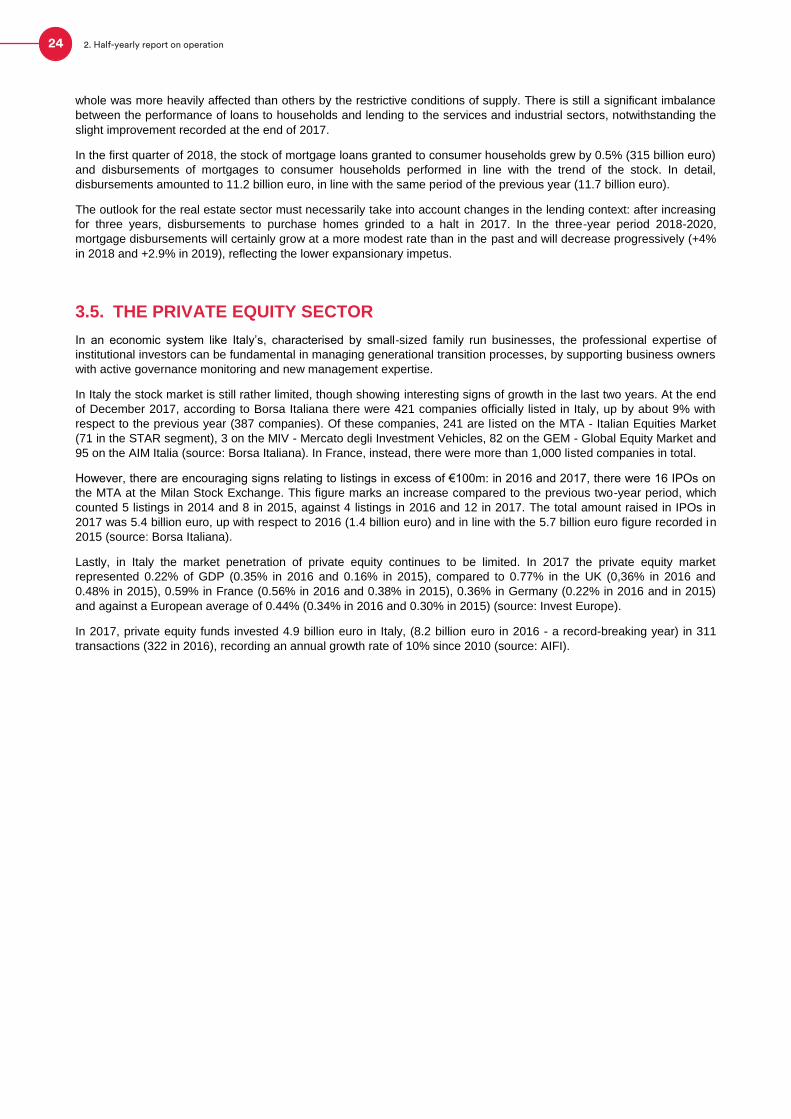
3.5. THE PRIVATE EQUITY SECTOR
In an economic system like Italy’s, characterised by small-sized family run businesses, the professional expertise of
institutional investors can be fundamental in managing generational transition processes, by supporting business owners
with active governance monitoring and new management expertise.
In Italy the stock market is still rather limited, though showing interesting signs of growth in the last two years. At the end
of December 2017, according to Borsa Italiana there were 421 companies officially listed in Italy, up by about 9% with
respect to the previous year (387 companies). Of these companies, 241 are listed on the MTA - Italian Equities Market
(71 in the STAR segment), 3 on the MIV - Mercato degli Investment Vehicles, 82 on the GEM - Global Equity Market and
95 on the AIM Italia (source: Borsa Italiana). In France, instead, there were more than 1,000 listed companies in total.
However, there are encouraging signs relating to listings in excess of €100m: in 2016 and 2017, there were 16 IPOs on
the MTA at the Milan Stock Exchange. This figure marks an increase compared to the previous two-year period, which
counted 5 listings in 2014 and 8 in 2015, against 4 listings in 2016 and 12 in 2017. The total amount raised in IPOs in
2017 was 5.4 billion euro, up with respect to 2016 (1.4 billion euro) and in line with the 5.7 billion euro figure recorded in
2015 (source: Borsa Italiana).
Lastly, in Italy the market penetration of private equity continues to be limited. In 2017 the private equity market
represented 0.22% of GDP (0.35% in 2016 and 0.16% in 2015), compared to 0.77% in the UK (0,36% in 2016 and
0.48% in 2015), 0.59% in France (0.56% in 2016 and 0.38% in 2015), 0.36% in Germany (0.22% in 2016 and in 2015)
and against a European average of 0.44% (0.34% in 2016 and 0.30% in 2015) (source: Invest Europe).
In 2017, private equity funds invested 4.9 billion euro in Italy, (8.2 billion euro in 2016 - a record-breaking year) in 311
transactions (322 in 2016), recording an annual growth rate of 10% since 2010 (source: AIFI).
24 2. Half-yearly report on operation

The private equity sector in Europe
(billions of euro)
Data source: Invest Europe/EDC
3.6 THE EXPORT SUPPORT AND CREDIT INSURANCE SECTORS
Between January and April 2018, international trade volumes grew by 4.3% marking an acceleration with respect to the
first four months of the previous year. Italian exports also increased in the same period (+4.1%), thanks to EU countries
(+6.1%), including Austria, France, Germany, the Netherlands, Poland and the Czech Republic. Outside the common
market (+1.5%), exports were driven by India, Mercosur members and Switzerland, where the demand for Italian
products remained steady (above 9%). Exports declined towards North Africa (-6.9%), the Middle East (-7.6%) and
OPEC countries (-10.1%).
The sectors that performed better were metalworking (7.7%), electronics (7.0%), pharmaceuticals (6.3%), food &
beverages and transport equipment (excluding motor vehicles, that is, those products that are reference products in the
demand for export credit insurance cover), in which exports increased by over 5%.
25
Half-yearly Financial Report 2018
3. Macroeconomic scenario and market context
DivestmentsInvestmentsFundraising
201320101H 1H 1H 1H1H 1H 1H 1H
50
40
30
20
10
020142011 20152012 2016 2017

4. PERFORMANCE OF THE CDP GROUP
4.1 BUSINESS PERFORMANCE
The CDP Group works to support Italy’s growth and deploys its resources, mainly funded through Postal Savings, for
local development throughout Italy, for strategic infrastructure for the country and for domestic companies to promote
their growth and international expansion.
Over time, CDP has taken on a key role in supporting the country’s industrial policies, also thanks to the adoption of new
operating procedures. In particular, in addition to traditional debt instruments such as special-purpose loans, corporate
finance, project finance and guarantees, CDP also uses risk sharing instruments to facilitate access to credit for SMEs,
as well as equity instruments, through which it has made both direct and indirect investments (via investment funds and
investment vehicles) mainly in the energy, transport networks and real estate sectors, also with a view to supporting the
growth and international development of SMEs and enterprises of strategic importance. These instruments are in
addition to third-party fund management and subsidised instruments to promote research and the international expansion
of companies.
CDP also acts as a “financial institution for international development cooperation”. Jointly with the other cooperation
institutions, CDP’s activities focus primarily on the management of the “Law 277/77 Revolving Fund” for development
loans to the governments of partner developing countries and for loans to Italian companies that set up joint ventures in
such countries.
Lastly, as a National Promotional Institution, CDP plays a key role in the implementation of the Investment Plan for
Europe (also known as the "Junker Plan") as it contributes to the structuring of the investment platforms identified as
forms of cooperation between the EIB Group and National Promotional Institutions.
In the first half of 2018, new lending, investment and resources managed by the CDP Group totalled around 13 billion
euro decreasing at overall level compared to the same period of 2017, characterised by transactions of a significant
amount. Resources were allocated to each of the key driver areas in the following proportions: 51% of the total to
“International Expansion”, 34% to “Enterprises”, 14% to “Government & PA and Infrastructure”, and 1% to “Real Estate”.
26 2. Half-yearly report on operation

New lending, investments and managed resources broken down by business line - CDP Group
(millions of euro; %) 30/06/2018 30/06/2017 Change (+ / -) (%) change
Government & P.A. and Infrastructure 1,755 1,908 (153) -8.0%
CDP S.p.A. 1,755 1,908 (153) -8.0%
International expansion 6,508 6,390 118 1.8%
CDP S.p.A. 2,388 3,203 (815) -25.4%
SACE Group 4,844 4,615 229 5.0%
Intercompany transactions (724) (1,428) 704 -49.3%
Enterprises 4,398 7,179 (2,781) -38.7%
CDP S.p.A. 4,152 6,878 (2,726) -39.6%
SACE Group 1,898 1,833 65 3.6%
CDP Equity 48 53 (5) -8.9%
Intercompany transactions (1,700) (1,584) (116) 7.3%
Real Estate 106 78 28 35.6%
CDP S.p.A. 35 22 13 60.9%
CDPI SGR 100 78 22 28.7%
Intercompany transactions (30) (22) (8) 36.3%
Total new lending, investment and managed resources 12,767 15,555 (2,789) -17.9%
27
Half-yearly Financial Report 2018
4. Performance of the CDP Group
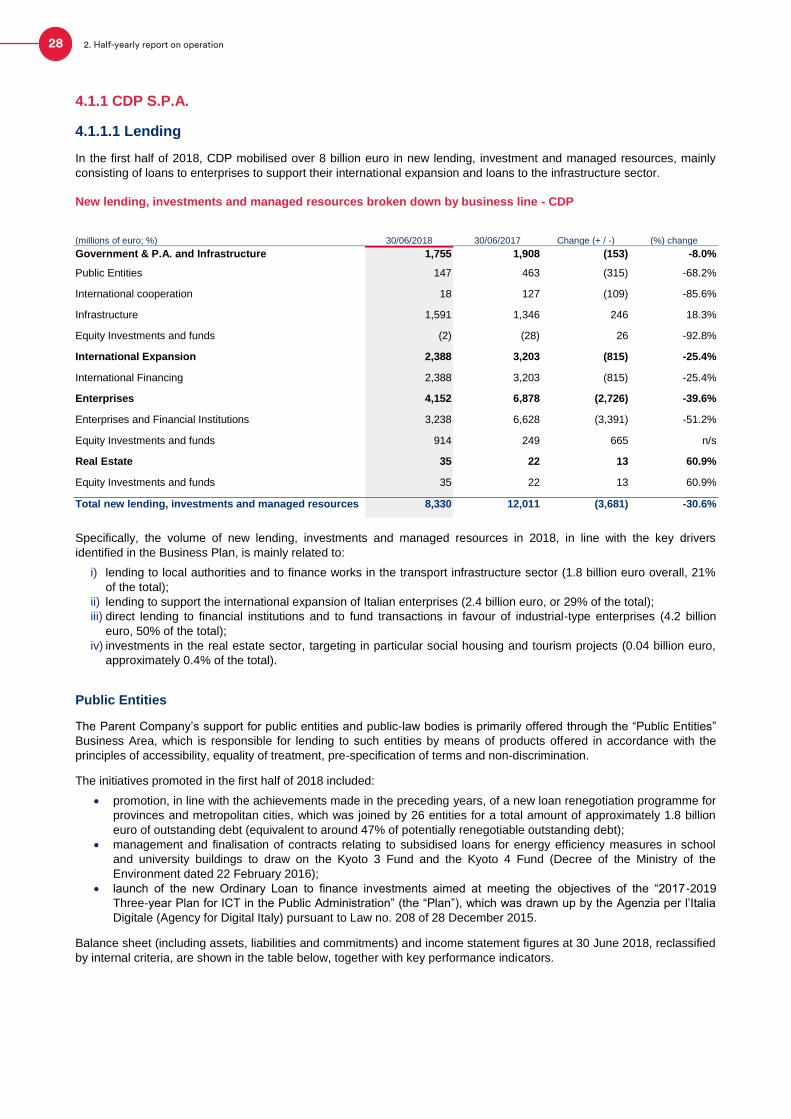
4.1.1 CDP S.P.A.
4.1.1.1 Lending
In the first half of 2018, CDP mobilised over 8 billion euro in new lending, investment and managed resources, mainly
consisting of loans to enterprises to support their international expansion and loans to the infrastructure sector.
New lending, investments and managed resources broken down by business line - CDP
(millions of euro; %) 30/06/2018 30/06/2017 Change (+ / -) (%) change
Government & P.A. and Infrastructure 1,755 1,908 (153) -8.0%
Public Entities 147 463 (315) -68.2%
International cooperation 18 127 (109) -85.6%
Infrastructure 1,591 1,346 246 18.3%
Equity Investments and funds (2) (28) 26 -92.8%
International Expansion 2,388 3,203 (815) -25.4%
International Financing 2,388 3,203 (815) -25.4%
Enterprises 4,152 6,878 (2,726) -39.6%
Enterprises and Financial Institutions 3,238 6,628 (3,391) -51.2%
Equity Investments and funds 914 249 665 n/s
Real Estate 35 22 13 60.9%
Equity Investments and funds 35 22 13 60.9%
Total new lending, investments and managed resources 8,330 12,011 (3,681) -30.6%
Specifically, the volume of new lending, investments and managed resources in 2018, in line with the key drivers
identified in the Business Plan, is mainly related to:
i) lending to local authorities and to finance works in the transport infrastructure sector (1.8 billion euro overall, 21%
of the total);
ii) lending to support the international expansion of Italian enterprises (2.4 billion euro, or 29% of the total);
iii) direct lending to financial institutions and to fund transactions in favour of industrial-type enterprises (4.2 billion
euro, 50% of the total);
iv) investments in the real estate sector, targeting in particular social housing and tourism projects (0.04 billion euro,
approximately 0.4% of the total).
Public Entities
The Parent Company’s support for public entities and public-law bodies is primarily offered through the “Public Entities”
Business Area, which is responsible for lending to such entities by means of products offered in accordance with the
principles of accessibility, equality of treatment, pre-specification of terms and non-discrimination.
The initiatives promoted in the first half of 2018 included:
promotion, in line with the achievements made in the preceding years, of a new loan renegotiation programme for
provinces and metropolitan cities, which was joined by 26 entities for a total amount of approximately 1.8 billion
euro of outstanding debt (equivalent to around 47% of potentially renegotiable outstanding debt);
management and finalisation of contracts relating to subsidised loans for energy efficiency measures in school
and university buildings to draw on the Kyoto 3 Fund and the Kyoto 4 Fund (Decree of the Ministry of the
Environment dated 22 February 2016);
launch of the new Ordinary Loan to finance investments aimed at meeting the objectives of the “2017-2019
Three-year Plan for ICT in the Public Administration” (the “Plan”), which was drawn up by the Agenzia per l’Italia
Digitale (Agency for Digital Italy) pursuant to Law no. 208 of 28 December 2015.
Balance sheet (including assets, liabilities and commitments) and income statement figures at 30 June 2018, reclassified
by internal criteria, are shown in the table below, together with key performance indicators.
28 2. Half-yearly report on operation
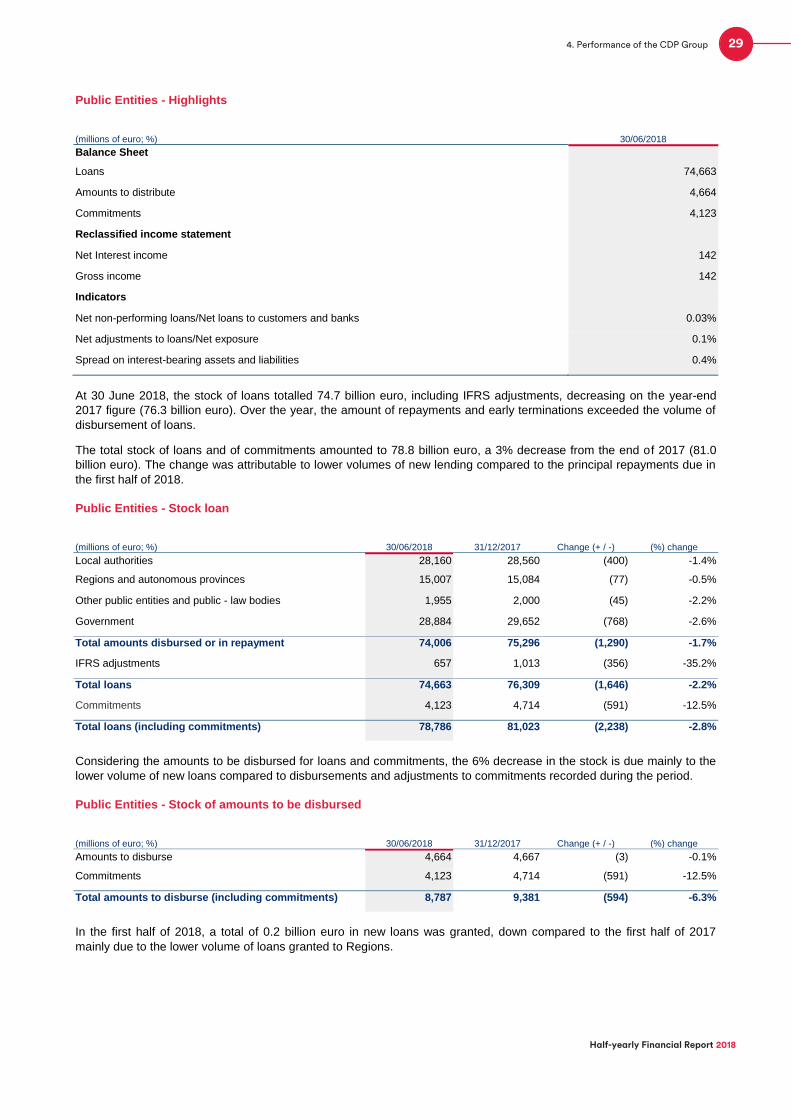
Public Entities - Highlights
(millions of euro; %) 30/06/2018
Balance Sheet
Loans 74,663
Amounts to distribute 4,664
Commitments 4,123
Reclassified income statement
Net Interest income 142
Gross income 142
Indicators
Net non-performing loans/Net loans to customers and banks 0.03%
Net adjustments to loans/Net exposure 0.1%
Spread on interest-bearing assets and liabilities 0.4%
At 30 June 2018, the stock of loans totalled 74.7 billion euro, including IFRS adjustments, decreasing on the year-end
2017 figure (76.3 billion euro). Over the year, the amount of repayments and early terminations exceeded the volume of
disbursement of loans.
The total stock of loans and of commitments amounted to 78.8 billion euro, a 3% decrease from the end of 2017 (81.0
billion euro). The change was attributable to lower volumes of new lending compared to the principal repayments due in
the first half of 2018.
Public Entities - Stock loan
(millions of euro; %) 30/06/2018 31/12/2017 Change (+ / -) (%) change
Local authorities 28,160 28,560 (400) -1.4%
Regions and autonomous provinces 15,007 15,084 (77) -0.5%
Other public entities and public - law bodies 1,955 2,000 (45) -2.2%
Government 28,884 29,652 (768) -2.6%
Total amounts disbursed or in repayment 74,006 75,296 (1,290) -1.7%
IFRS adjustments 657 1,013 (356) -35.2%
Total loans 74,663 76,309 (1,646) -2.2%
Commitments 4,123 4,714 (591) -12.5%
Total loans (including commitments) 78,786 81,023 (2,238) -2.8%
Considering the amounts to be disbursed for loans and commitments, the 6% decrease in the stock is due mainly to the
lower volume of new loans compared to disbursements and adjustments to commitments recorded during the period.
Public Entities - Stock of amounts to be disbursed
(millions of euro; %) 30/06/2018 31/12/2017 Change (+ / -) (%) change
Amounts to disburse 4,664 4,667 (3) -0.1%
Commitments 4,123 4,714 (591) -12.5%
Total amounts to disburse (including commitments) 8,787 9,381 (594) -6.3%
In the first half of 2018, a total of 0.2 billion euro in new loans was granted, down compared to the first half of 2017
mainly due to the lower volume of loans granted to Regions.
29
Half-yearly Financial Report 2018
4. Performance of the CDP Group

Public Entities - New loan agreements
(millions of euro; %) 30/06/2018 30/06/2017 Change (+ / -) (%) change
Local authorities 92 61 31 51.3%
Regions - 320 (320) n/s
Non-local Public Entities 27 6 21 n/s
Loans with repayment costs charged to the government budget
1 - 1 n/s
Advances and contributions 11 61 (50) -82.0%
Fondo Kyoto 16 15 1 5.5%
Total Public Entities 147 463 (315) -68.2%
Disbursements amounted to 0.7 billion euro, in line with the same period of 2017. In particular, disbursements for loans
granted to Regions increased sharply (+0.1 billion euro), offsetting the decrease in on disbursements related to loans
with costs borne by Central Government.
Public Entities - New disbursements
(millions of euro; %) 30/06/2018 30/06/2017 Change (+ / -) (%) change
Local authorities 336 342 (5) -1.6%
Regions 142 23 119 n/s
Non-local Public Entities 28 17 11 63.6%
Loans with repayment costs charged to the government budget
160 282 (122) -43.1%
Advances and contributions 14 17 (3) -17.3%
Fondo Kyoto 4 1 3 n/s
Total Public Entities 685 682 3 0.4%
Lending to Public Entities contributed 142 million euro in interest income to CDP’s earnings for the first half of 2018, with
a 0.4% spread between interest-bearing assets and liabilities. In terms of gross income, this contribution remained
essentially stable in view of the low impact of commission income.
In terms of credit quality, the portfolio of loans to Public Entities showed essentially no deteriorated exposures.
International cooperation
The “International Cooperation” Business Area supports international development cooperation initiatives, under the
Separate Account, by managing financial products earmarked for partner developing countries and through both third-
party fund management and lending of CDP funds, in accordance with the provisions of Law 125/2014.
During the first half of 2018, the implementation of the regulatory changes introduced by Law 125/2014 and by the
subsequent amendments and additions to the Law, continued in close cooperation with the other Italian operators in the
Cooperation area. Within this context, the activities reported below were carried out in line with the existing
organisational set-up and the service agreements in place with the competent government authorities (MEF - Treasury
Department, the Ministry of Foreign Affairs and International Cooperation, the Italian Agency for Development
Cooperation and the Ministry of the Environment and Protection of the Land and Sea).
Within the scope of the agreement signed with the Ministry of the Economy and Finance, in the first half of 2018, CDP
managed the Revolving fund for development cooperation (totalling approximately 5 billion euro), also contributing,
together with the competent Administrations, to the optimization of the efficient use of resources not yet disbursed. In this
regard, after identifying an amount of around 0.3 billion euro to be used to finance new development cooperation
initiatives, procedures are now being implemented to release these resources.
With regard to the Fund established by the Ministry of the Environment and Protection of the Land and Sea (MATTM),
which is dedicated to the financing of green cooperation projects, CDP continued to carry out the activities envisaged in
the service agreement signed with the Ministry of the Environment and Protection of the Land and Sea for the
management of the fund. To date, out of the initial amount of 54 million euro of MATTM resources to be transferred, the
Ministry has transferred 23.3 million euro, of which 19.3 million euro made available in the first half of 2018.
30 2. Half-yearly report on operation

In the first half of 2018, subsequent to the signing of the related intergovernmental agreements, CDP entered into 2
finance agreements with the beneficiary countries of the Italian government cooperation programme, governing
sovereign development loans totalling 18 million euro from the Revolving fund for development cooperation.
International cooperation - New loan agreements
(millions of euro; %) 30/06/2018 30/06/2017 Change (+ / -) (%) change
Revolving Fund management 18 125 (107) -85.6%
Ministry of the Environment Fund management 0.3 2 (2) -84.0%
Total International cooperation 18 127 (109) -85.6%
As it is a revolving fund, in the first half of 2018 CDP managed all transactions connected with outstanding development
loans (approximately 350), overseeing the disbursement of around 43 million euro and ensuring the repayment of loans
granted in the past for a total of around 91 million euro.
CDP also disbursed loans from the MATTM Fund for around 0.3 million euro.
International cooperation - New disbursements
(millions of euro; %) 30/06/2018 30/06/2017 Change (+ / -) (%) change
Revolving Fund management 43 38 5 13.8%
Ministry of the Environment Fund management 0.3 2 (2) -84.0%
Total International cooperation 43 40 4 9.1%
In the same period, in implementation of bilateral debt restructuring agreements between the Italian government and the
governments of beneficiary partner developing countries, CDP finalised:
- the conversion of about 4.4 million euro of existing debt in new development cooperation projects through debt
swaps;
- the cancellation of around 1 million euro of outstanding debt payable by partner developing countries to Italy, via
debt cancelling operations.
It also provided:
- technical assistance to the Ministry of the Economy and Finance and ensured its ongoing participation in Paris
Club meetings;
- the collaboration and technical assistance envisaged in the Agreement signed by CDP, the Ministry of Foreign
Affairs and International Cooperation and the Italian Agency for Development Cooperation.
In the context of the new External Investment Plan (“EIP”) launched by the European Union at the end of 2017, CDP,
together with the other partners involved - including the European Investment Bank (“EIB”), the African Development
Bank (“AfDB”), the Agence Française de Développement (“AfD”), the Agencia Española de Cooperación Internacional
para el Desarrollo (“AECID”) and the International Fund for Agricultural Development (“IFAD”) - submitted the
documentation of all the first quarter investments programmes to the Commission; the initiatives, which are dedicated to
micro, small and medium enterprises, sustainable energy and connectivity, sustainable agriculture, agro-industrial and
rural entrepreneurs and sustainable cities, were discussed at the first technical committees held in April and May 2018.
The final decision of the Member States is expected within the end of 2018, together with the signing of the related
agreements by the European Commission and by the European and international development Financial Institutions
(FIs).
After receiving accreditation as an observer at the Green Climate Fund (“GCF”) in 2017 (a preparatory step to obtaining
financial resources for projects aimed at countering and managing climate change, to be implemented in partner
developing countries), in the first half of 2018 CDP officially entered the GCF accreditation process to gain access to the
funding.
On 4 May 2018, CDP also signed a bilateral cooperation agreement with the MATTM, which will create the basis for the
launch of the “Climate and Sustainable Development Italian Platform” - dedicated to funding the climate change
mitigation and adaption projects and programmes promoted jointly by the MATTM and CDP.
Infrastructure
The "Infrastructure" Business Area is responsible for: i) granting loans to counterparties (public or private) operating in
the domestic territory in the construction, water, waste, social infrastructure, transport, energy/utilities and
31
Half-yearly Financial Report 2018
4. Performance of the CDP Group

telecommunications sectors, or also in other sectors under “Project Financing” arrangements; ii) managing relations with
corporate clients, public-law bodies and debt and equity infrastructure funds operating in their respective areas of
competence; and iii) promoting the implementation and financing of infrastructure projects by providing assistance and
advice to the Public Administration, also in accordance with the company’s role of National Promotional Institution.
Regarding this last point, a new business unit has been set up in the Infrastructure Business Area to ensure that support
is provided to the Public Administration systematically instead of on an occasional basis, as was the case previously. The
aim is to facilitate the development of projects or works programmes in the infrastructure sector, particularly those at
local level. In particular, the objective of this new initiative is to bring the demand and supply of infrastructural projects
closer by creating and making available standardised public-private partnership schemes (PPP), aimed at implementing
projects that are sustainable, balanced in terms of the allocation of risks and financeable according to international
standards. The initiative, which became operational in January 2018, is listed as a priority intervention in the 2016-2020
Business plan.
In the first half of 2018, lending agreements were concluded mainly to finance: i) the renewable energy sector, to build
new plants and to consolidate and improve the efficiency of the industry players, ii) investments in sustainable mobility, to
purchase new trains, mainly for use by commuters, iii) completion of investments in the motorway network.
Balance sheet (including assets, liabilities and commitments) and income statement figures at 30 June 2018, reclassified
by business, are shown in the table below, together with key performance indicators.
Infrastructure - Highlights
(millions of euro; %) 30/06/2018
Balance Sheet
Loans 7,034
Commitments 5,470
Reclassified income statement
Net Interest income 37
Gross income 51
Indicators
Net non-performing loans/Net loans to customers and banks 0.4%
Net adjustments to loans/Net exposure -0.0002%
Spread on interest-bearing assets and liabilities 1.1%
At 30 June 2018, the stock of loans totalled 7.0 billion euro, including IFRS adjustments, decreasing slightly on the 2017
year-end figure. As of the same date, loans, including commitments to lend, totalled 12.5 billion euro, down by
approximately 7% from the end of 2017.
Infrastructure - Stock loan
(millions of euro; %) 30/06/2018 31/12/2017 Change (+ / -) (%) change
Corporate/project finance 5,841 5,956 (114) -1.9%
Securities 1,575 1,381 194 14.0%
Total amounts disbursed or in repayment 7,416 7,336 80 1.1%
IFRS adjustments (382) (215) (167) 77.8%
Total loans 7,034 7,121 (88) -1.2%
Commitments 5,470 6,276 (806) -12.8%
Total loans (including commitments) 12,504 13,397 (893) -6.7%
In the first half of 2018, 8 new loan agreements were signed for a total of 1.6 billion euro, marking an increase of around
18% on the volumes for the same period of 2017. Lending mainly targeted the transport sectors (railways and
motorways) and the renewable energy sector.
32 2. Half-yearly report on operation
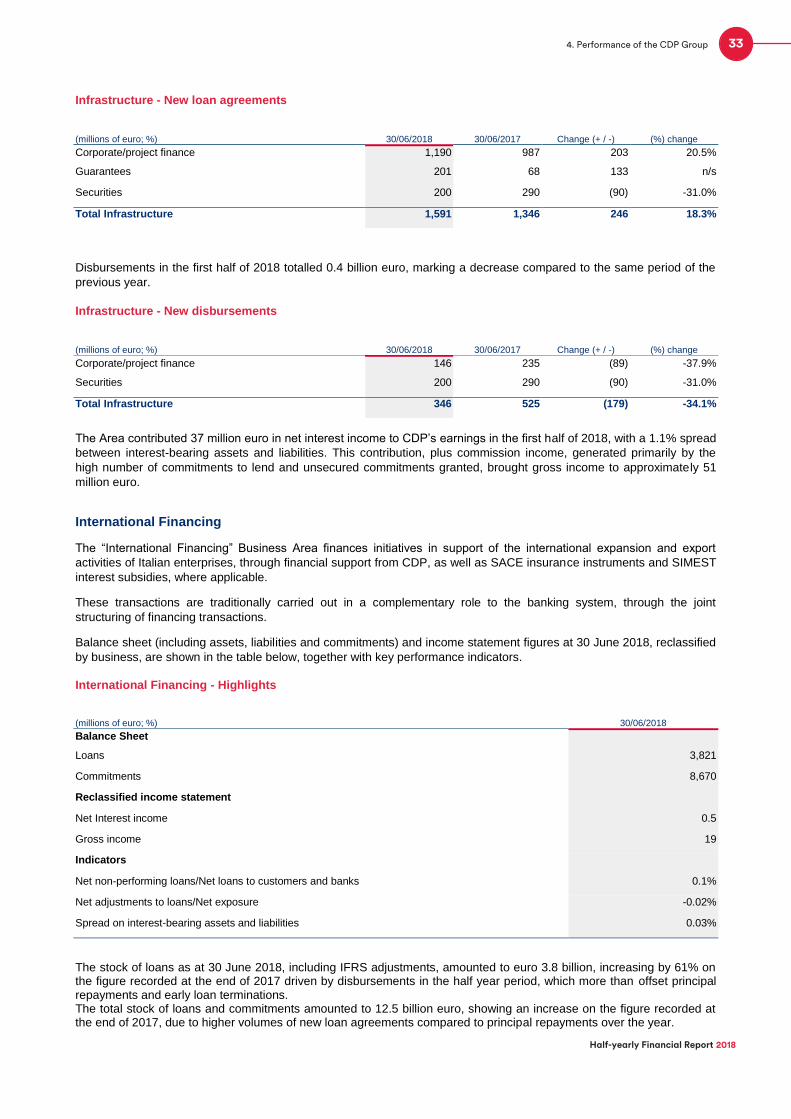
Infrastructure - New loan agreements
(millions of euro; %) 30/06/2018 30/06/2017 Change (+ / -) (%) change
Corporate/project finance 1,190 987 203 20.5%
Guarantees 201 68 133 n/s
Securities 200 290 (90) -31.0%
Total Infrastructure 1,591 1,346 246 18.3%
Disbursements in the first half of 2018 totalled 0.4 billion euro, marking a decrease compared to the same period of the
previous year.
Infrastructure - New disbursements
(millions of euro; %) 30/06/2018 30/06/2017 Change (+ / -) (%) change
Corporate/project finance 146 235 (89) -37.9%
Securities 200 290 (90) -31.0%
Total Infrastructure 346 525 (179) -34.1%
The Area contributed 37 million euro in net interest income to CDP’s earnings in the first half of 2018, with a 1.1% spread
between interest-bearing assets and liabilities. This contribution, plus commission income, generated primarily by the
high number of commitments to lend and unsecured commitments granted, brought gross income to approximately 51
million euro.
International Financing
The “International Financing” Business Area finances initiatives in support of the international expansion and export
activities of Italian enterprises, through financial support from CDP, as well as SACE insurance instruments and SIMEST
interest subsidies, where applicable.
These transactions are traditionally carried out in a complementary role to the banking system, through the joint
structuring of financing transactions.
Balance sheet (including assets, liabilities and commitments) and income statement figures at 30 June 2018, reclassified
by business, are shown in the table below, together with key performance indicators.
International Financing - Highlights
(millions of euro; %) 30/06/2018
Balance Sheet
Loans 3,821
Commitments 8,670
Reclassified income statement
Net Interest income 0.5
Gross income 19
Indicators
Net non-performing loans/Net loans to customers and banks 0.1%
Net adjustments to loans/Net exposure -0.02%
Spread on interest-bearing assets and liabilities 0.03%
The stock of loans as at 30 June 2018, including IFRS adjustments, amounted to euro 3.8 billion, increasing by 61% on the figure recorded at the end of 2017 driven by disbursements in the half year period, which more than offset principal repayments and early loan terminations. The total stock of loans and commitments amounted to 12.5 billion euro, showing an increase on the figure recorded at the end of 2017, due to higher volumes of new loan agreements compared to principal repayments over the year.
33
Half-yearly Financial Report 2018
4. Performance of the CDP Group
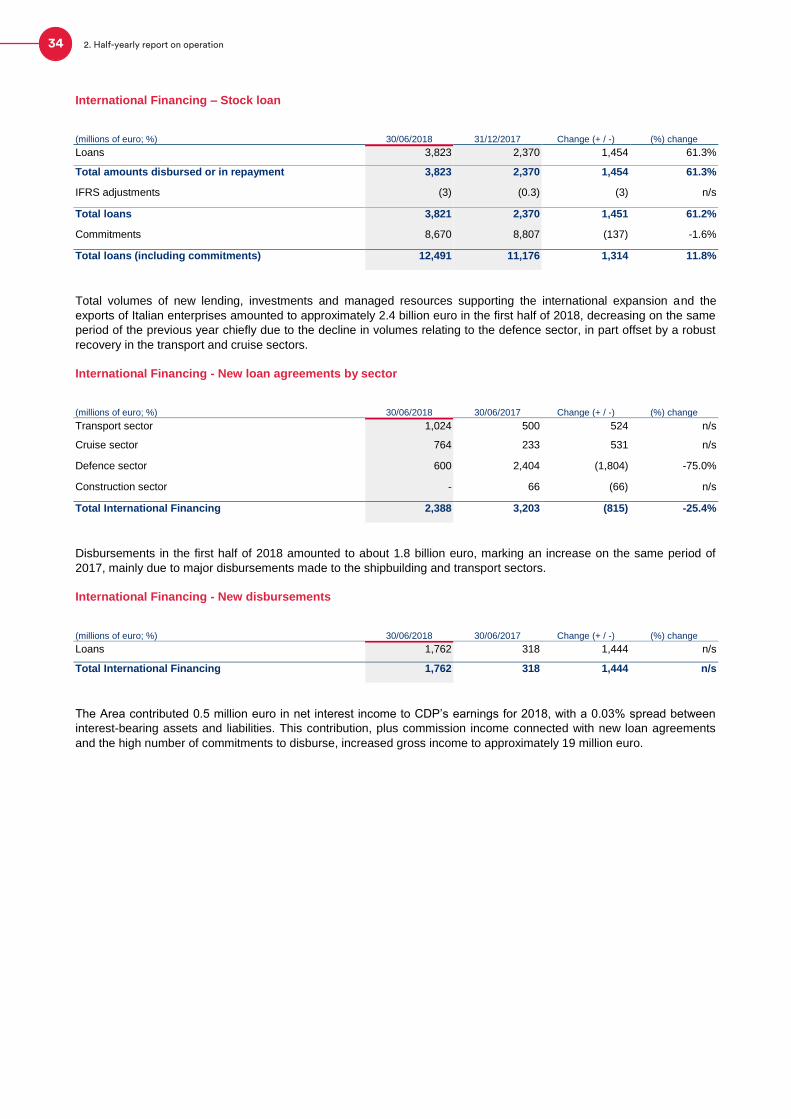
International Financing – Stock loan
(millions of euro; %) 30/06/2018 31/12/2017 Change (+ / -) (%) change
Loans 3,823 2,370 1,454 61.3%
Total amounts disbursed or in repayment 3,823 2,370 1,454 61.3%
IFRS adjustments (3) (0.3) (3) n/s
Total loans 3,821 2,370 1,451 61.2%
Commitments 8,670 8,807 (137) -1.6%
Total loans (including commitments) 12,491 11,176 1,314 11.8%
Total volumes of new lending, investments and managed resources supporting the international expansion and the
exports of Italian enterprises amounted to approximately 2.4 billion euro in the first half of 2018, decreasing on the same
period of the previous year chiefly due to the decline in volumes relating to the defence sector, in part offset by a robust
recovery in the transport and cruise sectors.
International Financing - New loan agreements by sector
(millions of euro; %) 30/06/2018 30/06/2017 Change (+ / -) (%) change
Transport sector 1,024 500 524 n/s
Cruise sector 764 233 531 n/s
Defence sector 600 2,404 (1,804) -75.0%
Construction sector - 66 (66) n/s
Total International Financing 2,388 3,203 (815) -25.4%
Disbursements in the first half of 2018 amounted to about 1.8 billion euro, marking an increase on the same period of
2017, mainly due to major disbursements made to the shipbuilding and transport sectors.
International Financing - New disbursements
(millions of euro; %) 30/06/2018 30/06/2017 Change (+ / -) (%) change
Loans 1,762 318 1,444 n/s
Total International Financing 1,762 318 1,444 n/s
The Area contributed 0.5 million euro in net interest income to CDP’s earnings for 2018, with a 0.03% spread between
interest-bearing assets and liabilities. This contribution, plus commission income connected with new loan agreements
and the high number of commitments to disburse, increased gross income to approximately 19 million euro.
34 2. Half-yearly report on operation

Enterprises and Financial Institutions
The “Enterprises and Financial Institutions” Business Area focus mainly on granting different forms of credit to
enterprises, either with the intermediation of financial institutions or directly (in the latter case, excluding enterprises
operating in infrastructure sectors) and on operations supporting international expansion.
Enterprises and Financial Institutions - Highlights
(millions of euro; %) 30/06/2018
Balance Sheet
Loans 14,820
Amounts to distribute 28
Commitments 1,534
Reclassified income statement
Net Interest income 36
Gross income 39
Indicators
Net non-performing loans/Net loans to customers and banks 0.9%
Net adjustments to loans/Net exposure -0.04%
Spread on interest-bearing assets and liabilities 0.5%
At 30 June 2018, the total stock of loans totalled 14.8 billion euro, including IFRS adjustments. Additionally, amounts to
be disbursed totalled to 0.03 billion euro and commitments amounted to 1.5 billion euro.
The Area contributed 36 million euro in net interest income to CDP’s earnings for 2018, with a 0.5% spread between
interest-bearing assets and liabilities. Commission income brought gross income to 39 million euro.
Enterprises
The “Enterprises” Business Area mission is to ensure direct financing directly and in any technical form - under ordinary
account or separate account based on the applicable provisions - for initiatives promoted by enterprises operating in the
following sectors: industrial, agri-food, automotive, chemical and pharmaceutical, biochemical, publishing, manufacturing,
mechanical and instrumental, IT, electronics, commerce, mass distribution, logistics, defence and aerospace, services,
construction, real estate, media, shipping, iron and steel, metallurgy and metalworking, concrete, paper, glass, wood,
plastic and rubber, raw materials and by-products, culture, tourism, fashion and luxury.
In the first half of 2018, the Business Area also continued the origination activities in key sectors with the objective to
increase managed with a view to increasing the diversification of the loans portfolio. Lending activities were carried out in
cooperation both with the banking channel, via financing transactions, and institutional investors, by taking part in bond
issues.
In the same period, the first two transactions of the EFSI Thematic Investment Platform concerning Corporate Projects
were subscribed, for a total of 45 million euro. The initiative, which was developed within the framework of the “Juncker
Plan”, involves supporting, together with the EIB, the investment plans of Italian companies (mainly domestic Mid-caps).
Balance sheet (including assets, liabilities and commitments) and income statement figures at 30 June 2018, reclassified
by business, are shown in the table below, together with key performance indicators.
35
Half-yearly Financial Report 2018
4. Performance of the CDP Group
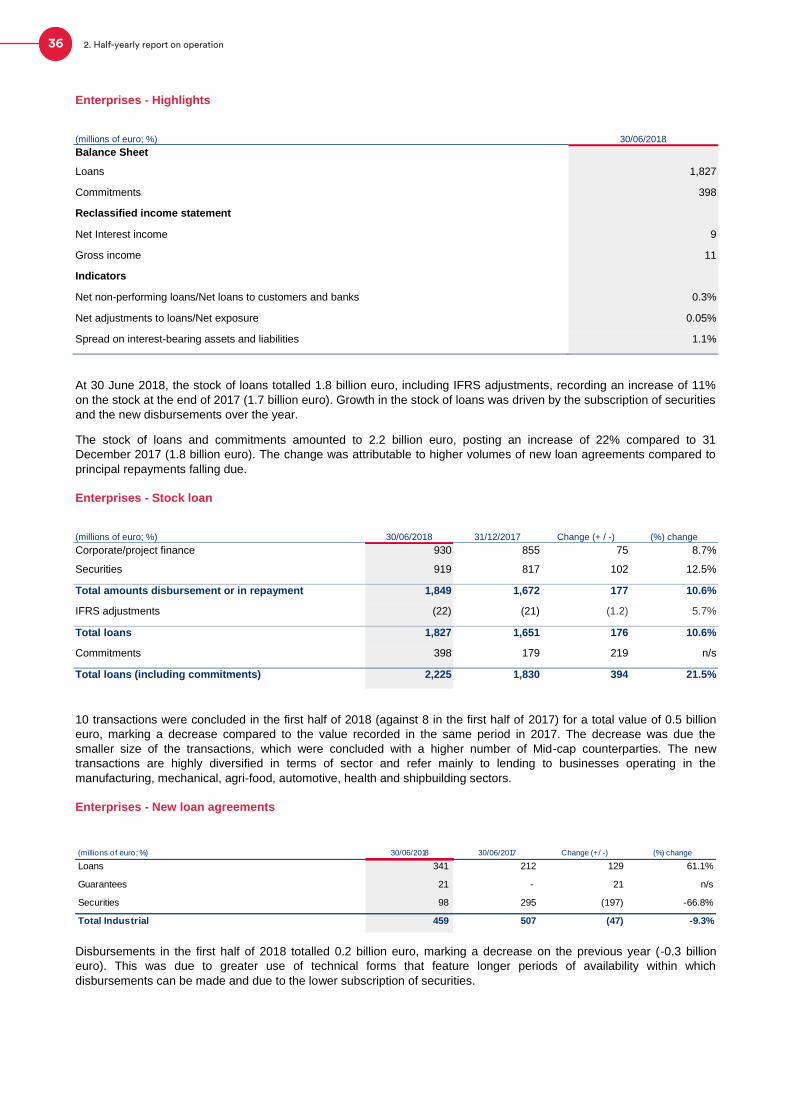
Enterprises - Highlights
(millions of euro; %) 30/06/2018
Balance Sheet
Loans 1,827
Commitments 398
Reclassified income statement
Net Interest income 9
Gross income 11
Indicators
Net non-performing loans/Net loans to customers and banks 0.3%
Net adjustments to loans/Net exposure 0.05%
Spread on interest-bearing assets and liabilities 1.1%
At 30 June 2018, the stock of loans totalled 1.8 billion euro, including IFRS adjustments, recording an increase of 11%
on the stock at the end of 2017 (1.7 billion euro). Growth in the stock of loans was driven by the subscription of securities
and the new disbursements over the year.
The stock of loans and commitments amounted to 2.2 billion euro, posting an increase of 22% compared to 31
December 2017 (1.8 billion euro). The change was attributable to higher volumes of new loan agreements compared to
principal repayments falling due.
Enterprises - Stock loan
(millions of euro; %) 30/06/2018 31/12/2017 Change (+ / -) (%) change
Corporate/project finance 930 855 75 8.7%
Securities 919 817 102 12.5%
Total amounts disbursement or in repayment 1,849 1,672 177 10.6%
IFRS adjustments (22) (21) (1.2) 5.7%
Total loans 1,827 1,651 176 10.6%
Commitments 398 179 219 n/s
Total loans (including commitments) 2,225 1,830 394 21.5%
10 transactions were concluded in the first half of 2018 (against 8 in the first half of 2017) for a total value of 0.5 billion
euro, marking a decrease compared to the value recorded in the same period in 2017. The decrease was due the
smaller size of the transactions, which were concluded with a higher number of Mid-cap counterparties. The new
transactions are highly diversified in terms of sector and refer mainly to lending to businesses operating in the
manufacturing, mechanical, agri-food, automotive, health and shipbuilding sectors.
Enterprises - New loan agreements
Disbursements in the first half of 2018 totalled 0.2 billion euro, marking a decrease on the previous year (-0.3 billion
euro). This was due to greater use of technical forms that feature longer periods of availability within which
disbursements can be made and due to the lower subscription of securities.
(millions of euro; %) 30/06/2018 30/06/2017 Change (+ / -) (%) change
Loans 341 212 129 61.1%
Guarantees 21 - 21 n/s
Securities 98 295 (197) -66.8%
Total Industrial 459 507 (47) -9.3%
36 2. Half-yearly report on operation

Enterprises - New disbursements
(millions of euro; %) 30/06/2018 30/06/2017 Change (+ / -) (%) change
Loans 103 190 (87) -45.8%
Securities 98 295 (197) -66.8%
Total Industrial 201 485 (284) -58.6%
The Area contributed 9 million euro in net interest income to CDP’s earnings for the first half of 2018, with a 1.1% spread
between interest-bearing assets and liabilities. Commission income brought gross income to 11 million euro.
Financial institutions
The "Financial Institutions" Business Area acts in support of the country’s economy and small and medium enterprises,
in synergy with the financial system. Alongside consolidated operations (management of subsidised credit instruments
introduced by specific laws and regulations and liquidity instruments for banks, primarily to facilitate access to credit for
enterprises and support reconstruction in the wake of natural disasters), from 2017 the Business Area has also focussed,
on the one hand, on developing tools designed to help financial institutions optimise their use of capital in order to
encourage new lending to enterprises and, on the other, on developing initiatives aimed at supporting access to forms of
Alternative Financing instruments.
Regarding traditional operations, the granting of subsidised loans primarily draws on CDP funds with state interest
subsidies (the Revolving Fund to support enterprises and research investment - FRI and the Capital Goods Fund), while
also taking advantage, to a residual extent, of Central Government funding in the form of capital grants (Territorial
Agreements and Area Contracts, Low Environmental Impact Vehicles Fund) or other subsidised financing (Kyoto Fund).
Funds were also earmarked for the banking industry i) for loans to Enterprises (SME, MIDCAP, and Networks & Supply
Chain funds), ii) to assist in the reconstruction and economic recovery of areas hit by natural disasters (2012 Earthquake,
Natural Disasters and Central Italy Earthquake funds) and, iii) to support the residential real estate market (Housing and
Banking Covered Bonds/RMBS funds).
On 12 January and 18 April 2018 respectively, CDP entered into the following agreements with the Council of Europe
Development Bank (CEB): i) a loan agreement of 350 million euro to support the operations of the Central Italy
Earthquake Fund and ii) a loan agreement of 290 million euro to support the Capital Goods Fund. The use of the CEB
loans will enable CDP to apply better financing terms to the benefit, firstly, of the Italian government (which backs the
reconstruction loans) and, secondly, of SMEs that invest in capital goods.
The operations started last year for direct lending to financial institutions are continuing, whether through loans or
through the subscription of bonds, aimed at meeting the funding needs of specialised banks and non-banking financial
intermediaries.
With regard to innovative business lines, the Alternative Financing business line was also consolidated in the first half of
2018. In particular, in the first few months of the year, an investment of 20 million euro was concluded in the alternative
fund “Hedge Invest CrescItalia PMI Fund”, specialized in providing medium-/long-term loans to small and medium Italian
enterprises - also by subscribing mini bonds - using resources of the SME Guarantee Fund provided for in Law no.
662/96 (SME Fund).
Lastly, with the aim of promoting further Alternative Financing initiatives, CDP is working together with ELITE and other
institutional partners to develop “basket bond” transactions, i.e. bonds backed by a basket of mini-bonds issued by
medium-sized Italian enterprises, which can benefit from guarantees or other public contributions, both national and
European.
Within the framework of the EFSI Thematic Investment Platform for Italian SMEs, on 29 March 2018 CDP signed a
second agreement with the SME Fund for the issue by CDP of an 80% counter-guarantee on a portfolio of new
guarantees issued in favour of enterprises in the creative-cultural sectors, for a maximum amount of 200 million euro and
with a 16-million-euro cap on losses. In that operation, CDP benefits from a free 70% counter-guarantee provided by the
EIF, via funds of the European Commission’s “Creative Europe” programme.
These initiatives are strategically important since their aim is to raise new resources for the SME Fund - the main tool
used at national level to support access to credit for SMEs - thus reducing the need for public funds to finance this tool.
On 15 March 2018, CDP entered into an agreement with the Emilia-Romagna Region to allocate resources for the
development of the guarantee platform in support of the regional economy. CDP’s intervention essentially consists in the
issuance of an 80% counter-guarantee, with a 10% cap on losses, on the new portfolios of guarantees issued by Confidi
in favour of SMEs operating in Emilia-Romagna, for a maximum amount of around 120 million euro.
37
Half-yearly Financial Report 2018
4. Performance of the CDP Group

On 19 June 2018, CDP signed a loan agreement with the Ministry for Agricultural, Food and Forestry Policies (MiPAAF)
to launch a guarantee initiative similar to the previous one, aimed specifically at ensuring access to credit for businesses
operating in the olive-growing/oil production sector. Thanks to the financial contribution of the MiPAAF, CDP will support
banks and Confidi in lending to olive oil producer organisations and the related associations.
In terms of subsidised credit, having regard to the FRI, activities continued in relation to the following initiatives:
Sustainable Growth Fund (Sustainable Industry and Digital Agenda measures) - in addition to the re-opening of
the scheme as of 8 January 2018, pursuant to the decree issued by the Ministry of Economic Development on
18 October 2017, multiple agreements were also finalised for a total of around 144 million euro of subsidised
loans granted by CDP;
“Social Enterprise” measures - launched at the end of 2017, in relation to which contracting activities by the
participating banks continued in the first half of 2018;
“Supply Chain and Cluster Contracts” measures - for which the tender procedure was opened on 29 January
2018 and in relation to which CDP followed the contracting activities of the participating banks in the first half of
2018.
Balance sheet (including assets, liabilities and commitments) and income statement figures at 30 June 2018, reclassified
by business, are shown in the table below, together with key performance indicators.
Financial Institutions - Highlights
(millions of euro; %) 30/06/2018
Balance Sheet
Loans 12,994
Amounts to distribute 28
Commitments 1,136
Reclassified income statement
Net Interest income 27
Gross income 28
Indicators
Net non-performing loans/Net loans to customers and banks 1.0%
Net adjustments to loans/Net exposure -0.05%
Spread on interest-bearing assets and liabilities 0.4%
As regards the loan portfolio of the Business Area, the stock of loans at 30 June 2018, including IFRS adjustments,
amounted to 13 billion euro, down by 7% from the end of 2017 due to lower disbursements during the year compared to
loan repayments plus loans extinguished on the basis of the figures reported by financial institutions (mainly in relation to
the SME Fund). Specifically, the breakdown of the stock of loans, excluding IFRS adjustments, is as follows:
i) 38% related to reconstruction loans following natural disasters, amounting to 5.0 billion euro;
ii) 34% related to loans under Enterprises funds, amounting to 4.5 billion euro;
iii) 13% related to transactions in favour of financial institutions, amounting to 1.7 billion euro;
iv) the remaining 15% related to other products, including loans to support the residential sector and loans drawing on
the FRI;
The total stock of loans and commitments amounted to 14.1 billion euro, marking a decrease on the figure recorded at
the end of 2017, mainly due to loan repayments plus loans extinguished on the basis of the figures reported by financial
institutions.
38 2. Half-yearly report on operation
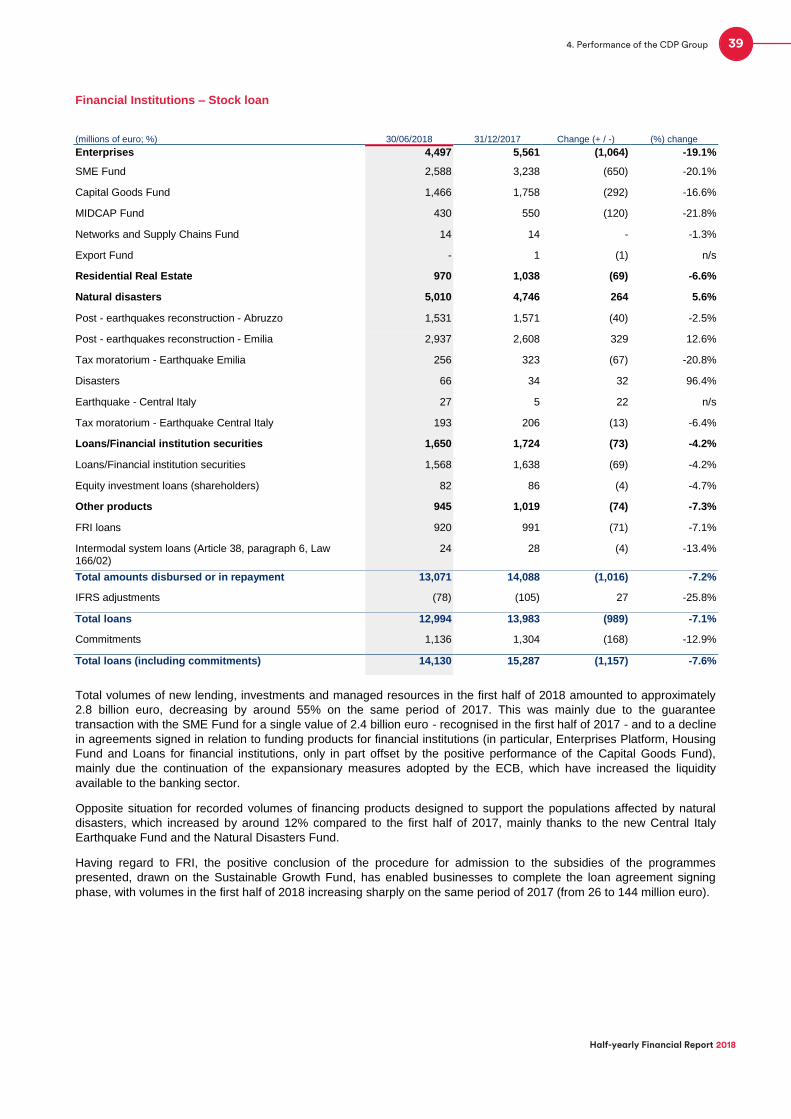
Financial Institutions – Stock loan
(millions of euro; %) 30/06/2018 31/12/2017 Change (+ / -) (%) change
Enterprises 4,497 5,561 (1,064) -19.1%
SME Fund 2,588 3,238 (650) -20.1%
Capital Goods Fund 1,466 1,758 (292) -16.6%
MIDCAP Fund 430 550 (120) -21.8%
Networks and Supply Chains Fund 14 14 - -1.3%
Export Fund - 1 (1) n/s
Residential Real Estate 970 1,038 (69) -6.6%
Natural disasters 5,010 4,746 264 5.6%
Post - earthquakes reconstruction - Abruzzo 1,531 1,571 (40) -2.5%
Post - earthquakes reconstruction - Emilia 2,937 2,608 329 12.6%
Tax moratorium - Earthquake Emilia 256 323 (67) -20.8%
Disasters 66 34 32 96.4%
Earthquake - Central Italy 27 5 22 n/s
Tax moratorium - Earthquake Central Italy 193 206 (13) -6.4%
Loans/Financial institution securities 1,650 1,724 (73) -4.2%
Loans/Financial institution securities 1,568 1,638 (69) -4.2%
Equity investment loans (shareholders) 82 86 (4) -4.7%
Other products 945 1,019 (74) -7.3%
FRI loans 920 991 (71) -7.1%
Intermodal system loans (Article 38, paragraph 6, Law 166/02)
24 28 (4) -13.4%
Total amounts disbursed or in repayment 13,071 14,088 (1,016) -7.2%
IFRS adjustments (78) (105) 27 -25.8%
Total loans 12,994 13,983 (989) -7.1%
Commitments 1,136 1,304 (168) -12.9%
Total loans (including commitments) 14,130 15,287 (1,157) -7.6%
Total volumes of new lending, investments and managed resources in the first half of 2018 amounted to approximately
2.8 billion euro, decreasing by around 55% on the same period of 2017. This was mainly due to the guarantee
transaction with the SME Fund for a single value of 2.4 billion euro - recognised in the first half of 2017 - and to a decline
in agreements signed in relation to funding products for financial institutions (in particular, Enterprises Platform, Housing
Fund and Loans for financial institutions, only in part offset by the positive performance of the Capital Goods Fund),
mainly due the continuation of the expansionary measures adopted by the ECB, which have increased the liquidity
available to the banking sector.
Opposite situation for recorded volumes of financing products designed to support the populations affected by natural
disasters, which increased by around 12% compared to the first half of 2017, mainly thanks to the new Central Italy
Earthquake Fund and the Natural Disasters Fund.
Having regard to FRI, the positive conclusion of the procedure for admission to the subsidies of the programmes
presented, drawn on the Sustainable Growth Fund, has enabled businesses to complete the loan agreement signing
phase, with volumes in the first half of 2018 increasing sharply on the same period of 2017 (from 26 to 144 million euro).
39
Half-yearly Financial Report 2018
4. Performance of the CDP Group

Financial Institutions - New loan agreements
(millions of euro; %) 30/06/2018 30/06/2017 Change (+ / -) (%) change
Enterprises 215 350 (135) -38.5%
SME Fund 110 283 (172) -61.0%
Capital Goods Fund 100 51 49 95.1%
MIDCAP Fund 5 17 (12) -70.9%
Networks and Supply Chains Fund 1 - 1 n/s
Residential Real Estate 2 190 (188) -98.7%
Housing Fund 2 190 (188) -98.7%
Natural disasters 434 387 46 12.0%
Post-earthquake 2012 reconstruction 378 381 (4) -1.0%
Disasters 33 6 28 n/s
Earthquake - Central Italy 22 - 22 n/s
Loans/Financial institution securities 1,700 2,740 (1,040) -38.0%
Loans/Financial institution securities - 1,240 (1,240) n/s
Equity investment loans (shareholders) 1,700 1,500 200 13.3%
Capital optimisation tools 257 2,400 (2,143) -89.3%
Community funds 257 2,400 (2,143) -89.3%
Other products 170 54 116 n/s
FRI loans 144 26 118 n/s
Disbursements/agreements third party funds 26 28 (3) -9.1%
Total Financial Institutions 2,778 6,122 (3,343) -54.6%
In relation to the loan agreements above, disbursements totalling around 1 billion euro were made in the first half of 2018
thanks to draw-downs by financial institutions on the liquidity funds supporting the communities affected by the natural
disasters. The decrease in disbursements (-62% compared to the same period of 2017) is mainly due to the decline in
operations linked to funds designed for the residential sector, enterprises and direct funding to financial institutions; the
decrease in the FRI (-56%) is instead due to the decline in agreements signed in 2017.
40 2. Half-yearly report on operation

Financial Institutions - New disbursements
(millions of euro; %) 30/06/2018 30/06/2017 Change (+ / -) (%) change
Enterprises 215 350 (135) -38.5%
SME Fund 110 283 (172) -61.0%
Capital Goods Fund 100 51 49 95.1%
MIDCAP Fund 5 17 (12) -70.9%
Networks and Supply Chains Fund 1 - 1 n/s
Residential Real Estate 2 190 (188) -98.7%
Housing Fund 2 190 (188) -98.7%
Natural disasters 434 387 46 12.0%
Post-earthquake 2012 reconstruction 378 381 (4) -1.0%
Disasters 33 6 28 n/s
Earthquake - Central Italy 22 - 22 n/s
Loans/Financial institution securities 320 1,680 (1,360) -81.0%
Loans/Financial institution securities 255 960 (705) -73.4%
Equity investment loans (shareholders) 65 720 (655) -91.0%
Other products 69 126 (57) -45.0%
FRI loans 42 97 (55) -56.4%
Disbursements/agreements third party funds 26 28 (3) -9.1%
Fondo Kyoto 1 1 - 72.0%
Total Financial Institutions 1,040 2,733 (1,693) -61.9%
The “Financial Institutions” Business Area contributed 27 million euro in net interest income to CDP’s earnings in the f irst
half of 2018, with a 0.4% spread between interest-bearing assets and liabilities. That contribution, plus commission
income, brought gross income to 28 million euro.
41
Half-yearly Financial Report 2018
4. Performance of the CDP Group
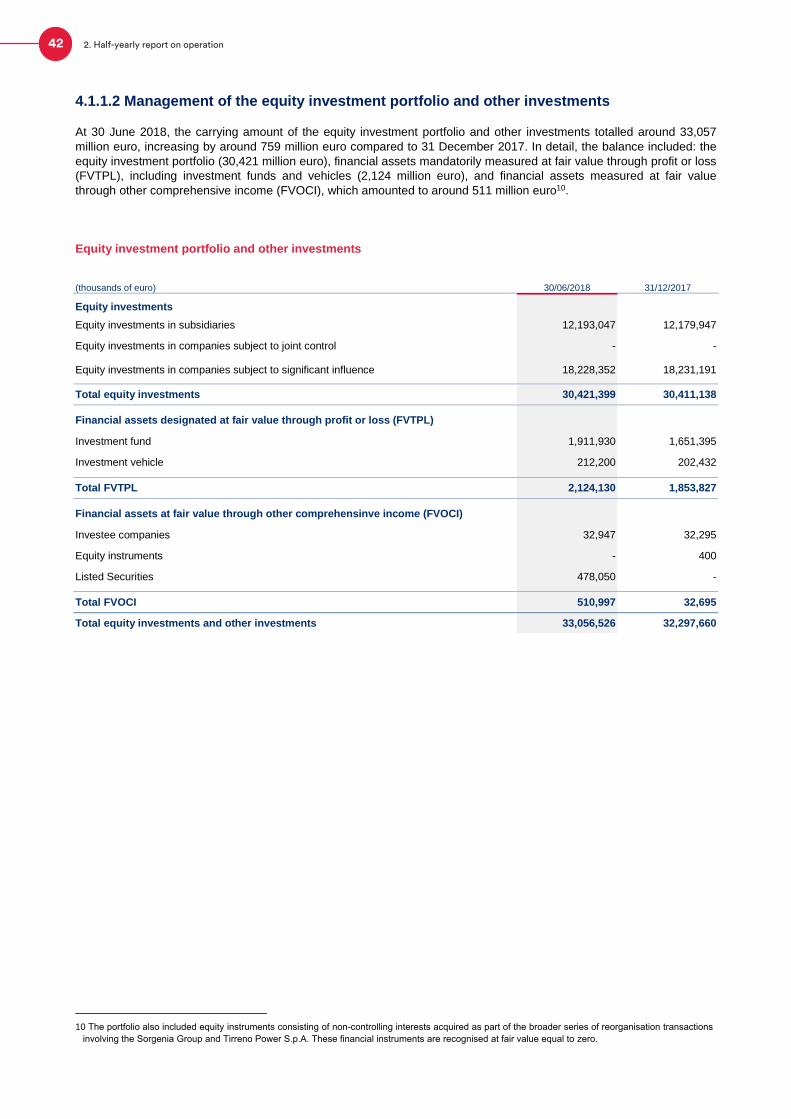
4.1.1.2 Management of the equity investment portfolio and other investments
At 30 June 2018, the carrying amount of the equity investment portfolio and other investments totalled around 33,057
million euro, increasing by around 759 million euro compared to 31 December 2017. In detail, the balance included: the
equity investment portfolio (30,421 million euro), financial assets mandatorily measured at fair value through profit or loss
(FVTPL), including investment funds and vehicles (2,124 million euro), and financial assets measured at fair value
through other comprehensive income (FVOCI), which amounted to around 511 million euro10.
Equity investment portfolio and other investments
(thousands of euro) 30/06/2018 31/12/2017
Equity investments
Equity investments in subsidiaries 12,193,047 12,179,947
Equity investments in companies subject to joint control - -
Equity investments in companies subject to significant influence 18,228,352 18,231,191
Total equity investments 30,421,399 30,411,138
Financial assets designated at fair value through profit or loss (FVTPL)
Investment fund 1,911,930 1,651,395
Investment vehicle 212,200 202,432
Total FVTPL 2,124,130 1,853,827
Financial assets at fair value through other comprehensinve income (FVOCI)
Investee companies 32,947 32,295
Equity instruments - 400
Listed Securities 478,050 -
Total FVOCI 510,997 32,695
Total equity investments and other investments 33,056,526 32,297,660
10 The portfolio also included equity instruments consisting of non-controlling interests acquired as part of the broader series of reorganisation transactions
involving the Sorgenia Group and Tirreno Power S.p.A. These financial instruments are recognised at fair value equal to zero.
42 2. Half-yearly report on operation

Equity investments
At 30 June 2018, the carrying amount of the equity investments portfolio showed an increase of approximately 10 million
euro compared to 31 December 2017.
Equity investments
31/12/2017 Changes 30/06/2018
(thousands of euro) % holding
Carrying amount
Transfers From
inv./disinv. From
measurement % holding Carrying amount
A. Listed companies
Equity investments in companies subject to significant influence
18,211,890 - - - 18,211,890
1. Eni S.p.A. 25.76% 15,281,632 - - - 25.76% 15,281,632
2. Poste Italiane S.p.A. 35.00% 2,930,258 - - - 35.00% 2,930,258
B. Unlisted companies
Equity investments in subsidiaries 12,179,947 - 13,100 - 12,193,047
3. SACE S.p.A. 100.00% 4,584,074 - - - 100.00% 4,584,074
4. CDP Reti S.p.A. 59.10% 2,017,339 - - - 59.10% 2,017,339
5. CDP Equity S.p.A. 97.13% 3,419,512 - - - 97.13% 3,419,512
6. Fintecna S.p.A. 100.00% 1,864,000 - - - 100.00% 1,864,000
7. CDP Immobiliare S.r.l. 100.00% 293,622 - 13,100 - 100.00% 306,722
8. CDP Investimenti SGR S.p.A. 70.00% 1,400 - - - 70.00% 1,400
Equity investments in companies subject to significant influence
19,301 400 (3,622) 384 16,463
9. QuattroR SGR S.p.A. 40.00% 400 400 - - 40.00% 800
10. Fondo Italiano d'Investimento SGR S.p.A. 43.00% 5,848 - - - 43.00% 5,848
11. Galaxy S.à r.l SICAR (in liquidation) 40.00% 3,665 - (4,049) 384 0.00% -
12. Europrogetti & Finanza S.r.l. in liquidazione 31.80% - - - - 31.80% -
13. FSI SGR S.p.A. 39.00% 1,170 - - - 39.00% 1,170
14. Elite S.p.A. 15.00% 8,000 - 427 - 15.00% 8,427
15. Risparmio Holding S.p.A 20.00% 218 - - - 20.00% 218
Total 30,411,138 400 9,478 384 30,421,399
The following transactions performed in the first half of 2018 had an impact on the portfolio’s carrying value:
the conversion of the equity instruments of QuattroR SGR into shares - on 26 March 2018. At 30 June 2018, the
share capital structure was as follows: 40% held by CDP and 60% held by the managers identified to manage the
initiative, with no change compared to 31 December 2017;
the completion of the liquidation of Galaxy S.à r.l. SICAR (in liquidation), as approved by the Shareholders’ Meeting
on 25 June 2018, with distribution of a total of 4 million euro, of which 3.7 million euro when the company has been
put into liquidation and an additional 384 thousand euro in the liquidation completion stage;
CDP’s injection of 13.1 million euro of new capital in CDP Immobiliare, to cover the financial needs of CDP
Immobiliare and its joint ventures.
Dividends received in the first half of 2018 totalled approximately 811 million euro and were mainly connected with the
equity investments in ENI (374 million euro), SACE (150 million euro), CDP RETI (83 million euro), Fintecna (11 million
euro), and Poste Italiane (192 million euro).
43
Half-yearly Financial Report 2018
4. Performance of the CDP Group
the development, international expansion, and growth in size of Italian SMEs and start-ups;
investments in the sustainable living sector, in the development of public real estate assets, in tourism-hospitality
real estate, in the residential rental sector with next generation services, in supporting innovation and training and in
property rental to the Public Administration;
investments in physical and social infrastructures:
– at the local level, in partnership with local authorities and with shareholder foundations. In this context, CDP
also promotes public-private partnership (PPP) projects;
– at the national level, focusing on major works in partnership with Italian and foreign institutional investors;
– at the international level, in support of infrastructure and network projects involving several countries, not
only within the European Union, in cooperation with European institutions and foreign counterpart
organisations (such as CDC, KfW and the EIB).
At 30 June 2018, the investment portfolio in investment funds and investment vehicles totalled around 2,124 million euro,
up by around 270 million euro (+14.6%) compared to 31 December 2017.
44 2. Half-yearly report on operation
Other investments: mutual funds and investment vehicles
CDP is a subscriber to investment funds and investment vehicles with the aim of facilitating:

Investment funds and investment vehicles
31/12/2017 Changes 30/06/2018
(thousands of euro)
Investment sector
% holding Carrying amount
From inv./disinv.
From measurement
Transfers % holding Carrying amount
Residual commitment
A. Investment vehicles 202,432 5,210 4,558 - 212,200 204,953
1. Inframed Infrastructure societèpar actions simplifièe à capital variable (Fondo Inframed)
Infrastructure
- A units 38.92% 131,200 - (6,700) - 38.92% 124,500 26,611
- B units - - 4 1 - 0.0012% 5 1
2. 2020 European Fund forEnergy, Climate Change and Infrastructure SICAV-FIS Sa (Fondo Marguerite)
Infrastructure 14.08% 54,336 (15,044) 11,712 - 14.08% 51,004 5,587
3. European Energy EfficiencyFund SA, SICAV-SIF (Fondo EEEF)
Energy - -
- A units 10.63% 14,602 - - - 10.54% 14,602 37,312
- B units 1.67% 2,294 - - - 1.66% 2,294 5,693
4. Marguerite II SCSp (FondoMarguerite II)
Infrastructure 14.18% - 20,250 (455) - 13.42% 19,795 79,750
5.Connecting Europe BroadbandFund, SICAV-FIAR
Broadband Infrastructures
- - - - - 11.90% - 50,000
B. Investment funds 1,651,395 284,804 (24,269) - 1,911,930 2,804,624
1. FIV Extra Public sector construction
100.00% 612,094 (9,147) (12,219) - 100.00% 590,728 331,100
2. F2i – Terzo Fondo per leInfrastrutture
Infrastructure 4.77% 97,582 (8,078) (236) - 4.36% 89,268 59,778
3. Fondo Investimenti per l'Abitare Socialhousing
49.31% 338,952 46,055 (11,012) - 49.31% 373,995 531,198
4. Fondo Italiano d'Investimento -Fondo di Fondi
SMEs and export finance
20.83% 28,061 (1,344) 90 - 20.83% 26,807 20,948
5. Fondo Italiano d'Investimento -FII Venture
Venture Capital
20.83% 7,588 811 (156) - 20.83% 8,243 6,718
6. F2i - Secondo Fondo Italianoper le Infrastrutture
Infrastructure
- A units 8.05% 68,272 1,183 11,329 - 8.05% 80,784 48,035
- C units 0.02% 178 3 30 - 0.02% 210 125
7. FIV Plus Public sector construction
100.00% 99,633 (11,000) (675) - 100.00% 87,958 161,400
8. Fondo PPP Italia Infrastructure and PPP project
14.58% 10,537 (321) (71) - 14.58% 10,145 2,054
9. Fondo Immobiliare di Lombardia - Comparto Uno (formerly Abitare Sociale 1)
Social housing
3.83% 9,537 (536) 61 - 3.83% 9,062 8,700
10. FoF Private Debt SMEs and export finance
62.50% 59,327 17,048 (2,965) - 62.50% 73,410 160,212
11. FoF Venture Capital Venture Capital
76.69% 7,856 10,492 (1,837) - 76.69% 16,511 101,002
12. Fondo Atlante Banks and NPLs
11.77% 61,527 38,254 (4) - 11.77% 99,777 905
13. Italian Recovery Fund Banks and NPLs
12.90% 162,358 140,476 (476) - 12.90% 302,358 16,384
14. Fondo Investimenti per ilTurismo (FIT)
Tourism sector construction
100.00% 59,317 3,200 2,844 - 100.00% 65,361 183,415
15. Fondo QuattroR Enterprises
- A units 42.17% 12,413 1,892 (1,856) - 42.17% 12,449 280,513
- B units 0.21% 63 - - - 0.21% 63 1,447
16. Fondo FIA 2 Smart Housing, smart working
100.00% 10,275 600 (602) - 100.00% 10,273 88,500
17. FSI Mid Market Growth EquityFund
Enterprises
45
Half-yearly Financial Report 2018
4. Performance of the CDP Group
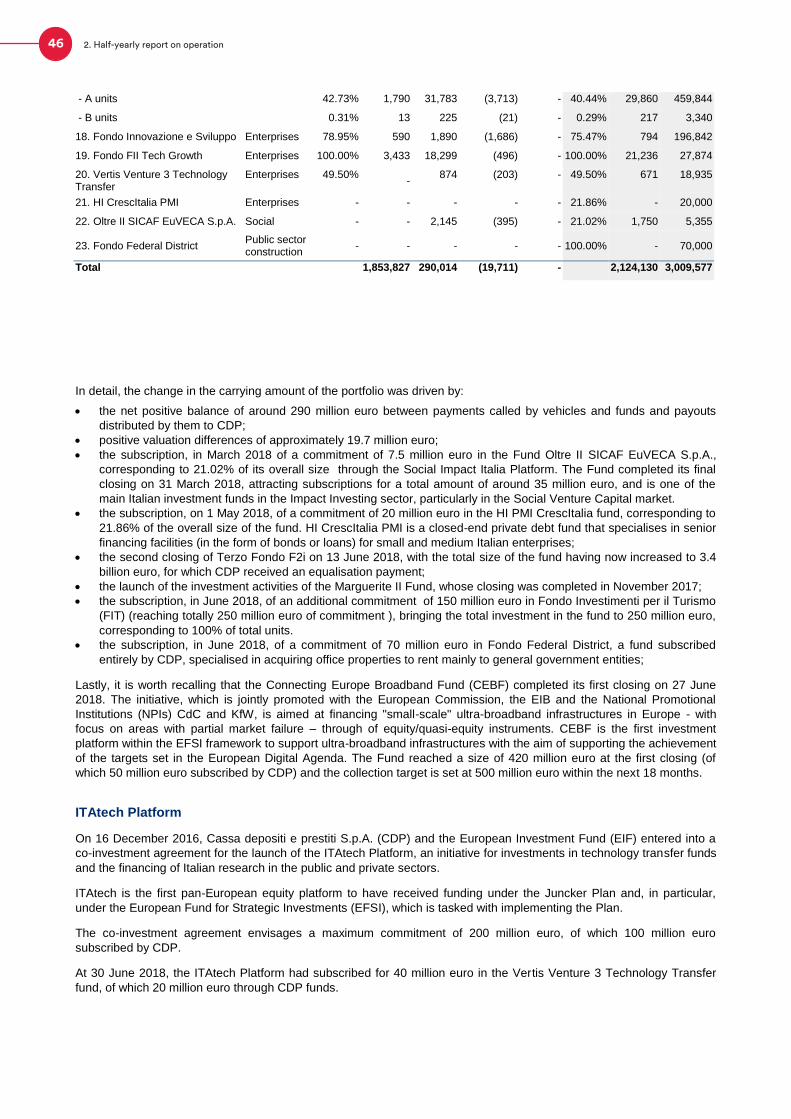
- A units 42.73% 1,790 31,783 (3,713) - 40.44% 29,860 459,844
- B units 0.31% 13 225 (21) - 0.29% 217 3,340
18. Fondo Innovazione e Sviluppo Enterprises 78.95% 590 1,890 (1,686) - 75.47% 794 196,842
19. Fondo FII Tech Growth Enterprises 100.00% 3,433 18,299 (496) - 100.00% 21,236 27,874
20. Vertis Venture 3 TechnologyTransfer
Enterprises 49.50% -
874 (203) - 49.50% 671 18,935
21. HI CrescItalia PMI Enterprises - - - - - 21.86% - 20,000
22. Oltre II SICAF EuVECA S.p.A. Social - - 2,145 (395) - 21.02% 1,750 5,355
23. Fondo Federal DistrictPublic sector construction
- - - - - 100.00% - 70,000
Total 1,853,827 290,014 (19,711) - 2,124,130 3,009,577
In detail, the change in the carrying amount of the portfolio was driven by:
the net positive balance of around 290 million euro between payments called by vehicles and funds and payouts
distributed by them to CDP;
positive valuation differences of approximately 19.7 million euro;
the subscription, in March 2018 of a commitment of 7.5 million euro in the Fund Oltre II SICAF EuVECA S.p.A.,
corresponding to 21.02% of its overall size through the Social Impact Italia Platform. The Fund completed its final
closing on 31 March 2018, attracting subscriptions for a total amount of around 35 million euro, and is one of the
main Italian investment funds in the Impact Investing sector, particularly in the Social Venture Capital market.
the subscription, on 1 May 2018, of a commitment of 20 million euro in the HI PMI CrescItalia fund, corresponding to
21.86% of the overall size of the fund. HI CrescItalia PMI is a closed-end private debt fund that specialises in senior
financing facilities (in the form of bonds or loans) for small and medium Italian enterprises;
the second closing of Terzo Fondo F2i on 13 June 2018, with the total size of the fund having now increased to 3.4
billion euro, for which CDP received an equalisation payment;
the launch of the investment activities of the Marguerite II Fund, whose closing was completed in November 2017;
the subscription, in June 2018, of an additional commitment of 150 million euro in Fondo Investimenti per il Turismo
(FIT) (reaching totally 250 million euro of commitment ), bringing the total investment in the fund to 250 million euro,
corresponding to 100% of total units.
the subscription, in June 2018, of a commitment of 70 million euro in Fondo Federal District, a fund subscribed
entirely by CDP, specialised in acquiring office properties to rent mainly to general government entities;
Lastly, it is worth recalling that the Connecting Europe Broadband Fund (CEBF) completed its first closing on 27 June
2018. The initiative, which is jointly promoted with the European Commission, the EIB and the National Promotional
Institutions (NPIs) CdC and KfW, is aimed at financing "small-scale" ultra-broadband infrastructures in Europe - with
focus on areas with partial market failure – through of equity/quasi-equity instruments. CEBF is the first investment
platform within the EFSI framework to support ultra-broadband infrastructures with the aim of supporting the achievement
of the targets set in the European Digital Agenda. The Fund reached a size of 420 million euro at the first closing (of
which 50 million euro subscribed by CDP) and the collection target is set at 500 million euro within the next 18 months.
ITAtech Platform
On 16 December 2016, Cassa depositi e prestiti S.p.A. (CDP) and the European Investment Fund (EIF) entered into a
co-investment agreement for the launch of the ITAtech Platform, an initiative for investments in technology transfer funds
and the financing of Italian research in the public and private sectors.
ITAtech is the first pan-European equity platform to have received funding under the Juncker Plan and, in particular,
under the European Fund for Strategic Investments (EFSI), which is tasked with implementing the Plan.
The co-investment agreement envisages a maximum commitment of 200 million euro, of which 100 million euro
subscribed by CDP.
At 30 June 2018, the ITAtech Platform had subscribed for 40 million euro in the Vertis Venture 3 Technology Transfer
fund, of which 20 million euro through CDP funds.
46 2. Half-yearly report on operation
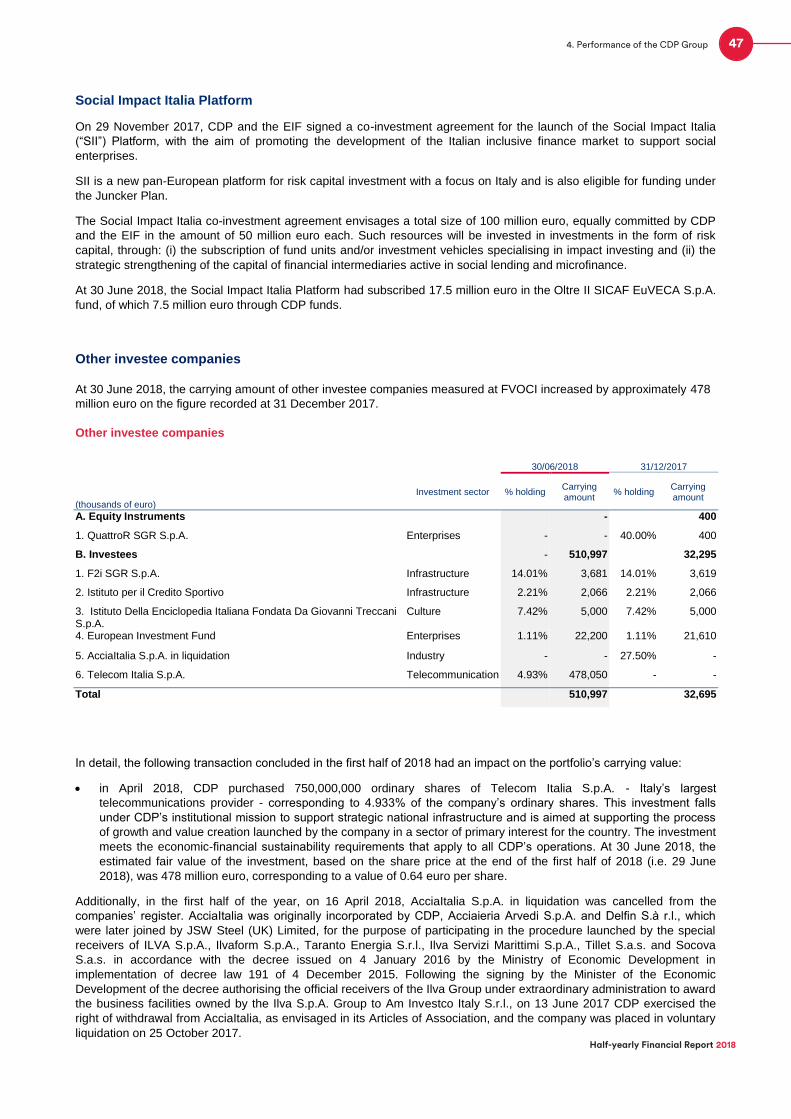
Social Impact Italia Platform
On 29 November 2017, CDP and the EIF signed a co-investment agreement for the launch of the Social Impact Italia
(“SII”) Platform, with the aim of promoting the development of the Italian inclusive finance market to support social
enterprises.
SII is a new pan-European platform for risk capital investment with a focus on Italy and is also eligible for funding under
the Juncker Plan.
The Social Impact Italia co-investment agreement envisages a total size of 100 million euro, equally committed by CDP
and the EIF in the amount of 50 million euro each. Such resources will be invested in investments in the form of risk
capital, through: (i) the subscription of fund units and/or investment vehicles specialising in impact investing and (ii) the
strategic strengthening of the capital of financial intermediaries active in social lending and microfinance.
At 30 June 2018, the Social Impact Italia Platform had subscribed 17.5 million euro in the Oltre II SICAF EuVECA S.p.A.
fund, of which 7.5 million euro through CDP funds.
Other investee companies
At 30 June 2018, the carrying amount of other investee companies measured at FVOCI increased by approximately 478
million euro on the figure recorded at 31 December 2017.
Other investee companies
30/06/2018 31/12/2017
(thousands of euro)
Investment sector % holding Carrying amount
% holding Carrying amount
A. Equity Instruments - 400
1. QuattroR SGR S.p.A. Enterprises - - 40.00% 400
B. Investees - 510,997 32,295
1. F2i SGR S.p.A. Infrastructure 14.01% 3,681 14.01% 3,619
2. Istituto per il Credito Sportivo Infrastructure 2.21% 2,066 2.21% 2,066
3. Istituto Della Enciclopedia Italiana Fondata Da Giovanni Treccani S.p.A.
Culture 7.42% 5,000 7.42% 5,000
4. European Investment Fund Enterprises 1.11% 22,200 1.11% 21,610
5. AcciaItalia S.p.A. in liquidation Industry - - 27.50% -
6. Telecom Italia S.p.A. Telecommunication 4.93% 478,050 - -
Total 510,997 32,695
In detail, the following transaction concluded in the first half of 2018 had an impact on the portfolio’s carrying value:
in April 2018, CDP purchased 750,000,000 ordinary shares of Telecom Italia S.p.A. - Italy’s largest
telecommunications provider - corresponding to 4.933% of the company’s ordinary shares. This investment falls
under CDP’s institutional mission to support strategic national infrastructure and is aimed at supporting the process
of growth and value creation launched by the company in a sector of primary interest for the country. The investment
meets the economic-financial sustainability requirements that apply to all CDP’s operations. At 30 June 2018, the
estimated fair value of the investment, based on the share price at the end of the first half of 2018 (i.e. 29 June
2018), was 478 million euro, corresponding to a value of 0.64 euro per share.
Additionally, in the first half of the year, on 16 April 2018, AcciaItalia S.p.A. in liquidation was cancelled from the
companies’ register. AcciaItalia was originally incorporated by CDP, Acciaieria Arvedi S.p.A. and Delfin S.à r.l., which
were later joined by JSW Steel (UK) Limited, for the purpose of participating in the procedure launched by the special
receivers of ILVA S.p.A., Ilvaform S.p.A., Taranto Energia S.r.l., Ilva Servizi Marittimi S.p.A., Tillet S.a.s. and Socova
S.a.s. in accordance with the decree issued on 4 January 2016 by the Ministry of Economic Development in
implementation of decree law 191 of 4 December 2015. Following the signing by the Minister of the Economic
Development of the decree authorising the official receivers of the Ilva Group under extraordinary administration to award
the business facilities owned by the Ilva S.p.A. Group to Am Investco Italy S.r.l., on 13 June 2017 CDP exercised the
right of withdrawal from AcciaItalia, as envisaged in its Articles of Association, and the company was placed in voluntary
liquidation on 25 October 2017.
47
Half-yearly Financial Report 2018
4. Performance of the CDP Group

Other ongoing activities
On 8 June 2018, CDP and Talent Garden S.p.A.11 (“TAG”) signed an Investment Agreement to build the first Italian
innovation centre in San Francisco - the objective being to create a reference structure for the development of Italian
technological and digital innovation in the Silicon Valley. Promoted by CDP, the initiative is aimed at supporting the
needs of Italian operators, including public institutions and research centres, by creating a permanent representative
office for the Italian innovation community, in one of the most dynamic technology hubs in the world. The focus will be on
aiding digital transformation processes for Italian enterprises and start-ups.
4.1.1.3 Investment of the financial resources of the Parent Company
With regard to the investment of financial resources, the following table shows the aggregates for cash and cash
equivalents, along with an indication of the other forms of investments of financial resources in debt securities.
Stock of investments of financial resources
(millions of euro; %) 30/06/2018 31/12/2017 % change
Cash and cash equivalents and other treasury investments 162,855 175,280 -7.1%
State Treasury current account 151,810 147,897 2.6%
Reserve requirement 2,740 23,998 -88.6%
Other treasury investments Separate account 3,828 2,751 39.2%
Reverse purchase agreements 3,332 - n/s
Deposits (assets) Ordinary account 217 413 -47.6%
Deposits (assets) on CSA/GMRA 928 221 n/s
Debt securities 58,093 48,031 20.9%
Separate Account 57,002 46,895 21.6%
Ordinary Account 1,090 1,136 -4.0%
Total 220,948 223,311 -1.1%
At 30 June 2018, the balance on the current account held with the Central State Treasury, which CDP uses to deposit
funding in excess of investments made in the Separate Account, stood at 152 billion euro, increasing by 4 billion euro on
the figure recorded at the end of 2017.
Cash and cash equivalents deposited for the reserve requirement amounted to about 2.7 billion euro at 30 June 2018, in
line with the minimum reserve requirement of approximately 2.6 billion euro: cash and cash equivalents deposited for the
reserve requirement resulted from the short-term funding on the collateralised money market (repurchase agreements).
The liabilities of CDP that are subject to the reserve requirement are those that have a maturity of or are payable with
notice of up to two years, with the exception of liabilities with credit institutions that are subject to the ECB’s reserve
requirements. The management of the reserve requirement is designed to ensure the accounting separation between the
Separate Account and the Ordinary Account.
Other forms of investments of the Separate Account treasury funds totalled 3.8 billion euro at 30 June 2018, marking an
increase on 31 December 2017 (2.8 billion euro). These investments included deposits with central counterparties and
short-term lending to Group’s companies.
Investments in repurchase agreements with collateral consisting of Italian government securities amounted to 3.3 billion
euro at 30 June 2018, largely due to temporary favourable market conditions linked to closings at the end of the half year
period. The amount includes repurchase agreements with subsidiaries for a total of around 1 billion euro, which
represent a new form of transactions within the Group treasury.
With regard to short-term treasury management operations under the Ordinary Account, amounting to 217 million euro at
30 June 2018, CDP uses money-market funding instruments such as deposits and repurchase agreements in order to
harmonise the timing and margins of the instruments with those of medium and long-term funding items. Temporary
surplus liquidity is invested by CDP in deposits held with banks with highly senior credit ratings and in short-term Italian
government securities.
11 Founded in Brescia in 2012, TAG is a leading operator in the innovation and digital sector, active, in particular, in the co-working, innovation and community management segments, at national and European level. The company will take on the role of operational manager, also with a view to leveraging the synergies between the respective know-how and resources.
48 2. Half-yearly report on operation

As regards collateral deposits, established under Credit Support Annexes and Global Master Repurchase Agreements to
limit the counterparty risk associated with transactions in derivative instruments and repurchase agreements, amounting
to 928 million euro at 30 June 2018, there was a net credit balance of +434 million euro, marking an opposing trend
compared to the figure recorded at the end of 2017 (-488 million euro). This figure was mainly driven by changes in
market conditions in the reporting period, primarily driven by in interest rates. These deposits are also managed in a
manner that ensures accounting separation between the two Accounts.
Net deposits on CSA/GMRA transactions
(millions of euro; %) 30/06/2018 31/12/2017 % change
Total net deposits 434 (488) n/s
of which:
- deposits (assets) 928 221 n/s
- deposits (liabilities) 494 710 -30.4%
At 30 June 2018, the securities portfolio showed a balance of approximately 58.1 billion euro, marking an increase on the
year-end 2017 figure (48.0 billion euro). The still relatively short duration of the portfolio, realised partly through the use
of floating-rate instruments, e.g. CCT EU floating-rate bonds, determined the reduction in the exposure of the portfolio to
potential interest rate increases. The securities portfolio mainly consists of Italian government securities classified in the
accounting categories HTC (Held To Collect) and HTCS (Held To Collect & Sell) and is held for asset & liability
management purposes, investment purposes and to stabilise CDP’s net interest income. In the first half of the year, CDP
also opened a HTCS portfolio dedicated to investments in European government securities and corporate securities,
both held for the purpose of diversification and to contribute to interest income.
4.1.1.4 Funding activities by the Parent Company
Funding from banks
The table below shows CDP’s overall position in terms of funding from banks at 30 June 2018, compared with 31
December 2017.
Stock of funding from banks
(millions of euro; %) 30/06/2018 31/12/2017 % change
ECB refinancing 2,475 2,475 n/s
of which:
- Separate Account 1,175 1,175 n/s
- Ordinary Account 1,300 1,300 n/s
Deposits, Repurchase agreements and other 37,024 27,978 32.3%
of which:
- Separate Account 36,919 27,687 33.3%
- Ordinary Account 104 291 -64.1%
Deposits (liabilities) for CSA/GMRA 494 710 -30.4%
EIB/CEB credit facilities 5,134 5,063 1.4%
of which:
- Separate Account 3,154 3,019 4.5%
- Ordinary Account 1,980 2,045 -3.2%
Total 45,126 36,225 24.6%
With regard to the first half of 2018, funding through the European Central Bank (ECB), represented by the TLTRO II
programme, was stable at around 2.5 billion euro.
Short-term funding on the money market through deposits and repurchase agreements increased sharply in the first half
of 2018 thanks to the particularly low market interest rates. The stock of funding for the Separate Account, raised almost
49
Half-yearly Financial Report 2018
4. Performance of the CDP Group

entirely through repurchase agreements, amounted to approximately 36.9 billion euro at 30 June 2018, compared to
around 27.7 billion euro at the end of 2017.
At 30 June 2018, the stock of credit facilities granted by the European Investment Bank (EIB) and the Council of Europe
Development Bank (CEB) amounted to 5.1 billion euro, of which around 4.9 billion euro referred to the EIB and around
0.2 billion euro referred to the CEB.
As regards the credit facilities granted by the EIB, a new loan agreement was signed in the first half of 2018 for a total of
650 million euro (Ordinary Account) to finance Ferrovienord S.p.A. - the holder of a concession to manage railway
infrastructure in the Lombardy region. In the first half of 2018, CDP also requested and obtained two new disbursements
totalling around 65 million euro, as funding for school building projects (one of the disbursements, totalling euro 13
million, was repaid in full on 30 June 2018).
Furthermore, CDP also signed two new loan agreements with the CEB in the first half of 2018 (Separate Account). The
first, totalling 350 million euro, to finance the Central Italy Earthquake Fund, and the second, amounting to 290 million
euro, to finance the Capital Goods Fund. Drawing on the latter, in May 2018 CDP requested and obtained a
disbursement of 130 million euro.
EIB/CEB funding in the first half of 2018
(millions of euro) Date of issue/Funding Nominal value
EIB Draw-down (maturity date 30/06/2018) 26/03/2018 13
EIB Draw-down (maturity date 31/12/2044) 26/03/2018 52
CEB Draw-down (maturity date 16/05/2023) 16/05/2018 130
Total 195
of which:
- under the Separate Account 195
- under the Ordinary Account -
Funding from customers
The table below shows CDP’s overall position in terms of funding from customers at 30 June 2018, compared with 31
December 2017.
Stock of funding from customers
(millions of euro; %) 30/06/2018 31/12/2017 % change
OPTES deposits (liabilities) 12,500 22,500 -44.4%
Deposits of Group companies 5,321 6,834 -22.1%
Amounts to be disbursed 4,711 4,715 -0.1%
Government securities amortisation fund 353 2 n/s
Total 22,886 34,052 -32.8%
At 30 June 2018, the liquidity balance of short-term OPTES deposits was euro 12.5 billion, compared to euro 22.5 billion
at 31 December 2017. The deposits represent short-term funding which is held primarily: i) to meet reserve
requirements; ii) to invest in Italian government bonds, and marginally iii) to carry out repurchase transactions with Italian
government securities as collateral.
With regard to companies subject to management and coordination, cash pooling with the Parent Company’s centralised
treasury was further consolidated, involving deposits arrangements between CDP and its subsidiaries. Centralised
treasury deposits at 30 June 2018 stood at around 5.3 billion euro, compared to 6.8 billion euro at the end of 2017.
Amounts to be disbursed constitute the part of loans granted by CDP that have not yet been taken up by the
beneficiaries, whose disbursement is subject to progress with the investments financed. The total of amounts to be
disbursed at 30 June 2018 was stable at approximately euro 4.7 billion, in line with the figure recorded at the end of
2017.
Finally, the Government securities amortisation fund deposited by the MEF with CDP amounted to approximately 0.4
billion euro at 30 June 2018.
50 2. Half-yearly report on operation
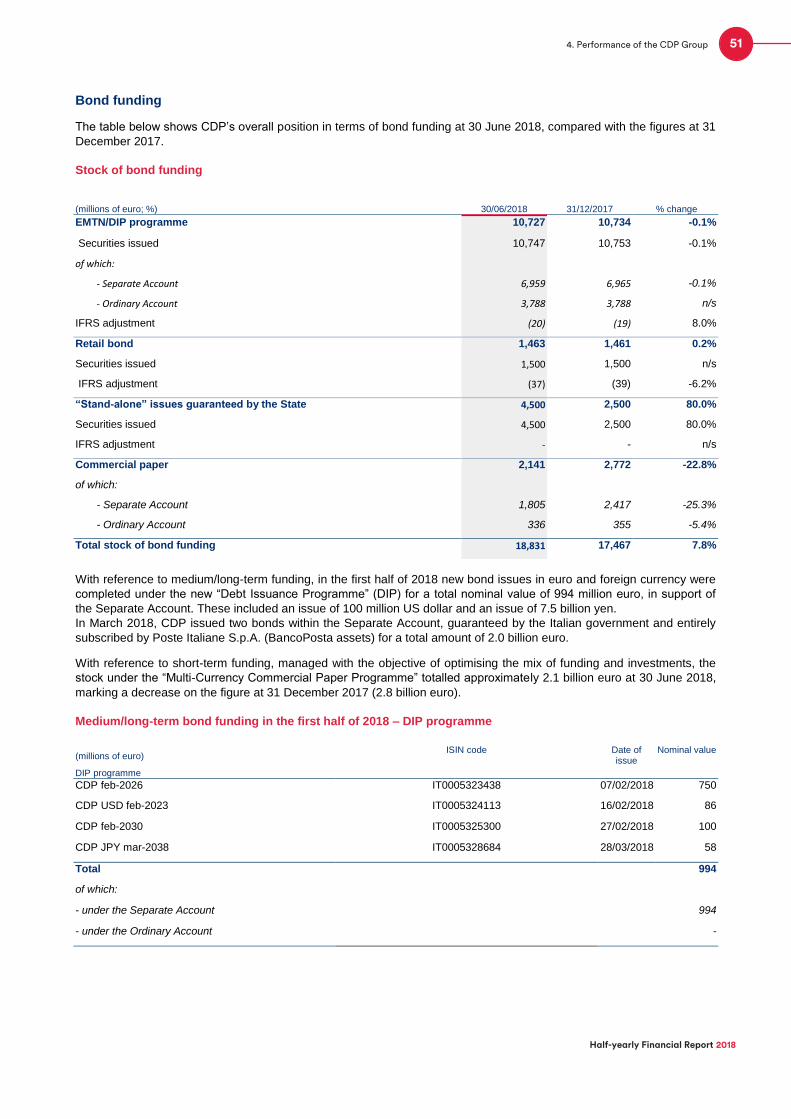
Bond funding
The table below shows CDP’s overall position in terms of bond funding at 30 June 2018, compared with the figures at 31
December 2017.
Stock of bond funding
(millions of euro; %) 30/06/2018 31/12/2017 % change
EMTN/DIP programme 10,727 10,734 -0.1%
Securities issued 10,747 10,753 -0.1%
of which:
- Separate Account 6,959 6,965 -0.1%
- Ordinary Account 3,788 3,788 n/s
IFRS adjustment (20) (19) 8.0%
Retail bond 1,463 1,461 0.2%
Securities issued 1,500 1,500 n/s
IFRS adjustment (37) (39) -6.2%
“Stand-alone” issues guaranteed by the State 4,500 2,500 80.0%
Securities issued 4,500 2,500 80.0%
IFRS adjustment - - n/s
Commercial paper 2,141 2,772 -22.8%
of which:
- Separate Account 1,805 2,417 -25.3%
- Ordinary Account 336 355 -5.4%
Total stock of bond funding 18,831 17,467 7.8%
With reference to medium/long-term funding, in the first half of 2018 new bond issues in euro and foreign currency were
completed under the new “Debt Issuance Programme” (DIP) for a total nominal value of 994 million euro, in support of
the Separate Account. These included an issue of 100 million US dollar and an issue of 7.5 billion yen.
In March 2018, CDP issued two bonds within the Separate Account, guaranteed by the Italian government and entirely
subscribed by Poste Italiane S.p.A. (BancoPosta assets) for a total amount of 2.0 billion euro.
With reference to short-term funding, managed with the objective of optimising the mix of funding and investments, the
stock under the “Multi-Currency Commercial Paper Programme” totalled approximately 2.1 billion euro at 30 June 2018,
marking a decrease on the figure at 31 December 2017 (2.8 billion euro).
Medium/long-term bond funding in the first half of 2018 – DIP programme
(millions of euro) ISIN code Date of
issue Nominal value
DIP programme
CDP feb-2026 IT0005323438 07/02/2018 750
CDP USD feb-2023 IT0005324113 16/02/2018 86
CDP feb-2030 IT0005325300 27/02/2018 100
CDP JPY mar-2038 IT0005328684 28/03/2018 58
Total 994
of which:
- under the Separate Account 994
- under the Ordinary Account -
51
Half-yearly Financial Report 2018
4. Performance of the CDP Group

Medium/long-term bond funding in the first half of 2018 – State-guaranteed issues
(millions of euro) ISIN code Date of
issue Nominal value
BancoPosta Issues State-guaranteed
CDPmar-2033 IT0005329682 29/03/2018 1,000
CDPmar-2028 IT0005329690 29/03/2018 1,000
Total 2,000
of which:
- under the Separate Account 2,000
- under the Ordinary Account -
Postal funding
Postal savings constitute a major component of household savings. In detail, the percentage impact of postal savings
(including bonds pertaining to the MEF) in respect of total Italian household financial assets was stable at 7.5% at the
end of 2017.
At 30 June 2018, postal funding, consisting of passbook savings accounts and postal savings bonds pertaining to CDP,
totalled 253,556 million euro, marking an improvement on 31 December 2017 (252,754 million euro).
Specifically, the carrying amount of passbook savings accounts was 105,615 million euro, while the carrying amount of
postal savings bonds, measured at amortised cost, was 147,941 million euro.
Stock of postal savings
(millions of euro; %) 30/06/2018 31/12/2017 Change (+ /- ) % change
Passbook savings accounts 105,615 108,566 (2,951) -2.72%
Postal savings bonds 147,941 144,187 3,754 2.60%
Total 253,556 252,754 803 0.32%
Total stock increased as a result of net inflows and interest accrued on Bonds, which more than offset outflows from
passbook accounts.
In terms of net funding, passbook savings accounts recorded a net outflow of -2,968 million euro in the first half of 2018,
marking a sharp improvement on the same period of 2017 (-7,801 million euro). This result was due to the improvement
in net funding from SMART passbook accounts (34% of total passbook accounts), which went from -5,028 million euro in
the first half of 2017 to -111 million euro in the first half of 2018, also thanks to the commercial offers available
(“Supersmart offers”). Net funding from ordinary registered passbooks (63% of total passbook accounts) was essentially
in line with the first half of 2017.
The following table shows a breakdown of net funding from passbook accounts by product type.
52 2. Half-yearly report on operation

- Judicial 175 (187) (12) 3
Bearer passbook accounts 0.1 (4) (4) (3)
- Ordinary 0.1 (4) (4) (3)
- Time deposits -
Note: The net funding figures include transfers between passbook accounts.
31/12/2017 Net funding Reclassifications and adjustments
Interest 01/01/2018-30/06/2018
Withholding tax
30/06/2018
(millions of euro)
Registered passbook accounts 108,534 (2,965) - 20 (2) 105,586
- Ordinary 69,578 (2,238) (502) 3 66,841
- Ordinary Smart 35,521 (707) 596 16 (2) 35,423
- Time deposits 0.2 - - 0.2
- for Minors 2,922 (7) (94) 0.1 2,821
- Judicial 513 (12) - 501
Bearer passbook accounts 33 (4) - - 29
- Ordinary 33 (4) - - 29
- Time deposits 0.03 - - - - 0.01
Total 108,566 (2,968) - 20 (2) 105,615
Net funding from CDP postal savings bonds saw positive inflows amounting to 2,078 million euro in the first half of 2018.
This result was mainly due to the good performance of funding from 3-year Plus Bonds (+3.129 million euro) and from
the BFP bonds added to the new range of products offered to savers from 22 January (3X2 bonds, 3X4 bonds and 4-
year Risparmio Semplice bonds).
In the first half of the year, bond subscriptions totalled 9,494 million euro with the following breakdown by key product: 3-
year Plus Bonds (4,124 million euro - 43% of the total), 3X2 bonds (2,706 million euro - 29% of the total), 3X4 bonds
(1,846 million euro - 19% of the total), Ordinary Bonds (633 million euro - 7% of the total) and Bonds for minors (171
million - 2% of the total).
Postal savings bonds - CDP net funding
Subscriptions Redemptions Net funding in the first half of 2018
Net funding in the first half of 2017
Change (+ / -)
(millions of euro)
Ordinary bonds 633 (2,591) (1,958) 2,153 (4,112)
3x4 bonds 1,846 (534) 1,312 (450) 1,762
3-year bonds 4,124 (995) 3,129 3,512 (383)
Italian inflation indexed bonds - (1,479) (1,479) (1,027) (451)
Bonds for minors 171 (174) (3) (19) 16
Europa/Premia bonds - (1,106) (1,106) (810) (297)
3x2 bonds 2,706 (93) 2,613 - 2,613
4-year bonds 14 (0.4) 13 - 13
Other bonds - (443) (443) (534) 91
Total 9,494 (7,416) 2,078 2,825 (747)
Note: "3x4 bonds" includes: 3x4 bonds, 3x4 Fedeltà bonds and 3x4 RisparmiNuovi bonds. "Other Bonds" includes: 7Insieme bonds, Fixed-term bonds, indexed bonds, 18-month bonds, 2-year bonds, Renditalia bonds, Impresa bonds, Risparmi Nuovi bonds, Fedeltà bonds, Eredità Sicura bonds, 4x4 bonds, 4x4 Fedeltà bonds and 4x4 Risparmi Nuovi bonds
53
Half-yearly Financial Report 2018
4. Performance of the CDP Group
Deposits Withdrawals Net funding in the first half of 2018
Net funding in the first half of 2017
49,181 (52,145) (2,965) (7,798)
30,369 (33,109) (2,740) (2,682)
18,398 (18,509) (111) (5,028)
- (0.02) (0.02) (0.01)
- Ordinary
- Ordinary SMART
- Time deposits
- for Minors 240 (341) (101) (92)
(millions of euro)
Registered passbook accounts
Passbook savings accounts
Passbook savings accounts - net funding
Total 49,181
(0.02) 0.00
(52,149) (7,801)
(0.02)
(2,968)
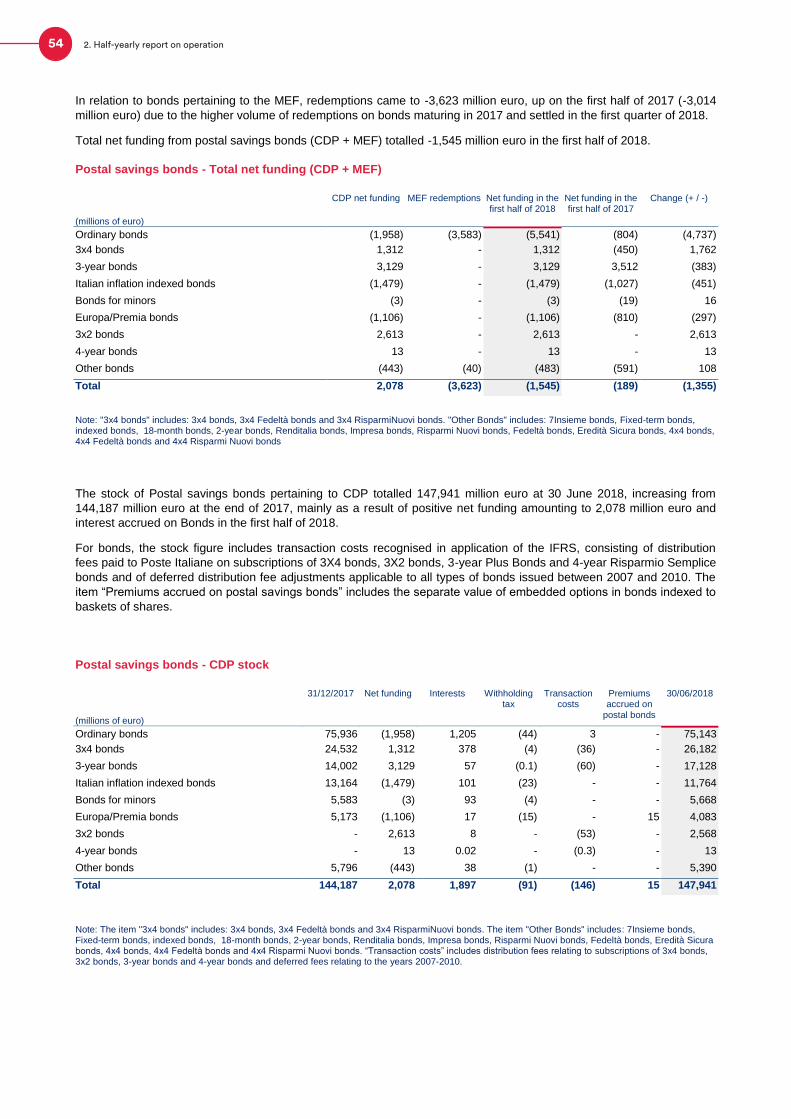
In relation to bonds pertaining to the MEF, redemptions came to -3,623 million euro, up on the first half of 2017 (-3,014
million euro) due to the higher volume of redemptions on bonds maturing in 2017 and settled in the first quarter of 2018.
Total net funding from postal savings bonds (CDP + MEF) totalled -1,545 million euro in the first half of 2018.
Postal savings bonds - Total net funding (CDP + MEF)
CDP net funding MEF redemptions Net funding in the first half of 2018
Net funding in the first half of 2017
Change (+ / -)
(millions of euro)
Ordinary bonds (1,958) (3,583) (5,541) (804) (4,737)
3x4 bonds 1,312 - 1,312 (450) 1,762
3-year bonds 3,129 - 3,129 3,512 (383)
Italian inflation indexed bonds (1,479) - (1,479) (1,027) (451)
Bonds for minors (3) - (3) (19) 16
Europa/Premia bonds (1,106) - (1,106) (810) (297)
3x2 bonds 2,613 - 2,613 - 2,613
4-year bonds 13 - 13 - 13
Other bonds (443) (40) (483) (591) 108
Total 2,078 (3,623) (1,545) (189) (1,355)
Note: "3x4 bonds" includes: 3x4 bonds, 3x4 Fedeltà bonds and 3x4 RisparmiNuovi bonds. "Other Bonds" includes: 7Insieme bonds, Fixed-term bonds, indexed bonds, 18-month bonds, 2-year bonds, Renditalia bonds, Impresa bonds, Risparmi Nuovi bonds, Fedeltà bonds, Eredità Sicura bonds, 4x4 bonds, 4x4 Fedeltà bonds and 4x4 Risparmi Nuovi bonds
The stock of Postal savings bonds pertaining to CDP totalled 147,941 million euro at 30 June 2018, increasing from
144,187 million euro at the end of 2017, mainly as a result of positive net funding amounting to 2,078 million euro and
interest accrued on Bonds in the first half of 2018.
For bonds, the stock figure includes transaction costs recognised in application of the IFRS, consisting of distribution
fees paid to Poste Italiane on subscriptions of 3X4 bonds, 3X2 bonds, 3-year Plus Bonds and 4-year Risparmio Semplice
bonds and of deferred distribution fee adjustments applicable to all types of bonds issued between 2007 and 2010. The
item “Premiums accrued on postal savings bonds” includes the separate value of embedded options in bonds indexed to
baskets of shares.
Postal savings bonds - CDP stock
31/12/2017 Net funding Interests Withholding tax
Transaction costs
Premiums accrued on
postal bonds
30/06/2018
(millions of euro)
Ordinary bonds 75,936 (1,958) 1,205 (44) 3 - 75,143
3x4 bonds 24,532 1,312 378 (4) (36) - 26,182
3-year bonds 14,002 3,129 57 (0.1) (60) - 17,128
Italian inflation indexed bonds 13,164 (1,479) 101 (23) - - 11,764
Bonds for minors 5,583 (3) 93 (4) - - 5,668
Europa/Premia bonds 5,173 (1,106) 17 (15) - 15 4,083
3x2 bonds - 2,613 8 - (53) - 2,568
4-year bonds - 13 0.02 - (0.3) - 13
Other bonds 5,796 (443) 38 (1) - - 5,390
Total 144,187 2,078 1,897 (91) (146) 15 147,941
Note: The item "3x4 bonds" includes: 3x4 bonds, 3x4 Fedeltà bonds and 3x4 RisparmiNuovi bonds. The item "Other Bonds" includes: 7Insieme bonds, Fixed-term bonds, indexed bonds, 18-month bonds, 2-year bonds, Renditalia bonds, Impresa bonds, Risparmi Nuovi bonds, Fedeltà bonds, Eredità Sicura bonds, 4x4 bonds, 4x4 Fedeltà bonds and 4x4 Risparmi Nuovi bonds. “Transaction costs” includes distribution fees relating to subscriptions of 3x4 bonds, 3x2 bonds, 3-year bonds and 4-year bonds and deferred fees relating to the years 2007-2010.
54 2. Half-yearly report on operation

In the first half of 2018, total net funding (CDP + MEF) from postal savings bonds and passbook savings accounts was
negative by -4,513 million euro, marking an improvement on the first half of 2017 (-7,990 million euro) owing to the
decrease in outflows from passbook accounts.
Total net postal savings funding (CDP + MEF)
(millions of euro)
Net funding 1st Half 2018
Net funding 1st Half 2017
Change (+ / -)
Postal savings bonds (1,545) (189) (1,355)
of which:
- pertaining to CDP 2,078 2,825 (747)
- pertaining to the MEF (3,623) (3,014) (609)
Passbook savings accounts (2,968) (7,801) 4,833
CDP net funding (890) (4,976) 4,086
MEF net funding (3,623) (3,014) (609)
Total (4,513) (7,990) 3,477
55
Half-yearly Financial Report 2018
4. Performance of the CDP Group

4.1.2 GROUP COMPANIES
4.1.2.1 PERFORMANCE OF COMPANIES SUBJECT TO MANAGEMENT AND COORDINATION
SACE GROUP
In the first half of 2018, the SACE Group focused on exports and on the international expansion of its companies in
sectors that are strategic for the Italian economy.
In line with the initiatives envisaged in the Business plan, activities to bring the companies closer continued in the first
half and included: (i) a new service model for customers, which provides for higher commercial focus on the sales
network and the presence of a single Customer Care service for the SACE Simest hub, (ii) expansion of the international
network with the inauguration of the new offices in Shanghai in June and the authorisation to open a representative office
in North Africa to support the many Italian companies working there, (iii) availability of new online products on the My
Export Gate platform, which saw increased website traffic thanks to new campaigns launched by the SACE Simest hub.
New lending, investments and managed resources - SACE Group
Business lines (millions of euro; %) 30/06/2018 30/06/2017 Change (+/-) % change
SACE 4,609 4,384 224 5.1%
Export 1,584 3,968 (2,383) -60.1%
- Buyer credit loans 976 3,476 (2,500) -71.9%
- Supplier credit loans 463 477 (14) -3.0%
- Confirmation of letters of credit policies 145 15 131 n/s
International expansion 3,024 416 2,608 n/s
- Financial guarantees 1,613 147 1,466 n/s
- Financial guarantees for SMEs 52 74 (22) -29.8%
- Bonds/sureties 174 80 94 n/s
- Political Risk Insurance policies 1,096 37 1,058 n/s
- Push Strategy 77 - 77 n/s
- Fondo Sviluppo Export 13 78 (65) -83.0%
SACE FCT 2,190 2,244 (55) -2.4%
Factoring with/without recourse 1,898 1,833 65 3.6%
Trade finance 291 411 (120) -29.2%
SIMEST 3,295 8,611 (5,316) -61.7%
Export 3,136 8,517 (5,380) -63.2%
- Interest grants (295 Fund) - Buyer credit 3,060 8,380 (5,320) -63.5%
- Interest grants (295 Fund) - Supplier credit 77 137 (60) -43.9%
International expansion 159 94 64 68.2%
- Direct equity investments and Venture Capital Fund 15 18 (3) -15.0%
- Subsidised loans (394 Fund) 124 57 67 n/s
- Equity investment grants (Law 100/90 and Law 19/91) 19 19 (0) -0.2%
Eliminations (3,351) (8,791) 5,440 -61.9%
Total new lending, investments and managed resources 6,743 6,448 294 4.6%
During the half year, new lending, investments and managed resources increased by 4.6% on the same period of the
previous year.
Specifically, new lending by the SACE Group totalled 6,742 million euro, mainly in support of the infrastructure,
aeronautics and banking sectors. These volumes were driven by international expansion operations totalling 3,183
million euro (47% of the total), up sharply from the first half of 2017, and by factoring activities totalling 2.190 million euro,
which remained in line with the 2017 figures.
56 2. Half-yearly report on operation

The Group also expects to finalise the export credit operations subject to the use of the reinsurance agreements signed
with the Ministry of the Economy and Finance and the refinancing of the 295 Fund.
Performance highlights - SACE Group1
(millions of euro; %) 30/06/2018 31/12/2017 Change (+/-) (%) change
SACE
Outstanding guarantees 50,359 49,929 429 0.9%
- on which principal 44,399 43,790 609 1.4%
- on which interest 5,960 6,140 (180) -2.9%
Loans 579 632 (54) -8.5%
SACE BT
Insurance of short-term loans 9,177 9,696 (519) -5.4%
Sureties Italy 6,142 6,235 (93) -1.5%
Other property damage 29,730 25,353 4,377 17.3%
SACE FCT
Outstanding receivables 1,727 1,921 (194) -10.1%
SIMEST
Equity investment portfolio 557 572 (16) -2.8%
1) Amounts refer to stock at the date indicated.
SACE’s total risk exposure, measured in relation to loans and guarantees provided, stood at 50.9 billion euro (of which
98.8% referring to the guarantees portfolio), in line with the year-end 2017 figure (+0.7%).
The value of the SACE BT portfolio (around 45 billion euro) was up on the year-end 2017 figure (+9.1%) due to new
sign-ups in the “Other property damage” segment.
Outstanding receivables of SACE FCT (approx. 1.7 billion euro) decreased by 10.1% as a result of payments received in
the half year period.
Finally, the Simest equity investment portfolio totalled 556 million euro, down slightly (-2.8%) on year-end 2017.
Treasury and funding activities - SACE Group
(millions of euro; %) 30/06/2018 31/12/2017 Change (+/-) (%) change
Cash and cash equivalents and other treasury investments 8,378 7,325 1,053 14.4%
Cash and cash equivalents at CDP 3,394 4,913 (1,519) -30.9%
Cash and cash equivalents held at banking institutions 565 93 472 n/s
Other treasury investments 4,419 2,319 2,100 90.5%
Debt securities and other forms of funding 3,009 2,304 706 30.6%
Financial payables 2,494 1,789 705 39.4%
Other debt securities 515 515 1 0.1%
In the first half of 2018, cash and cash equivalents and other treasury investments of the SACE Group increased by
1.053 million euro, against an increase of 706 million euro in financial payables.
The increase in cash and cash equivalents and other treasury investments is mainly due to repurchase agreements
signed in the first half by SACE with the Parent Company CDP, for a total of 1,014 million euro, and to cash flows from
operating activities in the same period.
The increase in financial payables is linked to the foregoing repurchase agreements, net of the decrease in financial
payables of the subsidiary SACE FCT (223 million euro).
57
Half-yearly Financial Report 2018
4. Performance of the CDP Group
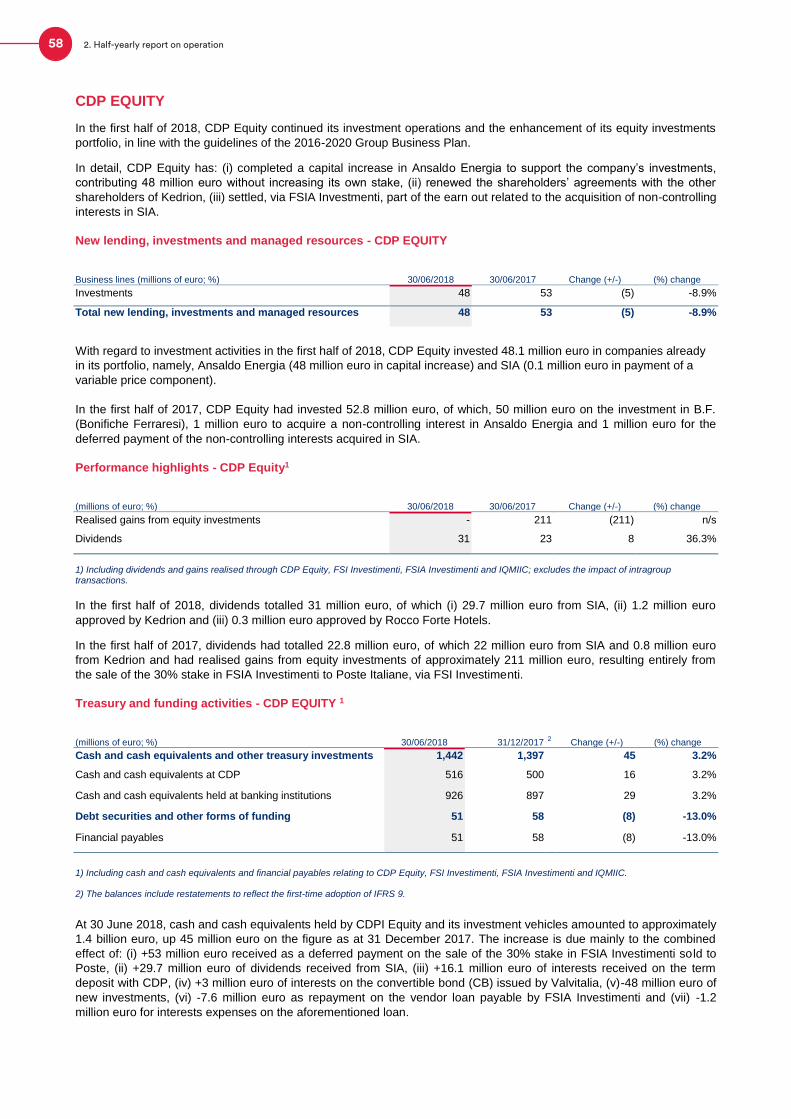
CDP EQUITY
In the first half of 2018, CDP Equity continued its investment operations and the enhancement of its equity investments
portfolio, in line with the guidelines of the 2016-2020 Group Business Plan.
In detail, CDP Equity has: (i) completed a capital increase in Ansaldo Energia to support the company’s investments,
contributing 48 million euro without increasing its own stake, (ii) renewed the shareholders’ agreements with the other
shareholders of Kedrion, (iii) settled, via FSIA Investmenti, part of the earn out related to the acquisition of non-controlling
interests in SIA.
New lending, investments and managed resources - CDP EQUITY
Business lines (millions of euro; %) 30/06/2018 30/06/2017 Change (+/-) (%) change
Investments 48 53 (5) -8.9%
Total new lending, investments and managed resources 48 53 (5) -8.9%
With regard to investment activities in the first half of 2018, CDP Equity invested 48.1 million euro in companies already
in its portfolio, namely, Ansaldo Energia (48 million euro in capital increase) and SIA (0.1 million euro in payment of a
variable price component).
In the first half of 2017, CDP Equity had invested 52.8 million euro, of which, 50 million euro on the investment in B.F.
(Bonifiche Ferraresi), 1 million euro to acquire a non-controlling interest in Ansaldo Energia and 1 million euro for the
deferred payment of the non-controlling interests acquired in SIA.
Performance highlights - CDP Equity1
(millions of euro; %) 30/06/2018 30/06/2017 Change (+/-) (%) change
Realised gains from equity investments - 211 (211) n/s
Dividends 31 23 8 36.3%
1) Including dividends and gains realised through CDP Equity, FSI Investimenti, FSIA Investimenti and IQMIIC; excludes the impact of intragroup transactions.
In the first half of 2018, dividends totalled 31 million euro, of which (i) 29.7 million euro from SIA, (ii) 1.2 million euro
approved by Kedrion and (iii) 0.3 million euro approved by Rocco Forte Hotels.
In the first half of 2017, dividends had totalled 22.8 million euro, of which 22 million euro from SIA and 0.8 million euro
from Kedrion and had realised gains from equity investments of approximately 211 million euro, resulting entirely from
the sale of the 30% stake in FSIA Investimenti to Poste Italiane, via FSI Investimenti.
Treasury and funding activities - CDP EQUITY 1
(millions of euro; %) 30/06/2018 31/12/2017 2 Change (+/-) (%) change
Cash and cash equivalents and other treasury investments 1,442 1,397 45 3.2%
Cash and cash equivalents at CDP 516 500 16 3.2%
Cash and cash equivalents held at banking institutions 926 897 29 3.2%
Debt securities and other forms of funding 51 58 (8) -13.0%
Financial payables 51 58 (8) -13.0%
1) Including cash and cash equivalents and financial payables relating to CDP Equity, FSI Investimenti, FSIA Investimenti and IQMIIC.
2) The balances include restatements to reflect the first-time adoption of IFRS 9.
At 30 June 2018, cash and cash equivalents held by CDPI Equity and its investment vehicles amounted to approximately
1.4 billion euro, up 45 million euro on the figure as at 31 December 2017. The increase is due mainly to the combined
effect of: (i) +53 million euro received as a deferred payment on the sale of the 30% stake in FSIA Investimenti sold to
Poste, (ii) +29.7 million euro of dividends received from SIA, (iii) +16.1 million euro of interests received on the term
deposit with CDP, (iv) +3 million euro of interests on the convertible bond (CB) issued by Valvitalia, (v)-48 million euro of
new investments, (vi) -7.6 million euro as repayment on the vendor loan payable by FSIA Investimenti and (vii) -1.2
million euro for interests expenses on the aforementioned loan.
58 2. Half-yearly report on operation

Financial payables as at 30 June 2018 consisted of the vendor loan payable by FSIA Investimenti. The decrease
compared to 31 December 2017 was due to the aforementioned early repayment of the loan, for approximately 7.6
million euro.
FINTECNA
In the first half of 2018, Fintecna continued to manage its litigation cases, with efforts focused on optimising its defence
strategy by constantly monitoring developments in court cases to assess critical aspects specifically.
Performance highlights - Fintecna
(number of disputes; %) 30/06/2018 31/12/2017 Change (+/-) (%) change
Labour law disputes 424 492 (68) -13.8%
Civil/administrative/tax law disputes 110 113 (3) -2.7%
Regarding labour law disputes (i.e. claims for compensation for health damage arising from occupational illnesses), the
reduction in the number compared to year-end 2017 is chiefly due to the decrease in the number of new appeals and to
the final settlement of a number of disputes, in line with budget forecasts.
With regard to other types of disputes (civil, administrative and tax-related), the number of pending proceedings is
essentially the same as a result of settlements being more difficult due to significant differences in valuations with respect
to counterparties.
Treasury and funding activities - FINTECNA
(millions of euro; %) 30/06/2018 31/12/2017 Change (+/-) (%) change
Cash and cash equivalents and other treasury investments 1,126 1,134 (8) -0.7%
Cash and cash equivalents at CDP 1,065 1,066 (1) -0.1%
Cash and cash equivalents held at banking institutions 61 68 (7) -10.3%
In accordance with CDP Group guidelines, investment activities during the year continued to focus on cash pooling
arrangements with the Parent Company.
Specifically, at 30 June 2018, cash held at banks and with CDP amounted to 1,126 million euro compared to 1,134
million euro in 2017.
The corporate and organisational streamlining activities launched in 2017 with the merger by incorporation of Ligestra
and Ligestra Tre into Ligestra Due continued also in the first half of 2018 with the approval of the project to merge also
Ligestra Quattro into Ligestra Due (both wholly owned).
In line with the company’s institutional purpose, Fintecna continued its steering and control continued to be exercised
over companies subject to management and coordination, with a view to progressively fulfilling the tasks assigned to
each of the companies under specific legislative provisions.
With reference to the operations carried out through special purpose vehicles, efforts continued in relation to the sale of
the “separate assets” of the dissolved entities E.F.I.M., Iged and “Comitato per l’intervento nella SIR e nei settori ad alta
tecnologia” (through Ligestra Due S.r.l.), and in relation to the liquidation of the residual assets of Cinecittà Luce (through
Ligestra Quattro).
In detail, regarding the separate assets of the dissolved company E.F.I.M., the management of industrial site remediation
works continued, mainly in the Portovesme area in Sardinia.
With regard to the highly complex management of the assets of the dissolved company Iged, a plan for the
valorisation/sale of properties has been defined by formalising specific collaboration arrangements with Cdp Immobiliare
and other outside professionals.
Having regard to the equity investment in XXI Aprile (wholly owned by Fintecna), the early winding-up of the company
and the appointment of a liquidator was approved in the first half of the year.
594. Performance of the CDP Group
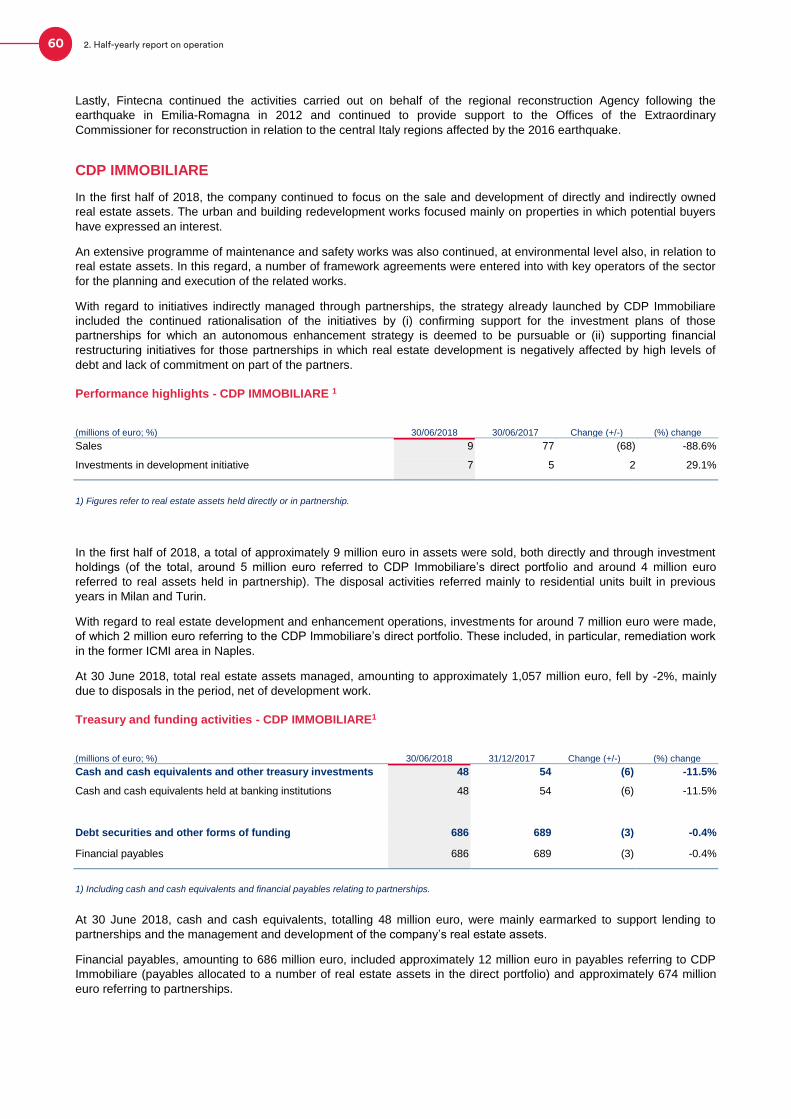
Lastly, Fintecna continued the activities carried out on behalf of the regional reconstruction Agency following the
earthquake in Emilia-Romagna in 2012 and continued to provide support to the Offices of the Extraordinary
Commissioner for reconstruction in relation to the central Italy regions affected by the 2016 earthquake.
CDP IMMOBILIARE
In the first half of 2018, the company continued to focus on the sale and development of directly and indirectly owned
real estate assets. The urban and building redevelopment works focused mainly on properties in which potential buyers
have expressed an interest.
An extensive programme of maintenance and safety works was also continued, at environmental level also, in relation to
real estate assets. In this regard, a number of framework agreements were entered into with key operators of the sector
for the planning and execution of the related works.
With regard to initiatives indirectly managed through partnerships, the strategy already launched by CDP Immobiliare
included the continued rationalisation of the initiatives by (i) confirming support for the investment plans of those
partnerships for which an autonomous enhancement strategy is deemed to be pursuable or (ii) supporting financial
restructuring initiatives for those partnerships in which real estate development is negatively affected by high levels of
debt and lack of commitment on part of the partners.
Performance highlights - CDP IMMOBILIARE 1
(millions of euro; %) 30/06/2018 30/06/2017 Change (+/-) (%) change
Sales 9 77 (68) -88.6%
Investments in development initiative 7 5 2 29.1%
1) Figures refer to real estate assets held directly or in partnership.
In the first half of 2018, a total of approximately 9 million euro in assets were sold, both directly and through investment
holdings (of the total, around 5 million euro referred to CDP Immobiliare’s direct portfolio and around 4 million euro
referred to real assets held in partnership). The disposal activities referred mainly to residential units built in previous
years in Milan and Turin.
With regard to real estate development and enhancement operations, investments for around 7 million euro were made,
of which 2 million euro referring to the CDP Immobiliare’s direct portfolio. These included, in particular, remediation work
in the former ICMI area in Naples.
At 30 June 2018, total real estate assets managed, amounting to approximately 1,057 million euro, fell by -2%, mainly
due to disposals in the period, net of development work.
Treasury and funding activities - CDP IMMOBILIARE1
(millions of euro; %) 30/06/2018 31/12/2017 Change (+/-) (%) change
Cash and cash equivalents and other treasury investments 48 54 (6) -11.5%
Cash and cash equivalents held at banking institutions 48 54 (6) -11.5%
Debt securities and other forms of funding 686 689 (3) -0.4%
Financial payables 686 689 (3) -0.4%
1) Including cash and cash equivalents and financial payables relating to partnerships.
At 30 June 2018, cash and cash equivalents, totalling 48 million euro, were mainly earmarked to support lending to
partnerships and the management and development of the company’s real estate assets.
Financial payables, amounting to 686 million euro, included approximately 12 million euro in payables referring to CDP
Immobiliare (payables allocated to a number of real estate assets in the direct portfolio) and approximately 674 million
euro referring to partnerships.
60 2. Half-yearly report on operation
CDPI SGR
In 2018, CDPI SGR continued to invest in the FIA fund, in support of social housing, and in the FIV fund, in support of the
enhancement of the real estate assets held. Additionally, the subscription period of the FIT fund was re-opened with the
subscription, by CDP, of a further 150 million euro,by CDP bringing the total subscribed to 250 million euro, in line with
forecasts. Lastly, the Fondo Federal District (“FFD”) fund was launched with an initial subscription of 70 million euro by
CDP.
New lending, investments and managed resources - CDPI SGR
Business lines (millions of euro; %) 30/06/2018 30/06/2017 Change (+/-) (%) change
Social housing 92 55 37 66.8%
- FIA 92 55 37 66.8%
Development 8 5 3 50.2%
- FIV (Extra sub-fund) 7 5 2 49.9%
- FIV (Plus sub-fund) 1 1 0 52.5%
Tourism 0 18 (17) -97.6%
- FIT 0 18 (17) -97.6%
Smart Housing - - - n/s
- FIA2 - - - n/s
Total new lending, investments and managed resources 100 78 22 28.7%
In the first six months of 2018, CDPI SGR invested around 100 million euro, marking a significant increase on the same
period in 2017, thanks mainly to the positive contribution of the FIA fund. In detail:
FIA invested a total of approximately 92 million euro, primarily in the following funds: Immobiliare di Lombardia,
Housing Sociale FVG, Housing Sociale Liguria and Abitare Sostenibile Piemonte;
FIV invested a total of approximately 8 million euro on the redevelopment of the Ospedali Riuniti di Bergamo complex
to adapt the buildings for a Guardia di Finanza Academy and on the demolition and remediation works at Magazzini
Taliedo (Milan) and former Caserma Colleoni (Bergamo).
FIT invested a total of 0.4 million euro on real estate assets in Pila and Marilleva.
Performance highlights - CDPI SGR
(millions of euro; %) 30/06/2018 31/12/2017 Change (+/-) (%) change
Real estate assets managed 1 (FIV) 644 664 (21) -3.1%
Real estate assets managed 1 (FT1) 59 59 0 0.8%
Residual commitment 2 (FIA) 1,077 1,171 (93) -8.0%
1) Value referring to direct real estate funds, showing the value of the real estate assets held by each fund.
2) Value referring to fund subscriptions, net of amounts called-up.
At 30 June 2018, real estate assets managed by the company on behalf of FIV consisted of 87 assets with a value of
approximately 644 million euro, of which around 566 million euro referred to the Extra sub-fund (69 assets) and around
78 million euro referred to the Plus sub-fund (18 assets).
The asset pool decreased by -3.1% compared to 2017 due to sales in the year (around 30 million euro), adjustments
related to FIV Extra Sub-fund (approx. 6 million euro), net of acquisitions from the state property office (approx. 7 million
euro)12 and capex in the period (approx. 8 million euro).
Real estate assets of the FT1 fund increased on 2017 due to investments made.
With reference to the FIA fund, the total residual commitment towards the target real estate funds was approximately
1,077 million euro. The lower commitment compared to 2017 (-8.0%) was primarily due to investments made in target
funds that support social housing.
12 The document confirming the occurrence of the required conditions for the Via Cassia property was formalised in the first half of 2018
614. Performance of the CDP Group
Half-yearly Financial Report 2018

Treasury and funding activities - CDPI SGR
(millions of euro; %) 30/06/2018 31/12/2017 Change (+/-) (%) change
Cash and cash equivalents and other treasury investments 17 17 (1) -4.0%
Cash and cash equivalents held at banking institutions 17 14 2 16.6%
Other treasury investments - 3 (3) n/s
At 30 June 2018, cash and cash equivalents held by CDPI SGR amounted to approximately 17 million euro, down
slightly from year-end 2017. The decrease in treasury investments is due to securities held at year-end 2017 having
reached maturity.
As in 2017, the company had no financial debt at 30 June 2018.
CDP RETI
On 27 March 2018, the Board of Directors of CDP RETI approved the Model of Organisation, Management and Control
pursuant to Legislative Decree 231/2001 (General and Special Part) and concomitantly appointed the Supervisory Body,
entrusting the related functions to the Board of Statutory Auditors.
Performance highlights - CDP RETI
(millions of euro; %) 30/06/2018 30/06/2017 Change (+/-) (%) change
Equity investments and other investments 1 5,023 5,023 0 0.0%
Dividends received 358 344 15 4.2%
1) Comparison figures refer to 31 December 2017.
Equity investments, totalling 5,023 million euro and showing no change on the comparison period, consisted of
investments in Snam (3,087 million euro), Terna (1,315 million euro) and Italgas (621 million euro).
In the first half of 2018, CDP RETI received dividends from subsidiaries totalling 358 million euro (344 million euro in the
first half of 2017), of which 227 million euro from Snam (2017 advance dividend of 91 million euro13 and 2017 final
dividend of 136 million euro), 87 million euro from Terna (2017 final dividend) and 44 million from Italgas (dividend paid
from 2017 net profit). Regarding dividends paid to shareholders, in the first half of 2018, CDP RETI paid out 140 million
euro (as final payment for the 2017 dividend). It bears recalling that a part (324 million euro) of the 2017 net income was
distributed in November 2017 as an advance dividend14.
Treasury and funding activities - CDP RETI
(millions of euro; %) 30/06/2018 31/12/2017 Change (+/-) (%) change
Cash and cash equivalents and other treasury investments 239 44 196 n/s
Cash and cash equivalents held at banking institutions 239 44 196 n/s
Cash and cash equivalents at CDP 0 0 (0) -2.7%
Debt securities and other forms of funding 1,688 1,694 (7) -0.4%
Financial payables 938 937 0 0.0%
Other debt securities 750 757 (7) -0.9%
At 30 June 2018, total cash and cash equivalents and treasury investments amounted to 239 million euro, increasing by
+196 million euro on year-end 2017 mainly as a result of dividends received from subsidiaries in the period (+358 million
13 Advance approved by the Board of Directors of Snam S.p.A. on 6 November 2017 and recognised in the financial statements of CDP RETI S.p.A. as at 31 December 2017. The dividend was received in January 2018. 14The advance, equivalent to 2,006.02 per each of the 161,514 shares, was approved on the basis of the Company's accounting situation at 30 June 2017, prepared in accordance with IFRS. The accounts stated a net income of approximately 360 million and available reserves of approximately 3,345 million euro.
62 2. Half-yearly report on operation
euro), only partly offset by dividends distributed to shareholders in the period (-140 million euro), bond coupons paid (- 14
million euro) and interest expense on the term loan (-7 million euro).
At 30 June 2018, debt securities and other forms of funding totalled 1,688 million euro and referred mainly to: (i) the term
loan for a nominal amount of 937 million euro (approx. 422 million euro disbursed by CDP), in line with year-end 2017
and (ii) the bond issue for a nominal amount of 750 million euro, subscribed by institutional investors for around 412
million euro (55%) and by the Parent Company for approximately 338 million euro (45%).
4.1.2.2 PERFORMANCE OF OTHER COMPANIES NOT SUBJECT TO MANAGEMENT AND COORDINATION
Some brief information is provided below about each of the companies in which CDP holds an equity investment but that
are not subject to management and coordination.
Elite S.p.A. (“Elite”)
Elite was established in May 2016 following the transformation into a joint-stock company of the business unit of Borsa
Italiana S.p.A. focused on the homonymous programme. The Elite programme, now representing the company’s core
business, is aimed at supporting SMEs with high-growth potential in their process of development and international
expansion. In addition, Elite provides services of licensing of its brand and business model to other stock exchanges
around the world and offers support to enterprises in accessing alternative sources of funding, also through advanced
technological solutions.
On 31 October 2017, CDP acquired a 15% stake in Elite, through a dedicated capital increase that enabled CDP to
become a non-controlling shareholder of the company.
Over 200 new Italian, European and UK companies signed up to Elite in the first half of 2018. Following the success of
the first Basket Bond, launched at the end of 2017, a second Basket Bond is expected to be launched in 2018.
Additionally, Elite One Platform - an integrated interface of Elite services supporting end-users - is scheduled for launch
by the end of the year.
Eni S.p.A (“Eni”)
In the second quarter of 2018, like in the first, Eni continued with a strong growth trend with earnings up by 152%, with
Brent in euro up 38%, driven by the performance of the E&P business, which more than tripled its contribution.
Consolidated cash generation also increased sharply, driven by the price of Brent and increased production, with a
contribution per barrel rising to 20 USD.
Performance of the G&P business was also excellent thanks to greater integration between the LNG business and
upstream activities and the major reorganisation completed by the ENI Management in recent years. The decline in the
Refining and Chemical business - anti-cyclical with respect to Brent - resulted in a lower contribution from these
segments, which did however remain in positive territory, benefitting from the restructuring commenced in previous
years.
At the level of consolidated income figures, ENI reported an adjusted operating profit of 4.9 billion euro (+73% on the first
half of 2017) and a consolidated net income of 2.2 billion euro (+124%, compared to 0.98 billion euro in the first half of
2017).
In terms of consolidated balance sheet figures at 30 June 2018, net debt continued to decrease and is now under 10
billion euro - the lowest level recorded in the last 11 years - and equity increased by 2.5 billion euro to 50.5 billion euro
(48 billion euro at 31 December 2017).
63
Half-yearly Financial Report 2018
4. Performance of the CDP Group

Europrogetti & Finanza S.r.l. in liquidation (“EPF”)
EPF is a company that was established in 1995 by leading Italian financial institutions to handle applications for
subsidised lending provided by the Italian government. The company’s shareholders are: UniCredit S.p.A. (39.8%), CDP
(31.8%), Intesa Sanpaolo S.p.A. (16.0%), Banca Monte dei Paschi di Siena S.p.A. (10.1%) and Banco BPM S.p.A.
(2.3%).
The liquidation of EPF continued in the first half of 2018, with the goal of completing all the subsidised lending related
activities still in place as expeditiously as possible. On 18 June 2018, with a view to reducing liquidation costs, the
Shareholders’ Meeting resolved to convert EPF from a joint stock company (società per azioni) to a limited liability
company (società a responsabilità limitata). EPF currently provides services, exclusively for the Ministry of Economic
Development, of submission and preparation of final reports relating to investments already made by the beneficiaries of
the subsidised lending initiatives. There is uncertainty regarding the time required for the completion of these activities,
because the final closure of the procedures often depends on external factors that cannot be influenced by the company.
F2i - Fondi Italiani per le infrastrutture SGR S.p.A. (“F2i SGR”)
In the first half of 2018, the company continued to manage the equity investments of Secondo Fondo F2i and Terzo
Fondo F2i, successfully pursuing investment opportunities in new sectors, as well as in those in which F2i is already
present.
Fincantieri S.p.A. (“Fincantieri”)
Fincantieri, an investee company of CDP through Fintecna, is one of the largest shipbuilders in the world and is capable
of building all types of highly-complex vessels from naval to offshore vessels and from special vessels and ferries to
mega-yachts. It is also engaged in ship repairs and conversions, systems and components production, and the provision
of after-sales services. The company is listed on the Italian stock market.
In the first half of 2018, Fincantieri confirmed the growth areas identified in the new 2018-2022 business plan and closed
the half year period with revenues in excess of 2.5 billion euro (+10% on 30 June 2017), EBITDA at 183 million euro
(equivalent to an EBITDA margin of 7.3%, increasing by 25% on 30 June 2017) and a positive net income for the period
of 15 million euro (+36% on 30 June 2017). At 30 June 2018, the Fincantieri Group had a backlog of approximately 22
billion euro, with 99 ships in portfolio, and a soft backlog of approximately 7.8 billion euro, resulting in a total workload of
approximately 29.8 billion euro (corresponding to around 6 years of business).
Additionally, on 2 February 2018, Fincantieri signed an agreement with the French government to acquire a 50% stake in
STX France from STX Europe and, on 19 February 2018, it was awarded a contract from the US Navy to develop a
customised version of the new next-generation, multi-role frigates under the FFG(X) scheme. On 24 July 2018 a
proposal was approved in relation to the delisting of the subsidiary VARD from the Singapore stock exchange.
Fondo Italiano d’Investimento SGR S.p.A (“FII SGR”)
In the first half of 2018, FII SGR continued to manage the following funds: (i) Fondo Italiano d’Investimento - FII Venture
(ii) Fondo Italiano d’Investimento – Fondo di Fondi; (iii) FoF Venture Capital; and (iv) FoF Private Debt. In September
2017, the first closing was completed of two new direct funds: (i) Fondo Innovazione e Sviluppo and (i i) FII Tech Growth.
The first of these funds is focused on strengthening the competitiveness of Italian enterprises by promoting the
processes of consolidation and integration and the second is focused on investments in start-ups and small and medium
enterprises in the late-stage venture capital phase. The company is continuing the fundraising phase for both funds, with
the aim of attracting other investors and reaching the target size.
At 30 June 2018, CDP held a share of 43% of FII SGR. The share capital is held as follows: CDP (43.0%); Unicredit
(12.5%); Intesa Sanpaolo (12.5%); Monte dei Paschi di Siena (12.5%); Nexi (12.5%); ABI (3.5%); and Confindustria
(3.5%).
FSI SGR S.p.A (“FSI SGR”)
FSI SGR S.p.A. was incorporated on 25 February 2016 with the aim of generating value for investors via the
management of one or more investment funds, through equity investments intended to promote the growth of the
companies (“growth capital”). On 6 December 2016, the Bank of Italy, subject to Consob’s favourable opinion, granted
FSI SGR the authorisation to carry out asset management activities.
At 30 June 2018, CDP held a share of 39% of FSI SGR. The share capital is held as follows: Magenta 71 S.r.l. – a
vehicle owned by the managers chosen to manage the initiative (51.1%); CDP (39.0%); and Poste Vita S.p.A. (9.9%).
64 2. Half-yearly report on operation
Lastly, the first closing of the “FSI Mid-Market Growth Equity Fund” was completed on 29 June 2017. The Fund is
promoted and managed by FSI SGR with the goal of investing in Italian companies with significant potential for
development, with a focus on organic growth and/or growth by acquisitions, on sector/chain consolidation, and on
facilitating the IPO process. Alongside CDP - the anchor investor of the initiative - other subscribers include sovereign
funds, European insurance companies and banks, foundations and asset managers. At 30 June 2018, FSI Mid Market
Growth Equity Fund had received subscriptions for capital commitments of over 1.2 billion euro.
Istituto della Enciclopedia Italiana Fondata da Giovanni Treccani S.p.A. (“Treccani”)
Treccani was established in 1933 through a legislative act, with the aim of continuing the publishing of the Italian
encyclopaedia initiated by the Istituto Giovanni Treccani in 1925. Treccani’s activities mainly consist of the editorial,
scientific or premium production of encyclopaedias and valuable works such as such as art books and history books.
On 18 October 2017, CDP acquired a 7.4% equity investment in Treccani, through a capital increase dedicated to new
shareholders.
At 30 June 2018, Treccani’s accounts show a positive pre-tax profit, in line with expectations.
Istituto per il Credito Sportivo (“ICS”)
From 1 March 2018, ICS is no longer under extraordinary administration, a procedure started in 2012. Now under
ordinary administration, new corporate bodies have been appointed.
ICS is the only state-owned bank to focus on financing sport and culture.
It should be recalled, with regard to the equity investment in ICS, that in 2013 the Prime Minister rescinded the 2005
Articles of Association, in implementation of the Directive issued to ICS in accordance with the Law dated 24 December
2003. Accordingly, in 2014 new Articles of Association were adopted, resulting in an increase in capital from
approximately 9 million euro to 835 million euro, through the conversion of the endowment fund. The equity interests held
by private investors in ICS were diluted as a result of the increased stake held by the government, and in particular
CDP’s interest fell from 21.62% to 2.22%.
Italgas S.p.A. (“Italgas”)
Italgas is the main natural gas distribution operator in Italy and the third largest in Europe. The company is listed on the
Italian stock market, in the FTSE MIB Index of Borsa Italiana.
Total revenues in the first half of 2018 (591 million euro) increased by 27 million euro (+4.7%) on the first half of 2017
and operating profit (223 million euro) increased by 19 million euro (+9.3%) on the corresponding period of 2017. This
increase is the outcome of the aforesaid increase in revenues and the decrease in operating costs, partly offset by the
increase in depreciation/amortisation and impairments.
At 30 June 2018, Italgas reported net income of 151 million euro, increasing by 11 million euro (+8.0%) on the first half of
2017, mainly due to the abovementioned increase in operating profit, partially offset by higher net financial charges,
lower net income from equity investments and higher income taxes.
At the level of the cash flow statement and debt, all net investment needs in the first half of 2018 were covered by net
cash flow from operating activity (632 million euro), resulting in positive free cash flow of euro 393 million - before M&As.
The net financial position increased to 3,591 million euro at 30 June 2018 (-129 million euro at 31 December 2017).
Having regard to key events in the first half of 2018, Italgas confirmed its commitments in respect of investments on the
network, digitisation processes and acquisitions.
A substantial share of the investments referred to the plan to replace traditional meters with smart meters (including non-
consolidated investees, just under 1 million new smart meters were installed in the first half of 2018, bringing the total to
around 3.98 million - equal to around 49% of total meters installed).
The strategy to consolidate Italgas’ presence in the gas distribution market was continued and a number of corporate
transactions were finalised, some of which announced in 2017. In detail, the following acquisitions were finalised:
Ichnusa Gas S.p.A. (100%), Medea S.p.A. (100%), a business unit comprising several gas distribution concessions,
acquired from Amalfitana Gas, a set of businesses that hold 16 natural gas distribution concessions in the Campania,
Calabria and Sicily regions (98%) and the distribution network of the Municipality of Portopalo di Capopassero, acquired
from AEnergia Reti S.r.l..
The acquisition of Seaside S.r.l. - one of Italy’s leading energy services companies - was also finalised in the half year.
65
Half-yearly Financial Report 2018
4. Performance of the CDP Group

Poste Italiane S.p.A. (“Poste Italiane”)
Poste Italiane is the largest Italian company in the services sector and the first in the country in terms of number of
employees. The company, listed on the Italian stock market, operates in the mail and logistics sector and is one of the
main players in Italy in financial services and insurance.
At the level of the main consolidated income statement figures, total revenues amounted to 5.429 billion euro at 30 June
2018, decreasing slightly by -1.3% on the first half of 2017. In detail, the “Mail, packages and distribution” sector posted
revenues from third parties of 1.761 billion euro, down -2,8% on the previous period. In the “Mobile and Digital
Payments” sector, revenues from third parties increased sharply to 307 million euro in the period (+10.4% on the same
period of the previous year) owing to an increase in the number of PostePay cards issued (now at 18.6 million) and an
increase in the number of payments executed (0.55 billion euro, +27.1% on the first half of 2017). The “Financial
Services” sector saw a slight decline (-1.3% on the previous year), generating 2.676 billion euro in revenues from third
parties. Lastly, the “Insurance Services” sector contributed 685 million euro of revenues from third parties, down -1.9%
on the previous year. In addition, operating profit as at 30 June 2018 increased significantly by 24.3% on the same
period in the previous year, to 1.053 million euro, mainly due to improved operating efficiencies in all business sectors:
the “Mobile and Digital Payments” sector posted a positive result of 101 million euro; the “Financial Services” sector was
the biggest contributor to operating profit in the period with 408 million euro; revenues from “Insurance Services”
amounted to 360 million euro, while the operating profit of the “Mail, Packages and Distribution” sector increased sharply
to 184 million euro in the half year period. Lastly, net income increased sharply to 735 million euro in the first half of 2018
(+44% compared to 510 million euro in the same period of the previous year).
At 30 June 2018, cumulative direct and indirect funding amounted to 510 billion euro, up 0.8% on 506 billion euro
recorded at the end of 2017. This increase is due to positive net inflows from life insurance products, deposits and
investment funds in the first half (4.4 billion euro).
QuattroR SGR S.p.A. (“QuattroR SGR”)
QuattroR SGR was incorporated on 4 August 2016. On 30 December 2016 it was authorised by the Bank of Italy, with
Consob’s favourable opinion, to carry out asset management activities. The QuattroR SGR was established to promote
and implement, through one or more funds, operations for the restructuring, support and consolidation of the financial
and equity structure of Italian companies which, despite temporary financial or equity imbalances, present good industry
and market prospects. At 30 June 2018, QuattroR SGR managed the QuattroR investment fund, which completed the
first closing on 5 April 2017, attracting subscriptions of approx. 700 million euro, as describer further down.
At 30 June 2018, CDP held a 40.0% stake in QuattroR SGR and the remainder (60%) was held by the managers chosen
to manage the initiative.
Risparmio Holding S.p.A. (“Risparmio Holding”)
Risparmio Holding S.p.A., owned by Poste Italiane S.p.A. (80%) and CDP (20%), was incorporated on 7 October 2016.
The company was set up to participate in the competitive procedure launched by UniCredit S.p.A. in connection with the
sale of the asset management operations of Pioneer Global Asset Management S.p.A.
On 3 July 2017, UniCredit and Amundi announced the closing of the transaction relating to the sale of Pioneer’s business
activities to Amundi
Snam S.p.A. (“Snam”)
Snam, a company engaged in the transportation, storage and regasification of natural gas, is the European leader in the
construction and integrated management of natural gas infrastructures. The company is listed on the Italian stock
market, in the FTSE MIB Index of Borsa Italiana.
Total revenues in the first half of 2018 (1,242 million euro - net of pass-through items) increased by 28 million euro
(+2.3%) on the first half of 2017 and operating profit (729 million euro) increased by 15 million euro (+2.1%) on the
corresponding period of 2017. This growth is essentially due to higher revenues contributed mainly by the transport and
storage sectors, partly offset by higher amortisation/depreciation and impairment in the period due to new assets
becoming operational.
At 30 June 2018, Snam reported net income of euro 523 million, increasing by euro 19 million (+3.8%) on the first half of
2017, due to the abovementioned increase in operating profit and the lower net financial charges, partially offset by
higher income taxes.
66 2. Half-yearly report on operation

Turning to the statement of cash flows and debt, the net cash flow from operating activity (1,525 million euro) covered all
net investment needs in the period (488 million euro), including equity investments, and resulted in a positive free cash
flow of 1,037 million euro. Net of the equity cash flow for the payment of the 2017 dividend to shareholders (731 million
euro) and to purchase treasury shares (183 million euro), net financial debt stood at 11,421 million euro, decreasing by
129 million euro on 31 December 2017.
Key events in the first half of 2018 included the acquisition of an 82% majority stake in TEP Energy Solution (TEP), one
of Italy’s leading energy efficiency businesses (for around 21 million euro) and the award by the Greek privatisation
agency (TAIPED) of a contract under which the European consortium between Snam (leader with a 60% stake), Enagás
(20%) and Fluxys (20%) will acquire a 66% stake in DESFA - the national operator of natural gas infrastructure.
Lastly, the share buyback programme continued with the acquisition, in the first half of 2018, of shares equivalent to
1.39% of the company’s share capital. Said shares were still outstanding following the cancellation of 31,599,715
treasury shares without reduction of share capital. At 30 June 2018, including the shares purchased in the first half of
2018 and after the cancellation of treasury shares, Snam held treasury shares representing 2.96% of its share capital.
Telecom Italia S.p.A. (“Tim”)
Tim is the biggest telecommunications operator in Italy and is active in all service segments: landline, mobile and internet
telecommunications, multimedia and television, office & system solutions, research & development. It has an
international scope having a presence in Europe, America, Africa and Asia. Telecom Italia S.p.A. shares are listed on the
Italian stock exchange and are included in more than 50 national and international indices.
Tim reported revenues of 9,441 million euro in the first half of 2018. Comparable revenues, based on the same
accounting standards, amounted to 9,512 million euro in the first half of 2018, down 2.7% on the first half of 2017 (9,772
million euro). The positive performance of the Domestic Business Unit (+24 million euro in revenues) was offset by the
fall in revenues of the Brazil Business Unit (-286 million euro), which was entirely due to the depreciation of the Brazilian
real.
Operating profit was 1,644 million euro in the first half of 2018. The comparable operating profit was 1,728 million euro in
the first half of 2018, down 7.6% on the first half of 2017 (1,871 million euro). Net income attributable to Shareholders of
the Parent amounted to 554 million euro in the first half of 2018. The comparable figure stood at 618 million euro (596
million euro in the first half of 2017).
Turning to the statement of cash flows and debt, cash flows from Group operating activities was positive for 886 million
euro (958 million euro in the first half of 2017). These cash flows were used mainly to pay dividends (on savings shares)
for a total of 222 million euro and for items associated with financing operations. Adjusted net financial debt amounted to
euro 25.141 million at 30 June 2018, decreasing by 167 million euro on 31 December 2017 (25,308 million euro).
Terna S.p.A. (“Terna”)
Terna is an independent energy transmission grid operator and one of the largest in Europe in terms of kilometres of
lines managed. The company is listed on the Italian stock market.
In the first half of 2018, Terna achieved growth in relation to the main economic and financial indicators. In particular,
revenues amounted to 1,080 million euro, up 35 million euro (+3.3%) on the same period of 2017. The increase was
mainly due to the increase in Regulated tariff revenues and to the contribution of the Non-regulated area, especially due
to increased sales by the Tamini Group and the progress made on the private Italy-France Interconnector. Operating
profit came to 548 million euro, up by 14 million euro (+2.5%) on the first half of 2017, while the Group’s net income
amounted to 360 million euro, up by 9 million euro on the previous financial year (+2.5%).
At the level of the cash flow statement and debt, cash flow from operating activity of 555 million euro covered all
investment needs for the period of 338 million euro, resulting in positive free cash flow of 217 million euro. Consequently,
considering primarily the outlay for dividends distributed to shareholders in the first half of 2018 (293 million euro), net
financial debt stood at 7,896 million euro at 30 June 2018, increasing by 99 million euro on 31 December 2017.
Key events in the first half of 2018 included the entry into service, on 15 June 2018, of the “C.P. Sacca Serenella-C.P.
Cavallino” 132 kV underground power line, the first phase of Terna’s intervention to modernise and increase the safety
and efficiency of the electricity grid of the Venetian Lagoon. Terna has also commenced work on the second section that
will complete the infrastructure: the “Fusina 2-C.P. Sacca Fisola” 132 kV underground power line, to be completed by the
end of 2018.
674. Performance of the CDP Group
Half-yearly Financial Report 2018

4.1.2.3 PERFORMANCE OF INVESTMENT FUNDS AND INVESTMENT VEHICLES
Some brief information about the activities in the first half of 2018 of each fund to which CDP has made commitments is
provided below.
2020 European Fund For Energy, Climate Change And Infrastructure Sicav-Fis Sa (“Marguerite Fund”)
The Fund, which was established in 2009, has a total size of approximately 638 million euro, of which 89.9 million euro
subscribed by CDP.15 It reached the end of its investment period in December 2017. At 30 June 2018, the Marguerite
Fund had invested in 10 companies in 8 member states, issuing total capital calls to its investors of 598.5 million euro
(approximately 94% of total commitments) and has committed the total remaining amount. Additionally, as part of the
establishment of the Marguerite Fund II, in the first quarter of 2018 the sale was completed, at cost, of 4 assets (“seed
assets”) from Marguerite to Marguerite II, consisting of: biomass plants in Portugal, an onshore wind farm in Sweden, the
Pedemontana-Veneta dual carriageway and the FTTH network in France (Losange SAS).
In the first half of 2018, the Fund distributed approx. 106.8 million euro of capital to investors, as follows: (i) ordinary
distributions (27 million euro) and (ii) transfer of seed assets to Marguerite II (79.8 million euro).
The Fund’s estimated NAV at 30 June 2018 was approximately 362 million euro, of which 51 million euro attributable to
CDP.
Connecting Europe Broadband Fund, Sicav-Fis (“CEBF”)
The Connecting Europe Broadband Fund (CEBF) completed its first closing on 27 June 2018. The initiative, which is
jointly promoted with the European Commission, the EIB and the National Promotional Institutions (NPIs) CDC and KfW,
is aimed at financing "small-scale" ultra-broadband infrastructures in Europe - with focus on areas with partial market
failure - through equity/quasi-equity instruments. CEBF is the first investment platform within the EFSI framework to
support ultra-broadband infrastructures with the aim of supporting the achievement of the targets set in the European
Digital Agenda. It is also an innovative tool thanks to its layered structure, i.e. different risk-return profiles for various
classes of investors, aimed at attracting additional private resources. The Fund manager is Cube Infrastructure
Managers (“Cube”), an international fund manager with assets under management of around 1.4 billion euro.
The Fund reached 420 million euro at the first closing, underwritten as follows: 50 million euro by CDP, equal to the other
NPIs; 140 million by the EIB (100 million euro of which underwritten as EFSI resources); 100 million euro by the
European Commission; 25 million euro by a private European investor and 5 million euro by Cube. The collection target
is set at 500 million euro within the next 18 months.
CDP’s investment, equal to that of other NPIs, was completed in Class A units, which are more senior compared to the
Class B units underwritten by the EIB (EFSI resources) and the European Commission (first loss).
At 30 June 2018, the Fund does not have any investments in its portfolio and has not made any capital calls to investors.
European Energy Efficiency Fund SA, SICAV-SIF (“EEEF Fund”)
EEEF is a Luxembourg variable capital investment vehicle established in 2011, with total commitments of 265 million
euro, of which 59.9 million euro subscribed by CDP. At 30 June 2018, the Fund’s portfolio included 12 investments in 8
countries (2 in Germany, 1 in Holland, 3 in France, 1 in Italy, 1 in Romania, 2 in Spain, 1 in Great Britain and 1 in
Portugal).
During the reporting period, the Fund had not made any capital calls to investors.
It should be noted that in December 2015, the draw-down ratio between the various categories of the Fund’s investors
was changed (“class A” units, “senior tranches” subscribed by CDP and EIB; “class B” units, “mezzanine tranches”,
subscribed by CDP, EIB and Deutsche Bank, the fund’s manager; and “class C” units, “junior tranches”, subscribed by
15 In February 2018, an unused commitment of approximately 71.8 million euro was released (CDP’s share was approximately 10.1 million) in relation to the transfer of the so-called “seed assets” to Marguerite II, with the associated investment commitments amounting to 71.8 million euro. The figure shown reflects the “revised” value of the fund’s Commitment (including CDP’s commitment), compared to an original commitment of 710 million euro (CDP’s share was 100 million euro).
68 2. Half-yearly report on operation
the European Commission) and the investment period solely for “class A” and “class B” units was also extended from 31
March 2016 to 31 December 2018. The commitment period relating to the “class C” units expired in March 2017, with a
total capital call of around 97 million euro (compared to the original commitment of 125 million euro).
At 30 June 2018, the fund’s NAV was estimated at approximately 138.5 million euro, of which approximately 17 million
euro attributable to CDP.
F2i – Secondo Fondo Italiano per le Infrastrutture
The Fund, which was established in 2012, completed the fundraising process in July 2015 with a total commitment of
1,242.5 million euro. The investment period will end in July 2018.
In the first half of 2018, the Fund made capital calls for a total of approximately 34.7 million euro. The main investments
concluded in the reporting period were: (i) early termination of the earn-out agreement with the ENEL group linked to 2i
Rete Gas; (ii) acquisition of a 90% stake in KPNQWest Italia S.p.A., through IRIDEOS S.p.A, the holding in which a stake
of 80% is owned by Secondo Fondo F2i, which aims to act as a catalyst for the Italian cloud and datacenter sector; (iii)
acquisition of a seventh company of the Veronagest group and (iv) signing of an agreement with two companies of the
ENEL Group - ENEL Produzione and ENEL Green Power - to acquire the entirety of their vegetable biomass plants16.
Since launch, the Fund has called up approximately 719 million euro (57.9% of the Fund’s commitment) and made
distributions (income and redemptions) of around 154 million euro.
At 30 June 2018, the fund’s NAV was estimated at approximately 1,004 million euro, of which approximately 81 million
euro attributable to CDP.
F2i – Terzo Fondo per le Infrastrutture
Terzo Fondo F2i completed its first closing in December 2017 through the merger by incorporation of Primo Fondo F2i,
as well as the subscription of new commitments for a total of 3,142 million euro. At 30 June 2018, the second closing had
been completed and the Fund had reached a size of around 3,439 million euro.
In the first half of 2018, the Fund issued capital calls for a total of 26.5 million euro. The main investments in the period
were: (i) early termination of the earn-out agreement with the ENEL group in relation to 2i Rete Gas; (ii) acquisition,
through F2i Energie Rinnovabili, of five companies operating in the renewable energy sector, from 3 New Srl (wholly
owned by an infrastructure fund of Ardian); (iii) acquisition, through 2i SAC - a wholly owned subsidiary of 2i Aeroporti -
of an additional 12% stake in GE.S.A.C., from the Municipality of Naples; (iv) acquisition, through 2i Aeroporti, of an
additional 0.64% stake in SEA from the Province of Varese; (v) acquisition, through 2i Aeroporti, of an additional 5%
stake in SAGAT S.p.A., from the Metropolitan City of Turin.
Since launch, the Fund has called up approximately 2,068.5 million euro, equal to 60.15% of subscribers’ commitments,
and has made distributions (income and redemptions) of around 19 million euro.
At 30 June 2018, the fund’s NAV was estimated at approximately 2,046 million euro, of which approximately 89 million
euro attributable to CDP.
Fondo PPP Italia
Launched in 2006 with a total size of 120 million euro, the Fund ended its investment phase in 2013 and may carry out
add-on acquisitions on existing portfolio investments until December 2018 (the Fund’s maturity). Since launch, the Fund
has called up approximately 106 million euro, equal to approximately 88% of subscribers’ commitments, and issued
gross distributions of approximately 48.8 million euro.
In the first half of 2018, the Fund made distributions to investors of approximately 2.2 million euro (0.3 million euro
attributable to CDP). During the reporting period, the Fund did not issue additional capital calls to subscribers. The sale
of the equity investments in Catalyst Brescia S.r.l. and Società di Biotecnologie S.p.A was also finalised in 2018. The
Fund currently has 12 projects in its portfolio, of which 5 carried out in public-private partnership and 7 in the renewable
energy sector.
16 The transaction is subject, inter alia, to approval by the Antitrust Authority and may entail several closings between 2018 and 2019.
694. Performance of the CDP Group
Half-yearly Financial Report 2018

The Fund’s estimated NAV at 30 June 2018 was approximately 70 million euro, of which 10 million euro attributable to
CDP.
Inframed Infrastructure Sas À Capital Variable (“Fondo Inframed”)
The Fund, which was established in 2010, has a total size of 385 million euro.
At 30 June 2018, the Fund’s portfolio, for which the investment period ended on 31 December 2015, consisted of 5
greenfield investments: three already operational, of which two in Turkey (“LimakPort Iskenderun” and “Limak Dogalgaz”)
and one in Jordan (“Jordan Wind Project Company”); one under construction (96% completed) in Egypt (“Egyptian
Refining Company”) and one under development in Jordan (“Lamsa Wind Project”).
In the first half of 2018, the Fund did not issue capital calls or make follow-up investments in projects under development.
Around 239 million euro of the Fund’s total commitment have been invested. Since it commenced operations, the Fund
has called up approximately 325 million euro, corresponding to 84% of the total shareholders’ commitment.
At 30 June 2018, the Fund’s NAV was approximately 320 million euro.
Marguerite II SCSp (“Marguerite Fund II”)
The Marguerite Fund II, the successor fund of the Marguerite Fund, completed its first closing on 30 November 2017,
reaching an overall size of 705 million euro, of which 100 million euro subscribed by CDP. At 30 June 2018, the Fund
had completed a second closing with additional subscriptions of 40 million euro, reaching a size of 745 million euro.
At 30 June 2018, the Marguerite II Fund had invested in 6 companies in 4 member states (2 in Italy, 1 in Sweden, 2 in
Portugal and 1 in France) and had issued capital calls to its investors for a total of 142.8 million euro (approximately 19%
of total commitments).
We recall that, as part of the establishment of the Marguerite Fund II, in the first quarter of 2018 the sale was completed,
at cost, of 4 assets (“seed assets”) from Marguerite, consisting in particular of: biomass plants in Portugal, an onshore
wind farm in Sweden, the Pedemontana-Veneta dual carriageway and the FTTH network in France. In the first half year,
the Fund also acquired a 39% stake in City Green Light, a leading Italian private operator in the sector of public
illumination. Finally, the Fund has signed an agreement to join the Ellalink submarine cable system as new sponsor to
help develop the project which will provide telecoms connectivity between Spain, Portugal and Brazil.
The Fund’s estimated NAV at 30 June 2018 was approximately euro 139.6 million, of which euro 19.8 million attributable
to CDP.
Fondo Immobiliare di Lombardia (“FIL”) – Sub-fund One
The Sub-fund One of FIL has been operational since 2006 and had a total size of 521.9 million euro at 30 June 2018, of
which 3.8% subscribed by CDP. The Fund is currently in the investment phase.
At 30 June 2018, a total of around 334 million euro had been called-up (corresponding to around 64% of subscribed
commitments), of which around 11.8 million euro attributable to CDP, and the Fund had distributed around 23 million
euro, of which around 1 million euro attributable to CDP as partial pro rata capital repayments.
The Fund did not undertake new initiatives in the first half of 2018. At 30 June 2018, the Fund had 21 initiatives in its
portfolio, for a total of 3,100 accommodation units, 1,016 already completed, and 3 university halls of residence with a
total of 939 bed-spaces, of which 541 already completed. In the first half of 2018, FIL issued capital calls for around 50.7
million euro and pro rata capital repayments amounting to around 12.2 million euro.
Fondo Investimenti per l’Abitare (“FIA”)
This Fund has been operational since 2010 and had a total size of 2,028 million euro at 30 June 2018, 1,000 million of
which subscribed by CDP (49.3% of total subscribed). The Fund is currently in the investment phase.
At 30 June 2018, a total of around 950 million euro had been called-up (equal to around 47% of subscribed
commitments), of which 468.8 million euro attributable to CDP, and the Fund had distributed around 14.7 million euro, of
which 7.4 million euro attributable to CDP as partial capital repayments.
70 2. Half-yearly report on operation

Payments of approximately 92 million euro, called up by the underlying funds, were also made in the first half of 2018. At
the end of the first half of the year, investments of 1,733 million euro had been definitively authorised (approximately 85%
of the Fund amount subscribed) and investments of 773 million euro had received authorisation according to dynamic
allocation, in 30 local funds managed by nine management companies. On the whole, total authorisations refer to
approximately 28017 projects that are expected to ultimately (completion is scheduled for 2020) yield 20,000 social
housing units and 8,500 bed-spaces in temporary and student residences, in addition to local services and proximity
stores.
In the first half of 2018, FIA had called up 46.0 million euro attributable to CDP.
Fondo Investimenti per la Valorizzazione (“FIV”)
Extra Sub-fund
The Extra Sub-fund of FIV has been operational since 2013 and had a total size of 1,130 million euro at 30 June 2018,
entirely subscribed by CDP. The Sub-fund is currently in the investment phase.
At 30 June 2018, a total of 798.9 million euro had been called-up from CDP (around 70.7% of subscribed commitments)
and 25.9 million euro had been distributed, as partial pro rata capital repayments.
In the first half of 2018, the Extra Sub-fund completed the acquisition of a real estate property on Via Cassia in Rome,
which was acquired as part of an extraordinary transaction with the State Property Office, involving 6 properties of a total
value of around 20 million euro. It also sold 4 properties for a total value of 31 million euro.
The Extra Sub-fund did not issue capital calls in the first half of 2018 but made a partial repayment totalling 9.1 million
euro.
At 30 June 2018, the value of the real estate portfolio was approximately 572 million euro.
Plus Sub-fund
The Plus Sub-fund of FIV has been operational since 2012 and had a total size of 272.6 million euro at 30 June 2018,
entirely subscribed by CDP. The Sub-fund is currently in the investment phase.
At 30 June 2018, a total of 111.2 million euro had been called-up from CDP (around 41% of subscribed commitments)
and 11.0 million euro had been distributed, as partial pro rata capital repayments.
Sales of a value of 10 million euro were concluded in the first half of 2018. The Plus Sub-fund did not issue capital calls
in the first half of 2018 but made a partial repayment totalling 11.0 million euro.
At 30 June 2018, the value of the real estate portfolio was approximately 78 million euro.
Fondo Investimenti per il Turismo (“FIT”)
FIT has been operational since 2016 and had a total size of 250 million euro at 30 June 2018, entirely subscribed by
CDP. The Fund is currently in the investment phase. CDP subscribed a further 150 million euro of the fund in the first half
of 2018.
At 30 June 2018, a total of 66.6 million euro had been called-up from CDP (around 26.6% of subscribed commitments),
of which 3.2 million euro in the first half of 2018. No distributions had been made at 30 June 2018.
At 30 June 2018, FIT had subscribed 80 million euro of FT1, the first operational fund to be launched using resources of
FIT, which in turn approved investments of around 92 million euro to purchase 5 tourist resorts. FT1 is currently in the
fundraising phase.
Fondo FIA2 (“FIA2”)
FIA2 has been operational since 2017 and had a total size of 100 million euro at 30 June 2018, entirely subscribed by
CDP. The Fund is currently in the fundraising phase.
17These also include projects identified under the resources authorised according to dynamic allocation, which will only in part be acquired and implemented by the local funds, subject to the residual availability of FIA’s resources.
71
Half-yearly Financial Report 2018
4. Performance of the CDP Group
At 30 June 2018, capital calls totalling 11.5 million euro had been issued to CDP (around 11.5% of commitments) and no
distributions had been made.
At 30 June 2018, FIA2 had subscribed 32 million euro of the Ca’ Tron H-Campus fund, representing the first investment
in the innovation and training sector.
In the first half of 2018, FIA2 issued capital calls for 0.6 million euro.
European Investment Fund
The European Investment Fund (“EIF”) is a public-private partnership under Luxembourg law held by the EIB (58.7%),
the European Commission (29.7%) and 32 public and private financial institutions (11.6%).
On 3 September 2014, CDP purchased 50 units of EIF from the EIB for a total nominal value of 50 million euro, equal to
a share of 1.11% at 31 December 2017. The Fund has called up 20% of the commitment and had a residual investment
commitment of 40 million euro at 31 December 2017.
In May 2018, CDP received dividends for 2017, paid by the EIF for an amount of around 120 thousand euro (payout
dividend of around 10%).
Constant cooperation between CDP and the EIF continued in the various areas of the Fund’s activity with a view to
promoting and supporting investments in SMEs and start-ups, thereby continuing to make significant progress towards
the implementation of the “Investment Plan for Europe”.
FII Tech Growth
This Fund has been operational since 21 September 2017 and had a size of 50 million euro at 30 June 2018, entirely
subscribed by CDP. The Fund is currently in the fundraising phase.
At 30 June 2018, the Fund had called up approximately 22 million euro (around 44% of the total commitment) and had
made three investments in innovative start-ups and SMEs.
The Fund’s NAV at 30 June 2018 was estimated at around 21.2 million euro.
Fondo Italiano di Investimento - Fund of Funds
The Fund was created with a size of 389 million euro through the demerger of Fondo Italiano di Investimento authorised
by the Investors’ Meeting on 5 April 2016.
At 30 June 2018, the Fund had subscribed commitments of approximately 360 million euro to 16 private-equity funds,
with an average investment of around 20 million euro, of which approximately 288 million euro (74% of the total
commitment) had been called up from investors. The Fund made partial early distributions, against disposals, amounting
to approximately 152 million euro.
Overall, the funds in portfolio had invested in around 70 companies, with a combined turnover of approximately 3.7 billion
euro and more than 10,000 employees.
The Fund’s NAV at 30 June 2018 was estimated at around 151.4 million euro.
Fondo Italiano di Investimento – FII Venture
The Fund was created with assets of 91.2 million euro through the demerger of Fondo Italiano di Investimento authorised
by the Investors’ Meeting on 5 April 2016.
At 30 June 2018, the Fund had subscribed commitments of approximately 80 million euro to 5 venture capital funds, with
an average investment of 16 million euro, of which approximately 59 million euro (65% of the total commitment) had
been called up from investors. The Fund made partial early distributions, against disposals, amounting to approximately
2 million euro.
Overall, the funds in portfolio had invested in over 89 start-ups with more than 1,000 employees.
The Fund’s NAV at 30 June 2018 was estimated at around 46.6 million euro.
Fondo di Fondi Private Debt
The Fund has been operational since 1 September 2014 and had a size of 400 million euro at 30 June 2018, of which
250 million euro subscribed by CDP. The fundraising period ended on 30 June 2017.
72 2. Half-yearly report on operation

At 30 June 2018, the Fund had called up approximately 148 million euro (around 37% of the total commitment) and had
made partial early distributions of around 13 million euro.
At 30 June 2018, the Fund had finalised the closing of 9 private debt funds for a total commitment of 290 million euro.
The funds currently in the portfolio of Fondo di Fondi Private Debt have in turn reached a total size in excess of 1.2 billion
euro, with a leverage effect on the market of over 4 times.
The Fund’s NAV at 30 June 2018 was estimated at around 138.2 million euro.
Fondo di Fondi Venture Capital
The fund has been operational since 1 September 2014 and had a size of euro 163 million at 30 June 2018, of which 125
million euro subscribed by CDP. The fundraising period ended on 30 June 2017.
On 19 May 2017, CDP subscribed an additional amount of 75 million euro.
At 30 June 2018, the Fund had called up approximately 32 million euro (around 19% of the total commitment) and had
made partial early distributions of around 3 million euro.
At 30 June 2018, the Fund had 9 investments in venture capital funds for a total commitment of approximately 147
million euro.
The Fund’s NAV at 30 June 2018 was estimated at around 25.3 million euro.
Fondo Innovazione e Sviluppo
The fund has been operational since 21 September 2017 and had a size of euro 265 million at 30 June 2018, of which
200 million euro subscribed by CDP. The Fund is currently in the fundraising phase.
At 30 June 2018, no investments had been made, notwithstanding intense scouting activities, and 4 million euro had
been called-up from investors.
The Fund’s NAV at 30 June 2018 was estimated at around 1.2 million euro.
Fondo QuattroR
Fondo QuattroR is managed by QuattroR SGR and finalised the first closing on 5 April 2017, attracting subscriptions in
excess of 700 million euro. The anchor investors of the Fund include, in addition to CDP (with a total commitment of 300
million euro), other leading Italian institutional investors. The Fund’s aim is to re-launch medium and large-sized Italian
companies which are temporarily in crisis but have solid industrial fundamentals.
At 30 June 2018, the Fund had called up approximately 42 million euro (around 6% of the total commitment) and had
made one investment.
The Fund’s NAV at 30 June 2018 was estimated at around 29.5 million euro.
FSI Mid-Market Growth Equity Fund
On 29 June 2017, the first closing of the “FSI Mid-Market Growth Equity Fund” was completed. The Fund is promoted
and managed by FSI with the goal of investing in Italian companies with significant potential for development, with a
focus on organic growth and/or growth by acquisitions, on sector/chain consolidation and on facilitating the IPO process.
Alongside CDP - the anchor investor of the initiative - other subscribers include sovereign funds, European insurance
companies and banks, foundations and asset managers. At June 2018, the FSI Mid Market Growth Equity Fund had
received subscriptions for capital commitments of around 1.2 billion euro.
At 30 June 2018, the Fund had called up approximately 86 million euro from investors (around 7% of the total
commitment) and had made two investments: (i) in CEDACRI S.p.A. - the leading operator in IT outsourcing services for
banks and financial institutions and (ii) in Adler Group S.p.A. - a global leader in the development and sale of thermal and
acoustic insulation components for the automotive sector.
The Fund’s NAV at 30 June 2018 was estimated at around 69.9 million euro.
Vertis Venture 3 Technology Transfer
The fund has been operational since 30 August 2017 and had a size of euro 40.4 million at 30 June 2018, of which 20
million euro subscribed by CDP. The Fund is currently in the fundraising phase.
73
Half-yearly Financial Report 2018
4. Performance of the CDP Group

Vertis Venture 3 Technology Transfer is the first fund launched by the ITAtech Platform and has therefore been
subscribed by the European Investment Fund for an amount equal to the subscription by CDP.
At 30 June 2018, the Fund had called-up around 2 million euro from investors and had made two investments.
The Fund’s NAV at 30 June 2018 was estimated at around 1.4 million euro.
Oltre II SICAF EuVECA S.p.A.
The Fund has been operational since July 2016 and completed its final closing on 31 March 2018, reaching a size of
around 35 million euro, of which 7.5 million euro subscribed by CDP through the Social Impact Italia Platform and,
consequently, also subscribed by the European Investment Fund for an amount of 10 million euro18.
Oltre II SICAF EuVECA S.p.A. is one of the main Italian investment funds operating in the Impact Investing sector and, in
particular, in the market of Social Venture Capital. It was the first fund to be subscribed by the Social Impact Italia
Platform.
At 30 June 2018, the Fund had called-up around 10 million euro from investors and had made seven investments.
At 30 June 2018, the Fund’s NAV was estimated at approximately 8 million euro.
Fondo Atlante
Incorporated in April 2016 with a commitment of 4,249 million euro, Fondo Atlante was promoted by Quaestio Capital
SGR S.p.A. to invest in: (i) banks with capital ratios that are below the minimum thresholds set by the SREP19, which
therefore must proceed, upon request of the Supervisory Authority, with initiatives to strengthen their capital through
share capital increases; and (ii) transactions involving NPLs originating from Italian banks.
During the period ended on 30 June 2018, the Fund invested in Banca Popolare di Vicenza S.p.A. (99.33% of capital)
and Veneto Banca S.p.A. (97.64% of capital) and also invested, via the Italian Recovery Fund (former Fondo Atlante II),
in the NPLs20 of Nuova Banca dell’Etruria e del Lazio S.p.A., Nuova Cassa di Risparmio di Chieti S.p.A., Nuova Banca
delle Marche S.p.A., Nuova Cassa di Risparmio di Ferrara S.p.A., Cassa di Risparmio di Rimini S.p.A., Cassa di
Risparmio di San Miniato S.p.A., Cassa di Risparmio di Cesena S.p.A. and Banca Monte dei Paschi di Siena S.p.A..
At 30 June 2018, the Fund had called up approximately 4,241 million euro, equal to 99.8% of subscribers’ commitments.
On 25 June 2017, having realised that precautionary recapitalisation was not feasible, the Government and the Bank of
Italy decided to initiate the compulsory administrative liquidation proceedings set out in the Consolidated Law on Banking
and in Decree Law No. 99 of 25 June 2017. The decree provided for the compulsory administrative liquidation of Banca
Popolare di Vicenza S.p.A. and Veneto Banca S.p.A. and the concurrent sale to Intesa Sanpaolo of their assets and
liabilities, with exception to a few items. By this solution, the cost of the crisis will be covered primarily by the
shareholders and the holders of the two banks’ subordinated bonds. In fact, the foregoing parties maintain their rights in
the liquidation proceedings, with such rights to be satisfied only if the Government recovers in full its outlays in support of
the intervention and if the claims of all other creditors are satisfied.
The Fund’s NAV at 30 June 2018 was estimated at around 848 million euro.
Italian Recovery Fund (former Fondo Atlante II)
Incorporated in October 2016, the Fund was promoted by Quaestio Capital SGR S.p.A. to invest in transactions involving
NPLs originating from Italian banks. The fundraising for the Fund was extended in 2017 until 31 December 2017 to
enable investors to increase Fund’s resources. In December 2017, an additional closing of the Fund was completed,
which increased the total commitment to 2,480 million euro.
On 27 October 2017, the Unitholders’ Meeting of the Fund changed its name from Fondo Atlante II to Italian Recovery
Fund.
During the period ended on 30 June 2018, the Fund invested in the NPLs of Nuova Banca dell’Etruria e del Lazio S.p.A.,
Nuova Cassa di Risparmio di Chieti S.p.A., Nuova Banca delle Marche S.p.A., Nuova Cassa di Risparmio di Ferrara
S.p.A., Cassa di Risparmio di Rimini S.p.A., Cassa di Risparmio di San Miniato S.p.A., Cassa di Risparmio di Cesena
S.p.A. and Banca Monte dei Paschi di Siena S.p.A..
18 Investments by the Social Impact Italia Platform are not subscribed by CDP and the EIF on a pari passu basis, but on the basis of specific co-investment agreements entered into between the two institutions. 19 Supervisory Review and Evaluation Process 20 Non-Performing Loans
74 2. Half-yearly report on operation

At 30 June 2018, the Fund had called up approximately 2,353 million euro, equal to 94.9% of subscribers’ commitments.
The Fund’s NAV at 30 June 2018 was estimated at around 2,343 million euro.
4.2 INCOME STATEMENT AND BALANCE SHEET RESULTS
4.2.1 CDP SPA
In keeping with its role of National Promotional Institution, CDP continued to provide financial services in the interest of
the country’s growth and competitiveness by supporting enterprises, local authorities and the local areas. With the
monetary policy still in an expansionary phase and in a market context that is still positive, albeit with some geopolitical
and political-institutional uncertainty, CDP has maintained robust economic performance at all levels.
Net income for the period increased on the same period of 2017, to 1,382 million euro, mainly due to: (i) the increase in
net commission arising from the reversal of commission on MEF Bonds, (ii) lower cost of equity risks and (iii) higher
dividends received.
4.2.1.1 Reclassified income statement
The economic performance of CDP was analysed using the income statement layout reclassified on the basis of
management criteria.
A statement of reconciliation between management and accounting schedules has also been appended in the interest of
completeness of information and forms an integral part of the half-yearly report on operations (Annex 2.1).
Reclassified Income Statement
(millions of euro; %) 30/06/2018 30/06/2017 Change (+ / -) (%) change
Net interest income 1,612 1,578 33 2.1%
Dividends 811 785 27 3.4%
Gains (losses) on equity investments (19) (78) 59 -75.3%
Net commission income (expense) (600) (741) 141 -19.1%
Other net revenues (costs) 49 (9) 58 n/s
Gross income 1,853 1,535 318 20.7%
Net recoveries (impairment) (39) (14) (25) 174.9%
Overheads (84) (73) (11) 14.6%
- of which: administrative expenses (81) (70) (11) 15.4%
Operating income 1,736 1,452 285 19.6%
Provisions for risks and charges (17) 0.0 (17) n/s
Income taxes (335) (226) (108) 48.0%
Net income for the period 1,382 1,222 160 13.1%
Net interest income totalled 1,612 million euro, essentially in line with the first half of 2017 (1,578 million euro), mainly
due lower interest expense on postal savings, only in part offset by lower interest income on loans.
The increase in dividends (811 million euro, +3% on the first half of 2017) was mainly due to the higher contribution
received from CDP Reti and Poste Italiane, only in part offset by the lower contribution received from Fintecna.
The contribution from “Gains (Losses) on equity investments” was negative for 19 million euro owing to the measurement
component linked to funds classified as “Financial assets measured at fair value through profit or loss”.
Net commission expense amounted to 600 million euro, marking a significant improvement on the first half of 2017 (-741
million euro), thanks to the contribution of commission on MEF Bonds (around 150 million euro), recognised in
accordance with the provisions of Art. 7 of the new CDP-MEF agreement associated with the MEF Bonds renewed on 23
February 2018.
Other net revenues increased to 49 million euro (from -9 million euro in the first half of 2017), mainly thanks to the
contribution of gains (losses) on the disposal or repurchase of loans and securities.
75
Half-yearly Financial Report 2018
4. Performance of the CDP Group

Net impairment losses increased to -39 million euro (-14 million euro in the first half of 2017) due to the effects of the
adoption of IFRS 9, with widening of the measurement scope and adoption of the lifetime expected credit losses
approach in Stage 2.
Overheads, consisting of staff costs and other administrative expenses, in addition to amortisation, depreciation and
impairment of property, plant and equipment and intangible assets, totalled approximately euro 84 million. Administrative
expenses include: (i) staff costs, which increased to 55 million compared with the first half of 2017 due to the increase in
the headcount, as envisaged in the plan launched in 2016 and continued in 2017 and 2018 with a view to aligning
competencies to the new operating contexts, in line with CDP’s role as a National Promotional Institution; (ii) other
administrative expenses, which increased to around euro 25 million compared with the first half of 2017 mainly due to the
continued modernisation of the IT architecture and the increased presence of CDP at the local level.
Lastly, income tax for the period amounted to 335 million euro. This figure includes, among other things, (i) IRES, IRES
surcharge and IRAP taxes for the period, and (ii) a decrease in deferred tax assets, mainly linked to amounts recognised
on FTA.
As a result of the above, net income for the period was 1,382 million euro, up by approximately 13% from 1,222 million
euro in the first half of 2017.
4.2.1.2 Reclassified balance sheet
First-time adoption of IFRS 9
As duly specified in the section of this Half-Year Financial Report dedicated to the first-time adoption of IFRS 9 (see
section 5 - Other issues of the section dedicated to the accounting policies of the CDP Group), the financial statements
have been appropriately amended with respect to those previously in use, in accordance with the requirements of Bank
of Italy Circular no. 262 on banks’ financial statements, updated to incorporate regulatory developments.
Consequently, the reclassified statements presented and commented below have also been appropriately amended with
respect to those previously in use.
The adoption of the new classification and measurement rules in relation to financial assets has entailed, in respect of
liabilities recognised in the Balance Sheet of CDP S.p.A., the reclassification of “Guarantees issued and commitments”
under the item “Provisions for contingencies, taxes and staff severance pay”, for an amount of 98 million euro.
In terms of measurement, the adoption of the new impairment rules (“expected credit losses”) has resulted in:
a negative impact of 421 million euro on the “Loans” item, mainly due to higher impairment losses recognised
on performing positions in view of (i) the requirement to calculate lifetime expected credit losses, and (ii) the
widening of the measurement scope;
a negative impact of 23 million euro on the “Debt securities” item, mainly due to the inclusion of securities
measured at amortised cost in the measurement scope;
a negative impact of 26 million euro on the “Cash and cash equivalents” item, due to the widening of the
measurement scope;
an increase of around 17 million euro in Provisions for contingencies, taxes and staff severance pay, due to: (i)
higher accruals for Guarantees issued and commitments (13 million euro), again due to the requirement to
adopt a forward-looking approach to expected credit losses, and (ii) the increase in provisions for deferred tax
(around 4 million euro).
As a result of the new measurement and impairment rules applied on first-time adoption of IFRS 9 on 1 January 2018,
total Equity has decreased by around 322 million euro due to the above described impacts, net of the related tax effects
amounting to approximately 162 million euro.
The reclassified balance sheet of CDP at 1 January 2018 is presented below.
76 2. Half-yearly report on operation

Reclassified balance sheet
(millions of euro; %) 31/12/2017 Reclassifications Effects of transition
to IFRS 9 01/01/2018
Assets
Cash and cash equivalents 175,280 - (26) 175,254
Loans 101,773 - (421) 101,351
Debt securities 48,031 - (23) 48,008
Equity investments 32,298 - - 32,298
Assets held for trading and hedging derivatives 895 - - 895
Property, plant and equipment and intangible assets 317 - - 317
Accrued income, prepaid expenses and other non-interest-bearing assets
7,829 - - 7,829
Other assets 843 - 166 1,008
Total assets 367,265 - (306) 366,960
(millions of euro; %) 31/12/2017 Reclassifications Effects of transition
to IFRS 9 01/01/2018
Liabilities and equity
Funding 340,498 - - 340,498
- of which :
- postal funding 252,754 - - 252,754
- funding from banks 36,225 - - 36,225
- funding from customers 34,052 - - 34,052
- bond funding 17,467 - - 17,467
Liabilities held for trading and hedging derivatives 747 - - 747
Accrued expenses, deferred income and other non-interest-bearing liabilities
495 - - 495
Other liabilities 835 (98) - 737
Provisions for contingencies, taxes and staff severance pay 256 98 17 371
Equity 24,435 - (322) 24,113
Total liabilities and equity 367,265 - (306) 366,960
77
Half-yearly Financial Report 2018
4. Performance of the CDP Group

The reclassified balance sheet of CDP at 30 June 2018 is presented below.
Assets
Assets in CDP’s reclassified balance sheet at 30 June 2018 included the following items:
Reclassified balance sheet
(millions of euro; %) 30/06/2018 31/12/2017 Change (+ / -) (%) change
Assets
Cash and cash equivalents 162,855 175,280 (12,425) -7.1%
Loans 100,676 101,773 (1,097) -1.1%
Debt securities 58,093 48,031 10,062 20.9%
Equity investments 33,057 32,298 759 2.3%
Assets held for trading and hedging derivatives 839 895 (56) -6.3%
Property, plant and equipment and intangible assets 329 317 12 3.7%
Accrued income, prepaid expenses and other non-interest-bearing assets
9,752 7,829 1,922 24.6%
Other assets 1,019 843 177 21.0%
Total assets 366,619 367,265 (646) -0.2%
Total assets stood at approximately 367 billion euro, essentially in line with the figure recorded at the end of the previous
year (-0.2%).
Cash and cash equivalents amounted to approximately 163 billion euro, decreasing by around 7% compared to the
figure recorded at the end of 2017. The decrease is mainly due to lower short-term investments associated with the fall in
funding from OPTES.
This item includes the treasury account balance of around 152 billion euro, which increased by over 3 billion euro
compared to the figure recorded at the end of the previous year.
Loans to customers and banks, totalling around 101 billion euro, were slightly down compared to the end of 2017, due to:
(i) a decrease in loans to public entities and financial institutions, and (ii) an increase in the provision for impaired loans,
arising from the first-time adoption of IFRS 9, only in part offset by the increase in loans in support of international
expansion.
Debt securities amounted to approximately 58 billion euro, up +21% compared to the figure recorded at the end of 2017,
mainly due to new purchases in the HTC portfolio.
At 30 June 2018, the carrying amount of equity investments and equity securities exceeded 33 billion euro, up 2%
compared to the end of 2017. The increase was due to CDP’s acquisition of a stake in Telecom Italia S.p.A. (TIM); this
investment falls under CDP’s institutional mission to support strategic national infrastructure and is aimed at supporting
the process of growth and value creation launched by the company in a sector of primary interest for the country.
Assets held for trading and hedging derivatives were slightly down compared to the end of 2017 (-6%). This item
includes the fair value (where positive) of hedging derivative instruments, including operational hedges that do not qualify
as hedges for accounting purposes.
Total property, plant and equipment and intangible assets amounted to 329 million euro, of which 316 million euro
relating to property, plant and equipment and the remainder to intangible assets. Specifically, the increase in the item
was due to considerable investments during the year, which exceeded the depreciation and amortisation of existing
assets during the same period. Expenditures on investments continued during the year, primarily in connection with one-
off renovations of owned properties.
Accrued income, prepaid expenses and other non-interest-bearing assets increased compared to 2017, amounting to
approximately 9.8 billion euro (7.8 billion euro at 31 December 2017). This change was mainly due to the increase in
past-due loans and receivables and to higher interest accrued in the first half of 2018 on cash and cash equivalents still
to be collected.
Lastly, the item “Other assets”, which includes current and deferred tax assets, payments on account for withholding tax
on passbook savings accounts and other residual assets, equal to 1,019 million euro, was up from 843 million euro
recorded in 2017.
78 2. Half-yearly report on operation

Liabilities
At 30 June 2018, the liabilities in CDP’s reclassified balance sheet were as follows:
Reclassified balance sheet
(millions of euro; %) 30/06/2018 31/12/2017 Change (+ / -) (%) change
Liabilities and equity
Funding 340,399 340,498 (98) n/s
- of which :
- postal funding 253,556 252,754 803 0.3%
- funding from banks 45,126 36,225 8,901 24.6%
- funding from customers 22,886 34,052 (11,165) -32.8%
- bond funding 18,831 17,467 1,364 7.8%
Liabilities held for trading and hedging derivatives 766 747 19 2.6%
Accrued expenses, deferred income and other non-interest-bearing liabilities
568 495 73 14.7%
Other liabilities 754 835 (81) -9.7%
Provisions for contingencies, taxes and staff severance pay 431 256 174 67.9%
Equity 23,701 24,435 (734) -3.0%
Total liabilities and equity 366,619 367,265 (646) -0.2%
Total funding exceeded 340 billion euro at 30 June 2018, essentially stable compared to year-end 2017.
Within this item, Postal Funding increased, with interest accrued more than offsetting net outflows for about 900 million
euro. The balance of such funding, which includes the balances of postal passbook savings accounts and postal savings
bonds, was around 254 billion euro.
Funding from banks increased to more than 45 billion euro in June 2018, from about 36 billion euro in 2017, mainly due
to an increase in repurchase agreements (around 37 billion euro), up compared to the figure recorded at the end of 2017
(around 28 billion euro), which has offset the decrease in OPTES transactions recorded in the first half of the year.
Funding from customers, which stood at around 23 billion euro, was down by 33% on the end of 2017. This decrease
was chiefly attributable to (i) reduced funding from OPTES transactions, amounting to around 13 billion euro (23 billion
euro at the end of 2017), and (ii) the decrease in balances held by Group companies, amounting to around 5 billion euro
(around 7 billion euro at the end of 2017).
Bond funding increased by approximately 8% to around 19 billion euro (approximately 17 billion euro at the end of 2017),
mainly as a result of the Bancoposta guaranteed bond issues and the new EMTN/DIP lines, in part offset by maturities in
the first half of 2018.
Liabilities held for trading and hedging derivatives amounted to 766 million euro, compared to 747 million euro at the end
of 2017. This item includes the fair value (where negative), of hedging derivative instruments, including operational
hedges that do not qualify as hedges for accounting purposes.
Accrued expenses, deferred income and other non-interest-bearing liabilities stood at 568 million euro, increasing slightly
from 495 million euro in 2017.
With regard to other significant items, there was (i) a slight decline in other liabilities (754 million euro), while (ii)
provisions for contingencies, taxes and staff severance pay increased (431 million euro, against 256 million euro in
2017).
To conclude, equity amounted to around 24 billion euro at 30 June 2018, marking a decrease of -3% on the end of 2017,
due to (i) dividends distributed, (ii) the FTA reserve and (iii) the decrease in valuation reserves relating to financial assets
measured at fair value, only in part offset by net income for the period.
79
Half-yearly Financial Report 2018
4. Performance of the CDP Group

4.2.1.3 Indicators
Main indicators (reclassified data)
30/06/2018 31/12/2017
STRUCTURE RATIOS (%)
Loans/Total assets 27.5% 27.7%
Loans/Postal Funding 39.7% 40.3%
Equity investments/Equity 139.5% 132.2%
Securities/Equity 245.1% 196.6%
Funding/Total liabilities 92.8% 92.7%
Equity/Total liabilities 6.5% 6.7%
Postal Savings/Total funding 74.5% 74.2%
PERFORMANCE RATIOS (%) 1
Net interest income/Gross income 87.0% 102.8%
Net commissions/Gross income -32.4% -48.3%
Dividends and gains (losses) on equity investments/Gross income 42.8% 46.0%
Commission expense/Gross income -42.6% -51.9%
Spread on interest-bearing assets and liabilities 1.1% 1.0%
Cost/income ratio 4.6% 4.8%
Net income/Opening equity (ROE) 11.3% 10.5%
Net income/Average equity (ROAE) 11.5% 10.5%
RISK RATIOS (%)
Coverage of bad loans 2 63.2% 62.0%
Net non-performing loans/Net loans to customers and banks 3,4 0.072% 0.215%
Net adjustments to loans/Net exposure 4 0.011% 0.003%
PRODUCTIVITY RATIOS (millions of euro)
Loans/Employees 133.0 140.2
Funding/Employees 449.7 469.0
Operating income/Employees1 4.6 4.0
1) For the year 2017, figures refer to 30/06/2017
2) Provision bad loans / Gross exposure to bad loans
3) Exposure includes Loans, Disbursement commitments and Financial assets at fair value with impact on equity
4) Net exposure is calculated net of the provision for non-performing loans
Structure ratios remained essentially in line with year-end 2017. With regard to liabilities, the percentage weight of postal
funding to the aggregate total remained essentially unchanged compared to the end of 2017, even following the
successful efforts to diversify funding sources. With regard to the asset structure, the assets related to the core business
(loans and equity investments) were basically unchanged, even if investments in government securities continue to have
a large weight.
An analysis of profitability indicators shows that there was a slight increase in the spread between lending and funding
rates, mainly as a result of lower funding costs linked to postal savings.
The improvement in net financial income has allowed CDP to further reduce the cost/income ratio (4.6%), which was well
within the specified target range notwithstanding the increase in overhead costs resulting mainly from the continuation of
plans to increase the workforce, to modernise the IT architecture and to strengthen CDP’s territorial presence. Return on
equity (ROE) was 11.3%, up compared to 2017 thanks to the increase in net income for the period and the decrease in
equity.
The creditworthiness of the CDP loan portfolio remained very high, with a moderate risk profile, as highlighted by its
excellent risk indicators, which were very low and in line with 2017.
80 2. Half-yearly report on operation
Productivity ratios continue to be very high, with loans and receivables per employee equal to 133 million euro and
funding per employee equal to 450 million euro. Due to the improvement in financial performance, operating income per
employee was approximately 4.6 million euro.
Details of alternative performance indicators have been appended in the interest of completeness of information and
form an integral part of the half-yearly report on operations (Annex 2.3).
4.2.1.4 Outlook of operations
The first half of 2018 closed with an improvement in CDP’s net income and turnover volumes, in line with Business Plan
projections. Projected net income for the second half is expected to confirm a further consolidation of the recovery in
profitability and a strengthened asset structure, continuing the trend seen in the last two years.
81
Half-yearly Financial Report 2018
4. Performance of the CDP Group

4.2.2 GROUP COMPANIES
The accounting situation of the CDP Group companies as at 30 June 2018 is presented below from a management
accounting standpoint: for detailed information concerning balance sheet and income statement performance, refer to the
financial statements of the Group’s companies, which contain full accounting information and analyses of their operating
performances.
A statement of reconciliation between management and accounting schedules has also been appended in the interest of
completeness of information and forms an integral part of the half-yearly report on operations (Annex 2.2).
4.2.2.1 Reclassified consolidated income statement
The Group’s reclassified consolidated income statement is presented below and includes a comparison with the figures
of the previous period, which have been restated to reflect the completion of the PPA process in relation to the equity
investment acquired in Poste Italiane.
The following figures include reconciled comparative data that do not take into account the effects that would have
occurred had the IFRS 9 and IFRS 15 rules been applied to said data.
Reclassified Income Statement
(millions of euro; %) 30/06/2018 30/06/2017 * Change (+ / -) (%) change
Net interest income 1,536 1,491 45 3.0%
Gains (losses) on equity investments 678 941 (263) -27.9%
Net commission income (expense) (597) (762) 165 -21.7%
Other net revenues (costs) 29 (204) 233 n/s
Gross income 1,646 1,466 180 12.3%
Profit (loss) on insurance business 75 511 (436) -85.3%
Profit (loss) on banking and insurance operations 1,721 1,977 (256) -12.9%
Net recoveries (impairment) (48) (122) 74 -60.7%
Administrative expenses (3,392) (3,120) (272) 8.7%
Other net operating income (costs) 5,700 5,304 396 7.5%
Operating income 3,981 4,039 (58) -1.4%
Net provisions for risks and charges (45) (46) 1 -2.2%
Net adjustments to PPE and intangible assets (1,002) (963) (39) 4.0%
Net adjustments of goodwill - - n/s
Other (2) (3) 1 -33.3%
Income taxes (740) (582) (158) 27.1%
Net income for the period 2,192 2,445 (253) -10.3%
Net income (loss) for the period pertaining to non-controlling interests 747 881 (134) -15.2%
Net income (loss) for the period pertaining to the Parent Company 1,445 1,564 (119) -7.6%
* The figure referring to 30 June 2017 was restated as a result of the purchase price allocation of Poste Italiane
Net income at 30 June 2018 totalled 2,192 million euro, marking a slight decrease on the previous half year. However,
the item includes the non-recurring entry of the restatement at fair value of the remaining interest in FSIA following the
loss of control of the subsidiary. Net income in the first half benefits from the positive contributions of the Parent
Company and the companies not subject to management and coordination, and from the two main equity investments
accounted for using the equity method.
82 2. Half-yearly report on operation
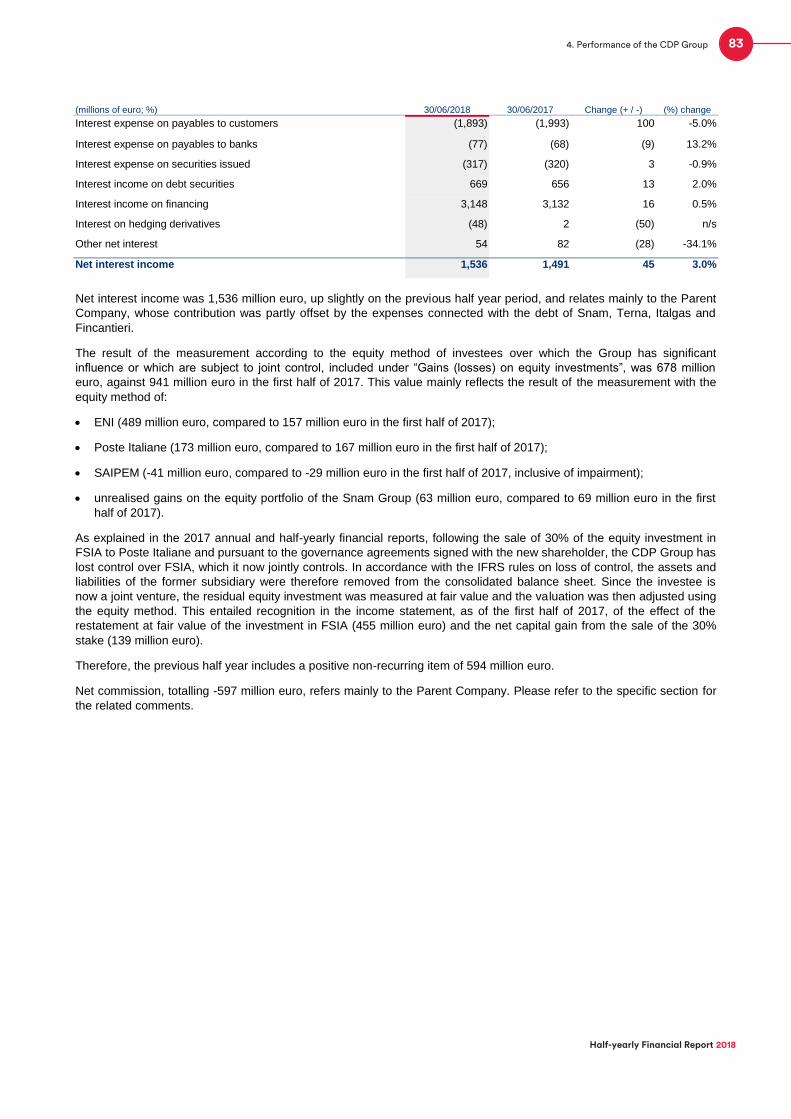
(millions of euro; %) 30/06/2018 30/06/2017 Change (+ / -) (%) change
Interest expense on payables to customers (1,893) (1,993) 100 -5.0%
Interest expense on payables to banks (77) (68) (9) 13.2%
Interest expense on securities issued (317) (320) 3 -0.9%
Interest income on debt securities 669 656 13 2.0%
Interest income on financing 3,148 3,132 16 0.5%
Interest on hedging derivatives (48) 2 (50) n/s
Other net interest 54 82 (28) -34.1%
Net interest income 1,536 1,491 45 3.0%
Net interest income was 1,536 million euro, up slightly on the previous half year period, and relates mainly to the Parent
Company, whose contribution was partly offset by the expenses connected with the debt of Snam, Terna, Italgas and
Fincantieri.
The result of the measurement according to the equity method of investees over which the Group has significant
influence or which are subject to joint control, included under “Gains (losses) on equity investments”, was 678 million
euro, against 941 million euro in the first half of 2017. This value mainly reflects the result of the measurement with the
equity method of:
ENI (489 million euro, compared to 157 million euro in the first half of 2017);
Poste Italiane (173 million euro, compared to 167 million euro in the first half of 2017);
SAIPEM (-41 million euro, compared to -29 million euro in the first half of 2017, inclusive of impairment);
unrealised gains on the equity portfolio of the Snam Group (63 million euro, compared to 69 million euro in the first
half of 2017).
As explained in the 2017 annual and half-yearly financial reports, following the sale of 30% of the equity investment in
FSIA to Poste Italiane and pursuant to the governance agreements signed with the new shareholder, the CDP Group has
lost control over FSIA, which it now jointly controls. In accordance with the IFRS rules on loss of control, the assets and
liabilities of the former subsidiary were therefore removed from the consolidated balance sheet. Since the investee is
now a joint venture, the residual equity investment was measured at fair value and the valuation was then adjusted using
the equity method. This entailed recognition in the income statement, as of the first half of 2017, of the effect of the
restatement at fair value of the investment in FSIA (455 million euro) and the net capital gain from the sale of the 30%
stake (139 million euro).
Therefore, the previous half year includes a positive non-recurring item of 594 million euro.
Net commission, totalling -597 million euro, refers mainly to the Parent Company. Please refer to the specific section for
the related comments.
83
Half-yearly Financial Report 2018
4. Performance of the CDP Group
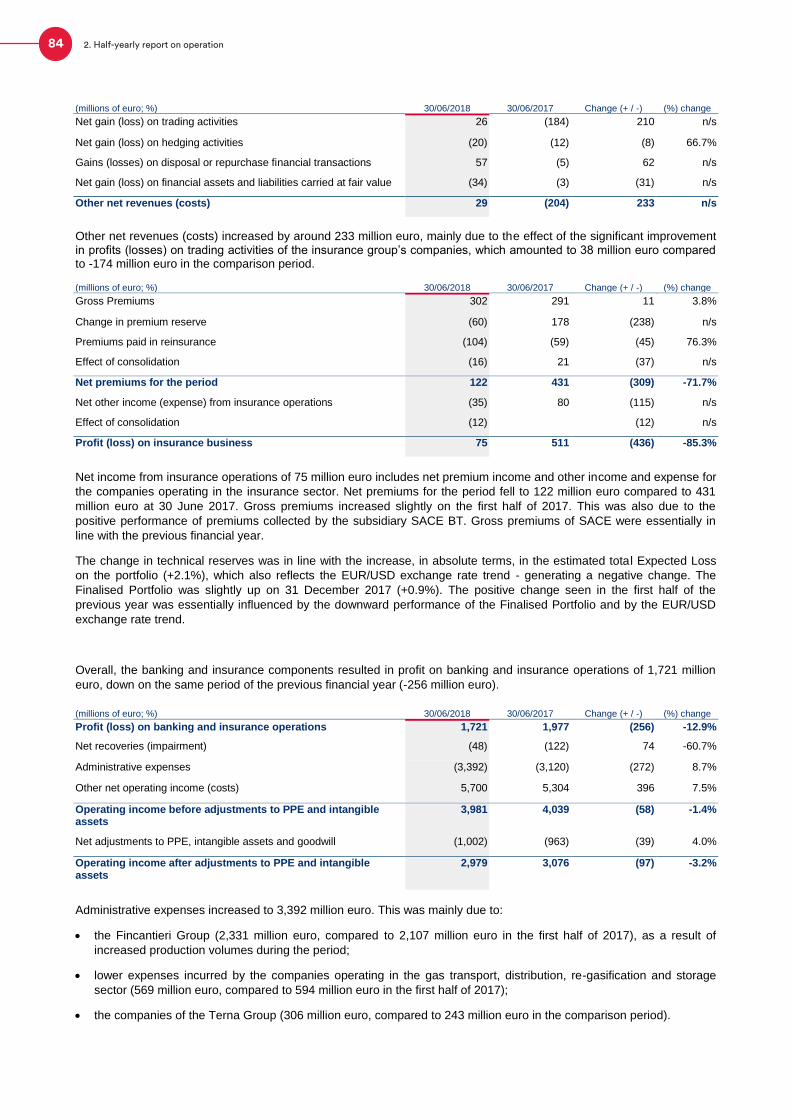
(millions of euro; %) 30/06/2018 30/06/2017 Change (+ / -) (%) change
Net gain (loss) on trading activities 26 (184) 210 n/s
Net gain (loss) on hedging activities (20) (12) (8) 66.7%
Gains (losses) on disposal or repurchase financial transactions 57 (5) 62 n/s
Net gain (loss) on financial assets and liabilities carried at fair value (34) (3) (31) n/s
Other net revenues (costs) 29 (204) 233 n/s
Other net revenues (costs) increased by around 233 million euro, mainly due to the effect of the significant improvement in profits (losses) on trading activities of the insurance group’s companies, which amounted to 38 million euro compared to -174 million euro in the comparison period.
(millions of euro; %) 30/06/2018 30/06/2017 Change (+ / -) (%) change
Gross Premiums 302 291 11 3.8%
Change in premium reserve (60) 178 (238) n/s
Premiums paid in reinsurance (104) (59) (45) 76.3%
Effect of consolidation (16) 21 (37) n/s
Net premiums for the period 122 431 (309) -71.7%
Net other income (expense) from insurance operations (35) 80 (115) n/s
Effect of consolidation (12) (12) n/s
Profit (loss) on insurance business 75 511 (436) -85.3%
Net income from insurance operations of 75 million euro includes net premium income and other income and expense for
the companies operating in the insurance sector. Net premiums for the period fell to 122 million euro compared to 431
million euro at 30 June 2017. Gross premiums increased slightly on the first half of 2017. This was also due to the
positive performance of premiums collected by the subsidiary SACE BT. Gross premiums of SACE were essentially in
line with the previous financial year.
The change in technical reserves was in line with the increase, in absolute terms, in the estimated total Expected Loss
on the portfolio (+2.1%), which also reflects the EUR/USD exchange rate trend - generating a negative change. The
Finalised Portfolio was slightly up on 31 December 2017 (+0.9%). The positive change seen in the first half of the
previous year was essentially influenced by the downward performance of the Finalised Portfolio and by the EUR/USD
exchange rate trend.
Overall, the banking and insurance components resulted in profit on banking and insurance operations of 1,721 million
euro, down on the same period of the previous financial year (-256 million euro).
(millions of euro; %) 30/06/2018 30/06/2017 Change (+ / -) (%) change
Profit (loss) on banking and insurance operations 1,721 1,977 (256) -12.9%
Net recoveries (impairment) (48) (122) 74 -60.7%
Administrative expenses (3,392) (3,120) (272) 8.7%
Other net operating income (costs) 5,700 5,304 396 7.5%
Operating income before adjustments to PPE and intangible assets
3,981 4,039 (58) -1.4%
Net adjustments to PPE, intangible assets and goodwill (1,002) (963) (39) 4.0%
Operating income after adjustments to PPE and intangible assets
2,979 3,076 (97) -3.2%
Administrative expenses increased to 3,392 million euro. This was mainly due to:
the Fincantieri Group (2,331 million euro, compared to 2,107 million euro in the first half of 2017), as a result of
increased production volumes during the period;
lower expenses incurred by the companies operating in the gas transport, distribution, re-gasification and storage
sector (569 million euro, compared to 594 million euro in the first half of 2017);
the companies of the Terna Group (306 million euro, compared to 243 million euro in the comparison period).
84 2. Half-yearly report on operation

Other net operating income (costs) of around 5.7 billion euro mainly include the revenues from the core business of the
Snam, Italgas, Terna and Fincantieri groups. The 396 million euro increase in this item is mainly due to the higher
turnover of the four companies and, precisely, of Fincantieri for 256 million euro, Snam and Italgas for 32 mill ion euro
and Terna for 80 million euro.
There was a slight increase in net adjustments to property, plant and equipment and intangible assets, mainly
attributable to the Snam, Terna, Fincantieri and Italgas groups.
The CDP Group’s effective tax rate at 30 June 2018 was 25.2%.
4.2.2.2 Reclassified consolidated balance sheet
Consolidated assets
The assets section of the reclassified consolidated balance sheet at 30 June 2018 is presented below. The comparative
data refer to reconciled figures as at 31 December 2017 and do not take into account the effects of the application of
IFRS 9 and 15, in relation to which further comments are provided in the First-Time Adoption section of the Notes to the
Financial Statements.
Reclassified consolidated balance sheet
(millions of euro; %) 30/06/2018 31/12/2017 Change (+ / -) (%) change
Assets
Cash and cash equivalents and other treasury investments 164,901 178,780 (13,879) -7.8%
Loans 109,560 108,222 1,338 1.2%
Debt securities, equity securities and units in collective investment undertakings
68,650 55,682 12,968 23.3%
Equity investments 20,149 19,770 379 1.9%
Trading and hedging derivatives 920 1,109 (189) -17.0%
Property, plant and equipment and intangible assets 45,761 43,865 1,896 4.3%
Reinsurers' share of technical reserves 599 671 (72) -10.7%
Other assets 9,612 11,435 (1,823) -15.9%
Total assets 420,152 419,534 618 0.1%
Group assets totalled over 420 billion euro, essentially stable compared to the figure recorded at the end of the previous
financial year.
The changes in financial assets represented by Cash and cash equivalents and other investments, Loans and Securities
were mainly due to the performance of the Parent Company’s portfolios.
Securities, including debt securities, equity securities and units in collective investment undertakings (the latter primarily
purchased as an investment) increased in value, mainly due to the effect of purchases of financial assets classified under
the HTC portfolio.
The increase in equity investments was driven by opposing trends. The balance for 2017 was 19.8 billion euro. This
balance had increased to 20.3 billion euro by 1 January 2018 (+483 million euro) following the adoption of IFRS 9 and
IFRS 15 by Group companies subject to significant influence and by jointly controlled companies.
The highest impacts of the adoption of IFRS 9 and IFRS 15 were seen by the Eni and Poste Italiane groups. These
impacts also concerned the related equity investments, recognised and accounted for using the equity method. Both
groups recognised a positive impact from the transition to the new financial reporting standards. The decreasing effect of
the adoption of the impairment rules is more than offset by the measurement at fair value of certain financial instruments.
In addition to these effects, the aforesaid equity investments produced the following effects:
ENI - the positive income for the period pertaining to the Group (489 million euro) was offset by the change in
valuation reserves, the reversal of the dividend and other changes, contributing a total of -25 million euro;
Poste Italiane - positive income for the period pertaining to the Group (173 million euro, taking into account
consolidation effects) was offset by the change in valuation reserves, the reversal of the dividend and other changes,
contributing a total of -667 million euro.
The measurement of the equity investments in Saipem and Openfiber also had a decreasing effect.
85
Half-yearly Financial Report 2018
4. Performance of the CDP Group
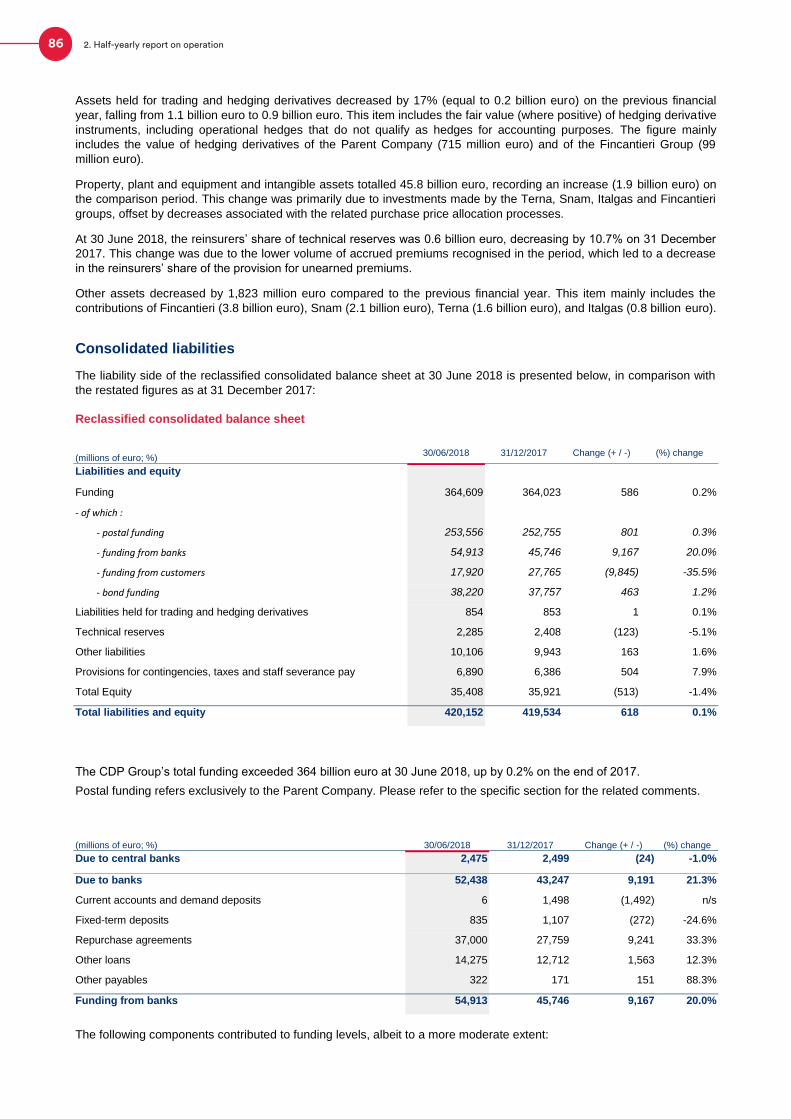
Assets held for trading and hedging derivatives decreased by 17% (equal to 0.2 billion euro) on the previous financial
year, falling from 1.1 billion euro to 0.9 billion euro. This item includes the fair value (where positive) of hedging derivative
instruments, including operational hedges that do not qualify as hedges for accounting purposes. The figure mainly
includes the value of hedging derivatives of the Parent Company (715 million euro) and of the Fincantieri Group (99
million euro).
Property, plant and equipment and intangible assets totalled 45.8 billion euro, recording an increase (1.9 billion euro) on
the comparison period. This change was primarily due to investments made by the Terna, Snam, Italgas and Fincantieri
groups, offset by decreases associated with the related purchase price allocation processes.
At 30 June 2018, the reinsurers’ share of technical reserves was 0.6 billion euro, decreasing by 10.7% on 31 December
2017. This change was due to the lower volume of accrued premiums recognised in the period, which led to a decrease
in the reinsurers’ share of the provision for unearned premiums.
Other assets decreased by 1,823 million euro compared to the previous financial year. This item mainly includes the
contributions of Fincantieri (3.8 billion euro), Snam (2.1 billion euro), Terna (1.6 billion euro), and Italgas (0.8 billion euro).
Consolidated liabilities
The liability side of the reclassified consolidated balance sheet at 30 June 2018 is presented below, in comparison with
the restated figures as at 31 December 2017:
Reclassified consolidated balance sheet
(millions of euro; %) 30/06/2018 31/12/2017 Change (+ / -) (%) change
Liabilities and equity
Funding 364,609 364,023 586 0.2%
- of which :
- postal funding 253,556 252,755 801 0.3%
- funding from banks 54,913 45,746 9,167 20.0%
- funding from customers 17,920 27,765 (9,845) -35.5%
- bond funding 38,220 37,757 463 1.2%
Liabilities held for trading and hedging derivatives 854 853 1 0.1%
Technical reserves 2,285 2,408 (123) -5.1%
Other liabilities 10,106 9,943 163 1.6%
Provisions for contingencies, taxes and staff severance pay 6,890 6,386 504 7.9%
Total Equity 35,408 35,921 (513) -1.4%
Total liabilities and equity 420,152 419,534 618 0.1%
The CDP Group’s total funding exceeded 364 billion euro at 30 June 2018, up by 0.2% on the end of 2017.
Postal funding refers exclusively to the Parent Company. Please refer to the specific section for the related comments.
(millions of euro; %) 30/06/2018 31/12/2017 Change (+ / -) (%) change
Due to central banks 2,475 2,499 (24) -1.0%
Due to banks 52,438 43,247 9,191 21.3%
Current accounts and demand deposits 6 1,498 (1,492) n/s
Fixed-term deposits 835 1,107 (272) -24.6%
Repurchase agreements 37,000 27,759 9,241 33.3%
Other loans 14,275 12,712 1,563 12.3%
Other payables 322 171 151 88.3%
Funding from banks 54,913 45,746 9,167 20.0%
The following components contributed to funding levels, albeit to a more moderate extent:
86 2. Half-yearly report on operation

funding from banks, the increase in which was primarily tied to the Parent Company’s dealings in repurchase
agreements;
funding from customers, the decrease in which was mainly due to the decrease in the balance held by the Parent
Company through OPTES transactions, equal to 13 billion euro (23 billion euro at the end of 2017);
bond funding, mainly composed of bonds issued under the EMTN programme, retail bond issues, "Stand alone"
issues by the Parent Company guaranteed by the Government and bonds issued by Snam, Terna and Italgas. The
total increase of 0.5 billion euro was mainly due to:
- the increase attributable to the Parent Company (1.4 billion euro) for bond issues guaranteed by Bancoposta
and for the new EMTN/DIP lines, in part offset by maturities in the first half of 2018;
- the bond issues of the subsidiary Italgas (0.2 billion euro), which, on 30 January 2018, completed the reopening
of the bond originally issued on 18 September 2017 (500 million euro, maturing on 18 January 2029 and with
coupon of 1.625%);
- the decrease in the bond issue of Terna (-0.8 billion euro), mainly due to the redemption of a bond issue and, to
a lesser extent, to the adjustment of the value of the financial instrument to its amortised cost.
Liabilities held for trading and hedging derivatives totalled 0.9 billion euro, essentially unchanged on 31 December 2017.
This item includes the fair value (where negative), of hedging derivative instruments, including operational hedges that
do not qualify as hedges for accounting purposes. It is essentially attributable to the Parent Company (0.7 billion euro).
Technical reserves refer solely to the SACE group and include reserves intended to cover, as far as they can be
reasonably foreseen, the commitments taken with reference to the Group’s insurance business. At 30 June 2018, the
item in question was around 2.3 billion euro, down by 0.1 billion euro compared to the previous financial year, mainly as
a result of the decrease in the reserve for unearned premiums.
Other liabilities, which totalled approximately 10.1 billion euro, include not only the other liabilities of the Parent
Company, but also significant balances relating to other Group companies, such as total trade payables (5.1 billion euro)
and contract work in progress (1.4 billion euro). The balance of this item was essentially unchanged from 31 December
2017 (+1.6%).
Provisions for contingencies, taxes and staff severance pay stood at approximately 6.9 billion euro at 30 June 2018, up
0.5 billion euro on 31 December 2017. It includes impairment on guarantees and commitments, in accordance with IFRS
9.
Equity amounted to approximately 35.4 billion euro at 30 June 2018 and is presented below in comparison with balances
at 31 December 2017. The adoption of IFRS 9 and IFRS 15 has led to an increase in total equity of 153 million euro and
in Group’s Equity of 163 million euro.
Taking also in account the effects of the new financial reporting standards, equity pertaining to the Group and that
pertaining to non-controlling interests was basically unchanged with respect to the previous financial year, because:
there were no significant changes in terms of equity investments and the scope of consolidation;
with reference to non-controlling interests, the decrease resulting from the payment of the dividends was essentially
offset by net income for the period;
with regard to equity pertaining to the Group, net income for the period was offset by a negative change in the
valuation reserve and by the payment of the dividend.
(millions of euro; %) 30/06/2018 31/12/2017 Change (+ / -) (%) change
Group's Equity 22,707 23,061 (354) -1.5%
Non-controlling interests 12,701 12,860 (159) -1.2%
Total equity 35,408 35,921 (513) -1.4%
87
Half-yearly Financial Report 2018
4. Performance of the CDP Group
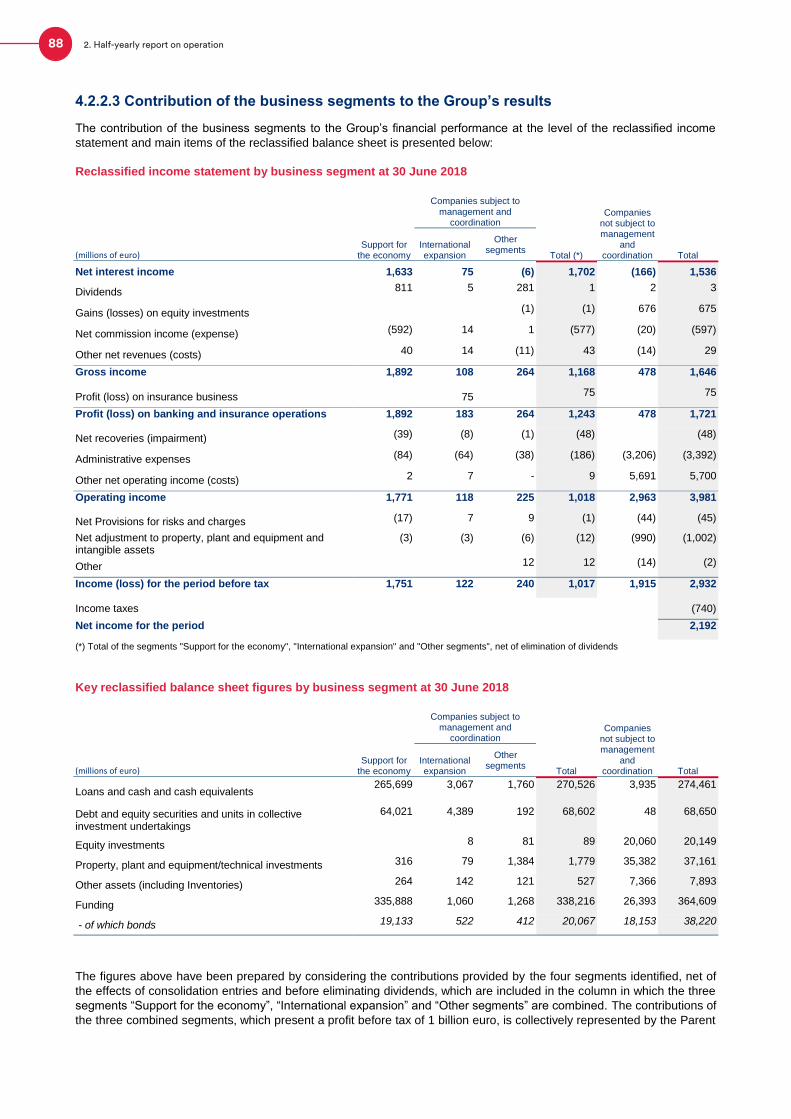
4.2.2.3 Contribution of the business segments to the Group’s results
The contribution of the business segments to the Group’s financial performance at the level of the reclassified income
statement and main items of the reclassified balance sheet is presented below:
Reclassified income statement by business segment at 30 June 2018
Companies subject to management and
coordination
Companies not subject to management
and coordination
(millions of euro) Support for
the economy International expansion
Other segments
Total (*) Total
Net interest income 1,633 75 (6) 1,702 (166) 1,536
Dividends 811 5 281 1 2 3
Gains (losses) on equity investments (1) (1) 676 675
Net commission income (expense) (592) 14 1 (577) (20) (597)
Other net revenues (costs) 40 14 (11) 43 (14) 29
Gross income 1,892 108 264 1,168 478 1,646
Profit (loss) on insurance business
75 75 75
Profit (loss) on banking and insurance operations 1,892 183 264 1,243 478 1,721
Net recoveries (impairment) (39) (8) (1) (48) (48)
Administrative expenses (84) (64) (38) (186) (3,206) (3,392)
Other net operating income (costs) 2 7 - 9 5,691 5,700
Operating income 1,771 118 225 1,018 2,963 3,981
Net Provisions for risks and charges (17) 7 9 (1) (44) (45)
Net adjustment to property, plant and equipment and intangible assets
(3) (3) (6) (12) (990) (1,002)
Other 12 12 (14) (2)
Income (loss) for the period before tax 1,751 122 240 1,017 1,915 2,932
Income taxes (740)
Net income for the period 2,192
(*) Total of the segments "Support for the economy", "International expansion" and "Other segments", net of elimination of dividends
Key reclassified balance sheet figures by business segment at 30 June 2018
Companies subject to management and
coordination
Companies not subject to management
and coordination
(millions of euro) Support for
the economy International expansion
Other segments
Total Total
Loans and cash and cash equivalents 265,699 3,067 1,760 270,526 3,935 274,461
Debt and equity securities and units in collective investment undertakings
64,021 4,389 192 68,602 48 68,650
Equity investments 8 81 89 20,060 20,149
Property, plant and equipment/technical investments 316 79 1,384 1,779 35,382 37,161
Other assets (including Inventories) 264 142 121 527 7,366 7,893
Funding 335,888 1,060 1,268 338,216 26,393 364,609
- of which bonds 19,133 522 412 20,067 18,153 38,220
The figures above have been prepared by considering the contributions provided by the four segments identified, net of
the effects of consolidation entries and before eliminating dividends, which are included in the column in which the three
segments “Support for the economy”, “International expansion” and “Other segments” are combined. The contributions of
the three combined segments, which present a profit before tax of 1 billion euro, is collectively represented by the Parent
88 2. Half-yearly report on operation

“Company and the companies subject to management and coordination”, net of their investments, included in
“Companies not subject to management and coordination”. The latter had a profit before tax of 1.9 billion euro.
Reclassified income statement by business segment at 30 June 2017
Companies subject to management and
coordination
Companies not subject to management
and coordination
(millions of euro) Support for
the economy International expansion
Other segments
Total (*) Total
Net interest income 1,593 78 (8) 1,663 (172) 1,491
Dividends 785 5 505 - - -
Gains (losses) on equity investments - - (14) (14) 955 941
Net commission income (expense) (763) 15 3 (745) (17) (762)
Other net revenues (costs) (22) (175) 2 (195) (9) (204)
Gross income 1,593 (77) 488 709 757 1,466
Profit (loss) on insurance business - 511 - 511 - 511
Profit (loss) on banking and insurance operations 1,593 434 488 1,220 757 1,977
Net recoveries (impairment) (119) (6) 4 (121) (1) (122)
Administrative expenses (72) (64) (43) (179) (2,941) (3,120)
Other net operating income (costs) - - (19) (19) 5,323 5,304
Operating income 1,402 364 430 901 3,138 4,039
Net Provisions for risks and charges - 1 5 6 (52) (46)
Net adjustment to property, plant and equipment and intangible assets
(3) (3) - (6) (957) (963)
Writedown of goodwill - - - - - -
Other - - 1 1 (4) (3)
Income (loss) for the period before tax 1,399 362 436 902 2,125 3,027
Income taxes (582)
Net income for the period 2,445
(*) Total of the segments "Support for the economy", "International expansion" and "Other segments", net of elimination of dividends
89
Half-yearly Financial Report 2018
4. Performance of the CDP Group

Key reclassified balance sheet figures by business segment at 31 December 2017
Companies subject to management and
coordination
Companies not subject to management
and coordination
(millions of euro) Support for
the economy International expansion
Other segments
Total Total
Loans and cash and cash equivalents 278,453 2,917 1,631 283,001 4,001 287,002
Debt and equity securities and units in collective investment undertakings
53,168 2,282 185 55,635 47 55,682
Equity investments 8 79 87 19,683 19,770
Property, plant and equipment/technical investments 306 99 21 426 35,388 35,814
Other assets (including Inventories) 117 153 1,487 1,758 8,018 9,776
Funding 334,403 1,407 1,254 337,064 26,959 364,023
- of which bonds 17,774 532 416 18,722 19,035 37,757
90 2. Half-yearly report on operation
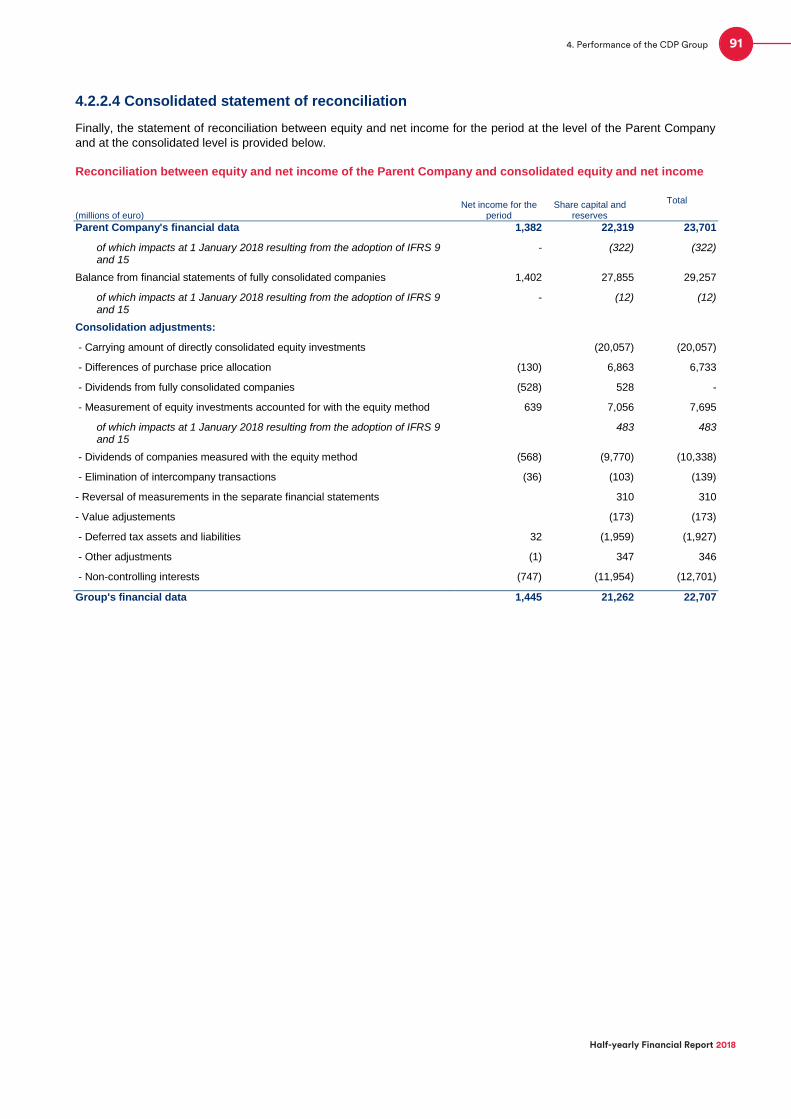
4.2.2.4 Consolidated statement of reconciliation
Finally, the statement of reconciliation between equity and net income for the period at the level of the Parent Company
and at the consolidated level is provided below.
Reconciliation between equity and net income of the Parent Company and consolidated equity and net income
(millions of euro) Net income for the
period Share capital and
reserves
Total
Parent Company's financial data 1,382 22,319 23,701
of which impacts at 1 January 2018 resulting from the adoption of IFRS 9 and 15
- (322) (322)
Balance from financial statements of fully consolidated companies 1,402 27,855 29,257
of which impacts at 1 January 2018 resulting from the adoption of IFRS 9 and 15
- (12) (12)
Consolidation adjustments:
- Carrying amount of directly consolidated equity investments (20,057) (20,057)
- Differences of purchase price allocation (130) 6,863 6,733
- Dividends from fully consolidated companies (528) 528 -
- Measurement of equity investments accounted for with the equity method 639 7,056 7,695
of which impacts at 1 January 2018 resulting from the adoption of IFRS 9 and 15
483 483
- Dividends of companies measured with the equity method (568) (9,770) (10,338)
- Elimination of intercompany transactions (36) (103) (139)
- Reversal of measurements in the separate financial statements 310 310
- Value adjustements (173) (173)
- Deferred tax assets and liabilities 32 (1,959) (1,927)
- Other adjustments (1) 347 346
- Non-controlling interests (747) (11,954) (12,701)
Group's financial data 1,445 21,262 22,707
91
Half-yearly Financial Report 2018
4. Performance of the CDP Group
3.Half-yearly condensed consolidated financial statements at 30 June 2018

3.Half-yearly condensed consolidated interim financial statements at 30 June 2018
FORM AND CONTENT OF THE HALF-YEARLY CONDENSED CONSOLIDATED FINANCIAL STATEMENTS
The half-yearly condensed consolidated financial statements at 30 June 2018 have been prepared in compliance with
applicable regulations and are composed of the:
Consolidated balance sheet;
Consolidated income statement;
Consolidated statement of comprehensive income;
Statement of changes in consolidated equity;
Consolidated statement of cash flows;
Notes to the consolidated financial statements.
The Notes to the consolidated financial statements consist of:
Introduction
Accounting policies
Information on the consolidated balance sheet
Information on the consolidated income statement
Risk monitoring
Business combinations
Transactions with related parties
Share-based payments
Segment reporting
The following are also included:
Annexes
Independent Auditors’ Report
Certification pursuant to article 154-bis of legislative decree no. 58/98
In the “Annexes” section, paragraph 1.1 “Scope of consolidation” has been added and forms an integral part of the half-
yearly condensed consolidated financial statements (Annex 1.1).
94 3. Half-yearly condensed consolidated financial statements at 30 June 2018

CONTENTS
CONSOLIDATED FINANCIAL STATEMENTS AT 30 JUNE 2018 .......................................................... 97
CONSOLIDATED BALANCE SHEET ................................................................................................... 97
CONSOLIDATED INCOME STATEMENT ............................................................................................ 99
CONSOLIDATED STATEMENT OF COMPREHENSIVE INCOME ................................................... 100
STATEMENT OF CHANGES IN CONSOLIDATED EQUITY AT 30 JUNE 2018 ............................... 101
STATEMENT OF CHANGES IN CONSOLIDATED EQUITY AT 30 June 2017 ................................ 102
CONSOLIDATED STATEMENT OF CASH FLOWS (INDIRECT METHOD) ..................................... 103
NOTES TO THE CONSOLIDATED FINANCIAL STATEMENTS ........................................................... 105
INTRODUCTION .................................................................................................................................. 105
ACCOUNTING POLICIES ................................................................................................................... 106
General information 106
Section 1 - Declaration of compliance with the International Financial Reporting Standards 106
Section 2 - General preparation principles 107
Section 3 - Scope and methods of consolidation 108
Section 4 - Events subsequent to the reporting date 114
Section 5 - Other issues 115
The main financial statement items 131
1 - Financial assets measured at fair value through profit or loss (FVTPL) 131
2 - Financial assets measured at fair value through other comprehensive income (FVOCI) 132
3 - Financial assets measured at amortised cost 134
4 - Hedging transactions 136
5 - Equity investments 137
6 - Property, plant and equipment 138
7 - Intangible assets 140
8 - Non-current assets and disposal groups held for sale 141
9 - Current and deferred taxes 141
10 - Provisions for risks and charges 142
11 - Financial liabilities measured at amortised cost 142
12 - Financial liabilities held for trading 143
13 - Financial liabilities designated at fair value 144
14 – Transactions in a foreign currency 144
15 - Insurance assets and liabilities 145
16 - Other information 145
Disclosure of transfers between portfolios of financial assets 149
Disclosures on fair value measurement 149
Qualitative disclosures ...................................................................................................................... 149 Fair value levels 2 and 3: valuation techniques and inputs used 150
Valuation processes and sensitivity 151
Hierarchy of fair value 152
Hierarchy of fair value 153
Disclosure of day one profit/loss 155
INFORMATION ON THE CONSOLIDATED BALANCE SHEET ........................................................ 156
Assets 156
Cash and cash equivalents - Item 10 156
Financial assets measured at fair value through profit and loss - Item 20 156
Financial assets measured at fair value through other comprehensive income - Item 30 157
Financial assets measured at amortised cost - Item 40 158
Hedging Derivatives - Item 50 160
Fair value change of financial assets in hedged portfolios - Item 60 161
95
Half-yearly Financial Report 2018
Quantitative disclosures .................................................................................................................... 153

Equity investments - Item 70 162
Reinsurers’ share of technical reserves - Item 80 166
Property, plant and equipment - Item 90 166
Intangible assets - Item 100 168
Non-current assets and disposal groups held for sale and associated liabilities - Item 120
of the assets and Item 70 of the liabilities 169
Other assets - Item 130 170
Liabilities ............................................................................................................................................. 171 Financial liabilities measured at amortised cost - Item 10 171
Financial liabilities held for trading - Item 20 174
Financial liabilities designated at fair value – Item 30 175
Hedging Derivatives - Item 40 175
Fair value change of financial liabilities in hedged portfolios - Item 50 176
Other liabilities - Item 80 177
Provisions for risks and charges - Item 100 178
Technical reserves - Item 110 179
Group’s equity - Items 120, 130, 140, 150, 160, 170 and 180 180
INFORMATION ON THE CONSOLIDATED INCOME STATEMENT ................................................. 182 Interest - Items 10 and 20 182
Commissions - Items 40 and 50 184
Dividends and similar revenues - Item 70 185
Profits (losses) on trading activities - Item 80 185
Fair value adjustments in hedge accounting - Item 90 185
Gains (losses) on disposal or repurchase - Item 100 186
Profits (losses) on financial assets and liabilities measured at fair value through profit or loss - Item 110 186
Net adjustments/recoveries for credit risk - Item 130 186
Net premium income - Item 160 188
Net Other income (expense) from insurance operations - Item 170 188
Administrative expenses – item 190 189
Net accruals to the provisions for risks and charges - Item 200 190
Net adjustments to/recoveries on property, plant and equipment - Item 210 191
Net adjustments to/recoveries on intangible assets - Item 220 191
Other operating income (costs) - Item 230 192
Gains (losses) on equity investments - Item 250 192
Gains (losses) on disposal of investments - Item 280 192
Risk monitoring .................................................................................................................................. 193 1. Credit risk 193
3. Interest rate risk 195
4. Liquidity risk 196
5. Operational risks 197
6. Risk of money laundering and financing of terrorism 198
7. Equity investment risks 198
8. Compliance risk 199
10. Legal disputes 199
11. Other material risks 200
12. Monitoring the risks of companies subject to management and coordination 200
Business combinations ..................................................................................................................... 201 Transactions in the period 201
Business combinations carried out after the reporting date 204
Transactions with related parties ..................................................................................................... 205 1. Information on the remuneration of Key management personnel 205
2. Information on transactions with related parties 207
Share-based payments 208
Consolidated information on operating segments ......................................................................... 210
ANNEXES ................................................................................................................................................ 214
INDEPENDENT AUDITORS’ REPORT ................................................................................................... 227
CERTIFICATION OF THE HALF-YEARLY CONDENSED CONSOLIDATED FINANCIAL STATEMENTS PURSUANT TO ARTICLE 154 BIS OF LEGISLATIVE DECREE NO. 58/1998 ..................................... 228
96 3. Half-yearly condensed consolidated financial statements at 30 June 2018
2. Counterparty risk 195
9. Reputational risk 199

CONSOLIDATED FINANCIAL STATEMENTS AT 30 JUNE 2018
CONSOLIDATED BALANCE SHEET
(thousands of euro)
Assets 30/06/2018 31/12/2017
10. Cash and cash equivalents 1,029 1,015
20. Financial assets measured at fair value through profit or loss 5,347,662 3,718,029
a) Financial assets held for trading 2,248,867 894,208
b) Financial assets designated at fair value - -
c) Other financial asstes mandatorily measured at fair value 3,098,795 2,823,821
30. Financial assets measured at fair value through other comprehesinve income 10,607,524 9,523,380
40. Financial assets measured at amortised cost 327,260,407 329,561,238
a) Loans to banks 22,978,847 43,137,745
b) Loans to customers 304,281,560 286,423,493
50. Hedging derivatives 815,293 988,655
60. Fair value change of financial assets in hedged portfolios (+/-) 32,617 (41,503)
70. Equity investments 20,148,923 19,769,766
80. Reinsurers' share of technical reserves 599,277 670,812
90. Property, plant and equipment 37,161,233 37,178,510
100. Intangible assets 8,600,192 8,050,650
- of which goodwill 661,275 653,342
110. Tax assets 1,665,584 1,701,679
a) current tax assets 414,014 441,776
b) deferred tax assets 1,251,570 1,259,903
120. Non-current assets and disposal groups held for sale 19,180 23
130. Other assets 7,893,519 8,411,494
Total assets 420,152,440 419,533,748
The data as at 31 December 2017 have been reconciled to the new schemes as described in the Accounting Policies, “Other Issues” Section.
97
Half-yearly Financial Report 2018
Consolidated financial statements at June 2018

(thousands of euro)
Liabilities and equity 30/06/2018 31/12/2017
10. Financial liabilities measured at amortised cost 363,974,990 363,381,652
a) Due to banks 31,393,081 25,812,471
b) Due to customers 294,879,601 300,331,654
c) Securities issued 37,702,308 37,237,527
20. Financial liabilities held for trading 96,093 185,694
30. Financial liabilities designated at fair value 633,765 641,642
40. Hedging derivatives 757,981 667,714
50. Fair value change of financial liabilities in hedged portfolios (+/-) 28,878 32,400
60. Tax liabilities 3,843,045 3,549,637
a) current tax liabilties 522,913 82,581
b) deferred tax liabilties 3,320,132 3,467,056
70. Liabilities associated with non-current assets and disposal groups held for sale - -
80. Other liabilities 10,077,841 9,720,862
90. Staff severance pay 217,704 221,039
100. Provisions for risks and charges 2,829,193 2,803,941
a) guarantees issued and commitments 229,550 188,131
b) pensions and other post-retirement benefit obligations - -
c) other provisions 2,599,643 2,615,810
110. Technical reserves 2,285,297 2,407,786
120. Valuation reserves 570,650 763,663
130. Redeemable shares - -
140. Equity instruments - -
150. Reserves 14,319,024 12,981,676
160. Share premium reserve 2,378,517 2,378,517
170. Share capital 4,051,143 4,051,143
180. Treasury shares (-) (57,220) (57,220)
190. Non-controlling interests (+/-) 12,701,027 12,860,288
200. Net income (loss) for the period 1,444,512 2,943,314
Total liabilities and equity 420,152,440 419,533,748
The data as at 31 December 2017 have been reconciled to the new schemes as described in the Accounting Policies, “Other Issues” Section.
98 3. Half-yearly condensed consolidated financial statements at 30 June 2018

CONSOLIDATED INCOME STATEMENT
(thousands of euro)
Items 1st half of 2018 1st half of 2017
10. Interest income and similar income 3,788,943 3,906,697
- of which: interest income calculated using the effective interest rate method 3,807,251 3,797,194
20. Interest expense and similar expense (2,253,268) (2,415,513)
30. Net interest income 1,535,675 1,491,184
40. Commission income 214,136 52,103
50. Commission expense (811,028) (814,079)
60. Net commission income (expense) (596,892) (761,976)
70. Dividends and similar revenues 3,293 733
80. Profits (losses) on trading activities 26,371 (183,599)
90. Fair value adjustments in hedge accounting (20,541) (12,544)
100. Gains (losses) on disposal or repurchase of: 57,062 (5,019)
a) financial assets measured at amortised cost 47,319 9,606
b) financial assets measured at fair value through other comprehesinve income 9,762 (14,625)
c) financial liabilities (19) -
110. Profits (losses) on financial assets and liabilities measured at fair value through profit or loss (33,762) (187,522)
a) financial assets and liabilities designated at fair value 1,835 (3,421)
b) Other financial asstes mandatorily measured at fair value (35,597) (184,101)
120. Gross income 971,206 341,257
130. Net adjustments/recoveries for credit risk relating to: (48,355) (15,975)
a) financial assets measured at amortised cost (47,817) (15,975)
b) financial assets at fair value through other comprehesinve income (538) -
150. Net financial income (expense) 922,851 325,282
160. Net premium income 122,462 430,343
170. Net other income (expense) from insurance operations (47,517) 80,211
180. Net income from financial and insurance operations 997,796 835,836
190. Administrative expenses (3,391,776) (3,119,979)
a) staff costs (932,727) (890,557)
b) other administrative expenses (2,459,049) (2,229,422)
200. Net accruals to the provisions for risks and charges (45,243) 31,971
a) guarantees issued and commitments (1,077) 78,080
b) other net accruals (44,166) (46,109)
210. Net adjustments to/recoveries on property, plant and equipment (698,552) (676,285)
220. Net adjustments to/recoveries on intangible assets (303,568) (286,352)
230. Other operating income (costs) 5,700,451 5,304,507
240. Operating costs 1,261,312 1,253,862
250. Gains (losses) on equity investments 674,651 355,638
260. Gains (losses) on tangible and intangibile assets measured at fair value - 494
280. Gains (losses) on disposal of investments (2,245) 580,330
290. Income (loss) before tax from continuing operations 2,931,514 3,026,160
300. Income tax for the period on continuing operations (739,683) (581,880)
310. Income (loss) after tax on continuing operations 2,191,831 2,444,280
330. Net income (loss) for the period 2,191,831 2,444,280
340. Net income (loss) for the period pertaining to non-controlling interests 747,319 880,588
350. Net income (loss) for the period pertaining to shareholders of the Parent Company 1,444,512 1,563,692
The data as at 30 June 2017 have been restated to take into account the completion of the PPA process in relation to the investment acquired in Poste Italiane in late 2016, and have also been reconciled to the new financial statements schemes as described in the Accounting Policies, “Other Issues” Section.
99
Half-yearly Financial Report 2018
Consolidated financial statements at June 2018
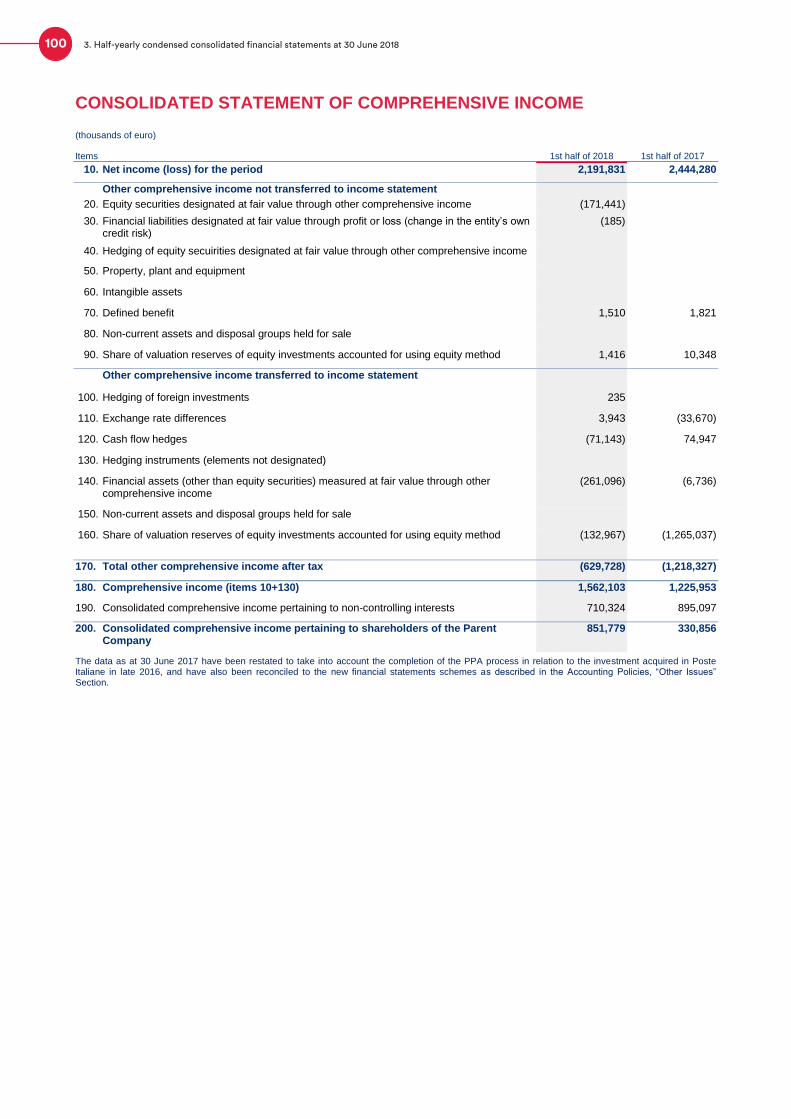
CONSOLIDATED STATEMENT OF COMPREHENSIVE INCOME
(thousands of euro)
Items 1st half of 2018 1st half of 2017
10. Net income (loss) for the period 2,191,831 2,444,280
Other comprehensive income not transferred to income statement
20. Equity securities designated at fair value through other comprehensive income (171,441)
30. Financial liabilities designated at fair value through profit or loss (change in the entity’s own credit risk)
(185)
40. Hedging of equity secuirities designated at fair value through other comprehensive income
50. Property, plant and equipment
60. Intangible assets
70. Defined benefit 1,510 1,821
80. Non-current assets and disposal groups held for sale
90. Share of valuation reserves of equity investments accounted for using equity method 1,416 10,348
Other comprehensive income transferred to income statement
100. Hedging of foreign investments 235
110. Exchange rate differences 3,943 (33,670)
120. Cash flow hedges (71,143) 74,947
130. Hedging instruments (elements not designated)
140. Financial assets (other than equity securities) measured at fair value through other comprehensive income
(261,096) (6,736)
150. Non-current assets and disposal groups held for sale
160. Share of valuation reserves of equity investments accounted for using equity method (132,967) (1,265,037)
170. Total other comprehensive income after tax (629,728) (1,218,327)
180. Comprehensive income (items 10+130) 1,562,103 1,225,953
190. Consolidated comprehensive income pertaining to non-controlling interests 710,324 895,097
200. Consolidated comprehensive income pertaining to shareholders of the Parent Company
851,779 330,856
The data as at 30 June 2017 have been restated to take into account the completion of the PPA process in relation to the investment acquired in Poste Italiane in late 2016, and have also been reconciled to the new financial statements schemes as described in the Accounting Policies, “Other Issues” Section.
100 3. Half-yearly condensed consolidated financial statements at 30 June 2018
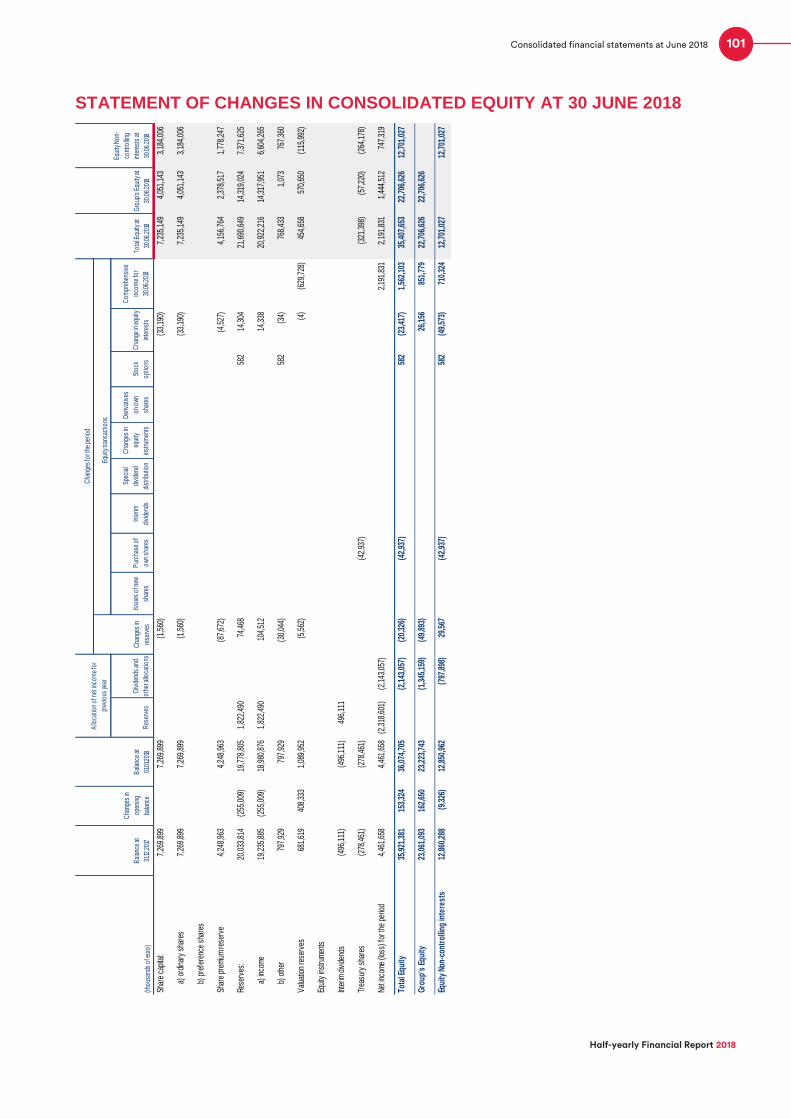
STATEMENT OF CHANGES IN CONSOLIDATED EQUITY AT 30 JUNE 2018
Res
erve
s
Div
iden
ds a
nd
othe
r allo
catio
ns
Issu
es o
f new
shar
es
Pur
chas
e of
own
shar
es
Inte
rim
divi
dend
s
Spec
ial
divi
dend
dist
ribut
ion
Cha
nges
in
equi
ty
inst
rum
ents
Der
ivat
ives
on o
wn
shar
es
Stoc
k
optio
ns
Cha
nge
in e
quity
inte
rest
s
Com
preh
ensi
ve
inco
me
for
30.0
6.20
18
Shar
e ca
pita
l:7,
269,
899
7,
269,
899
(1,5
60)
(3
3,19
0)
7,
235,
149
4,05
1,14
3 3,
184,
006
a
) ord
inar
y sh
ares
7,26
9,89
9
7,26
9,89
9
(1
,560
)
(33,
190)
7,23
5,14
9 4,
051,
143
3,18
4,00
6
b
) pre
fere
nce
shar
es
Shar
e pr
emiu
m re
serv
e4,
248,
963
4,
248,
963
(87,
672)
(4,5
27)
4,
156,
764
2,37
8,51
7 1,
778,
247
Rese
rves
:20
,033
,814
(2
55,0
09)
19,7
78,8
05
1,82
2,49
0
74,4
68
582
14,3
04
21
,690
,649
14
,319
,024
7,
371,
625
a
) inc
ome
19,2
35,8
85
(255
,009
) 18
,980
,876
1,
822,
490
10
4,51
2
14,3
38
20
,922
,216
14
,317
,951
6,
604,
265
b
) oth
er79
7,92
9
797,
929
(30,
044)
58
2 (3
4)
76
8,43
3 1,
073
767,
360
Val
uatio
n re
serv
es68
1,61
9 40
8,33
3 1,
089,
952
(5,5
62)
(4
) (6
29,7
28)
454,
658
570,
650
(115
,992
)
Equi
ty in
stru
men
ts
Inte
rim d
ivid
ends
(496
,111
)
(496
,111
) 49
6,11
1
Trea
sury
sha
res
(278
,461
)
(278
,461
)
(4
2,93
7)
(3
21,3
98)
(57,
220)
(2
64,1
78)
Net i
ncom
e (lo
ss) f
or th
e pe
riod
4,46
1,65
8
4,46
1,65
8 (2
,318
,601
) (2
,143
,057
)
2,19
1,83
1 2,
191,
831
1,44
4,51
2 74
7,31
9
Tota
l Equ
ity35
,921
,381
15
3,32
4 36
,074
,705
(2,1
43,0
57)
(20,
326)
(42,
937)
58
2 (2
3,41
7)
1,56
2,10
3 35
,407
,653
22
,706
,626
12
,701
,027
Gro
up's
Equ
ity23
,061
,093
16
2,65
0 23
,223
,743
(1,3
45,1
59)
(49,
893)
26,1
56
851,
779
22,7
06,6
26
22,7
06,6
26
Equi
ty N
on-c
ontr
ollin
g in
tere
sts
12,8
60,2
88
(9,3
26)
12,8
50,9
62
(7
97,8
98)
29,5
67
(4
2,93
7)
582
(49,
573)
71
0,32
4 12
,701
,027
12,7
01,0
27
Cha
nges
for t
he p
erio
d
Tota
l Equ
ity a
t
30.0
6.20
18
Gro
up's
Equ
ity a
t
30.0
6.20
18
Equi
ty N
on-
cont
rollin
g
inte
rest
s at
30.0
6.20
18
Cha
nges
in
rese
rves
Equi
ty tr
ansa
ctio
ns
(thou
sand
s of
eur
o)
Bal
ance
at
31.12
.201
7
Cha
nges
in
open
ing
bala
nce
Bal
ance
at
01.0
1.201
8
Allo
catio
n of
net
inco
me
for
prev
ious
year
101
Half-yearly Financial Report 2018
Consolidated financial statements at June 2018

STATEMENT OF CHANGES IN CONSOLIDATED EQUITY AT 30 JUNE 2017
Res
erve
s
Div
iden
ds a
nd
oth
er a
lloca
tions
Issu
es o
f new
shar
es
Pur
chas
e o
f
ow
n sh
ares
Inte
rim
divi
dend
s
Spe
cial
divi
dend
dist
ribut
ion
Cha
nges
in
equi
ty
inst
rum
ents
Der
ivat
ives
on
ow
n
shar
es
Sto
ck
opt
ions
Cha
nge
in e
quity
inte
rest
s
Co
mpr
ehen
sive
inco
me
for
30.0
6.20
17
Sha
re c
apita
l:7,
420,
005
7,
420,
005
(138
,889
)
7,28
1,11
6 4,
051,
143
3,22
9,97
3
a
) or
dina
ry s
hare
s7,
420,
005
7,
420,
005
(138
,889
)
7,28
1,11
6 4,
051,
143
3,22
9,97
3
b
) pr
efer
ence
sha
res
Sha
re p
rem
ium
res
erve
4,47
7,48
3
4,47
7,48
3
(2
22,6
24)
(5
,452
)
4,24
9,40
7 2,
378,
517
1,87
0,89
0
Res
erve
s:20
,751
,578
20,7
51,5
78
(862
,208
)
162,
220
(9
7,83
2)
11
,674
17,1
75
19
,982
,607
12
,967
,468
7,
015,
139
a
) in
com
e19
,948
,861
19,9
48,8
61
(862
,283
)
180,
367
(9
7,83
2)
17
,828
19,1
86,9
41
12,9
66,4
03
6,22
0,53
8
b
) ot
her
802,
717
80
2,71
7 75
(18,
147)
11,6
74
(6
53)
79
5,66
6 1,
065
794,
601
Val
uatio
n re
serv
es2,
239,
203
2,
239,
203
(4,0
88)
(2
4,75
1)
(1,2
18,3
27)
992,
037
1,06
9,15
7 (7
7,12
0)
Equi
ty in
stru
men
ts
Inte
rim d
ivid
ends
(205
,133
)
(205
,133
) 20
5,13
3
Trea
sury
sha
res
(132
,348
)
(132
,348
)
(1
39,4
50)
(2
71,7
98)
(57,
220)
(2
14,5
78)
Net
inco
me
(loss
) fo
r th
e pe
riod
1,12
8,42
2 96
,726
1,
225,
148
657,
075
(1,8
82,2
23)
2,
444,
280
2,44
4,28
0 1,
563,
692
880,
588
To
tal E
qu
ity
35,6
79,2
10
96,7
26
35,7
75,9
36
(1
,882
,223
) (6
4,49
2)
(1
39,4
50)
(9
7,83
2)
11
,674
(151
,917
) 1,
225,
953
34,6
77,6
49
21,9
72,7
57
12,7
04,8
92
Gro
up
's E
qu
ity
22,5
28,0
64
96,7
26
22,6
24,7
90
(9
86,9
01)
57,2
13
(5
3,20
1)
330,
856
21,9
72,7
57
21,9
72,7
57
Equ
ity
No
n-c
on
tro
llin
g in
tere
sts
13,1
51,1
46
13
,151
,146
(895
,322
) (1
21,7
05)
(1
39,4
50)
(9
7,83
2)
11
,674
(98,
716)
89
5,09
7 12
,704
,892
12,7
04,8
92
Cha
nges
for t
he p
erio
d
To
tal E
quity
at
30.0
6.20
17
Gro
up's
Equ
ity a
t
30.0
6.20
17
Equ
ity N
on-
cont
rolli
ng
inte
rest
s at
30.0
6.20
17
Cha
nges
in
rese
rves
Equ
ity tr
ansa
ctio
ns
(tho
usan
ds o
f eur
o)
Bal
ance
at
31.12
.201
6
Cha
nges
in
ope
ning
bala
nce
Bal
ance
at
01.0
1.201
7
Allo
catio
n o
f net
inco
me
for
prev
ious
yea
r
Wo
rk p
roce
eded
in 2
017
to c
om
plet
e th
e P
PA
for t
he e
quity
inve
stm
ent a
cqui
red
in P
ost
e Ita
liane
at t
he e
nd o
f 201
6 (a
s in
dica
ted
in th
e se
ctio
n o
n A
cco
untin
g P
olic
ies,
"O
ther
Asp
ects
"). C
ons
eque
ntly
, thi
s st
atem
ent s
how
s th
e re
stat
ed e
quity
figu
res
at 3
1 Dec
embe
r 201
6 (w
hose
cha
nges
are
reco
gnis
ed in
the
colu
mn
"Cha
nges
in o
peni
ng b
alan
ce")
, and
the
figur
es
at 3
0 Ju
ne 2
017
for E
quity
and
Net
inco
me
for t
he p
erio
d.
102 3. Half-yearly condensed consolidated financial statements at 30 June 2018
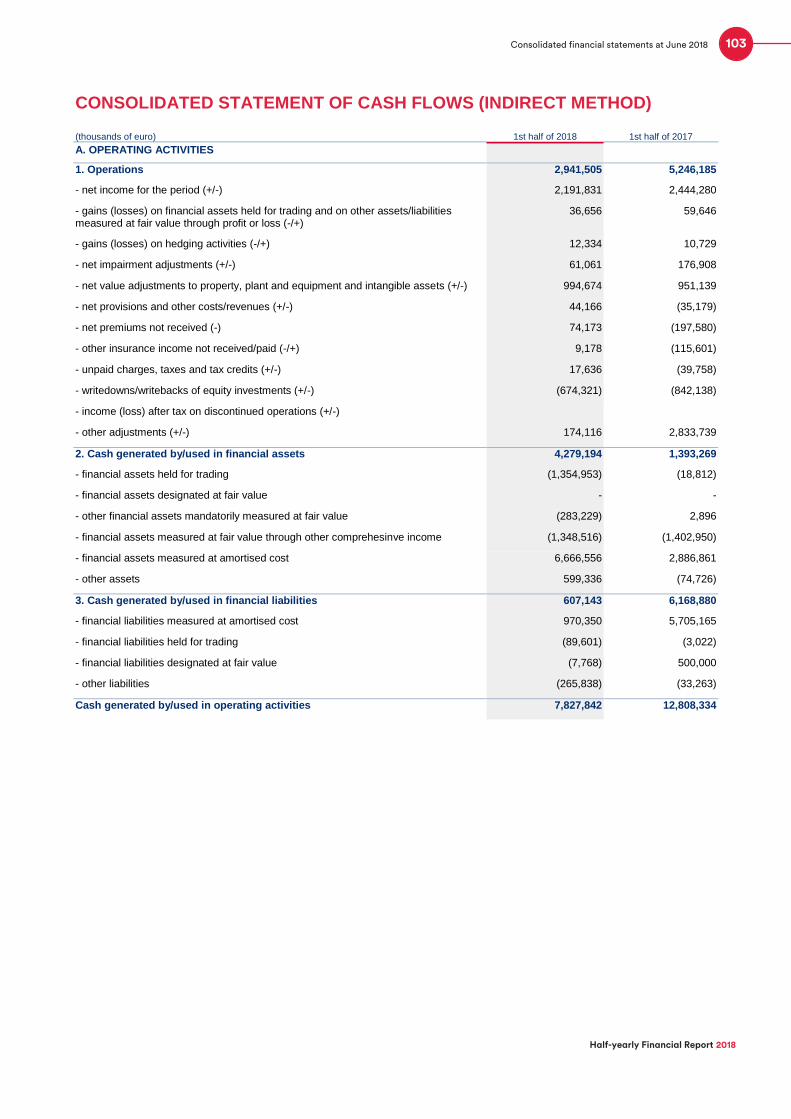
CONSOLIDATED STATEMENT OF CASH FLOWS (INDIRECT METHOD)
(thousands of euro) 1st half of 2018 1st half of 2017
A. OPERATING ACTIVITIES
1. Operations 2,941,505 5,246,185
- net income for the period (+/-) 2,191,831 2,444,280
- gains (losses) on financial assets held for trading and on other assets/liabilities measured at fair value through profit or loss (-/+)
36,656 59,646
- gains (losses) on hedging activities (-/+) 12,334 10,729
- net impairment adjustments (+/-) 61,061 176,908
- net value adjustments to property, plant and equipment and intangible assets (+/-) 994,674 951,139
- net provisions and other costs/revenues (+/-) 44,166 (35,179)
- net premiums not received (-) 74,173 (197,580)
- other insurance income not received/paid (-/+) 9,178 (115,601)
- unpaid charges, taxes and tax credits (+/-) 17,636 (39,758)
- writedowns/writebacks of equity investments (+/-) (674,321) (842,138)
- income (loss) after tax on discontinued operations (+/-)
- other adjustments (+/-) 174,116 2,833,739
2. Cash generated by/used in financial assets 4,279,194 1,393,269
- financial assets held for trading (1,354,953) (18,812)
- financial assets designated at fair value - -
- other financial assets mandatorily measured at fair value (283,229) 2,896
- financial assets measured at fair value through other comprehesinve income (1,348,516) (1,402,950)
- financial assets measured at amortised cost 6,666,556 2,886,861
- other assets 599,336 (74,726)
3. Cash generated by/used in financial liabilities 607,143 6,168,880
- financial liabilities measured at amortised cost 970,350 5,705,165
- financial liabilities held for trading (89,601) (3,022)
- financial liabilities designated at fair value (7,768) 500,000
- other liabilities (265,838) (33,263)
Cash generated by/used in operating activities 7,827,842 12,808,334
103
Half-yearly Financial Report 2018
Consolidated financial statements at June 2018
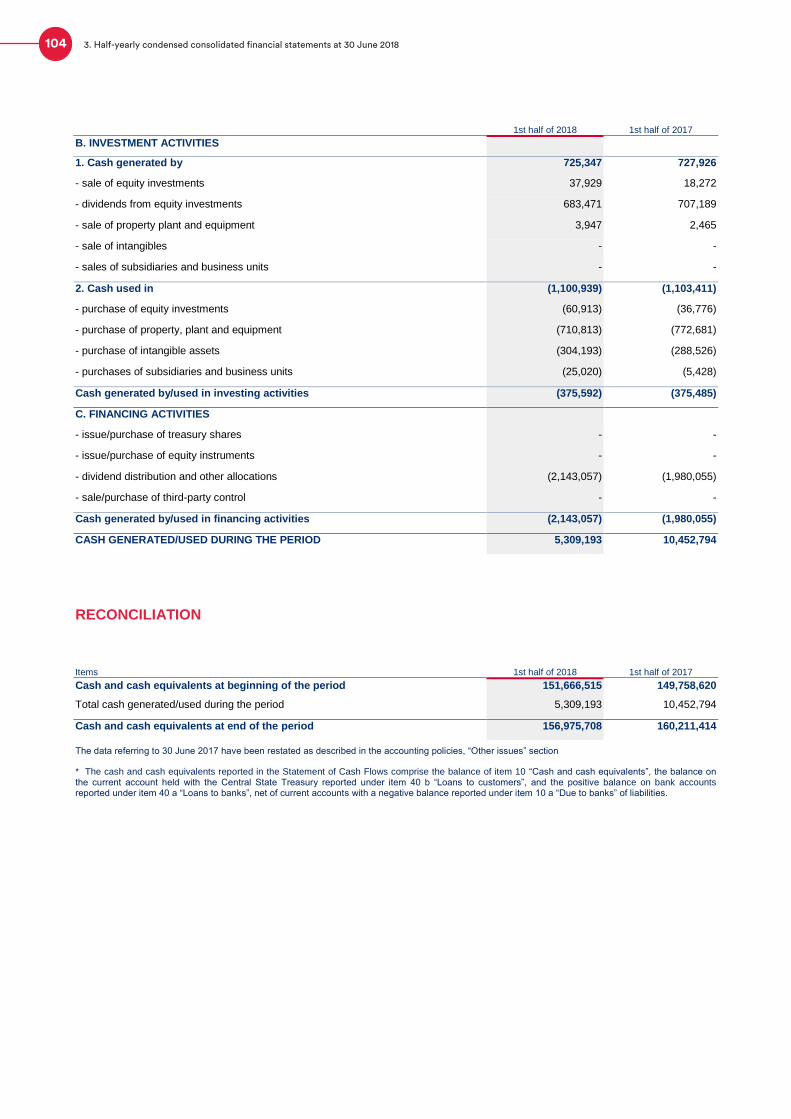
1st half of 2018 1st half of 2017
B. INVESTMENT ACTIVITIES
1. Cash generated by 725,347 727,926
- sale of equity investments 37,929 18,272
- dividends from equity investments 683,471 707,189
- sale of property plant and equipment 3,947 2,465
- sale of intangibles - -
- sales of subsidiaries and business units - -
2. Cash used in (1,100,939) (1,103,411)
- purchase of equity investments (60,913) (36,776)
- purchase of property, plant and equipment (710,813) (772,681)
- purchase of intangible assets (304,193) (288,526)
- purchases of subsidiaries and business units (25,020) (5,428)
Cash generated by/used in investing activities (375,592) (375,485)
C. FINANCING ACTIVITIES
- issue/purchase of treasury shares - -
- issue/purchase of equity instruments - -
- dividend distribution and other allocations (2,143,057) (1,980,055)
- sale/purchase of third-party control - -
Cash generated by/used in financing activities (2,143,057) (1,980,055)
CASH GENERATED/USED DURING THE PERIOD 5,309,193 10,452,794
RECONCILIATION
Items 1st half of 2018 1st half of 2017
Cash and cash equivalents at beginning of the period 151,666,515 149,758,620
Total cash generated/used during the period 5,309,193 10,452,794
Cash and cash equivalents at end of the period 156,975,708 160,211,414
The data referring to 30 June 2017 have been restated as described in the accounting policies, “Other issues” section
* The cash and cash equivalents reported in the Statement of Cash Flows comprise the balance of item 10 “Cash and cash equivalents”, the balance on the current account held with the Central State Treasury reported under item 40 b “Loans to customers”, and the positive balance on bank accounts reported under item 40 a “Loans to banks”, net of current accounts with a negative balance reported under item 10 a “Due to banks” of liabilities.
104 3. Half-yearly condensed consolidated financial statements at 30 June 2018

NOTES TO THE CONSOLIDATED FINANCIAL STATEMENTS
INTRODUCTION
Structure and content of the half-yearly condensed consolidated financial statements
The half-yearly condensed consolidated financial statements of the Cassa depositi e prestiti Group (“CDP Group” or
“Group”) have been prepared in compliance with the international accounting standards, and in particular IAS 34, which
sets out the minimum content and the basis of preparation for half-yearly financial reports.
The half-yearly condensed consolidated financial statements are expressed in thousands of euro and include the
consolidated balance sheet, the consolidated income statement, the consolidated statement of comprehensive income,
the statement of changes in consolidated equity, the consolidated statement of cash flows and these notes to the
consolidated financial statements, as well as the Board of Directors’ report on operations at Group level (Half-yearly
report on operations).
The half-yearly condensed consolidated financial statements at 30 June 2018 give a clear, true and fair view of the
Group’s financial positions and results for the period. The figures shown in these statements correspond with the
company accounting records and fully reflect the transactions conducted during the half-year period.
Basis of presentation
The financial statements and the related explanatory notes are expressed in thousands of euro, unless otherwise
specified.
Items with zero balances for both the current and prior periods have been excluded. In the income statement, income is
indicated as positive numbers, while expenses are shown in brackets, when presented inside tables that also include
revenue items.
The figures of the items, sub-items, and the “of which” specifications in the consolidated financial statements and in the
tables of the notes to the consolidated financial statements have been rounded as appropriate, while ignoring the
fractions of amounts equal to or less than 500 euro and raising fractions greater than 500 euro to the next highest
thousand. The rounded amounts for the various items are the sum of the rounded balances of sub-items.
The cash and cash equivalents reported in the Statement of cash flows comprise the balance of item 10 “Cash and cash
equivalents”, the balance on the current account held with the Central State Treasury reported under item 40 b “Loans to
customers”, and the positive balance on bank accounts reported under item 40 a “Loans to banks”, net of current
accounts with a negative balance reported under item 10 a “Due to banks” of liabilities.
Comparison and disclosure
As detailed below, the notes to the consolidated financial statements provide all the information required by law, as well
as any supplemental information deemed necessary in order to give a true and fair view of the Group’s financial position
and results.
105
Half-yearly Financial Report 2018
Notes to the consolidated financial statements

These financial statements comply with the requirements of Bank of Italy circular No. 262/2005, updated as at 22
December 2017, and include, in accordance with IAS 34, accounting data as at 30 June 2018 as well as the following
comparative data:
Consolidated balance sheet at 31 December 2017;
Consolidated income statement for the period ended 30 June 2017;
Consolidated statement of comprehensive income at 30 June 2017;
Statement of changes in consolidated equity at 30 June 2017;
Consolidated statement of cash flows at 30 June 2017;
The comparative information for the balance sheet data at 31 December 2017 is presented as reclassified figures, as
described in more detail in the “Other issues” section of the accounting policies in the paragraphs “Transition
statements”.
The comparative information for the income statement figures and other comprehensive income for the period ended 30
June 2017 has also been reclassified, in addition to having been restated following completion of the PPA for the equity
investment in Poste Italiane, as described in the “Other issues” section. Following the completion of the PPA, the figures
contained in the Statement of changes in consolidated shareholders' equity at 30 June 2017 have also been restated.
The comparative figures at 30 June 2017 included in the statement of cash flows have consequently been reclassified
and restated.
Auditing of the financial statements
The half-yearly condensed consolidated financial statements of the CDP Group are subject to review by the independent
auditing firm PricewaterhouseCoopers S.p.A., following award of the audit engagement for the 2011-2019 period by the
Shareholders’ Meeting of 25 May 2011.
Annexes
Annex 1.1 “Scope of consolidation” is attached to the half-yearly condensed consolidated financial statements.
ACCOUNTING POLICIES
General information
SECTION 1 - DECLARATION OF COMPLIANCE WITH THE INTERNATIONAL FINANCIAL REPORTING STANDARDS
These half-yearly condensed consolidated financial statements at 30 June 2018 have been prepared in compliance with
the International Financial Reporting Standards (IFRS), issued by the International Accounting Standards Board (IASB),
including the SIC and IFRIC interpretations, in force at 30 June 2018 and endorsed by the European Commission, as
provided by Regulation (EC) 1606 of 19 July 2002, published in the Official Journal of the Republic of Italy (Gazzetta
Ufficiale) L. 243 on 11 September 2002.
In detail, the content of these half-yearly condensed consolidated financial statements complies with IAS 34, which sets
out the minimum content and the basis of preparation for interim financial reports. The CDP Group has exercised the
option to prepare the half-yearly financial report in the condensed format as opposed to the full disclosure envisaged for
the consolidated annual report
To the extent applicable, these half-yearly condensed consolidated financial statements have been prepared on the
basis of Circular No. 262 of the Bank of Italy of 22 December 2005, 5th Update of 22 December 2017.
The IFRS applied for preparation of these half-yearly condensed consolidated financial statements are found in the list
given in “Section 5 – Other issues”.
106 3. Half-yearly condensed consolidated financial statements at 30 June 2018

SECTION 2 - GENERAL PREPARATION PRINCIPLES
The half-yearly condensed consolidated financial statements include the consolidated balance sheet, the consolidated
income statement, the consolidated statement of comprehensive income, the statement of changes in consolidated
equity, the consolidated statement of cash flows (prepared according to the “indirect method”), and these notes, as well
as the Board of Directors’ interim report on operations of the Group.
The consolidated balance sheet does not contain those items having a zero amount in the reference financial period and
in the previous financial year. The consolidated income statement and the consolidated statement of comprehensive
income do not contain those items having a zero amount in the reference financial period and in the previous one.
In the consolidated income statement, the consolidated statement of comprehensive income, and the tables in the
explanatory notes, revenues are indicated without sign, while costs are shown in brackets, when presented inside tables
that also include revenue items.
For the purposes of interpretation and to provide support in applying the financial reporting standards, the following
documents have also been considered, although they have not been endorsed by the European Commission:
the Framework for the Preparation and Presentation of Financial Statements, issued by the International Accounting
Standards Board (IASB) in 2001;
Implementation Guidance, Basis for Conclusions, and any other documentation prepared by the IASB or IFRIC to
supplement the IFRS issued;
interpretation documents concerning the application of the IFRS in Italy, prepared by the Organismo Italiano di
Contabilità (Italian Accounting Board, OIC) and the Italian Banking Association (ABI);
documents issued by the EBA, ESMA and Consob concerning the application of specific IFRS rules.
Where the information required by the IFRS and the regulations of the Bank of Italy is deemed to be inadequate in
presenting the company’s financial standing in a true and fair manner, the explanatory notes also provide supplemental
information for such purpose.
These half-yearly condensed consolidated financial statements have been prepared in accordance with the provisions of
IAS 1 - “Presentation of financial statements”:
Going concern basis: pursuant to the provisions of joint Bank of Italy/Consob/Isvap Document No. 2 of 6 February
2009 concerning disclosures on the going concern basis and in compliance with the requirements on the same issue
contained in IAS 1 Revised, the CDP Group has conducted an assessment of its ability to continue to operate as a
single going concern, considering all available information over a medium-term time horizon. Based on an analysis of
the information and the results achieved in previous years, CDP feels that it is appropriate to prepare its half-yearly
condensed consolidated financial statements on a going concern basis;
Accruals basis: operations are recognised in the accounting records and in the half-yearly condensed consolidated
financial statements of the CDP Group (except for the disclosure about cash flows) when they accrue, regardless of
the payment or collection date. Costs and revenues are taken to profit or loss in accordance with the matching
principle;
Materiality and aggregation: all items containing assets, liabilities, revenues and expense of a similar nature and with
similar characteristics are presented separately in the half-yearly condensed consolidated financial statements, unless
they are immaterial;
Offsetting: no assets have been offset with liabilities, nor income with expenses, unless expressly required or allowed
by the instructions of the Bank of Italy or by an accounting standard or a related interpretation;
Frequency of reporting: the CDP Group has prepared these half-yearly condensed consolidated financial statements,
presenting the related disclosures, on an annual basis. No changes occurred with respect to the reporting date, which
remains at 31 December of each year;
Comparative information: the comparative information is shown for all the corresponding previous financial years and
periods of the previous financial year and is provided for each individual document comprising the half-yearly
condensed consolidated financial statements, including the consolidated explanatory notes.
Use of estimates
The application of International Financial Reporting Standards in preparing the half-yearly condensed consolidated
financial statements requires the CDP Group to make accounting estimates that are considered reasonable and realistic
according to the information available at the time the estimate is made. Such estimates impact the carrying amount of the
assets and liabilities, costs, revenues, and the disclosures on contingent assets and liabilities at the date of the half-
yearly condensed consolidated financial statements, as well as the amounts reported for revenues and costs for the
reference financial period.
Changes in the conditions underlying the judgements, assumptions and estimates used could also have an impact on the
financial statement items and future earnings results.
107
Half-yearly Financial Report 2018
Notes to the consolidated financial statements

The main areas in which management is required to make subjective assessments are:
the calculation of impairment losses on financial assets at amortised cost (loans and debt securities), financial assets
measured at fair value through other comprehensive income, guarantees and commitments, as well as equity
investments;
the use of measurement techniques to determine the fair value of financial instruments not quoted on an active
market;
the calculation of provisions for employees and provisions for risks and charges;
the estimates and assumptions used in assessing the recoverability of deferred tax assets and interpretive issues
concerning tax treatment;
the statistical and financial assumptions used in estimating repayment flows on postal savings products;
the assessment of the accuracy of the value of goodwill and other intangible assets;
the technical reserves of the insurance companies;
the valuation of work in progress and inventories of raw materials, semi-finished and finished goods.
The description of the accounting policies used for the main items of the half-yearly condensed consolidated financial
statements provides details on the main assumptions and assessments used in preparing the half-yearly condensed
consolidated financial statements.
SECTION 3 - SCOPE AND METHODS OF CONSOLIDATION
Subsidiaries are consolidated on a line-by-line basis, while companies subject to joint control or significant influence are
accounted for using the equity method. An exception is made for a number of equity investments in companies in
liquidation or subsidiaries in the start-up phase without assets and liabilities, whose contribution to the consolidated
financial statements is immaterial.
The financial statements of the subsidiaries used for line-by-line consolidation are those at 30 June 2018, as approved
by competent corporate bodies of consolidated companies, adjusted as necessary to harmonise them with Group
accounting policies and reclassified on the basis of the formats established by the Bank of Italy in Circular no. 262 of 22
December 2005, updated to 22 December 2017.
The following statement shows the companies consolidated on a line-by-line basis.
108 3. Half-yearly condensed consolidated financial statements at 30 June 2018
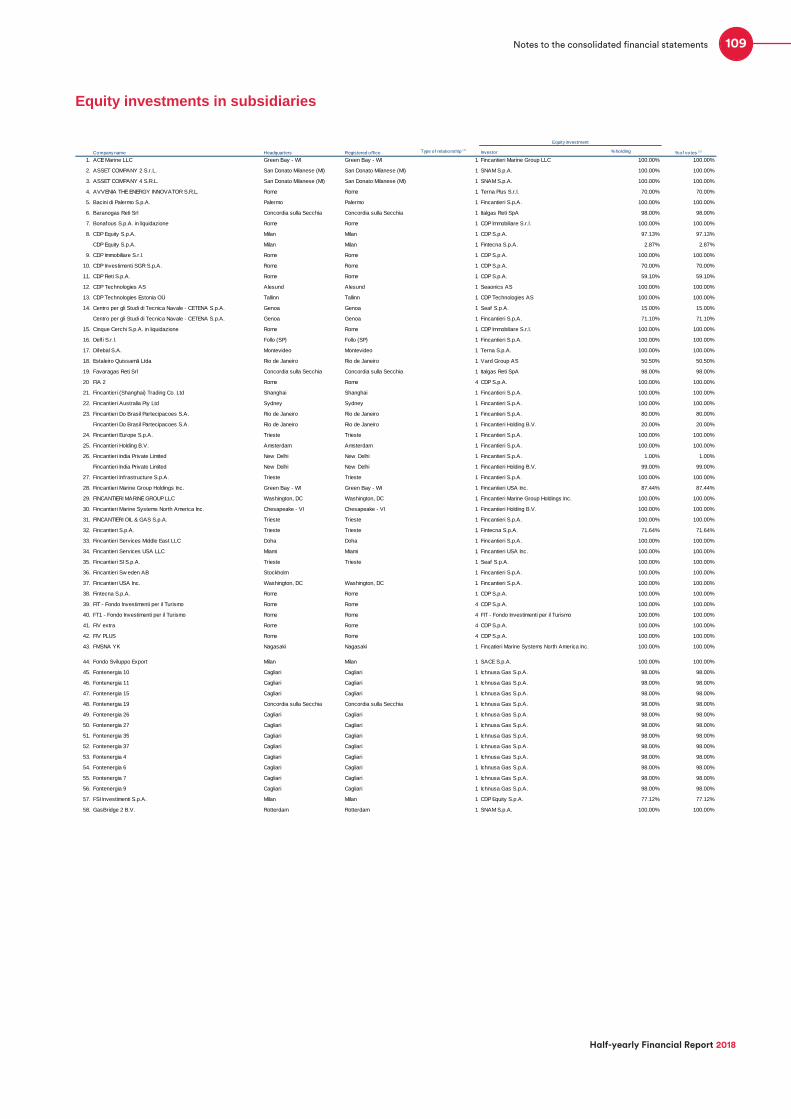
Equity investments in subsidiaries
Type of relationship (1)
Investor % holding
1. ACE Marine LLC Green Bay - WI Green Bay - WI 1 Fincantieri Marine Group LLC 100.00% 100.00%
2. ASSET COMPANY 2 S.r.L. San Donato Milanese (MI) San Donato Milanese (MI) 1 SNAM S.p.A. 100.00% 100.00%
3. ASSET COMPANY 4 S.R.L. San Donato Milanese (MI) San Donato Milanese (MI) 1 SNAM S.p.A. 100.00% 100.00%
4. AVVENIA THE ENERGY INNOVATOR S.R.L. Rome Rome 1 Terna Plus S.r.l. 70.00% 70.00%
5. Bacini di Palermo S.p.A. Palermo Palermo 1 Fincantieri S.p.A. 100.00% 100.00%
6. Baranogas Reti Srl Concordia sulla Secchia Concordia sulla Secchia 1 Italgas Reti SpA 98.00% 98.00%
7. Bonafous S.p.A. in liquidazione Rome Rome 1 CDP Immobiliare S.r.l. 100.00% 100.00%
8. CDP Equity S.p.A. Milan Milan 1 CDP S.p.A. 97.13% 97.13%
CDP Equity S.p.A. Milan Milan 1 Fintecna S.p.A. 2.87% 2.87%
9. CDP Immobiliare S.r.l. Rome Rome 1 CDP S.p.A. 100.00% 100.00%
10. CDP Investimenti SGR S.p.A. Rome Rome 1 CDP S.p.A. 70.00% 70.00%
11. CDP Reti S.p.A. Rome Rome 1 CDP S.p.A. 59.10% 59.10%
12. CDP Technologies AS Alesund Alesund 1 Seaonics AS 100.00% 100.00%
13. CDP Technologies Estonia OÜ Tallinn Tallinn 1 CDP Technologies AS 100.00% 100.00%
14. Centro per gli Studi di Tecnica Navale - CETENA S.p.A. Genoa Genoa 1 Seaf S.p.A. 15.00% 15.00%
Centro per gli Studi di Tecnica Navale - CETENA S.p.A. Genoa Genoa 1 Fincantieri S.p.A. 71.10% 71.10%
15. Cinque Cerchi S.p.A. in liquidazione Rome Rome 1 CDP Immobiliare S.r.l. 100.00% 100.00%
16. Delf i S.r.l. Follo (SP) Follo (SP) 1 Fincantieri S.p.A. 100.00% 100.00%
17. Difebal S.A. Montevideo Montevideo 1 Terna S.p.A. 100.00% 100.00%
18. Estaleiro Quissamã Ltda Rio de Janeiro Rio de Janeiro 1 Vard Group AS 50.50% 50.50%
19. Favaragas Reti Srl Concordia sulla Secchia Concordia sulla Secchia 1 Italgas Reti SpA 98.00% 98.00%
20 FIA 2 Rome Rome 4 CDP S.p.A. 100.00% 100.00%
21. Fincantieri (Shanghai) Trading Co. Ltd Shanghai Shanghai 1 Fincantieri S.p.A. 100.00% 100.00%
22. Fincantieri Australia Pty Ltd Sydney Sydney 1 Fincantieri S.p.A. 100.00% 100.00%
23. Fincantieri Do Brasil Partecipacoes S.A. Rio de Janeiro Rio de Janeiro 1 Fincantieri S.p.A. 80.00% 80.00%
Fincantieri Do Brasil Partecipacoes S.A. Rio de Janeiro Rio de Janeiro 1 Fincantieri Holding B.V. 20.00% 20.00%
24. Fincantieri Europe S.p.A. Trieste Trieste 1 Fincantieri S.p.A. 100.00% 100.00%
25. Fincantieri Holding B.V. Amsterdam Amsterdam 1 Fincantieri S.p.A. 100.00% 100.00%
26. Fincantieri India Private Limited New Delhi New Delhi 1 Fincantieri S.p.A. 1.00% 1.00%
Fincantieri India Private Limited New Delhi New Delhi 1 Fincantieri Holding B.V. 99.00% 99.00%
27. Fincantieri Infrastructure S.p.A. Trieste Trieste 1 Fincantieri S.p.A. 100.00% 100.00%
28. Fincantieri Marine Group Holdings Inc. Green Bay - WI Green Bay - WI 1 Fincantieri USA Inc. 87.44% 87.44%
29. FINCANTIERI MARINE GROUP LLC Washington, DC Washington, DC 1 Fincantieri Marine Group Holdings Inc. 100.00% 100.00%
30. Fincantieri Marine Systems North America Inc. Chesapeake - VI Chesapeake - VI 1 Fincantieri Holding B.V. 100.00% 100.00%
31. FINCANTIERI OIL & GAS S.p.A. Trieste Trieste 1 Fincantieri S.p.A. 100.00% 100.00%
32. Fincantieri S.p.A. Trieste Trieste 1 Fintecna S.p.A. 71.64% 71.64%
33. Fincantieri Services Middle East LLC Doha Doha 1 Fincantieri S.p.A. 100.00% 100.00%
34. Fincantieri Services USA LLC Miami Miami 1 Fincantieri USA Inc. 100.00% 100.00%
35. Fincantieri SI S.p.A. Trieste Trieste 1 Seaf S.p.A. 100.00% 100.00%
36. Fincantieri Sw eden AB Stockholm 1 Fincantieri S.p.A. 100.00% 100.00%
37. Fincantieri USA Inc. Washington, DC Washington, DC 1 Fincantieri S.p.A. 100.00% 100.00%
38. Fintecna S.p.A. Rome Rome 1 CDP S.p.A. 100.00% 100.00%
39. FIT - Fondo Investimenti per il Turismo Rome Rome 4 CDP S.p.A. 100.00% 100.00%
40. FT1 - Fondo Investimenti per il Turismo Rome Rome 4 FIT - Fondo Investimenti per il Turismo 100.00% 100.00%
41. FIV extra Rome Rome 4 CDP S.p.A. 100.00% 100.00%
42. FIV PLUS Rome Rome 4 CDP S.p.A. 100.00% 100.00%
43. FMSNA YK Nagasaki Nagasaki 1 Fincatieri Marine Systems North America Inc. 100.00% 100.00%
44. Fondo Sviluppo Export Milan Milan 1 SACE S.p.A. 100.00% 100.00%
45. Fontenergia 10 Cagliari Cagliari 1 Ichnusa Gas S.p.A. 98.00% 98.00%
46. Fontenergia 11 Cagliari Cagliari 1 Ichnusa Gas S.p.A. 98.00% 98.00%
47. Fontenergia 15 Cagliari Cagliari 1 Ichnusa Gas S.p.A. 98.00% 98.00%
48. Fontenergia 19 Concordia sulla Secchia Concordia sulla Secchia 1 Ichnusa Gas S.p.A. 98.00% 98.00%
49. Fontenergia 26 Cagliari Cagliari 1 Ichnusa Gas S.p.A. 98.00% 98.00%
50. Fontenergia 27 Cagliari Cagliari 1 Ichnusa Gas S.p.A. 98.00% 98.00%
51. Fontenergia 35 Cagliari Cagliari 1 Ichnusa Gas S.p.A. 98.00% 98.00%
52. Fontenergia 37 Cagliari Cagliari 1 Ichnusa Gas S.p.A. 98.00% 98.00%
53. Fontenergia 4 Cagliari Cagliari 1 Ichnusa Gas S.p.A. 98.00% 98.00%
54. Fontenergia 6 Cagliari Cagliari 1 Ichnusa Gas S.p.A. 98.00% 98.00%
55. Fontenergia 7 Cagliari Cagliari 1 Ichnusa Gas S.p.A. 98.00% 98.00%
56. Fontenergia 9 Cagliari Cagliari 1 Ichnusa Gas S.p.A. 98.00% 98.00%
57. FSI Investimenti S.p.A. Milan Milan 1 CDP Equity S.p.A. 77.12% 77.12%
58. GasBridge 2 B.V. Rotterdam Rotterdam 1 SNAM S.p.A. 100.00% 100.00%
Headquarters Registered office Company name % of votes (2)
Equity investment
109
Half-yearly Financial Report 2018
Notes to the consolidated financial statements

Type of relationship (1) Investor % holding
59. Gasrule Insurance D.A.C. DUBLIN DUBLIN 1 SNAM S.p.A. 100.00% 100.00%
60. Gestione Bacini La Spezia S.p.A. La Spezia La Spezia 1 Fincantieri S.p.A. 99.89% 99.89%
61. GNL Italia SpA San Donato Milanese (MI) San Donato Milanese (MI) 1 SNAM S.p.A. 100.00% 100.00%
62. Grecanica Gas Srl Concordia sulla Secchia Melito di Porto Salvo 1 Italgas Reti SpA 98.00% 98.00%
63. Ichnusa Gas S.p.A. Bologna Bologna 1 Italgas Reti S.p.A. 100.00% 100.00%
64. Industrial Control Design AS Alesund Alesund 1 Seaonics AS 100.00% 100.00%
65. Infrastrutture Trasporto Gas S.p.A. San Donato Milanese (MI) Milan 1 ASSET COMPANY 2 S.r.L. 100.00% 100.00%
66. Ischia Reti Gas Srl Concordia sulla Secchia Concordia sulla Secchia 1 Italgas Reti SpA 98.00% 98.00%
67. Isotta Fraschini Motori S.p.A. Bari Bari 1 Fincantieri S.p.A. 100.00% 100.00%
68. Issel Nord S.r.l. Follo Follo 1 Delf i S.r.l. 100.00% 100.00%
69. Italgas Acqua S.p.A. Milan Caserta 1 Italgas S.p.A. 100.00% 100.00%
70. ITALGAS RETI S.P.A. Turin Turin 1 Italgas S.p.A. 100.00% 100.00%
71. ITALGAS S.P.A. Milan Milan 4 CDP Reti S.p.A. 26.04% 26.04%
ITALGAS S.P.A. Milan Milan 1 SNAM S.p.A. 13.50% 13.50%
72. M.I. Galley S.r.l. Pordenone Pordenone 1 MARINE INTERIORS S.p.A. 85.00% 85.00%
73. MARINE INTERIORS S.p.A. Trieste Caneva (PN) 1 Società per l'Esercizio di Attività Finanziaria - Seaf
S.p.A.
100.00% 100.00%
74. Marinette Marine Corporation Marinette - WI Marinette - WI 1 Fincantieri Marine Group LLC 100.00% 100.00%
75. Medea S.p.A. Sassari Sassari 1 Italgas Reti SpA 100.00% 100.00%
76. Monita Interconnector S.r.l. Rome Rome 1 Terna S.p.A. 95.00% 95.00%
Monita Interconnector S.r.l. Rome Rome 1 Terna Rete Italia S.p.A. 5.00% 5.00%
77. Pentagramma Romagna S.p.A. in liquidazione unipersonale Rome Rome 1 CDP Immobiliare S.r.l. 100.00% 100.00%
78. Progas Metano Srl Concordia sulla Secchia Concordia sulla Secchia 1 Italgas Reti SpA 98.00% 98.00%
79. Residenziale Immobiliare 2004 S.p.A. Rome Rome 1 CDP Immobiliare S.r.l. 74.47% 74.47%
80. Rete S.r.l. Rome Rome 1 Terna S.p.A. 100.00% 100.00%
81. Rete Verde 17 S.r.l. Rome Rome 1 Terna Plus S.r.l. 100.00% 100.00%
82. Rete Verde 18 S.r.l. Rome Rome 1 Terna Plus S.r.l. 100.00% 100.00%
83. Rete Verde 19 S.r.l. Rome Rome 1 Terna Plus S.r.l. 100.00% 100.00%
84. Rete Verde 20 S.r.l. Rome Rome 1 Terna Plus S.r.l. 100.00% 100.00%
85. SACE BT Rome Rome 1 SACE S.p.A. 100.00% 100.00%
86. Sace do Brasil San Paolo San Paolo 1 SACE S.p.A. 100.00% 100.00%
87. SACE FCT Rome Rome 1 SACE S.p.A. 100.00% 100.00%
88. SACE S.p.A. Rome Rome 1 CDP S.p.A. 100.00% 100.00%
89. SACE Servizi Rome Rome 1 SACE BT 100.00% 100.00%
90. Seaonics AS Alesund Alesund 1 Vard Group AS 56.40% 56.40%
91. Seaonics Polska SP.Z O.O. Gdansk Gdansk 1 Seaonics AS 37.50% 37.50%
Seaonics Polska SP.Z O.O. Gdansk Gdansk 1 Industrial Control Design AS 62.50% 62.50%
92. Seaside S.r.l. Bologna Bologna 1 Italgas S.p.A. 100.00% 100.00%
93. Seastema S.p.A Genoa Genoa 1 Fincantieri S.p.A. 100.00% 100.00%
94. SIA ICD Industries Latvia Riga Riga 1 Industrial Control Design AS 100.00% 100.00%
95. Siculianagas Reti Srl Concordia sulla Secchia Concordia sulla Secchia 1 Italgas Reti SpA 98.00% 98.00%
96. Simest SpA Rome Rome 1 SACE S.p.A. 76.01% 76.01%
97. Snam 4 Mobility S.p.A. San Donato Milanese (MI) San Donato Milanese (MI) 1 SNAM S.p.A. 100.00% 100.00%
98. SNAM RETE GAS S.p.A. San Donato Milanese (MI) San Donato Milanese (MI) 1 SNAM S.p.A. 100.00% 100.00%
99. SNAM S.p.A. San Donato Milanese (MI) San Donato Milanese (MI) 4 CDP Reti S.p.A. 30.37% 30.37%
100. Società per l'Esercizio di Attività Finanziaria - Seaf S.p.A. Trieste Trieste 1 Fincantieri S.p.A. 100.00% 100.00%
101. SPE Santa Lucia Transmissora de Energia S.A. San Paulo San Paulo 1 Terna Plus S.r.l. 99.99% 99.99%
SPE Santa Lucia Transmissora de Energia S.A. San Paulo San Paulo 1 Terna Chile S.p.A. 0.01% 0.01%
102. SPE Santa Maria Transmissora de Energia S.A. San Paulo San Paulo 1 Terna Chile S.p.A. 0.01% 0.01%
SPE Santa Maria Transmissora de Energia S.A. San Paulo San Paulo 1 Terna Plus S.r.l. 99.99% 99.99%
103. Stogit S.p.A. San Donato Milanese (MI) San Donato Milanese (MI) 1 SNAM S.p.A. 100.00% 100.00%
104. Tamini Transformers USA L.L.C. Chicago Chicago 1 Tamini Trasformatori S.r.l. 100.00% 100.00%
105. Tamini Trasformatori S.r.l. Melegnano (MI) Melegnano (MI) 1 Terna Plus S.r.l. 70.00% 70.00%
106. Tep Energy Solution S.r.l. Rome Rome 1 ASSET COMPANY 4 S.R.L. 82.00% 82.00%
107. Terna Chile S.p.A. Santiago del Cile Santiago del Cile 1 Terna Plus S.r.l. 100.00% 100.00%
108. TERNA Crna Gora d.o.o. Podgorica Podgorica 1 Terna S.p.A. 100.00% 100.00%
109. Terna Interconnector S.r.l. Rome Rome 1 Terna S.p.A. 65.00% 65.00%
Terna Interconnector S.r.l. Rome Rome 1 TERNA RETE ITALIA S.p.A. 5.00% 5.00%
110. Terna Peru S.A.C. Lima Lima 1 Terna Chile S.p.A. 0.01% 0.01%
Terna Peru S.A.C. Lima Lima 1 Terna Plus S.r.l. 99.99% 99.99%
111. TERNA PLUS S.r.l. Rome Rome 1 Terna S.p.A. 100.00% 100.00%
112. TERNA RETE ITALIA S.p.A. Rome Rome 1 Terna S.p.A. 100.00% 100.00%
113. Terna S.p.A. Rome Rome 4 CDP Reti S.p.A. 29.85% 29.85%
Company name % of votes (2)
Equity investment
Headquarters Registered office
110 3. Half-yearly condensed consolidated financial statements at 30 June 2018
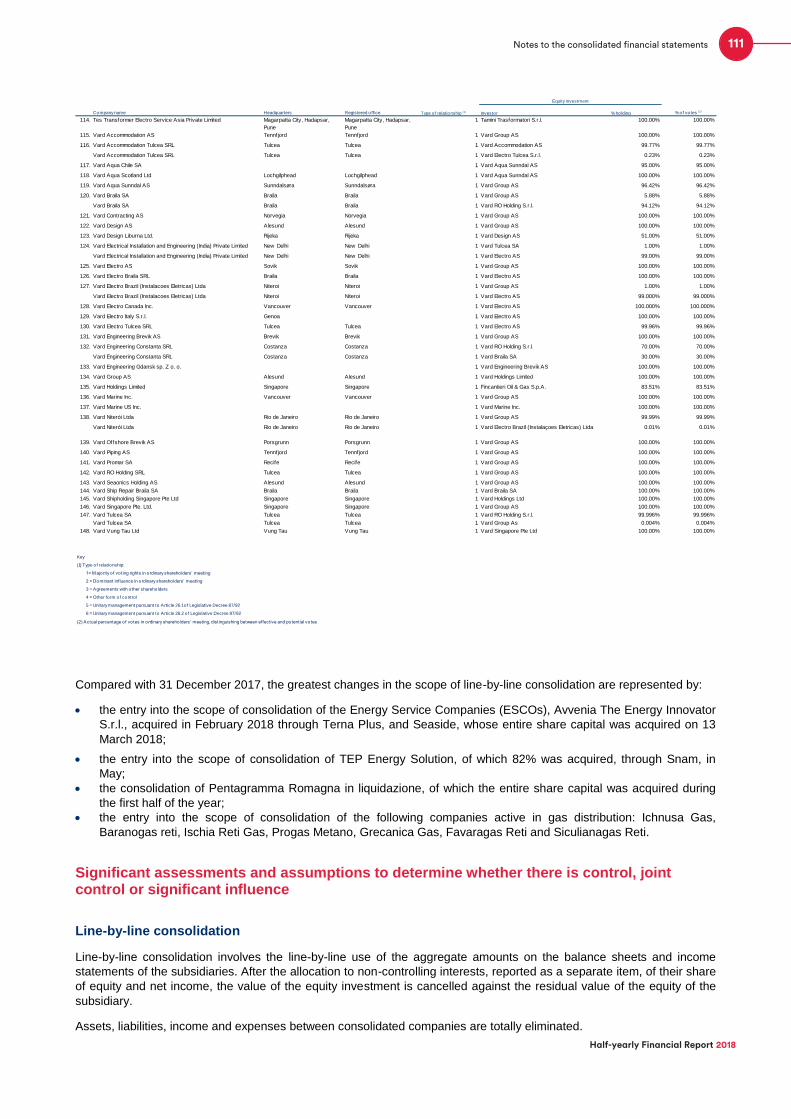
Compared with 31 December 2017, the greatest changes in the scope of line-by-line consolidation are represented by:
the entry into the scope of consolidation of the Energy Service Companies (ESCOs), Avvenia The Energy Innovator
S.r.l., acquired in February 2018 through Terna Plus, and Seaside, whose entire share capital was acquired on 13
March 2018;
the entry into the scope of consolidation of TEP Energy Solution, of which 82% was acquired, through Snam, in
May;
the consolidation of Pentagramma Romagna in liquidazione, of which the entire share capital was acquired during
the first half of the year;
the entry into the scope of consolidation of the following companies active in gas distribution: Ichnusa Gas,
Baranogas reti, Ischia Reti Gas, Progas Metano, Grecanica Gas, Favaragas Reti and Siculianagas Reti.
Significant assessments and assumptions to determine whether there is control, joint control or significant influence
Line-by-line consolidation
Line-by-line consolidation involves the line-by-line use of the aggregate amounts on the balance sheets and income
statements of the subsidiaries. After the allocation to non-controlling interests, reported as a separate item, of their share
of equity and net income, the value of the equity investment is cancelled against the residual value of the equity of the
subsidiary.
Assets, liabilities, income and expenses between consolidated companies are totally eliminated.
Type of relationship (1) Investor % holding
114. Tes Transformer Electro Service Asia Private Limited Magarpatta City, Hadapsar,
Pune
Magarpatta City, Hadapsar,
Pune
1 Tamini Trasformatori S.r.l. 100.00% 100.00%
115. Vard Accommodation AS Tennfjord Tennfjord 1 Vard Group AS 100.00% 100.00%
116. Vard Accommodation Tulcea SRL Tulcea Tulcea 1 Vard Accommodation AS 99.77% 99.77%
Vard Accommodation Tulcea SRL Tulcea Tulcea 1 Vard Electro Tulcea S.r.l. 0.23% 0.23%
117. Vard Aqua Chile SA 1 Vard Aqua Sunndal AS 95.00% 95.00%
118. Vard Aqua Scotland Ltd Lochgilphead Lochgilphead 1 Vard Aqua Sunndal AS 100.00% 100.00%
119. Vard Aqua Sunndal AS Sunndalsøra Sunndalsøra 1 Vard Group AS 96.42% 96.42%
120. Vard Braila SA Braila Braila 1 Vard Group AS 5.88% 5.88%
Vard Braila SA Braila Braila 1 Vard RO Holding S.r.l. 94.12% 94.12%
121. Vard Contracting AS Norvegia Norvegia 1 Vard Group AS 100.00% 100.00%
122. Vard Design AS Alesund Alesund 1 Vard Group AS 100.00% 100.00%
123. Vard Design Liburna Ltd. Rijeka Rijeka 1 Vard Design AS 51.00% 51.00%
124. Vard Electrical Installation and Engineering (India) Private Limited New Delhi New Delhi 1 Vard Tulcea SA 1.00% 1.00%
Vard Electrical Installation and Engineering (India) Private Limited New Delhi New Delhi 1 Vard Electro AS 99.00% 99.00%
125. Vard Electro AS Sovik Sovik 1 Vard Group AS 100.00% 100.00%
126. Vard Electro Braila SRL Braila Braila 1 Vard Electro AS 100.00% 100.00%
127. Vard Electro Brazil (Instalacoes Eletricas) Ltda Niteroi Niteroi 1 Vard Group AS 1.00% 1.00%
Vard Electro Brazil (Instalacoes Eletricas) Ltda Niteroi Niteroi 1 Vard Electro AS 99.000% 99.000%
128. Vard Electro Canada Inc. Vancouver Vancouver 1 Vard Electro AS 100.000% 100.000%
129. Vard Electro Italy S.r.l. Genoa 1 Vard Electro AS 100.00% 100.00%
130. Vard Electro Tulcea SRL Tulcea Tulcea 1 Vard Electro AS 99.96% 99.96%
131. Vard Engineering Brevik AS Brevik Brevik 1 Vard Group AS 100.00% 100.00%
132. Vard Engineering Constanta SRL Costanza Costanza 1 Vard RO Holding S.r.l. 70.00% 70.00%
Vard Engineering Constanta SRL Costanza Costanza 1 Vard Braila SA 30.00% 30.00%
133. Vard Engineering Gdansk sp. Z o. o. 1 Vard Engineering Brevik AS 100.00% 100.00%
134. Vard Group AS Alesund Alesund 1 Vard Holdings Limited 100.00% 100.00%
135. Vard Holdings Limited Singapore Singapore 1 Fincantieri Oil & Gas S.p.A. 83.51% 83.51%
136. Vard Marine Inc. Vancouver Vancouver 1 Vard Group AS 100.00% 100.00%
137. Vard Marine US Inc. 1 Vard Marine Inc. 100.00% 100.00%
138. Vard Niterói Ltda Rio de Janeiro Rio de Janeiro 1 Vard Group AS 99.99% 99.99%
Vard Niterói Ltda Rio de Janeiro Rio de Janeiro 1 Vard Electro Brazil (Instalaçoes Eletricas) Ltda 0.01% 0.01%
139. Vard Offshore Brevik AS Porsgrunn Porsgrunn 1 Vard Group AS 100.00% 100.00%
140. Vard Piping AS Tennfjord Tennfjord 1 Vard Group AS 100.00% 100.00%
141. Vard Promar SA Recife Recife 1 Vard Group AS 100.00% 100.00%
142. Vard RO Holding SRL Tulcea Tulcea 1 Vard Group AS 100.00% 100.00%
143. Vard Seaonics Holding AS Alesund Alesund 1 Vard Group AS 100.00% 100.00%
144. Vard Ship Repair Braila SA Braila Braila 1 Vard Braila SA 100.00% 100.00%
145. Vard Shipholding Singapore Pte Ltd Singapore Singapore 1 Vard Holdings Ltd 100.00% 100.00%
146. Vard Singapore Pte. Ltd. Singapore Singapore 1 Vard Group AS 100.00% 100.00%
147. Vard Tulcea SA Tulcea Tulcea 1 Vard RO Holding S.r.l. 99.996% 99.996%
Vard Tulcea SA Tulcea Tulcea 1 Vard Group As 0.004% 0.004%
148. Vard Vung Tau Ltd Vung Tau Vung Tau 1 Vard Singapore Pte Ltd 100.00% 100.00%
(2) Actual percentage of votes in ordinary shareholders’ meeting, distinguishing between effective and potential votes
5 = Unitary management pursuant to Article 26.1 of Legislative Decree 87/92
6 = Unitary management pursuant to Article 26.2 of Legislative Decree 87/92
(1) Type of relationship:
1 = M ajority o f voting rights in ordinary shareholders’ meeting
2 = Dominant influence in ordinary shareholders’ meeting
3 = Agreements with other shareholders
Key
4 = Other form of contro l
Company name % of votes (2)Headquarters Registered office
Equity investment
111
Half-yearly Financial Report 2018
Notes to the consolidated financial statements
Acquisitions of companies are accounted for using the “acquisition method” provided for under IFRS 3, as modified by
Regulation 495/2009, under which the identifiable assets acquired and the identifiable liabilities assumed (including
contingent liabilities) are recognised at their respective fair values at the acquisition date.
For the newly acquired companies, the difference between the purchase price and equity is provisionally allocated to
goodwill if positive or to liabilities under item 100 “Other liabilities” if negative, net of any goodwill in the balance sheets of
the investees. In accordance with IFRS 3.45 et seq., the difference resulting from the transaction is allocated within
twelve months of the acquisition date. If positive, the difference is recognised – after any allocation to the assets and
liabilities of the subsidiary – as goodwill or other intangible assets under intangible assets. If negative, it is recognised
through profit or loss.
The acquisition method is applied as from the moment in which control of the investee is effectively acquired.
Accounting for companies using the equity method
Associates and joint operations are accounted for using the equity method.
The equity method involves initial recognition of the equity investment at cost, which is subsequently adjusted on the
basis of the share held in the equity of the investee.
The difference between the value of the equity investment and the share held of the equity of the investee is included in
the carrying amount of the investee.
The share of profit or loss of the investee is recognised in a specific item of the consolidated income statement.
If there is evidence of impairment, the recoverable amount of the equity investment is estimated, considering the present
value of the future cash flows which may be generated by the investment, including the final disposal value. If the
recoverable value is lower than the carrying amount resulting from the application of the equity method, the difference is
recognised through profit or loss.
The consolidation of joint operations and investments in associates was based on the most recent half-yearly financial
statements of the companies.
Subsidiaries
Subsidiaries are entities, including structured entities, which are directly or indirectly controlled by the Group. Control
over an entity is shown by the Group’s capacity to exercise power in order to influence variable returns to which the
Group is exposed as a result of its relationship with the aforementioned entity.
In order to verify the existence of control, the Group considers the following factors:
the purpose and structure of the investee, in order to identify the entity’s objectives, the activities that generate its
revenues and how such activities are governed;
power, in order to understand whether the Group has contractual rights enabling it to govern relevant activities; to this
end, only substantial rights that confer effective governance are considered;
the exposure to the investee, in order to assess whether the Group has business relationships with the investee
whose returns vary as a result of changes in the investee’s performance;
the existence of potential principal-agent relationships.
Where significant activities are governed through voting rights, the following factors show evidence of control:
direct or indirect ownership – through a subsidiary – of over fifty per cent of voting rights of an entity, unless it can be
demonstrated – in exceptional cases – that such ownership does not constitute control;
ownership of fifty per cent or less of the votes that can be exercised in the Shareholders’ Meeting and unilateral ability
to govern the main activities through:
- control of over half of voting rights by virtue of an agreement with other investors;
- power to determine the financial and operational policies of the entity by virtue of a clause of the Articles of
Association or an agreement;
- power to appoint or remove the majority of the members of the Board of Directors or the equivalent governing
body, where management of the business falls under the remit of the aforementioned Board of Directors or body;
- power to exercise the majority of voting rights in the meetings of the Board of Directors or those of the equivalent
governing body, where management of the business falls under the remit of the aforementioned Board of Directors
or body. Presence of the aforementioned factors was verified for equity investments in Snam, Terna and Italgas,
over which, therefore, de facto control was ascertained.
The presence and the effect of potential voting rights, where substantial, are taken into account when assessing whether
the power of governing another entity’s financial and operational policies exists.
112 3. Half-yearly condensed consolidated financial statements at 30 June 2018

Subsidiaries may include any “structured entities” in which voting rights are not significant with respect to control
assessment, including special purpose entities and investment funds.
Structured entities are considered as subsidiaries where:
the Group has power through contractual rights that enable governance of relevant activities;
the Group is exposed to variable returns resulting from the aforementioned activities.
The carrying value of equity stakes in entities consolidated on a line-by-line basis held by the Parent Company or other
Group companies is offset – against the assets and the liabilities of the investees – as a counterparty of the relevant
equity share pertaining to the Group.
Assets and liabilities, off-balance sheet transactions, income and expenses, as well profits and losses between entities
included into the scope of consolidation are fully eliminated, in line with the consolidation method adopted.
A subsidiary’s revenues and costs are consolidated starting from the date on which control is acquired. Revenues and
costs of a divested subsidiary sold are included into the consolidated income statement up to the divestment date, i.e.
until the Group no longer controls the investee. The difference between the disposal price for the subsidiary and the
carrying value of its net assets at the same date is recorded in the income statement under item 270. “Gains (Losses) on
disposal of investments” for companies consolidated on a line-by-line basis.
Non-controlling interests are presented in the balance sheet under item 210. “Non-controlling interests”, separately from
liabilities and equity attributable to the Group. In the income statement, non-controlling interests are also presented
separately under item 330. “Net income (loss) for the period pertaining to non-controlling interests”.
For companies included into the scope of consolidation for the first time, the fair value of the cost incurred to acquire
control over the equity investment, including ancillary charges, is measured at the acquisition date.
The difference between the disposal price of an interest held in a subsidiary and the relevant carrying value of net assets
is recognised as a balancing entry in Equity, when the disposal does not entail a loss of control.
Joint arrangements
A joint arrangement is a contractual agreement in which two or more counterparties have joint control. Joint control is the
contractually agreed sharing of control of an arrangement, which exists only when decisions about the relevant activities
require the unanimous consent of the parties sharing control.
According to IFRS 11, joint arrangements must be classified as joint operation or joint venture depending on the Group’s
contractual rights and obligations.
A joint operation is a joint arrangement in which the parties have rights on the assets and obligations on the liabilities of
the arrangement.
A joint venture is a joint arrangement in which the parties have rights on the net assets of the agreement.
Equity investments in jointly controlled companies are valued at equity.
Associate companies
An associate is a company over which the owner exercises a significant influence and which is neither a subsidiary nor a
joint venture. Significant influence is presumed when the owner:
owns, directly or indirectly, at least 20% of another company’s share capital; or
can, inter alia through shareholders’ agreements, exercise significant influence through:
- representation in the company’s management body;
- participation in the policy-making process, including in decision-making on dividends or other allocations;
- existence of significant transactions;
- exchange of managerial personnel;
- provision of key know-how.
Equity investments in associates are measured at equity.
113
Half-yearly Financial Report 2018
Notes to the consolidated financial statements

SECTION 4 - EVENTS SUBSEQUENT TO THE REPORTING DATE
No events requiring changes to the figures approved occurred between the reporting date of these half-yearly condensed
consolidated financial statements and the date of their approval by the Board of Directors.
Significant events after 30 June 2018
The significant transactions which occurred after 30 June 2018 are summarised below.
Italgas Group
On 4 July 2018, ruling no. 4104/2018 was filed through which the Council of State rejected the appeal brought by Italgas
Reti against the decision of the Veneto Regional Administrative Court no. 654/2017, confirming the free acquisition in
favour of the Municipality of Venice of the assets included in the so-called block A, as well as the Company’s obligation
to pay a fee for the use of the portion of the network subject to free transfer.
The Company is currently evaluating possible judicial remedies against the ruling by the Council of State. In relation to a
request for a fee by the Municipality of Venice equivalent to the tariff remuneration of the assets of the aforesaid block A,
and in the absence of specific reference regulations, the Company, which already pays a fee of approximately 0.5 million
euro per year for the entire concession, is not currently in a position to reliably determine the amount of the liability
according to the terms of the abovementioned ruling. However, the Company has accelerated the depreciation of the
portion of the network relating to the so-called block A by 3.0 million euro in the period.
Fincantieri Group
The following should be noted with respect to the shipbuilding operations:
on 3 July 2018, the subsidiary VARD acquired a new order for the construction of an Expedition Cruises unit (part of
the series of 2 vessels previously ordered) for the shipowner Hapag-Lloyd Cruises;
on 12 July 2018, Norwegian Cruise Une Holdings Ltd. confirmed to Fincantieri the orders for the construction of the
fifth and sixth vessels of the “Leonardo” series, a class of newly designed cruise ships for the Norwegian Cruise Line
(NCL) brand, which will be delivered in 2026 and 2027. The option was contained in the February 2017 agreement for
the construction of the first 4 vessels;
on 13 July 2018, Fincantieri received an order from TUI Cruises, a joint venture between the TUI AG and Royal
Caribbean Cruises groups, for the construction of 2 new concept gas-propelled (Liquefied Natural Gas - LNG) cruise
ships. The ships will be built in Monfalcone and delivered in 2024 and 2026;
on 20 July 2018, the United States government awarded an order to the consortium led by Lockheed Martin – of
which Fincantieri’s subsidiary, Marinette Marine Corporation, is a part – using the “Undefinitized Contract Action” as
an advance on the Foreign Military Sales contract for the construction of four Multi-Mission Surface Combatant
(MMSC) units for Saudi Arabia. The ships, which will be built in the Marinette (Wisconsin) facility, will be highly
manoeuvrable, with the flexibility resulting from the hull of the Freedom class, Littoral Combat Ships built by the same
consortium for the US Navy, with an increased range of 5,000 nautical miles and a speed of more than 30 knots,
making it capable of both coastal and offshore patrolling;
on 23 July 2018, Fincantieri signed a Memorandum of Agreement with Princess Cruises, a Carnival Corporation & Plc
brand, for the construction of 2 cruise ships, the first in the fleet to be powered primarily by LNG. The ships, each of
which will have a gross tonnage of 175,000, will be the largest built so far in Italy;
on 24 July 2018, the subsidiary VARD signed a contract for the design and construction of two expedition cruise
vessels for Viking. The vessels, which will be delivered in Norway in 2021 and 2022 respectively, will be the first to be
built by VARD for this shipping company;
on 24 July 2018, the Shareholders’ Meeting of VARD approved the delisting of the company from the Singapore Stock
Exchange.
Snam Group
The following should be noted with respect to the gas transport, storage and regasification activities carried out by Snam
group companies:
on 5 July 2018, Snam, through its subsidiary Snam4Mobility, acquired 70% of IES Biogas, one of Italy’s leading
companies in the design, construction and management of biogas and biomethane plants with a market share of more
than 10%, for a price of approximately 4 million euro. With a turnover of more than 20 million euro in 2017, IES Biogas
has so far built more than 200 plants throughout the country. In recent years, the company has also developed
projects outside Italy.
Snam4Mobility is the company through which Snam is developing the supply infrastructure for compressed natural
gas (CNG) and liquefied natural gas (LNG) engines. The growing market interest in sustainable natural gas mobility
and biomethane demonstrates the great potential of the alternative uses of gas.
114 3. Half-yearly condensed consolidated financial statements at 30 June 2018

Biomethane is a source of renewable energy derived from the purification of biogas obtained from the processing of
products and by-products of the agricultural and agro-industrial chain and from the organic part of municipal waste.
Biomethane can be introduced into the natural gas transport infrastructure.
This acquisition represents a first step for Snam in renewable energy, supporting its role in the energy transition;
on 25 July 2018, the business unit operating in the sector of design, development and production of technological
solutions for natural gas filling stations for transport of M.T.M., a company of the Westport Fuel Systems group, was
acquired through the newly established company Cubogas S.r.l., wholly-owned by Snam4Mobility, following the
satisfaction of certain conditions precedent including the conduct of trade union procedures.
The value of the transaction was 12.5 million euro, including the price adjustment made at the time of the closing.
The acquisition, which includes the Cubogas brand, will enable Snam to fully internalise and consolidate the value
created along the supply chain, positioning itself as a leader in the creation of “turnkey” solutions for sustainable
natural gas mobility. Snam will work to further develop Cubogas’s areas of strength such as brand value, customer
orientation and level of service. The use of compressed natural gas (CNG) in the transport sector is one of the best
available technologies for reducing pollutant emissions, benefiting air quality in cities.
SECTION 5 - OTHER ISSUES
New IFRS endorsed and in force since 2018
Details are provided below of the European Commission Regulations that have endorsed the new international financial
reporting standards, or amendments to standards already in force, whose application became mandatory from 1 January
2018:
European Commission Regulation (EU) no. 2018/519 of 28 March 2018, published in the Official Journal L 87 of 3
April 2018, adopting Interpretation IFRIC 22 Foreign Currency Transactions and Advance Consideration. The
Interpretation clarifies the accounting for transactions that include the receipt or payment of advance consideration in
a foreign currency
European Commission Regulation (EU) no. 2018/498 of 22 March 2018, published in the Official Journal L 82 of 26
March 2018, adopting the Amendments to IFRS 9 “Financial Instruments - Prepayment Features with Negative
Compensation”. The amendments are intended to clarify the classification of particular prepayable financial assets
when applying IFRS 921.
Commission Regulation (EU) 2018/400 of 14 March 2018, published in the Official Journal L 72 of 15 March 2018,
adopting Amendments to IAS 40 Investment Property – Transfers of investment property. The amendments clarify
when a company is allowed to reclassify a property to (or from) the “investment property” category.
Commission Regulation (EU) 2018/289 of 26 February 2018, published in the Official Journal L 55 of 27 February
2018, adopting Amendments to IFRS 2 Share-based Payments, aimed at clarifying how companies should apply the
standard in some specific instances.
Commission Regulation (EU) 2018/182 of 7 February 2018, published in the Official Journal L 34 of 8 February
2018, adopting Annual Improvements to International Financial Reporting Standards 2014-2016 Cycle that lead to
changes to IAS 28 – Investments in associates and joint ventures, IFRS 1 - First-time Adoption of International
Financial Reporting Standards and IFRS 12 – Disclosure of Interests in Other Entities (the latter should already be
applied for 2017). The objective of the annual improvements is to address non-urgent, but necessary, issues
discussed by the IASB during the project cycle on areas of inconsistency in International Financial Reporting
Standards or where clarification of wording is required.
Commission Regulation (EU) no. 2017/1988 of 3 November 2017, published in the Official Journal L 291 of 9
November 2017, adopting the Amendments to IFRS 4, Applying IFRS 9 Financial Instruments with IFRS 4 Insurance
Contracts. The amendments to IFRS 4 aim to address the temporary accounting consequences of the different
effective dates of IFRS 9 and the new standard for insurance contracts replacing IFRS 4 (IFRS 17).
Commission Regulation (EU) no. 2017/1987 of 31 October 2017, published in the Official Journal L 291 of 9
November 2017, adopting the Clarifications to IFRS 15 – Revenue from contracts with customers. The amendments
aim to clarify some requirements and provide additional transitional relief for companies that are implementing the
Standard.
Commission Regulation (EU) no. 2016/2067 of 22 November 2016, published in the Official Journal L 323 of 29
November 2016, adopting IFRS 9 – Financial Instruments, aimed at improving the financial reporting of financial
21 The Regulation establishes that the amendments it contains shall apply from the start of the first financial year that begins on or after 1 January 2019. The text, however, indicates that the Commission considers the following: “Since Commission Regulation (EU) 2016/2067 has become applicable for financial periods starting at the latest on or after 1 January 2018, companies should be able to use International Financial Reporting Standard (IFRS) 9 Financial Instruments as amended in the Annex to this Regulation as from the date of application of Regulation (EU) 2016/2067. Therefore, companies should be able to apply the provisions of this Regulation for financial periods starting on or after 1 January 2018.”
115
Half-yearly Financial Report 2018
Notes to the consolidated financial statements

instruments by addressing concerns that arose in this area during the financial crisis. In particular, IFRS 9 responds
to the G20's call to move to a more forward-looking model for the recognition of expected losses on financial assets.
Commission Regulation (EU) no. 2016/1905 of 22 September 2016, published in the Official Journal L. 295 of 29
October 2016, adopting IFRS 15 –Revenue from contracts with customers, which aims to improve the financial
reporting of revenue and to improve comparability of the top line in financial statements globally.
New accounting standards and interpretations issued and endorsed by the European Union, but not yet in force (date of entry into effect for financial years beginning from 1 January 2019)
Listed below are the new standards and interpretations already issued and endorsed, but not yet in force and therefore
not applicable to the preparation of the financial statements at 30 June 2018 (unless, where permitted, it is chosen to
adopt them in advance):
Commission Regulation (EU) 2017/1986 of 31 October 2017, published in the Official Journal L 291 of 9 November
2017, adopting IFRS 16 – Leasing, which aims to improve financial reporting on lease contracts.
Companies shall apply IFRS 16, at the latest, as from the commencement date of their first financial year starting on or
after 1 January 2019.
The CDP Group will not adopt IFRS 16 in advance, for the preparation of its half-yearly condensed consolidated financial
statements.
IFRS 16: Leases
On 13 January 2016, the IASB published IFRS 16 (Leases), which is intended to replace the current accounting standard
IAS 17, and the interpretations IFRIC 4 (Determining whether an Arrangement contains a Lease), SIC 15 (Operating
Leases – Incentives), and SIC 27 (Evaluating the Substance of Transactions Involving the Legal Form of a Lease). The
new standard gives a new definition of lease and introduces a principle based on control (“right of use”) of an asset, to
distinguish finance leases from service agreements, by identifying the following as discriminating elements: identification
of the asset, the right to substitute the asset, the right to obtain substantially all economic benefits resulting from use of
the asset and the right to direct the use of the asset underlying the agreement. The aim is to ensure greater
comparability between financial statements due to the different accounting principles applied to operating leases and
finance leases. The standard establishes a single model for recognition and measurement of leases by the lessee, which
entails recognition of the leased asset, including those held under an operating lease, on the assets side of the balance
sheet, with a balancing entry for the financial liability, while also offering the possibility of not recognising as finance
leases those agreements whose objects are “low-value assets” and leases whose term is 12 months or less. In contrast,
the new standard does not envisage significant changes for the lessors.
Accounting standards, amendments and interpretations that have not yet been endorsed by the European Union at the reporting date of 30 June 2018.
Certain accounting standards, interpretations and amendments had been issued by the IASB but not yet endorsed by the
European Union as at the date of preparation of this annex:
IFRS 17 Insurance Contracts (issued on 18 May 2017)
IFRIC 23 Uncertainty over Income Tax Treatments (issued on 7 June 2017)
Amendments to IAS 28: Long-term Interests in Associates and Joint Ventures (issued on 12 October 2017)
Annual Improvements to IFRS Standards 2015-2017 Cycle (issued on 12 December 2017)
Amendments to IAS 19: Plan Amendment, Curtailment or Settlement (issued on 7 February 2018)
Amendments to References to the Conceptual Framework in IFRS Standards (issued on 29 March 2018).
Other information
The half-yearly condensed consolidated financial statements of the CDP Group are subject to approval by the Board of
Directors of CDP and shall be published in accordance with the timing and methods provided for in the applicable
provisions of law in force.
116 3. Half-yearly condensed consolidated financial statements at 30 June 2018
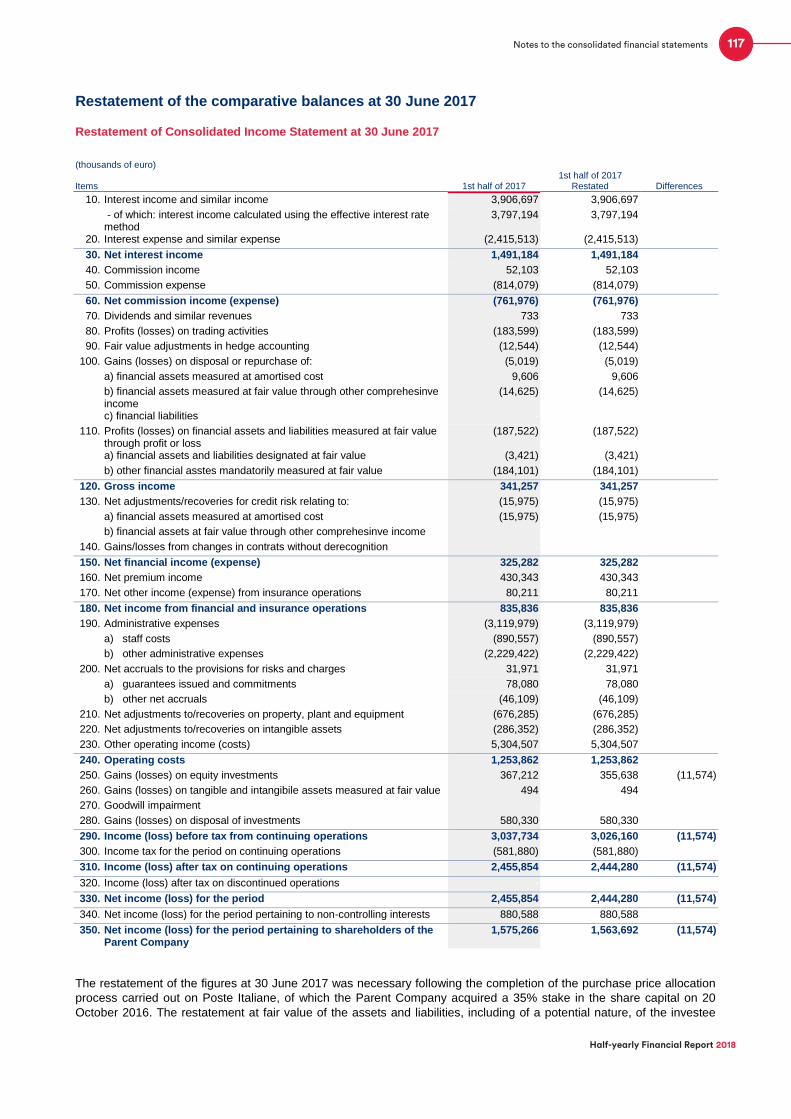
Restatement of the comparative balances at 30 June 2017
Restatement of Consolidated Income Statement at 30 June 2017
(thousands of euro)
Items 1st half of 2017 1st half of 2017
Restated Differences
10. Interest income and similar income 3,906,697 3,906,697
- of which: interest income calculated using the effective interest ratemethod
3,797,194 3,797,194
20. Interest expense and similar expense (2,415,513) (2,415,513)
30. Net interest income 1,491,184 1,491,184
40. Commission income 52,103 52,103
50. Commission expense (814,079) (814,079)
60. Net commission income (expense) (761,976) (761,976)
70. Dividends and similar revenues 733 733
80. Profits (losses) on trading activities (183,599) (183,599)
90. Fair value adjustments in hedge accounting (12,544) (12,544)
100. Gains (losses) on disposal or repurchase of: (5,019) (5,019)
a) financial assets measured at amortised cost 9,606 9,606
b) financial assets measured at fair value through other comprehesinveincome
(14,625) (14,625)
c) financial liabilities - -
110. Profits (losses) on financial assets and liabilities measured at fair value through profit or loss
(187,522) (187,522)
a) financial assets and liabilities designated at fair value (3,421) (3,421)
b) other financial asstes mandatorily measured at fair value (184,101) (184,101)
120. Gross income 341,257 341,257
130. Net adjustments/recoveries for credit risk relating to: (15,975) (15,975)
a) financial assets measured at amortised cost (15,975) (15,975)
b) financial assets at fair value through other comprehesinve income -
140. Gains/losses from changes in contrats without derecognition - -
150. Net financial income (expense) 325,282 325,282
160. Net premium income 430,343 430,343
170. Net other income (expense) from insurance operations 80,211 80,211
180. Net income from financial and insurance operations 835,836 835,836
190. Administrative expenses (3,119,979) (3,119,979)
a) staff costs (890,557) (890,557)
b) other administrative expenses (2,229,422) (2,229,422)
200. Net accruals to the provisions for risks and charges 31,971 31,971
a) guarantees issued and commitments 78,080 78,080
b) other net accruals (46,109) (46,109)
210. Net adjustments to/recoveries on property, plant and equipment (676,285) (676,285)
220. Net adjustments to/recoveries on intangible assets (286,352) (286,352)
230. Other operating income (costs) 5,304,507 5,304,507
240. Operating costs 1,253,862 1,253,862
250. Gains (losses) on equity investments 367,212 355,638 (11,574)
260. Gains (losses) on tangible and intangibile assets measured at fair value 494 494
270. Goodwill impairment - -
280. Gains (losses) on disposal of investments 580,330 580,330
290. Income (loss) before tax from continuing operations 3,037,734 3,026,160 (11,574)
300. Income tax for the period on continuing operations (581,880) (581,880)
310. Income (loss) after tax on continuing operations 2,455,854 2,444,280 (11,574)
320. Income (loss) after tax on discontinued operations - -
330. Net income (loss) for the period 2,455,854 2,444,280 (11,574)
340. Net income (loss) for the period pertaining to non-controlling interests 880,588 880,588
350. Net income (loss) for the period pertaining to shareholders of the Parent Company
1,575,266 1,563,692 (11,574)
The restatement of the figures at 30 June 2017 was necessary following the completion of the purchase price allocation
process carried out on Poste Italiane, of which the Parent Company acquired a 35% stake in the share capital on 20
October 2016. The restatement at fair value of the assets and liabilities, including of a potential nature, of the investee
117
Half-yearly Financial Report 2018
Notes to the consolidated financial statements
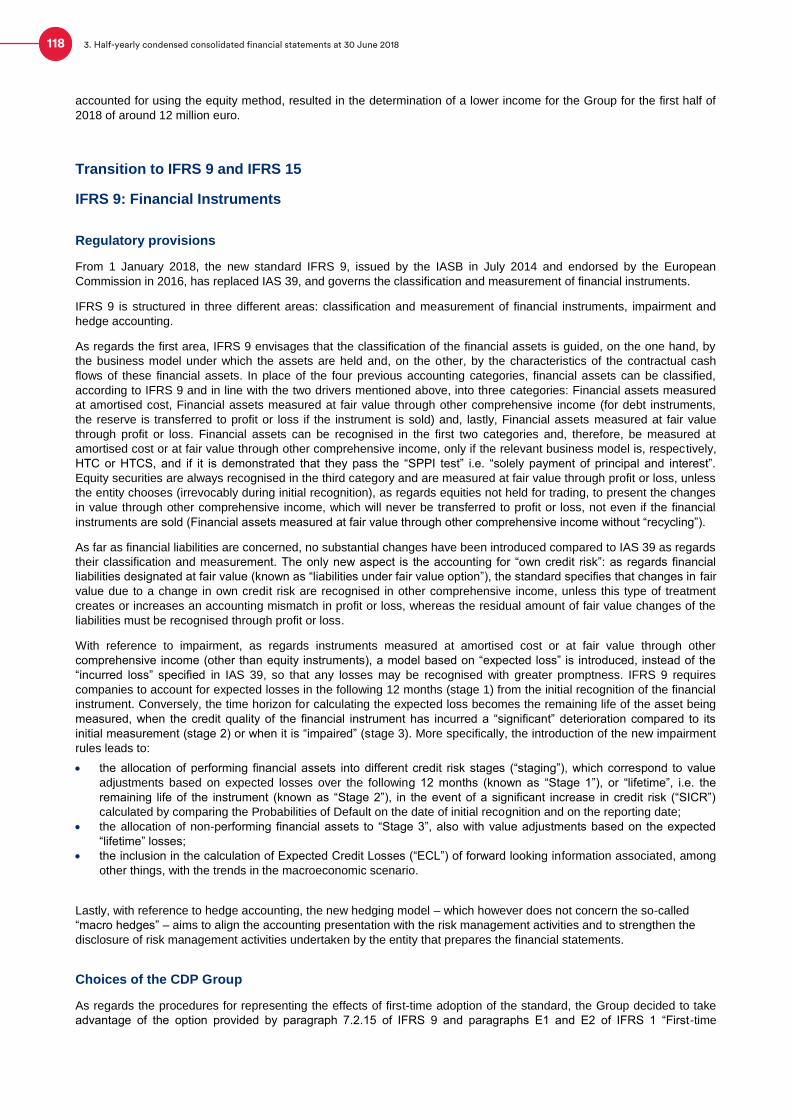
accounted for using the equity method, resulted in the determination of a lower income for the Group for the first half of
2018 of around 12 million euro.
Transition to IFRS 9 and IFRS 15
IFRS 9: Financial Instruments
Regulatory provisions
From 1 January 2018, the new standard IFRS 9, issued by the IASB in July 2014 and endorsed by the European
Commission in 2016, has replaced IAS 39, and governs the classification and measurement of financial instruments.
IFRS 9 is structured in three different areas: classification and measurement of financial instruments, impairment and
hedge accounting.
As regards the first area, IFRS 9 envisages that the classification of the financial assets is guided, on the one hand, by
the business model under which the assets are held and, on the other, by the characteristics of the contractual cash
flows of these financial assets. In place of the four previous accounting categories, financial assets can be classified,
according to IFRS 9 and in line with the two drivers mentioned above, into three categories: Financial assets measured
at amortised cost, Financial assets measured at fair value through other comprehensive income (for debt instruments,
the reserve is transferred to profit or loss if the instrument is sold) and, lastly, Financial assets measured at fair value
through profit or loss. Financial assets can be recognised in the first two categories and, therefore, be measured at
amortised cost or at fair value through other comprehensive income, only if the relevant business model is, respectively,
HTC or HTCS, and if it is demonstrated that they pass the “SPPI test” i.e. “solely payment of principal and interest”.
Equity securities are always recognised in the third category and are measured at fair value through profit or loss, unless
the entity chooses (irrevocably during initial recognition), as regards equities not held for trading, to present the changes
in value through other comprehensive income, which will never be transferred to profit or loss, not even if the financial
instruments are sold (Financial assets measured at fair value through other comprehensive income without “recycling”).
As far as financial liabilities are concerned, no substantial changes have been introduced compared to IAS 39 as regards
their classification and measurement. The only new aspect is the accounting for “own credit risk”: as regards financial
liabilities designated at fair value (known as “liabilities under fair value option”), the standard specifies that changes in fair
value due to a change in own credit risk are recognised in other comprehensive income, unless this type of treatment
creates or increases an accounting mismatch in profit or loss, whereas the residual amount of fair value changes of the
liabilities must be recognised through profit or loss.
With reference to impairment, as regards instruments measured at amortised cost or at fair value through other
comprehensive income (other than equity instruments), a model based on “expected loss” is introduced, instead of the
“incurred loss” specified in IAS 39, so that any losses may be recognised with greater promptness. IFRS 9 requires
companies to account for expected losses in the following 12 months (stage 1) from the initial recognition of the financial
instrument. Conversely, the time horizon for calculating the expected loss becomes the remaining life of the asset being
measured, when the credit quality of the financial instrument has incurred a “significant” deterioration compared to its
initial measurement (stage 2) or when it is “impaired” (stage 3). More specifically, the introduction of the new impairment
rules leads to:
the allocation of performing financial assets into different credit risk stages (“staging”), which correspond to value
adjustments based on expected losses over the following 12 months (known as “Stage 1”), or “lifetime”, i.e. the
remaining life of the instrument (known as “Stage 2”), in the event of a significant increase in credit risk (“SICR”)
calculated by comparing the Probabilities of Default on the date of initial recognition and on the reporting date;
the allocation of non-performing financial assets to “Stage 3”, also with value adjustments based on the expected
“lifetime” losses;
the inclusion in the calculation of Expected Credit Losses (“ECL”) of forward looking information associated, among
other things, with the trends in the macroeconomic scenario.
Lastly, with reference to hedge accounting, the new hedging model – which however does not concern the so-called
“macro hedges” – aims to align the accounting presentation with the risk management activities and to strengthen the
disclosure of risk management activities undertaken by the entity that prepares the financial statements.
Choices of the CDP Group
As regards the procedures for representing the effects of first-time adoption of the standard, the Group decided to take
advantage of the option provided by paragraph 7.2.15 of IFRS 9 and paragraphs E1 and E2 of IFRS 1 “First-time
118 3. Half-yearly condensed consolidated financial statements at 30 June 2018

Adoption of International Financial Reporting Standards”, which allows entities not to restate comparable figures.
According to the instructions contained in the document issuing the 5th update to Circular no. 262 of the Bank of Italy,
dated 22 December 2017, banks that take advantage of the exemption in preparing comparative figures must include a
statement of reconciliation in the first financial statements prepared in accordance with the update, highlighting the
method used and providing reconciliation between the figures in the last approved financial statements and the first
financial statements prepared in accordance with the new provisions. Therefore, the date of first-time adoption of the new
standard for the CDP Group is 1 January 2018.
The following paragraphs provide a brief analysis of the main effects on the CDP Group arising from the application of
IFRS 9, divided according to the three impact areas as defined above.
Classification and measurement
In order to implement the classification and measurement rules laid down by the new Standard and, therefore, to classify
financial assets on the basis of the business model and the contractual cash flow characteristics, an analysis was
conducted on the securities and loans portfolios (within the scope of a Group Project, as regards the Parent Company
and the companies subject to management and coordination) to identify and define the related business models, i.e. the
methods of managing financial assets with regard to the generation of cash flows.
The process of defining the business models was therefore implemented by examining the existing management
approaches (verifying whether the cash flows generated from financial assets arise from the collection of contractual
cash flows or from the sale of the assets or from both), which substantially confirmed the portfolio management strategy
conducted so far, in line with the objectives, general policies and risk policies, i.e. a management of the loan portfolio
ascribable to a “Held to collect” (HTC) business model, and a management of the securities portfolio essentially
ascribable to the “Held to collect” and “Held to collect and sell” (HTCS) business models.
As regards HTC portfolios, the thresholds under which sales may be permitted without affecting classification have been
defined and, at the same time, parameters were established for identifying sales that are consistent with this business
model as they are attributable to an increase in credit risk, a management of risk concentration or are executed close to
maturity.
More specifically, within the scope of the “Held to collect” business model, sales are permitted:
in the event of an increase in credit risk; the limits and/or the cases of admissibility have been defined in line with the
impairment method;
when they occur close to the maturity of the financial asset and the revenues from the sale are approximately the
same as the collectable value of the remaining contractual financial flows. Specifically, the materiality threshold in
terms of proximity to the maturity of the instrument has been established based on the residual duration of the loan;
when they are not frequent and not significant, given, in particular for the Parent Company, the size, nature,
experience and prospects of its portfolio.
The business models under which the financial assets are held have been approved by the Board of Directors.
The performance of the SPPI Test (“Solely Payments of Principal and Interest” Test), consisting of the analysis of the
characteristics of the cash flows for all financial assets, on the other hand, required portfolios to be structured into
uniform subcategories that would allow the systematic study of products with similar characteristics, compared to those
with special characteristics.
For the loan portfolio, this consisted of identifying the types of “Standard Products” and “Non-Standard Products” for the
purposes of IFRS 9, based on whether or not there are contractual clauses that can be attributed to a contractual
standard or uniform contractual clauses that are relevant for IFRS 9 purposes. This classification enabled the conduct of
a precise analysis, and thus of the SPPI Test, on all the loans held in CDP’s portfolio as at 31 December 2017.
All potentially critical contractual clauses for the purposes of the SPPI Test were carefully and thoroughly analysed. Only
one product of a subsidiary did not pass the test.
The method adopted to conduct the test was based on the use of a specific checklist and a related decision tree.
All the parameters and indexing rules of the loan portfolio were also fully mapped, together with the related frequency of
interest payments. This enabled the identification of positions that have a modified time value of money remuneration, for
which the significance of the modification needed to be measured (Benchmark Test).
For the securities classified in the HTC and HTCS portfolios, the SPPI Test was conducted with help from an external
provider and the result was subject to review and/or, where necessary, input from the competent areas (Risk
Management area and Administration, Accounting and Reporting area).
For the loans segment, the analyses conducted did not result in changes in classification. Whereas, for the securities
segment, a very small number of classification and measurement changes were required.
119
Half-yearly Financial Report 2018
Notes to the consolidated financial statements

In addition, it should be noted that on the basis of the analyses conducted and clarifications provided by the IFRS
Interpretation Committee, units in collective investment undertakings have been classified among the assets that are
mandatorily measured at fair value through profit or loss.
The specified classification procedures have been applied as from 1 January 2018.
Impairment
The process of implementing the new accounting provisions has led CDP to define its policies and methods of Stage
Allocation and calculation of expected losses so that they are compliant with IFRS 9 and appropriate to the specific
characteristics of the CDP Group, while taking into consideration the characteristics of the Parent Company’s portfolio,
whose main exposures are traditionally towards Public Entities and were originated with more than one decade horizon,
and which consequently has registered an extremely limited number of default events.
Stage Allocation
CDP has long since set up a series of internal processes and models for assessing creditworthiness, focused on the
typical time horizon of its assets and used in the ex-ante assessment phase, as well as in risk monitoring and risk
calculation. The results of these processes and models are ascribed to a master scale of internal ratings to which a term
structure on the probability of default is associated.
The internal rating integrates all the main available information, including information on trends, since the structure of the
system is forward-looking and relates to the duration of the exposure. Stage allocation is, therefore, mainly based on the
use of these methods that are considered appropriate for managing the CDP assets.
In particular, the classification in the various stages involves verifying a series of relative and absolute conditions.
The adoption of the new Standard does not lead to changes in the identification of non-performing assets, which are
classified within Stage 3. Conversely, as regards performing assets, it is necessary to define criteria for assigning them
to Stage 1 or Stage 2.
The first element for identifying a significant impairment in creditworthiness is a change in the internal rating attributed to
each instrument between the initial date and the measurement date. The adopted method involves defining the staging
criteria based on the number of notches that separate the two ratings: the threshold that causes the shift from Stage 1 to
Stage 2 takes account, among other things, of the age of the individual instrument and its rating on the reporting date.
The first element allows CDP’s expectations regarding changes in PD to be grasped (shifts in ratings over time), while,
with regard to the second element, the threshold takes account of the fact that the probabilities of default increase in an
uneven manner as the rating worsens (trends of the PD in line with the ratings).
The decision to use ratings as a benchmark was taken due, among other things, to the scarcity of past default events as
mentioned above, which is a characteristic of CDP’s loan portfolio and does not allow thresholds to be calibrated based
on PD.
Additional criteria specified by the Stage Allocation policy are of an absolute and not relative nature: all instruments are
classified in Stage 2 if they relate to counterparties for which the following conditions apply:
they belong to specific monitoring classes (known as “watchlists”, which highlight the need for particularly careful
monitoring, even for exposures that are performing, because of specific levels of risk);
there are overdue amounts the age and materiality of which provide evidence of a possible deterioration of
creditworthiness;
classification as forborne.
The existence of these elements ensures a gradual approach in classification, so as to reduce the likelihood of an
instrument being classified to Stage 3 without first passing through Stage 2.
In accordance with the Standard and in line with the Stage Allocation policy, when the conditions that led to a position
being attributed to Stage 2 cease to exist, it may return to Stage 1 with the consequent reduction in the associated
expected loss.
As regards debt securities, it was necessary to develop certain additional considerations because, in contrast with loans,
these types of exposures may involve acquisitions subsequent to the first purchase, performed on a case-by-case basis
in accordance with the business models identified by CDP. In particular, it is necessary to take account of the time
sequence of purchases and sales of the same security, so as to enable differentiated staging, where necessary, between
two tranches purchased at different times when the corresponding creditworthiness may have been different.
In the event of tranches of securities classified in Stage 2, which require the calculation of the expected losses over a
time horizon that corresponds to the remaining lifetime of the instrument, the time profile of the EAD would be
120 3. Half-yearly condensed consolidated financial statements at 30 June 2018

determined according to the actual redemption schedule of the individual tranches in line with their accounting
measurement.
The staging policy developed by CDP does not envisage the use of the “low credit risk exemption” (LCRE), even though
this is permitted by IFRS 9. This possibility consists of classifying all positions with "low" credit risk (substantially similar
to the "investment grade" threshold, i.e. from the "BBB-" rating upwards) in Stage 1, regardless of any changes in credit
rating since origination. The decision not to adopt this exemption takes account of the Basel Committee
recommendations, even though they are not binding for CDP, which state that banks authorised to use internal models
for credit risk should not apply this exception to their loan portfolio. The approach chosen by CDP enables exposures to
be treated in a uniform way, regardless of their technical form: in particular, one of the effects deemed undesirable would
have been the application of the LCRE to the securities portfolio, which would have led to differences in the classification
of loans and securities issued by the same issuer and originated in the same period.
Elements for the calculation of expected loss
The accounting standard specifies that after identifying the appropriate stage for each instrument, one must use, in
calculating the expected loss, all reasonable and sustainable information (that is available without excessive costs or
effort), which might influence the credit risk of a financial instrument. The available information must include:
specific attributes of the debtor, and
general economic conditions and the assessment of current and forecast conditions (forward-looking information).
As regards estimating expected loss, IFRS 9 requires the adoption of the Point – in – Time (PIT) PD instead of the
Through – the – Cycle (TTC) PD which CDP uses in measuring risks, also in consideration of the nature of long-term
investor which characterises its activity.
Therefore, CDP has developed a method for determining the PIT PD drawing on the TTC PD which are estimated using
a sample of past external data, with methods that aim to take account of possible future trends.
In order to achieve the aims of the Standard, the TTC PD are made contingent upon macroeconomic scenarios: a short-
term, forward-looking element is, therefore, added to the medium-to-long term forward-looking component already
present in the TTC PD, through the introduction of an appropriate scale factor allowing the maintenance of the current
forward-looking system, combined with a greater sensitivity towards the expected short-term trends.
Within its own credit assessment and management methods, CDP has defined certain recovery values (and
correspondingly of Loss Given Defaults - LGD) based on expert opinions, adopting a conservative approach aimed at
identifying the characteristic aspects of each position (i.e. existence of collateral or a “security package”), since it is
unable to make use of a statistical approach due to the scarcity of events in its own portfolio. In those cases where an
explicit value is not already provided for, reference was made to the instructions included in Regulation no. 2013/575/EU
(CRR).
The calculation of the expected loss over the time horizon that is consistent with the staging of each instrument is based
on the discounting of the expected cash flows according to the probability of default corresponding to the
creditworthiness at the reporting date and LGD.
Governance aspects
The methodological framework was developed by the Risk Management Area, in collaboration with the Administration,
Accounting and Reporting Area. The adoption of key choices on the implementation of the Standard was discussed
within the Internal Risk Committee and Board Risk Committee and was lastly approved by the Board of Directors.
Various organisational and process adjustments were also developed to meet the increased demands for data compared
to IAS 39.
Hedge Accounting
As regards Hedge Accounting, IFRS 9 contains provisions relating to the “General Hedge Accounting Model” aimed at
providing a greater alignment between the hedge accounting positions and the risk management strategies adopted by
the management. The new standard does not envisage the accounting model for collective hedging relationships of loan
portfolios (so-called Macro Hedging) which is still being analysed by the IASB research group.
121
Half-yearly Financial Report 2018
Notes to the consolidated financial statements

While waiting for new regulatory provisions, the CDP Group has decided to take advantage of the opt-out option in FTA:
all hedging transactions will continue to be managed in line with the past according to the (carved out) provisions in IAS
39.
IFRS 15: Revenue from Contracts with Customers
Regulatory provisions
The standard, published by the IASB on 28 May 2014, has introduced a single model for measuring all revenue deriving
from contracts with customers and replaces the previous standards/interpretations on revenue (IAS 18, IAS 11, IFRIC
13, IFRIC 15, IFRIC 18, SIC 31). According to this model, the entity has to recognize revenue according to the
consideration to which it expects to be entitled in exchange for the goods or services provided, determined according to
the following five steps:
1. identification of the contract, defined as an agreement having commercial substance between two or more equal
parties that can generate rights and obligations;
2. identification of the performance obligations contained in the contract;
3. determination of the transaction price, i.e. the consideration expected for the transfer of goods or services to the
customer;
4. allocation of the transaction price to each of the performance obligations, by reference to their standalone selling
prices;
5. recognition of the revenue allocated to the individual obligation when it is satisfied, i.e. when the customer obtains
control of the goods and services. This recognition acknowledges the fact that certain services may be provided at a
specific time or over a period of time.
Choices of the CDP Group
In line with the decisions taken with respect to IFRS 9 and in accordance with IFRS 15 Appendix C, the CDP Group has
opted to apply the new standard retrospectively, by recognising the cumulative effect of initially applying the standard as
an adjustment to the opening balance of retained earnings of the annual reporting period that includes the date of initial
application (IFRS 15 §C7). The date of first-time adoption of the new standard for the CDP Group is 1 January 2018.
Additional reclassifications made on 1 January 2018 in accordance with the 5th Update of Circular no. 262 of the Bank of Italy
The 5th Update of Circular no. 262 of the Bank of Italy clarified the fact that Property, plant and equipment that was
recognised in accordance with IAS 2 “Inventories” must be reclassified to item 90 “Property, plant and equipment” and no
longer recognised in item 130 “Other assets”.
The same update also specified that the provisions made with respect to off-balance sheet exposures must be
recognised in item 100 “Provisions for risks and charges” instead of item 80 “Other liabilities”.
The following statements concerning the effects of first-time adoption of IFRS 9 and IFRS 15 also include the aforesaid
reclassifications.
Transition statements
The reference regulatory framework for the consolidated financial statements of CDP saw the introduction, in 2018, of
two new relevant standards - IFRS 9 “Financial instruments” (Commission Regulation (EU) 2016/1905 of 22 September
2016) and IFRS 15 “Revenue from contracts with customers” (Commission Regulation (EU) 2016/1905 of 22 September
2016) - and the consequent amendment to Circular no. 262 published by the Bank of Italy in an updated version in
December 2017.
These standards incurred two additions such as the Clarifications to IFRS 15 published with Commission Regulation
(EU) 2017/1987 of 31 October 2017 and the Amendments to IFRS 9 Financial instruments - Prepayment Features with
Negative Compensation published with Commission Regulation (EU) 2018/498 of 22 March 2018, both adopted by the
Group in this half-yearly financial report.
With reference to IFRS 9 and IFRS 15, the CDP Group has decided to apply them retrospectively but without restating
the comparative figures for the previous financial year as regards the end-of-period figures or for the previous period
regarding the flow data.
122 3. Half-yearly condensed consolidated financial statements at 30 June 2018

Considering the requirements contained in the international financial reporting standards in terms of disclosure in such
circumstances, and in particular in IFRS 7, as regards the adoption of IFRS 9 and also the changes made in the updated
version of Circular no. 262, the following disclosure information has been prepared, represented by:
the statements transferring the balance sheet items at 31 December 2017 from the accounting categories with
names used in the 2017 consolidated financial statements to the new accounting categories introduced by the
updated version of Circular 262. This statement transfers the carrying amounts to the new items without making any
changes in measurement and impairment, keeping the overall closing totals of assets, liabilities and equity items
exactly the same;
the measurement statements concerning the accounting categories introduced to take account of the impacts arising
from the adoption of IFRS 9 (measurement and impairment) and IFRS 15 (measurement) and of the related tax
effects. This statement highlights the opening balance sheet balances at 1 January 2018 and the subsequent effects
on equity at the same date;
the statement of reconciliation of equity at 31 December 2017 with the opening equity at 1 January 2018;
the breakdown of exposures at amortised cost that are subject to the impairment process.
The impacts resulting from the adoption of the new standards involve an adjustment to the opening balance of retained
earnings. As specified in the updated version of Circular 262, the impacts on equity resulting from the adoption of IFRS 9
and 15 at 1 January 2018 are highlighted in the section entitled “Changes in opening balances” in the statement of
changes in equity for the period in those items that will incur these effects.
Statements transferring balance sheet figures
The following statements show the transfer of the balance sheet items at 31 December 2017 from the accounting
categories with names used in the 2017 consolidated financial statements (and thus as required by the previous version
of Circular 262), to the new accounting categories introduced by the updated version of Circular 262. These statements
show the carrying values resulting from the published 2017 consolidated financial statements that have been transferred
to the new items, taking account of the analyses conducted as part of the projects implemented by the Group, without
making any changes in measurement and impairment due to the adoption of IFRS 9 and IFRS 15, keeping the overall
closing totals of assets, liabilities and equity items exactly the same.
Assets
The statement relating to the balance sheet asset items shows the following main changes:
the financial assets at fair value amounting to 255.9 million euro included the convertible bond (CB) disbursed to
Valvitalia, units of UCIs of 10.2 million euro and other financial assets amounting to 73.5 million euro. The first two
financial instruments were transferred to financial assets mandatorily measured at fair value through profit or loss:
the CB in connection with the disappearance of the conditions that allowed its designation at fair value and its failure
to pass the SPPI test because of the existence of options, and the units of UCIs in connection with their nature and
structure. The financial asset held by Terna, based on the analysis carried out by the company, was reclassified
among the financial assets measured at amortised cost;
the financial assets available for sale, amounting to 10,597.9 million euro, were transferred to the item “Financial
assets measured at fair value through other comprehensive income” whenever these were represented by debt
instruments held in a HTCS business model and passed the SPPI test (9,441.1 million euro), along with equities
which the holding company irrevocably decided to classify within that category, given their nature as a stable
investment. The remaining financial assets amounting to 1,074.6 million euro were transferred to financial assets
mandatorily measured at fair value through profit or loss, of which 1,072.5 million euro relate to units in funds and
investment vehicles held by CDP for long-term investment to support specific initiatives and therefore included in this
item in relation to their nature and structure. The residual amount of 60.7 million euro relates to equity securities
IF R S9 / IA S 39
(thousands of euro)
10. Cash and
cash
equivalents
20. Financial
assets held for
trading
30. Financial
assets
designated at
fair value
40. Financial
assets available
for sale
50. Financial
assets held to
maturity
60. Loans to
banks
70. Loans to
customers
80. Hedging
derivatives
90. Fair value
change of
financial assets
in hedged
portfo lios (+/-)
100. Equity
investments
110. Reinsurers'
share of
technical
reserves
120. Property,
plant and
equipment
130. Intangible
assets
140. Tax assets 150. Non-current
assets and
disposal group
held for sale
160. Other
assets
Total assets
10. Cash and cash equivalents 1,015 1,015
20. Financial assets measured at fair value through profit or loss 896,815 182,382 1,074,584 549,627 1,014,621 3,718,029
30. Financial assets measured at fair value through other
comprehesinve income- 9,523,380 9,523,380
40. Financial assets measured at amortised cost 73,503 30,181,380 43,137,745 256,168,610 329,561,238
50. Hedging derivatives 988,655 988,655
60. Fair value change of f inancial assets in hedged portfolios (+/-) (41,503) (41,503)
70. Equity investments 19,769,766 19,769,766
80. Reinsurers' share of technical reserves 670,812 670,812
90. Property, plant and equipment 35,813,995 1,364,515 37,178,510
100. Intangible assets 8,050,650 8,050,650
110. Tax assets 1,701,679 1,701,679
120. Non-current assets and disposal groups held for sale 23 23
130. Other assets 8,411,494 8,411,494
Total assets 1,015 896,815 255,885 10,597,964 30,731,007 43,137,745 257,183,231 988,655 (41,503) 19,769,766 670,812 35,813,995 8,050,650 1,701,679 23 9,776,009 419,533,748
123
Half-yearly Financial Report 2018
Notes to the consolidated financial statements

classified as such based on the provisions of IAS 32; an irrevocable decision was made to classify them among
financial assets measured at fair value through other comprehensive income.
the financial assets held to maturity amounting to 30,731 million euro were transferred to the item “Financial assets
measured at amortised cost” whenever these were represented by debt instruments held in a HTC business model
and passed the SPPI test (30,181.4 million euro), and to the item “Financial assets mandatorily measured at fair
value through profit or loss” when they did not pass the SPPI test;
loans to customers and banks held within a HTC business model and which passed the SPPI test were transferred
to financial assets measured at amortised cost. In case of failure in passing the test, i.e. for a limited number of
securities and loans with significant option components, the loans were classified among financial assets
mandatorily measured at fair value through profit or loss;
in addition, to take account of the provisions in the updated version of Circular 262, the inventories of property, plant
and equipment under IAS 2 (as specified in para. 8.5 of Section 8 - 2.7.16 – of the Circular) were transferred from
Other assets to Property, plant and equipment.
Liabilities
The statement relating to the balance sheet liability items shows the following main changes:
the amounts Due to banks were retained among financial liabilities measured at amortised cost except for one
component of 122.4 million euro. That component relates to financial liabilities associated with the aforementioned
types of loans that failed to pass the SPPI test and were therefore transferred to financial assets mandatorily
measured at fair value through profit or loss. Given that relationship, these liabilities were designated at fair value;
the transfer of the overall net adjustments for guarantees and commitments from other liabilities to provisions for
risks and charges (188.1 million euro).
Equity
Considering the methods used to prepare the statements transferring balance sheet items as regards assets and
liabilities, equity did not incur any changes.
IF R S9 / IA S 39
(thousands of euro)
10. Due to banks 20. Due to
customers
30. Securities
issued
40. Financial
liabilities held
for trading
50. Financial
liabilities
designated at
fair value
60. Hedging
derivatives
70. Fair value
change of
financial
liabilities in
hedged
portfo lios (+/-)
80.Tax liabilities 90. Liabilities
associated with
non-current
assets and
disposal groups
held for sale
100. Other
liabilities
110. Staff
severance pay
120. Provisions
for risks and
charges
130. Technical
reserves
Total liabilities
10. Financial liabilities measured at amortised cost 25,812,471 300,331,654 37,237,527 363,381,652
20. Financial liabilities held for trading - 184,354 1,340 185,694
30. Financial liabilities designated at fair value 122,414 519,228 641,642
40. Hedging derivatives 667,714 667,714
50. Fair value change of f inancial liabilities in hedged portfolios (+/-) 32,400 32,400
60. Tax liabilities 3,549,637 3,549,637
70. Liabilities associated w ith non-current assets and disposal
groups held for sale-
80. Other liabilities 9,720,862 9,720,862
90. Staff severance pay 221,039 221,039
100. Provisions for risks and charges 188,131 2,615,810 2,803,941
110. Technical reserves 2,407,786 2,407,786
Total liabilities 25,934,885 300,331,654 37,237,527 184,354 519,228 669,054 32,400 3,549,637 - 9,908,993 221,039 2,615,810 2,407,786 383,612,367
IF R S9 / IA S 39
(thousands of euro)
140. Valuation
reserves
150. Share
capital
repayable on
demand
160. Equity
instrument
165. Interim
dividends
170. Reserves 180. Share
premium
reserve
190. Share
capital
200. Treasury
share (-)
210. Non-
contro lling
interests (+/-)
220. Net income
(loss) for the
year
Total equity
120. Valuation reserves 763,663 763,663
130. Redeemable shares -
140. Equity instruments -
150. Reserves 12,981,676 12,981,676
160. Share premium reserve 2,378,517 2,378,517
170. Share capital 4,051,143 4,051,143
180. Treasury shares (-) (57,220) (57,220)
190. Non-controlling interests (+/-) 12,860,288 12,860,288
200. Net income (loss) for the year 2,943,314 2,943,314
Total equity 763,663 - - - 12,981,676 2,378,517 4,051,143 (57,220) 12,860,288 2,943,314 35,921,381
Total liabilities and equity 419,533,748
124 3. Half-yearly condensed consolidated financial statements at 30 June 2018
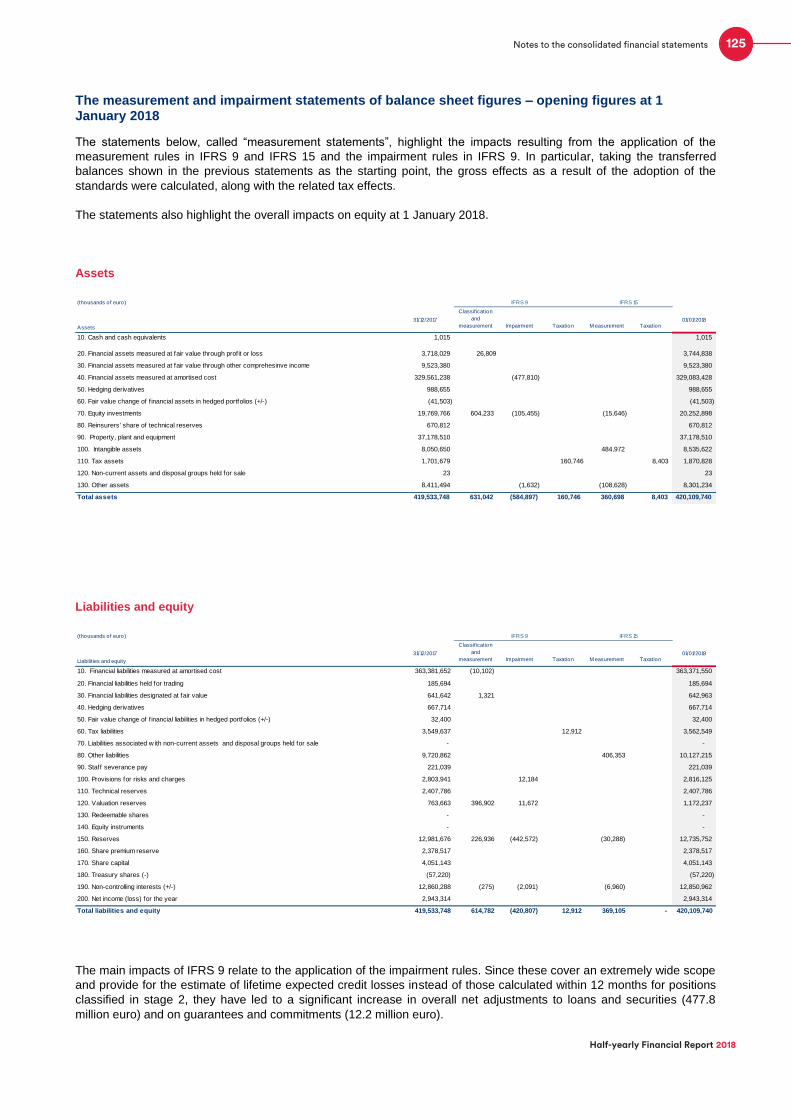
The measurement and impairment statements of balance sheet figures – opening figures at 1 January 2018
The statements below, called “measurement statements”, highlight the impacts resulting from the application of the
measurement rules in IFRS 9 and IFRS 15 and the impairment rules in IFRS 9. In particular, taking the transferred
balances shown in the previous statements as the starting point, the gross effects as a result of the adoption of the
standards were calculated, along with the related tax effects.
The statements also highlight the overall impacts on equity at 1 January 2018.
Assets
Liabilities and equity
The main impacts of IFRS 9 relate to the application of the impairment rules. Since these cover an extremely wide scope
and provide for the estimate of lifetime expected credit losses instead of those calculated within 12 months for positions
classified in stage 2, they have led to a significant increase in overall net adjustments to loans and securities (477.8
million euro) and on guarantees and commitments (12.2 million euro).
31/12/2017
Classification
and
measurement Impairment Taxation M easurement Taxation01/01/2018
1,015 1,015
3,718,029 26,809 3,744,838
9,523,380 9,523,380
329,561,238 (477,810) 329,083,428
988,655 988,655
(41,503) (41,503)
19,769,766 604,233 (105,455) (15,646) 20,252,898
670,812 670,812
37,178,510 37,178,510
8,050,650 484,972 8,535,622
1,701,679 160,746 8,403 1,870,828
23 23
8,411,494 (1,632) (108,628) 8,301,234
419,533,748 631,042 (584,897) 160,746 360,698 8,403 420,109,740
120. Non-current assets and disposal groups held for sale
130. Other assets
Total assets
70. Equity investments
80. Reinsurers' share of technical reserves
90. Property, plant and equipment
100. Intangible assets
110. Tax assets
20. Financial assets measured at fair value through profit or loss
30. Financial assets measured at fair value through other comprehesinve income
40. Financial assets measured at amortised cost
50. Hedging derivatives
60. Fair value change of f inancial assets in hedged portfolios (+/-)
(thousands of euro) IFRS 9 IFRS 15
Assets
10. Cash and cash equivalents
Liabilities and equity
31/12/2017
Classification
and
measurement Impairment Taxation M easurement Taxation01/01/2018
10. Financial liabilities measured at amortised cost 363,381,652 (10,102) 363,371,550
20. Financial liabilities held for trading 185,694 - 185,694
30. Financial liabilities designated at fair value 641,642 1,321 642,963
40. Hedging derivatives 667,714 667,714
50. Fair value change of f inancial liabilities in hedged portfolios (+/-) 32,400 32,400
60. Tax liabilities 3,549,637 12,912 - 3,562,549
70. Liabilities associated w ith non-current assets and disposal groups held for sale - -
80. Other liabilities 9,720,862 406,353 10,127,215
90. Staff severance pay 221,039 221,039
100. Provisions for risks and charges 2,803,941 12,184 2,816,125
110. Technical reserves 2,407,786 2,407,786
120. Valuation reserves 763,663 396,902 11,672 1,172,237
130. Redeemable shares - -
140. Equity instruments - -
150. Reserves 12,981,676 226,936 (442,572) (30,288) 12,735,752
160. Share premium reserve 2,378,517 2,378,517
170. Share capital 4,051,143 4,051,143
180. Treasury shares (-) (57,220) (57,220)
190. Non-controlling interests (+/-) 12,860,288 (275) (2,091) (6,960) 12,850,962
200. Net income (loss) for the year 2,943,314 2,943,314
Total liabilities and equity 419,533,748 614,782 (420,807) 12,912 369,105 - 420,109,740
IFRS 15(thousands of euro) IFRS 9
125
Half-yearly Financial Report 2018
Notes to the consolidated financial statements

Overall net adjustments also affected securities classified as financial assets measured at fair value through other
comprehensive income (with additional impairment of 9.9 million euro) offset, however, by an equal increase in changes
in fair value, resulting in a zero net impact.
Conversely, there was a limited impact resulting from the different classification of financial assets and it substantially
related to their transfer to financial assets mandatorily measured at fair value through profit or loss due to their failure to
pass the SPPI test.
The main impacts arising from IFRS 15 are substantially related to the subsidiaries Fincantieri and Italgas. Fincantieri
established the effects of the new standard on its accounts by analysing a combination of a range of goods and services
into a single contractual obligation, the change of timing for the recognition of revenues and the capitalisation of
incremental costs for obtaining contracts, with an overall effect of reducing the equity of the CDP Group by 14 million
euro after the tax effects.
As regards the subsidiary Italgas, IFRS 15 led to the adoption of a different accounting treatment for connection fees for
private users. It emerged that it was necessary to present the remuneration component for the initial installation
investment amount (connection fee) as a revenue to be deferred over time in line with the useful life of the asset to which
it refers, rather than consider the connection fee as a capital contribution that would be recognised as a reduction of
assets. This kind of registration resulted in an increase in assets of 437 million euro, as of 1 January 2018, and a
corresponding increase in other liabilities for the portion of revenues from fees that were deferred based on the technical-
economic useful life of the plants to which they refer, with no impact on equity 22.
The impact that the two standards had on companies accounted for using equity method was also illustrated and
regarded primarily Poste Italiane and ENI. For the former this resulted in an overall increase of 425 million euro, and for
the latter of 64 million euro. In both cases, the effect of impairment under the new rules of IFRS 9 was considerable,
although it was more than offset by changes in the measurement of financial instruments.
22 The adoption of IFRS 15 for Italgas led to a different representation of its assets and liabilities. For this reason, although this did not generate an effect on equity, it was illustrated in the measurement and impairment statement and not in the transfer statement, precisely in order to keep the value of total assets of balance sheet assets and liabilities, in the latter statement, the same as those published in the 2017 consolidated financial statements.
126 3. Half-yearly condensed consolidated financial statements at 30 June 2018
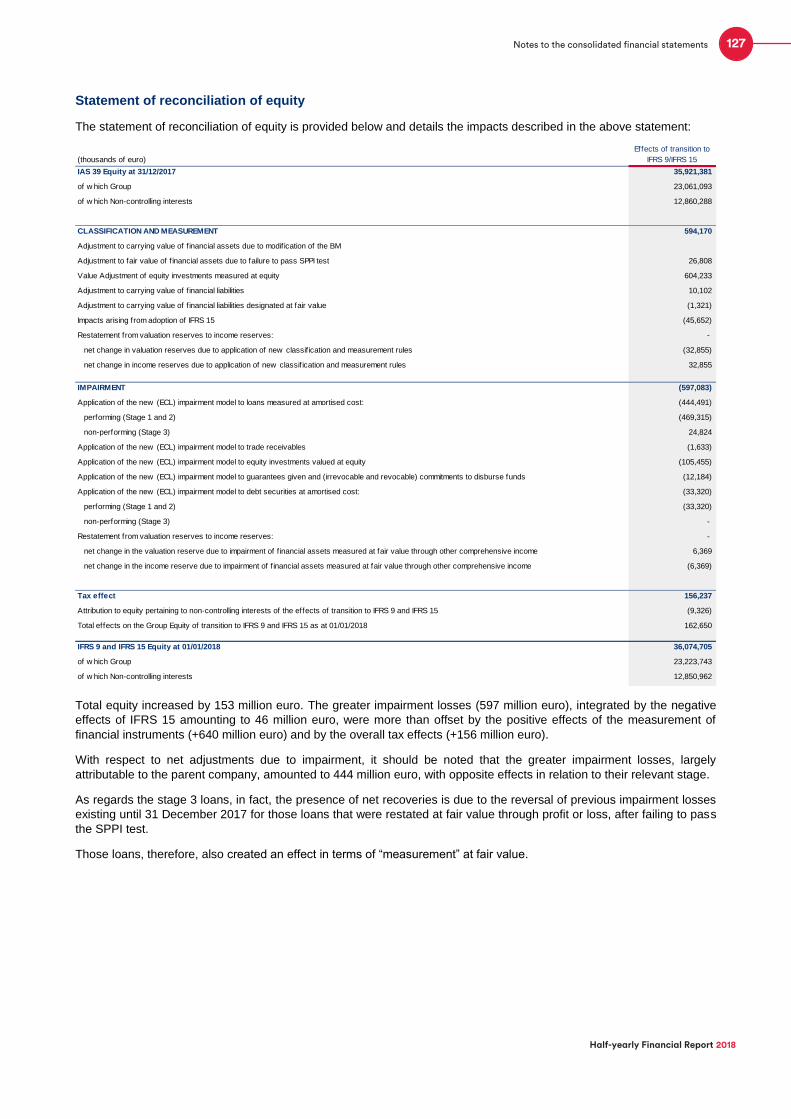
Statement of reconciliation of equity
The statement of reconciliation of equity is provided below and details the impacts described in the above statement:
Total equity increased by 153 million euro. The greater impairment losses (597 million euro), integrated by the negative
effects of IFRS 15 amounting to 46 million euro, were more than offset by the positive effects of the measurement of
financial instruments (+640 million euro) and by the overall tax effects (+156 million euro).
With respect to net adjustments due to impairment, it should be noted that the greater impairment losses, largely
attributable to the parent company, amounted to 444 million euro, with opposite effects in relation to their relevant stage.
As regards the stage 3 loans, in fact, the presence of net recoveries is due to the reversal of previous impairment losses
existing until 31 December 2017 for those loans that were restated at fair value through profit or loss, after failing to pass
the SPPI test.
Those loans, therefore, also created an effect in terms of “measurement” at fair value.
(thousands of euro)
Effects of transition to
IFRS 9/IFRS 15
IAS 39 Equity at 31/12/2017 35,921,381
of w hich Group 23,061,093
of w hich Non-controlling interests 12,860,288
CLASSIFICATION AND MEASUREMENT 594,170
Adjustment to carrying value of f inancial assets due to modif ication of the BM
Adjustment to fair value of f inancial assets due to failure to pass SPPI test 26,808
Value Adjustment of equity investments measured at equity 604,233
Adjustment to carrying value of f inancial liabilities 10,102
Adjustment to carrying value of f inancial liabilities designated at fair value (1,321)
Impacts arising from adoption of IFRS 15 (45,652)
Restatement from valuation reserves to income reserves: -
net change in valuation reserves due to application of new classif ication and measurement rules (32,855)
net change in income reserves due to application of new classif ication and measurement rules 32,855
IMPAIRMENT (597,083)
Application of the new (ECL) impairment model to loans measured at amortised cost: (444,491)
performing (Stage 1 and 2) (469,315)
non-performing (Stage 3) 24,824
Application of the new (ECL) impairment model to trade receivables (1,633)
Application of the new (ECL) impairment model to equity investments valued at equity (105,455)
Application of the new (ECL) impairment model to guarantees given and (irrevocable and revocable) commitments to disburse funds (12,184)
Application of the new (ECL) impairment model to debt securities at amortised cost: (33,320)
performing (Stage 1 and 2) (33,320)
non-performing (Stage 3) -
Restatement from valuation reserves to income reserves: -
net change in the valuation reserve due to impairment of f inancial assets measured at fair value through other comprehensive income 6,369
net change in the income reserve due to impairment of f inancial assets measured at fair value through other comprehensive income (6,369)
Tax effect 156,237
Attribution to equity pertaining to non-controlling interests of the effects of transition to IFRS 9 and IFRS 15 (9,326)
Total effects on the Group Equity of transition to IFRS 9 and IFRS 15 as at 01/01/2018 162,650
IFRS 9 and IFRS 15 Equity at 01/01/2018 36,074,705
of w hich Group 23,223,743
of w hich Non-controlling interests 12,850,962
127
Half-yearly Financial Report 2018
Notes to the consolidated financial statements
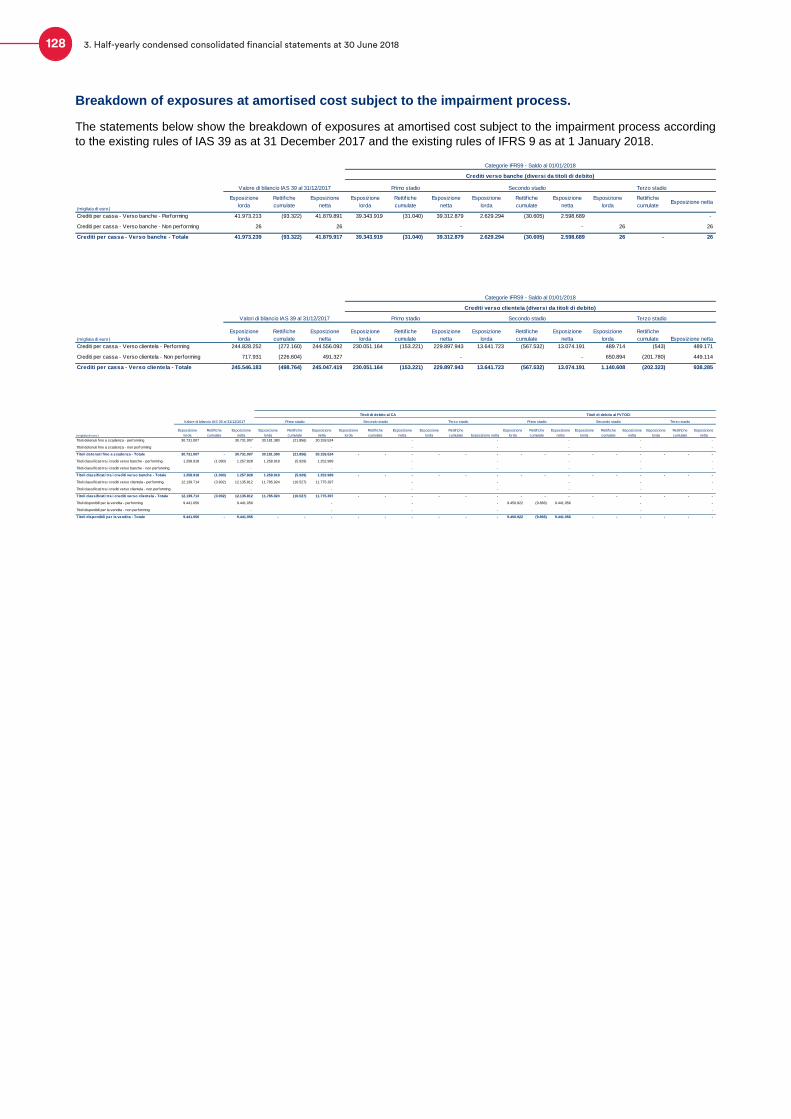
Breakdown of exposures at amortised cost subject to the impairment process.
The statements below show the breakdown of exposures at amortised cost subject to the impairment process according
to the existing rules of IAS 39 as at 31 December 2017 and the existing rules of IFRS 9 as at 1 January 2018.
(migliaia di euro)
Esposizione
lorda
Rettif iche
cumulate
Esposizione
netta
Esposizione
lorda
Rettif iche
cumulate
Esposizione
netta
Esposizione
lorda
Rettif iche
cumulate
Esposizione
netta
Esposizione
lorda
Rettif iche
cumulateEsposizione netta
Crediti per cassa - Verso banche - Performing 41.973.213 (93.322) 41.879.891 39.343.919 (31.040) 39.312.879 2.629.294 (30.605) 2.598.689 -
Crediti per cassa - Verso banche - Non performing 26 26 - - 26 26
Crediti per cassa - Verso banche - Totale 41.973.239 (93.322) 41.879.917 39.343.919 (31.040) 39.312.879 2.629.294 (30.605) 2.598.689 26 - 26
Categorie IFRS9 - Saldo al 01/01/2018
Crediti verso banche (diversi da titoli di debito)
Valore di bilancio IAS 39 al 31/12/2017 Primo stadio Secondo stadio Terzo stadio
(migliaia di euro)
Esposizione
lorda
Rettif iche
cumulate
Esposizione
netta
Esposizione
lorda
Rettif iche
cumulate
Esposizione
netta
Esposizione
lorda
Rettif iche
cumulate
Esposizione
netta
Esposizione
lorda
Rettif iche
cumulate Esposizione netta
Crediti per cassa - Verso clientela - Performing 244.828.252 (272.160) 244.556.092 230.051.164 (153.221) 229.897.943 13.641.723 (567.532) 13.074.191 489.714 (543) 489.171
Crediti per cassa - Verso clientela - Non performing 717.931 (226.604) 491.327 - - 650.894 (201.780) 449.114
Crediti per cassa - Verso clientela - Totale 245.546.183 (498.764) 245.047.419 230.051.164 (153.221) 229.897.943 13.641.723 (567.532) 13.074.191 1.140.608 (202.323) 938.285
Categorie IFRS9 - Saldo al 01/01/2018
Crediti verso clientela (diversi da titoli di debito)
Valori di bilancio IAS 39 al 31/12/2017 Primo stadio Secondo stadio Terzo stadio
(migliaia di euro)
Esposizione
lorda
Rettif iche
cumulate
Esposizione
netta
Esposizione
lorda
Rettif iche
cumulate
Esposizione
netta
Esposizione
lorda
Rettif iche
cumulate
Esposizione
netta
Esposizione
lorda
Rettif iche
cumulate Esposizione netta
Esposizione
lorda
Rettif iche
cumulate
Esposizione
netta
Esposizione
lorda
Rettif iche
cumulate
Esposizione
netta
Esposizione
lorda
Rettif iche
cumulate
Esposizione
netta
Titoli detenuti f ino a scadenza - performing 30.731.007 30.731.007 30.181.380 (21.856) 30.159.524 - - - - -
Titoli detenuti f ino a scadenza - non performing - - - - - - -
Titoli detenuti fino a scadenza - Totale 30.731.007 - 30.731.007 30.181.380 (21.856) 30.159.524 - - - - - - - - - - - - - - -
Titoli classif icati tra i crediti verso banche - performing 1.258.918 (1.090) 1.257.828 1.258.918 (5.929) 1.252.989 - - - - -
Titoli classif icati tra i crediti verso banche - non performing - - - - - - -
Titoli classificati tra i crediti verso banche - Totale 1.258.918 (1.090) 1.257.828 1.258.918 (5.929) 1.252.989 - - - - - - - - - - - - - - -
Titoli classif icati tra i crediti verso clientela - performing 12.139.714 (3.902) 12.135.812 11.785.924 (10.527) 11.775.397 - - - - -
Titoli classif icati tra i crediti verso clientela - non performing - - - - - - -
Titoli classificati tra i crediti verso clientela - Totale 12.139.714 (3.902) 12.135.812 11.785.924 (10.527) 11.775.397 - - - - - - - - - - - - - - -
Titoli disponibili per la vendita - performing 9.441.056 9.441.056 - - - 9.450.922 (9.866) 9.441.056 - -
Titoli disponibili per la vendita - non performing - - - - - - -
Titoli disponibili per la vendita - Totale 9.441.056 - 9.441.056 - - - - - - - - - 9.450.922 (9.866) 9.441.056 - - - - - -
Titoli di debito al FVTOCI
Primo stadio Secondo stadio Terzo stadio
Titoli di debito al CA
Valore di bilancio IAS 39 al 31/12/2017 Primo stadio Secondo stadio Terzo stadio
128 3. Half-yearly condensed consolidated financial statements at 30 June 2018

Financial assets and liabilities measured at fair value – breakdown by level of fair value
The statements below show the breakdown by levels of fair value of the portfolios of financial assets and liabilities
measured at fair value according to the existing rules of IAS 39 as at 31 December 2017 and the existing rules of IFRS 9
as at 1 January 2018.
Financial assets and liabilities measured at fair value at 31/12/2017 – levels of fair value
Financial assets and liabilities measured at fair value at 01/01/2018 – levels of fair value
Comparative data
As reported in the section “”Comparison and disclosure” of the Notes to the consolidated financial statements, the
comparative information for the balance sheet data at 31 December 2017 in presented ad reclassified figures as
described in more detail in the “Other issues” section of the accounting policies in the paragraphs “Transition
statements”.
The comparative information for the income statement figures and other comprehensive income for the period ended 30
June 2017 has also been reclassified, in addition to having been restated following completion of the PPA for the equity
investment in Poste Italiane, as described in “Other Issues” section. Following the completion of the PPA, the figures
contained in the Statement of changes in consolidated shareholders’ equity at 30 June 2017 has also been restated.
The comparative figures at 30 June 2017 included in the statement of cash flows have consequently been reclassified
and restated.
The table below shows the statement transferring the income statement items at 30 June 2017 from the accounting
categories with names used in the 2017 consolidated financial statements to the new accounting categories introduced
by the updated version of Circular 262. The income statement figures have been restated.
(thousands of euro) 31/12/2017 L1 L2 L3
Financial assets measured at fair value through profit or loss (3,718,029) (1,192,139) (344,300) (2,181,590)
a) f inancial assets held for trading (894,208) (641,881) (192,901) (59,426)
b) f inancial assets designated at fair value
c) other f inancial asstes mandatorily measured at fair value (2,823,821) (550,258) (151,399) (2,122,164)
Financial assets measured at fair value through other comprehesinve income (9,523,380) (9,441,056) (82,324)
Hedging derivatives (988,655) (988,655)
Financial liabilities held for trading 185,694 141,595 44,099
Financial liabilities measured at fair value 641,642 501,551 140,091
Key
L1 = Level 1
L2 = Level 2
L3 = Level 3
(thousands of euro) 01/01/2018 L1 L2 L3
Financial assets measured at fair value through profit or loss (3,744,838) (1,243,418) (345,666) (2,155,754)
a) f inancial assets held for trading (894,208) (641,881) (192,901) (59,426)
b) f inancial assets designated at fair value
c) other f inancial asstes mandatorily measured at fair value (2,850,630) (601,537) (152,765) (2,096,328)
Financial assets at fair value through other comprehesinve income (9,523,380) (9,441,056) (82,324)
Hedging derivatives (988,655) (988,655)
Financial liabilities held for trading 185,694 141,595 44,099
Financial liabilities measured at fair value 642,963 501,551 141,412
Key
L1 = Level 1
L2 = Level 2
L3 = Level 3
129
Half-yearly Financial Report 2018
Notes to the consolidated financial statements
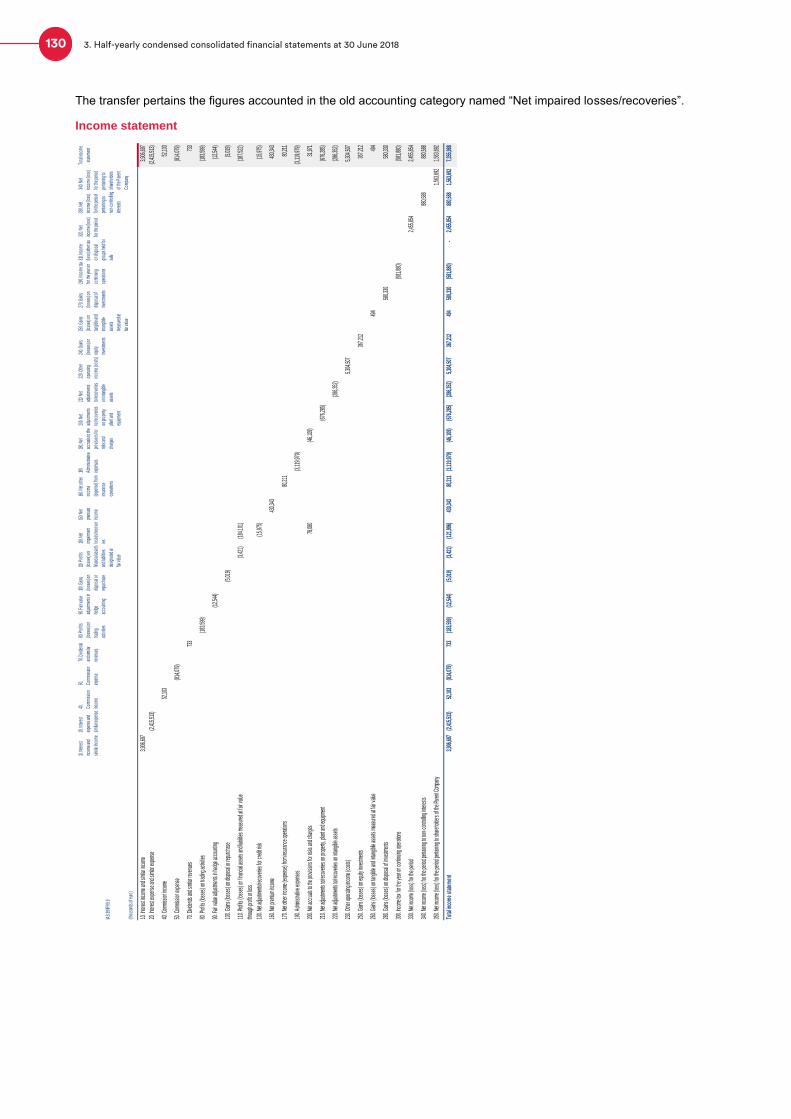
The transfer pertains the figures accounted in the old accounting category named “Net impaired losses/recoveries”.
Income statement
IAS
39/IF
RS 9
(thou
sand
s of e
uro)
10. In
tere
st
incom
e and
simila
r inco
me
20. In
tere
st
expe
nse a
nd
simila
r exp
ense
40.
Com
miss
ion
incom
e
50.
Com
miss
ion
expe
nse
70. D
ivide
nds
and s
imila
r
reve
nues
80. P
rofit
s
(loss
es) o
n
tradin
g
activ
ities
90. F
air va
lue
adjus
tmen
ts in
hedg
e
acco
untin
g
100.
Gains
(loss
es) o
n
dispo
sal o
r
repu
rcha
se
110. P
rofit
s
(loss
es) o
n
finan
cial a
sset
s
and l
iabilit
ies
desig
nate
d at
fair v
alue
130.
Net
impa
irmen
t
loss
es/re
cove
r
ies
150.
Net
prem
ium
incom
e
160.
Net o
ther
incom
e
(exp
ense
) fro
m
insur
ance
oper
atio
ns
180.
Adm
inist
rativ
e
expe
nses
190.
Net
accr
uals
to th
e
prov
ision
s for
risks
and
char
ges
200.
Net
adjus
tmen
ts
to/re
cove
ries
on pr
oper
ty,
plant
and
equip
men
t
210.
Net
adjus
tmen
ts
to/re
cove
ries
on in
tang
ible
asse
ts
220.
Othe
r
oper
ating
incom
e (co
sts)
240.
Gains
(loss
es) o
n
equit
y
inves
tmen
ts
250.
Gains
(loss
es) o
n
tang
ible a
nd
intan
gibile
asse
ts
mea
sure
d at
fair v
alue
270.
Gains
(loss
es) o
n
dispo
sal o
f
inves
tmen
ts
290.
Incom
e tax
for t
he ye
ar o
n
cont
inuing
oper
atio
ns
310.
Incom
e
(loss
) afte
r tax
on di
spos
al
grou
ps he
ld fo
r
sale
320.
Net
incom
e (lo
ss)
for t
he pe
riod
330.
Net
incom
e (lo
ss)
for t
he pe
riod
perta
ining
to
non-
cont
rollin
g
inter
ests
340.
Net
incom
e (lo
ss)
for t
he pe
riod
perta
ining
to
shar
ehol
ders
of th
e Par
ent
Com
pany
Tota
l inco
me
stat
emen
t
10. In
teres
t inco
me an
d sim
ilar in
come
3,906
,697
3,906
,697
20. In
teres
t exp
ense
and s
imila
r exp
ense
(2,41
5,513
) (2
,415,5
13)
40. C
ommi
ssion
inco
me52
,103
52,10
3
50. C
ommi
ssion
expe
nse
(814
,079)
(8
14,07
9)
70. D
ivide
nds a
nd si
milar
reve
nues
733
733
80. P
rofits
(loss
es) o
n tra
ding a
ctivit
ies(1
83,59
9)
(183
,599)
90. F
air va
lue ad
justm
ents
in he
dge a
ccou
nting
(12,5
44)
(12,5
44)
100.
Gains
(loss
es) o
n disp
osal
or re
purc
hase
(5,01
9)
(5,01
9)
110.
Prof
its (lo
sses
) on f
inanc
ial as
sets
and l
iabiliti
es m
easu
red a
t fair
value
throu
gh pr
ofit o
r loss
(3,42
1)
(184
,101)
(1
87,52
2)
130.
Net a
djustm
ents/
reco
verie
s for
cred
it risk
(15,9
75)
(15,9
75)
160.
Net p
remi
um in
come
430,3
43
430,3
43
170.
Net o
ther in
come
(exp
ense
) fro
m ins
uran
ce op
erati
ons
80,21
1 80
,211
190.
Admi
nistra
tive e
xpen
ses
(3,11
9,979
) (3
,119,9
79)
200.
Net a
ccru
als to
the p
rovis
ions f
or ris
ks an
d cha
rges
78,08
0 (4
6,109
) 31
,971
210.
Net a
djustm
ents
to/re
cove
ries o
n pro
perty
, plan
t and
equip
ment
(676
,285)
(6
76,28
5)
220.
Net a
djustm
ents
to/re
cove
ries o
n inta
ngibl
e ass
ets(2
86,35
2)
(286
,352)
230.
Othe
r ope
ratin
g inc
ome (
costs
)5,3
04,50
7 5,3
04,50
7
250.
Gains
(loss
es) o
n equ
ity in
vestm
ents
367,2
12
367,2
12
260.
Gains
(loss
es) o
n tan
gible
and i
ntang
ibile
asse
ts me
asur
ed at
fair v
alue
494
494
280.
Gains
(loss
es) o
n disp
osal
of in
vestm
ents
580,3
30
580,3
30
300.
Incom
e tax
for t
he ye
ar on
conti
nuing
oper
ation
s(5
81,88
0)
(581
,880)
330.
Net in
come
(loss
) for
the p
eriod
2,455
,854
2,455
,854
340.
Net in
come
(loss
) for
the p
eriod
perta
ining
to no
n-co
ntroll
ing in
teres
ts88
0,588
88
0,588
350.
Net in
come
(loss
) for
the p
eriod
perta
ining
to sh
areh
older
s of t
he Pa
rent
Comp
any
1,563
,692
1,563
,692
Tota
l inco
me
stat
emen
t3,9
06,69
7 (2
,415,5
13)
52,10
3 (8
14,07
9)
733
(183
,599)
(1
2,544
) (5
,019)
(3
,421)
(1
21,99
6)
430,3
43
80,21
1 (3
,119,9
79)
(46,1
09)
(676
,285)
(2
86,35
2)
5,304
,507
367,2
12
494
580,3
30
(581
,880)
-
2,455
,854
880,5
88
1,563
,692
7,355
,988
130 3. Half-yearly condensed consolidated financial statements at 30 June 2018

The main financial statement items
The half-yearly condensed consolidated financial statements of the CDP Group at 30 June 2018 have been prepared by
applying the same accounting standards as those used for preparation of the consolidated financial statements for the
previous financial year, reflecting the amendments endorsed and in force with effect from the financial year 2018, as
described in Section 5 – Other issues, A.1 General Information.
The following pages provide a description of the accounting policies adopted in preparing these half-yearly condensed
consolidated financial statements.
1 - FINANCIAL ASSETS MEASURED AT FAIR VALUE THROUGH PROFIT OR LOSS (FVTPL)
The item “Financial assets measured at fair value through profit or loss” includes:
a) “Financial assets held for trading” represented by debt securities, equities, loans, units of UCIs included in an
Other/Trading business model, and also derivatives not designated under hedge accounting
b) “Financial assets designated at fair value” represented by debt securities and loans, with measurement results
entered through profit or loss on the basis of the right accorded to companies by IFRS 9 (i.e. the fair value option),
which allows a financial asset to be irrevocably measured through profit or loss if, and only if, this will eliminate or
significantly reduce a recognition inconsistency;
c) “Other financial assets mandatorily measured at fair value” represented by debt securities, equity securities, units of
collective investment undertakings and loans, i.e. those assets other than those measured at fair value through profit
or loss, which do not meet the requirements for classification at amortised cost, at fair value through other
comprehensive income or which are not held for trading. They are substantially represented by those financial
assets whose contractual terms provide for periodic flows that are not represented only by principal repayments and
interest payments on the principal to be returned (thus characterised by the failure to pass the SPPI test), or those
assets that do not comply with the business model terms of the portfolio measured at amortised cost or at fair value
through other comprehensive income.
Financial assets held for trading, as indicated, include financial derivatives not designated under hedge accounting,
operational hedging derivatives, derivatives embedded in complex financial contracts, the host contract of which is a
financial liability, which were recognized separately because:
the financial characteristics and risks are not strictly correlated to the characteristics of the underlying contract;
the embedded instruments, even when separated, meet the definition of derivative;
the hybrid instruments that they belong to are not measured at fair value with their related values recognized through
profit or loss.
Operational hedging derivatives are those derivatives which are not part of effective hedge accounting but are held to
meet operational hedging requirements where the company wishes to standardise the measurement criterion with
respect to the assets and/or liabilities associated with them.
As with all financial assets held for trading, the fair value of which can assume both positive and negative values,
derivatives are classified among Financial assets held for trading if their fair value is positive and among Financial
liabilities held for trading if their fair value is negative.
Other financial assets mandatorily measured at fair value also include units of UCIs subscribed by CDP with the aim of
implementing initiatives geared to supporting the economy in the long term. Given the nature of these initiatives, these
financial assets are held within a Held to Collect business model, but because of their structure and also in relation to the
clarifications provided by the IFRIC, their contractual terms do not enable them to pass the SPPI test.
Financial assets measured at fair value through profit or loss are initially recognised on the execution date for derivative
contracts, at the settlement date for debt securities, equities, and units of UCIs, and at the disbursement date for loans.
An exception is represented by those securities whose delivery is governed by conventions on the market concerned, for
which initial recognition is at the subscription date.
Upon initial recognition, financial assets measured at fair value through profit or loss are recognised at fair value, which
generally equals the transaction price, net of transaction costs or income that are immediately recognised through profit
or loss.
Subsequent measurement is at fair value, with recognition of the measurement results in the item “Profits (losses) on
trading activities” in the income statement in relation to financial assets held for trading, including those relating to
derivatives associated with the fair value option, or in the item “Profits (losses) on financial assets and liabilities
measured at fair value through profit or loss” as regards other types. The fair value is determined based on the official
prices as of the reporting date if the financial instruments are listed on active markets. For financial instruments, including
131
Half-yearly Financial Report 2018
Notes to the consolidated financial statements

equity securities, not listed on active markets, fair value is determined by using measurement techniques and information
available on the market, such as the price of similar instruments on an active market, discounted cash flows, option
pricing models and values registered in recent similar transactions. For equity securities and related derivative
instruments not listed in an active market, the cost method is used as an estimate of fair value only in a residual manner
and limited to a few circumstances, i.e. in case of non-applicability of all the afore-mentioned measurement methods, or
in the presence of a wide range of possible measurements of fair value, within which the cost is the most significant
estimate.
The interest arising from debt securities and loans classified as Financial assets measured at fair value through profit or
loss are included in interest income and similar income, an item that also includes the positive and negative differentials
and margins of operational hedging derivatives. The positive and negative differentials and margins of trading
derivatives are included in the Profits (losses) on trading activities. Dividends and similar revenues of equity instruments
classified among the Financial assets measured at fair value through profit or loss (including revenue from units of UCIs)
are included in the item Dividends and similar revenues.
Reclassifications to other categories of financial assets are not permitted, unless, as regards financial assets held for
trading, the business model is changed. In this case, all affected financial assets will be reclassified, according to the
rules provided for in IFRS 9.
Financial assets measured at fair value through profit or loss are derecognised when payment is received, when the
contractual rights to the cash flows expire, or a sale transfers all the risks and rewards connected with ownership to a
third party. Conversely, when a prevalent share of the risks and rewards associated with the transferred financial assets
is retained, the asset remains on the financial statements, even if legal title has been effectively transferred.
In cases where it is not possible to verify the substantial transfer of risks and rewards, financial assets are derecognised
from the balance sheet if no type of control over the assets has been maintained. Conversely, the preservation of such
control, even if it is only partial, involves keeping the assets on the balance sheet to an extent equal to the residual
involvement.
Transferred financial assets are derecognised even if the contractual rights to receive the related cash flows are retained,
in the presence of a simultaneous obligation to transfer such flows, and only those, without material delay to other third
parties.
2 - FINANCIAL ASSETS MEASURED AT FAIR VALUE THROUGH OTHER COMPREHENSIVE INCOME (FVOCI)
The item “Financial assets measured at fair value through other comprehensive income” includes financial assets
represented by debt securities and loans that meet both of the following conditions:
the financial asset is held within a Business Model whose objective is achieved by both collecting contractual cash
flows and selling financial assets ;
the contractual terms of the financial asset give rise on specified dates to cash flows that are solely payments of
principal and interest on the principal amount outstanding.
Recognition under this item is also extended to equity instruments, considered as such in compliance with the provisions
of IAS 32, which are not held for trading and for which the option, granted by the standard, of classifying the subsequent
changes in the fair value of the instrument within the valuation reserves has been irrevocably exercised, with recognition
through other comprehensive income (FVTOCI option).
Initial recognition of the item under examination occurs on the settlement date for debt securities and equities and on the
disbursement date for loans.
Financial assets at fair value are initially recognized at fair value through other comprehensive income, which generally
corresponds to the transaction price, including any expenses and income attributable to the transaction.
Subsequent to the initial recognition, financial instruments traded in active markets are measured at their fair value
determined on the basis of official prices on the reporting date. For financial instruments, including equity securities, not
listed on active markets, fair value is determined by using measurement techniques and information available on the
market, such as the price of similar instruments on an active market, discounted cash flows, and values recorded in
recent similar transactions. For equity securities not listed in an active market, the cost method is used as an estimate of
fair value only in a residual manner and limited to a few circumstances, i.e. in case of non-applicability of all the afore-
mentioned measurement methods, or in the presence of a wide range of possible measurements of fair value, within
which the cost is the most significant estimate.
132 3. Half-yearly condensed consolidated financial statements at 30 June 2018
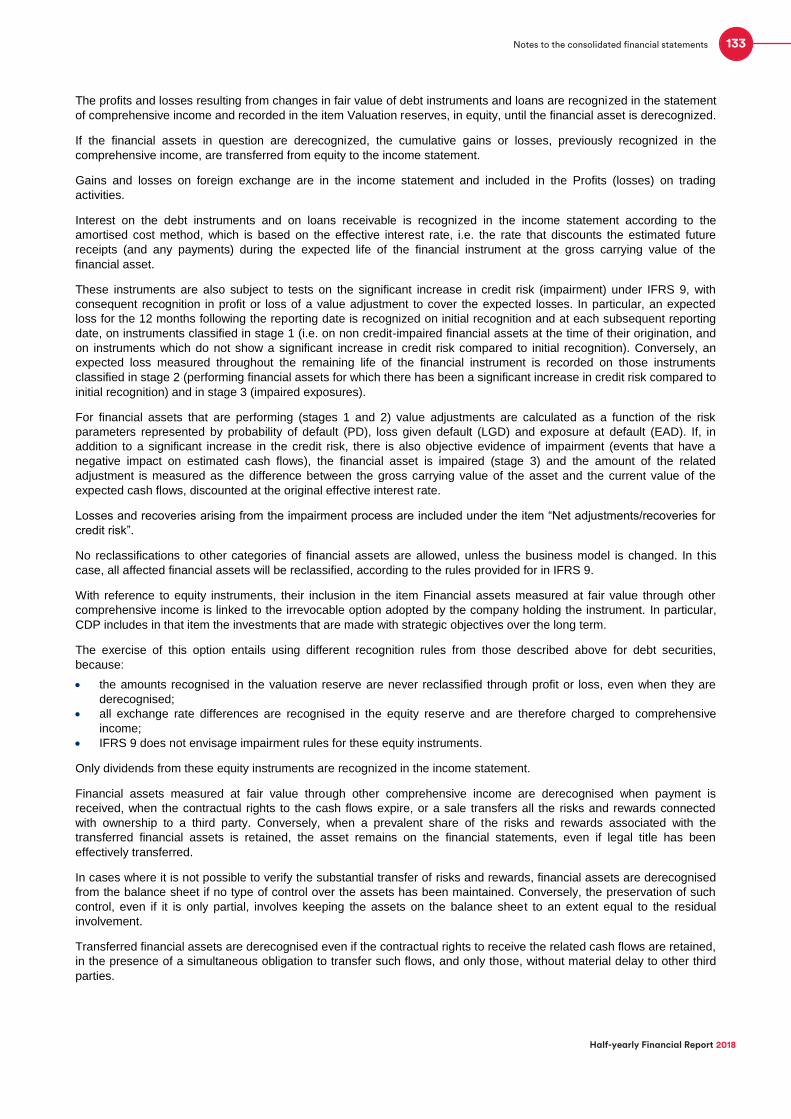
The profits and losses resulting from changes in fair value of debt instruments and loans are recognized in the statement
of comprehensive income and recorded in the item Valuation reserves, in equity, until the financial asset is derecognized.
If the financial assets in question are derecognized, the cumulative gains or losses, previously recognized in the
comprehensive income, are transferred from equity to the income statement.
Gains and losses on foreign exchange are in the income statement and included in the Profits (losses) on trading
activities.
Interest on the debt instruments and on loans receivable is recognized in the income statement according to the
amortised cost method, which is based on the effective interest rate, i.e. the rate that discounts the estimated future
receipts (and any payments) during the expected life of the financial instrument at the gross carrying value of the
financial asset.
These instruments are also subject to tests on the significant increase in credit risk (impairment) under IFRS 9, with
consequent recognition in profit or loss of a value adjustment to cover the expected losses. In particular, an expected
loss for the 12 months following the reporting date is recognized on initial recognition and at each subsequent reporting
date, on instruments classified in stage 1 (i.e. on non credit-impaired financial assets at the time of their origination, and
on instruments which do not show a significant increase in credit risk compared to initial recognition). Conversely, an
expected loss measured throughout the remaining life of the financial instrument is recorded on those instruments
classified in stage 2 (performing financial assets for which there has been a significant increase in credit risk compared to
initial recognition) and in stage 3 (impaired exposures).
For financial assets that are performing (stages 1 and 2) value adjustments are calculated as a function of the risk
parameters represented by probability of default (PD), loss given default (LGD) and exposure at default (EAD). If, in
addition to a significant increase in the credit risk, there is also objective evidence of impairment (events that have a
negative impact on estimated cash flows), the financial asset is impaired (stage 3) and the amount of the related
adjustment is measured as the difference between the gross carrying value of the asset and the current value of the
expected cash flows, discounted at the original effective interest rate.
Losses and recoveries arising from the impairment process are included under the item “Net adjustments/recoveries for
credit risk”.
No reclassifications to other categories of financial assets are allowed, unless the business model is changed. In this
case, all affected financial assets will be reclassified, according to the rules provided for in IFRS 9.
With reference to equity instruments, their inclusion in the item Financial assets measured at fair value through other
comprehensive income is linked to the irrevocable option adopted by the company holding the instrument. In particular,
CDP includes in that item the investments that are made with strategic objectives over the long term.
The exercise of this option entails using different recognition rules from those described above for debt securities,
because:
the amounts recognised in the valuation reserve are never reclassified through profit or loss, even when they are
derecognised;
all exchange rate differences are recognised in the equity reserve and are therefore charged to comprehensive
income;
IFRS 9 does not envisage impairment rules for these equity instruments.
Only dividends from these equity instruments are recognized in the income statement.
Financial assets measured at fair value through other comprehensive income are derecognised when payment is
received, when the contractual rights to the cash flows expire, or a sale transfers all the risks and rewards connected
with ownership to a third party. Conversely, when a prevalent share of the risks and rewards associated with the
transferred financial assets is retained, the asset remains on the financial statements, even if legal title has been
effectively transferred.
In cases where it is not possible to verify the substantial transfer of risks and rewards, financial assets are derecognised
from the balance sheet if no type of control over the assets has been maintained. Conversely, the preservation of such
control, even if it is only partial, involves keeping the assets on the balance sheet to an extent equal to the residual
involvement.
Transferred financial assets are derecognised even if the contractual rights to receive the related cash flows are retained,
in the presence of a simultaneous obligation to transfer such flows, and only those, without material delay to other third
parties.
133
Half-yearly Financial Report 2018
Notes to the consolidated financial statements
3 - FINANCIAL ASSETS MEASURED AT AMORTISED COST
The item “Financial assets measured at amortised cost” includes debt securities and loans that meet both of the following
conditions:
the financial asset is held within a business model whose objective is to hold financial assets in order to collect
contractual cash flows;and
the contractual terms of the financial asset give rise on specified dates to cash flows that are solely payments of
principal and interest on the principal amount outstanding.
Specifically, the following items are recognized:
loans to banks (current accounts, deposits, security deposits, debt securities, repo transactions and other loans).
This includes operating receivables associated with the provision of financial services. This also includes the
amounts receivable from Central Banks (such as the reserve requirement), other than demand deposits included in
“Cash and cash equivalents”;
loans to customers (current accounts, mortgage loans, factoring, debt securities, repo transactions and other loans).
It also includes receivables due from Italian post offices and variation margins with clearing houses in respect of
transactions on derivative, in addition to operating receivables associated with the provision of business and
financial services. The item also includes cash and cash equivalents held with the Central State Treasury.
Loans disbursed using funds provided by the State or other government agencies and intended for particular uses and
operations required and regulated by special laws (“loans with third-party funds in administration”) are recognized under
this item, provided that the loans and funds accrue interest respectively in favour of and at the expense of the providing
agency. Conversely, loans disbursed using funds administered on behalf of the State or other entities are not included.
The loans granted to public entities and public-law bodies under CDP’s Separate Account portfolio have a number of
features that distinguish them from loans granted by banks, which normally disburse the entire amount of the loan to its
beneficiary at the time the loan is granted. Such loans are special-purpose loans generally granted to public entities for
public works and are disbursed to the beneficiaries only after verification of the progress of the works in question.
Therefore, disbursements are intended to meet the debts actually accumulated by the entities in respect of suppliers as
the work is performed.
Upon signing the loan agreement, the debtor assumes the obligation to repay the entire principal granted, and this
amount is used to determine an amortisation schedule separately from the amount actually disbursed. Amounts still to be
disbursed by CDP earn interest that can be treated as a reimbursement of the interest income earned by CDP on the
non-disbursed portion.
The special-purpose loans issued by CDP normally have an initial grace period, during which, in the absence of
disbursements on the loan granted, the loan does not bear interest. With certain exceptions, the loan repayment
schedule begins on 1 July or 1 January following the execution of the loan agreement. CDP’s accounting policy for
special-purpose loans is to recognize a commitment to disburse the sums granted upon signing the loan agreement and
to recognize a receivable (with a consequent reduction in the disbursement commitments) for the entire amount granted
only when repayment begins, regardless of the amount actually disbursed.
Any disbursements requested by borrowers during the grace period effectively reduce the commitment and result in a
“short-term” receivable for the amount actually disbursed, with this amount accruing interest at the contractually agreed
lending rate. The short-term receivable for advances on loans in their grace period is measured at cost in accordance
with international accounting standards.
When repayment begins on a loan that has not yet been disbursed, both a payable and a receivable are recognized for
the same amount in respect of the party responsible for repaying the loan. The receivable is measured at amortised cost
(which, given the lack of transaction costs on the loans granted by CDP and with certain exceptions, equals cost), and
the payable is a demand liability that decreases as the amounts are actually disbursed.
Loans granted to borrowers other than public entities or public-law bodies are treated in a manner analogous to that for
loans granted by banks.
“Financial assets measured at amortised cost” are initially recognized on the settlement date as regards debt securities
or on the disbursement date as regards loans.
Initial recognition is at fair value, which generally equals the transaction price, including any expenses and income
attributable to the transaction.
After initial recognition, these assets are measured at amortised cost, equal to the value that the financial asset was
measured at on initial recognition minus any principal repayments, plus or minus the accumulated amortisation,
according to the effective interest method of any difference between that initial amount and the maturity amount, adjusted
134 3. Half-yearly condensed consolidated financial statements at 30 June 2018

for any loss allowance. The effective interest rate is the rate that discounts the estimated future receipts (and any
payments) for the expected lifetime of the financial asset at its gross carrying value, which includes the directly
attributable transaction costs and the fees paid or received by the contracting parties.
In some cases, the financial asset is considered impaired at initial recognition as the credit risk is very high and, if it is
purchased, this may be done with significant discounts (assets known as POCI i.e. “Purchased or Originated Credit
Impaired”). In that case, for purchased or originated financial assets that are credit-impaired at initial recognition, a credit-
adjusted effective interest rate is calculated for the credit risk, including the expected losses on initial loans within the
financial flow estimates.
The amortised cost method is not used for loans whose short-term duration means that discounting is considered to have
a negligible effect. This measurement rule is also used for loans without a specific expiration date or demand loans.
Financial assets measured at amortised cost are subject to the calculation of an expected credit loss allowance under
IFRS 9 rules and the amount of such losses is recognized through profit or loss in the item “Net adjustments/recoveries
for credit risk”. In particular, an expected loss at one year is recognized on initial recognition and at each subsequent
reporting date, on instruments classified in stage 1 (i.e. on non credit-impaired financial assets at the time of their
origination, and on instruments which do not show a significant increase in credit risk compared to initial recognition).
Conversely, an expected loss measured throughout the remaining life of the financial instrument is recorded on those
instruments classified in stage 2 (performing financial assets for which there has been a significant increase in credit risk
compared to initial recognition) and in stage 3 (impaired exposures).
For financial assets that are performing (stages 1 and 2) value adjustments are calculated as a function of the risk
parameters represented by probability of default (PD), loss given default (LGD) and exposure at default (EAD). If, in
addition to a significant increase in the credit risk, there is also objective evidence of impairment (events that have a
negative impact on estimated cash flows), the financial asset is impaired (stage 3) and the amount of the related
adjustment is measured as the difference between the gross carrying value of the asset and the current value of the
expected cash flows, discounted at the original effective interest rate.
Impaired assets include those financial instruments that have been attributed the status of bad loans, unlikely to pay or
past due and/or overdrawn as defined by the current rules of the Bank of Italy for the purposes of supervisory reporting.
The expected cash flows take account of estimated recovery times and the expected realisable value of any guarantees.
The amount of the loss to be recognized through profit or loss is calculated based on an analytical assessment process
or for categories of the same kind and thus attributed analytically to each position and takes account of forward-looking
information and possible alternative recovery scenarios.
If the reasons for the impairment are removed following an event after initial recognition, then writebacks are performed
and charged through profit or loss.
Financial assets measured at amortised cost are derecognized when payment is received, when the contractual rights to
the cash flows expire, or a sale transfers to a third party all the risks and rewards connected with ownership of the
transferred asset. Conversely, when a prevalent share of the risks and rewards associated with the transferred financial
assets is retained, the asset remains on the financial statements, even if legal title has been effectively transferred.
In cases where it is not possible to verify the substantial transfer of risks and rewards, financial assets are derecognized
from the balance sheet if no type of control over the assets has been maintained. Conversely, the preservation of such
control, even if it is only partial, involves keeping the assets on the balance sheet to an extent equal to the residual
involvement.
Transferred financial assets are derecognized even if the contractual rights to receive the related cash flows are retained,
in the presence of a simultaneous obligation to transfer such flows, and only those, without material delay to other third
parties.
It is also possible, over the life of financial assets, and specifically for financial assets measured at amortised cost, that
they are the subject to renegotiation of the contract terms. In that case, one needs to check whether or not the
intervening contractual changes give rise to derecognition of the original instrument and the registration of a new
financial instrument.
The analysis required to assess which changes give rise to derecognition rather than modification may sometimes entail
significant elements of judgement.
In general, changes to a financial asset lead to its derecognition and the recognition of a new asset when they are of a
substantial nature. However, in the absence of specific instructions in the IFRS to which one can refer, a list of major
changes has been drawn up which lead to a substantial change in the terms of the existing contract, by introducing a
different nature of risks and entailing, therefore, derecognition.
The list is as follows:
135
Half-yearly Financial Report 2018
Notes to the consolidated financial statements

change of the counterparty;
change in the reference currency;
replacement of debt to equity;
acceptance in lieu, whose repayment depends on the fair value of an asset;
other cases of substantial change in the nature of the contract, such as the introduction of contractual clauses that
expose the debtor to new risk components;
changes granted to performing customers, who do not show any economic and financial difficulties (thus not falling
into the series of so-called “forborne” exposures) and which involve the use of market parameters for the
restatement of the financial conditions of the loan agreement, also with the aim of retaining the customer.
In the event of changes not deemed significant, the gross value is restated through the calculation of the current value of
the cash flows resulting from the renegotiation, at the original exposure rate. The difference between the gross value of the financial instrument before and after the renegotiation of contract terms,
required to reflect the associated changes in the cumulative value adjustments, is recognised through profit or loss as a
gain or loss from contractual changes without derecognition.
4 - HEDGING TRANSACTIONS
Hedging transactions are executed to neutralise contingent losses that are attributable to a specific risk and which can be
found in a specific element or group of elements, should that particular risk effectively materialise.
As permitted by paragraph 7.2.21 of IFRS 9, the Parent Company CDP has decided to apply the provisions on hedging
from IAS 39 rather than those from Chapter 6 of IFRS 9, to be used for its separate financial statements, the
consolidated financial statements of the CDP Group, as well as its own half-yearly financial statements.
In accordance with IAS 39, hedging instruments are derivatives or (limited to the hedging of foreign currency risk) non-
derivative financial assets or liabilities whose fair value or cash flows are expected to offset the changes in fair value or
cash flows of a designated hedged position (IAS 39, paragraphs 72-77 and Annex A, paragraph AG94). A hedged item is
an asset, liability, firm commitment, a highly probable forecast transaction, or a net investment in a foreign operation that:
a) exposes the company to the risk of a change in fair value or future cash flows;
b) is designated as being hedged (IAS 39, paragraphs 78-84 and Annex A, paragraphs AG98-AG101).
The effectiveness of the hedge is the extent to which the change in fair value or cash flows of the hedged position that is
attributable to a hedged risk are offset by the change in fair value or cash flows of the hedging instrument (IAS 39, Annex
A, paragraphs AG105 - AG113).
When a financial instrument is classified as a hedging instrument, the following are to be formally documented:
the relationship between the hedging instrument and the hedged item, including the risk management objectives;
the hedging strategy, which must be in line with established risk management policies;
the methods to be used in order to verify the hedge effectiveness.
Accordingly, both at the inception of the hedge and throughout its life, the change in the fair value of the derivative is
analysed in order to determine whether it is highly effective in offsetting the changes in fair value of the hedged item.
A hedge is deemed to be highly effective if the changes in fair value of the hedged item or in the expected cash flows
attributable to the risk being hedged are almost entirely offset by the changes in fair value of the hedging derivative, with
the relationship of these changes falling within a range of between 80% and 125%.
At each annual or interim reporting date, the effectiveness is assessed through specific prospective and retrospective
tests capable, respectively, of demonstrating the expected effectiveness and the level of effectiveness achieved.
If the hedge is not effective as described above, the hedging instrument is reclassified under financial instruments held
for trading, while the hedged item continues to be measured in accordance with the criteria defined for its category.
Hedge accounting also ceases when the hedging instrument expires, is sold or exercised or when the hedged item
expires, is sold or is repaid.
Hedging derivatives are initially recognized at their fair value on the contract date. In particular:
for fair value hedge, the change in the fair value of the hedged item is offset by the change in the fair value of the
hedging instrument. This offsetting is accounted for by recognising the changes in value through profit or loss, in the
item “Fair value adjustments in hedge accounting”, relating both to the hedged item (for the changes generated by
the underlying risk factor) and to the hedging instrument. Any difference, which represents the partial ineffectiveness
of the hedge, consequently represents the net profit or loss effect. The recognition through profit or loss of the
change in fair value of the hedged item, attributable to the risk hedged, is also applied if the hedged item is a
136 3. Half-yearly condensed consolidated financial statements at 30 June 2018

financial asset measured at fair value through other comprehensive income; if there were no hedging, this change
would be recognised in equity;
for cash flow hedge, the changes in fair value of the derivative are recognised, net of the tax effect, in a specific
“Valuation reserve” of equity, for the effective portion of the hedge, and are only recognised through profit or loss
when there is a change in the cash flows to be offset for the hedged item. The amount of the gain or loss of the
hedging instrument considered ineffective is recognised through profit or loss, in the item “Fair value adjustments in
hedge accounting”. This amount is equal to any excess of the accumulated fair value of the hedging instrument with
respect to the related fair value of the instrument hedged; in any event, the fluctuation of the hedged item and the
related hedge must be kept within the range of 80%-125%;
hedge of a net investment in a foreign operation are accounted for in the same way as cash flow hedge.
If the hedge is not fully effective, the fair value change of the hedging instrument, to the extent of the ineffective portion,
is immediately recognised through profit or loss, in the item “Fair value adjustments in hedge accounting”.
If, during the life of a derivative, the expected hedged cash flows are no longer considered as highly probable, the portion
of that instrument recognized in the “Valuation reserves” of equity is immediately recycled through profit or loss.
Conversely, if the hedging instrument is transferred or no longer qualifies as an effective hedge, the portion of the item
“Valuation reserves” representing the changes in the fair value of the instrument recognised up to that point are retained
in equity and reversed to profit or loss in accordance with the classification criterion described above, in conjunction with
the manifestation of the financial effects of the transaction originally hedged.
Item 50 of the consolidated balance sheet assets and item 40 of the consolidated balance sheet liabilities report financial
and credit hedging derivatives, which at the reporting date have, respectively, a positive and a negative fair value.
For macro hedge, IAS 39 allows the object of a fair value hedge against interest rate risk to be not only an individual
financial asset or liability, but also a monetary amount, containing multiple financial assets and liabilities (or their
portions), so that a set of derivatives may be used to reduce the fair value fluctuations of the hedged items in response to
changes in market interest rates. Net amounts resulting from the mismatch of assets and liabilities cannot be designated
as subject to macro hedging. In the same way as for micro fair value hedges, a macro hedge is deemed to be highly
effective if, both at inception and throughout its life, the changes in fair value of the monetary amount hedged are offset
by changes in the fair value of the hedge derivatives and if the actual results are within a range of 80% to 125%. The
positive or negative amount of the fair value changes, respectively, of the assets or liabilities subject of fair value macro
hedge measured with reference to the risk hedged is recognised in Items 60 of the consolidated balance sheet assets or
50 of the consolidated balance sheet liabilities, with a balancing entry under “Fair value adjustments in hedge
accounting” in the income statement.
The hedge ineffectiveness consists of the difference between the change in fair value of the hedging instruments and the
change in fair value of the monetary amount hedged. The hedge ineffective portion is in any case included under “Fair
value adjustments in hedge accounting” in the income statement.
If the hedging relationship ends, for reasons other than the sale of the hedged items, the accumulated write-back/write-
down recognised in items 60 of the consolidated balance sheet assets or 50 of the consolidated balance sheet liabilities
is recognised through profit or loss under interest income or expense, over the remaining lifetime of the hedged financial
asset or liability.
If these assets and liabilities are sold or redeemed, the amount of fair value not amortised is recognised immediately in
“Gains (Losses) on disposal or repurchase” in the income statement.
5 - EQUITY INVESTMENTS
“Equity investments” means investments in associates and joint ventures (according to IAS 28) and joint arrangements
(according to IFRS 11).
Associates are companies in which the CDP Group holds, either directly or indirectly, at least 20% of the voting rights or,
even with a lower voting interest, companies over which the CDP Group has significant influence, which is defined as the
power to participate in determining financial and operating policies, but without exercising either control or joint control.
Joint arrangements involve companies where control is contractually shared between the CDP Group and one or more
parties, or when decisions about the relevant activities require the unanimous consent of the parties sharing control.
Equity investments are initially recognized at cost at the settlement date and subsequently measured using the equity
method, where the original cost of the equity investment is adjusted (up or down) according to the change in the interest
held by the investor in the equity of the investee.
The same provisions governing business combinations apply to acquisitions. Consequently, the difference between the
acquisition price and the portion of acquired equity is allocated based on the fair value of the identifiable net assets of the
137
Half-yearly Financial Report 2018
Notes to the consolidated financial statements
associate. Any unallocated excess amount is considered as goodwill. The higher allocated price is not presented
separately, but is included in the carrying value of the equity investment (“equity method”).
Any positive difference between the value of the portion of equity of the investee and the cost of the equity investment is
recognized as income. Application of the equity method also considers the treasury shares held by the investee.
The equity investments are tested for impairment at every annual or interim reporting date.
Evidence of impairment, based on the existence of qualitative and quantitative indicators, as illustrated hereunder, and in
accordance with the internal policies, differs where these involve investments in companies whose shares are or are not
listed on active markets.
An impairment test is performed when the aforementioned indicators exist, in accordance with the provisions of IAS 36.
This test is aimed at estimating the recoverable amount of the equity investment and comparing it with its carrying value
to determine the recognition of any impairment losses.
The following are possible indicators of impairment:
the recognition of losses or significantly lower results than budgeted or forecast in multi-year plans;
the announcement or commencement of insolvency proceedings or restructuring plans;
the receipt of a dividend that exceeds the total comprehensive income of the investee for the year or its accumulated
income from previous years;
a carrying value of the equity investment in the separate financial statements that exceeds the amount, in the
consolidated financial statements, of the corresponding portion of equity, including any goodwill.
In addition, for equity investments in listed companies, bearing in mind the provisions of IAS 28 par. 41C, the CDP Group
also considers the following as evidence of impairment:
equity higher than market capitalisation;
a reduction in the market price exceeding the carrying value by over 40% or for more than 24 months.
The recoverable amount is the higher of the fair value of the unit, less costs of disposal and its value in use, being the
present value of the future cash flows that the equity investment may generate, including the final disposal value of the
investment.
If this value is lower than the carrying value, the difference is recognised in the income statement as an impairment loss.
If the reasons causing the adjustment cease to exist, the impairment losses are reversed. These reversals have to be
recognised in the income statement up to the amount of the previous impairment. Consequently, the reduction in the
previously recognised impairment upon write-back of the value of the equity investment may not exceed the book value
that would have existed if no impairment had been previously recognised. Both the adjustments and the reversals of
impairment are recognised in the income statement under “Gains (losses) on equity investments”.
The investor’s interest in any losses of the investee that exceed the carrying value of the equity investment is recognised
in a specific provision, to the extent that the investor is committed to meeting the legal or constructive obligations of the
investee, or otherwise cover its losses.
Dividends on equity instruments that are available for sale are recognised in “Dividends and similar revenues” when the
right to receive payment is established.
Equity investments are derecognised when the contractual rights to the cash flows deriving from ownership of the equity
investments expire or when they are sold, substantially transferring all risks and rewards connected with them.
6 - PROPERTY, PLANT AND EQUIPMENT
This item includes the capital assets used in operations governed by IAS 16, the investment property governed by IAS
40 and the inventories of property, plant and equipment governed by IAS 2. These include also assets under finance
leases (for the lessee) and operating leases (for the lessor). In order to determine whether a contract contains a lease,
the provisions of IFRIC 4 are applied. The item includes the leasehold improvement costs, which can be separated from
the assets and have their own functionality and utility.
“Operating property, plant and equipment” consist of property, plant and equipment used for production purposes and to
supply goods/services, which may be leased or held for administrative purposes.
In accordance with IAS 16, these assets are initially recognized at purchase cost, including incidental expenses directly
related to the purchase, non-deductible VAT and costs for bringing the asset to working condition, increased by
138 3. Half-yearly condensed consolidated financial statements at 30 June 2018
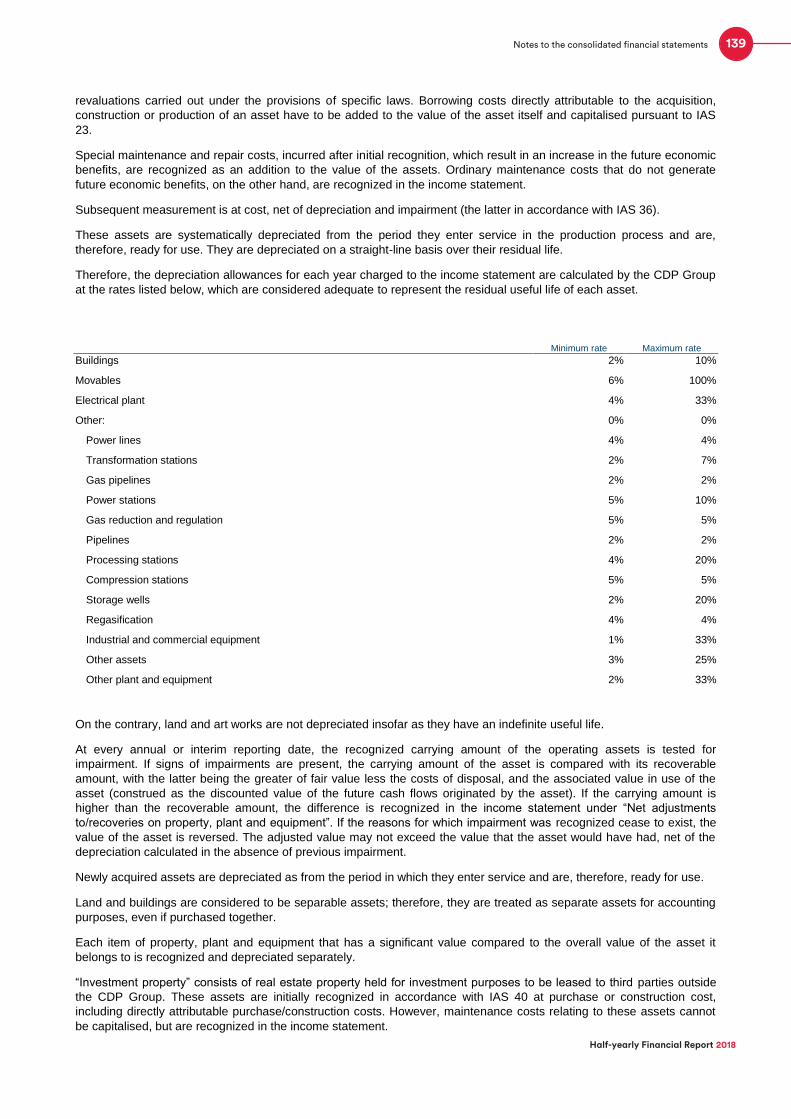
revaluations carried out under the provisions of specific laws. Borrowing costs directly attributable to the acquisition,
construction or production of an asset have to be added to the value of the asset itself and capitalised pursuant to IAS
23.
Special maintenance and repair costs, incurred after initial recognition, which result in an increase in the future economic
benefits, are recognized as an addition to the value of the assets. Ordinary maintenance costs that do not generate
future economic benefits, on the other hand, are recognized in the income statement.
Subsequent measurement is at cost, net of depreciation and impairment (the latter in accordance with IAS 36).
These assets are systematically depreciated from the period they enter service in the production process and are,
therefore, ready for use. They are depreciated on a straight-line basis over their residual life.
Therefore, the depreciation allowances for each year charged to the income statement are calculated by the CDP Group
at the rates listed below, which are considered adequate to represent the residual useful life of each asset.
Minimum rate Maximum rate
Buildings 2% 10%
Movables 6% 100%
Electrical plant 4% 33%
Other: 0% 0%
Power lines 4% 4%
Transformation stations 2% 7%
Gas pipelines 2% 2%
Power stations 5% 10%
Gas reduction and regulation 5% 5%
Pipelines 2% 2%
Processing stations 4% 20%
Compression stations 5% 5%
Storage wells 2% 20%
Regasification 4% 4%
Industrial and commercial equipment 1% 33%
Other assets 3% 25%
Other plant and equipment 2% 33%
On the contrary, land and art works are not depreciated insofar as they have an indefinite useful life.
At every annual or interim reporting date, the recognized carrying amount of the operating assets is tested for
impairment. If signs of impairments are present, the carrying amount of the asset is compared with its recoverable
amount, with the latter being the greater of fair value less the costs of disposal, and the associated value in use of the
asset (construed as the discounted value of the future cash flows originated by the asset). If the carrying amount is
higher than the recoverable amount, the difference is recognized in the income statement under “Net adjustments
to/recoveries on property, plant and equipment”. If the reasons for which impairment was recognized cease to exist, the
value of the asset is reversed. The adjusted value may not exceed the value that the asset would have had, net of the
depreciation calculated in the absence of previous impairment.
Newly acquired assets are depreciated as from the period in which they enter service and are, therefore, ready for use.
Land and buildings are considered to be separable assets; therefore, they are treated as separate assets for accounting
purposes, even if purchased together.
Each item of property, plant and equipment that has a significant value compared to the overall value of the asset it
belongs to is recognized and depreciated separately.
“Investment property” consists of real estate property held for investment purposes to be leased to third parties outside
the CDP Group. These assets are initially recognized in accordance with IAS 40 at purchase or construction cost,
including directly attributable purchase/construction costs. However, maintenance costs relating to these assets cannot
be capitalised, but are recognized in the income statement.
139
Half-yearly Financial Report 2018
Notes to the consolidated financial statements

Subsequent measurement of said property investments in the consolidated financial statements is at cost, net of
depreciation and impairment, as set out in IAS 16 in relation to operating property, plant and equipment.
“Assets under construction and advances” are composed of advances or expenses incurred in respect of items of
property, plant and equipment that have not been completed or are undergoing testing before entering service. Since
they have not yet entered the company’s production cycle, depreciation is suspended.
As regards property, plant and equipment recognized in accordance with IAS 2, these are measured at the lower of cost
and net realisable value, on the understanding that one nevertheless compares the carrying amount of the asset and its
recoverable amount, where there is some evidence that shows that the asset may have suffered an impairment loss. Any
adjustments are recorded through profit or loss.
The carrying value of an operating item of property, plant and equipment is eliminated from the balance sheet upon
disposal or when no future economic benefits are expected from its use or disposal.
7 - INTANGIBLE ASSETS
“Intangible assets” includes, pursuant to IAS 38, non-monetary assets that are identifiable and do not have physical
substance. They are held to be used for a multi-year period or an indefinite period. They consist mainly of concessions,
licenses and trademarks, contractual relationships with customers, research and development costs and industrial patent
and intellectual property rights.
Intangible assets include goodwill, regulated by IFRS 3 and defined as the difference between the price paid for a
transaction related to a business combination and the fair value of identifiable net assets acquired. If this difference is
negative (badwill) or if the goodwill is not justified by the future earnings capacity of the investee, the difference is
recognized in the income statement.
An intangible asset is recognized if the following conditions are satisfied:
the asset is identifiable, i.e. it is separable from the rest of the enterprise;
the asset is controlled, i.e. it is subject to the control of the enterprise;
the asset generates future economic benefits; the cost of the asset can be measured reliably.
If one of these elements is missing, the purchase or realisation cost is fully recognised as a cost in the income statement
in the financial year in which it is incurred.
Concessions, licenses, trademarks and similar rights arising from an acquisition are recognized at current values at the
date of the acquisition. The value of the storage concessions, determined as indicated by the Ministry for Productive
Activities (now the Ministry of Economic Development) in the decree of 3 November 2005, is recorded under the item
“Other assets” of intangible assets valued at cost. More specifically, trademarks are not amortised but they are tested for
impairment annually or more frequently if events or changes in circumstances indicate that they may be impaired.
Customer contracts arising from an acquisition are recognized at fair value as of the date of the acquisition. Contractual
rights are amortised over the expected life of the relationship. Research costs are expensed in the period in which they
are incurred. Costs for the development of new products and production processes are capitalised and recognized under
intangible assets only if all of the following conditions are met:
the project is clearly identified and the associated costs can be identified and measured reliably;
the technical feasibility of the project has been established;
there is a clear intention to complete the project and sell the intangible assets generated by the project;
a potential market exists or, in the case of internal use, the usefulness of the intangible asset has been established;
adequate technical and financial resources to complete the project are available.
The amortisation of any development costs recognized under intangible assets begins as from the date on which the
result of the project is ready for sale and is carried out on a straight-line basis.
The costs incurred for the acquisition of industrial patents and intellectual property rights are amortised on a straight-line
basis, allocating the acquisition cost over the shorter of the expected period of use and the term of the associated
contracts, as from the time the right acquired can be exercised.
If, regardless of the amortisation, there is objective evidence that the intangible asset is impaired, a test is performed to
determine the adequacy of the carrying value of the asset. Consequently, the carrying amount of the asset is compared
with its recoverable amount, with the latter being the greater of fair value less the costs of disposal, and the associated
value in use of the asset (construed as the discounted value of the future cash flows originated by the asset). If the
carrying amount is higher than the recoverable amount, the difference is recognised in the income statement under “Net
adjustments to/recoveries on intangible assets”. If the reasons for which impairment was recognised cease to exist, the
140 3. Half-yearly condensed consolidated financial statements at 30 June 2018

value of the asset is written back. The adjusted value may not exceed the value that the asset would have had, net of the
amortisation calculated in the absence of previous impairment.
Goodwill generated from the acquisition of subsidiaries is allocated to each identified cash generating unit (CGU). Within
the CDP Group, CGUs correspond to the individual legal entities. Since it is an intangible asset having an indefinite
useful life, goodwill is not amortised but tested only for the adequacy of its carrying amount. An impairment test is
performed annually on goodwill, or whenever there is evidence of impairment. This involves comparing the carrying
amount of goodwill and the recoverable amount of the CGUs to which the goodwill is attributed. If the carrying amount of
goodwill is higher than the recoverable value of the CGU, the difference is recognized in the income statement at “Net
adjustments to goodwill”. Any reversals of impairment of goodwill may not be recognized.
Goodwill related to investments in associated companies and joint ventures is included in the carrying amount of such
companies. Negative goodwill is recognized in the income statement at the time of the acquisition.
Intangible assets are derecognized when sold or when future economic benefits are no longer expected.
8 - NON-CURRENT ASSETS AND DISPOSAL GROUPS HELD FOR SALE
The balance sheet items “Non-current assets and disposal groups held for sale” and “Liabilities associated with disposal
groups held for sale” include the assets or groups of assets/liabilities whose carrying value will be recovered mainly
through sale rather than through their continuous use. Disposal processes have been initiated for these assets, whose
sale is deemed highly likely.
These non-current assets (or disposal groups) are presented separately from the balance sheet items “Other assets” and
“Other liabilities”. Initial recognition is done in compliance with the specific IFRS as applicable to each associated asset
and liability while, subsequently, they are recognized at the lower of their carrying value and fair value (the latter net of
costs to sell), without any depreciation/amortisation being envisaged.
The individual assets of the companies classified as held for sale are not amortised, whereas financial expense and
other expenses attributable to liabilities held for sale continue to be recognized. Any subsequent impairment losses are
recognized directly as an adjustment to the carrying amount of the non-current assets (or disposal groups) held for sale
through profit or loss. The corresponding balance sheet values for the previous financial year are not reclassified. A
discontinued operation is a component of an entity that either has been disposed of, or is classified as held for sale, and:
represents a major line of business or geographical area of operations;
is part of a single coordinated plan to dispose of a separate major line of business or geographical area of
operations;
is an investment exclusively acquired with a view to resale.
The profits and losses net of tax that can be related to disposal groups of assets and liabilities are shown in the specific
income statement item “Income (loss) after tax on discontinued operations”.
9 - CURRENT AND DEFERRED TAXES
Tax assets and liabilities are recognized in the consolidated balance sheet respectively under asset Item 110 “Tax
assets” and consolidated liability Item 60 “Tax liabilities”.
The accounting entries related to current and deferred taxes include: i) current tax assets, consisting of tax paid in
advance and receivables for withholding taxes incurred; ii) current tax liabilities, consisting of tax payables to be settled
according to applicable tax regulations; iii) deferred tax assets, consisting of the amounts of tax recoverable in future
years in view of temporarily deductible differences; and iv) deferred tax liabilities, consisting of payables for tax to be paid
in future periods as a result of taxable temporary differences.
Current taxes, consisting of corporate income tax (IRES) and regional tax on business activities (IRAP), are recognized
on an accruals basis using a realistic estimate of the negative and positive tax components for the year. They are
calculated on the basis of applicable tax rates.
Deferred tax assets and liabilities are recognized according to the tax rate that, under the legislation in force at the
reporting date, is expected to apply in the year when the asset is realised or the liability is settled, and are periodically
reviewed to take account of any changes in legislation.
The term “deferred” tax refers, in particular, to the recognition, in terms of tax, of the temporary differences between the
value assigned to an asset or liability for statutory accounting purposes and the corresponding value for tax purposes.
141
Half-yearly Financial Report 2018
Notes to the consolidated financial statements

Deferred taxes are recognized: i) under Tax assets, if they relate to “deductible temporary differences”, which means the
differences between statutory and tax values that will give rise to deductible amounts in future financial years, to the
extent that they are likely to be recovered; and ii) under Tax liabilities, if they relate to “taxable temporary differences”
representing liabilities because they are related to accounting entries that will become taxable in future tax periods.
If the deferred tax items regard transactions that directly affected equity, they are recognized in equity.
Some of the Group’s Italian companies joined the “national fiscal consolidation” mechanism regulated by articles 117-129
of the Consolidated Income Tax Law (“TUIR”), introduced into tax law by Italian Legislative Decree no. 344/2003. It
consists of an optional tax system, according to which aggregate net taxable income or loss of each subsidiary that has
joined the national fiscal consolidation mechanism – inclusive of any tax withholding, deductions and tax credits – is
transferred to the Parent Company, for which a single taxable income or a single tax loss is carried forward (resulting
from the algebraic sum of its income/losses and those of the subsidiaries) and, as a result, a single tax
payable/receivable.
10 - PROVISIONS FOR RISKS AND CHARGES
This item consists of the allowances set aside to cover specific types of liabilities whose existence is certain or probable,
but whose amount or accrual date were uncertain at the reporting date.
Therefore, the allowances are recognized only when:
there is a present (legal or constructive) obligation resulting from a past event;
it is probable that an outflow of resources embodying economic benefits will be required to settle the obligation;
a reliable estimate can be made of the amount of the obligation.
When the financial impact of the time factor is significant and the dates of payment of the obligation can be estimated
reliably, the allowance is measured as the present value (discounted at market rates as of the reporting date) of the
charges that are expected to be incurred in order to settle the obligation.
Contingent – not probable – liabilities are not provided for. However, they are disclosed in the notes, unless the
probability of an outflow of resources is remote or the event is deemed insignificant.
The allowances are used only to cover the costs for which they were originally recognized, and they are reversed in the
income statement when the obligation is settled or when it is no longer probable that an outflow of resources will be
required to settle the present obligation.
This item also includes provisions for credit risk for commitments to disburse funds and on financial guarantees that are
subject to the rules of impairment in IFRS 9.
This item also includes the company pensions plans and other post-retirement benefit obligations, i.e. the provisions for
long-term employment and post-employment benefits. However, no value has been recognized for the sub-account in
question because there were no net amounts attributable to that item at the reporting date of these financial statements.
For more information, see the content of the “Staff severance pay” in paragraph 16 “Other information”..
11 - FINANCIAL LIABILITIES MEASURED AT AMORTISED COST
This item includes all due to banks and due to customers of any kind (deposits, current accounts, loans) other than
those in item 20 “Financial liabilities held for trading” and in item 30 “Financial liabilities designated at fair value”. This
includes operating debts associated with the provision of business and financial services and variation margins with
clearing houses in respect of transactions on derivatives, in addition to operating debts associated with the provision of
financial services.
In particular, CDP includes in these items the amounts still to be disbursed for loans being repaid, as well as liabilities in
respect of postal funding products.
Postal savings bonds issued by CDP are reported under the item “Due to banks” and the item “Due to customers”,
including those that have matured but have not yet been redeemed at the reporting date. These instruments are zero-
coupon securities (where the interest accrued is paid when the principal is redeemed) with a step-up interest structure
(the interest rate increases as the period for which the bond is held increases) and with principal and interest redeemed
in a single payment upon maturity, although the bonds can be redeemed upon request of the underwriter at any time
prior to their contractual maturity, with principal and interest paid in accordance with the period for which the bond was
held. For Postal savings bonds, the adoption of the amortised cost method and of the effective interest rate used for
calculating the amortised cost under examination must be equal to the internal rate of return from the estimated (not
contractual) cash flows throughout the expected (and not contractual) life of the instrument. Given the aforementioned
option of early redemption, the expected life of postal savings bonds is, on average, less than their contractual life. CDP
142 3. Half-yearly condensed consolidated financial statements at 30 June 2018

has therefore developed a statistical model for forecasting early redemption of postal savings bonds based on a time
series of redemptions, which is used to price the new issues. The forecasting model used at the time of the bond issue is
also used to determine the initial estimated amortisation plan for each series of postal savings bonds. Based on these
estimated flows, the effective interest rate and the amortised cost to be recognized in the balance sheet are then
calculated. Differences between the actual early redemptions and these estimates result in an adjustment to the
remaining amortisation schedule. In such cases, the IFRSs state that the amortised cost of the instrument being
measured is to be equal to the present value of the new estimated future cash flows using the unchanging effective
interest rate calculated upon issuing each series of postal savings bonds as the discount rate. The effective rate for
floating-rate interest-bearing postal savings bonds is updated every time the estimated cash flows are revised due to
changes in the benchmark indices and the review of the flow of redemptions.
Financial liabilities measured at amortised cost also include the amount of funds provided by the State or other
government agencies and intended for particular operations required and regulated by special laws (“third-party funds in
administration”), provided that the loans and funds accrue interest respectively in favour of and at the expense of the
providing agency. However, funds administered on behalf of the State or other government agencies are not included
here if their management is exclusively remunerated by an all-in-one fee (commission) and that are, therefore, merely
seen as a service.
In addition, this item also includes issued securities issued measured at amortised cost. The item is reported net of
repurchased securities.
Financial liabilities measured at amortised cost are recognized for the first time on the date the raised funds are received
or the debt instruments are issued. These items are recognized at their fair value upon initial recognition. That value
normally corresponds to the amount received or the issue price, inclusive of the costs directly attributable to the
individual fund-raising operations or the costs incurred for the issue.
The financial liabilities are subsequently measured at amortised cost using the effective interest rate method, as defined
in the preceding paragraphs. An exception is represented by short-term financial liabilities, which are recognized at the
received value, given the negligible effect of the time factor.
In hybrid debt instruments (indexed to equity instruments, indices, foreign currencies, etc.) the embedded derivative is
separated from the host contract, when the criteria for separation under IFRS 9 apply, and is recognized at its fair value
under financial assets/liabilities held for trading (respectively positive or negative). The related changes in value are
recognized through profit or loss. The host contract is instead allocated an initial value corresponding to the difference
between the total amount of the proceeds received and the fair value allocated to the embedded derivative. The contract
is recognized and measured according to the criteria envisaged by the classification portfolio.
The amounts under the item “Due to banks”, “Due to customers”, and “Securities issued” are derecognized when they
mature or are extinguished. The derecognition also takes place when there is a repurchase of previously issued bonds,
with simultaneous recalculation of the residual payable only for the securities issued. The difference between the
carrying value of the liability and the amount paid to purchase it is recognized in the income statement.
12 - FINANCIAL LIABILITIES HELD FOR TRADING
This item includes all forms of financial liabilities (debt securities, loans, derivatives) designated as being held for trading
purposes. It excludes any portion of the company’s own issued debt securities that have not yet been placed with third
parties.
This category of liabilities includes, in particular, financial derivatives not designated under hedge accounting, operational
hedging derivatives, and also derivatives embedded in complex financial contracts, whose host contract is a financial
liability, which have been recognized separately if their fair value is negative.
The criteria for initial recognition and measurement of these derivatives are illustrated with reference to the same
instruments with positive fair value within the scope of Financial assets held for trading.
Financial liabilities are initially recognized at fair value, which generally equals the amount received net of transaction
costs or revenues. When the amount paid differs from fair value, a financial liability is nevertheless recognized at fair
value, and the difference between the two amounts is recognized through profit or loss. Initial recognition is made at the
contract date for derivative contracts and at the settlement date for debt securities, with the exception of those for which
delivery is not governed by conventions on the market concerned, for which initial recognition is at the subscription date.
Measurement after initial recognition is made at fair value, with recognition of the measurement results through profit or
loss. If the fair value of a financial liability becomes positive, it is recognized as a financial asset held for trading.
Financial liabilities held for trading are derecognized when the contractual rights to the cash flows expire or a sale
transfers all the risks and rewards connected with ownership to a third party. Conversely, when a prevalent share of the
143
Half-yearly Financial Report 2018
Notes to the consolidated financial statements
risks and rewards associated with the financial liability are retained, the liabilities remain on the balance sheet even if
official title has been transferred.
The gains and losses on sale or redemption and unrealized gains and losses resulting from changes in the fair value of
the trading portfolio are reported under “Profits (losses) on trading activities” in the income statement.
13 - FINANCIAL LIABILITIES DESIGNATED AT FAIR VALUE
This item includes financial liabilities, regardless of their technical form (debt securities, loans etc.), for which the fair
value option has been exercised (Fair Value Option) in accordance with the requirements established by IFRS 9 for
classification in this item.
This classification is made when one of the following conditions applies:
the designation eliminates or significantly reduces a measurement or recognition inconsistency (i.e. an accounting
mismatch) that would otherwise arise from the measuring of assets or liabilities or from the recognition of gains or
losses on different bases;
a group of financial liabilities, or a group of financial assets and liabilities is managed and the performance is
evaluated on a fair value basis, in accordance with a documented risk management or investment strategy.
the liabilities consist of hybrid instruments containing embedded derivatives that would otherwise have been
separated (however, this rule does not apply if the embedded derivative is insignificant or if the separation of the
embedded derivative cannot be applied).
As regards issued debt securities, these financial liabilities are recognized for the first time on the date of issue.
Initial recognition is at fair value, which generally equals the amount collected, without considering the transaction
expenses and income attributable to the instrument issued, which are instead recognized in the income statement.
Subsequent to initial recognition, these financial liabilities are measured at fair value and charged as follows:
the change in fair value that is attributable to changes in its creditworthiness is recognised in the statement of
comprehensive income and recorded in the item Valuation reserves.
the residual amount of change in fair value is recognised through profit or loss.
Financial liabilities at fair value are derecognized from the balance sheet when the contractual rights to the related
cash flows expire or when the financial liability is sold, transferring substantially all risks and rewards connected with
it.
14 – TRANSACTIONS IN A FOREIGN CURRENCY
Transactions in a foreign currency are initially recognized in euros by translating the amount in the foreign currency into
euros at the spot exchange rate prevailing on the date of the transaction.
In preparing the annual or interim financial statements, assets denominated in a foreign currency are accounted for as
follows:
monetary instruments are translated at the spot rate quoted on the reporting date.
non-monetary instruments, which are carried at cost, are translated at the exchange rate quoted on the date of the
original transaction;
non-monetary instruments, which are carried at fair value, are translated at the spot rate quoted on the reporting
date.
Exchange rate differences in respect of non-monetary items are treated using the same rules for gains and losses on the
original instruments.
The positive and negative exchange rate differences, relating to:
financial assets and liabilities denominated in foreign currencies, other than those measured at fair value and
those subject to fair value hedges (exchange rate or fair value risk) and cash flow hedges (exchange rate risk),
as well as the related hedging derivatives are included in Profits (losses) on trading activities. This item also
includes the results of fair value measurement of any forward contracts associated with foreign currency
transactions concluded for hedging purposes, net of the accrued contractual margins recognized in interest with
the relevant + or - sign;
financial assets and liabilities denominated in foreign currencies measured at fair value are included in the
Profits (losses) on financial assets and liabilities measured at fair value through profit or loss;
144 3. Half-yearly condensed consolidated financial statements at 30 June 2018

financial assets and liabilities denominated in foreign currencies, subject to fair value hedge (exchange rate or
fair value risk) and relating to hedging derivatives are included in the results of related measurements
recognized in Fair value adjustments in hedge accounting.
15 - INSURANCE ASSETS AND LIABILITIES
Insurance assets include amounts in respect of risks transferred to reinsurers under contracts governed by IFRS 4 and
are classified on the balance sheet under item 80 Reinsurers’ share of technical provisions. Reinsurers’ share of
technical provisions are determined on the basis of the existing contracts/treaties, in accordance with the same criteria
used for quantifying the technical provisions, unless a different valuation is deemed appropriate in consideration of the
recoverability of the receivable.
Insurance liabilities represented by technical provisions are classified under item 110 Technical provisions. In
accordance with IFRS 4, they may continue to be accounted for in line with local GAAP. A review of the contracts written
by the Group insurance companies found that they all qualify as insurance contracts. Technical provisions also include
any accruals made necessary by the liability adequacy test. Provisions for outstanding claims do not include
compensation and equalisation provisions as they are not permitted under the IFRS. Provisions continued to be
accounted for in compliance with the accounting standards adopted prior to IFRS, as all the existing policies fall within
the scope of IFRS 4 (insurance contracts) and, specifically, this item includes:
the provision for unearned premiums, which comprises two sub-items: provision for premium instalments,
determined on a pro rata basis, pursuant to Article 45 of Italian Legislative Decree no. 173 of 26 May 1997 and the
provision for current risks, composed of the amounts to be set aside to cover claims and expenses that exceed the
provision for premium instalments on existing contracts for which no claims arose at year-end, to meet the liability
adequacy test requirements imposed by IFRS 4;
the provision for outstanding claims, which includes the net accruals for claims reported but not yet paid on the basis
of the forecast cost of the claim, including settlement and management expenses. The provisions for outstanding
claims are determined on the basis of an estimate of the ultimate cost of covering charges relating to the indemnity
paid, direct costs and payment for each individual claim.
16 - OTHER INFORMATION
Other assets
Inventories
Inventories, including compulsory stock, are stated at the lower of their purchase or production cost and their net
realisable value, represented by the amount that the business expects to obtain from their sale in the normal course of its
activities. Cost is measured as the weighted average cost. The net realisable value is the selling price in the ordinary
course of business less the estimated completion costs and those necessary to sell the good. Work in progress and
semi-finished goods are valued at production cost, excluding financial charges and overheads. Sales and purchases of
strategic gas do not generate an actual transfer of the risks and rewards associated with ownership and, therefore, do
not result in changes in inventory.
Contract work in progress
The gross amount due from contract work in progress is shown in the balance sheet assets. When the revenues and
costs related to contract work can be reliably estimated, the related contract work costs and revenues are recognized
separately in the income statement on a percentage of completion basis. Progress is measured based on the work
carried out and measured proportionally to the costs of contracts incurred up to the reporting date and estimated costs of
the total contract. Differences between the value of completed contracts and payments on account received are
recognized under balance sheet assets or liabilities, considering any impairment losses on the work carried out so as to
take into account the risks of customers’ refusal to recognize the work performed. Expected contract losses are
recognized immediately.
Contract costs include all those costs that relate directly to the specific contract, as well as fixed and variable costs
incurred by Group companies as part of normal operations.
145
Half-yearly Financial Report 2018
Notes to the consolidated financial statements

Capitalised borrowing costs
Borrowing costs directly attributable to the acquisition, construction or production of an asset that qualify for capitalisation
are capitalized as part of the cost of the asset. The qualifying assets (property, plant and equipment and intangible
assets) involved are those that require at least one year before being ready for use. The directly attributable financial
expenses are those that would not have been incurred if the expense for that asset had not been incurred.
Where funds are borrowed specifically, costs eligible for capitalisation are the actual financial expense incurred for that
financing, less any income earned on the temporary investment of such borrowings. In regard to the general pool of
assumed debt, the amount of financial expenses that can be capitalised is determined by applying a capitalisation rate to
the expenses incurred for that asset which corresponds to the weighted average of the borrowing costs applicable to the
general pool, excluding any specifically borrowed funds. The amount of borrowing costs capitalised during a financial
year shall in any case not exceed the amount of borrowing costs incurred during that year.
The starting date of capitalisation is the date on which all of the following conditions were met for the first time: (a) the
costs for the asset were incurred; (b) the financial expenses were incurred; and (c) the activities necessary to prepare the
asset for its intended use or for sale were undertaken.
Capitalisation of the financial expenses ceases when the activities necessary to prepare the asset for its intended use or
sale are substantially complete.
Other liabilities
Staff severance pay
Staff severance pay (TFR) covers the entire entitlement accrued by employees at the end of the period, as provided by
law (Article 2120 of the Italian Civil Code) and applicable employment agreements.
In accordance with IAS 19, staff severance pay is treated as a “Post-employment benefit” and is classified as:
a “Defined benefit plan” for the portion of staff severance pay accrued by employees until 31 December 2006;
a “Defined contribution plan” for the portion of staff severance pay accrued by employees beginning 1 January 2007.
The accounting standard envisages that these portions of staff severance pay be recognised at their actuarial value. The
accruing and accrued obligations are considered for discounting purposes (these obligations are, respectively, the
discounted value of the expected future payments related to benefits accrued during the current financial year and the
discounted value of future payments resulting from amounts accrued in previous financial years).
It should be noted that a number of CDP Group companies with a small number of employees and an immaterial staff
severance pay amount continued to report that liability as calculated on the basis of Italian statutory provisions (Article
2120 of the Italian Civil Code), given the immateriality of the effects of adopting IAS 19.
Other income statement items
Interest income and expense
Interest income and expense is recognized in the income statement, on a pro-rated basis over time for all instruments,
based on the contractual interest rate or at the effective interest rate if the amortised cost method is applied.
Default interest, where provided for by contract, is recognized in the income statement only when it is actually received.
The interest also includes the net balance, either positive or negative, of the differentials and margins relating to the
financial derivative instruments hedging assets and liabilities that generate interest, and derivatives recognized in the
balance sheet in the trading book but operationally related to assets and/or liabilities designated at fair value option.
Commission income and expense
Commission income for revenues from services provided and commission expense for the costs of services received are
recognized, based on the existence of contractual agreements, on an accrual basis, i.e. in the periods when the services
are provided.
146 3. Half-yearly condensed consolidated financial statements at 30 June 2018

This item also includes the commissions received from guarantees issued in favour of third parties, and commissions
paid for guarantees received.
When the amortised cost method is used, the commissions considered in calculating the effective interest rate are
recognised instead as interest.
Dividends
As previously described, the dividends received from unconsolidated investees are recognized as income in the financial
year in which they are approved for distribution.
The dividends from companies accounted for using the equity method reduce the carrying value of the equity
investments.
Share-based payments
These are payments to employees as consideration for their work services performed. When specific conditions are met,
the cost of employee service is remunerated through stock option plans, whose value is measured according to the fair
value of the options granted to employees at the grant date.
The fair value of options granted is recognized in the income statement, under the item “Staff costs” over the vesting
period, with a corresponding increase in equity, considering the best possible estimate of the number of options that
employees will be able to exercise. That estimate is revised where subsequent information indicates that the expected
number of equity instruments that will vest differs from the estimate previously carried out, independently of market
conditions.
The measurement method used to calculate fair value considers all the characteristics of the options (term, price and
conditions for exercise, etc.), as well as the value of the underlying security at the grant date, volatility and the yield curve
at the grant date, in line with the duration of the plan.
At maturity, the estimate is revised and recognized in the income statement to register the amount corresponding to the
number of equity instruments that have effectively vested, independently of whether market conditions have been met.
Grants
Capital grants provided by public entities are recognized when there is reasonable certainty that the conditions
established by the granting authorities for obtaining the grant will be met. Their recognition reduces the purchase or
transfer price or the production cost of the asset they refer to. Similarly, capital grants received from private parties are
accounted for in accordance with the same accounting policies.
Grants for operating expenses can be recognized through profit or loss on an accruals basis when the related costs are
incurred or, alternatively, in full when the conditions for their recognition have been met.
With particular reference to connection fees for private users, the remuneration component for the initial installation
investment amount is recognized as a revenue to be deferred over the useful life of the asset to which it refers, with a
balancing entry among other liabilities.
Revenue recognition
The revenue is recognized in such a way as to accurately represent the process of transfer of goods and services to
customers in an amount that reflects the consideration that one expects to receive in exchange for supplied goods and
services, using a model consisting of five basic steps:
step 1: identify the contract with the customer;
step 2: identify the contractual obligations, noting the separable goods or services as separate obligations;
step 3: determine the price of the transaction, i.e. the amount of the consideration that one expects to receive;
step 4: allocate the transaction price to each obligation identified in the contract based on the sale price of each
individual separable item of goods or services;
step 5: recognise the revenue when (or if) each contractual obligation is fulfilled through the transfer of the good or
service to the customer, i.e. when the customer obtains control of the good or service.
The revenues from fees for the use of the National Transmission Grid (NTG) are determined on the basis of the rates set
by the Italian Authority for Electricity and Gas.
147
Half-yearly Financial Report 2018
Notes to the consolidated financial statements
Payments collected on behalf of third parties, such as fees for other non-Group grid owners, as well as fees recognized
for the balancing of the national electrical energy system, which do not increase equity, are shown net of the related
costs.
Net premium income
This macro-item includes accrued premiums in respect of contracts classifiable as insurance contracts pursuant to IFRS
4 and investment contracts with discretionary participation in profits considered equivalent to insurance contracts by
IFRS 4.
Insurance contracts comprise all contracts under which one party (the insurer) accepts significant insurance risk from
another party by agreeing to compensate the other party (the policyholder or other beneficiary) if a specified uncertain
future event adversely affects the policyholder or the other beneficiary.
All contracts written by the Group can be classified as insurance contracts pursuant to IFRS 4. Premiums are reported
net of cessions in reinsurance.
Emission rights
Costs relating to emission rights, determined on the basis of market prices, are recorded solely for the amount of carbon
dioxide emissions exceeding the allocated emission rights. Costs relating to the purchase of emission rights are
capitalised and recorded among intangible assets net of any negative balance between emissions and allocated rights.
Proceeds relating to emission rights are recorded at the moment of their realisation through the sale of rights. In the
event of sale, any purchased emission rights are understood to have been sold first. Cash credits allocated instead of the
free allocation of emission rights are recorded in “Other income” in the income statement.
Business combinations
A business combination involves the transfer of control over a business activity or, more generally, a company.
Business combinations are recognized in accordance with the acquisition method, by which the assets transferred and
liabilities assumed by the CDP Group at the business combination acquisition date are recognized at fair value.
Transaction costs are generally recognised in the income statement when those costs are incurred or the services are
rendered.
For newly acquired companies, if the initial values for a business combination are incomplete by the end of the reporting
period in which the combination occurs, the CDP Group reports in its consolidated financial statements provisional
amounts for the item for which the accounting is incomplete.
In accordance with IFRS 3, paragraphs 45 ff., within twelve months of the acquisition date, the differences resulting from
the business combination have to be allocated by recognizing the fair value at the acquisition date of the identifiable
assets acquired and liabilities assumed. The following items are an exception and are measured in accordance with their
applicable standard:
deferred tax assets and liabilities;
assets and liabilities for employee benefits;
liabilities or equity instruments related to share-based payment transactions involving shares of the acquiree or
share-based payment transactions involving shares of the Group issued in replacement of contracts of the acquiree;
assets held for sale and discontinued operations.
Goodwill is determined as the excess of the aggregate of the consideration transferred in the business combination, the
amount of any non-controlling interest in the acquiree, and the fair value of any equity interest previously held by the
acquirer in the acquiree over the fair value at the acquisition date of the net assets acquired and the liabilities assumed. If
the fair value at the acquisition date of the net assets acquired and the liabilities assumed exceeds the aggregate of the
consideration transferred, the amount of any non-controlling interest in the acquiree, and the fair value of any equity
interest previously held by the acquirer in the acquiree, the excess is recognized in the income statement as a gain from
the transaction.
After initial recognition, the goodwill acquired for consideration in a business combination is tested for impairment once
annually or whenever there is evidence of impairment. For newly acquired companies, the difference between the
acquisition price and equity is provisionally recognised as goodwill, if positive, or under liabilities if negative, net of
goodwill, if any, recognized in the financial statements of the acquirees.
At the acquisition date, non-controlling interests are measured at fair value or as a proportionate share of the recognised
amounts of the acquiree’s identifiable net assets. The measurement method is selected on a transaction basis.
148 3. Half-yearly condensed consolidated financial statements at 30 June 2018

Any contingent consideration provided in the business combination is measured at the acquisition-date fair value and
included in the amount of the consideration transferred in the business combination for the purposes of calculating
goodwill. Any subsequent changes in that fair value, which qualify as adjustments occurring during the measurement
period, are included in goodwill retrospectively. Changes in fair value that can be considered as measurement-period
adjustments are those prompted by new information about facts and circumstances that existed at the acquisition date,
that has been obtained during the measurement period (which shall not exceed one year from the business
combination).
In the case of business combinations achieved in stages, the equity interest previously held by the Group in the acquiree
is revalued at the fair value at the date control was acquired and any resulting gain or loss is recognized through profit or
loss. Any changes in the value of the previously held equity investment that had been recognized in other comprehensive
income are reclassified to the income statement as if the equity investment had been sold. If the initial accounting for a
business combination is incomplete by the end of the reporting period in which the combination occurs, the CDP Group
shall report in its financial statements provisional amounts for the items for which the accounting is incomplete. During
the measurement period, the Group shall adjust the provisional amounts to reflect new information obtained about facts
and circumstances that existed at the acquisition date and that, if known, would have affected the measurement of the
amounts recognized at that date.
Business combinations do not include those transactions aimed at obtaining control of one or more companies that do
not constitute a business activity or if the business combination is carried out with reorganisation purposes, and thus
between two or more entities already belonging to the same Group, and which do not cause changes in the control
structure independently of the percentage of non-controlling interests before and after the transaction (referred to as
“business combination under common control”). These transactions are in fact considered to have no economic
substance.
Disclosure of transfers between portfolios of financial assets
There were no transfers between portfolios of financial assets.
Disclosures on fair value measurement
QUALITATIVE DISCLOSURES
This section contains the disclosures on fair value measurement in accordance with the requirements of IFRS 13.
Fair value is the price that would be received to sell an asset or paid to transfer a liability in an orderly transaction
between market participants at the measurement date. The assumption is that this refers to an ordinary transaction
between independent counterparties that have a reasonable degree of knowledge of market conditions and the relevant
facts related to the item being traded.
In the definition of fair value, a key assumption is that an entity is fully operational and does not have the urgent need to
liquidate or significantly reduce a position. Among other factors, the fair value of an instrument reflects its credit quality as
it incorporates the default risk associated with the counterparty or the issuer.
The international accounting standards have established three levels of classification for a financial instrument (known as
the “hierarchy of fair value”); the level of fair value measurement assigned depends on the observability and significance
of the inputs used in the valuation model.
For financial instruments listed on active markets, fair value corresponds to the market price at the measurement date, or
as close to it as possible (Level 1). An instrument is considered to be traded on an active market if prices are readily and
regularly available on regulated markets, organised trading facilities, pricing services, etc. and if those prices can
reasonably be considered to be representative of actual and regular market transactions executed close to the valuation
date. When there are no published prices on an active market or when, in reference to several indicators (e.g. the
possibility of performing transactions at the quoted price and their number, the bid-ask spread, the effective trading
volumes), it cannot be held that the price represents an active and regularly functioning market, the fair value of the
financial instruments is determined by using measurement models and techniques whose purpose is to establish the
price at which the asset or liability would be exchanged between market operators in an arm’s length transaction at the
valuation date. The fair value of unlisted financial instruments is classified under Level 2 or 3 according to whether or not
the inputs used in the valuation model are observable and their significance within that model.
149
Half-yearly Financial Report 2018
Notes to the consolidated financial statements

The Level 2 inputs are prices available on active markets or inputs based on observable market data, such as interest
rates, credit spreads, or yield curves. If they are used in the pricing of an instrument, they must be available for the entire
residual life of the instrument. The fair value of a financial instrument measured with techniques that use Level 2 inputs is
classified in the same level for the fair value hierarchy.
The level 2 inputs may need to be adjusted to enable their use, also in view of the characteristics of the financial
instrument being measured. If the adjustment is made on the basis of parameters that cannot be observed in the market
or is impacted to a greater or a lesser extent by the modelling choices needed to make it (through the use of statistical or
“expert-based” techniques by those carrying out the measurement), the fair value measurement is classified under Level
3, if the inputs are not observable in the market or not directly available. This category also includes the parameters
estimated on the basis of proprietary models or historic data and used for the fair value measurement of unlisted financial
instruments, classified under the same level.
The valuation techniques used for Level 2 and Level 3 measurements are validated by the Risk Management Area of
CDP. The development and validation of the techniques, and their application for accounting evaluations, are set out in
specific process documentation.
Fair value levels 2 and 3: valuation techniques and inputs used
The valuation techniques used for unlisted financial instruments may, in addition to interpolations and extrapolations,
involve the specification of stochastic processes that represent market dynamics and the use of simulations or other
numerical techniques to determine the fair value of the instruments being measured.
The CDP Group takes the following into consideration when selecting the valuation models:
simpler valuation techniques are preferred to more complex techniques, all other conditions being equal and as long
as they represent all of the relevant characteristics of the product, ensuring that they are reasonably in line with the
practices and results of other sector operators;
valuation techniques are applied consistently over time to consistent categories of instruments, unless objective
grounds for replacement emerge;
all other conditions being equal, preference is given to standard models whose mathematical structure and
implementing procedures are familiar to practitioners and implemented in the CDP Group's systems.
The market parameters used as inputs for Level 2 valuations are selected on the basis of non-arbitrage relationships or
comparative relationships that define the fair value of the financial instrument being measured as the relative fair value
compared with that of financial instruments listed on active markets.
Specifically, the financial statements of the CDP Group use fair value measurements assigned to Level 2 for bonds
receivable or payable whose measurement depends exclusively on observable market parameters, and for the
measurement of interest rate, currency, and plain vanilla equity derivatives designated as accounting or operational
hedges for assets or liabilities and of the items relating to the exchanges of collateral referring to them.
The CDP Group has developed a reference framework for derivative contracts and bonds. This framework is composed
of the valuation criteria and models on which the valuation of each category of instruments is based.
The fair value of derivatives incorporates the counterparty credit risk and current and potential exposure using a
simplified credit value adjustment (CVA) methodology. However, in view of the generalised use of framework netting
arrangements that provide for the exchange of collateral, and considering the frequency of exchange of the collateral and
the fact that it is established in the form of cash deposits, as well as the minimum ratings required from the
counterparties, no adjustments of this kind have been made at 30 June 2018. With regard to the embedded derivatives in
postal savings bonds which are separated out, the adjustment for the joint credit risk of CDP and the Italian Government
is considered to be nil. An adjustment of this type, if made, would result in a reduction in the fair value of those liabilities.
With regard to the assets and liabilities measured at fair value on a recurring basis, the following are classified as Level 3
in the financial statements of CDP Group:
the valuations of options on equity indices embedded in certain categories of postal savings bonds, which are
separated and measured at fair value through profit or loss and require the use of parameters concerning the
redemption behaviour of investors;
the valuations of financial assets not quoted on active markets that fail the SPPI test;
certain bonds whose valuation depends on the conditions of use by CDP established from time to time and/or spreads
that are not directly observable or representative of the creditworthiness of the issuer/debtor;
equity interests and other unlisted equity instruments that are measured using non-market parameters.
150 3. Half-yearly condensed consolidated financial statements at 30 June 2018

Valuation processes and sensitivity
Description of the valuation process for the fair value measurement of instruments classified at Level 3 of the hierarchy of fair value inputs
Level 3 valuation techniques are also applied consistently over time to consistent categories of instruments, unless
objective grounds for replacement emerge. Similarly, parameters that cannot be drawn directly from observable market
variables are applied consistently over time.
The methods and processes adopted by the CDP Group aim to ensure that the value assigned to each position
appropriately reflects their current fair value, with a level of detail for the checks proportional to the quantitative
significance of the assets and liabilities measured.
The reference framework that comprises the valuation criteria and models on which the valuation of each category of
instrument is based is set out in methodological documents updated on half-yearly basis by the Market Risk and ALM
department, within the Risk Management Area. The valuations are performed through internal systems used by CDP for
the management of securities and derivatives and subject to standard controls. The valuation process and related
controls are subject to third-level checks on a regular basis.
Description of non-observable inputs used in the valuation process for the fair value measurement on a recurrent basis of instruments classified at Level 3 and the sensitivity of the fair value to changes in those inputs
Fair value measurements for which significant non-observable inputs are used (Level 3), a sensitivity analysis is
conducted to obtain a range of possible and reasonable alternative valuations. In general, the impact of unobservable
inputs on the Level 3 fair value measurement depends on the interaction between the various inputs used in the
valuation process.
Redemption profiles
The redemption profile of postal savings bonds is a central estimate of the nominal amount of the bonds that will be
redeemed within a series of future dates, between the valuation date and the final maturity date. The estimate is made by
the CDP Group through statistical analyses and expert-based valuations. This non-observable figure is significant for the
Level 3 measurement of the fair value of the options separated out from the postal savings bonds linked to the
performance of the Dow Jones Euro Stoxx 50 index. If the investor asks for early redemption of the bond, they lose the
entitlement to receive any component of remuneration linked to the index and, as a result, the equity option granted
lapses. For this category of financial instruments, higher redemptions therefore result in a lower value of liabilities for the
Parent Company. Although the redemption profiles are non-observable inputs on the market, the changes in those
profiles over time are closely linked to the changes in actual redemptions observed.
The sensitivity analysis considered changes of 10% in the remaining principal, applied to the relevant expected
percentage for the expiry of each option. If redemptions are lower than estimated, a condition has been established that
the current level of remaining principal shall not be exceeded.
Equity multiple
Equity investments in unlisted companies are valued by applying a multiplication factor to the equity in line with what is
estimated would be applied for a market transaction. At 30 June 2018, all the multiples, set based on expert appraisal,
were 100%. Given that this parameter acts directly on the final fair value in a proportional manner, no sensitivity analysis
has been reported.
NAV Adjustment
The Net Asset Value (NAV) is the difference between the total value of a fund’s assets and liabilities. An increase in NAV
coincides with an increase in fair value. For funds classified in Level 3, fair value adjustments may be needed to take
account of certain specific characteristics; such adjustments would result in a transaction being priced below NAV. At 30
June 2018 adjustments of this kind were made to the NAVs of some collective investment undertakings held in the
portfolio determined on the basis of expert appraisal, taking into account the characteristics of limited liquidity of the
units.
151
Half-yearly Financial Report 2018
Notes to the consolidated financial statements

Hierarchy of fair value
IFRS 13 requires the provision of a description, with regard to the financial and non-financial assets and liabilities
measured at fair value on a recurring basis, of the policy for determining when transfers between levels of the fair value
hierarchy are deemed to have occurred separately for financial assets and liabilities and non-financial assets and
liabilities (IFRS 13, paragraph 95). For all classes of assets and liabilities, the policies adopted by CDP require that the
transfer from one level to another take place at the end of the reporting period.
The transfers are motivated by whether it becomes possible or impossible to reliably measure fair value, respectively, at
Level 1, Level 2 or Level 3: for example, if the measurement of an instrument is classified as “Level 3” due to the non-
observability of a significant input, if that input becomes observable in the market or if it becomes common to use a
model that requires only observable inputs, or its estimate is not necessary then the measurement is transferred to Level
2, and the transfer occurs at the end of the reporting period.
152 3. Half-yearly condensed consolidated financial statements at 30 June 2018
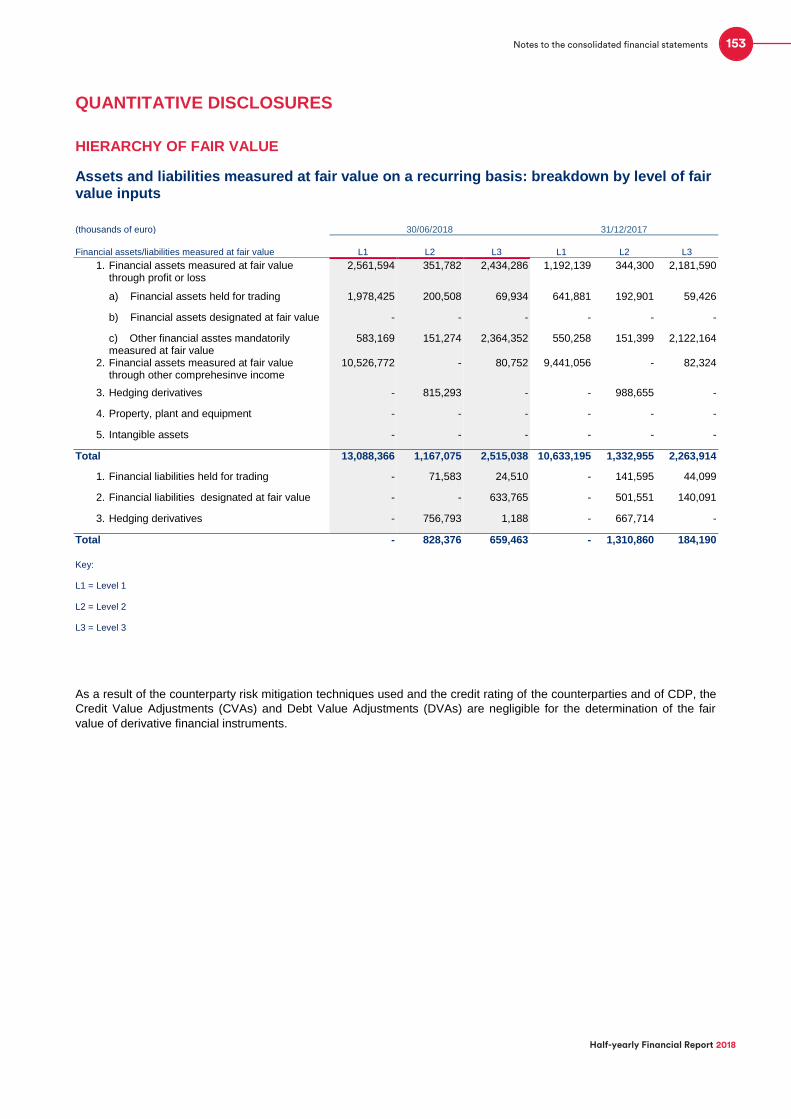
QUANTITATIVE DISCLOSURES
HIERARCHY OF FAIR VALUE
Assets and liabilities measured at fair value on a recurring basis: breakdown by level of fair value inputs
(thousands of euro) 30/06/2018 31/12/2017
Financial assets/liabilities measured at fair value L1 L2 L3 L1 L2 L3
1. Financial assets measured at fair value through profit or loss
2,561,594 351,782 2,434,286 1,192,139 344,300 2,181,590
a) Financial assets held for trading 1,978,425 200,508 69,934 641,881 192,901 59,426
b) Financial assets designated at fair value - - - - - -
c) Other financial asstes mandatorily measured at fair value
583,169 151,274 2,364,352 550,258 151,399 2,122,164
2. Financial assets measured at fair value through other comprehesinve income
10,526,772 - 80,752 9,441,056 - 82,324
3. Hedging derivatives - 815,293 - - 988,655 -
4. Property, plant and equipment - - - - - -
5. Intangible assets - - - - - -
Total 13,088,366 1,167,075 2,515,038 10,633,195 1,332,955 2,263,914
1. Financial liabilities held for trading - 71,583 24,510 - 141,595 44,099
2. Financial liabilities designated at fair value - - 633,765 - 501,551 140,091
3. Hedging derivatives - 756,793 1,188 - 667,714 -
Total - 828,376 659,463 - 1,310,860 184,190
Key:
L1 = Level 1
L2 = Level 2
L3 = Level 3
As a result of the counterparty risk mitigation techniques used and the credit rating of the counterparties and of CDP, the
Credit Value Adjustments (CVAs) and Debt Value Adjustments (DVAs) are negligible for the determination of the fair
value of derivative financial instruments.
153
Half-yearly Financial Report 2018
Notes to the consolidated financial statements

Change for the period in financial assets measured at fair value on a recurring basis (Level 3)
Financial assets measured at fair value through profit or loss
Financial assets
measured at fair value
through other comprehesinve
income
Hedging derivatives
Property, plant and
equipment
Intangible assets
Total
of which: a) Financial
assets held for trading
of which: b) Financial assets
designated at fair value
of which: c) Other
financial asstes
mandatorily measured at
fair value
(thousands of euro)
1 Opening balance 2,181,590 59,426 - 2,122,164 82,324 - - -
Change in opening balance
(25,836) - - (25,836) - - - -
2 Increases 436,870 11,057 - 425,813 652 - - -
2.1 Purchases 371,305 10,998 - 360,307 - - - -
2.2 Profits taken to: 27,839 59 - 27,780 652 - - -
2.2.1 Income statement
27,839 59 - 27,780 - - - -
2.2.2 Equity - X X X 652 - - -
2.3 Transfers from other levels
- - - - - - - -
2.4 Other increases 37,726 - - 37,726 - - - -
3. Decreases 158,338 549 - 157,789 2,224 - - -
3.1 Sales 25,151 549 - 24,602 - - - -
3.2 Repayments 90,995 - - 90,995 1,824 - - -
3.3 Losses taken to: 42,192 - - 42,192 - - - -
3.3.1 Income statement
42,192 - - 42,192 - - - -
3.3.2 Equity - X X - - - - -
3.4 Transfers from other levels
- - - - - - - -
3.5 Other decreases - - - - 400 - - -
4. Closing balance 2,434,286 69,934 - 2,364,352 80,752 - - -
154 3. Half-yearly condensed consolidated financial statements at 30 June 2018

Change for the period in financial liabilities measured at fair value on a recurring basis (Level 3)
Financial liabilities held for trading
Financial liabilities designated at fair value
Hedging derivatives
(thousands of euro)
1 Opening balance 44,099 140,091 -
Change in opening balance - 1,321 -
2. Increases 2,905 500,556 1,188
2.1 Issues - - -
2.2 Losses taken to: 2,705 185 -
2.2.1 Income statement 2,705 - -
2.2.2 Equity X 185 -
2.3 Transfers from other levels - 499,863 -
2.4 Other increases 200 508 1,188
3. Decreases 22,494 6,882 -
3.1 Repayments 14,992 6,735 -
3.2 Buybacks - - -
3.3 Profits taken to: 7,502 147 -
3.3.1 Income statement 7,502 147 -
3.3.2 Equity X - -
3.4 Transfers from other levels - - -
3.5 Other decreases - - -
4. Closing balance 24,510 633,765 1,188
Disclosure of day one profit/loss
The carrying amount of financial instruments on recognition is equal to their fair value at the same date.
In the case of financial instruments other than those measured at fair value through profit or loss, the fair value at the
recognition date is normally assumed to be equal to the amount received or paid.
In the case of financial instruments measured at fair value through profit or loss classified as Level 3, any difference with
respect to the amount received or paid could in principle be recognised through profit or loss under the appropriate items,
generating a “day one profit/loss”.
Such difference may only be recognised through profit or loss if it is generated by a change in the factors on which
market participants base their valuations in determining prices (including the time effect).
If the instrument has a specified maturity and a model that monitors changes in the factors on which operators base
prices is not immediately available, the day one profit/loss can be recognised through profit or loss over the life of the
financial instrument.
CDP has not recognised any “day one profit/loss” on financial instruments in accordance with the provisions of IFRS 7.28
and other related IFRS provisions.
155
Half-yearly Financial Report 2018
Notes to the consolidated financial statements
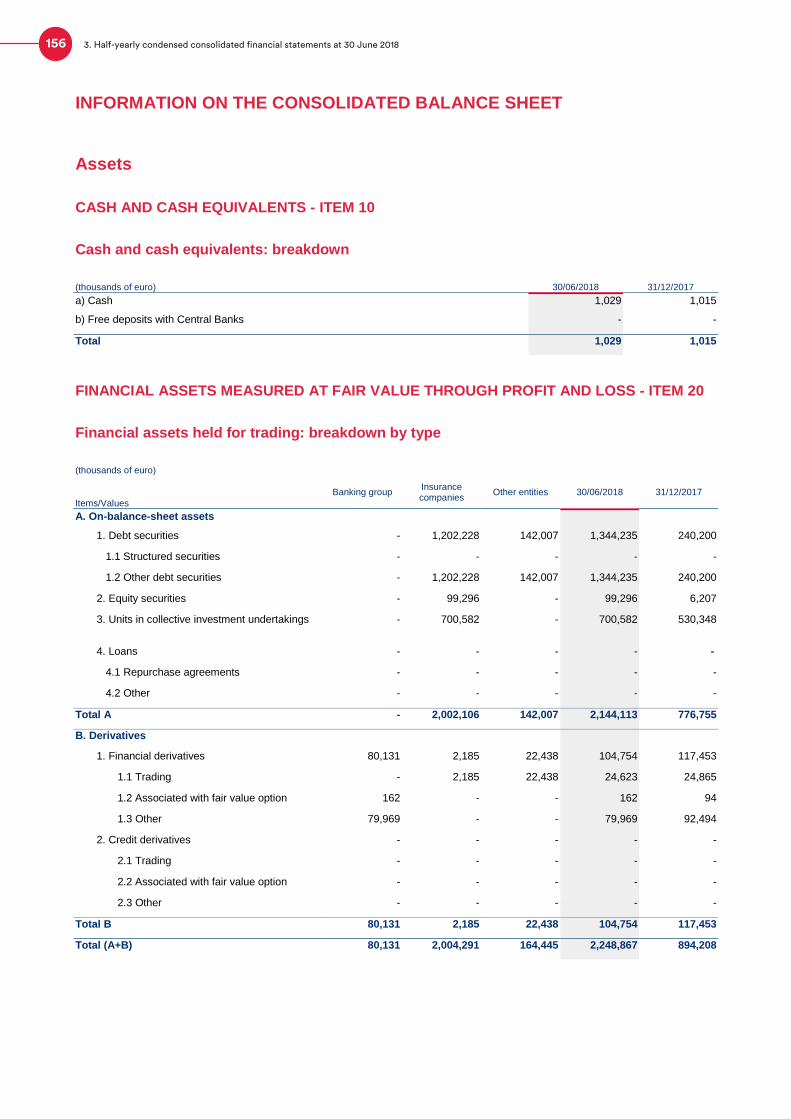
INFORMATION ON THE CONSOLIDATED BALANCE SHEET
Assets
CASH AND CASH EQUIVALENTS - ITEM 10
Cash and cash equivalents: breakdown
(thousands of euro) 30/06/2018 31/12/2017
a) Cash 1,029 1,015
b) Free deposits with Central Banks - -
Total 1,029 1,015
FINANCIAL ASSETS MEASURED AT FAIR VALUE THROUGH PROFIT AND LOSS - ITEM 20
Financial assets held for trading: breakdown by type
(thousands of euro)
Items/Values
Banking group Insurance companies
Other entities 30/06/2018 31/12/2017
A. On-balance-sheet assets
1. Debt securities - 1,202,228 142,007 1,344,235 240,200
1.1 Structured securities - - - - -
1.2 Other debt securities - 1,202,228 142,007 1,344,235 240,200
2. Equity securities - 99,296 - 99,296 6,207
3. Units in collective investment undertakings - 700,582 - 700,582 530,348
4. Loans - - - - -
4.1 Repurchase agreements - - - - -
4.2 Other - - - - -
Total A - 2,002,106 142,007 2,144,113 776,755
B. Derivatives
1. Financial derivatives 80,131 2,185 22,438 104,754 117,453
1.1 Trading - 2,185 22,438 24,623 24,865
1.2 Associated with fair value option 162 - - 162 94
1.3 Other 79,969 - - 79,969 92,494
2. Credit derivatives - - - - -
2.1 Trading - - - - -
2.2 Associated with fair value option - - - - -
2.3 Other - - - - -
Total B 80,131 2,185 22,438 104,754 117,453
Total (A+B) 80,131 2,004,291 164,445 2,248,867 894,208
156 3. Half-yearly condensed consolidated financial statements at 30 June 2018

The financial derivatives relating to the Banking Group include:
the value of the options purchased as a hedge, for operational purposes, of the embedded option component of bonds
indexed to baskets of equities. This option component was separated from the host instrument and was classified
among financial liabilities held for trading;
the positive fair value of interest rate derivatives.
Other financial assets mandatorily measured at fair value: breakdown by type
(thousands of euro)
Items/Values Banking group
Insurance companies
Other entities 30/06/2018 31/12/2017
1. Debt securities 313,409 582,444 164,482 1,060,335 1,075,633
1.1 Structured securities - - 164,482 164,482 172,216
1.2 Other debt securities 313,409 582,444 - 895,853 903,417
2. Equity securities - - 4,893 4,893 2,076
3. Units in collective investment undertakings 1,351,410 - 28,160 1,379,570 1,082,674
4. Loans - 180,150 473,847 653,997 663,438
4.1 Repurchase agreements - - - - -
4.2 Other - 180,150 473,847 653,997 663,438
Totale 1,664,819 762,594 671,382 3,098,795 2,823,821
This item, which mainly includes the contribution of the Parent Company, consists of debt securities (approximately
1,060 million euro), loans (approximately 654 million euro) and units in collective investment undertakings (approximately
1,380 million euro) which, upon first-time adoption of IFRS 9, were classified in this item following the failure to pass the
SPPI23 test.
FINANCIAL ASSETS MEASURED AT FAIR VALUE THROUGH OTHER COMPREHENSIVE INCOME - ITEM 30
Financial assets measured at fair value through other comprehensive income: breakdown by type
(thousands of euro)
Items/Values Banking group
Insurance companies
Other entities 30/06/2018 31/12/2017
1. Debt securities 10,048,722 - - 10,048,722 9,441,056
1.1 Structured securities - - - -
1.2 Other debt securities 10,048,722 - - 10,048,722 9,441,056
2. Equity securities 510,997 - 47,805 558,802 82,324
4. Loans - - - -
Total 10,559,719 - 47,805 10,607,524 9,523,380
The financial assets relating to the Banking Group at 30 June 2018 include:
debt securities for a value of 10,048.7 million euro. Taking into account the securities that were recorded under
"Financial assets available for sale", in the published financial statements as at 31 December 2017 and that were
included under this item on first-time adoption of IFRS 9, the figure shows an increase compared to the end of 2017.
This item includes Italian government securities with a value of approximately 8,706.1 million euro;
equity securities for approximately 511 million euro, of which 478 million euro relating to the investment in the capital
of Telecom Italia S.p.A. made in the first half of 2018.
23 The SPPI test is a qualitative, and in some cases quantitative, analysis of the financial activity's cash flows aimed at verifying whether or not those flows consist exclusively in payments of capital and interest accrued on the amount of the principal to be repaid and are compatible with a credit lending arrangement. (IFRS 9 § 4.1.2 and 4.1.2 A (lett.b), 4.1.3 and § B 4.1.7 – B 4.1.9E).
157
Half-yearly Financial Report 2018
Notes to the consolidated financial statements

FINANCIAL ASSETS MEASURED AT AMORTISED COST - ITEM 40
Financial assets measured at amortised cost: breakdown by type of loans to banks
(thousands of euro)
Type of transactions/values
Banking group Insurance companies
Other entities 30/06/2018 31/12/2017
A. Claims on central banks 2,739,720 - - 2,739,720 23,997,985
1. Fixed-term deposits - - - - -
2. Rserve requirement 2,739,720 - - 2,739,720 23,997,985
3. Repurchase agreements - - - - -
4. Other - - - - -
B. Loans to banks 15,274,000 536,462 4,428,665 20,239,127 19,139,760
1. Loans 14,308,486 536,462 4,428,665 19,273,613 17,881,932
1.2 Current deposit and demand deposit 289,731 403,230 3,084,760 3,777,721 4,065,690
1.2 Fixed-term deposits 896,025 133,232 1,343,905 2,373,162 1,128,239
1.3 Other financing: 13,122,730 - - 13,122,730 12,688,003
- Repurchase agreements 800,130 - - 800,130 -
- Finance lease - - - - -
- Other 12,322,600 - - 12,322,600 12,688,003
2. Debt securities 965,514 - - 965,514 1,257,828
2.1 Structured - - - - -
2.2 Other debt securities 965,514 - - 965,514 1,257,828
Total 18,013,720 536,462 4,428,665 22,978,847 43,137,745
Loans to banks are primarily composed of:
the Parent Company’s balance on the management account of the reserve requirement, which decreased to around
2,740 million euro (around -21,258 million euro on the figure recorded at the end of 2017);
other loans of approximately 12,323 million euro, mostly attributable to loans granted by the Parent Company to the
banking system as part of initiatives to support SMEs;
term deposits for approximately 2,373 million euro, of which about 896 million euro in respect of Credit Support
Annexes (cash collateral) opened by the Parent Company to hedge counterparty credit risk on derivatives and around
1,342 million euro due to the contribution from SNAM;
reverse repurchase agreements of the Parent Company of approximately 800 million euro. At 31 December 2017
there were no repurchase agreements in place with banks;
current account balances amounting to around 3,778 million euro.
158 3. Half-yearly condensed consolidated financial statements at 30 June 2018

Financial assets measured at amortised cost: breakdown by type of loans to customers
(thousands of euro)
Type of transactions/values Banking group
Insurance companies
Other entities 30/06/2018 31/12/2017
1. Loans 250,115,888 409,741 1,267,511 251,793,140 244,460,091
1.Current accounts 13,349 - 475,074 488,423 488,818
1.1 Cash and cash equivalents held with Central State Treasury
153,202,974 - - 153,202,974 149,097,764
2. Repurchase agreements 1,517,954 - - 1,517,954
3. Loans 91,327,738 - 4,240 91,331,978 90,892,508
4. Credit cards, personal loans and loans repaid by automatic deductions from wages
- - 279 279 347
5. Finance leasing - - - -
6. Factoring 1,401,641 - - 1,401,641 1,636,335
7. Other 2,652,232 409,741 787,918 3,849,891 2,344,319
2. Debt securities 50,831,022 1,657,242 156 52,488,420 41,963,402
2.1 Structured securities - - - -
2.2 Other debt securities 50,831,022 1,657,242 156 52,488,420 41,963,402
Totale 300,946,910 2,066,983 1,267,667 304,281,560 286,423,493
Loans to customers, which essentially include the contribution of the Parent Company, mainly relate to:
lending operations under the Separate Account and Ordinary Account;
cash and cash equivalents held with Central State Treasury;
investments in debt securities under the Held to collect business model.
The above table provides a breakdown of the positions by technical form.
With respect to the cash and cash equivalents held with the Central State Treasury, account no. 29814, called “Cassa
DP SPA - Gestione Separata”, which comprises the liquidity generated by Separate Account transactions, the Ministry of
the Economy and Finance pays CDP interest at a floating 6-month rate equal to the weighted average (using weightings
at 20% and 80%) of the yields recorded at auction, in the reference half year, respectively on 6-month BOTs and 10-year
BTPs. The cash and cash equivalents held with the Treasury current account amount to around 153,203 million euro
(+4,105 million euro compared to the end of 2017).
The volume of mortgage loans and other financing amounted to approximately 95,182 million euro (+1,944 million euro
compared to the end of 2017).
Reverse repurchase agreements amounted to approximately 1,518 million euro (there were no reverse repurchase
agreements outstanding at the end of 2017).
The volume of debt securities included in this item amounted to approximately 52,488 million euro, of which
approximately 50,831 million euro attributable to the Parent Company (of which 47,313 million euro in Italian government
securities).
159
Half-yearly Financial Report 2018
Notes to the consolidated financial statements

Financial assets measured at amortised cost: gross value and total adjustments
(thousands of euro)
Gross value Total adjustments
Stage 1
of which: Instruments
with low credit risk
Stage 2 Stage 3 Stage 1 Stage 2 Stage 3
Debt Securities 53,497,295 - - - 43,361 - -
Loans 257,514,554 1,354,575 16,369,213 950,488 177,881 638,120 211,781
Totale 30/06/2018 311,011,849 1,354,575 16,369,213 950,488 221,242 638,120 211,781
of which: non-performing financial assets acquired or originated
X X - 12 X - 3
HEDGING DERIVATIVES - ITEM 50
Hedging derivatives: breakdown by type of hedge and level of inputs
Banking group
Insurance companies
(thousands of euro) Other entities 30/06/2018 31/12/2017
A. Financial derivatives: 715,010 - 100,283 815,293 988,655
1) Fair value 621,040 - 3,099 624,139 717,098
2) Cash flow 93,970 - 97,184 191,154 271,557
3) Investment in foreign operation - - - - -
B. Credit derivatives - - - - -
1) Fair value - - - - -
2) Cash flow - - - - -
Total 715,010 - 100,283 815,293 988,655
160 3. Half-yearly condensed consolidated financial statements at 30 June 2018
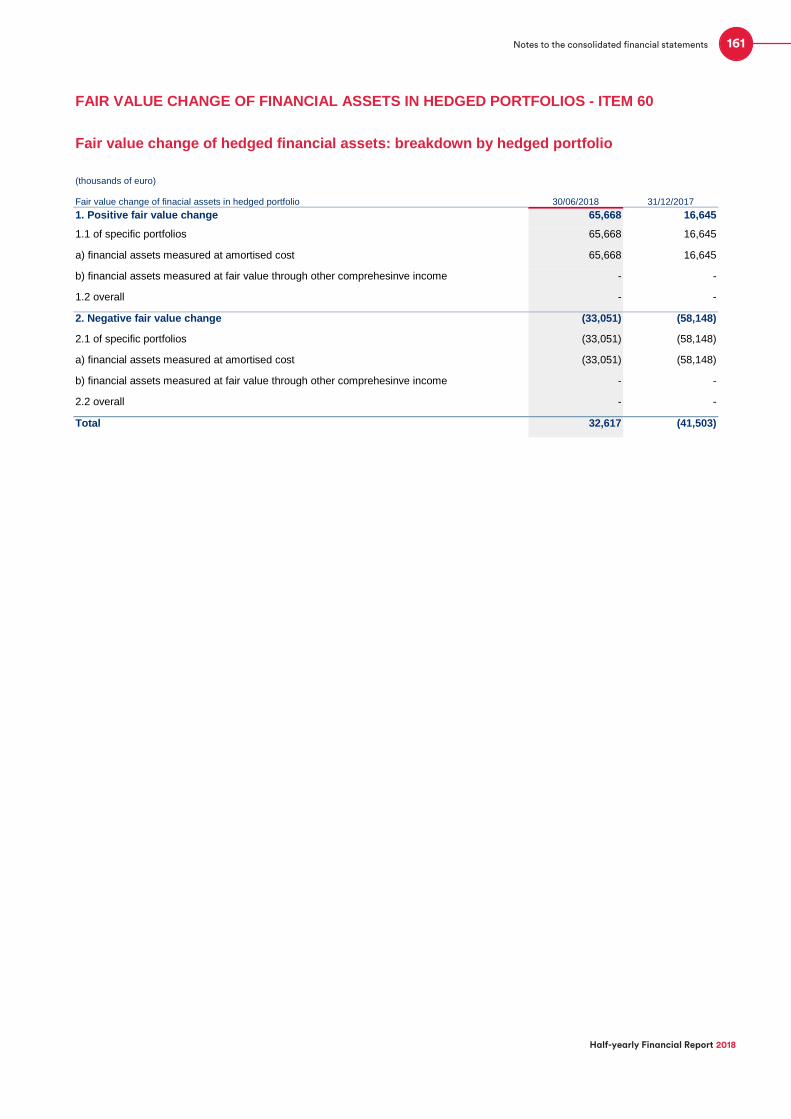
FAIR VALUE CHANGE OF FINANCIAL ASSETS IN HEDGED PORTFOLIOS - ITEM 60
Fair value change of hedged financial assets: breakdown by hedged portfolio
(thousands of euro)
Fair value change of finacial assets in hedged portfolio 30/06/2018 31/12/2017
1. Positive fair value change 65,668 16,645
1.1 of specific portfolios 65,668 16,645
a) financial assets measured at amortised cost 65,668 16,645
b) financial assets measured at fair value through other comprehesinve income - -
1.2 overall - -
2. Negative fair value change (33,051) (58,148)
2.1 of specific portfolios (33,051) (58,148)
a) financial assets measured at amortised cost (33,051) (58,148)
b) financial assets measured at fair value through other comprehesinve income - -
2.2 overall - -
Total 32,617 (41,503)
161
Half-yearly Financial Report 2018
Notes to the consolidated financial statements

EQUITY INVESTMENTS - ITEM 70
Equity investments: information on equity investments
Investor % holding
1. Alf iere S.p.A Rome Rome 7 CDP Immobiliare S.r.l. 50.00% 50.00%
2. Ansaldo Energia S.p.A. Genoa Genoa 7 CDP Equity S.p.A. 59.94% 59.94%
3. AS Gasinfrastruktur Beteiligung GmbH Vienna Vienna 7 SNAM S.p.A. 40.00% 40.00%
4. CSSC - Fincantieri Cruise Industry Development Ltd. Hong Kong Hong Kong 7 Fincantieri S.p.A. 40.00% 40.00%
5. CSSC Fincantieri (Shanghai) Cruise Design Limited Shanghai Shanghai 7 CSSC - Fincantieri Cruise
Industry Development Limited
100.00% 100.00%
6. ELMED Etudes S.a.r.l. Tunis Tunis 7 Terna S.p.A. 50.00% 50.00%
7. ETIHAD SHIP BUILDING LLC Abu Dhabi Abu Dhabi 7 Fincantieri S.p.A. 35.00% 35.00%
8. FSIA INVESTIMENTI S.r.l. Milan Milan 7 FSI Investimenti S.p.A. 70.00% 70.00%
9. Hotelturist S.p.A. Padua Padua 7 CDP Equity S.p.A. 45.90% 45.90%
10. IQ Made in Italy Investment Company S.p.A. Milan Milan 7 FSI Investimenti S.p.A. 50.00% 50.00%
11. Issel Middle East Information Technology Consultancy LLC Abu Dhabi Abu Dhabi 7 Issel Nord S.r.l. 49.00% 49.00%
12. Luxury Interiors Factory s.r.l. Naples Naples 7 Marine Interiors S.p.A. 40.00% 40.00%
13. M.T. Manifattura Tabacchi S.p.A. Rome Rome 7 CDP Immobiliare S.r.l. 90.91% 90.91%
14. Manifatture Milano S.p.A. Rome Rome 7 CDP Immobiliare S.r.l. 50.00% 50.00%
15. Metano S.Angelo Lodigiano S.p.A. Sant'Angelo Lodigiano Sant'Angelo Lodigiano 7 Italgas Reti SpA 50.00% 50.00%
16. OpEn Fiber S.p.A. Milan Milan 7 CDP Equity S.p.A. 50.00% 50.00%
17. Orizzonte Sistemi Navali S.p.A. Genoa Genoa 7 Fincantieri S.p.A. 51.00% 51.00%
18. Pentagramma Perugia S.p.A. Rome Rome 7 CDP Immobiliare S.r.l. 50.00% 50.00%
19. Pentagramma Piemonte S.p.A. Rome Rome 7 CDP Immobiliare S.r.l. 50.00% 50.00%
20. Saipem S.p.A. San Donato Milanese (MI) San Donato Milanese (MI) 7 CDP Equity S.p.A. 12.55% 12.55%
21. TEREGA HOLDING S.A.S. Pau Pau 7 SNAM S.p.A. 40.50% 40.50%
22. Toscana Energia S.p.A. Florence Florence 7 Italgas Reti SpA 48.08% 48.08%
23. Trans Austria Gasleitung GmbH Vienna Vienna 7 SNAM S.p.A. 84.47% 84.47%
24. Umbria Distribuzione GAS S.p.A. Terni Terni 7 Italgas Reti SpA 45.00% 45.00%
25. Unifer Navale S.r.l. Finale Emilia (MO) Finale Emilia (MO) 7 Seaf S.p.A. 20.00% 20.00%
26. Valvitalia Finanziaria S.p.A. Milan Milan 7 FSI Investimenti S.p.A. 0.50% 0.50%
1. African Trade Insurance Company Nairobi Nairobi 4 SACE S.p.A. 4.43% 4.43%
2. ARSENAL S.r.l. Trieste Trieste 4 Fincantieri Oil & Gas S.p.A. 24.00% 24.00%
3. AS Dameco Skien Skien 4 Vard Offshore Brevik AS 34.00% 34.00%
4. B.F. S.p.A. Milan Jolanda di Savoia (FE) 4 CDP Equity S.p.A. 19.98% 19.98%
5. Brevik Technology AS Brevik Brevik 4 Vard Group AS 34.00% 34.00%
6. Castor Drilling Solution AS Kristiansand S Kristiansand S 4 Seaonics AS 34.13% 34.13%
7. CENTRO SERVIZI NAVALI S.p.A. San Giorgio di Nogaro (UD) San Giorgio di Nogaro (UD) 4 Fincantieri S.p.A. 10.94% 10.94%
8. CESI S.p.A. Milan Milan 4 Terna S.p.A. 42.70% 42.70%
9. CGES A.D. Podgorica Podgorica 4 Terna S.p.A. 22.09% 22.09%
10. CORESO S.A. Brussels Brussels 4 Terna S.p.A. 15.84% 15.84%
11. CSS Design Limited British Virgin Islands (GB) British Virgin Islands (GB) 4 Vard Marine Inc. 31.00% 31.00%
12. DOF Iceman AS Storebø Storebø 4 Vard Group AS 50.00% 50.00%
13. Elite S.p.A. Milan Milan 4 CDP S.p.A. 15.00% 15.00%
14. Eni S.p.A. Rome Rome 4 CDP S.p.A. 25.76% 25.76%
15. Europrogetti & Finanza S.p.A. in liquidazione Rome Rome 4 CDP S.p.A. 31.80% 31.80%
16. Fondo Italiano di Investimento SGR S.p.A. Milan Milan 4 CDP S.p.A. 43.00% 43.00%
17. FSI SGR S.p.A. Milan Milan 4 CDP S.p.A. 39.00% 39.00%
18. Interconnector (UK) Ltd London London 4 GasBridge 2 B.V. 23.54% 23.54%
19. Interconnector Zeebrugge Terminal S.C./C.V. Scrl Brussels Brussels 4 GasBridge 2 B.V. 25.00% 25.00%
20. Island Diligence AS Ulsteinvik Ulsteinvik 4 Vard Group AS 39.38% 39.38%
21. Kedrion S.p.A. Castelvecchio Pascoli (LU) Castelvecchio Pascoli (LU) 4 FSI Investimenti S.p.A. 25.06% 25.06%
22. Ligestra DUE S.r.l. (5) Rome Rome 4 Fintecna S.p.A. 100.00% 100.00%
23. Møkster Supply AS Stavanger Stavanger 4 Vard Group AS 40.00% 40.00%
24. Møkster Supply KS Stavanger Stavanger 4 Vard Group AS 36.00% 36.00%
25. Olympic Challenger KS Fosnavåg Fosnavåg 4 Vard Group AS 35.00% 35.00%
26. Olympic Green Energy KS Fosnavag Fosnavag 4 Vard Group AS 29.50% 29.50%
27. Poste Italiane S.p.A. Rome Rome 4 CDP S.p.A. 35.00% 35.00%
28. Quattror SGR S.p.A. Milan Milan 4 CDP S.p.A. 40.00% 40.00%
29. Rem Supply AS Fosnavag Fosnavag 4 Vard Group AS 26.66% 26.66%
30. Risparmio Holding S.p.A. Rome Rome 4 CDP S.p.A. 20.00% 20.00%
31. Rocco Forte Hotels Limited London London 4 FSI Investimenti S.p.A. 23.00% 23.00%
32. Taklif t AS Skien Skien 4 Vard Group AS 25.47% 25.47%
33. Trans Adriatic Pipeline AG Baar Baar 4 SNAM S.p.A. 20.00% 20.00%
34. Trevi Finanziaria Industriale S.p.A Cesena Cesena 4 FSI Investimenti S.p.A. 16.86% 16.86%
Equity investment
% of votes (2)
A. Joint ventures
B. Companies subject to significant influence
Company name Registered office Operational headquarters
Type of
relationship (1)
162 3. Half-yearly condensed consolidated financial statements at 30 June 2018
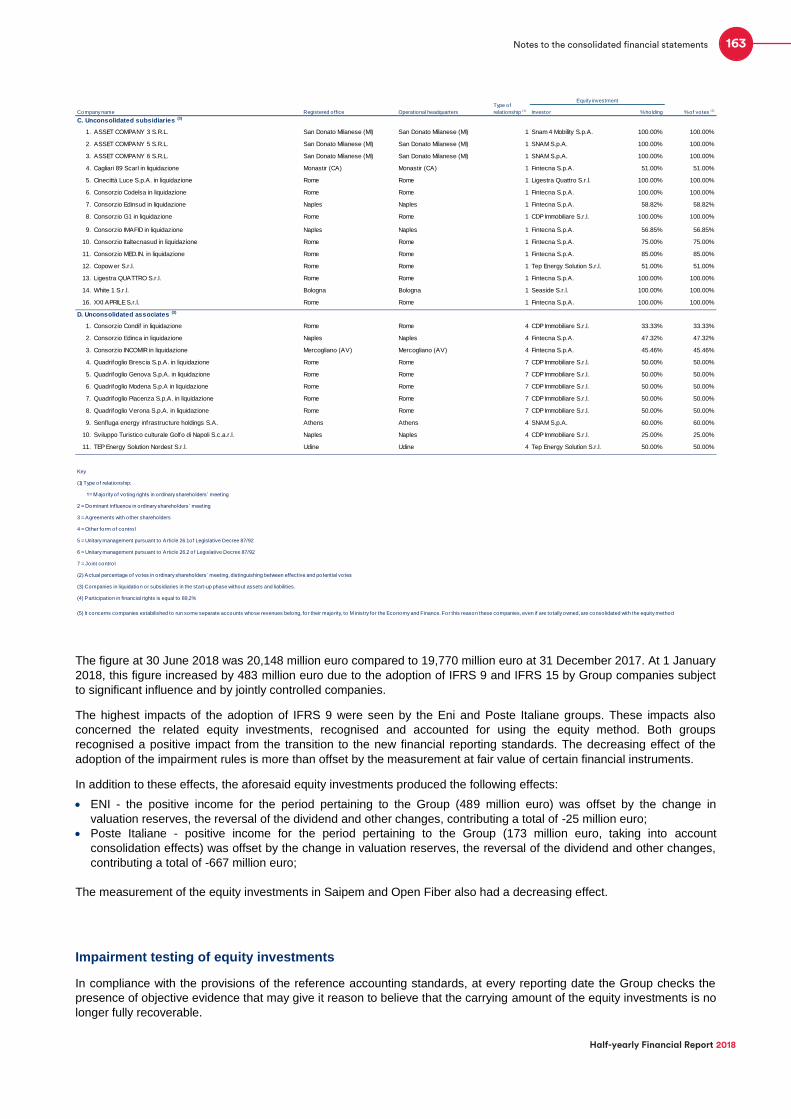
The figure at 30 June 2018 was 20,148 million euro compared to 19,770 million euro at 31 December 2017. At 1 January
2018, this figure increased by 483 million euro due to the adoption of IFRS 9 and IFRS 15 by Group companies subject
to significant influence and by jointly controlled companies.
The highest impacts of the adoption of IFRS 9 were seen by the Eni and Poste Italiane groups. These impacts also
concerned the related equity investments, recognised and accounted for using the equity method. Both groups
recognised a positive impact from the transition to the new financial reporting standards. The decreasing effect of the
adoption of the impairment rules is more than offset by the measurement at fair value of certain financial instruments.
In addition to these effects, the aforesaid equity investments produced the following effects:
ENI - the positive income for the period pertaining to the Group (489 million euro) was offset by the change in
valuation reserves, the reversal of the dividend and other changes, contributing a total of -25 million euro;
Poste Italiane - positive income for the period pertaining to the Group (173 million euro, taking into account
consolidation effects) was offset by the change in valuation reserves, the reversal of the dividend and other changes,
contributing a total of -667 million euro;
The measurement of the equity investments in Saipem and Open Fiber also had a decreasing effect.
Impairment testing of equity investments
In compliance with the provisions of the reference accounting standards, at every reporting date the Group checks the
presence of objective evidence that may give it reason to believe that the carrying amount of the equity investments is no
longer fully recoverable.
Investor % holding
1. ASSET COMPANY 3 S.R.L. San Donato Milanese (MI) San Donato Milanese (MI) 1 Snam 4 Mobility S.p.A. 100.00% 100.00%
2. ASSET COMPANY 5 S.R.L. San Donato Milanese (MI) San Donato Milanese (MI) 1 SNAM S.p.A. 100.00% 100.00%
3. ASSET COMPANY 6 S.R.L. San Donato Milanese (MI) San Donato Milanese (MI) 1 SNAM S.p.A. 100.00% 100.00%
4. Cagliari 89 Scarl in liquidazione Monastir (CA) Monastir (CA) 1 Fintecna S.p.A. 51.00% 51.00%
5. Cinecittà Luce S.p.A. in liquidazione Rome Rome 1 Ligestra Quattro S.r.l. 100.00% 100.00%
6. Consorzio Codelsa in liquidazione Rome Rome 1 Fintecna S.p.A. 100.00% 100.00%
7. Consorzio Edinsud in liquidazione Naples Naples 1 Fintecna S.p.A. 58.82% 58.82%
8. Consorzio G1 in liquidazione Rome Rome 1 CDP Immobiliare S.r.l. 100.00% 100.00%
9. Consorzio IMAFID in liquidazione Naples Naples 1 Fintecna S.p.A. 56.85% 56.85%
10. Consorzio Italtecnasud in liquidazione Rome Rome 1 Fintecna S.p.A. 75.00% 75.00%
11. Consorzio MED.IN. in liquidazione Rome Rome 1 Fintecna S.p.A. 85.00% 85.00%
12. Copow er S.r.l. Rome Rome 1 Tep Energy Solution S.r.l. 51.00% 51.00%
13. Ligestra QUATTRO S.r.l. Rome Rome 1 Fintecna S.p.A. 100.00% 100.00%
14. White 1 S.r.l. Bologna Bologna 1 Seaside S.r.l. 100.00% 100.00%
16. XXI APRILE S.r.l. Rome Rome 1 Fintecna S.p.A. 100.00% 100.00%
1. Consorzio Condif in liquidazione Rome Rome 4 CDP Immobiliare S.r.l. 33.33% 33.33%
2. Consorzio Edinca in liquidazione Naples Naples 4 Fintecna S.p.A. 47.32% 47.32%
3. Consorzio INCOMIR in liquidazione Mercogliano (AV) Mercogliano (AV) 4 Fintecna S.p.A. 45.46% 45.46%
4. Quadrifoglio Brescia S.p.A. in liquidazione Rome Rome 7 CDP Immobiliare S.r.l. 50.00% 50.00%
5. Quadrifoglio Genova S.p.A. in liquidazione Rome Rome 7 CDP Immobiliare S.r.l. 50.00% 50.00%
6. Quadrifoglio Modena S.p.A in liquidazione Rome Rome 7 CDP Immobiliare S.r.l. 50.00% 50.00%
7. Quadrifoglio Piacenza S.p.A. in liquidazione Rome Rome 7 CDP Immobiliare S.r.l. 50.00% 50.00%
8. Quadrifoglio Verona S.p.A. in liquidazione Rome Rome 7 CDP Immobiliare S.r.l. 50.00% 50.00%
9. Senfluga energy infrastructure holdings S.A. Athens Athens 4 SNAM S.p.A. 60.00% 60.00%
10. Sviluppo Turistico culturale Golfo di Napoli S.c.a.r.l. Naples Naples 4 CDP Immobiliare S.r.l. 25.00% 25.00%
11. TEP Energy Solution Nordest S.r.l. Udine Udine 4 Tep Energy Solution S.r.l. 50.00% 50.00%
Equity investment
% of votes (2)
(2) Actual percentage of votes in ordinary shareholders’ meeting, distinguishing between effective and potential votes
(3) Companies in liquidation or subsidiaries in the start-up phase without assets and liabilities.
(4) Participation in financial rights is equal to 89,2%
(5) It concerns companies estabilished to run some separate accounts whose revenues belong, for their majority, to M inistry for the Economy and Finance. For this reason these companies, even if are to tally owned, are consolidated with the equity method
6 = Unitary management pursuant to Article 26.2 of Legislative Decree 87/92
7 = Jo int contro l
(1) Type of relationship:
1 = M ajority o f voting rights in ordinary shareholders’ meeting
2 = Dominant influence in ordinary shareholders’ meeting
3 = Agreements with other shareholders
4 = Other form of contro l
5 = Unitary management pursuant to Article 26.1 of Legislative Decree 87/92
Company name Registered office Operational headquarters
Type of
relationship (1)
C. Unconsolidated subsidiaries (3)
D. Unconsolidated associates (3)
Key
163
Half-yearly Financial Report 2018
Notes to the consolidated financial statements

The identification of this evidence, based on the existence of qualitative and quantitative indicators, as described in the
accounting policies, and set out in detail in the internal policies, differs according to whether or not they are equity
investments in companies whose shares are listed in active markets.
The analysis aimed at detecting the presence of impairment indicators is carried out, first of all, with regard to the
separate financial statements of the company holding the equity investment.
An impairment test is performed when the aforementioned indicators exist, in accordance with the provisions of IAS 36.
This test is aimed at estimating the recoverable amount of the equity investment and comparing it with its carrying
amount to determine the recognition of any impairment losses.
The impairment tests conducted are considered in order to evaluate any results in the consolidated financial statements.
At the reporting date there were certain indicators that therefore required the conduct of the impairment tests.
Eni
The interest in ENI in CDP’s equity portfolio is very significant in quantitative terms. CDP’s risk profile is therefore linked
to the main factors that determine the value and profitability of the associated company.
A significant indicator of impairment was identified for the purposes of the separate financial statements and an
impairment test was therefore conducted on the equity investment.
Specifically, the value in use was determined on the basis of IAS 36, by using the Discounted Cash Flow (DCF) method
as provided for in the accounting standard.
The plan used to construct the cash flows and the other information needed to calculate the DCF were taken from public
sources. The impairment test found that the value in use was higher than the carrying value and, consequently, the
carrying amount of the equity investment in ENI was confirmed.
Poste Italiane
A significant indicator of impairment was identified for the purpose of the separate financial statements and, accordingly,
an impairment test was conducted on the equity investment in Poste Italiane. The test took account of the fair value
determined according to the internal policies, which was higher than the carrying value and, consequently, the carrying
amount of the equity investment in Poste Italiane was confirmed.
Saipem
The equity investment held in Saipem had already been tested for impairment in previous years. Specifically, in the
consolidated financial statements at 31 December 2017, it was written down by a total of 22 million euro. At 30 June
2018, the equity investment was tested again for impairment. The results of this test, taking into account the value in use
determined using the DCF method based on information taken from public sources, identified a value in use higher than
the carrying value of the equity investment.
The impairment test and the accuracy of the results obtained were subject to a Fairness Opinion provided by an
independent expert.
Open Fiber
In consideration of the negative result recorded by the investee in 2017 and in the expected results for 2018, an
impairment test was also carried out on the equity investment in Open Fiber (held through CDP Equity). The analysis
produced a recoverable amount estimated, with the DCF method (determined as part of the more complex measurement
of the investor by an independent expert), to be higher than the carrying value in the consolidated financial statements.
As a consequence, the carrying amount of the equity investment was confirmed.
Impairment indicators were also found on other minor equity investments without significant impairment losses being
recognized.
The following summary table lists the methods used to calculate the recoverable amount determined for the purpose of
the impairment test on the equity investments above:
164 3. Half-yearly condensed consolidated financial statements at 30 June 2018

The consolidated accounting figures for joint arrangements and significant associates were produced based on the
information provided by the investees.
Equity investment Type Recoverable amount M ethodology used
Eni Associate Value in use Discounted Cash Flow
Poste Italiane Associate Fair value n.a.
Saipem Joint venture Value in use Discounted Cash Flow
Open Fiber Joint venture Value in use Discounted Cash Flow
165
Half-yearly Financial Report 2018
Notes to the consolidated financial statements
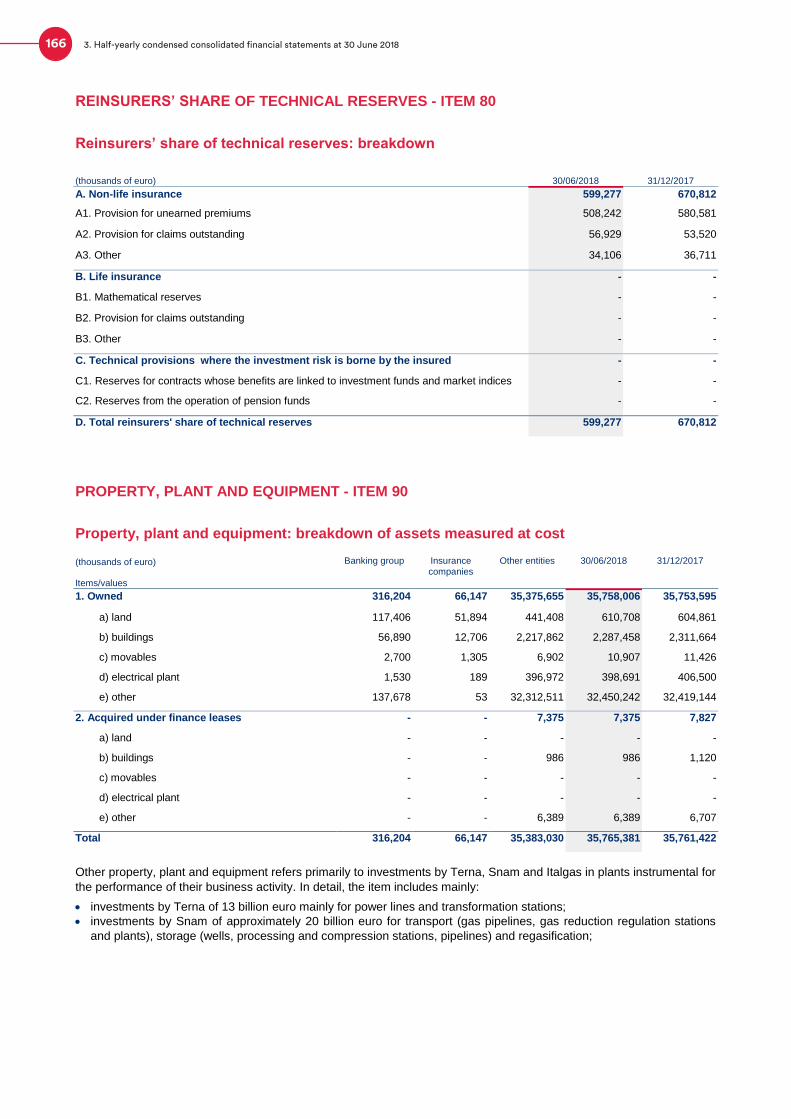
REINSURERS’ SHARE OF TECHNICAL RESERVES - ITEM 80
Reinsurers’ share of technical reserves: breakdown
(thousands of euro) 30/06/2018 31/12/2017
A. Non-life insurance 599,277 670,812
A1. Provision for unearned premiums 508,242 580,581
A2. Provision for claims outstanding 56,929 53,520
A3. Other 34,106 36,711
B. Life insurance - -
B1. Mathematical reserves - -
B2. Provision for claims outstanding - -
B3. Other - -
C. Technical provisions where the investment risk is borne by the insured - -
C1. Reserves for contracts whose benefits are linked to investment funds and market indices - -
C2. Reserves from the operation of pension funds - -
D. Total reinsurers' share of technical reserves 599,277 670,812
PROPERTY, PLANT AND EQUIPMENT - ITEM 90
Property, plant and equipment: breakdown of assets measured at cost
(thousands of euro) Banking group Insurance companies
Other entities 30/06/2018 31/12/2017
Items/values
1. Owned 316,204 66,147 35,375,655 35,758,006 35,753,595
a) land 117,406 51,894 441,408 610,708 604,861
b) buildings 56,890 12,706 2,217,862 2,287,458 2,311,664
c) movables 2,700 1,305 6,902 10,907 11,426
d) electrical plant 1,530 189 396,972 398,691 406,500
e) other 137,678 53 32,312,511 32,450,242 32,419,144
2. Acquired under finance leases - - 7,375 7,375 7,827
a) land - - - - -
b) buildings - - 986 986 1,120
c) movables - - - - -
d) electrical plant - - - - -
e) other - - 6,389 6,389 6,707
Total 316,204 66,147 35,383,030 35,765,381 35,761,422
Other property, plant and equipment refers primarily to investments by Terna, Snam and Italgas in plants instrumental for
the performance of their business activity. In detail, the item includes mainly:
investments by Terna of 13 billion euro mainly for power lines and transformation stations;
investments by Snam of approximately 20 billion euro for transport (gas pipelines, gas reduction regulation stations
and plants), storage (wells, processing and compression stations, pipelines) and regasification;
166 3. Half-yearly condensed consolidated financial statements at 30 June 2018

Investment property: breakdown of assets measured at cost
(thousands of euro)
Banking group Insurance companies Other entities 30/06/2018 31/12/2017 Items/values
1. Owned - 12,707 20,703 33,410 52,573
a) land - 3,655 - 3,655 16,578
b) buildings - 9,052 20,703 29,755 35,995
2.Aacquired under finance leases - - - - -
a) land - - - -
b) buildings - - - -
Totale - 12,707 20,703 33,410 52,573
Inventories of property, plant and equipment governed by IAS 2: breakdown
(thousands of euro) Assets/Values 30/06/2018 31/12/2017
1. Inventories of property, plant and equipment from the recovery of non-performing loans - -
a) land - -
b) buildings - -
c) furniture - -
d) electrical systems - -
e) others - -
2. Other inventories of property, plant and equipment 1,362,442 1,364,515
Total 1,362,442 1,364,515
167
Half-yearly Financial Report 2018
Notes to the consolidated financial statements

INTANGIBLE ASSETS - ITEM 100
Intangible assets: breakdown by category
30/06/2018 31/12/2017
(thousands of euro) Definite life Indefinite life Definite life Indefinite life
Assets/values
A.1 Goodwill x 661,275 x 653,342
A.1.1 pertaining to Group x 661,275 x 653,342
A.1.2 non-controlling interests x - x -
A.2 Other intangible assets 7,923,048 15,869 7,381,882 15,426
A.2.1 Assets carried at cost 7,923,048 15,869 7,381,882 15,426
a) internally-generated intangible assets 148,291 - 132,940 -
b) other assets 7,774,757 15,869 7,248,942 15,426
A.2.2 Assets carried at fair value - - - -
a) internally-generated intangible assets - - - -
b) other assets - - - -
Total 7,923,048 677,144 7,381,882 668,768
Other intangible assets include the recognition of intangible assets resulting from business combinations involving the
various companies of the Group.
They mainly regard:
concessions and licences worth 975,170 thousand euro, which mainly include the value of concessions for the
storage of natural gas;
infrastructure rights worth 6,167,312 thousand euro, of which 6,066,137 thousand euro refers to Italgas, and the
remainder to Terna. The item includes the value of the public-private service concession agreements relating to the
development, maintenance and operation of infrastructure under concession arrangements. Under the terms of the
agreements, the operator holds the right to use the infrastructure in order to provide the public service;
customer contracts valued at 128,972 thousand euro;
trademarks worth 7,249 thousand euro;
technological know-how worth 11,700 thousand euro;
software licences worth 199,144 thousand euro.
168 3. Half-yearly condensed consolidated financial statements at 30 June 2018

NON-CURRENT ASSETS AND DISPOSAL GROUPS HELD FOR SALE AND ASSOCIATED LIABILITIES - ITEM 120 OF THE ASSETS AND ITEM 70 OF THE LIABILITIES
Non-current assets and disposal groups: breakdown by category
(thousands of euro)
30/06/2018 31/12/2017
A. Individual assets
A.1 Financial assets - -
A.2 Equity investments - -
A.3 Property, plant and equipment 19,169 12
of which: obtained via the enforcement of the guarantees received -
A4 Intangible assets -
A.5 Other non-current assets -
Total A 19,169 12
B. Groups of assets (discontinued operations)
B.1 Financial assets measured at fair value through profit or loss - -
- financial assets held for trading -
- financial assets designated at fair value -
- non -trading financial asstes mandatorily measured at fair value -
B.2 Financial assets measured at fair value through other comprehesinve income -
B.3 Financial assets measured at amortised cost -
B.4 Equity investments -
B.5 Property, plant and equipment 11 11
of which: obtained via the enforcement of the guarantees received
B.6 Intangible assets -
B.7 Other assets -
Total B 11 11
C. Liabilities associated with individual assets held for sale
C.1 Payables -
C.2 Securities -
C.3 Other liabilities -
Total C - -
of which carried at cost -
of which measured at fair value – level 1 -
of which measured at fair value – level 2 -
of which measured at fair value – level 3 -
D. Liabilities associated with disposal groups held for sale - -
D.1 Financial liabilities measured at amortised cost -
D.2 Financial liabilities held for trading -
D.3 Financial liabilities designated at fair value -
D.4 Provisions -
D.5 Other liabilities -
Total D - -
169
Half-yearly Financial Report 2018
Notes to the consolidated financial statements

OTHER ASSETS - ITEM 130
Other assets: breakdown
Banking group Insurance companies Other entities 30/06/2018 31/12/2017 (thousands of euro)
Payments on account for withholding tax on postal passbooks
98,615 - - 98,615 98,615
Other tax receivables 87 1,527 108,999 110,613 180,572
Leasehold improvements 8 - 5,579 5,587 5,993
Receivables due from investees 777 - 169,459 170,236 171,121
Trade receivables and advances to public entities 155,519 - 24,831 180,350 33,242
Construction contracts - - 2,063,864 2,063,864 2,032,230
Advances to suppliers 80 777 432,761 433,618 421,826
Inventories - - 921,537 921,537 910,490
Advances to personnel 38 1,933 14,428 16,399 13,817
Other trade receivables - 84,425 3,047,501 3,131,926 3,953,719
Other items 12,036 23,793 441,665 477,494 339,724
Accrued income and prepaid expenses 3,725 3,108 276,447 283,280 250,145
Total 270,885 115,563 7,507,071 7,893,519 8,411,494
The item includes assets that are not classified under the previous items.
The most significant amounts refer to:
trade receivables for 3,132 million euro, referred mainly to SNAM for 968 million euro, Terna for 1,235 million euro,
Fincantieri for 449 million euro, Italgas for 353 million euro and SACE for 40 million euro;
contract work in progress for 2,063 million euro, mainly regarding the shipbuilding activities of Fincantieri;
inventories of semi-finished goods and work in progress in the amount of 922 million euro, which include:
o mandatory gas reserves valued at 363 million euro, kept at owned storage sites;
o semi-finished products of the Fincantieri Group, amounting to about 422 million euro.
170 3. Half-yearly condensed consolidated financial statements at 30 June 2018

LIABILITIES
FINANCIAL LIABILITIES MEASURED AT AMORTISED COST - ITEM 10
Financial liabilities measured at amortised cost: breakdown by type of amounts due to banks
(thousands of euro)
Banking group Insurance companies Other entities Type of operations/Components of group 30/06/2018 31/12/2017
1. Due to central banks 2,474,850 - - 2,474,850 2,498,984
2. Due to banks 19,790,233 - 9,127,998 28,918,231 23,313,487
2.1 Current accounts and demand deposits - - 6,016 6,016 1,375,540
2.2 Time deposits 2,130,023 - - 2,130,023 2,383,642
2.3 Loans 17,660,207 - 8,904,309 26,564,516 19,383,009
2.3.1 Repurchase agreements 12,300,587 - - 12,300,587 6,670,879
2.3.2 Other 5,359,620 - 8,904,309 14,263,929 12,712,130
2.4 Liabilities in respect of commitments to repurchase own equity instruments
- - 10,704 10,704 -
2.6 Other payables 3 - 206,969 206,972 171,296
Total 22,265,083 - 9,127,998 31,393,081 25,812,471
“Due to central banks”, which refer exclusively to the Parent Company CDP, relate to the refinancing operations granted
by the European Central Bank (ECB) under the Targeted Longer-Term Refinancing Operations (TLTRO II). The balance
of 2,475 million euro was substantially stable compared to the figure at the end of 2017.
“Repurchase agreements”, which refer to the Parent Company, amount to approximately 12,301 million euro and were
up sharply in the first half of 2018 (around +5,630 million euro compared to the end of 2017), due to the particularly low
market rates.
“Term deposits”, which also refer to the Parent Company, amount to approximately 2,130 million euro and mainly
comprise:
the balance of passbook savings accounts and postal savings bonds held by banks of around 1,635 million euro
(approximately +147 million euro on the 2017 year-end balance);
the amounts referred to Credit Support Annex contracts to hedge counterparty risk on derivative contracts of around
478 million euro (around -214 million euro on the 2017 year-end balance);
the balance of interbank deposits of around 17 million euro (-188 million euro on the 2017 year-end balance).
Loans payable refer mainly to:
“Loans - Other” of about 5,146 million euro, are slightly up on the 2017 year-end balance (approximately +73 million
euro) and mainly refer to the loans granted by the European Investment Bank (EIB) and the Council of Europe
Development Bank (CEB) to the Parent Company;
loans granted by the banking system to Snam for approximately 4,619 million euro, Terna for approximately 1,855
million euro, Fincantieri for approximately 788 million euro and Italgas for 787 million euro.
171
Half-yearly Financial Report 2018
Notes to the consolidated financial statements
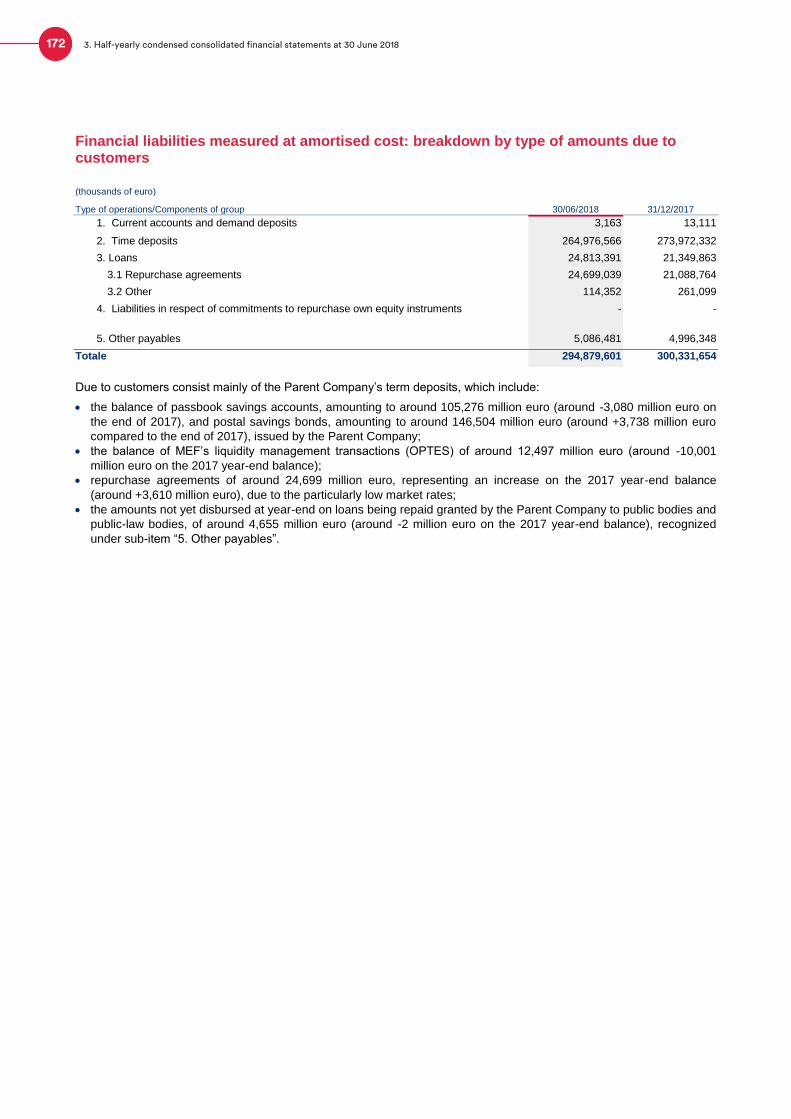
Financial liabilities measured at amortised cost: breakdown by type of amounts due to customers
(thousands of euro)
Type of operations/Components of group 30/06/2018 31/12/2017
1. Current accounts and demand deposits 3,163 13,111
2. Time deposits 264,976,566 273,972,332
3. Loans 24,813,391 21,349,863
3.1 Repurchase agreements 24,699,039 21,088,764
3.2 Other 114,352 261,099
4. Liabilities in respect of commitments to repurchase own equity instruments - -
5. Other payables 5,086,481 4,996,348
Totale 294,879,601 300,331,654
Due to customers consist mainly of the Parent Company’s term deposits, which include:
the balance of passbook savings accounts, amounting to around 105,276 million euro (around -3,080 million euro on
the end of 2017), and postal savings bonds, amounting to around 146,504 million euro (around +3,738 million euro
compared to the end of 2017), issued by the Parent Company;
the balance of MEF’s liquidity management transactions (OPTES) of around 12,497 million euro (around -10,001
million euro on the 2017 year-end balance);
repurchase agreements of around 24,699 million euro, representing an increase on the 2017 year-end balance
(around +3,610 million euro), due to the particularly low market rates;
the amounts not yet disbursed at year-end on loans being repaid granted by the Parent Company to public bodies and
public-law bodies, of around 4,655 million euro (around -2 million euro on the 2017 year-end balance), recognized
under sub-item “5. Other payables”.
172 3. Half-yearly condensed consolidated financial statements at 30 June 2018

Financial liabilities measured at amortised cost: breakdown by type of securities issued
(thousands of euro)
Banking group Insurance companies Other entities Type of securities/Values 30/06/2018 31/12/2017
A. Securities
1. Bonds 16,492,809 522,193 18,321,684 35,336,686 34,463,517
1.1 structured 45,300 - - 45,300 50,038
1.2 other 16,447,509 522,193 18,321,684 35,291,386 34,413,479
2. Ohter securities 2,140,622 - 225,000 2,365,622 2,774,010
1.1 structured - - - - - 1.2 other 2,140,622 - 225,000 2,365,622 2,774,010
Total 18,633,431 522,193 18,546,684 37,702,308 37,237,527
With respect to the Banking Group, the balance of securities issued at 30 June 2018, mainly referring to the Parent
Company, amounts to 18,633 million euro and includes:
the bonds issued under the “Euro Medium Term Notes” and “Debt Issuance Programme” programmes, with a stock of
approximately 10,574 million euro (-41 million euro on the 2017 year-end balance). In the first half of 2018, as part of
the “Debt Issuance Programme”, new issues were made, in euro and foreign currencies, for a total equivalent nominal
value of 994 million euro in support of the Separate Account;
6 bonds guaranteed by the Italian government, for a total carrying amount of 4,537 million euro (+2,030 million euro
compared to the end of 2017), entirely subscribed by Poste Italiane S.p.A. (of which 2 issued in December 2015 for a
total nominal value of 1,500 million euro, 2 issued in December 2017 for a total nominal value of 1,000 million euro,
and another 2 issued in March 2018 for a total nominal value of 2,000 million euro);
the first bond for retail investors issued in March 2015 for a carrying amount of approximately 1,472 million euro, with
a view to diversifying the source of funding for the development of public interest projects (for the Separate Account);
the stock of commercial paper with a carrying amount of around 2,141 million euro (-633 million euro on the 2017
year-end balance), related to the “Multi-Currency Commercial Paper Programme”.
Securities issued pertaining to the insurance undertakings refer to SACE’s subordinated bond issues placed with
institutional investors in January 2015, with an annual coupon of 3.875% for the first 10 years and indexed to the 10-year
swap rate plus 318.6 basis points for the following years. The bonds can be redeemed by the issuer initially after 10
years and then at every subsequent coupon payment date.
Securities issued by other companies mainly refer to the bond placements by Snam, Terna and Italgas on active markets
(Level 1), amounting to 8,134 million euro, 6,582 million euro and 2,894 million euro, respectively.
173
Half-yearly Financial Report 2018
Notes to the consolidated financial statements
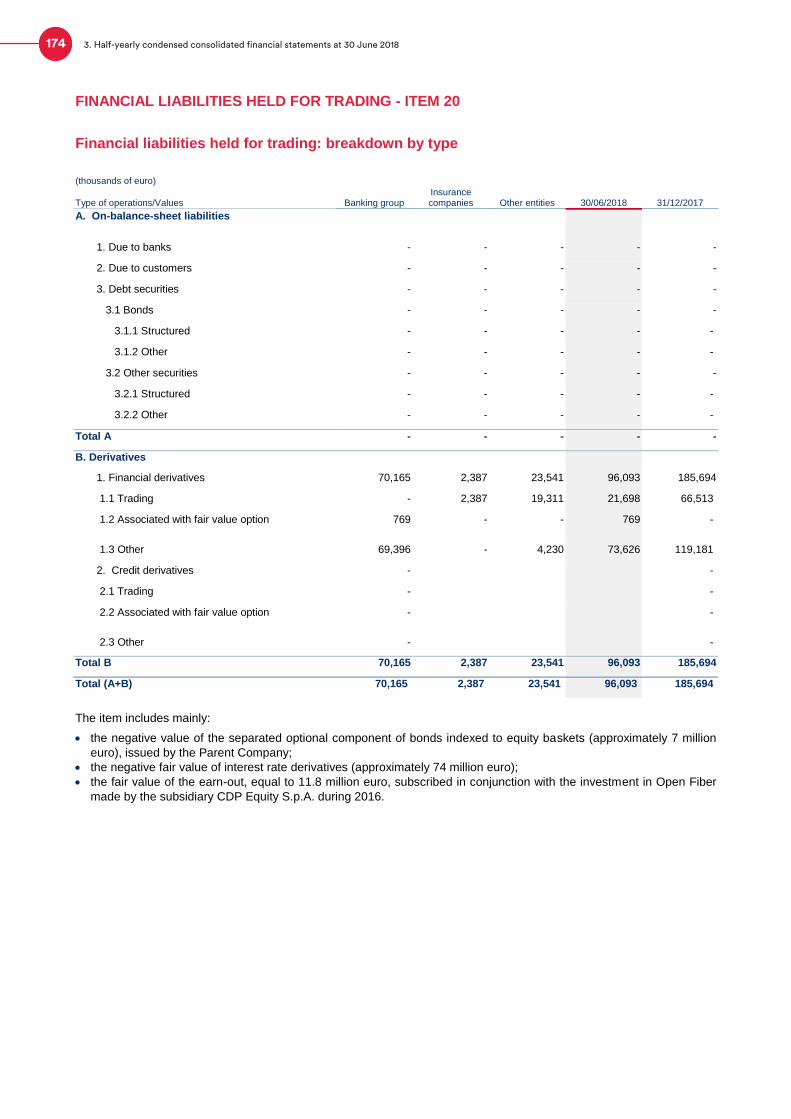
FINANCIAL LIABILITIES HELD FOR TRADING - ITEM 20
Financial liabilities held for trading: breakdown by type
(thousands of euro)
Banking group Insurance companies Other entities
Type of operations/Values 30/06/2018 31/12/2017
A. On-balance-sheet liabilities
1. Due to banks - - - - -
2. Due to customers - - - - -
3. Debt securities - - - - -
3.1 Bonds - - - - -
3.1.1 Structured - - - - -
3.1.2 Other - - - - -
3.2 Other securities - - - - -
3.2.1 Structured - - - - -
3.2.2 Other - - - - -
Total A - - - - -
B. Derivatives
1. Financial derivatives 70,165 2,387 23,541 96,093 185,694
1.1 Trading - 2,387 19,311 21,698 66,513
1.2 Associated with fair value option 769 - - 769 -
1.3 Other 69,396 - 4,230 73,626 119,181
2. Credit derivatives - -
2.1 Trading - -
2.2 Associated with fair value option - -
2.3 Other - -
Total B 70,165 2,387 23,541 96,093 185,694
Total (A+B) 70,165 2,387 23,541 96,093 185,694
The item includes mainly:
the negative value of the separated optional component of bonds indexed to equity baskets (approximately 7 million
euro), issued by the Parent Company;
the negative fair value of interest rate derivatives (approximately 74 million euro);
the fair value of the earn-out, equal to 11.8 million euro, subscribed in conjunction with the investment in Open Fiber
made by the subsidiary CDP Equity S.p.A. during 2016.
174 3. Half-yearly condensed consolidated financial statements at 30 June 2018

FINANCIAL LIABILITIES DESIGNATED AT FAIR VALUE – ITEM 30
Financial liabilities designated at fair value: breakdown by type
Banking group
Insurance companies Other entities
(migliaia di euro) 30/06/2018 31/12/2017
1. Due to banks - - 115,717 115,717 122,414
1.1 Structured - - - - -
1.2 Other - - 115,717 115,717 122,414
of which
- commiments to disburse funds X X X - -
- financial guarantees issued X X X - -
2. Due to customers - - - - -
2.1 Structured - - - - -
2.2 Other X X - - -
of which
- commiments to disburse funds X X X - -
- financial guarantees issued X X X - -
3. Securities 499,863 - 18,185 518,048 519,228
3.1 Structured 499,863 - - 499,863 501,551
3.2 Other - - 18,185 18,185 17,677
Totale 499,863 - 133,902 633,765 641,642
The contribution of this item mainly refers to 2 securities issued by the Parent Company in 2017 (total nominal value 500
million euro) under the Debt Issuance Programme (“DIP”), which were not separated from the embedded derivative.
HEDGING DERIVATIVES - ITEM 40
Hedging derivatives: breakdown by type of hedge and level of inputs
Banking group Insurance companies Other entities (thousands of euros) 30/06/2018 31/12/2017
A. Financial derivatives 656,371 1,388 100,222 757,981 667,714
1) Fair value 638,031 1,388 10,264 649,683 574,362
2) Cash flow 18,340 - 89,958 108,298 93,352
3) Investment in foreign operation - - - - -
B. Credit derivatives - - - - -
1) Fair value - - - - -
2) Cash flow - - - - -
Total 656,371 1,388 100,222 757,981 667,714
The contribution of this item is mainly attributable to the Parent Company, whose specific hedging derivatives with a
negative value at 30 June 2018 amount to around 510 million euro, while macro hedges with a negative value, relating to
loan portfolios, amount to around 146 million euro.
175
Half-yearly Financial Report 2018
Notes to the consolidated financial statements

FAIR VALUE CHANGE OF FINANCIAL LIABILITIES IN HEDGED PORTFOLIOS - ITEM 50
Fair value change of hedged financial liabilities
(thousands of euro)
Adjustment of hedged liabilities/Components of the group 30/06/2018 31/12/2017
1. Positive adjustments of financial liabilities 28,878 32,400
2. Negative adjustments of financial liabilities - -
Total 28,878 32,400
This item reports the net change in the value of the postal savings bonds portfolio hedged generically against interest
rate risk. The hedging relationship was interrupted in 2009 in view of the termination of the derivative hedging
instruments. The change in the fair value of the hedged bonds, determined up to the date of validity of the hedging
relationship, was subsequently transferred to profit or loss on the basis of the amortised cost of the originally hedged
postal savings bonds.
176 3. Half-yearly condensed consolidated financial statements at 30 June 2018

OTHER LIABILITIES - ITEM 80
Other liabilities: breakdown
(thousands of euro) Banking group Insurance
companies Other entities 30/06/2018 31/12/2017
Type of operation/Values
Items being processed 14,512 36,221 - 50,733 54,440
Amounts due to employees 8,078 1,447 105,872 115,397 126,535
Charges for postal funding service 449,007 - - 449,007 382,600
Tax payables 99,612 6,796 80,255 186,663 221,085
Construction contracts - - 1,393,600 1,393,600 1,353,298
Trade payables 12,892 34,092 5,019,161 5,066,145 5,147,107
Due to social security institutions 7,975 3,998 124,528 136,501 115,172
Accrued expenses and deferred income 1,803 3,088 1,067,747 1,072,638 437,114
Other items of insurance companies 26,130 19,938 - 46,068 70,821
- liabilities for premiums to be reimbursed - 19,724 - 19,724 30,051
- premium deposits - 214 - 214 -
- processing expenses - - - - 299
- collections from factoring being processed 26,130 - - 26,130 40,471
Other 58 80,123 1,480,908 1,561,089 1,812,690
Total 620,067 185,703 9,272,071 10,077,841 9,720,862
This item reports other liabilities not otherwise classified under the previous items and is broken down as follows.
For the Banking Group, the main items under this heading are:
the payable to Poste Italiane, of about 449 million euro, relating to the portion of commissions due in respect of the
products of the postal savings funding service not yet paid at the reporting date;
tax payables totalling around 99 million euro, mainly regarding the substitute tax levied on interest paid on postal
savings products.
With regard to Other Group entities, the item mainly regards:
trade payables of around 5,019 million euro, mainly related to Terna (around 2,413 million euro), Fincantieri (around
1,595 million euro), Snam (around 595 million euro), and Italgas (around 365 million euro);
contract work in progress of 1,394 million euro, mainly resulting from the activities of Fincantieri.
177
Half-yearly Financial Report 2018
Notes to the consolidated financial statements

PROVISIONS FOR RISKS AND CHARGES - ITEM 100
Provisions for risks and charges: breakdown
(thousands of euro) Banking group Insurance
companies Other entities 30/06/2018 31/12/2017
Items/Components
1. Provisions for credit risk relating to commitments and financial guarantees issued
229,445 - - 229,445 188,131
2. Provisions on other guarantees issued and other commitments
- - 105 105 -
3. Company pension plans - - - - -
4. Other provisions 58,836 124,305 2,416,502 2,599,643 2,615,810
4.1 legal disputes 41,061 2,890 324,635 368,586 343,018
4.2 staff costs 17,039 1,482 153,958 172,479 186,984
4.3 other 736 119,933 1,937,909 2,058,578 2,085,808
Total 288,281 124,305 2,416,607 2,829,193 2,803,941
The provisions for risks and charges at 30 June 2018 amounted to around 2,829 million euro.
This item includes the reclassification, upon first-time adoption of IFRS 9, of the payables for guarantees issued and
commitments that were recognised under the liability item “Other liabilities” at 31 December 2017.
The accruals included in the item 4.3 “Other provisions for risks and charges”, totalling approximately 2,059 million euro
at 30 June 2018, consist mainly:
of approximately 623 million euro relating to the provisions for the dismantling and reclamation of sites, recognised
mainly for liabilities that are likely to be incurred to remove the structures and reclaim natural gas storage and
transportation sites;
of about 306 million euro relating to the provisions for the reclamation and preservation of properties, as well as
provisions for commitments in respect of contracts. The estimate of the liabilities recognized is based both on
technical assessments (relating to the determination of works to be carried out or actions to be taken) and on legal
assessments, bearing in mind contractual provisions in force;
of around 56 million euro relating to liabilities for contractual guarantees issued to customers in line with market
practices and conditions;
of approximately 46 million euro relating to tax disputes.
178 3. Half-yearly condensed consolidated financial statements at 30 June 2018
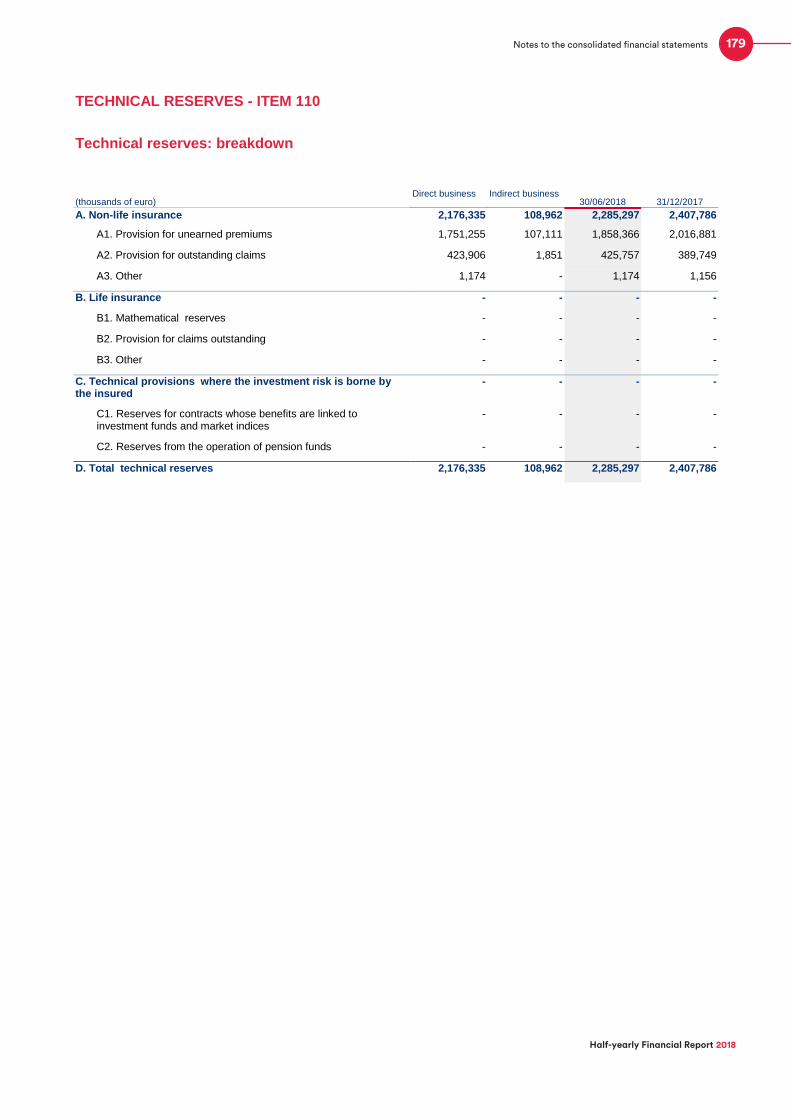
TECHNICAL RESERVES - ITEM 110
Technical reserves: breakdown
30/06/2018 31/12/2017 (thousands of euro) Direct business Indirect business
A. Non-life insurance 2,176,335 108,962 2,285,297 2,407,786
A1. Provision for unearned premiums 1,751,255 107,111 1,858,366 2,016,881
A2. Provision for outstanding claims 423,906 1,851 425,757 389,749
A3. Other 1,174 - 1,174 1,156
B. Life insurance - - - -
B1. Mathematical reserves - - - -
B2. Provision for claims outstanding - - - -
B3. Other - - - -
C. Technical provisions where the investment risk is borne by the insured
- - - -
C1. Reserves for contracts whose benefits are linked to investment funds and market indices
- - - -
C2. Reserves from the operation of pension funds - - - -
D. Total technical reserves 2,176,335 108,962 2,285,297 2,407,786
179
Half-yearly Financial Report 2018
Notes to the consolidated financial statements

GROUP’S EQUITY - ITEMS 120, 130, 140, 150, 160, 170 AND 180
“Share capital” and “Treasury shares”: breakdown
The share capital of the Parent Company of 4,051,143,264 euro at 30 June 2018 is fully paid up and is composed of
342,430,912 ordinary shares, without par value.
At 30 June 2018, the Parent Company held treasury shares with a value of 57,220,116 euro.
Share capital - Number of shares of the Parent Company: changes for the period
Items/Type Ordinary Other
A. Shares at start of the year 342,430,912 -
- fully paid 342,430,912 -
- partly paid - -
A.1 Treasury shares (-) (4,451,160) -
A.2 Shares in circulation: opening balance 337,979,752 -
B. Increases - -
B.1 New issues - -
- for consideration: - -
- business combinations - -
- conversion of bonds - -
- exercise of warrants - -
- other - -
- bonus issues: - -
- to employees - -
- to directors - -
- other - -
B.2 Sale of own shares - -
B.3 Other changes - -
C. Decreases - -
C.1 Cancellation - -
C.2 Purchase of own shares - -
C.3 Disposal of companies - -
C.4 Other changes - -
D. Shares in circulation: closing balance 337,979,752 -
D.1 Treasury shares (+) 4,451,160 -
D.2 Shares at end of the year 342,430,912 -
- fully paid 342,430,912 -
- partly paid - -
180 3. Half-yearly condensed consolidated financial statements at 30 June 2018

Group’s equity: breakdown
(thousands of euro) 30/06/2017 31/12/2017
1. Share capital 4,051,143 4,051,143
2. Share premium reserve 2,378,517 2,378,517
3. Reserves 14,319,024 12,981,676
4. Tresury shares (57,220) (57,220)
5. Valuation reserves 570,650 763,663
6. Equity instruments - -
7. Profit (loss) for the period 1,444,512 2,943,314
Total Group's equity 22,706,626 23,061,093
181
Half-yearly Financial Report 2018
Notes to the consolidated financial statements

INFORMATION ON THE CONSOLIDATED INCOME STATEMENT
INTEREST - ITEMS 10 AND 20
Interest income and similar income: breakdown
(thousands of euro) Item/Type Debt securities Loans Other 1st half 2018 1 st half 2017
1. Financial assets measured at fair value through profit or loss
11,381 521 94 11,996 4,541
1.1 Financial assets held for trading 3,806 - 94 3,900 2,796
1.2 Financial assets designated at fair value - - - - 1,745
1.3 Non -trading financial asstes mandatorily measured at fair value
7,575 521 - 8,096 -
2. Financial assets measured at fair value through other comprehesinve income
36,703 - X 36,703 47,273
3 Financial assets measured at amortised cost 621,081 3,147,280 X 3,768,361 3,749,921
3.1 Loans to banks 5,439 118,566 X 124,005 122,170
3.2 Loans to customers 615,642 3,028,714 X 3,644,356 3,627,751
4. Hedging derivatives X X (110,466) (110,466) 2,008
5. Other assets X X 6,796 6,796 102,954
6. Financial liabilities X X X 75,553 -
Total 669,165 3,147,801 (103,576) 3,788,943 3,906,697
Interest income accrued in the first half of 2018 amounted to 3,789 million euro, mainly contributed by the Parent
Company, and essentially consisting of:
interest income on loans to banks and customers, classified as financial assets measured at amortised cost, totalling
3,768 million euro (3,750 million euro in the first half of 2017);
interest income on financial assets measured at fair value through other comprehensive income, of around 37 million
euro.
Sub-item “4. Hedging derivatives” includes the (positive or negative) amount of differentials or margins accrued on
interest rate risk hedging derivatives that adjust the interest income recognised on the hedged financial instruments. At
30 June 2018, this amount is a negative figure of around 110 million euro.
Sub-item “6. Financial liabilities” includes interest accrued on financial liabilities which, due to negative remuneration,
gave rise to an income (interest income).
The item includes interest income on impaired financial assets of approximately 1.9 million euro.
182 3. Half-yearly condensed consolidated financial statements at 30 June 2018

Interest expense and similar expenses: breakdown
(thousands of euro) Item/Type Payables Securities Other 1st half 2018 1 st half 2017
1. Financial liabilities measured at amortised cost 1,970,052 317,301 - 2,287,353 2,381,124
1.1 Due to central banks - X X - -
1.2 Due to banks 76,702 X X 76,702 68,042
1.3 Due to customers 1,893,350 X X 1,893,350 1,992,724
1.4 Securities issued X 317,301 X 317,301 320,358
2. Financial liabilities held for trading - - 119 119 -
3. Financial liabilities designated at fair value 768 - - 768 -
4. Other liabilities and provisions X X 8,893 8,893 34,389
5. Hedging derivatives X X (62,403) (62,403) -
6. Financial assets X X X 18,538
Totale 1,970,820 317,301 (53,391) 2,253,268 2,415,513
Interest expense at 30 June 2018 amounts to around 2,253 million euro and is mainly attributable to:
remuneration of the Parent Company’s postal funding, amounting to approximately 1,916 million euro;
interest expense accrued on securities issued by the Parent Company of 163 million euro, by the industrial companies
of 141 million euro and by the SACE Group companies of 10 million euro.
Sub-item “5. Hedging derivatives” includes the (positive or negative) amount of differentials or margins accrued on
interest rate risk hedging derivatives that adjust the interest expense recognised on the hedged financial instruments. At
30 June 2018, this amount is a positive figure of around 62 million euro.
Sub-item “6. Financial assets” includes interest accrued on financial assets which, due to negative remuneration, gave
rise to a charge (interest expense).
183
Half-yearly Financial Report 2018
Notes to the consolidated financial statements
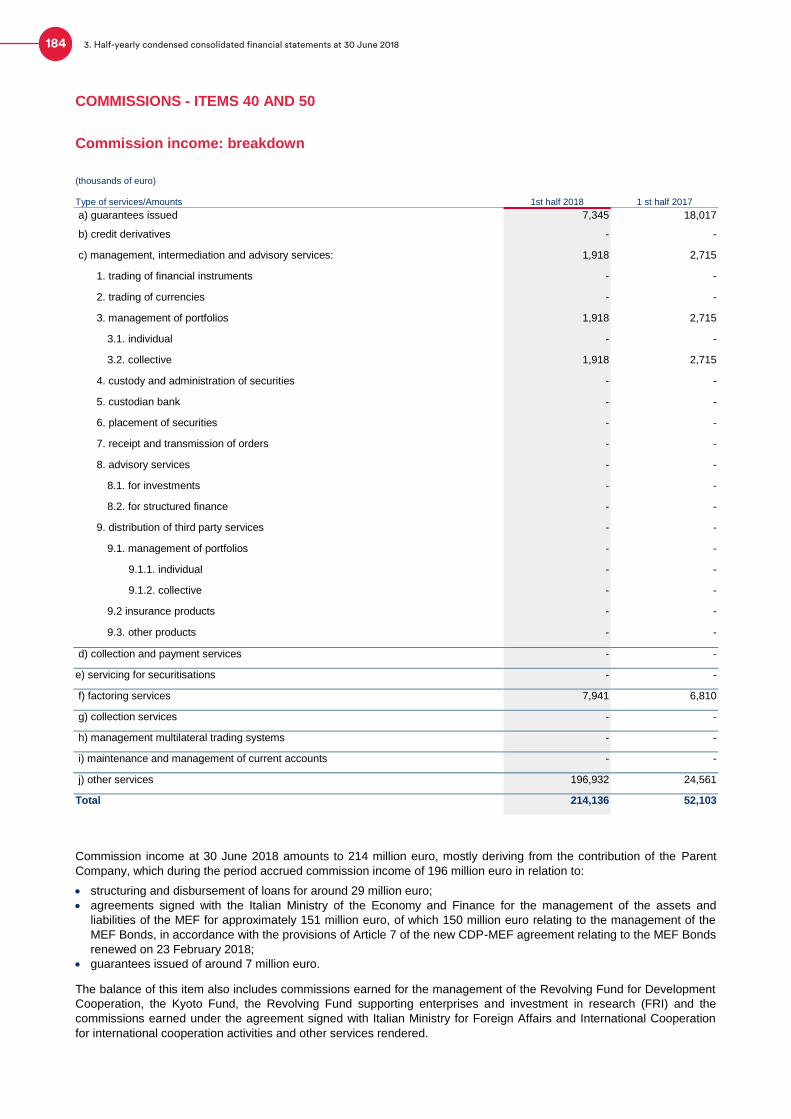
COMMISSIONS - ITEMS 40 AND 50
Commission income: breakdown
(thousands of euro)
Type of services/Amounts 1st half 2018 1 st half 2017
a) guarantees issued 7,345 18,017
b) credit derivatives - -
c) management, intermediation and advisory services: 1,918 2,715
1. trading of financial instruments - -
2. trading of currencies - -
3. management of portfolios 1,918 2,715
3.1. individual - -
3.2. collective 1,918 2,715
4. custody and administration of securities - -
5. custodian bank - -
6. placement of securities - -
7. receipt and transmission of orders - -
8. advisory services - -
8.1. for investments - -
8.2. for structured finance - -
9. distribution of third party services - -
9.1. management of portfolios - -
9.1.1. individual - -
9.1.2. collective - -
9.2 insurance products - -
9.3. other products - -
d) collection and payment services - -
e) servicing for securitisations - -
f) factoring services 7,941 6,810
g) collection services - -
h) management multilateral trading systems - -
i) maintenance and management of current accounts - -
j) other services 196,932 24,561
Total 214,136 52,103
Commission income at 30 June 2018 amounts to 214 million euro, mostly deriving from the contribution of the Parent
Company, which during the period accrued commission income of 196 million euro in relation to:
structuring and disbursement of loans for around 29 million euro;
agreements signed with the Italian Ministry of the Economy and Finance for the management of the assets and
liabilities of the MEF for approximately 151 million euro, of which 150 million euro relating to the management of the
MEF Bonds, in accordance with the provisions of Article 7 of the new CDP-MEF agreement relating to the MEF Bonds
renewed on 23 February 2018;
guarantees issued of around 7 million euro.
The balance of this item also includes commissions earned for the management of the Revolving Fund for Development
Cooperation, the Kyoto Fund, the Revolving Fund supporting enterprises and investment in research (FRI) and the
commissions earned under the agreement signed with Italian Ministry for Foreign Affairs and International Cooperation
for international cooperation activities and other services rendered.
184 3. Half-yearly condensed consolidated financial statements at 30 June 2018

The balance also includes commission income of 7.8 million euro received by the subsidiary SIMEST for the
management of Public Funds, 7.9 million euro for commissions for services related to factoring transactions of the
subsidiary SACE Fct, and commission income of 1.9 million euro accrued by the subsidiary CDPI SGR for the
performance of its own institutional portfolio management activity.
Commission expense: breakdown
(thousands of euro)
Services/Amounts 1st half 2018 1 st half 2017
a) guarantees received 12,050 6,443
b) credit derivatives - -
c) management and intermediation services: 790,790 799,987
1. trading of financial instruments 38 34
2. trading of currencies - -
3. management of portfolios 715 905
3.1 own portfolio 569 905
3.2 third-party portfolio 146 -
4. custody and administration of securities -
5. placement of financial instruments 790,037 799,048
6. door-to-door selling of financial instruments, products and services -
d) collection and payment services 1,270 2,289
e) other services 6,918 5,360
811,028 814,079
Commission expense totalled 811 million euro at 30 June 2018, almost exclusively attributable to the Parent Company
(788 million euro), and mainly related to the amount for the year, of around 783 million euro, of the remuneration paid to
Poste Italiane S.p.A. for managing postal savings products.
The commission expense for the postal savings service recognised during the first half of the year accrued under the
agreement signed in December 2017 between CDP and Poste Italiane S.p.A., for the three-year period 2018-2020.
Under that agreement, the annual commission will be calculated from 1 January 2018 as the sum of a part called
“Ordinary Commission” calculated on the overall average balance, and a part called “Campaigns Commission” calculated
on the gross funding from specific types of postal savings bonds.
Commission expense of 14 million euro was recognised by the Fincantieri group and mainly related to commissions due
on guarantees received.
DIVIDENDS AND SIMILAR REVENUES - ITEM 70
Dividends and similar revenues: breakdown
The balance of this item at 30 June 2018, of around 3 million euro (1 million euro at 30 June 2017) mainly relates to the
dividends earned by the Snam group from unconsolidated non-controlling interests.
PROFITS (LOSSES) ON TRADING ACTIVITIES - ITEM 80
The profits (losses) on trading activities show a profit of around 26 million euro at 30 June 2018, essentially due to the
overall profit of 21 million euro on financial derivative instruments, mainly earned by the insurance group companies, the
Parent Company and the Fincantieri group.
FAIR VALUE ADJUSTMENTS IN HEDGE ACCOUNTING - ITEM 90
The fair value adjustments in hedge accounting at 30 June 2018 show a negative amount of 20.5 million euro (negative
amount of 13 million euro at 30 June 2017). The measurement component closed with a net negative amount of 12.3
million euro, while the disposals component recorded a negative amount of around 8.2 million euro.
185
Half-yearly Financial Report 2018
Notes to the consolidated financial statements
GAINS (LOSSES) ON DISPOSAL OR REPURCHASE - ITEM 100
The balance of this item at 30 June 2018 is a gain of 57 million euro (loss of 5 million euro at 30 June 2017) and is
attributable almost exclusively to the operations of the Parent Company, which contributed 55.3 million euro.
The positive balance for the first half of 2018 is mainly due to the fees received from customers for the early repayment
of mortgage loans (39 million euro) and to the net positive imbalance of profits/losses recorded on the sale of debt
securities (around 16 million euro).
PROFITS (LOSSES) ON FINANCIAL ASSETS AND LIABILITIES MEASURED AT FAIR VALUE THROUGH PROFIT OR LOSS - ITEM 110
The profits (losses) on financial assets measured at fair value through profit or loss show a net loss of 34 million euro at
30 June 2018, attributable almost exclusively to the financial assets classified as mandatorily measured at fair value.
The balance at 30 June 2018 is mainly due to the contribution of the Parent Company in relation to units in collective
investment undertakings and the contribution of insurance companies in relation to capital losses on debt securities.
NET ADJUSTMENTS/RECOVERIES FOR CREDIT RISK - ITEM 130
This item shows a loss of around 48 million euro at 30 June 2018 and almost exclusively relates to the net balance
between adjustments and recoveries for credit risk calculated on an individual and collective basis and related to
financial assets measured at amortised cost.
For financial assets that are performing (stages 1 and 2) value adjustments are calculated as a function of the risk
parameters represented by probability of default (PD), loss given default (LGD) and exposure at default (EAD). If, in
addition to a significant increase in credit risk, there is also objective evidence of an impairment loss (stage 3), the
amount of the loss is measured as the difference between the contractual cash flows that are provided for contractually
and all the cash flows that one would expect to receive, discounted at the original effective interest rate.
The amount of the loss to be recognized through profit or loss is calculated based on an analytical assessment process
or for categories of the same kind and thus attributed analytically to each position and takes account of forward-looking
information and possible alternative recovery scenarios.
186 3. Half-yearly condensed consolidated financial statements at 30 June 2018

Net adjustments for credit risk relating to financial assets measured at amortised cost: breakdown
Adjustments
Recoveries
(thousands of euro)
Stage 1 e 2
Stage 3 Stage 1 e 2 Stage 3
1st half 2018 1st half 2017 P&L items Write - off Other
A. Loans to banks (2,793) - - 9,250 - 6,457 (3,496)
- Loans (2,790) - - 8,943 - 6,153 (3,028)
- Debt securities (3) - - 307 - 304 (468)
of which: impaired loans acquired or originated
- - - - - - -
B. Loans to customers (63,299) - (20,862) 20,213 9,674 (54,274) (12,479)
- Loans (56,952) - (20,862) 19,223 9,674 (48,917) (11,044)
- Debt securities (6,347) - - 990 - (5,357) (1,435)
of which: impaired loans acquired or originated
- - (3) - - (3) -
C. Total (66,092) - (20,862) 29,463 9,674 (47,817) (15,975)
Net adjustments for credit risk relating to financial assets measured at fair value through other comprehensive income: breakdown
Adjustments Recoveries
(thousands of euro) Stage 1 and 2
Stage 3 Stage 1 and 2
Stage 3
P&L items Write - off Other 1st half 2018 1st half 2017
A. Debt securities (1,324) - - 786 - (538) -
B. Loans - - - - - - -
- due to customers - - - - - - -
- due to banks - - - - - - -
of which: impaired financial assets acquired or originated
- - - - - - -
Total (1,324) - - 786 - (538) -
187
Half-yearly Financial Report 2018
Notes to the consolidated financial statements

NET PREMIUM INCOME - ITEM 160
Net premium income: breakdown
(thousands of euro)
Direct work Indirect work
Premiums from insurance activity 1st half 2018 1st half 2017
A. Life insurance
A.1 Gross premium income recognised (+) - - - -
A.2 Premiums transferred to reinsurance (-) - X - -
A.3 Total - - - -
B. Non-life insurance
B.1 Gross premium income recognised (+) 132,418 7,378 139,796 239,014
B.2 Premiums transferred to reinsurance (-) (21,805) X (21,805) (44,231)
B.3 Change in gross amount of provision for unearned premiums (+/-) 91,489 (212) 91,277 220,151
B.4 Change in reinsurer's share of provision for unearned reserves (-/+)
(87,248) 442 (86,806) 15,409
B.5 Total 114,854 7,608 122,462 430,343
C. Total net premium income 114,854 7,608 122,462 430,343
NET OTHER INCOME (EXPENSE) FROM INSURANCE OPERATIONS - ITEM 170
Net other income (expense) from insurance operations: breakdown
(thousands of euro)
Items 1st half 2018 1st half 2017
1. Net change in technical provisions (2,598) (2,849)
2. Claims accrued and paid during the year (36,283) 95,619
3. Other net profit (loss) on insurance operations (8,636) (12,559)
Total (47,517) 80,211
188 3. Half-yearly condensed consolidated financial statements at 30 June 2018

ADMINISTRATIVE EXPENSES – ITEM 190
Staff costs: breakdown
(thousands of euro) Banking group
Insurance companies
Other entities
Type of expenses/Sectors 1st half 2018 1st half 2017
1) Employees 61,875 32,895 826,408 921,178 877,384
a) wages and salaries 45,557 21,201 575,128 641,886 606,236
b) social security costs 253 6 32,595 32,854 30,219
c) staff severence pay 230 492 11,116 11,838 10,429
d) pension costs 9,211 5,878 146,178 161,267 168,562
e) allocation to staff severance pay 64 55 2,599 2,718 2,021
f) allocation to provision for post-employment benefits 77 129 86 292 351
- defined contribution 77 129 86 292 351
- defined benefit - - - - -
g) payments to external supplementary pensions funds:
2,462 1,732 27,401 31,595 30,945
- defined contribution 2,462 1,732 26,093 30,287 29,673
- defined benefit - - 1,308 1,308 1,272
h) costs arising from share-based payment arrangements
- - 1,576 1,576 -
i) other employee benefits 4,021 3,402 29,729 37,152 28,621
2) Other personnel in service 253 208 2,868 3,329 5,203
3) Board of Directors and Board of Auditors 694 347 7,179 8,220 7,970
4) Retired personnel - - - - -
Total 62,822 33,450 836,455 932,727 890,557
Other administrative expenses: breakdown
(thousands of euro) Banking group Insurance
companies Other entities
Type of expenses/Amounts 1st half 2018 1st half 2017
IT costs 13,102 2,345 33,792 49,239 66,388
General services 1,962 2,169 2,078,216 2,082,347 1,804,272
Professional and financial services 4,461 2,024 176,102 182,587 214,960
Publicity and marketing expenses 872 717 12,884 14,473 13,800
Other personnel-related expenses 1,208 1,053 14,025 16,286 14,434
Utilities, duties and other expenses 6,275 3,101 101,026 110,402 111,842
Information resources and databases 871 - 2,555 3,426 3,451
Corporate bodies 157 - 132 289 275
Total 28,908 11,409 2,418,732 2,459,049 2,229,422
189
Half-yearly Financial Report 2018
Notes to the consolidated financial statements

NET ACCRUALS TO THE PROVISIONS FOR RISKS AND CHARGES - ITEM 200
Net accruals to the provisions for risks and charges for commitments and guarantees issued
Net accruals to the provisions for risks and charges for commitments and guarantees issued amount to 1.1 million euro
and mainly relate to provisions made by the Parent Company.
Net accruals to other provisions for risks and charges: breakdown
(thousands of euro) Allocations Uses 1st half 2018
Type of transactions/Values
Net provisions for legal disputes (22,429) 1,853 (20,576)
Net provisions for sundry expenses for personnel - 510 510
Net provisions for tax disputes (33) - (33)
Net sundry provisions (56,876) 32,809 (24,067)
Total (79,338) 35,172 (44,166)
190 3. Half-yearly condensed consolidated financial statements at 30 June 2018
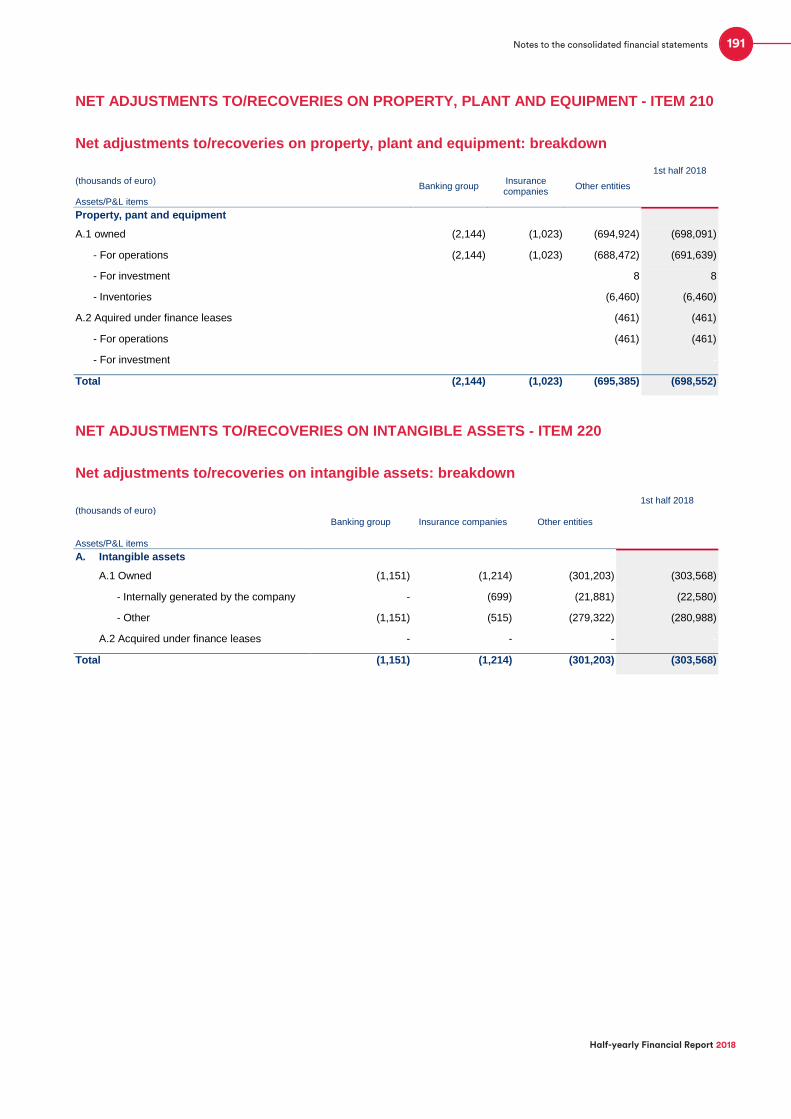
NET ADJUSTMENTS TO/RECOVERIES ON PROPERTY, PLANT AND EQUIPMENT - ITEM 210
Net adjustments to/recoveries on property, plant and equipment: breakdown
(thousands of euro) Banking group
Insurance companies
Other entities
1st half 2018
Assets/P&L items
Property, pant and equipment
A.1 owned (2,144) (1,023) (694,924) (698,091)
- For operations (2,144) (1,023) (688,472) (691,639)
- For investment - - 8 8
- Inventories - - (6,460) (6,460)
A.2 Aquired under finance leases - - (461) (461)
- For operations - - (461) (461)
- For investment - - - -
Total (2,144) (1,023) (695,385) (698,552)
NET ADJUSTMENTS TO/RECOVERIES ON INTANGIBLE ASSETS - ITEM 220
Net adjustments to/recoveries on intangible assets: breakdown
(thousands of euro)
Banking group Insurance companies Other entities
1st half 2018
Assets/P&L items
A. Intangible assets
A.1 Owned (1,151) (1,214) (301,203) (303,568)
- Internally generated by the company - (699) (21,881) (22,580)
- Other (1,151) (515) (279,322) (280,988)
A.2 Acquired under finance leases - - - -
Total (1,151) (1,214) (301,203) (303,568)
191
Half-yearly Financial Report 2018
Notes to the consolidated financial statements

OTHER OPERATING INCOME (COSTS) - ITEM 230
Other operating costs: breakdown
(thousands of euro)
Banking group Insurance companies Other entities
Type of costs/Figures 1st half 2018 1st half 2017
Depreciation of leasehold improvements - - 472 472 499
Other 367 1,857 34,202 36,426 118,845
Total 367 1,857 34,674 36,898 119,344
Other operating income: breakdown
(thousands of euro)
Banking group Insurance companies Other entities Type of costs/Figures 1st half 2018 1st half 2017
Income for company engagements to employees 182 - 96 278 405
Recovery of expenses 76 8 21,333 21,417 3,047
Rental income and other income from property management
682 309 7,083 8,074 79,061
Revenues from industrial management - - 5,635,101 5,635,101 5,291,688
Other 896 6,222 65,361 72,479 49,650
Total 1,836 6,539 5,728,974 5,737,349 5,423,851
Revenues from industrial operations mainly derive from:
Fincantieri, in the amount of 2,471 million euro;
Snam, in the amount of 1,258 million euro;
Terna, in the amount of 1,125 million euro;
Italgas, in the amount of 782 million euro.
GAINS (LOSSES) ON EQUITY INVESTMENTS - ITEM 250
Net gains on equity investments, of approximately 675 million euro (356 million euro at 30 June 2017), comprise the
results of the measurement at equity of investments subject to significant influence or joint operations and are mainly due
to:
the positive effect of the measurement at equity of the investment in ENI (489 million euro), Poste Italiane (173 million
euro), TAG (39 million euro), TIGF Holdings S.A.S. (15 million euro) and Toscana Energia (9.6 million euro);
the negative effect of the measurement at equity of Open Fiber (16.5 million euro), Saipem (approximately 41.1 million
euro) and Ansaldo Energia (8.7 million euro).
GAINS (LOSSES) ON DISPOSAL OF INVESTMENTS - ITEM 280
This item shows losses of 2.2 million euro at 30 June 2018, and consists of gains on the disposal of investment property,
offset by losses on the disposal of other assets.
192 3. Half-yearly condensed consolidated financial statements at 30 June 2018

RISK MONITORING
To guarantee an efficient risk management system, CDP has adopted rules, procedures, resources (human,
technological, and organisational), and control activities to identify, measure or evaluate, monitor, prevent or mitigate,
and communicate all risks assumed or that can be assumed in the different segments to the appropriate reporting levels.
Risk management considers the specific characteristics of the activity performed, and is implemented in compliance with
the regulatory requirements.
Within the organisational structure of CDP, the Chief Risk Officer (CRO), who reports directly to the Chief Executive
Officer (CEO), is responsible for the governance of all types of risk and the clear presentation of the overall risk profile
and solidity of CDP to the Board of Directors. As part of this mandate, the CRO coordinates the activities of the Risk
Management Area (RM), the Risk Governance Area, the Compliance and Anti-Money Laundering Area and the Risk
Operations Area. RM is responsible for supporting the CRO with the governance and monitoring of all types of risks,
rendering transparent the overall risk profile of CDP and the capital requirements associated with each category of risk.
These types of risk are defined by the Risk Policy approved by the Board of Directors in 2010 and subsequently updated
as necessary. They are classifiable in terms of market risks (which include equity risk, interest rate risk, inflation risk, and
exchange rate risk), liquidity risk, credit risk (which includes concentration and counterparty risks), operational risks, and
reputation risks. The Risk Policy is updated semi-annually and includes the Risk Management Rules and the related
documents, each of which focuses on a specific category of risks (e.g. interest rate risk) or area exposed to those risks
(e.g. treasury operations and investment in securities). The Risk Policy represents a key tool used by the Board of
Directors to define the risk appetite of CDP, the tolerance thresholds, risk limits, risk management policies, and
framework of related organisational processes.
The guidelines governing the risk management of CDP are summarised in the Risk Management Rules and envisage:
the separation of roles and responsibilities in the assumption and control of risks;
the organisational independence of risk control from the operational management of risks;
rigorous risk measurement and control systems.
The Board Risk Committee is set up within the Board of Directors and has control and guidance functions with respect to
risk management and the assessment of the adoption of new products. The CEO is supported by the Internal Risk
Committee. This technical and advisory body gives opinions on policy and control issues concerning the overall risk
profile of CDP and operating assessment of especially important risks.
RM verifies compliance with the limits set by the Board of Directors and the operating limits established by the CEO,
recommending corrective measures to the Risk Committee that might be necessary to ensure compliance with the Risk
Policy and the risk profile chosen by CDP, monitoring the use of economic capital with respect to capital requirements
and participating in capital management activities.
Within the banking group companies, the bodies participating in the risk and control management systems consist not
only of top management but also of second-level control functions (Risk Management, Compliance, Anti-Money
Laundering) and third-level control functions (Internal Auditing).
1. CREDIT RISK
The principles adopted by CDP in its lending activities involving the assumption of credit risk are set out in the Lending
Rules, which also govern the lending process and the roles of the units involved.
The Risk Operations Area assesses the proposals made by the CDP business units, as well as the most significant
transactions submitted for the formulation of a governance opinion by the subsidiaries. It is also responsible for issuing
the internal rating and estimate of the Loss Given Default. These parameters are used for management and accounting
purposes and are determined in accordance with the Risk Policy and the Rating and Recovery Rate Policy. This latter
document is approved by the CEO, who applies the methods adopted by CDP for the assignment of internal ratings to
counterparties and in producing internal estimates of the recovery rate for individual financing transactions. The Risk
Operations Area is also responsible for the periodic review of loans, as regards the evolution of the counterparty’s
financial situation and developments in their industry.
The Risk Management Area is responsible for the methods used to determine the risk-adjusted pricing, to monitor the
use of economic capital, and to measure the portfolio concentration. The Risk Management Area regularly monitors the
overall performance of loan portfolio risk, also to identify corrective measures designed to optimise the risk/return profile.
The credit risk responsibilities of the Risk Management Area also include:
193
Half-yearly Financial Report 2018
Notes to the consolidated financial statements

performing specific controls to ensure that the performance of individual exposures is properly monitored, and
especially the performance of non-performing loans, that the classifications are consistent, that the accrued provisions
are adequate, and that the recovery process is adequate;
preparing opinions on specific loan transactions, in the cases stipulated in the policies in effect from time to time;
the definition, selection, and implementation of models, methods, and instruments of the internal rating system,
guaranteeing that it is constantly monitored and updated.
With regard to non-performing counterparties, the Risk Operations Area reviews any proposals made for restructuring –
where necessary with the support of other Areas for more complex cases – while the Risk Management Area performs a
second-level control. Contractual amendment requests for performing loans (“waivers”) are managed instead by the
Transactions Management Area, with the support of other Areas for more complex cases where necessary.
The CDP Group’s risk management consists of a specific governance process for the most significant transactions in
terms of risk, identified based on the structure approved by the Parent Company’s Board of Directors in setting the
guidelines for the assumption of credit risk for the subsidiaries included in the “credit group” 24. As mentioned above, a
non-binding opinion must be obtained from the Parent Company for these transactions. In addition, the Group Risk
Committee has been established and tasked with issuing opinions on the Group’s risk monitoring and assessment
systems, and on its risk policies and Group transactions with the greatest impact.
The management of credit risk connected with the factoring activities carried out by SACE Fct is governed by internal
corporate regulations. These apply from the initiation of contact and preliminary assessment of the counterparty, to
possible management of credit collection.
The factoring process is broken down into the following phases: (i) an investigation aimed at preparing an initial
assessment of the counterparty; (ii) a decision based on the thresholds and delegations of authority deriving from
assessment of its creditworthiness; (iii) execution of the relationship, (iv) revision of the expiring credit facilities, with a
new review and decision-making process; (v) operational management and management of anomalous loans, requiring
possible value adjustments, the commencement of judicial or extra-judicial proceedings for credit recovery or, if it is
decided not to pursue legal action, the preparation of an irrecoverable credit report.
The entire group adopts procedures for the credit risk management and measurement aimed at assessing the quality of
credit assets. This is done both when the loan is first granted/approved and through the lifetime of the loan, by monitoring
the performance of portfolio positions.
In regard to the credit risk management and control policies of the Separate Account, the Parent Company adopts a
system for approving loans to local entities. This system can be used to classify each loan in uniform risk categories, by
adequately defining the risk level associated with the individual entities, with the aid of quantitative parameters that are
differentiated by type of entity and their individual dimensions. This loan approval system uses qualitative and
quantitative criteria to identify the cases where the debtor’s creditworthiness requires further analysis.
For the Ordinary Account and loans to private-sector parties under the Separate Account portfolio, CDP uses a validated
proprietary model to calculate portfolio credit risk. CDP also uses this system to calculate the economic capital
associated with the entire loan portfolio, with the sole exception of positions associated with country risk.
The Risk Management Area monitors compliance with the system of limits and the guidelines for composition of the loan
portfolio, which are an integral part of the Risk Policy, approved by the Board of Directors. The limits are set according to
the credit rating of each counterparty, and become stricter as the rating and recovery rate decrease, according to
proportions based on the extent of capital being used. Specific country risk limits are also established.
The Risk Management Area also conducts stress tests on the level of risk in the loan portfolio, based on assumptions of
generalised deterioration in the portfolio’s creditworthiness, increased probability of default, decreased recovery rates
and increased correlation parameters.
The methods adopted for the assignment of internal ratings aim to ensure compliance with an adequate level of
transparency and consistency, including through traceability of the assignment process.
Developed by specialised outsourcers, the internal rating models used as benchmark tools in the internal rating
assignment process are broken down according to the principal types of CDP customers, based on their size, legal form,
and sector.
In line with agency rating practice, the scale of ratings adopted by CDP is broken down into 21 classes, of which 10 are
for “investment grade” positions and 11 for “speculative grade”. A class is also used for counterparties in default. Given
24 CDP’s credit group, as defined for internal management purposes, comprises CDP S.p.A., SACE S.p.A., SACE FCT S.p.A., SACE BT S.p.A. and Simest
S.p.A.
194 3. Half-yearly condensed consolidated financial statements at 30 June 2018
the limited number of historical defaults in the CDP portfolio, also considering the type of borrowers, default probabilities
are calibrated on the basis of long-term default rates (through the cycle) calculated using databases acquired from a
specialised provider.
Default is defined in accordance with the supervisory regulations for banks issued by the Bank of Italy.
The internal estimates of Loss Given Default take into account the different types of guarantees, as well as recovery
times, and are differentiated by category of customer.
The rating system is used in the loan approval process (for private individuals also in the setting of risk-adjusted prices),
to monitor loan performance, to calculate general provisions, within the limits framework and to measure the use of
capital. The risk assessment assigned to the counterparty is updated at least annually. However, it is reviewed at any
time during the year whenever events occur or information is acquired that significantly affect the credit rating.
In accordance with its own operations, SACE Fct has developed an internal scoring model for the assessment of public
counterparties and, more specifically, of municipalities and provincial authorities. In that area, the Company
complements the qualitative rating given by the AIDA PA rating tool (rating on 11 classes) with another six indicators,
representing the creditworthiness of the public counterparties. The internally determined score is compared with the
appropriate thresholds. Scores higher than those thresholds qualify the analysed counterparty for a positive rating.
2. COUNTERPARTY RISK
In order to mitigate the counterparty risk generated by transactions in derivatives, new loans are allowed only with
counterparties with which framework netting arrangements, supported by Credit Support Annex that provide for the
exchange of collateral (under ISDA 2002), are in place.
Securities financing transactions utilise GMRAs (Global Master Repurchase Agreement, ISMA 2000 format). In addition,
CDP has long since joined the Cassa di Compensazione e Garanzia (Clearing House), through which it transacts in repo
agreements while benefiting from robust protections against counterparty risk.
3. INTEREST RATE RISK
As part of its activities, the Parent Company is exposed to interest rate risk in all its forms: repricing, yield curve, basis
and optionality. It also monitors inflation risk within the same conceptual and analytical framework as interest rate risk on
the banking book. The interest rate and the inflation risks can affect the profits and economic value of the Group.
With respect to specific activities, CDP faces a substantial level of interest rate risk for the structure of assets and
liabilities: a considerable portion of CDP’s balance sheet consists of funding through Ordinary Fixed-rate Bonds with an
early redemption option, while the stock of loans is mainly fixed rate. Other types of Postal Savings Bonds also include
an early redemption option whose value is significantly affected by interest rates and inflation.
The basic approach taken by CDP to measuring and managing interest rate risk is an “economic value perspective”,
which complements the “profitability perspective”. The economic value perspective corresponds to the long-term
representation of the profitability perspective, as economic value is essentially equal to the discounted sequence of
future net interest income.
From this perspective, CDP analyses its exposure and risk profile by assessing balance sheet items that are sensitive to
interest rates, quantifying their reaction to small changes (sensitivity analysis) and major shocks (stress testing) to the
risk factors. The transition from exposure metrics (derived from the sensitivity analyses and stress testing) to risk metrics
is carried out by assigning a probability to possible market scenarios. This gives a statistical distribution of the value of
the balance sheet items and composite indicators representing the economic capital necessary for the risks involved.
This monitoring structure is translated into the calculation of value at risk (VaR), which CDP calculates using methods
based on historical simulation.
To quantify and monitor the interest rate risk of the banking book, CDP measures VaR both over short time horizons –
such as over one day or ten days – and annually, which is more suited to internal assessment of capital adequacy, with
particular regard to risk pertaining to the banking book. The short-term and annual measures of VaR share the same
combination of models for valuing balance sheet items and measuring sensitivity, and they use the same input data. The
daily VaR is used for backtesting, because there is a larger pool of figures available over that interval.
VaR summarises in a single figure the results of the simulation of many scenarios generated in accordance with the
statistical characteristics of the risk factors.
195
Half-yearly Financial Report 2018
Notes to the consolidated financial statements

CDP’s Risk Policy sets specific limits to manage the exposure to interest rate and inflation risk. More specifically, limits
have been established on the impact on the economic value of parallel shifts (+/- 100 basis points) in the yield curve and
the inflation curve. In addition to these limits, further, more granular limits are in place, which are set by the Chief
Executive Officer.
CDP also assesses the impact of interest rate risk on income for shorter horizons using internal planning and ALM
systems, specifically quantifying the impact of parallel shifts in the yield curve on net interest income.
CDP’s ALM approach seeks to limit the volume of hedging derivatives by exploiting “operational hedges” between fixed-
rate assets and liabilities. Hedging therefore regards subsets of those items, depending on the sign of the net exposure,
with a view to containing the overall risk exposure.
Operational responsibility for managing interest rate risk lies with the Finance Area.
The measurement and the monitoring of interest rate risk are performed by the RMA and discussed within the Finance
Committee. The Board of Directors approves risk management policies and the associated monitoring methods and
receives periodic reports on the results achieved.
SACE Fct monitors and manages interest rate risk according to the provisions of the specific policy and by setting
appropriate operating limits. Risk management is ensured by the Budget and Treasury Department, in close
collaboration with the Risk Management Department, through operating management of assets and liabilities in
compliance with the guidelines defined by the Board of Directors.
The Company carefully monitors any mismatching between assets and liabilities. Interest risk originates especially from
final purchases of receivables (where the consideration to be paid is determined by discounting the face value of the
acquired receivables at the pre-set interest rate). These transactions constitute fixed-rate transactions of an uncertain
duration, insofar as the maturity date of the transaction also has to consider any period estimated for any delays in final
receipt.
The interest rate risk associated with standard transactions with and without recourse is minimal. The reason is that
these are variable rate transactions with monthly repricing financed through floating or fixed rate funding with short-term
maturities (from 1 to 3 months).
CDP Investimenti SGR is not directly exposed to interest rate and inflation risks resulting from its own activity but in
relation to investments of liquidity. It invests principally in fixed-rate securities issued by the Italian Government and in the
postal savings bonds issued by the Parent Company.
4. LIQUIDITY RISK
Liquidity risk is construed in the sense of “asset liquidity risk” and of “funding liquidity risk”.
Since the Parent Company, SACE Fct and CDP Investimenti SGR do not engage in trading activities, the exposure to
liquidity risk in the sense of asset liquidity risk25 is limited.
For the Parent Company, liquidity risk becomes significant mainly in the form of funding liquidity risk26, in view of the
dominant weight of demand deposits (passbook savings accounts) and bonds redeemable on demand (postal savings
bonds) in the liabilities of the Separate Account.
In order to ensure that any scenario of uncontrolled redemptions remains remote, CDP benefits from the mitigating effect
of the state guarantee on postal savings. In addition to the key function of that guarantee, the ability of CDP to ensure
that such a scenario does in fact remain remote is based on its capital strength, on the protection and promotion of the
reputation of postal savings with the public, on safeguarding CDP’s reputation in the market and on liquidity
management. With regard to the latter, CDP adopts a series of specific measures to prevent the emergence of
unexpected funding requirements and to be able to meet them if it should prove necessary.
To this end, a lower limit on the stock of liquid assets has been established, which is monitored by the RMA, together
with a number of aggregates that represent the capacity of CDP to cope with potential crisis situations. As an operational
protection measure for liquidity risk, CDP has adopted a Contingency Funding Plan (CFP). The CFP sets out the
processes and strategies used by CDP to manage possible liquidity crises, whether of systemic origin – caused by an
unexpected deterioration in monetary and financial market conditions – or due to idiosyncratic difficulties at CDP itself.
As regards the Ordinary Account, CDP raises funds through the market or the European Investment Bank (EIB),
adopting approaches, opportunities and constraints more similar to those of ordinary banks.
25 Asset liquidity risk means the impossibility, for a financial institution or a generic investor, of selling assets on the market without significantly reducing
their price. 26 Funding liquidity risk means the impossibility, for a financial institution, to meet its obligations by collecting liquidity at non-penalising conditions or selling
assets held.
196 3. Half-yearly condensed consolidated financial statements at 30 June 2018

CDP prevents the emergence of unexpected liquidity requirements by developing effective loan disbursement forecasting
systems, setting structural limits on maturity transformation, monitoring the short-term liquidity position, carried out on a
continuous basis by the Finance area, and monitoring liquidity gaps at medium and long term, which is performed by the
Market Risk & ALM Department.
Management of treasury activities by the Finance area enables CDP to raise funds using repos, for both the Separate
and Ordinary Accounts.
CDP can also take part in European Central Bank refinancing operations, as it holds a significant stock of eligible
negotiable and non-negotiable assets.
As a further control, both for the Separate and the Ordinary Account, RMA monitors an incremental available liquidity
buffer, in a stress scenario, through transactions with the European Central Bank and refinancing on the liquid securities
market.
The controls put in place are supported by a stress test used in order to assess the potential effects of an extremely
unfavourable scenario on the liquidity position.
With regard to SACE Fct activities, the “Liquidity Risk Policy” defines the roles and responsibilities of the corporate
bodies and corporate units involved in the process and the methods of measuring, managing, and monitoring liquidity
risk. Moreover, a Contingency Funding Plan defines the strategies for management of a possible liquidity crisis and the
specific procedures to be implemented in response to adverse fund-raising situations.
In regard to liquidity risk, CDPI SGR is potentially exposed to the risk of a cash shortfall caused by the reduction in the
management fees received on the funds under management, calculated as a percentage of the net aggregate value
(FIA27) and the total value of the assets (FIV and FIT28).
Any fluctuations in the value of units in collective investment undertakings and/or the real estate in which the managed
funds invest would consequently impact the management fees received. At present, that risk appears insignificant29.
From an operating point of view, liquidity risk is monitored through careful planning of Company cash flows (financial
forecast), prepared by the Administration, Finance and Control unit and updated monthly.
5. OPERATIONAL RISKS
CDP has adopted the guidelines established by the Basel Committee for the banking industry and incorporated by the
Bank of Italy in Circular no. 285 of 17 December 2013 as the benchmark for managing operational risk.
Operational risk means the risk of loss resulting from inadequate or failed internal processes, people and systems or
from external events. Such risk includes, among others, losses resulting from internal or external fraud, human error,
employment relationships and workplace safety, business disruption, system unavailability, breach of contract, process
management, damage to company assets and natural disasters.
Operational risk includes legal risk but not strategic or reputational risk.
The “legal risk” is the risk of incurring losses resulting from violations of laws or regulations, from contractual or tortious
liability or from other disputes.
The operational risk management system is a set of structured processes, functions and resources for identifying,
assessing and controlling the above-mentioned risks. Its main objective is to ensure effective prevention and mitigation of
such risks.
Apart from adopting best practice in the banking sector as a reference, CDP pays particular attention to industrial sector
benchmarks for the management of operational risks. The methodological and organizational framework implemented is
aimed at capturing the company’s actual risk profile, similarly to what occurs in the most advanced corporates, which
actively manage operational risks even though they are not subject to capital requirements.
The objective is to improve corporate processes and the Internal Control System, so as to lay the foundations for more
targeted mitigation measures and to make a more accurate quantification of the associated economic capital, currently
estimated using the Basic Indicator Approach.
The Operational Risks Department, operating within the Risk Management Area, is the Unit responsible for designing,
implementing and monitoring the methodological and organizational framework for the assessment of the exposure to
27 Fondo Investimenti per l’Abitare. 28 Respectively: Fondo Investimenti per la Valorizzazione and Fondo Investimento Turismo. 29 Example: by simulating a 5-year time horizon, the prudent assumptions of (i) missed growth in received management fees as compared with the levels
recorded during the last financial year and (ii) 8% growth on annual basis in management costs and staff, the cash gaps would not appear.
197
Half-yearly Financial Report 2018
Notes to the consolidated financial statements
operational risks, the initiation of remediation measures - in agreement with the organization units involved - and the
preparation of reporting to the Top Management.
The adopted framework involves the inclusion of information on operational losses classified according to specified Loss
Event Types (i.e. a Model of loss events), Loss Effect Types (i.e. a Model of types of losses) and Risk Factors (i.e. a
Model for the classification of risk factors).
With a view to implementing integrated management of events, so as to combine into a single decision-making step the
assessment of mitigation actions defined during both Risk Assessment and Loss Data Collection, a dedicated Working
Group has been established for the analysis of the corrective measures identified to control operational risks.
The Operational Risk Department monitors the status of the corrective actions initiated by periodically checking their
progress with the individuals responsible for the actions taken and/or to be taken.
The results of the activities performed are shared and disseminated through dedicated reports, which detail operational
risk exposures and detected losses. In this way, information on operational risks is provided to the Top Management and
the managers of the business units involved, in order to enable the implementation of the most appropriate corrective
actions.
In line with the mission of the Operational Risk Department, which is to develop and disseminate awareness of
operational risks within the Company, training courses addressed to all the staff involved in the analyses have been
organised.
Other periodical actions organised by the Operational Risk Department for the staff concerned include training, also in
the form of on-the-job training. These actions ensure that the bank officers concerned have appropriate knowledge of the
process and of its attendant responsibilities, so as to make the best use of support tools.
The aim is to put in place a coordinated approach at all levels within the Company, which can be achieved by wide
dissemination of operational risk awareness.
6. RISK OF MONEY LAUNDERING AND FINANCING OF TERRORISM
Group-level strategic decisions about managing the risk of money laundering and financing of terrorism are the
responsibility of the Parent Company's corporate bodies, which set out counterparty acceptance policies, introducing the
obligation to refrain from establishing any type of relationship under certain conditions which may expose the company to
an unacceptable level of risk. In this respect, the Parent Company involves the subsidiaries' control departments in the
decisions about the relevant risk management policies and procedures, in the manners that it deems most appropriate.
The Parent Company's Anti-Money Laundering function promotes group-level coordination of the assessment
methodologies and procedures to supervise the operating activities related to the management of the risk of money
laundering and financing of terrorism. Where applicable, a specific anti-money laundering function was established in
each subsidiary which, by closely operating with the specific function of the Parent Company, monitors the effectiveness
of the processes related to the anti-money laundering legislation in the relevant company.
Each group company's legal representatives entrusted the anti-money laundering managers with the power to report
suspicious transactions to the UIF (Financial Intelligence Unit). The information obtained as part of these activities is
shared among the anti-money laundering functions and becomes common information capital, ensuring effective
collaboration within the entire group.
7. EQUITY INVESTMENT RISKS
CDP has a significant portfolio of equity investments (listed and unlisted) and of fund units. The measurement and
management criteria applied to equity investments and fund units are set out in the Risk Regulation and include also
specific stress tests, in particular in respect of the most significant equity investments (in quantitative terms) in listed
companies.
Price risk regards the possibility that the net economic value, profitability or the book equity of CDP could be adversely
affected by variables associated with shares, in particular the market prices of such securities and related derivatives, or
changes in the current and future profitability of the investment in such instruments.
In order to monitor and manage equity investment risks, CDP also considers investments in units of investment funds,
including real estate funds, as equity investments.
In line with the net economic value approach, equity risk is quantified in terms of VaR (with a one-year time horizon). The
VaR gives a proxy of the risk that the listed and liquid securities – even when they are not recognised at their current fair
value – do not recover any impairment over time. It is calculated on the basis of hypotheses about the statistical
198 3. Half-yearly condensed consolidated financial statements at 30 June 2018

distribution of the prices of shares, the related derivatives (where present) and the fair value of unlisted securities. Risk is
quantified by assuming continuity in the business model of CDP, which expects to hold most of its stock investments for
the long term.
8. COMPLIANCE RISK
The Compliance function operates using a risk-based approach applied to the entire company operations ensuring,
above all, effective preventive controls, with a view to pro-active and dynamic risk management.
In this respect, it: i) ensures daily monitoring of the new national and international legislation, assessing any impact on
the company’s processes; ii) provides advice and support, also for matters where compliance risk has a significant role
(e.g. conflicts of interest, international sanctions, market abuse); iii) validates beforehand all company procedures to
ensure their compliance with applicable regulations; and iv) participates in internal committees. This function also carries
out ex post controls, assessing the adequacy of the organisational measures in place and the correct application of the
compliance risk prevention procedures, while identifying the related corrective actions.
With respect to management and coordination, the Compliance function regularly coordinates all the CDP Group’s
Compliance units, issuing guidelines, providing consultancy, ensuring operational and methodological support, sharing
work tools, while receiving periodic information flows. Finally, the Compliance function has direct responsibility for the
compliance activities related to some CDP Group companies, in accordance with specific outsourcing agreements.
9. REPUTATIONAL RISK
Given CDP's peculiar nature, the ex ante management of the reputational risk is extremely important. The Compliance
and Anti-money laundering functions apply an internally-developed methodology in assessing the reputational risk
related to transactions, based on specific “risk indicators” (Country Risk, Counterparty Risk, Economic Sector Risk).
The outcome of the assessed lending transactions supplements the preliminary documentation supporting advisory or
decision-making bodies.
10. LEGAL DISPUTES
At 30 June 2018, there were 43 pending disputes in civil and administrative matters in which CDP is a defendant, for a
total amount of approximately 800 million euro.
In particular, the most significant dispute in civil matters related to the conversion of preference shares into ordinary CDP
shares, following the exercise of the right of withdrawal by Fondazione Cassa di Risparmio di Verona Vicenza Belluno e
Ancona. The dispute, initiated by the Foundation in June 2013 before the Court of Rome, amounted to approximately
432 million euro and was subsequently increased to 651 million euro when the parties’ conclusions were presented. The
proceedings are currently pending at first instance before the Court of Rome for the main claim and at appeal before the
Court of Appeal of Rome for the preliminary rulings.
With reference to the above-mentioned dispute with the Foundation, in relation to the proceedings before the Court of
Rome, CDP’s defence team considered the risk of a ruling against the company to be probable. The defence team has
also stated that, considering the complexity and particular nature of the lawsuit and the state of the proceedings, any
reliable estimate of CDP obligations would currently be arbitrary. With regard to the proceedings pending before the
Court of Appeal of Rome, the defence team considered the risk of a ruling against the company to be possible. In relation
to the proceedings considered at the various instances, the defence team considers it reasonable to expect a favourable
outcome to the proceedings.
Finally, with respect to labour disputes, potential liabilities were estimated at around 4.7 million euro at 30 June 2018.
With reference to all the above-mentioned pending disputes in civil and administrative matters, provisions have been
made for a total of approximately 13 million euro.
199
Half-yearly Financial Report 2018
Notes to the consolidated financial statements

11. OTHER MATERIAL RISKS
As part of its activities, CDP is exposed to other market risks, in addition to the equity risks related to its investment
portfolio and the interest rate and inflation risks related to the banking books.
Specifically, CDP is exposed to the equity risk arising from the issue of Postal Savings Bonds indexed to the Euro Stoxx
50. This risk is hedged from an operational perspective by purchasing options that mirror those embedded in the Bonds,
taking into account the redemption profile and the amount expected at expiration upon issue, calculated using estimates
from the proprietary model of customer repayment behaviour.
The hedged notional amount estimated upon issue is monitored periodically, at least every quarter, to check that it
matches the expected profile re-weighted on the actual redemptions observed. As part of the early redemption option
granted to investors, the hedged notional at the inception may be in overhedge in a specific time of the bond's life: the
hedging policy is optimised on the portfolio of options sold, checking the net position on options with the same financial
features (in terms of payoff, strike, fixing date of the underlying index), in order to ensure that the cash flows payable,
should the embedded options expire in the money, are entirely hedged.
The net exposure is assessed and monitored including by applying stress scenarios which provide for the joint reduction
of the Euro Stoxx 50 index and level of volatility. The results of monitoring activities and stress tests are used, inter alia,
to determine any plans to unwind the hedges in place and to check the effectiveness of the operational hedges for EMIR
purposes.
CDP may assume the exchange rate risk by granting loans and issuing or purchasing foreign currency bonds.
Generally speaking, CDP undertakes such activities only if covered by appropriate exchange rate hedges. Hedges
usually coincide with the signing of Cross Currency Swaps (CCSs) which translate foreign currency flows into Euro.
Alternatively, the position may be refinanced with funding in the currency corresponding to the commitment, using a
strategy that minimises existing risks.
12. MONITORING THE RISKS OF COMPANIES SUBJECT TO MANAGEMENT AND COORDINATION
Management and monitoring of subsidiaries’ risks are the responsibility of the Risk Governance, Risk Management and
Risk Operations areas of the Parent Company, which report to the Chief Risk Officer.
Under the Management and Coordination Regulation, the Parent Company shall set:
the principles and guidelines of material risks (credit, market, operational, etc.), and the risk processes, systems and
models, in accordance with the mandatory requirements applicable to Supervised Companies;
the risk appetite framework;
risk identification and control guidelines, checking the adequacy of the related procedures;
monitoring the evolution of corporate risks and compliance with operational limits.
In accordance with the Management and Coordination Regulation, the subsidiaries also:
discuss risk-assumption rules with the Parent Company prior to their approval or change;
prepare, at a frequency adequate to the type of risk, the periodic reporting required, ensuring compliance with the
Parent Company's functional requirements;
regularly describe the main risk profiles and their evolution.
200 3. Half-yearly condensed consolidated financial statements at 30 June 2018

BUSINESS COMBINATIONS
TRANSACTIONS IN THE PERIOD
Business combinations
(thousands of euro) Date of
transaction (1) (2) (3) (4)
Company name
Ramo d'azienda Amalfitana Gas 26/01/2018 20,809 100% - -
Ramo d'azienda Aenergia Reti (Portopalo) 31/01/2018 2,200 100% - -
Avvenia The Energy Innovator Srl 15/02/2018 7,000 70% (300) (215)
Pentagramma Romagna S.p.A. in liquidazione 23/02/2018 500 100% - (203)
Gruppo Ichnusa 28/02/2018 1,235 100% 609 (451)
Seaside 13/03/2018 9,208 100% 271 421
Medea 06/04/2018 15,875 100% 1,186 (95)
TEP Energy Solution 30/05/2018 25,721 100% 63,233 3,833
Baranogas Reti 31/05/2018 575 98% 12 12
Ischia Reti Gas 31/05/2018 300 98% - -
Progas Metano 31/05/2018 280 98% - (25)
Grecanica Gas 31/05/2018 2,027 98% 98 88
Favara Gas 31/05/2018 974 98% 6 6
Siculianagas Reti 31/05/2018 490 98% - -
Key
(1) = Cost of transaction
(2) = Percentage of voting rights in the Ordinary Shareholder's Meeting
(3) = Total Group revenues
(4) = Group net Profit (Loss)
Acquisition of Avvenia The Energy Innovator S.r.l.
On 15 February 2018, the Terna group made an acquisition, for 7 million euro, of 70% of Avvenia The Energy Innovator
S.r.l., a NewCo to which the principal assets of Avvenia, a Lazio-based company established in 2001 and leader in the
energy efficiency sector and certified as an Energy Service Company (ESCo), have been transferred. The sale
agreement also includes a call option on the remaining 30% of the company’s shares, exercisable within 24 months of
the date of sale of the first stake.
The table below shows the consideration paid for the acquisition of the company, and gives breakdown of the assets
acquired and liabilities assumed at the date of the transaction:
201
Half-yearly Financial Report 2018
Notes to the consolidated financial statements
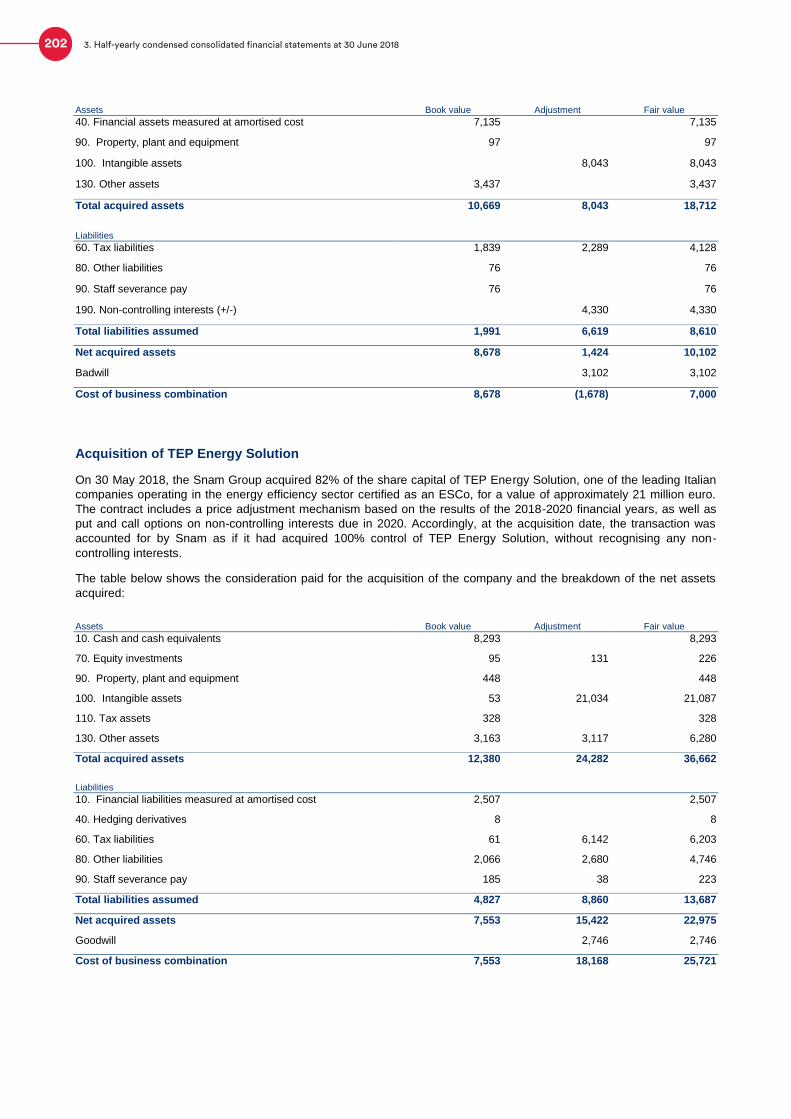
Assets Book value Adjustment Fair value
40. Financial assets measured at amortised cost 7,135 7,135
90. Property, plant and equipment 97 97
100. Intangible assets 8,043 8,043
130. Other assets 3,437 3,437
Total acquired assets 10,669 8,043 18,712
Liabilities 60. Tax liabilities 1,839 2,289 4,128
80. Other liabilities 76 76
90. Staff severance pay 76 76
190. Non-controlling interests (+/-) 4,330 4,330
Total liabilities assumed 1,991 6,619 8,610
Net acquired assets 8,678 1,424 10,102
Badwill 3,102 3,102
Cost of business combination 8,678 (1,678) 7,000
Acquisition of TEP Energy Solution
On 30 May 2018, the Snam Group acquired 82% of the share capital of TEP Energy Solution, one of the leading Italian
companies operating in the energy efficiency sector certified as an ESCo, for a value of approximately 21 million euro.
The contract includes a price adjustment mechanism based on the results of the 2018-2020 financial years, as well as
put and call options on non-controlling interests due in 2020. Accordingly, at the acquisition date, the transaction was
accounted for by Snam as if it had acquired 100% control of TEP Energy Solution, without recognising any non-
controlling interests.
The table below shows the consideration paid for the acquisition of the company and the breakdown of the net assets
acquired:
Assets Book value Adjustment Fair value
10. Cash and cash equivalents 8,293 8,293
70. Equity investments 95 131 226
90. Property, plant and equipment 448 448
100. Intangible assets 53 21,034 21,087
110. Tax assets 328 328
130. Other assets 3,163 3,117 6,280
Total acquired assets 12,380 24,282 36,662
Liabilities 10. Financial liabilities measured at amortised cost 2,507 2,507
40. Hedging derivatives 8 8
60. Tax liabilities 61 6,142 6,203
80. Other liabilities 2,066 2,680 4,746
90. Staff severance pay 185 38 223
Total liabilities assumed 4,827 8,860 13,687
Net acquired assets 7,553 15,422 22,975
Goodwill 2,746 2,746
Cost of business combination 7,553 18,168 25,721
202 3. Half-yearly condensed consolidated financial statements at 30 June 2018
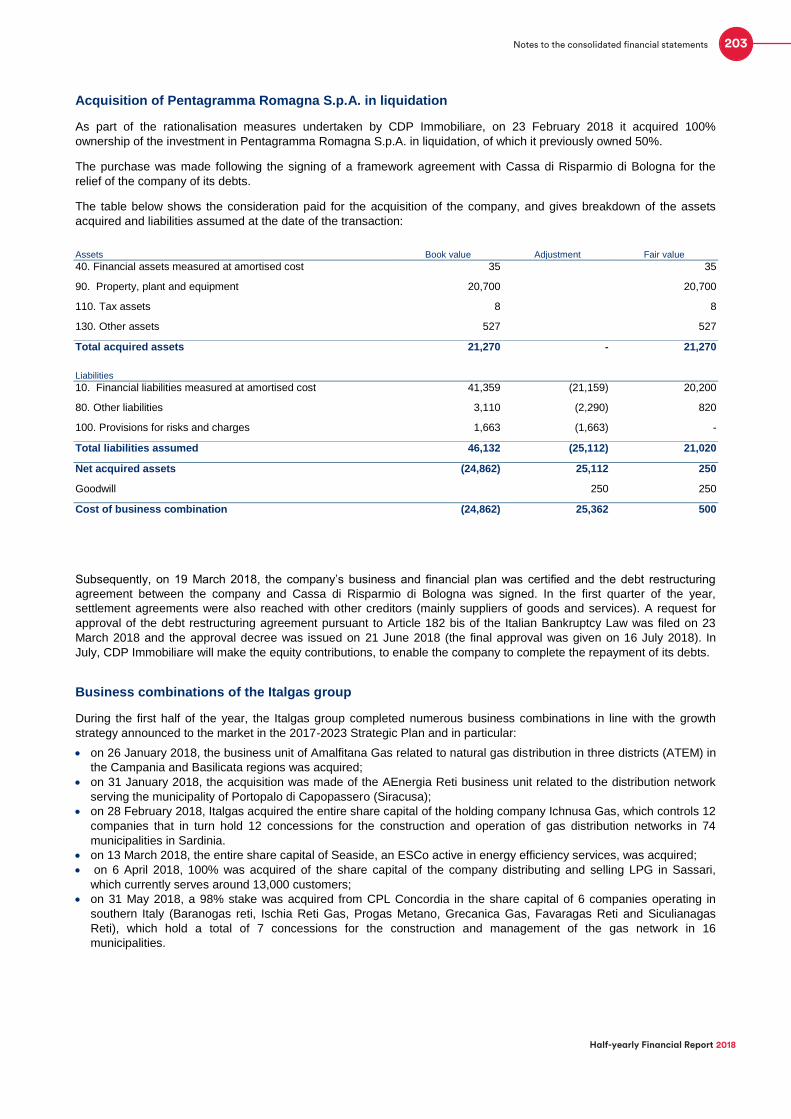
Acquisition of Pentagramma Romagna S.p.A. in liquidation
As part of the rationalisation measures undertaken by CDP Immobiliare, on 23 February 2018 it acquired 100%
ownership of the investment in Pentagramma Romagna S.p.A. in liquidation, of which it previously owned 50%.
The purchase was made following the signing of a framework agreement with Cassa di Risparmio di Bologna for the
relief of the company of its debts.
The table below shows the consideration paid for the acquisition of the company, and gives breakdown of the assets
acquired and liabilities assumed at the date of the transaction:
Assets Book value Adjustment Fair value
40. Financial assets measured at amortised cost 35 35
90. Property, plant and equipment 20,700 20,700
110. Tax assets 8 8
130. Other assets 527 527
Total acquired assets 21,270 - 21,270
Liabilities 10. Financial liabilities measured at amortised cost 41,359 (21,159) 20,200
80. Other liabilities 3,110 (2,290) 820
100. Provisions for risks and charges 1,663 (1,663) -
Total liabilities assumed 46,132 (25,112) 21,020
Net acquired assets (24,862) 25,112 250
Goodwill 250 250
Cost of business combination (24,862) 25,362 500
Subsequently, on 19 March 2018, the company’s business and financial plan was certified and the debt restructuring
agreement between the company and Cassa di Risparmio di Bologna was signed. In the first quarter of the year,
settlement agreements were also reached with other creditors (mainly suppliers of goods and services). A request for
approval of the debt restructuring agreement pursuant to Article 182 bis of the Italian Bankruptcy Law was filed on 23
March 2018 and the approval decree was issued on 21 June 2018 (the final approval was given on 16 July 2018). In
July, CDP Immobiliare will make the equity contributions, to enable the company to complete the repayment of its debts.
Business combinations of the Italgas group
During the first half of the year, the Italgas group completed numerous business combinations in line with the growth
strategy announced to the market in the 2017-2023 Strategic Plan and in particular:
on 26 January 2018, the business unit of Amalfitana Gas related to natural gas distribution in three districts (ATEM) in
the Campania and Basilicata regions was acquired;
on 31 January 2018, the acquisition was made of the AEnergia Reti business unit related to the distribution network
serving the municipality of Portopalo di Capopassero (Siracusa);
on 28 February 2018, Italgas acquired the entire share capital of the holding company Ichnusa Gas, which controls 12
companies that in turn hold 12 concessions for the construction and operation of gas distribution networks in 74
municipalities in Sardinia.
on 13 March 2018, the entire share capital of Seaside, an ESCo active in energy efficiency services, was acquired;
on 6 April 2018, 100% was acquired of the share capital of the company distributing and selling LPG in Sassari,
which currently serves around 13,000 customers;
on 31 May 2018, a 98% stake was acquired from CPL Concordia in the share capital of 6 companies operating in
southern Italy (Baranogas reti, Ischia Reti Gas, Progas Metano, Grecanica Gas, Favaragas Reti and Siculianagas
Reti), which hold a total of 7 concessions for the construction and management of the gas network in 16
municipalities.
203
Half-yearly Financial Report 2018
Notes to the consolidated financial statements
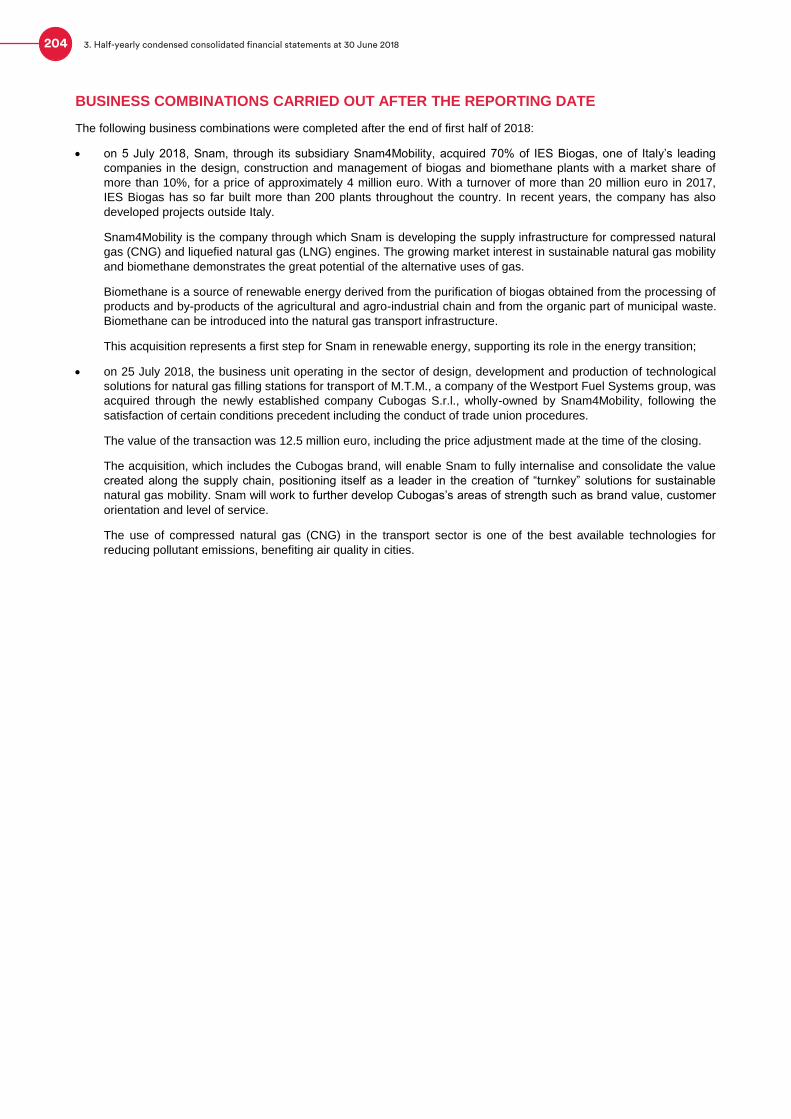
BUSINESS COMBINATIONS CARRIED OUT AFTER THE REPORTING DATE
The following business combinations were completed after the end of first half of 2018:
on 5 July 2018, Snam, through its subsidiary Snam4Mobility, acquired 70% of IES Biogas, one of Italy’s leading
companies in the design, construction and management of biogas and biomethane plants with a market share of
more than 10%, for a price of approximately 4 million euro. With a turnover of more than 20 million euro in 2017,
IES Biogas has so far built more than 200 plants throughout the country. In recent years, the company has also
developed projects outside Italy.
Snam4Mobility is the company through which Snam is developing the supply infrastructure for compressed natural
gas (CNG) and liquefied natural gas (LNG) engines. The growing market interest in sustainable natural gas mobility
and biomethane demonstrates the great potential of the alternative uses of gas.
Biomethane is a source of renewable energy derived from the purification of biogas obtained from the processing of
products and by-products of the agricultural and agro-industrial chain and from the organic part of municipal waste.
Biomethane can be introduced into the natural gas transport infrastructure.
This acquisition represents a first step for Snam in renewable energy, supporting its role in the energy transition;
on 25 July 2018, the business unit operating in the sector of design, development and production of technological
solutions for natural gas filling stations for transport of M.T.M., a company of the Westport Fuel Systems group, was
acquired through the newly established company Cubogas S.r.l., wholly-owned by Snam4Mobility, following the
satisfaction of certain conditions precedent including the conduct of trade union procedures.
The value of the transaction was 12.5 million euro, including the price adjustment made at the time of the closing.
The acquisition, which includes the Cubogas brand, will enable Snam to fully internalise and consolidate the value
created along the supply chain, positioning itself as a leader in the creation of “turnkey” solutions for sustainable
natural gas mobility. Snam will work to further develop Cubogas’s areas of strength such as brand value, customer
orientation and level of service.
The use of compressed natural gas (CNG) in the transport sector is one of the best available technologies for
reducing pollutant emissions, benefiting air quality in cities.
204 3. Half-yearly condensed consolidated financial statements at 30 June 2018
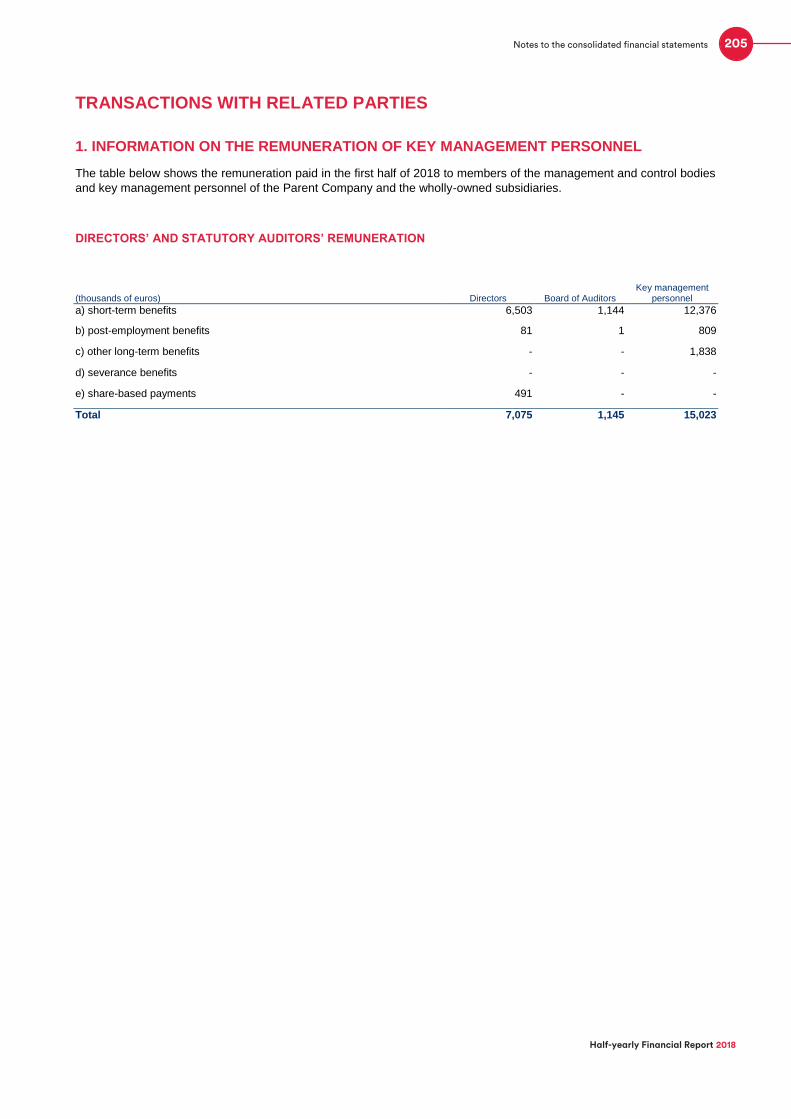
TRANSACTIONS WITH RELATED PARTIES
1. INFORMATION ON THE REMUNERATION OF KEY MANAGEMENT PERSONNEL
The table below shows the remuneration paid in the first half of 2018 to members of the management and control bodies
and key management personnel of the Parent Company and the wholly-owned subsidiaries.
DIRECTORS’ AND STATUTORY AUDITORS’ REMUNERATION
Directors Board of Auditors Key management
personnel (thousands of euros)
a) short-term benefits 6,503 1,144 12,376
b) post-employment benefits 81 1 809
c) other long-term benefits - - 1,838
d) severance benefits - - -
e) share-based payments 491 - -
Total 7,075 1,145 15,023
205
Half-yearly Financial Report 2018
Notes to the consolidated financial statements

PARENT COMPANY DIRECTORS’ AND STATUTORY AUDITORS’ REMUNERATION
(thousands of euro)
Name and Surname Position
Period in office End of term (*)
Compensation and bonuses
Directors
Claudio Costamagna Chairman 01/01/2018-30/06/2018 24/07/2018 148
Mario Nuzzo Vice Chairman 01/01/2018-30/06/2018 24/07/2018 18
Fabio Gallia Chief Executive Officer
01/01/2018-30/06/2018 24/07/2018 196
Maria Cannata Director (4) 01/01/2018-30/06/2018 24/07/2018 15
Carla Patrizia Ferrari Director 01/01/2018-30/06/2018 24/07/2018 18
Stefano Micossi Director (5) 01/01/2018-04/04/2018 9
Alessandro Rivera Director 01/01/2018-30/06/2018 24/07/2018 (**)
Alessandra Ruzzu Director 01/01/2018-30/06/2018 24/07/2018 18
Andrea Sironi Director (6) 01/01/2018-26/04/2018 11
Supplementary members for administration of Separate Account (Article 5.8, Decree Law 269/2003
Roberto Ferranti Director (1) 01/01/2018-30/06/2018 24/07/2018 18
Vincenzo La Via Director (2) 01/01/2018-14/05/2018 (**)
Giuseppe Maresca Director (10) 25/05/2018-30/06/2018 24/07/2018 (**)
Piero Fassino Director (7) 01/01/2018-03/04/2018 9
Massimo Garavaglia Director (8) 01/01/2018-05/04/2018 9
Carlo Davide Caparini Director (9) 11/05/2018-30/06/2018 24/07/2018 5
Antonio Decaro Director (9) 11/05/2018-30/06/2018 24/07/2018 5
Achille Variati Director (3) 01/01/2018-30/06/2018 24/07/2018 -
Statutory Auditors
Carlo Corradini Chairman 01/01/2018-30/06/2018 2018 20
Alessandra Dal Verme Statutory Auditor 01/01/2018-30/06/2018 2018 (**)
Giusella Finocchiaro Statutory Auditor 01/01/2018-30/06/2018 2018 15
Luciano Barsotti Statutory Auditor 01/01/2018-30/06/2018 2018 15
Ines Russo Statutory Auditor 01/01/2018-30/06/2018 2018 15
(*) The term of office of board directors ended on 24 July 2018 - the date on which the Shareholders’ Meeting appointed the new Board of Directors for the years 2018, 2019 and 2020. The term of office of statutory auditors ends on the date of the Shareholders’ Meeting called to approve the 2018 financial statements.
(**) The remuneration is paid to the Ministry of the Economy and Finance.
(1) Delegate of the State Accountant General.
(2) Director General of the Treasury, whose term of office ended on 14 May 2018
(3) The director Achille Variati will not receive any remuneration in accordance with Article 5.9 of Law 135 of 2012.
(4) The remuneration indicated refers to the period from 01.02.2018 to 30.06.2018. From 1 January 2018 to 31 January 2018, the remuneration was paid to the Ministry of the Economy and Finance.
(5) Resigned from his position as director on 4 April 2018
(6) Resigned from his position as director on 26 April 2018
(7) Resigned from his position as director on 3 April 2018
(8) Resigned from his position as director on 5 April 2018
(9) Appointed as director for the Separate Account pursuant to Decree of the Ministry of the Economy and Finance of 11 May 2018
(10) Deputy Director General of the Treasury.
On 24 July 2018, the Shareholders’ Meeting appointed the new Board of Directors for the years 2018, 2019 and 2020. The following have been appointed as directors: Massimo Tononi (Chairman), Fabrizio Palermo (appointed as Chief Executive Officer by the Board of Directors meeting held on 27 July 2018), Luigi Paganetto (appointed as Vice Chairman by the Board of Directors meeting held on 27 July 2018), Fabrizia Lapecorella, Fabiana Massa Felsani, Valentino Grant, Francesco Floro Flores, Matteo Melley and Alessandra Ruzzu. The following supplementary directors have been appointed to manage funding from Postal Savings (Separate Account): Giuseppe Maresca (Deputy Director General of the Treasury), Roberto Ferranti (Delegate of the State Accountant General), Davide Carlo Caparini and Antonio Decaro.
206 3. Half-yearly condensed consolidated financial statements at 30 June 2018
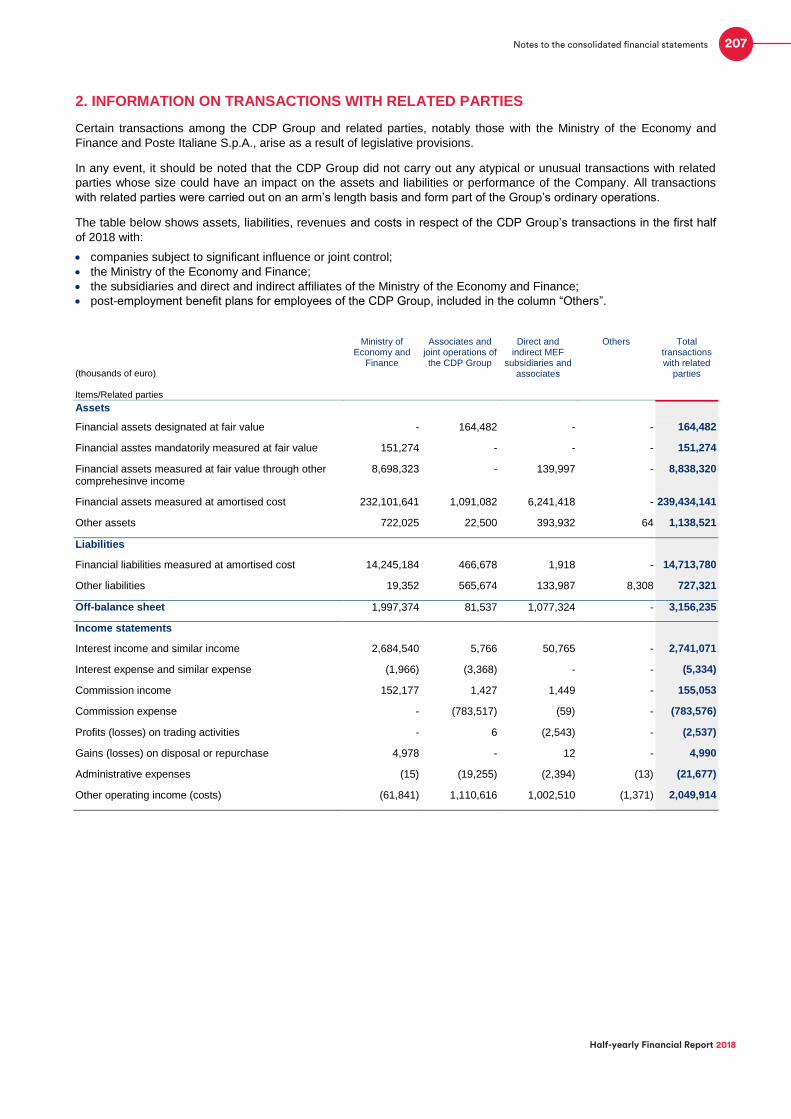
2. INFORMATION ON TRANSACTIONS WITH RELATED PARTIES
Certain transactions among the CDP Group and related parties, notably those with the Ministry of the Economy and
Finance and Poste Italiane S.p.A., arise as a result of legislative provisions.
In any event, it should be noted that the CDP Group did not carry out any atypical or unusual transactions with related
parties whose size could have an impact on the assets and liabilities or performance of the Company. All transactions
with related parties were carried out on an arm’s length basis and form part of the Group’s ordinary operations.
The table below shows assets, liabilities, revenues and costs in respect of the CDP Group’s transactions in the first half
of 2018 with:
companies subject to significant influence or joint control;
the Ministry of the Economy and Finance;
the subsidiaries and direct and indirect affiliates of the Ministry of the Economy and Finance;
post-employment benefit plans for employees of the CDP Group, included in the column “Others”.
(thousands of euro) Items/Related parties
Ministry of Economy and
Finance
Associates and joint operations of the CDP Group
Direct and indirect MEF
subsidiaries and associates
Others Total transactions with related
parties
Assets
Financial assets designated at fair value - 164,482 - - 164,482
Financial asstes mandatorily measured at fair value 151,274 - - - 151,274
Financial assets measured at fair value through other comprehesinve income
8,698,323 - 139,997 - 8,838,320
Financial assets measured at amortised cost 232,101,641 1,091,082 6,241,418 - 239,434,141
Other assets 722,025 22,500 393,932 64 1,138,521
Liabilities
Financial liabilities measured at amortised cost 14,245,184 466,678 1,918 - 14,713,780
Other liabilities 19,352 565,674 133,987 8,308 727,321
Off-balance sheet 1,997,374 81,537 1,077,324 - 3,156,235
Income statements
Interest income and similar income 2,684,540 5,766 50,765 - 2,741,071
Interest expense and similar expense (1,966) (3,368) - - (5,334)
Commission income 152,177 1,427 1,449 - 155,053
Commission expense - (783,517) (59) - (783,576)
Profits (losses) on trading activities - 6 (2,543) - (2,537)
Gains (losses) on disposal or repurchase 4,978 - 12 - 4,990
Administrative expenses (15) (19,255) (2,394) (13) (21,677)
Other operating income (costs) (61,841) 1,110,616 1,002,510 (1,371) 2,049,914
207
Half-yearly Financial Report 2018
Notes to the consolidated financial statements

Share-based payments
Fincantieri incentive plans
2016-2018 Performance Share Plan
On 19 May 2017, the Shareholders’ Meeting of Fincantieri S.p.A. approved the medium/long-term management share-
based incentive plan called 2016-2018 Performance Share Plan (the “Plan”) for management, as well as the related
Regulation. The project had been approved by the Board of Directors on 10 November 2016.
The Plan is divided into three cycles, each having a duration of three years, and provides for the free assignment of
shares to the beneficiaries identified by the Board of Directors, up to a maximum number of 50,000,000 Fincantieri S.p.A.
ordinary shares with no par value, provided those beneficiaries meet the specific performance targets established in
relation to 2016-2018 (first cycle), 2017-2019 (second cycle) and 2018-2020 (third cycle). The targets identified for all
three cycles of the Plan are Total Shareholder Return (“TSR”) and EBITDA, which provide objective criteria for
measuring value creation by the Company over the long term.
The vesting period for all beneficiaries will be three years, from the date the rights are granted to the date the shares are
assigned to the beneficiaries. Therefore, on meeting the performance targets and satisfying the other conditions set out
in the Plan Regulation, the shares accrued in relation to the first cycle will be vested and assigned to the beneficiaries
within 31 July 2019, while those accrued in relation to the second and third cycles will be vested and assigned
respectively within the 31 July 2020 and 31 July 2021.
The Plan also contemplates a lock-up period in relation to a portion of the shares assigned to the Company’s board
members or key management personnel.
On 19 May 2017, in the first cycle of the Plan, 9,101,544 Fincantieri S.p.A. ordinary shares were assigned to the
beneficiaries identified by the Board of Directors on 15 December 2016; in the second cycle of the Plan, 4,170,706
Fincantieri S.p.A. shares were assigned to the beneficiaries identified by the Board of Directors on 25 July 2017; and, in
the third and last cycle of the Plan, 3,604,691 shares of Fincantieri S.p.A. were assigned to the beneficiaries identified by
the Board of Directors on 22 June 2018.
The business and financial performance targets consist of two components:
a) a “market based” component (equal to 30% of the total rights assigned) linked to Fincantieri’s performance in terms
of the TSR associated with the FTSE ITALY ALL SHARE Index and the Peer group identified by the Company;
b) a “non-market based” component (equal to 70% of the total rights assigned) linked to the achievement of Group
EBITDA targets measured against pre-established targets.
The “market based” component is calculated according to the Monte Carlo method, under which appropriate
assumptions can be applied to define a significant number of alternative scenarios within a given time period. Unlike the
“market based” performance target, the “non-market based” component (EBITDA) is immaterial in terms of the fair value
estimate but is updated quarterly to take into account expectations in terms of the number of rights accruable based on
EBITDA performance measured against the targets established in the Plan. To estimate the number of rights accrued as
at 31 December 2017 it has been assumed that the targets will be met.
The table below shows the amount, for each cycle of the Plan, of the fair value determined at the grant date of the rights
to the beneficiaries.
With regard to the 2016-2018 Performance Share Plan, the Shareholders’ Meeting of Fincantieri S.p.A. held on 19 May
2017 authorised the Board of Directors to acquire treasury shares to service the Plan for a period of 18 months after the
Shareholders’ Meeting date. At 30 June 2018, 4,706,890 treasury shares worth 5,227 thousand euro had been
purchased by the Fincantieri S.p.A..
Grant dateNo. of shares
grantedFair value
First cycle of the Plan May 19. 2017 9,101,544 6,866,205
Second cycle of the Plan July 25. 2017 4,170,706 3,672,432
Third cycle of the Plan June 22. 2018 3,604,691 3,963,754
208 3. Half-yearly condensed consolidated financial statements at 30 June 2018

2019-2021 Performance Share Plan
On 11 May 2018, the Shareholders’ Meeting of Fincantieri S.p.A. approved the new 2019-2021 Performance Share Plan
(the “Plan”) for management and the related Regulation, the structure of which was defined by the Board of Directors at
the meeting held on 27 March 2018.
The Plan is divided into three cycles, each having a duration of three years, and provides for the free assignment of
shares to the beneficiaries identified by the Board of Directors, up to a maximum number of 25,000,000 Fincantieri S.p.A.
ordinary shares with no par value, provided those beneficiaries meet the specific performance targets established in
relation to 2019-2021 (first cycle), 2020-2022 (second cycle) and 2021-2023 (third cycle).
The vesting period for all beneficiaries will be three years, from the date the rights are granted to the date the shares are
assigned to the beneficiaries. Therefore, on meeting the performance targets and satisfying the other conditions set out
in the Plan Regulation, the shares accrued in relation to the first cycle will be vested and assigned to the beneficiaries
within 31 July 2022, while those accrued in relation to the second and third cycles will be vested and assigned
respectively within the 31 July 2023 and 31 July 2024.
The Plan also contemplates a lock-up period in relation to a portion of the shares assigned to the Company’s board
members or key management personnel.
In addition to the EBITDA and TSR parameters, already included in the 2016-2018 Performance Share Plan, the Group
has also introduced a further parameter, the Sustainability Index, among the Plan’s targets, which measures the
achievement of the sustainability targets the Group has set itself to align it with European best practices and the growing
expectations of the financial community regarding sustainable development.
The references for testing the achievement of the sustainability target consist of market parameters such as the Carbon
Disclosure Project (CDP) and a second rating by an additional agency that assesses the entire basket of sustainability
aspects.
The free assignment of the number of rights is delegated to the Board of Directors, which also has the power to identify
the number and names of the beneficiaries.
Snam incentive plans
To set up an incentive and loyalty system for its senior managers, the subsidiary Snam established a long-term share-
based incentive plan in 2017 for the Chief Executive Officer and for Snam’s and it’s subsidiaries’ senior managers,
appointed by the Chief Executive Officer, who hold offices that have the greatest impact on value creation or are
strategically important in terms of achieving Snam’s multi-year objectives.
This long-term share-based incentive plan for the period 2017-2019, which was approved by the Shareholders’ Meeting
on 11 April 2017, provides for three cycles of annual assignment of three-year targets (“Rolling Plan”) for the years 2017,
2018 and 2019. At the end of the three-year performance period, beneficiaries will be entitled to the free assignment of
company shares if the conditions underlying the Plan are satisfied.
At the end of the Plan’s vesting period, the beneficiaries will also receive a Dividend Equivalent, consisting in a number
of additional shares equivalent to the ordinary and extraordinary dividends distributed by Snam in the vesting period,
which would have accrued on the number of shares effectively assigned to the beneficiaries on the basis of their
performance and in accordance with the terms and conditions set out in the Plan. Entitlement to the shares is subject to
meeting the performance targets, which are measured as the average yearly performance against the parameters
established for the three-year vesting period, with impact on EBITDA, adjusted net income and sustainability.
The maximum number of shares backing the plan is 3,500,000 shares for each year of the Plan. The Plan will end in
2022, that is, on expiry of the three-year vesting period linked to the last assignment of shares (2019). The Chief
Executive Officer and the other eligible executives will be subject to a lock-up period of two years on 20% of the shares
assigned, as recommended in the Corporate Governance Code.
209
Half-yearly Financial Report 2018
Notes to the consolidated financial statements

CONSOLIDATED INFORMATION ON OPERATING SEGMENTS
OPERATING SEGMENTS
This section of the Notes to the consolidated financial statements has been drafted in compliance with IFRS 8 -
Operating Segments.
Operating segment disclosures are presented by showing separately the contribution given by four sectors to the
consolidated Group’s results:
Support for the economy: represented by the Parent Company’s financial data;
International expansion: represented by the SACE group’s financial data;
Other sectors: represented by the financial data of the Companies not subject to management and coordination,
except for those included in the previous sector and without their equity investments, which are reported instead under
the heading “Companies not subject to management and coordination”. The segment therefore includes CDP Reti,
Fintecna, CDP Equity, FSI Investimenti, CDP Investimenti SGR, the funds FIV Plus, FIV Extra, FIT, FT1 and FIA2,
and CDP Immobiliare30;
Companies not subject to management and coordination: represented by the financial data of the companies
consolidated line by line (Snam, Terna, Italgas and Fincantieri) and by the financial data from consolidation with the
equity method of ENI, Poste Italiane, Saipem, Ansaldo Energia, FSIA, Open Fiber, Kedrion, IQ Made in Italy,
Valvitalia, Trevi Finanziaria Industriale, Rocco Forte Hotels, BF and the other associates or companies subject to joint
control.
The reported financial data were prepared considering the contribution of the four segments already net of the effects of
consolidation entries, but without the elimination of dividends, which has instead been performed in the column
aggregating the three segments “Support for the economy”, “International expansion” and “Other sectors”.
Thus, the contribution of the three segments taken together, whose profit before tax amounts to 1.02 billion euro, is
represented by the Parent Company and the companies under its management and coordination.
This aggregate figure is impacted significantly by the weight of the financial data of the “Support for the economy”
segment in terms of Net interest income, Net commission and Net impairment losses.
The segment “Companies not subject to management and coordination” reports a profit before tax of 1.9 billion euro. As
regards gross income, there was an improvement in net interest income related to charges on current debt. Net gains on
equity investments at 30 June 2017 included the effects of the transfer of control over FSIA, for an amount of 0.6 billion
euro.
The profit before tax benefits from the contribution from the core earnings of the industrial companies recorded under
Other net operating income, which offset administrative expenses of 3.2 billion euro and the amortisation/depreciation
charges for the period of 1 billion euro linked to technical investments and to the effects of purchase price allocations on
those assets.
Balance sheet figures too show the significant weight of the “Support for the economy” segment, in particular under
property, plant and equipment and in funding for Companies not subject to management and coordination.
The reclassified income statement figures and the main reclassified balance sheet figures at 30 June 2018 and for the
comparison period shown below are attributable to the group as a whole. For further details, see also Annex 2.2
“Reconciliation between the reclassified income statement and balance sheet and the financial statements - CDP
Group”.
30 The segment includes the equity investments of CDP Immobiliare and Fintecna (except for Fincantieri), since they are representative of the company’s business.
210 3. Half-yearly condensed consolidated financial statements at 30 June 2018

Reclassified consolidated balance sheet at 30/06/2018
Companies subject to management and coordination
Companies not subject to
management and
coordination
(thousands of euro) Support for the
economy International expansion
Other segments
Total Total
Loans and cash and cash equivalents 265,698,612 3,066,607 1,760,928 270,526,147 20,107,359 290,633,506
Equity investments - 8,361 80,861 89,222 20,059,701 20,148,923
Debt and equity securities and units in collective investment undertakings
64,021,074 4,388,964 192,673 68,602,711 47,658 68,650,369
Property, plant and equipment/technical investments
316,080 79,328 1,383,538 1,778,946 35,382,287 37,161,233
Other assets (including Inventories) 264,331 142,403 120,717 527,451 7,366,068 7,893,519
Funding 335,888,176 1,060,222 1,267,799 338,216,197 26,392,558 364,608,755
- of which bonds 19,133,294 522,193 412,475 20,067,962 18,152,394 38,220,356
Reclassified consolidated balance sheet at 31/12/2017
Companies subject to management and coordination
Companies not subject to
management and
coordination
(thousands of euro) Support for the
economy International expansion
Other segments
Total Total
Loans and cash and cash equivalents 278,453,442 2,916,717 1,630,550 283,000,709 4,001,145 287,001,854
Equity investments - 8,010 78,771 86,781 19,682,985 19,769,766
Debt and equity securities and units in collective investment undertakings
53,167,873 2,281,757 185,452 55,635,082 46,666 55,681,748
Property, plant and equipment/technical investments
305,538 99,183 21,102 425,823 35,388,172 35,813,995
Other assets (including Inventories) 117,489 152,916 1,487,481 1,757,886 8,018,123 9,776,009
Funding 334,403,210 1,406,837 1,253,937 337,063,984 26,959,310 364,023,294
- of which bonds 17,774,419 531,545 416,283 18,722,247 19,034,508 37,756,755
211
Half-yearly Financial Report 2018
Notes to the consolidated financial statements

Reclassified consolidated income statement for the period ended 30/06/2018
Companies subject to management and coordination
Companies not subject to
management and
coordination
(thousands of euro)
Support for the economy
International expansion
Other segments Total (*) Total
Net interest income 1,632,694 74,691 (5,462) 1,701,923 (166,248) 1,535,675
Dividends 811,479 4,532 281,114 1,285 2,008 3,293
Gains (losses) on equity investments - 351 (1,595) (1,244) 675,895 674,651
Net commission income (expense) (592,231) 13,775 1,948 (576,508) (20,384) (596,892)
Other net revenues (costs) 40,175 14,362 (10,909) 43,628 (14,498) 29,130
Gross income 1,892,117 107,711 265,096 1,169,084 476,773 1,645,857
Profit (loss) on insurance business - 74,945 - 74,945 - 74,945
Profit (loss) on banking and insurance operations
1,892,117 182,656 265,096 1,244,029 476,773 1,720,802
Net recoveries (impairment) (38,554) (7,895) (1,784) (48,233) (122) (48,355)
Administrative expenses (83,528) (63,882) (38,354) (185,764) (3,206,012) (3,391,776)
Other net operating income (costs) 1,513 6,668 240 8,421 5,692,030 5,700,451
Operating income 1,771,548 117,547 225,198 1,018,453 2,962,669 3,981,122
Net Provisions for risks and charges (17,365) 7,089 9,452 (824) (44,419) (45,243)
Net adjustment to property, plant and equipment and intangible assets
(3,169) (2,692) (6,630) (12,491) (989,629) (1,002,120)
Writedown of goodwill - - - - - -
Other (1) - 11,541 11,540 (13,785) (2,245)
Income (loss) for the period before tax 1,751,013 121,944 239,561 1,016,678 1,914,836 2,931,514
Income taxes (739,683)
Net income for the period 2,191,831
(*) Total of the segments "Support for the economy", "International expansion" and "Other segments", net of elimination of dividends
212 3. Half-yearly condensed consolidated financial statements at 30 June 2018

Reclassified consolidated income statement for the period ended 30/06/2017
Companies subject to management and coordination
Companies not subject to
management and
coordination
(thousands of euro)
Support for the economy
International expansion
Other segments Total (*) Total (**)
Net interest income 1,593,457 77,717 (7,882) 1,663,292 (172,108) 1,491,184
Dividends 784,728 5,464 505,159 730 3 733
Gains (losses) on equity investments - 56 (13,675) (13,619) 953,746 940,127
Net commission income (expense) (762,686) 14,840 2,542 (745,304) (16,672) (761,976)
Other net revenues (costs) (22,232) (175,369) 1,749 (195,852) (8,731) (204,583)
Gross income 1,593,267 (77,292) 487,893 709,247 756,238 1,465,485
Profit (loss) on insurance business - 510,554 - 510,554 - 510,554
Profit (loss) on banking and insurance operations
1,593,267 433,262 487,893 1,219,801 756,238 1,976,039
Net recoveries (impairment) (119,634) (6,272) 4,235 (121,671) (325) (121,996)
Administrative expenses (71,654) (63,213) (42,887) (177,754) (2,942,225) (3,119,979)
Other net operating income (costs) 156 (304) (18,864) (19,012) 5,323,519 5,304,507
Operating income 1,402,135 363,473 430,377 901,364 3,137,207 4,038,571
Net Provisions for risks and charges (25) 1,293 5,159 6,427 (52,536) (46,109)
Net adjustment to property, plant and equipment and intangible assets
(3,261) (2,408) (206) (5,875) (956,762) (962,637)
Writedown of goodwill - - - - - -
Other (3) - 507 504 (4,169) (3,665)
Income (loss) for the period before tax 1,398,846 362,358 435,837 902,420 2,123,740 3,026,160
Income taxes (581,880)
Net income for the period 2,444,280
(*) Total of the segments "Support for the economy", "International expansion" and "Other segments", net of elimination of dividends
(**) Restated
213
Half-yearly Financial Report 2018
Notes to the consolidated financial statements

ANNEXES
1. Annexes to the half-yearly condensed consolidated financial statements
1.1 Scope of consolidation
2. Annexes to the half-yearly report on operations
2.1 Reconciliation between the reclassified income statement and balance sheet and the financial statements – CDP S.p.A.
2.2 Reconciliation between the reclassified income statement and balance sheet and the financial statements – CDP Group
2.3 Details of alternative performance indicators – CDP S.p.A.
214 3. Half-yearly condensed consolidated financial statements at 30 June 2018

1. Annexes to the half-yearly condensed consolidated financial statements
1.1 Scope of consolidation
Company name Registered office Investor % holding Consolidation method
PARENT COMPANY
Cassa depositi e prestiti S.p.A Rome
Consolidated companies
ACE Marine LLC Green Bay - WI Fincantieri Marine Group LLC 100.00% Line-by-line
African Trade Insurance Company Nairobi SACE S.p.A. 4.43% Equity
Alf iere S.p.A Rome CDP Immobiliare S.r.l. 50.00% Equity
Ansaldo Energia S.p.A. Genoa CDP Equity S.p.A. 59.94% Equity
ARSENAL S.r.l. Trieste Fincantieri Oil & Gas S.p.A. 24.00% Equity
AS Dameco Skien Vard Offshore Brevik AS 34.00% Equity
AS Gasinfrastruktur Beteiligung GmbH Vienna SNAM S.p.A. 40.00% Equity
ASSET COMPANY 2 S.r.L. San Donato Milanese (MI) SNAM S.p.A. 100.00% Line-by-line
ASSET COMPANY 3 S.R.L. San Donato Milanese (MI) Snam 4 Mobility S.p.A. 100.00% Unconsolidated subsidiary
ASSET COMPANY 4 S.R.L. San Donato Milanese (MI) SNAM S.p.A. 100.00% Line-by-line
ASSET COMPANY 5 S.R.L. San Donato Milanese (MI) SNAM S.p.A. 100.00% Unconsolidated subsidiary
ASSET COMPANY 6 S.R.L. San Donato Milanese (MI) SNAM S.p.A. 100.00% Unconsolidated subsidiary
AVVENIA THE ENERGY INNOVATOR S.R.L. Rome Terna Plus S.r.l. 70.00% Line-by-line
B.F. S.p.A. Milan CDP Equity S.p.A. 19.98% Equity
Bacini di Palermo S.p.A. Palermo Fincantieri S.p.A. 100.00% Line-by-line
Baranogas Reti Srl Concordia sulla Secchia Italgas Reti SpA 98.00% Line-by-line
Bonafous S.p.A. in liquidazione Rome CDP Immobiliare S.r.l. 100.00% Line-by-line
Brevik Technology AS Brevik Vard Group AS 34.00% Equity
Cagliari 89 Scarl in liquidazione Monastir (CA) Fintecna S.p.A. 51.00% At cost
Castor Drilling Solution AS Kristiansand S Seaonics AS 34.13% Equity
CDP Equity S.p.A. Milan CDP S.p.A. 97.13% Line-by-line
Milan Fintecna S.p.A. 2.87% Line-by-line
CDP Immobiliare S.r.l. Rome CDP S.p.A. 100.00% Line-by-line
CDP Investimenti SGR S.p.A. Rome CDP S.p.A. 70.00% Line-by-line
CDP Reti S.p.A. Rome CDP S.p.A. 59.10% Line-by-line
CDP Technologies AS Alesund Seaonics AS 100.00% Line-by-line
CDP Technologies Estonia OÜ Tallinn CDP Technologies AS 100.00% Line-by-line
Centro per gli Studi di Tecnica Navale - CETENA S.p.A. Genoa Seaf S.p.A. 15.00% Line-by-line
Genoa Fincantieri S.p.A. 71.10% Line-by-line
CENTRO SERVIZI NAVALI S.p.A. San Giorgio di Nogaro (UD) Fincantieri S.p.A. 10.94% Equity
CESI S.p.A. Milan Terna S.p.A. 42.70% Equity
CGES A.D. Podgorica Terna S.p.A. 22.09% Equity
Cinecittà Luce S.p.A. in liquidazione Rome Ligestra Quattro S.r.l. 100.00% At cost
Cinque Cerchi S.p.A. in liquidazione Rome CDP Immobiliare S.r.l. 100.00% Line-by-line
Consorzio Codelsa in liquidazione Rome Fintecna S.p.A. 100.00% At cost
Consorzio Condif in liquidazione Rome CDP Immobiliare S.r.l. 33.33% At cost
Consorzio Edinca in liquidazione Naples Fintecna S.p.A. 47.32% At cost
Consorzio Edinsud in liquidazione Naples Fintecna S.p.A. 58.82% At cost
Consorzio G1 in liquidazione Rome CDP Immobiliare S.r.l. 100.00% At cost
Consorzio IMAFID in liquidazione Naples Fintecna S.p.A. 56.85% At cost
Consorzio INCOMIR in liquidazione Mercogliano (AV) Fintecna S.p.A. 45.46% At cost
Consorzio Italtecnasud in liquidazione Rome Fintecna S.p.A. 75.00% At cost
Consorzio MED.IN. in liquidazione Rome Fintecna S.p.A. 85.00% At cost
Copow er S.r.l. Rome Tep Energy Solution S.r.l. 51.00% Unconsolidated subsidiary
CORESO S.A. Brussels Terna S.p.A. 15.84% Equity
CSS Design Limited British Virgin Islands (GB) Vard Marine Inc. 31.00% Equity
CSSC - Fincantieri Cruise Industry Development Ltd. Hong Kong Fincantieri S.p.A. 40.00% Equity
CSSC Fincantieri (Shanghai) Cruise Design Limited Shanghai CSSC - Fincantieri Cruise Industry
Development Limited
100.00% Equity
Delf i S.r.l. Follo (SP) Fincantieri S.p.A. 100.00% Line-by-line
Difebal S.A. Montevideo Terna S.p.A. 100.00% Line-by-line
DOF Iceman AS Vard Group AS 50.00% Equity
Elite S.p.A. Milan CDP S.p.A. 15.00% Equity
215
Half-yearly Financial Report 2018
Annexes

Company name Registered office Investor % holding Consolidation method
ELMED Etudes S.a.r.l. Tunis Terna S.p.A. 50.00% Equity
Eni S.p.A. Rome CDP S.p.A. 25.76% Equity
Estaleiro Quissamã Ltda Rio de Janeiro Vard Group AS 50.50% Line-by-line
ETIHAD SHIP BUILDING LLC Abu Dhabi Fincantieri S.p.A. 35.00% Equity
Europrogetti & Finanza S.p.A. in liquidazione Rome CDP S.p.A. 31.80% Equity
Favaragas Reti Srl Concordia sulla Secchia Italgas Reti SpA 98.00% Line-by-line
FIA 2 Rome CDP S.p.A. 100.00% Line-by-line
Fincantieri (Shanghai) Trading Co. Ltd Shanghai Fincantieri S.p.A. 100.00% Line-by-line
Fincantieri Australia Pty Ltd Sydney Fincantieri S.p.A. 100.00% Line-by-line
Fincantieri Do Brasil Partecipacoes S.A. Rio de Janeiro Fincantieri Holding B.V. 20.00% Line-by-line
Rio de Janeiro Fincantieri S.p.A. 80.00% Line-by-line
Fincantieri Europe S.p.A. Trieste Fincantieri S.p.A. 100.00% Line-by-line
Fincantieri Holding B.V. Amsterdam Fincantieri S.p.A. 100.00% Line-by-line
Fincantieri India Private Limited New Delhi Fincantieri S.p.A. 1.00% Line-by-line
New Delhi Fincantieri Holding B.V. 99.00% Line-by-line
Fincantieri Infrastructure S.p.A. Trieste Fincantieri S.p.A. 100.00% Line-by-line
Fincantieri Marine Group Holdings Inc. Green Bay - WI Fincantieri USA Inc. 87.44% Line-by-line
FINCANTIERI MARINE GROUP LLC Washington, DC Fincantieri Marine Group Holdings
Inc.
100.00% Line-by-line
Fincantieri Marine Systems North America Inc. Chesapeake - VI Fincantieri Holding B.V. 100.00% Line-by-line
FINCANTIERI OIL & GAS S.p.A. Trieste Fincantieri S.p.A. 100.00% Line-by-line
Fincantieri S.p.A. Trieste Fintecna S.p.A. 71.64% Line-by-line
Fincantieri Services Middle East LLC Doha Fincantieri S.p.A. 100.00% Line-by-line
Fincantieri Services USA LLC Miami Fincantieri USA Inc. 100.00% Line-by-line
Fincantieri SI S.p.A. Trieste Seaf S.p.A. 100.00% Line-by-line
Fincantieri Sw eden AB Stockholm Fincantieri S.p.A. 100.00% Line-by-line
Fincantieri USA Inc. Washington, DC Fincantieri S.p.A. 100.00% Line-by-line
Fintecna S.p.A. Rome CDP S.p.A. 100.00% Line-by-line
FIT - Fondo Investimenti per il Turismo Rome CDP S.p.A. 100.00% Line-by-line
FIT1 - Fondo Investimenti per il Turismo Rome FIT - Fondo Investimenti per il Turismo 100.00% Line-by-line
FIV extra Rome CDP S.p.A. 100.00% Line-by-line
FIV PLUS Rome CDP S.p.A. 100.00% Line-by-line
FMSNA YK Nagasaki Fincatieri Marine Systems North
America Inc.
100.00% Line-by-line
Fondo Italiano di Investimento SGR S.p.A. Milan CDP S.p.A. 43.00% Equity
Fondo Sviluppo Export Milan SACE S.p.A. 100.00% Line-by-line
Fontenergia 10 Cagliari Ichnusa Gas S.p.A. 98.00% Line-by-line
Fontenergia 11 Cagliari Ichnusa Gas S.p.A. 98.00% Line-by-line
Fontenergia 15 Cagliari Ichnusa Gas S.p.A. 98.00% Line-by-line
Fontenergia 19 Concordia sulla Secchia Ichnusa Gas S.p.A. 98.00% Line-by-line
Fontenergia 26 Cagliari Ichnusa Gas S.p.A. 98.00% Line-by-line
Fontenergia 27 Cagliari Ichnusa Gas S.p.A. 98.00% Line-by-line
Fontenergia 35 Cagliari Ichnusa Gas S.p.A. 98.00% Line-by-line
Fontenergia 37 Cagliari Ichnusa Gas S.p.A. 98.00% Line-by-line
Fontenergia 4 Cagliari Ichnusa Gas S.p.A. 98.00% Line-by-line
Fontenergia 6 Cagliari Ichnusa Gas S.p.A. 98.00% Line-by-line
Fontenergia 7 Cagliari Ichnusa Gas S.p.A. 98.00% Line-by-line
Fontenergia 9 Cagliari Ichnusa Gas S.p.A. 98.00% Line-by-line
FSI Investimenti S.p.A. Milan CDP Equity S.p.A. 77.12% Line-by-line
FSI SGR S.p.A. Milan CDP S.p.A. 39.00% Equity
FSIA INVESTIMENTI S.r.l. Milan FSI Investimenti S.p.A. 70.00% Equity
GasBridge 2 B.V. Rotterdam SNAM S.p.A. 100.00% Line-by-line
Gasrule Insurance D.A.C. DUBLIN SNAM S.p.A. 100.00% Line-by-line
Gestione Bacini La Spezia S.p.A. La Spezia Fincantieri S.p.A. 99.89% Line-by-line
GNL Italia SpA San Donato Milanese (MI) SNAM S.p.A. 100.00% Line-by-line
Grecanica Gas Srl Concordia sulla Secchia Italgas Reti SpA 98.00% Line-by-line
Hotelturist S.p.A. Padua CDP Equity S.p.A. 45.90% Equity
Ichnusa Gas S.p.A. Bologna Italgas Reti S.p.A. 100.00% Line-by-line
Industrial Control Design AS Alesund Seaonics AS 100.00% Line-by-line
Infrastrutture Trasporto Gas S.p.A. San Donato Milanese (MI) ASSET COMPANY 2 S.r.L. 100.00% Line-by-line
216 3. Half-yearly condensed consolidated financial statements at 30 June 2018

Company name Registered office Investor % holding Consolidation method
Interconnector (UK) Ltd London GasBridge 2 B.V. 23.54% Equity
Interconnector Zeebrugge Terminal S.C./C.V. Scrl Brussels GasBridge 2 B.V. 25.00% Equity
IQ Made in Italy Investment Company S.p.A. Milan FSI Investimenti S.p.A. 50.00% Equity
Ischia Reti Gas Srl Concordia sulla Secchia Italgas Reti SpA 98.00% Line-by-line
Island Diligence AS Vard Group AS 39.38% Equity
Isotta Fraschini Motori S.p.A. Bari Fincantieri S.p.A. 100.00% Line-by-line
Issel Middle East Information Technology Consultancy LLC Abu Dhabi Issel Nord S.r.l. 49.00% Equity
Issel Nord S.r.l. Follo Delf i S.r.l. 100.00% Line-by-line
Italgas Acqua S.p.A. Milan Italgas S.p.A. 100.00% Line-by-line
ITALGAS RETI S.P.A. Turin Italgas S.p.A. 100.00% Line-by-line
ITALGAS S.P.A. Milan CDP Reti S.p.A. 26.04% Line-by-line
Milan SNAM S.p.A. 13.50% Line-by-line
Kedrion S.p.A. Castelvecchio Pascoli (LU) FSI Investimenti S.p.A. 25.06% Equity
Ligestra DUE S.r.l. Rome Fintecna S.p.A. 100.00% Equity
Ligestra QUATTRO S.r.l. Rome Fintecna S.p.A. 100.00% At cost
Luxury Interiors Factory s.r.l. Naples Marine Interiors S.p.A. 40.00% Equity
M.I. Galley S.r.l. Pordenone MARINE INTERIORS S.p.A. 85.00% Line-by-line
M.T. Manifattura Tabacchi S.p.A. Rome CDP Immobiliare S.r.l. 90.91% Equity
Manifatture Milano S.p.A. Rome CDP Immobiliare S.r.l. 50.00% Equity
MARINE INTERIORS S.p.A. Trieste Società per l'Esercizio di Attività
Finanziaria - Seaf S.p.A.
100.00% Line-by-line
Marinette Marine Corporation Marinette - WI Fincantieri Marine Group LLC 100.00% Line-by-line
Medea S.p.A. Sassari Italgas Reti SpA 100.00% Line-by-line
Metano S.Angelo Lodigiano S.p.A. Sant'Angelo Lodigiano Italgas Reti SpA 50.00% Equity
Møkster Supply AS Stavanger Vard Group AS 40.00% Equity
Møkster Supply KS Stavanger Vard Group AS 36.00% Equity
Monita Interconnector S.r.l. Rome Terna S.p.A. 95.00% Line-by-line
Rome Terna Rete Italia S.p.A. 5.00% Line-by-line
Olympic Challenger KS Fosnavåg Vard Group AS 35.00% Equity
Olympic Green Energy KS Fosnavag Vard Group AS 29.50% Equity
OpEn Fiber S.p.A. Milan CDP Equity S.p.A. 50.00% Equity
Orizzonte Sistemi Navali S.p.A. Genoa Fincantieri S.p.A. 51.00% Equity
Pentagramma Perugia S.p.A. Rome CDP Immobiliare S.r.l. 50.00% Equity
Pentagramma Piemonte S.p.A. Rome CDP Immobiliare S.r.l. 50.00% Equity
Pentagramma Romagna S.p.A. in liquidazione unipersonale Rome CDP Immobiliare S.r.l. 100.00% Line-by-line
Poste Italiane S.p.A. Rome CDP S.p.A. 35.00% Equity
Progas Metano Srl Concordia sulla Secchia Italgas Reti SpA 98.00% Line-by-line
Quadrifoglio Brescia S.p.A. in liquidazione Rome CDP Immobiliare S.r.l. 50.00% At cost
Quadrifoglio Genova S.p.A. in liquidazione Rome CDP Immobiliare S.r.l. 50.00% At cost
Quadrifoglio Modena S.p.A in liquidazione Rome CDP Immobiliare S.r.l. 50.00% At cost
Quadrifoglio Piacenza S.p.A. in liquidazione Rome CDP Immobiliare S.r.l. 50.00% At cost
Quadrifoglio Verona S.p.A. in liquidazione Rome CDP Immobiliare S.r.l. 50.00% At cost
Quattror SGR S.p.A. Milan CDP S.p.A. 40.00% Equity
Rem Supply AS Fosnavag Vard Group AS 26.66% Equity
Residenziale Immobiliare 2004 S.p.A. Rome CDP Immobiliare S.r.l. 74.47% Line-by-line
Rete S.r.l. Rome Terna S.p.A. 100.00% Line-by-line
Rete Verde 17 S.r.l. Rome Terna Plus S.r.l. 100.00% Line-by-line
Rete Verde 18 S.r.l. Rome Terna Plus S.r.l. 100.00% Line-by-line
Rete Verde 19 S.r.l. Rome Terna Plus S.r.l. 100.00% Line-by-line
Rete Verde 20 S.r.l. Rome Terna Plus S.r.l. 100.00% Line-by-line
Risparmio Holding S.p.A. Rome CDP S.p.A. 20.00% Equity
Rocco Forte Hotels Limited London FSI Investimenti S.p.A. 23.00% Equity
SACE BT Rome SACE S.p.A. 100.00% Line-by-line
Sace do Brasil San Paolo SACE S.p.A. 100.00% Line-by-line
SACE FCT Rome SACE S.p.A. 100.00% Line-by-line
SACE S.p.A. Rome CDP S.p.A. 100.00% Line-by-line
SACE Servizi Rome SACE BT 100.00% Line-by-line
Saipem S.p.A. San Donato Milanese (MI) CDP Equity S.p.A. 12.55% Equity
Seaonics AS Alesund Vard Group AS 56.40% Line-by-line
217
Half-yearly Financial Report 2018
Annexes
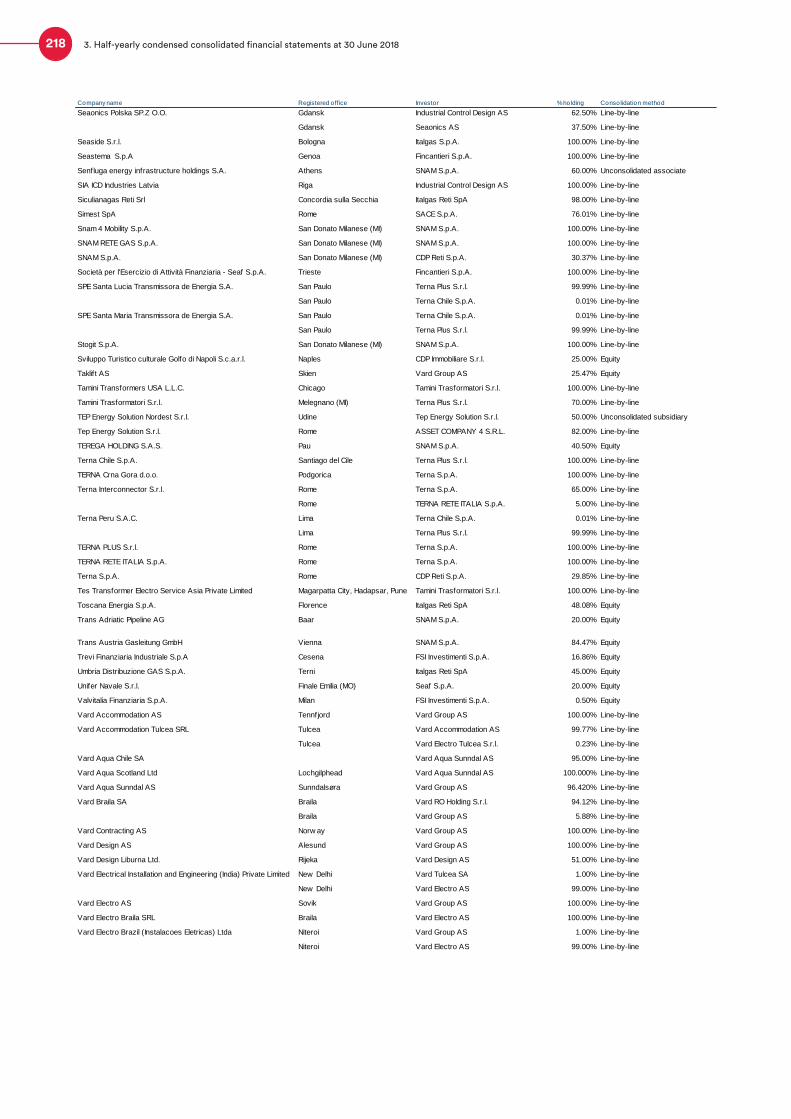
Company name Registered office Investor % holding Consolidation method
Seaonics Polska SP.Z O.O. Gdansk Industrial Control Design AS 62.50% Line-by-line
Gdansk Seaonics AS 37.50% Line-by-line
Seaside S.r.l. Bologna Italgas S.p.A. 100.00% Line-by-line
Seastema S.p.A Genoa Fincantieri S.p.A. 100.00% Line-by-line
Senfluga energy infrastructure holdings S.A. Athens SNAM S.p.A. 60.00% Unconsolidated associate
SIA ICD Industries Latvia Riga Industrial Control Design AS 100.00% Line-by-line
Siculianagas Reti Srl Concordia sulla Secchia Italgas Reti SpA 98.00% Line-by-line
Simest SpA Rome SACE S.p.A. 76.01% Line-by-line
Snam 4 Mobility S.p.A. San Donato Milanese (MI) SNAM S.p.A. 100.00% Line-by-line
SNAM RETE GAS S.p.A. San Donato Milanese (MI) SNAM S.p.A. 100.00% Line-by-line
SNAM S.p.A. San Donato Milanese (MI) CDP Reti S.p.A. 30.37% Line-by-line
Società per l'Esercizio di Attività Finanziaria - Seaf S.p.A. Trieste Fincantieri S.p.A. 100.00% Line-by-line
SPE Santa Lucia Transmissora de Energia S.A. San Paulo Terna Plus S.r.l. 99.99% Line-by-line
San Paulo Terna Chile S.p.A. 0.01% Line-by-line
SPE Santa Maria Transmissora de Energia S.A. San Paulo Terna Chile S.p.A. 0.01% Line-by-line
San Paulo Terna Plus S.r.l. 99.99% Line-by-line
Stogit S.p.A. San Donato Milanese (MI) SNAM S.p.A. 100.00% Line-by-line
Sviluppo Turistico culturale Golfo di Napoli S.c.a.r.l. Naples CDP Immobiliare S.r.l. 25.00% Equity
Taklif t AS Skien Vard Group AS 25.47% Equity
Tamini Transformers USA L.L.C. Chicago Tamini Trasformatori S.r.l. 100.00% Line-by-line
Tamini Trasformatori S.r.l. Melegnano (MI) Terna Plus S.r.l. 70.00% Line-by-line
TEP Energy Solution Nordest S.r.l. Udine Tep Energy Solution S.r.l. 50.00% Unconsolidated subsidiary
Tep Energy Solution S.r.l. Rome ASSET COMPANY 4 S.R.L. 82.00% Line-by-line
TEREGA HOLDING S.A.S. Pau SNAM S.p.A. 40.50% Equity
Terna Chile S.p.A. Santiago del Cile Terna Plus S.r.l. 100.00% Line-by-line
TERNA Crna Gora d.o.o. Podgorica Terna S.p.A. 100.00% Line-by-line
Terna Interconnector S.r.l. Rome Terna S.p.A. 65.00% Line-by-line
Rome TERNA RETE ITALIA S.p.A. 5.00% Line-by-line
Terna Peru S.A.C. Lima Terna Chile S.p.A. 0.01% Line-by-line
Lima Terna Plus S.r.l. 99.99% Line-by-line
TERNA PLUS S.r.l. Rome Terna S.p.A. 100.00% Line-by-line
TERNA RETE ITALIA S.p.A. Rome Terna S.p.A. 100.00% Line-by-line
Terna S.p.A. Rome CDP Reti S.p.A. 29.85% Line-by-line
Tes Transformer Electro Service Asia Private Limited Magarpatta City, Hadapsar, Pune Tamini Trasformatori S.r.l. 100.00% Line-by-line
Toscana Energia S.p.A. Florence Italgas Reti SpA 48.08% Equity
Trans Adriatic Pipeline AG Baar SNAM S.p.A. 20.00% Equity
Trans Austria Gasleitung GmbH Vienna SNAM S.p.A. 84.47% Equity
Trevi Finanziaria Industriale S.p.A Cesena FSI Investimenti S.p.A. 16.86% Equity
Umbria Distribuzione GAS S.p.A. Terni Italgas Reti SpA 45.00% Equity
Unifer Navale S.r.l. Finale Emilia (MO) Seaf S.p.A. 20.00% Equity
Valvitalia Finanziaria S.p.A. Milan FSI Investimenti S.p.A. 0.50% Equity
Vard Accommodation AS Tennfjord Vard Group AS 100.00% Line-by-line
Vard Accommodation Tulcea SRL Tulcea Vard Accommodation AS 99.77% Line-by-line
Tulcea Vard Electro Tulcea S.r.l. 0.23% Line-by-line
Vard Aqua Chile SA Vard Aqua Sunndal AS 95.00% Line-by-line
Vard Aqua Scotland Ltd Lochgilphead Vard Aqua Sunndal AS 100.000% Line-by-line
Vard Aqua Sunndal AS Sunndalsøra Vard Group AS 96.420% Line-by-line
Vard Braila SA Braila Vard RO Holding S.r.l. 94.12% Line-by-line
Braila Vard Group AS 5.88% Line-by-line
Vard Contracting AS Norw ay Vard Group AS 100.00% Line-by-line
Vard Design AS Alesund Vard Group AS 100.00% Line-by-line
Vard Design Liburna Ltd. Rijeka Vard Design AS 51.00% Line-by-line
Vard Electrical Installation and Engineering (India) Private Limited New Delhi Vard Tulcea SA 1.00% Line-by-line
New Delhi Vard Electro AS 99.00% Line-by-line
Vard Electro AS Sovik Vard Group AS 100.00% Line-by-line
Vard Electro Braila SRL Braila Vard Electro AS 100.00% Line-by-line
Vard Electro Brazil (Instalacoes Eletricas) Ltda Niteroi Vard Group AS 1.00% Line-by-line
Niteroi Vard Electro AS 99.00% Line-by-line
218 3. Half-yearly condensed consolidated financial statements at 30 June 2018
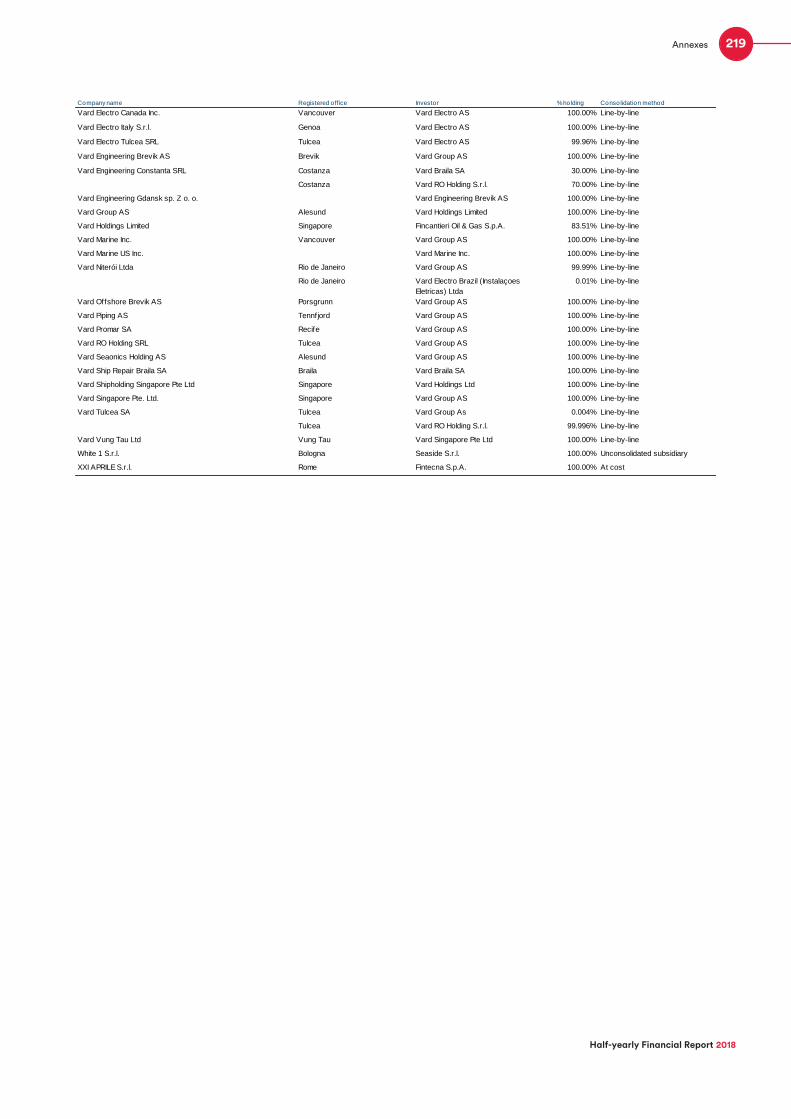
Company name Registered office Investor % holding Consolidation method
Vard Electro Canada Inc. Vancouver Vard Electro AS 100.00% Line-by-line
Vard Electro Italy S.r.l. Genoa Vard Electro AS 100.00% Line-by-line
Vard Electro Tulcea SRL Tulcea Vard Electro AS 99.96% Line-by-line
Vard Engineering Brevik AS Brevik Vard Group AS 100.00% Line-by-line
Vard Engineering Constanta SRL Costanza Vard Braila SA 30.00% Line-by-line
Costanza Vard RO Holding S.r.l. 70.00% Line-by-line
Vard Engineering Gdansk sp. Z o. o. Vard Engineering Brevik AS 100.00% Line-by-line
Vard Group AS Alesund Vard Holdings Limited 100.00% Line-by-line
Vard Holdings Limited Singapore Fincantieri Oil & Gas S.p.A. 83.51% Line-by-line
Vard Marine Inc. Vancouver Vard Group AS 100.00% Line-by-line
Vard Marine US Inc. Vard Marine Inc. 100.00% Line-by-line
Vard Niterói Ltda Rio de Janeiro Vard Group AS 99.99% Line-by-line
Rio de Janeiro Vard Electro Brazil (Instalaçoes
Eletricas) Ltda
0.01% Line-by-line
Vard Offshore Brevik AS Porsgrunn Vard Group AS 100.00% Line-by-line
Vard Piping AS Tennfjord Vard Group AS 100.00% Line-by-line
Vard Promar SA Recife Vard Group AS 100.00% Line-by-line
Vard RO Holding SRL Tulcea Vard Group AS 100.00% Line-by-line
Vard Seaonics Holding AS Alesund Vard Group AS 100.00% Line-by-line
Vard Ship Repair Braila SA Braila Vard Braila SA 100.00% Line-by-line
Vard Shipholding Singapore Pte Ltd Singapore Vard Holdings Ltd 100.00% Line-by-line
Vard Singapore Pte. Ltd. Singapore Vard Group AS 100.00% Line-by-line
Vard Tulcea SA Tulcea Vard Group As 0.004% Line-by-line
Tulcea Vard RO Holding S.r.l. 99.996% Line-by-line
Vard Vung Tau Ltd Vung Tau Vard Singapore Pte Ltd 100.00% Line-by-line
White 1 S.r.l. Bologna Seaside S.r.l. 100.00% Unconsolidated subsidiary
XXI APRILE S.r.l. Rome Fintecna S.p.A. 100.00% At cost
219
Half-yearly Financial Report 2018
Annexes

2. Annexes to the half-yearly report on operations
2.1 Reconciliation between the reclassified income statement and balance sheet and the financial statements - CDP S.p.A.
The following table provides a reconciliation of the financial statements prepared in accordance with Bank of Italy circular
no. 262/2005, as amended, and the aggregates as reclassified on an operational basis.
These reclassifications mainly concerned:
the allocation to specific and distinct items of interest-bearing amounts and non-interest-bearing amounts;
the revision of portfolios for IFRS purposes with their reclassification into uniform aggregates in relation to both
products and business lines.
Balance sheet - Assets
30/06/2018 Cash and
cash equivalents
Loans Debt securities
Equity investments
Assets held for trading
and hedging
derivatives
Property, plant and equipment
and intangible
assets
Accrued income, prepaid
expenses and other
non-interest-bearing assets
Other assets
(millions of euro)
ASSETS
10. Cash and cash equivalents 0 0
20. Financial assets measured at fair value through profit or loss
2,522 313 2,124 85 0
30. Financial assets measured at fair value through other comprehesinve income
10,896 10,354 511 32
40. Financial assets measured at amortised cost
320,677
a) Loans to banks 17,986 4,697 11,998 1,291
b) Loans to customers 302,691 158,159 88,677 47,426 8,429
50. Hedging derivatives 721 721
60. Fair value change of financial assets in hedged portfolios
33 33
70. Equity investments 30,421 30,421
80. Property, plant and equipment 316 316
90. Intangible assets 13 13
100. Tax assets 630 630
110. Non-current assets and disposal groups held for sale
120. Other assets 390 390
Total assets 366,619 162,855 100,676 58,093 33,057 839 329 9,752 1,019
220 3. Half-yearly condensed consolidated financial statements at 30 June 2018
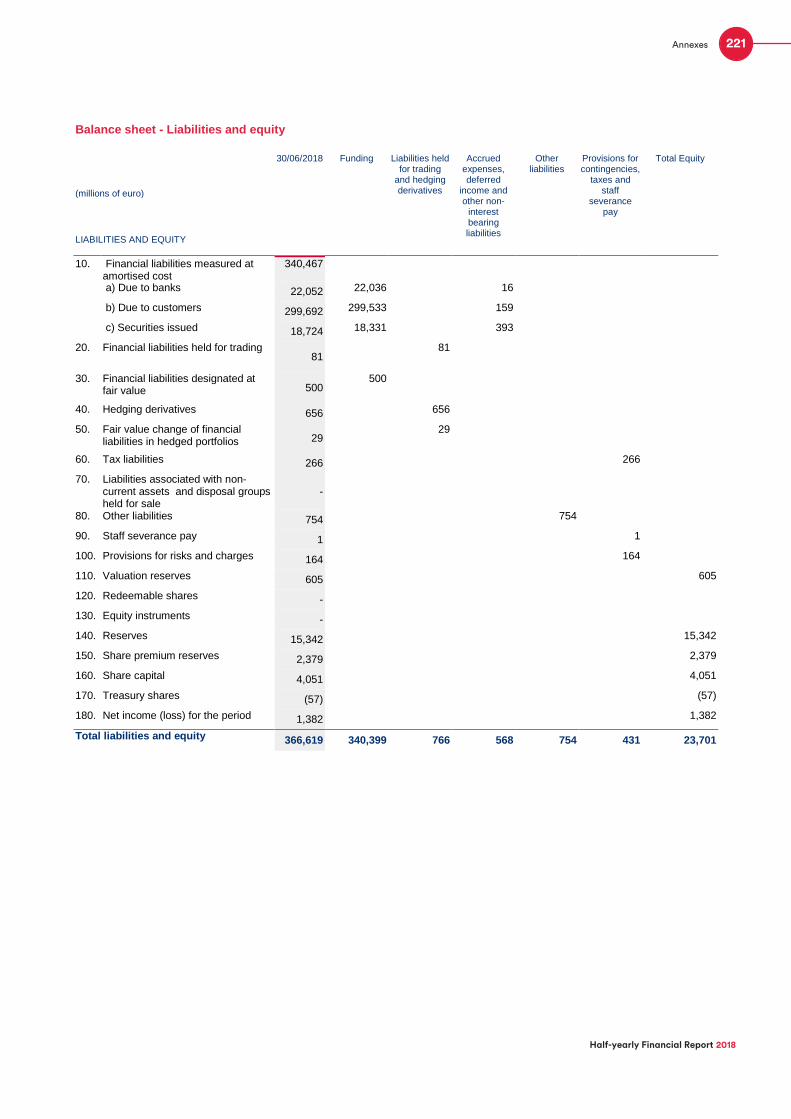
Balance sheet - Liabilities and equity
(millions of euro)
30/06/2018 Funding Liabilities held for trading
and hedging derivatives
Accrued expenses, deferred
income and other non-
interest bearing liabilities
Other liabilities
Provisions for contingencies,
taxes and staff
severance pay
Total Equity
LIABILITIES AND EQUITY
10. Financial liabilities measured at amortised cost
340,467
a) Due to banks 22,052 22,036 16
b) Due to customers 299,692 299,533 159
c) Securities issued 18,724 18,331 393
20. Financial liabilities held for trading 81
81
30. Financial liabilities designated at fair value 500
500
40. Hedging derivatives 656 656
50. Fair value change of financial liabilities in hedged portfolios 29
29
60. Tax liabilities 266 266
70. Liabilities associated with non-current assets and disposal groups held for sale
-
80. Other liabilities 754 754
90. Staff severance pay 1 1
100. Provisions for risks and charges 164 164
110. Valuation reserves 605 605
120. Redeemable shares -
130. Equity instruments -
140. Reserves 15,342 15,342
150. Share premium reserves 2,379 2,379
160. Share capital 4,051 4,051
170. Treasury shares (57) (57)
180. Net income (loss) for the period 1,382 1,382
Total liabilities and equity 366,619 340,399 766 568 754 431 23,701
221
Half-yearly Financial Report 2018
Annexes

Income statement
10.
Inte
rest
inco
me
and
sim
ilar
reve
nues
3,68
4 3,
684
3,68
4 3,
684
3,68
4
20.
Inte
rest
exp
ense
and
sim
ilar
char
ges
(2,0
72)
(2,0
72)
(2,0
72)
(2,0
72)
(2,0
72)
40.
Com
mis
sion
inco
me
189
189
189
189
189
50.
Com
mis
sion
exp
ense
(788
) (7
88)
(788
) (7
88)
(788
)
70.
Div
iden
ds a
nd s
imila
r re
venu
es81
1 81
1 81
1 81
1 81
1
80.
Net
gai
n (lo
ss)
on tr
adin
g ac
tiviti
es5
5 5
5 5
90.
Fair
valu
e ad
just
men
ts in
hed
ge a
ccou
ntin
g(1
0)
(10)
(1
0)
(10)
(1
0)
100.
Gai
ns (
loss
es)
on d
ispo
sal o
r re
purc
hase
55
55
55
55
55
110.
Prof
its (
loss
es)
on f
inan
cial
ass
ets
and
liabi
litie
s m
easu
red
at f
air
valu
e th
roug
h pr
ofit
or lo
ss
(21)
(2
0)
(1)
(21)
(2
1)
(21)
130.
Net
adj
ustm
ents
/rec
over
ies
for
cred
it ris
k(3
8)
(38)
(3
8)
(38)
140.
Gai
ns/lo
sses
fro
m c
hang
es in
con
trat
s w
ithou
t der
ecog
nitio
n-
160.
Adm
inis
trat
ive
expe
nses
(82)
(8
2)
(82)
(8
2)
170.
Net
acc
rual
s to
the
prov
isio
ns f
or r
isks
and
cha
rges
(17)
(1
) (1
) (1
7)
(17)
180.
Net
adj
ustm
ents
to/r
ecov
erie
s on
pro
pert
y, p
lant
and
equ
ipm
ent
(2)
(2)
(2)
190.
Net
adj
ustm
ents
to/r
ecov
erie
s on
inta
ngib
le a
sset
s(1
) (1
) (1
)
200.
Oth
er o
pera
ting
inco
me
(cos
ts)
4 1
3 4
4
220.
Gai
ns (
loss
es)
on e
quity
inve
stm
ents
0 0
0 0
0
230.
Gai
ns (
loss
es)
on ta
ngib
le a
nd in
tang
ibile
ass
ets
mea
sure
d at
fai
r
valu
e
240.
Goo
dwill
impa
irmen
t
250.
Gai
ns (
loss
es)
on d
ispo
sal o
f in
vest
men
ts(0
) (0
) (0
)
260.
Inco
me
tax
for
the
perio
d on
con
tinui
ng o
pera
tions
(335
) (3
35)
(335
)
280.
Inco
me
(loss
) af
ter
tax
on d
isco
ntin
ued
oper
atio
ns-
1,38
2 1,
612
811
(19)
(6
00)
49
1,85
3 (3
9)
(84)
3
1,73
6 (1
7)
(335
) 1,
382
To
tal i
nco
me
sta
tem
en
t
Ne
t co
mm
issio
n
inco
me
(e
xpe
nse
)
Oth
er n
et
reve
nu
es (co
sts
)
Gro
ss in
co
me
Ne
t re
co
ve
rie
s
(im
pa
irm
en
t)(m
illio
ns o
f e
uro
)3
0 J
un
e 2
018
Ne
t in
tere
st
inco
me
Div
ide
nd
s
Ga
ins (lo
sse
s)
on
eq
uity
inve
stm
en
ts
Op
era
tin
g in
co
me
Ne
t P
rovis
ion
s
for
risks a
nd
ch
arg
es
Inco
me
ta
xes
Ne
t in
co
me
fo
r
the
pe
rio
d
INC
OM
E S
TA
TE
ME
NT
Ove
rhe
ad
sO
the
r o
pe
ratin
g
inco
me
(co
sts
)
222 3. Half-yearly condensed consolidated financial statements at 30 June 2018

2.2 Reconciliation between the reclassified income statement and balance sheet and the financial statements - CDP Group
In support of the comments on the results for the period, paragraph 4.2.2 of the Report on operations presents and
illustrates the reclassified consolidated income statement and balance sheet of the CDP Group. The following sets forth
the reconciliation statements for the consolidated income statement and consolidated balance sheet, reclassified with
respect to the consolidated financial statements, as requested in Consob communication no. 6064293 of 28 July 2006.
Consolidated balance sheet - Assets
Reclassified financial statements
1 1
5,347
a) Financial assets held for trading 2,249 2,144 105
b) Financial assets designated at fair value -
c) Other f inancial asstes mandatorily measured at fair
value
3,098 653 2,445
10,608 10,608
327,260
a) Loans to banks 22,979 9,691 12,323 965
b) Loans to customers 304,281 155,209 96,584 52,488
815 815
33 33
20,149 20,149
599 599
37,161 37,161
8,600 8,600
1,666 1,666
19 19
7,894 7,894
420,152 164,901 109,560 68,650 20,149 920 45,761 599 9,612
80. Reinsurers' share of technical reserves
Other assets30 June 2018 Cash and cash
equivalents and
other treasury
investments
Loans Debt securities,
equity securities
and units in
co llective
investment
undertakings
Equity
investments
Trading and
hedging
derivatives
Property, plant
and equipment
and intangible
assets
Reinsureres'
share of technical
reserves(millions of euro)
ASSETS - Balance sheet items
Total assets
10. Cash and cash equivalents
20. Financial assets measured at fair value through profit or loss
30. Financial assets measured at fair value through other
comprehesinve income
90. Property, plant and equipment
100. Intangible assets
110. Tax assets
120. Non-current assets and disposal groups held for sale
130. Other assets
50. Hedging derivatives
60. Fair value change of f inancial assets in hedged portfolios (+/-)
40. Financial assets measured at amortised cost
70. Equity investments
223
Half-yearly Financial Report 2018
Annexes

Consolidated balance sheet - liabilities and equity
Reclassified financial statements
10. Financial liabilities measured at amortised cost 363,975
a) Due to banks 31,393 31,393 1,295 30,098
b) Due to customers 294,880 294,880 252,261 24,699 17,920
c) Securities issued 37,702 37,702 37,702
20. Financial liabilities held for trading 96 96
30. Financial liabilities designated at fair value 634 634 116 518
40. Hedging derivatives 758 758
50. Fair value change of f inancial liabilities in hedged
portfolios
29 29
60. Tax liabilities 3,843 3,843
70. Liabilities associated w ith non-current assets
and disposal groups held for sale
-
80. Other liabilities 10,077 10,077
90. Staff severance pay 218 218
100. Provisions for risks and charges 2,829 2,829
110. Technical reserves 2,285 2,285
120. Valuation reserves 570 570
150. Reserves 14,319 14,319
160. Share premium reserve 2,379 2,379
170. Share capital 4,051 4,051
180. Treasury shares (57) (57)
190. Non-controlling interests 12,701 12,701
200. Net income (loss) for the period 1,445 1,445
420,152 364,609 253,556 54,913 17,920 38,220 854 2,285 10,106 6,890 35,408 Total liabilities and equity
30 June 2018 Funding Liabilities held
for trading
and hedging
derivatives
Technical
reserves
Other liabilities Provisions for
contingencies,
taxes and staff
severance pay
Total equity
(millions of euro)Postal Funding Funding from
banks
Funding from
customers
Bond Funding
LIABILITIES AND EQUITY - Balance sheet items
224 3. Half-yearly condensed consolidated financial statements at 30 June 2018

Consolidated income statement
Reclassified financial statements
(milio
ns o
f eur
o)
10.
Inte
rest
inco
me
and
sim
iliar i
ncom
e3,
789
3,78
9 3,
789
3,78
9 3,
789
3,78
9
20.
Inte
rest
exp
ense
and
sim
ilar e
xpen
se(2
,253
) (2
,253
) (2
,253
) (2
,253
) (2
,253
) (2
,253
)
40.
Com
mis
sin
inco
me
214
214
214
214
214
214
50.
Com
mis
sin
expe
nse
(811
) (8
11)
(811
) (8
11)
(811
) (8
11)
70.
Divi
dend
s an
d si
mila
r rev
enue
s3
3 3
3 3
3
80.
Prof
its (l
osse
s) o
n tra
ding
act
ivitie
s27
27
27
27
27
27
90.
Net g
ain
(loss
) on
hedg
ing
activ
ities
(21)
(2
1)
(21)
(2
1)
(21)
(2
1)
100.
Gai
ns (l
osse
s) o
n di
spos
al o
r rep
urch
ase
57
57
57
57
57
57
110.
Prof
its (l
osse
s) o
n fin
anci
al a
sset
s an
d lia
biliti
es m
easu
red
at fa
ir
valu
e th
roug
h pr
ofit
or lo
ss
(34)
(3
4)
(34)
(3
4)
(34)
(3
4)
130.
Net a
djus
tmen
ts/re
cove
ries
for c
redi
t ris
k(4
8)
(48)
(4
8)
(48)
140.
Gai
ns/lo
sses
from
cha
nges
in c
ontra
ts w
ithou
t der
ecog
nitio
n-
160.
Net p
rem
ium
inco
me
122
122
122
122
122
170.
Net o
the
inco
me
(exp
ense
) fro
m in
sura
nce
oper
atio
ns(4
7)
(47)
(4
7)
(47)
(4
7)
190.
Adm
inis
trativ
e ex
pens
es(3
,392
) (3
,392
) (3
,392
) (3
,392
)
200.
Net a
ccru
als
to th
e pr
ovis
ions
for r
isks
and
cha
rges
(45)
(4
5)
(45)
210.
Net a
djus
tmen
ts to
/reco
verie
s on
pro
perty
, pla
nt a
nd e
quip
men
t(6
98)
(698
) (6
98)
220.
Net a
djus
tmen
ts to
/reco
verie
s on
inta
ngib
le a
sset
s(3
04)
(304
) (3
04)
230.
Oth
er o
pera
ting
inco
me
(cos
ts)
5,70
0 5,
700
5,70
0 5,
700
250.
Gai
ns (l
osse
s) o
n eq
uity
inve
stm
ents
675
675
675
675
675
675
260.
Gai
ns (L
osse
s) o
n ta
ngib
le a
nd in
tang
ible
ass
ets
mea
sure
d at
fair
valu
e
- -
280.
Gai
ns (l
osse
s) o
n di
spos
al o
f inv
estm
ents
(2)
(2)
(2)
300.
Inco
me
tax
for t
he p
erio
d on
con
tinui
ng o
pera
tions
(740
) (7
40)
(740
)
2,19
2 1,
536
678
(597
) 29
1,
646
75
1,72
1 (4
8)
(3,3
92)
5,70
0 3,
981
(45)
(1
,002
) (2
) (7
40)
2,19
2
340.
Net i
ncom
e (lo
ss) f
or th
e pe
riod
perta
inin
g to
non
-con
trollin
g
inte
rest
s
747
747
1,44
5 1,
445
330.
Net
inco
me
(loss
) for
the
peri
od
350.
Net
inco
me
(loss
) for
the
peri
od p
erta
inin
g to
sha
reho
lder
s
of th
e Pa
rent
Com
pany
Net
adj
ustm
ents
on P
PE
and
inta
ngib
le a
sset
s
Pro
fit (l
oss)
on
insu
ranc
e
busi
ness
30 J
une
2018
Oth
erIn
com
e ta
xes
Net
inco
me
(loss
) for
the
perio
d
INC
OM
E ST
ATE
MEN
T-Fi
nanc
ial s
tate
men
t ite
ms
Pro
fit (l
oss)
on
bank
ing
and
insu
ranc
e
oper
atio
ns
Net
reco
verie
s
(impa
irmen
t)
Adm
inis
trativ
e
expe
nses
Oth
er n
et
oper
atin
g in
com
e
(cos
ts)
Ope
ratin
g in
com
eN
et p
rovi
sion
s
for r
isks
and
char
ges
Net
inte
rest
inco
me
Gai
ns (l
osse
s) o
n
equi
ty
inve
stm
ents
Net
com
mis
sion
inco
me
(exp
ense
)
Oth
er n
et
reve
nues
(cos
ts)
Gro
ss In
com
e
225
Half-yearly Financial Report 2018
Annexes

2.3 Details of alternative performance indicators - CDP S.p.A.
In support of the comments on the results for the period, paragraph 4.4.1 of the Report on operations also presents and
illustrates the reclassified income statement and balance sheet of CDP S.p.A. A reconciliation between the latter and the
Parent Company’s financial statements at 30 June 2018 is provided in Annex 2, as required by Consob Communication
no. 6064293 of 28 July 2006. With a view to providing further information on the Parent Company’s performance, the
Report on operations contains financial information and a number of alternative performance indicators, including, for
example, the cost/income ratio and Net impaired loans/net loans to customers and banks. In accordance with the
guidelines published on 5 October 2015 by the European Securities and Markets Authority (ESMA/2015/1415), details of
the calculation method and the content of the aforementioned indicators are provided below.
STRUCTURE RATIOS
Loans / Total assets: it measures loans to customers and banks, as shown in the aggregate account (Annex 2), against
total assets, as shown in the financial statements
Loans / Postal funding: it measures loans to customers and banks, as shown in the aggregate account (Annex 2),
against total Postal funding, inclusive of the nominal value of Savings Bonds and Passbook Savings Accounts, interest
accrued and premiums on the related options
Equity investments / Final equity: it measures equity investments and shares, as shown in the aggregate account
(Annex 2), against Equity, as shown in the financial statements
Securities / Equity: it measures debt securities, as shown in the aggregate account (Annex 2), against Equity, as shown
in the financial statements
Funding / Total liabilities: it measures Total Funding, as shown in the aggregate account (Annex 2), against total
liabilities, as shown in the financial statements
Postal Funding / Total Funding: it measures Postal Funding, inclusive of the nominal value of Savings Bonds and
Passbook Savings Accounts, interest accrued and premiums on the related options, against Total Funding, as shown in
the aggregate account (Annex 2)
PROFITABILITY RATIOS
Net Interest Income / Gross Income: it measures Net Interest Income, as shown in the financial statements, against
Gross Income, as shown in the aggregate account (Annex 2)
Net Commission / Gross Income: it measures Net Commission, as shown in the financial statements, against Gross
Income, as shown in the aggregate account (Annex 2)
Dividends and Gains (Losses) on Equity investments / Gross Income: it measures the performance of the equity
investments portfolio, considered as the sum of dividends and gains (losses) on equity investments, as shown in the
aggregate account (Annex 2), against Gross Income, as shown in the aggregate account (Annex 2)
Commission Expense / Gross income: it measures Commission Expense, as shown in the financial statements,
against Gross Income, as shown in the aggregate account (Annex 2)
Spread on interest-bearing assets and liabilities: it measures the difference between the return on assets (measured
as the ratio of interest income to average interest-bearing assets) and the cost of liabilities (measured as the ratio of
interest expense to average interest-bearing liabilities).
Average interest-bearing assets are measured as the average at two dates (31 December 2017 and 30 June 2018) of
Cash and Cash Equivalents, Loans to customers and banks and Debt securities, as shown in the aggregate account
(Annex 2).
Average interest-bearing liabilities are measured as the average at two dates (31 December 2017 and 30 June 2018), of
Funding, as shown in the aggregate account (Annex 2)
Cost / Income Ratio: it measures the ratio of Overhead costs to Operating Income, as respectively shown in the
aggregate account (Annex 2).
226 3. Half-yearly condensed consolidated financial statements at 30 June 2018

lndependeot Aud;to''' Report o---INDEPENDENT AUDITORS' REPORT
p wc REVIEW REPORT ON HALF-YEARLY CONDENSED CONSOLIDATED FINANCIAL STATEMENTS AS OF 30 JUNE 2018
To the Shareholders of Cassa Depositi e Prestiti SpA
Foreword
W e have reviewed the accompanying half-yearly condensed consolidated financial statements of Cassa Depositi e Prestiti SpA and its subsidiaries (the Cassa Depositi e Prestiti Group) as of 30 June 2018, comprising the consolidated balance sheet, the consolidated income statement, the consolidated statement of comprehensive income, the consolidated statement of changes in equity, the consolidated statement of cash flows and the related notes. The directors of Cassa Depositi e Prestiti SpA are responsible for the preparation of the half-yearly condensed consolidated financial statements in accordance with International Accounting Standard 34, applicable to interim financial reporting (lAS 34) as adopted by the European Union. Our responsibility is to express a conclusion on these halfyearly condensed consolidated financial statements based on our review.
Scope of review
W e conducted our work in accordance with the criteria fora review recommended by Consob in Resolution no. 10867 of 31 July 1997. A review of half-yearly condensed consolidated financial statements consists of making enquiries, primarily of persons responsible for financial an d accounting matters, and applying analytical and other review procedures. A review is substantially less in scope than a full-scope audit conducted in accordance with International Standards on Auditing (ISA Italia) and, consequently, does not enable us to obtain assurance that we would become aware of all significant matters that might be identified in an audi t. Accordingly, we do not express an audi t opinion on the half-yearly condensed consolidated financial statements.
Conclusion
Based on our review, nothing has come to our attention that causes us to believe that the accompanying half-yearly condensed consolidated financial statements of the Cassa Depositi e Prestiti Group as of 30 June 2018 are not prepared, in all material respects, in accordance with International Accounting Standard 34 applicable to interim financial reporting (lAS 34) as adopted by the European Union.
Rome, 6 August 2018
PricewaterhouseCoopers SpA
Signed by
Lorenzo Pini Prato (Partner)
This report has been translated into Englishfrom the Italian origina[ solely for the convenience of international readers.
PricewaterhouseCoopers SpA
Sede legale e amministrativa: Milano 20149 Via Monte Rosa 91 T eL 0277851 Fax 027785240 Cap. Soc. Euro 6.89o.ooo,oo i. v., C .F. e P.NA e Reg. Imp. Milano 12979880155 Iscritta al n° 119644 del Registro dei Revisori Legali - Altri Uffici: Ancona 60131 Via Sandro Totti 1 Te!. 0712132311 - Bari 70122 Via Abate Gimma 72 Te!. 0805640211 - Bologna 40126 Via Angelo Finelli 8 Te!. 0516186211 - Brescia 25123 Via Borgo Pietro Wuhrer 23 Te!. 0303697501 -Catania 95129 Corso Italia 302 Te!. 0957532311 -Firenze 50121 Viale Gramsci 15 Te!. 0552482811-Genova 16121 Piazza Piccapietra 9 Te!. 01029041- Napoli 80121 Via dei Mille 16 Te!. 08136181- Padova 35138 Via Vicenza 4 Te!. 049873481 - Palermo 90141 Via Marchese Ugo 6o Te!. 091349737- Parma 43121 Viale Tanara 2oj A Te!. 0521275911 -Pescara 65127 Piazza Ettore Troilo 8 Te!. 0854545711 - Roma 00154 Largo Fochetti 29 Te!. 06570251 - Tmfuo 10122 Corso Palestro 10 Te!. 011556771 -Trento 38122 Viale della Costituzione 33 Te!. 0461237004 -Treviso 31100 Viale Felissent 90 Te!. 0422696911 -Trieste 34125 Via Cesare Battisti 18 Te!. 0403480781 -Udine 33100 Via Poscolle 43 Te!. 043225789 - Varese 21100 Via Albuzzi 43 Te!. 0332285039 - Verona 37135 Via Francia 21/C Te!. 0458263001- Vicenza 36100 Piazza Pontelandolfo 9 Te!. 0444393311
www.pwc.com/it
Half-yearly Financial Report 2018
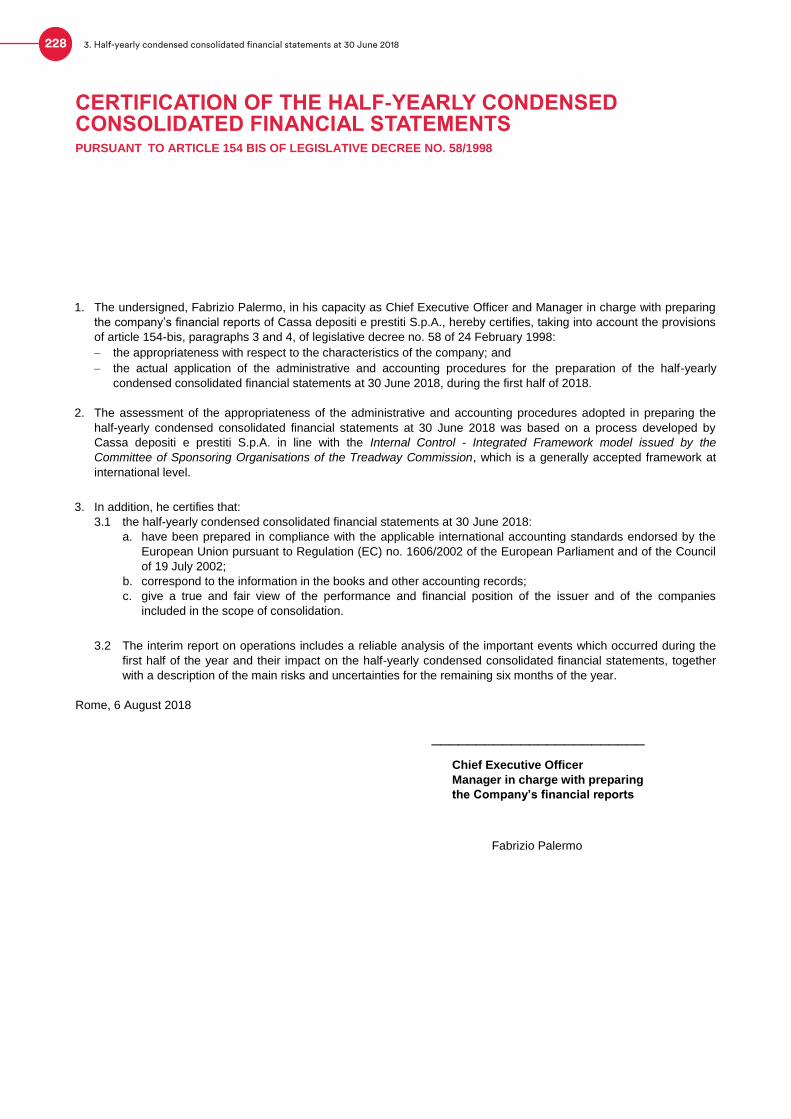
CERTIFICATION OF THE HALF-YEARLY CONDENSED CONSOLIDATED FINANCIAL STATEMENTS PURSUANT TO ARTICLE 154 BIS OF LEGISLATIVE DECREE NO. 58/1998
1. The undersigned, Fabrizio Palermo, in his capacity as Chief Executive Officer and Manager in charge with preparing
the company’s financial reports of Cassa depositi e prestiti S.p.A., hereby certifies, taking into account the provisions
of article 154-bis, paragraphs 3 and 4, of legislative decree no. 58 of 24 February 1998:
the appropriateness with respect to the characteristics of the company; and
the actual application of the administrative and accounting procedures for the preparation of the half-yearly
condensed consolidated financial statements at 30 June 2018, during the first half of 2018.
2. The assessment of the appropriateness of the administrative and accounting procedures adopted in preparing the
half-yearly condensed consolidated financial statements at 30 June 2018 was based on a process developed by
Cassa depositi e prestiti S.p.A. in line with the Internal Control - Integrated Framework model issued by the
Committee of Sponsoring Organisations of the Treadway Commission, which is a generally accepted framework at
international level.
3. In addition, he certifies that:
3.1 the half-yearly condensed consolidated financial statements at 30 June 2018:
a. have been prepared in compliance with the applicable international accounting standards endorsed by the
European Union pursuant to Regulation (EC) no. 1606/2002 of the European Parliament and of the Council
of 19 July 2002;
b. correspond to the information in the books and other accounting records;
c. give a true and fair view of the performance and financial position of the issuer and of the companies
included in the scope of consolidation.
3.2 The interim report on operations includes a reliable analysis of the important events which occurred during the
first half of the year and their impact on the half-yearly condensed consolidated financial statements, together
with a description of the main risks and uncertainties for the remaining six months of the year.
Rome, 6 August 2018
________________________
Chief Executive Officer
Manager in charge with preparing
the Company’s financial reports
Fabrizio Palermo
228 3. Half-yearly condensed consolidated financial statements at 30 June 2018

Cassa depositi e prestiti S.p.A.
Registered office
Via Goito 4 00185 Rome
Share capital euro 4,051,143,264.00 fully paid up Tax identification number and Rome Companies’ Register no. 80199230584 VAT no. 07756511007 Rome Chamber of Commerce REA no. 1053767
Tel.: +39 06 42211 www.cdp.it
Milan Office
Via San Marco 21 A 20123 Milan
Brussels Office
Rue Montoyer 51, B- 1000 Brussels

we promote the future