Embed Size (px)
Citation preview

Half year results 20181 August 2018
Capita plc

Financial results
Introduction
Executing our strategy
Questions
Nick Greatorex, CFO
Jon Lewis, CEO
Jon Lewis, CEO
Agenda
2 | Capita HY Results 2018

Financial results on track
• Half year results in line with expectations
• £921m order intake in H1
• FY2018 profit guidance unchanged (before adjustment for planned disposals)
Good progress executing our strategy
• New organisation structure in place
• Completed £701m rights issue
• Non-core disposals now expected to realise £416m in proceeds in FY18
• £30m cost out delivered, on track for £70m in FY18
2020 targets unchanged
Introduction: overview of HY18
3 | Capita HY Results 2018
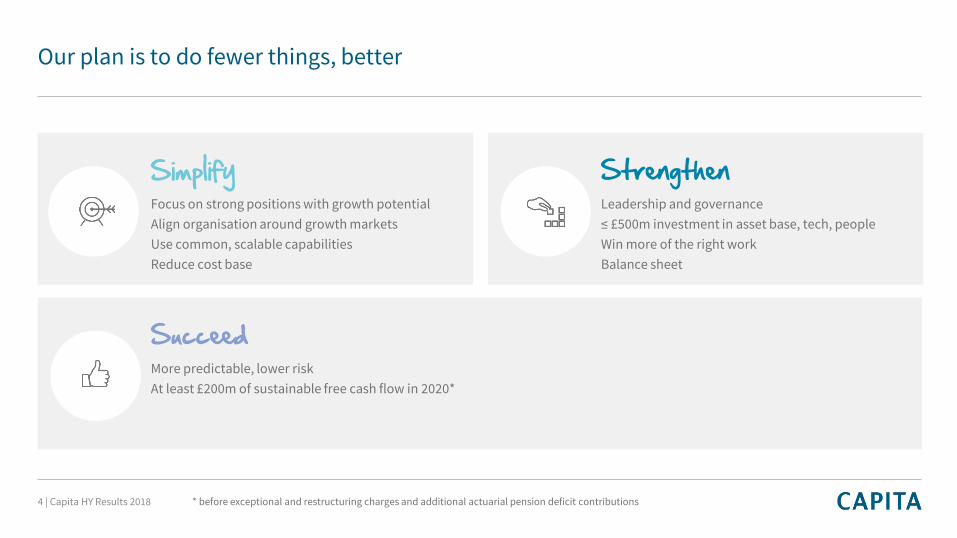
SimplifyFocus on strong positions with growth potentialAlign organisation around growth marketsUse common, scalable capabilitiesReduce cost base
* before exceptional and restructuring charges and additional actuarial pension deficit contributions
Our plan is to do fewer things, better
StrengthenLeadership and governance≤ £500m investment in asset base, tech, peopleWin more of the right workBalance sheet
SucceedMore predictable, lower riskAt least £200m of sustainable free cash flow in 2020*
4 | Capita HY Results 2018

SimplifyNew organisation structure in place5 non-core disposals, £416m proceeds in 2018On track to realise £70m cost out in 2018
StrengthenRights issue completedInvestment and Contract Review CommitteesMicrosoft partnership agreed
SucceedMore predictable, lower riskAt least £200m of sustainable free cash flow in 2020*
Our plan is to do fewer things, better
5 | Capita HY Results 2018 * before exceptional and restructuring charges and additional actuarial pension deficit contributions

Financial results
Nick Greatorex6 | Capita HY Results 2018

Decisive action to support transformation
• Completion of £701m rights issue
• Leverage at end June 1.5x*, inside target range of 1-2x*
HY18 results in line with expectations
Underlying FY18 guidance unchanged
Financial summary
7 | Capita HY Results 2018 *Adjusted net debt to adjusted EBITDA
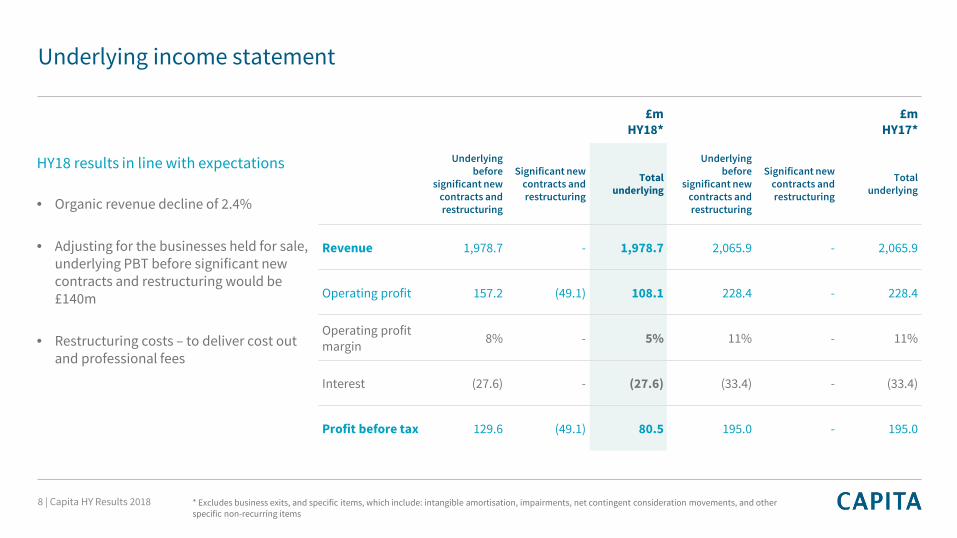
Underlying income statement
* Excludes business exits, and specific items, which include: intangible amortisation, impairments, net contingent consideration movements, and other specific non-recurring items
£mHY18*
£mHY17*
£m Underlyingbefore
significant newcontracts andrestructuring
Significant newcontracts andrestructuring
Totalunderlying
Underlyingbefore
significant newcontracts andrestructuring
Significant newcontracts andrestructuring
Totalunderlying
Revenue 1,978.7 - 1,978.7 2,065.9 - 2,065.9
Operating profit 157.2 (49.1) 108.1 228.4 - 228.4
Operating profit margin 8% - 5% 11% - 11%
Interest (27.6) - (27.6) (33.4) - (33.4)
Profit before tax 129.6 (49.1) 80.5 195.0 - 195.0
HY18 results in line with expectations
• Organic revenue decline of 2.4%
• Adjusting for the businesses held for sale, underlying PBT before significant new contracts and restructuring would be £140m
• Restructuring costs – to deliver cost out and professional fees
8 | Capita HY Results 2018

Underlying revenue HY17 to HY18
HY17 CMPSSoftware GS IT&N SS Other HY18
Revenue decline as expected
• Limited benefit from new contract wins
• Attrition** in Customer Management, IT & Networks and Government Services
• Organic sales to be weaker in H2, as expected
*Adjusted for 2018 business exits**Attrition defined as scope or volume reduction on existing contracts plus loss of contracts
LFLadjustment*
LFLHY17
HY17 DIO one-off
Local Gov weak
Marshone-off £10m
9 | Capita HY Results 2018

Underlying PBT HY17 to HY18
10 | Capita HY Results 2018
PBT in line with FY18 guidance
• People Solutions: lower margins in public sector resourcing and a decline in apprenticeships
• Customer Management, Government Services and IT & Networks: attrition** and one-offs dropped out
• Specialist Services: £9m one-off benefit from end of Marsh
• Group-wide: higher GDPR costs and investment in organisationcapability
LFL HY17
HY17 CMPSSoftware GS IT&N SS InterestUnderlying profit after significant contracts
and restructuring
Underlying profit before
significant contracts
and restructuring
Significant contracts and restructuring
LFL adjustment*
HY17 DIO one-off £16m
Marsh one-off £9mTrading £5m
*Adjusted for 2018 business exits**Attrition defined as scope or volume reduction on existing contracts plus loss of contracts
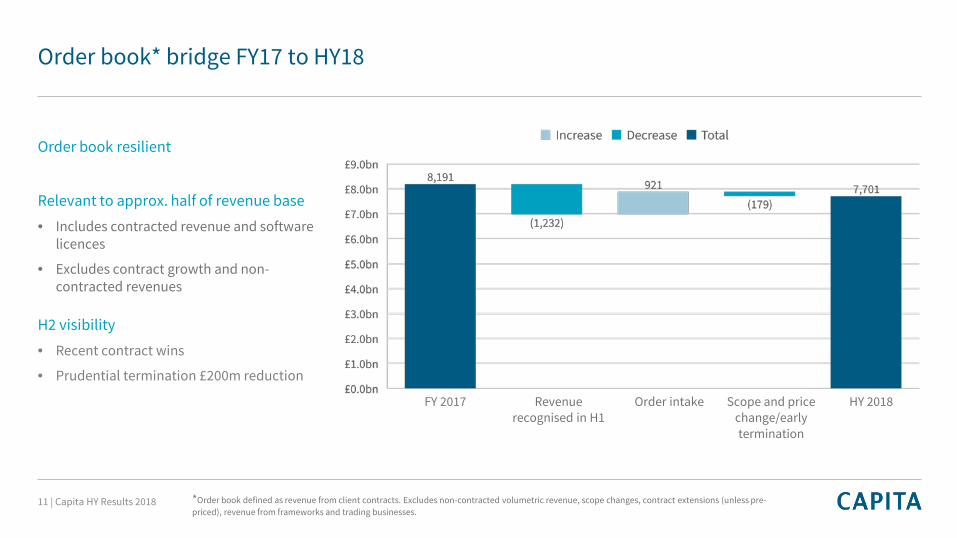
Order book* bridge FY17 to HY18
FY 2017 Revenue recognised in H1
Scope and price change/early termination
Order intake HY 2018
Order book resilient
Relevant to approx. half of revenue base
• Includes contracted revenue and software licences
• Excludes contract growth and non-contracted revenues
H2 visibility
• Recent contract wins
• Prudential termination £200m reduction
*Order book defined as revenue from client contracts. Excludes non-contracted volumetric revenue, scope changes, contract extensions (unless pre-priced), revenue from frameworks and trading businesses.
11 | Capita HY Results 2018

£m HY18 HY17
EBITDA before significant new contracts and restructuring 199 272
Working capital (257) (6)
Underlying interest (17) (29)
Underlying tax 15 16
Underlying capex (56) (50)
Other 1 (8)
Underlying free cash flow before restructuring (115) 195
Known commitments (158) -
Other (16) (2)
Cash movement in net debt pre rights issue (285) 193
Net proceeds of right issue 671 -
Cash movement in net debt 386 193
Non-cash movement 1 (10)
Decrease in net debt 387 183
Working capital outflow £257m
• Period end cash flow management activity unwind £130m
• Deferred income unwind £75m
• Other working capital movement £52m
Receivables financing
• £94m drawn as at HY18 compared to £110m as at FY17
Capex £56m
• Increased investment in infrastructure and systems
Known commitments £158m
• Final Connaught settlement £61m (FY18 guidance £66m)
• Separation of Capita Asset Services £36m (FY18 guidance £51m)
• Restructuring cash costs £37m
Cash flow
12 | Capita HY Results 2018

Pension valuation completed
• IAS 19 deficit reduced to £289m at 30 June ‘18
• 31 March ‘17 actuarial deficit £185m
• Intention to reduce actuarial pension deficit over
medium term
• Update on discussions with Scheme Trustees later this
year
Update on pension
13 | Capita HY Results 2018
$£m2
HY18 FY17 FY14
Actuarial deficit1 185 n/a 1
IAS 19 deficit2 289 407 149
1 The Capita Pension and Life Assurance Scheme (“CPLAS”)2 CPLAS plus 10 smaller schemes

Free cash - outflows £300m known commitments
£130m from final normalisation of period end cash flow management
£130m on continued reduction in deferred income
Net finance costs c£55m underlying
Leverage Toward bottom end of 1–2x* range
Profit before tax Underlying PBT** £270m - £300m
Disposals announced since April, FY18 PBT contribution of £25m
Underlying PBT**, ex disposals, £250m - £275m
Tax rate Small underlying tax credit***
FY18 financial guidance
14 | Capita HY Results 2018 *Adjusted net debt to adjusted EBITDA **Before significant new contracts and restructuring costs***Includes one-off deferred tax credit. Underlying tax rate expected to be 18-19% on an ongoing basis.

Executing our strategy
Jon Lewis15 | Capita HY Results 2018

Succeed: transformation led by things that we control
Driver Contributor to value creation by 2020 In our control
Cost competitiveness
Complete contract turnarounds
Reduced finance costs
Market trends
New investments
High
High
Medium
Medium
Low
Huge value from doing the basics better
16 | Capita HY Results 2018

Programme execution on track
£30m cost out delivered in H1
• Consolidating IT support, offshoring and headcount
Actions to deliver 2018 target all identified
Simplify: delivering our cost competitiveness programme
$32
2018 2019 2020
Cost to achieve in year £40m £70m £40m
Accumulated savings £70m £140m >£175m
SG&A
Systems & processes
Procurement
Split of £175m cost out by 2020
17 | Capita HY Results 2018

• Now meeting 40 out of 41 key service levels on PCSE; 4 other KPIs to be agreed
• Targeting break even by end 2020 following further transformation- Paper to electronic self-service- Consolidate existing IT systems for 3 services
• Contract still challenging and collectively not meeting recruitment targets
• New recruiting system – early benefits in speed of processing and conversion
• Regular soldier applications at 5 year seasonal peak (April-July)
• Partnership re-set with direct CEO involvement and joint commitment with Army to drive improvement from here
• Failed to deliver original transformation to timetable
• Digital transformation re-planned and 1st significant milestone of new contact centre platform delivered to part of the operation
• Operations performing but still challenges to meet increasing targets
• Targeting break even by end of 2020
Strengthen: improving poorly performing contracts
RPP Army Recruiting
mobilcom-debitel
NHS PCSE
18 | Capita HY Results 2018

Rights issue completed in May, raising £701m*
Non-core disposals ahead of plan - £416m* proceeds in 2018
• Supplier Assessment Services sold for £160m, agreement to sell ParkingEye for £235m
• 3 other small disposals totalling ~£21m
Accelerated PPN repayments
• H1: £157m from rights issue proceeds, £150m maturing in September, repaid early
• H2: £200m from disposal proceeds
Outlook
• Including disposal proceeds, expect to be at lower end of 1-2x leverage target by year end
• Review diversity of debt funding over next 2 years
* Gross proceeds
Strengthen: significant progress de-leveraging the balance sheet
19 | Capita HY Results 2018

• Attract, develop and retain talent• New operating model
Organisation capability
Services & Products
IT systems & infrastructure
• Technologies common across businesses; egdata analytics and robotic process automation
• Upgrade existing platforms/products to retain competitiveness; eg SaaS enablement
• Ensure meet commitments in existing contracts; eg data centre upgrades
• Functional IT systems to support business better; eg SAP, single CRM
Investment Initiatives
Strengthen: we are investing up to £500m over the next 3 years
20 | Capita HY Results 2018
Benefits
• Competitive, scalable, repeatable platforms to deliver strategy
• Better decision making and more predictable business
• Necessary to repair under investment
• More cost effective, more flexible, more secure, more reliable foundations
• Better decision making and more predictable business

Valuing our people
• First ever people strategy – rewards, performance, development, resourcing, systems and engagement
• Senior reward linked to employee NPS* improvement
Strengthened leadership and governance
• New hires since April: Appointed Chief General Counsel, making good progress on search for Chief Growth Officer and Chief Digital Officer
Creating a new operating model
• Devise and launch a more disciplined and efficient way of working
Making a positive contribution
• Recognition that more needs to be done to address diversity and to reduce the gender pay gap
• Agreed to appoint up to two employees to the Board
• Commitment to strengthening relationship with suppliers, including payment terms for SMEs
Strengthen: investing in our organisation capability
21 | Capita HY Results 2018 * NPS: Net Promoter Score, a measure of employee advocacy and satisfaction

Investing in our core products/services
• SIMS ‘light’ for emerging markets
• Orbit and Knowledgepool platform
• Digital contact centre platform
Improving our digital transformation capabilities
• Five year Microsoft partnership, improved access to Azure to support our roll-out of cloud services, joint marketing
• Planned digital partnerships with Digital McKinsey and Quantum Black to accelerate our analytics and digital transformation services
Strengthen: services and products
22 | Capita HY Results 2018

Chosen markets have long term secular growth
• Plan to address our underperformance
Delivering top line growth will take time
• Move from reactive to proactive sales origination and consultative selling
• Create more competitive, repeatable, offerings
Initial progress
• Chief Growth Officer appointment progressing well
• C-suite engagement with clients and divisional sales leads
• CRM database to improve account management and lead generation
• Investment in training, performance management and target KPIs re-set
• Contract Review Committee ensuring right risk/reward balance
Targeting returning to organic growth in 2020
* For Customer Management, People Solutions and Government - growth CAGR to 2021 due to data availability Sources: Gartner, TechMarketView, Nelson Hall
+8% £15bn
Growth 3yr CAGR*
Current market size
+5% £5bn
+4% £7bn
+4% £7bn
Software
People Solutions
Customer management
Government
Strengthen: focus on winning the work we can execute well
23 | Capita HY Results 2018

£921m added to order book in H1
• Includes £153m Software licenses, and Customer Management and Government Services wins and renewals
• Reflects half of revenue base, and can cover any contract size
H2 wins to date
• Includes some decisions delayed from H1
• New signings – Standards and Testing Agency, Southern Water, British Airways
£921mOrder intake
£7.7bnOrder book
Strengthen: current sales performance reflects historic challenges
24 | Capita HY Results 2018

Succeed: our plans for each division
Roll out best practice consistently Invest in analytics, infrastructure & tools / expand into new sectors
People SolutionsLeverage integrated business structure
Invest in products, platforms, partnerships and analytics
Software Develop a shared backbone across our products
Invest in adjacent product offerings, pilot US market
Government Services
Focus our portfolio on proven, scalable offerings
Build out partnerships and innovation (inc BPaaS)
Customer Management
IT and Networks Leverage single platform, and focus on customer
Upgrade data centres, investment into cloud, SD Wan
Specialist Services
18 operating units - mostly stand-alone operations Delivering plan to maximise value Managed on a portfolio basis for each
Simplify Strengthen
Extend UK market leadership, turnaround DACH* margin
Outperform market and improve cash generation
Drive profitable growth and expand internationally
Deliver contracts and reliable cash flow
Fix the basics and support Capita’s technology ambitions
Succeed
* DACH is Germany and Switzerland 25 | Capita HY Results 2018

Software
• Specialist enterprise software, in specific vertical markets
• Leader in education, emergency services, local government & utilities
What we do
Recent successes
International 5%
UK 95%
* Source: Gartner** Based on H1 continuing underlying activities before significant new contracts and restructuring
• Education: SIMS win at world’s largest school, City Montessori School, Lucknow, India
• Emergency services: West Midlands Police and MoJ digital radio networks
Execution• Shared services: consolidated multiple service desks
• Investing in core products: roll out of SIMS product suite
• Internationalise: roll out of selected products in US market
UK market position*
#1 in education software
#1 in utilities software
#1 ‘blue-light’ software
£200m revenue
£48.8m** profit
24.4%margin
£555m order book
Revenue split
Key HY18 data
Market dynamics• UK £15bn high growth market*, driven by SaaS
26 | Capita HY Results 2018
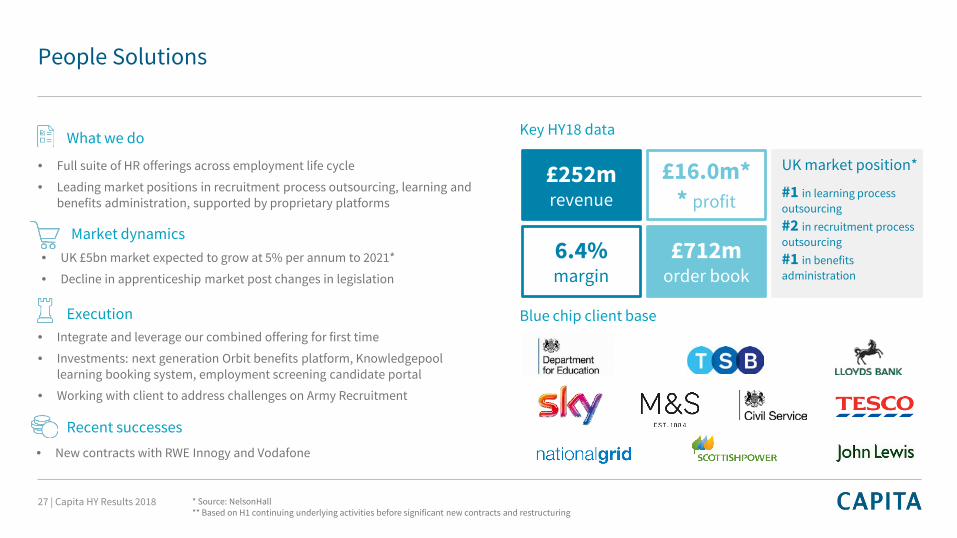
• Full suite of HR offerings across employment life cycle
• Leading market positions in recruitment process outsourcing, learning and benefits administration, supported by proprietary platforms
• New contracts with RWE Innogy and Vodafone
• Integrate and leverage our combined offering for first time
• Investments: next generation Orbit benefits platform, Knowledgepool learning booking system, employment screening candidate portal
• Working with client to address challenges on Army Recruitment
What we do
Recent successes
Execution
Key HY18 data
* Source: NelsonHall** Based on H1 continuing underlying activities before significant new contracts and restructuring
Blue chip client base
Market dynamics• UK £5bn market expected to grow at 5% per annum to 2021*
• Decline in apprenticeship market post changes in legislation
UK market position*
#1 in learning process outsourcing#2 in recruitment process outsourcing#1 in benefits administration
£252m revenue
£16.0m** profit
6.4%margin
£712m order book
27 | Capita HY Results 2018
People Solutions

• Leading provider of multi-channel customer contact services in the UK, Switzerland and Germany
• Primarily serving clients in telecommunications/media, retail and utilities, from a mix of locations in Europe, India and South Africa
• New win with British Airways, expanded contracts with FSCS, Marks & Spencer, npower and Southern Water
• Best practice: standardise processes, enhanced training for c8,000 FTE
• Investment: commenced refresh of our IT and telephony infrastructure
• Move into new sectors: wins in travel and financial services
• Turnaround and deliver mobilcom-debitel transformation
What we do
Recent successes
Execution
Key data
* Source: NelsonHall** Based on H1 continuing underlying activities before significant new contracts and restructuring
New and extended contracts
Market dynamics
• UK and Germany/Switzerland forecast growth 4-5% per annum to 2021*
• UK retail sector challenging and experiencing attrition
Market position*
#1 in UK customer management#1 in Switzerland
#2 Germany
£400m revenue
£15.7m** profit
3.9%margin
£2,040m order book
28 | Capita HY Results 2018
Customer Management

• Government’s trusted partner for transformation and delivery tech-enabled business services
• Processing, administration & IT services to local gov, education & health
• TfL ULEZ expansion and Standards and Testing Agency (DfE)
• Winning tenderer for the Defence Fire and Rescue Project***
• Operational excellence programme commenced
• Addressing performance of challenging contracts: improvements at PCSE
• Focus on proven, repeatable offerings and leveraging existing capabilities
What we do
Recent successes
Execution
* Source: NelsonHall, Capita estimates** Based on H1 continuing underlying activities before significant new contracts and restructuring*** Contract award on hold due to legal challenge
Major clients
Market• Central £3.5bn new opportunities to 2020; some delays in HY18
• PAC report welcome - move to quality and partnership with less risk transfer
• Local government BPO partnerships – large deals going back in-house and shift to transactional services
Key data
UK market position*
Leading government BPO providerCentral - 11% market shareLocal – 15% market share
£387m revenue
£12.6m** profit
3.3%margin
£2,297m order book
29 | Capita HY Results 2018
Government Services

IT and Networks
• End-to-end enterprise IT services
• Managed network solutions, datacenter and cloud infrastructure, managed IT support, testing, cyber & consulting
• Provides support across all our large contracts,
IT Services 57%Networking Solutions
43%
• Integrate and invest to support Capita’s technology ambitions
• ‘One ITS’ programme: consolidating separately run entities into a single, integrated UK IT Services business
• Introducing shared service centres, with common processes
• Investing in infrastructure for resilience, security and client experience
What we do
Execution
* Source: Gartner** Based on H1 continuing underlying activities before significant new contracts and restructuring
Revenue split
Market• UK IT market growth forecast growth 1% per annum to 2020*
Recent successes• New Network contracts with Ministry of Defence, Metropolitan Police and Kent
County Council
Key HY18 data
UK market position
Top 10 ITO player*
Scope to grow share in
Networks
£198m revenue
£21.5m**profit
10.9%margin
£398m order book
30 | Capita HY Results 2018
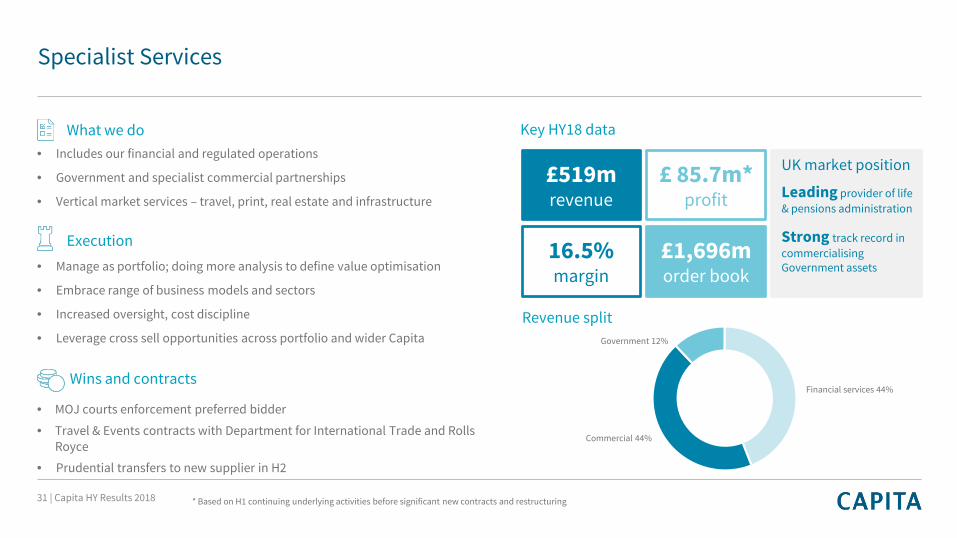
Specialist Services
• Includes our financial and regulated operations
• Government and specialist commercial partnerships
• Vertical market services – travel, print, real estate and infrastructure
Financial services 44%
Commercial 44%
Government 12%
• MOJ courts enforcement preferred bidder
• Travel & Events contracts with Department for International Trade and Rolls Royce
• Prudential transfers to new supplier in H2
• Manage as portfolio; doing more analysis to define value optimisation
• Embrace range of business models and sectors
• Increased oversight, cost discipline
• Leverage cross sell opportunities across portfolio and wider Capita
What we do
Wins and contracts
Execution
Revenue split
* Based on H1 continuing underlying activities before significant new contracts and restructuring
Key HY18 data
UK market position
Leading provider of life & pensions administration
Strong track record in commercialising Government assets
£519m revenue
£ 85.7m* profit
16.5%margin
£1,696m order book
31 | Capita HY Results 2018

Summary
32 | Capita HY Results 2018

Summary: on track to deliver significant financial transformation
* Adjusted net debt to adjusted EBITDA before adoption of IFRS 16 ** before exceptional and restructuring charges and additional pension contributions
Greater efficiency
Annualised initial cost out of >£175m by 2020
One-off cost of £150m to achieve
Greater investment Up to £500m over next three years
Stronger performance
Double digit EBIT margins within three years
Sustainable FCF
At least £200m of sustainable annual free cash flow in 2020**
Greater focus £300m disposal proceeds in 2018
Simplified organisation
Stronger balance sheet
Leverage target of 1-2x*
Review diversity of funding over next 2 years
Our target Progress to date
On track – £70m in 2018
Ahead - £416m in 2018
Continued focus on optimising portfolio
On track - first investments made in H1
On track – inside leverage range at H1
On track
On track
On track
33 | Capita HY Results 2018

Appendix
34 | Capita HY Results 2018

• Sales momentum will take time to rebuild
• Like for like revenue has declined by 2.3%, excluding business exits from both years
• Like for like organic revenue declined 2.4%
• Organic sales to be weaker in H2, as expected
Revenue
$3£2
HY18 HY17 Change
Total revenue 2,012.6 2,127.3 (5.3%)
Business exit (33.9) (61.4)
Underlying revenue 1,978.7 2,065.9 (4.2%)
Prior year revenue from 2018 business exits N/A (40.1)
Like for like revenue from continuing underlying activities 1,978.7 2,025.8 (2.3%)
2017 acquisitions (2.6) -
Like for like organic revenue from continuing underlying activities 1,976.1 2,025.8 (2.4%)
35 | Capita HY Results 2018

Business Exit PBT comprises:
• £13m profit on disposals completed in HY18 - Capita Specialist Insurance Services, Projen and Medicals Direct Group
• £10m trading profit on businesses held for sale (Supplier Assessment Services, including Constructionline, ParkingEye)
Underlying PBT bridge to reported PBT*
*Excludes the sale of Capita Asset Services and underlying operating profit excludes non-underlying items which include: business exits, intangible amortisation, impairments, net changes in contingent consideration movements, and other specific non-recurring items
Total Underlying
profits
Business exit
Amortisation Other Reported PBT
36 | Capita HY Results 2018

• Revenue split – based on IFRS 15 definitions:
• 71% long term contractual
• 16% short term contractual
• 13% transactional
• Considerable variation by division
Overall underlying revenue split*
Transactional13%
Short term contractual
16%
Long term contractual
71%
Revenue split 2018
* Categories are consistent with those presented in previous years, with long term contractual representing "Contractual > 2 years" and Short term contractual representing "Contractual < 2 years". Years based from service commencement date37 | Capita HY Results 2018

£m
Revenue PBT Margin %
HY18 HY17 Variance HY18 HY17 Variance HY18 HY17
Software 200 203 (3) 49 55 (6) 24.4% 27.1%
People Solutions 252 256 (4) 16 29 (13) 6.4% 11.3%
Customer Management 400 414 (14) 16 35 (19) 3.9% 8.5%
Government Services 387 424 (37) 13 38 (25) 3.3% 8.9%
IT and Networks 198 218 (20) 22 33 (11) 10.9% 15.1%
Specialist Services* 519 547 (28) 86 83 3 16.5% 15.2%
Central 23 4 19 (72) (78) 6 - -
Total 1,979 2,066 (87) 130 195 (65) 6.6% 9.4%
Divisional performance – underlying excluding significant contracts and restructuring
38 | Capita HY Results 2018* After disposals and held for sale
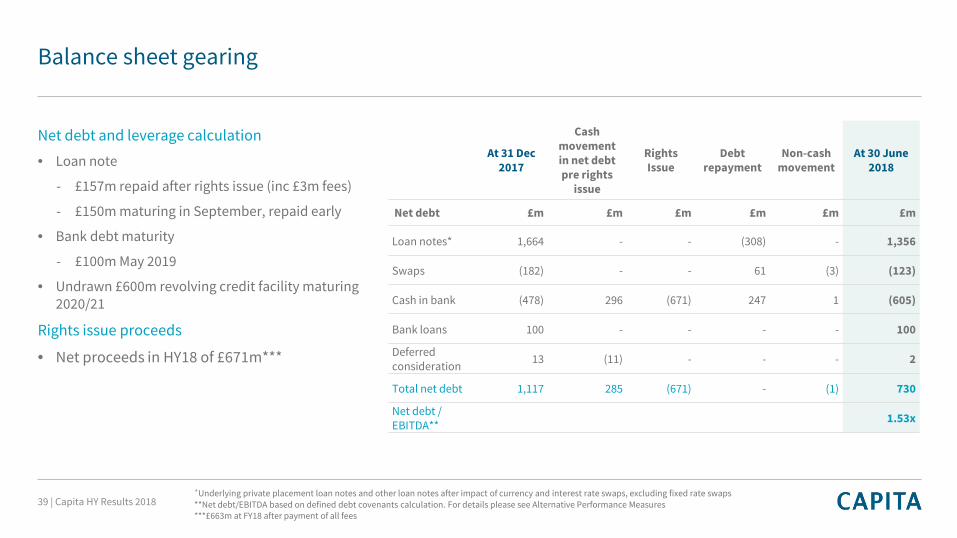
Net debt and leverage calculation
• Loan note
- £157m repaid after rights issue (inc £3m fees)
- £150m maturing in September, repaid early
• Bank debt maturity
- £100m May 2019
• Undrawn £600m revolving credit facility maturing 2020/21
Rights issue proceeds
• Net proceeds in HY18 of £671m***
Balance sheet gearing
At 31 Dec2017
Cash movement in net debt pre rights
issue
Rights Issue
Debt repayment
Non-cashmovement
At 30 June 2018
Net debt £m £m £m £m £m £m
Loan notes* 1,664 - - (308) - 1,356
Swaps (182) - - 61 (3) (123)
Cash in bank (478) 296 (671) 247 1 (605)
Bank loans 100 - - - - 100
Deferred consideration 13 (11) - - - 2
Total net debt 1,117 285 (671) - (1) 730
Net debt / EBITDA** 1.53x
*Underlying private placement loan notes and other loan notes after impact of currency and interest rate swaps, excluding fixed rate swaps **Net debt/EBITDA based on defined debt covenants calculation. For details please see Alternative Performance Measures***£663m at FY18 after payment of all fees
39 | Capita HY Results 2018
This announcement is prepared for and addressed only to the Company's shareholders as a whole and to no other person. The Company, its Directors, employees, agents and advisers accept and assume no liability to any person in respect of this trading update save as would arise under English law. Statements contained in this trading update are based on the knowledge and information available to Capita’s Directors at the date it was prepared and therefore facts stated and views expressed may change after that date.
This document and any materials distributed in connection with it may include forward-looking statements, beliefs, opinions or statements concerning risks and uncertainties, including statements with respect to Capita’s business, financial condition and results of operations. Those statements and statements which contain the words "anticipate", "believe", "intend", "estimate", "expect" and words of similar meaning, reflect Capita’s Directors' beliefs and expectations and involve risk and uncertainty because they relate to events and depend on circumstances that will occur in the future and which may cause results and developments to differ materially from those expressed or implied by those statements and forecasts.
No representation is made that any of those statements or forecasts will come to pass or that any forecast results will be achieved. You are cautioned not to place any reliance on such statements or forecasts. Those forward-looking and other statements speak only as at the date of this trading update. Capita undertakes no obligation to release any update of, or revisions to, any forward-looking statements, opinions (which are subject to change without notice) or any other information or statement contained in this trading update. Furthermore, past performance cannot be relied on as a guide to future performance.
No statement in this document is intended as a profit forecast or a profit estimate and no statement in this document should be interpreted to mean that earnings per Capita share for the current or future financial years would necessarily match or exceed the historical published earnings per Capita share.
Nothing in this document is intended to constitute an invitation or inducement to engage in investment activity. This document does not constitute or form part of any offer for sale or subscription of, or any solicitation of any offer to purchase or subscribe for, any securities nor shall it or any part of it nor the fact of its distribution form the basis of, or be relied on in connection with, any contract, commitment or investment decision in relation thereto. This document does not constitute a recommendation regarding any securities.
Disclaimer
40 | Capita HY Results 2018