Embed Size (px)
Citation preview

Half-year results 2014
Gerard Ryan Chief Executive Officer
Adrian Gardner Chief Financial Officer
David Broadbent
Chief Commercial Officer
30.07.14

Strong growth and
returns to shareholders
2
Gerard Ryan Chief Executive Officer
3
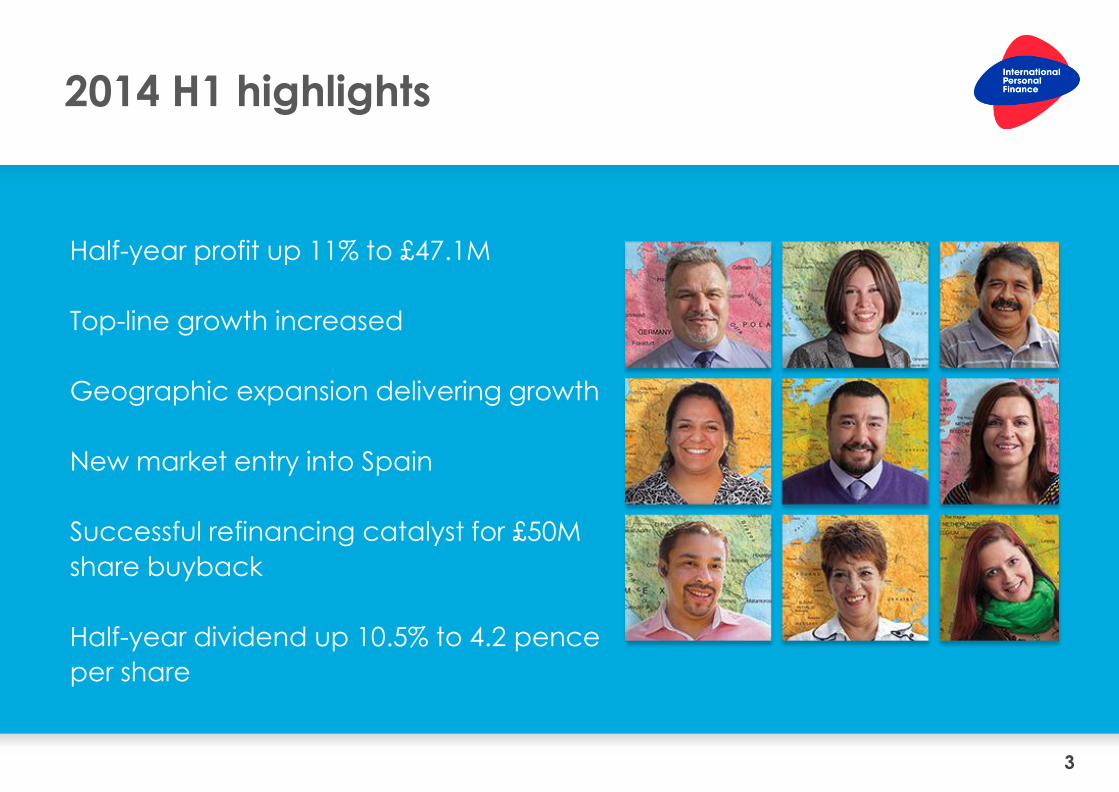
2014 H1 highlights
Half-year profit up 11% to £47.1M
Top-line growth increased
Geographic expansion delivering growth
New market entry into Spain
Successful refinancing catalyst for £50M
share buyback
Half-year dividend up 10.5% to 4.2 pence
per share
4
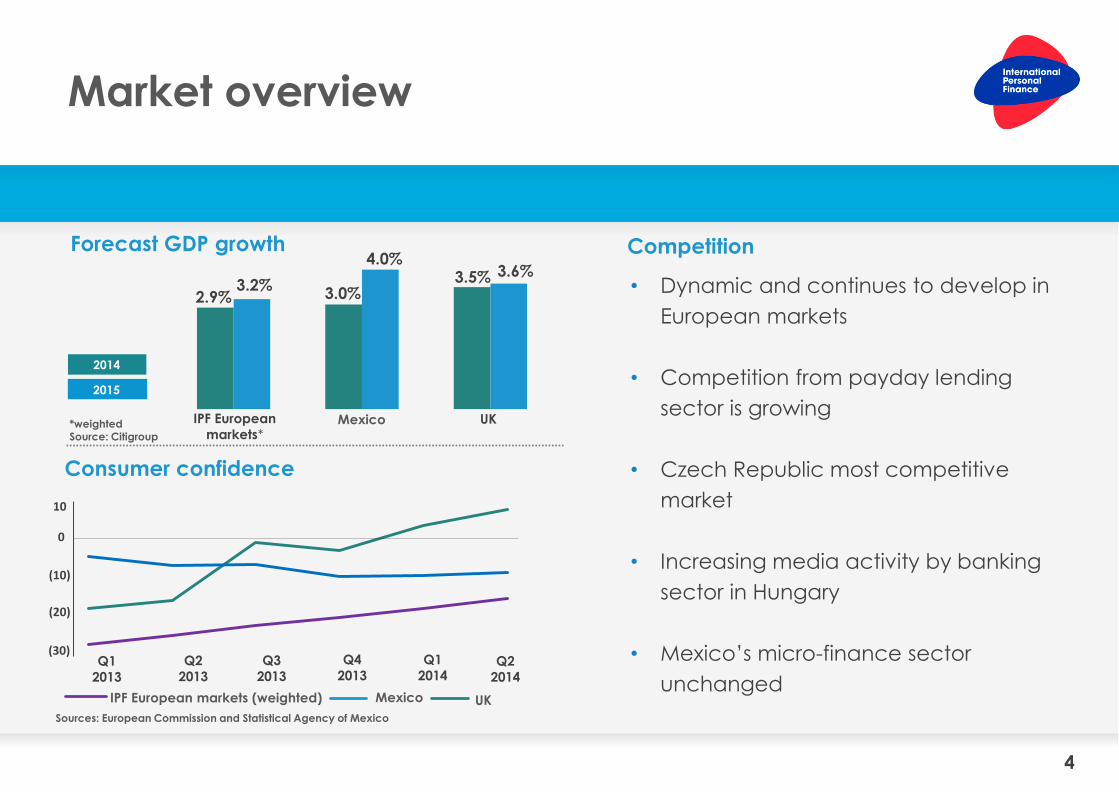
Market overview
• Dynamic and continues to develop in
European markets
• Competition from payday lending
sector is growing
• Czech Republic most competitive
market
• Increasing media activity by banking
sector in Hungary
• Mexico’s micro-finance sector
unchanged
Competition
Consumer confidence
Forecast GDP growth
Mexico
2014
2015
*weighted Source: Citigroup
IPF European markets (weighted) Mexico UK
Sources: European Commission and Statistical Agency of Mexico
IPF European
markets* UK
Q2
2014
Q1
2014 Q3
2013 Q2
2013 Q1
2013
Q4
2013
3.6% 3.5% 4.0%
3.0% 3.2%
2.9%
10
0
(30)
(20)
(10)
5
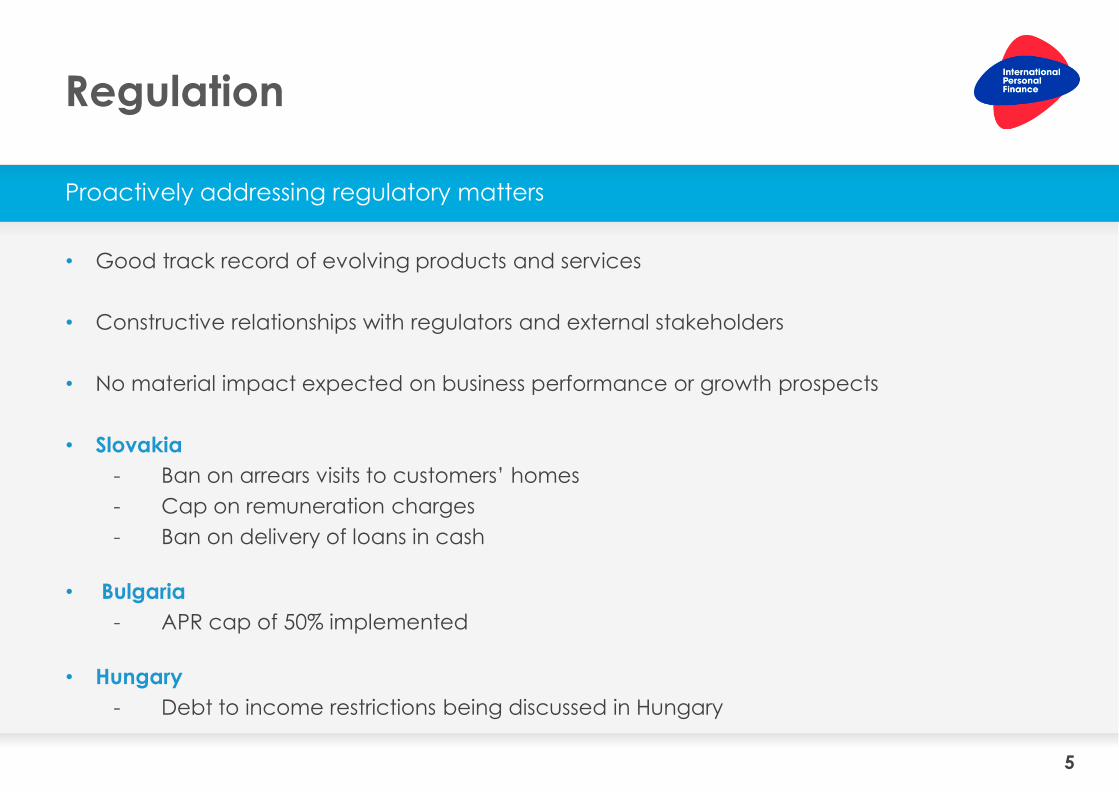
Regulation
Proactively addressing regulatory matters
• Good track record of evolving products and services
• Constructive relationships with regulators and external stakeholders
• No material impact expected on business performance or growth prospects
• Slovakia
- Ban on arrears visits to customers’ homes
- Cap on remuneration charges
- Ban on delivery of loans in cash
• Bulgaria
- APR cap of 50% implemented
• Hungary
- Debt to income restrictions being discussed in Hungary
6
Regulation
Proactively addressing regulatory matters
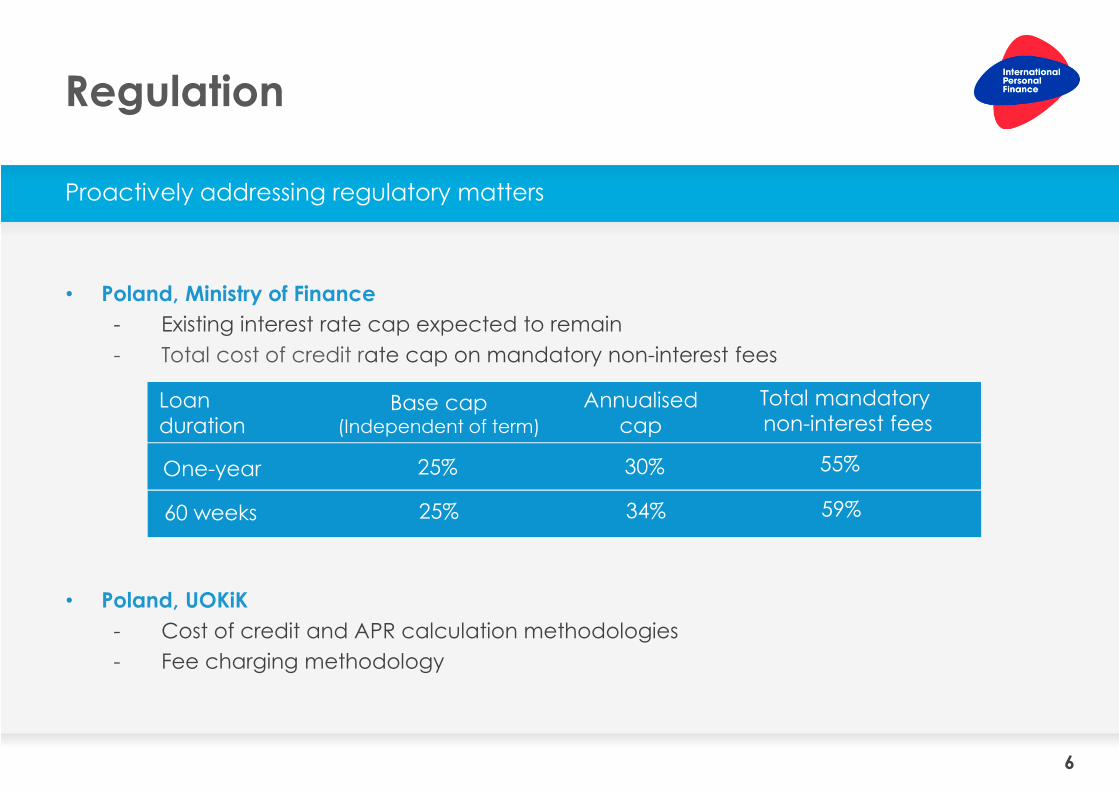
• Poland, Ministry of Finance
- Existing interest rate cap expected to remain
- Total cost of credit rate cap on mandatory non-interest fees
• Poland, UOKiK
- Cost of credit and APR calculation methodologies
- Fee charging methodology
25% One-year 30%
Base cap (Independent of term)
Annualised
cap Loan
duration
55%
Total mandatory
non-interest fees
25% 60 weeks 34% 59%
Performance and financial review
7
Adrian Gardner Chief Financial Officer
8
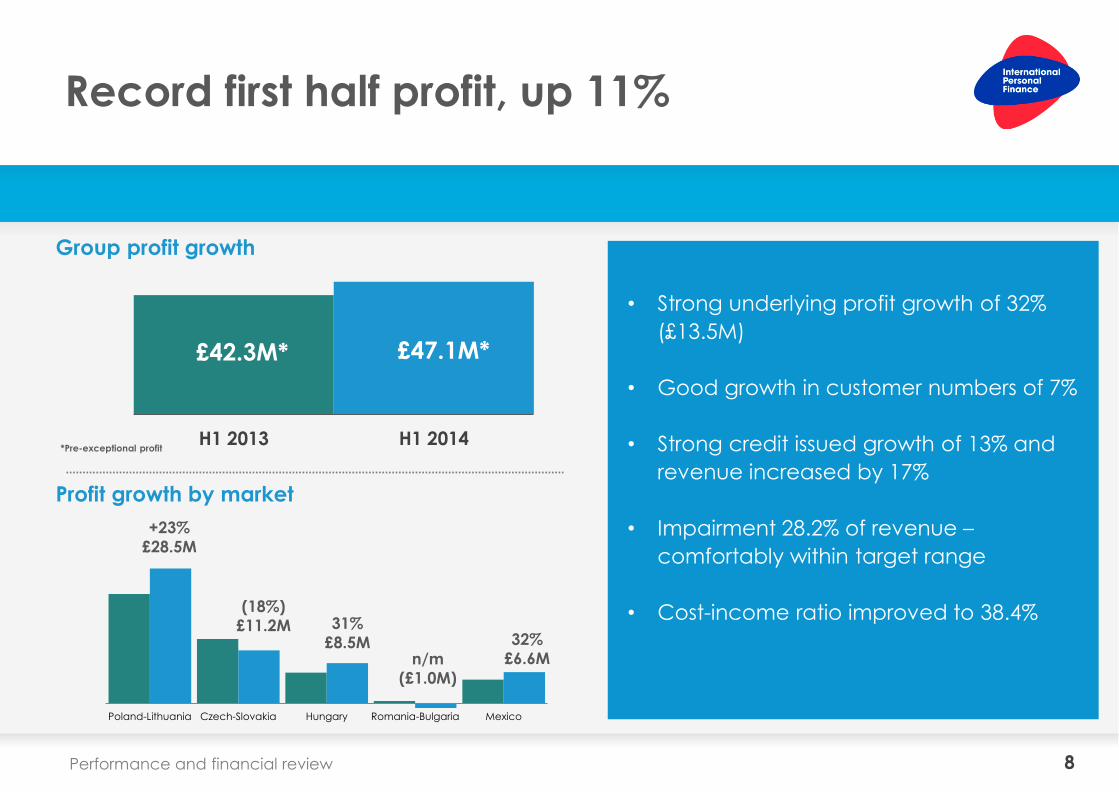
Record first half profit, up 11%
Performance and financial review
• Strong underlying profit growth of 32%
(£13.5M)
• Good growth in customer numbers of 7%
• Strong credit issued growth of 13% and
revenue increased by 17%
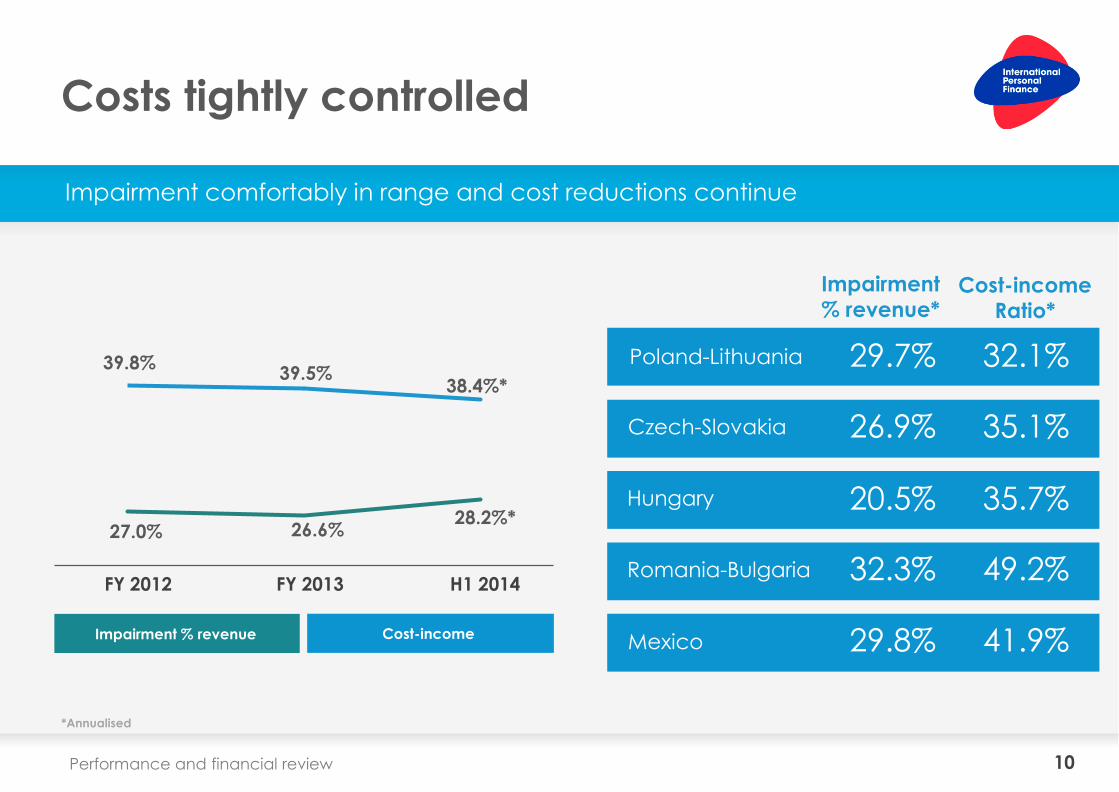
• Impairment 28.2% of revenue –
comfortably within target range
• Cost-income ratio improved to 38.4%
Group profit growth
*Pre-exceptional profit
Profit growth by market
H1 2013 H1 2014
£42.3M* £47.1M*
Poland-Lithuania Czech-Slovakia Hungary Romania-Bulgaria Mexico
+23%
£28.5M
(18%)
£11.2M 31%
£8.5M n/m
(£1.0M)
32%
£6.6M
9
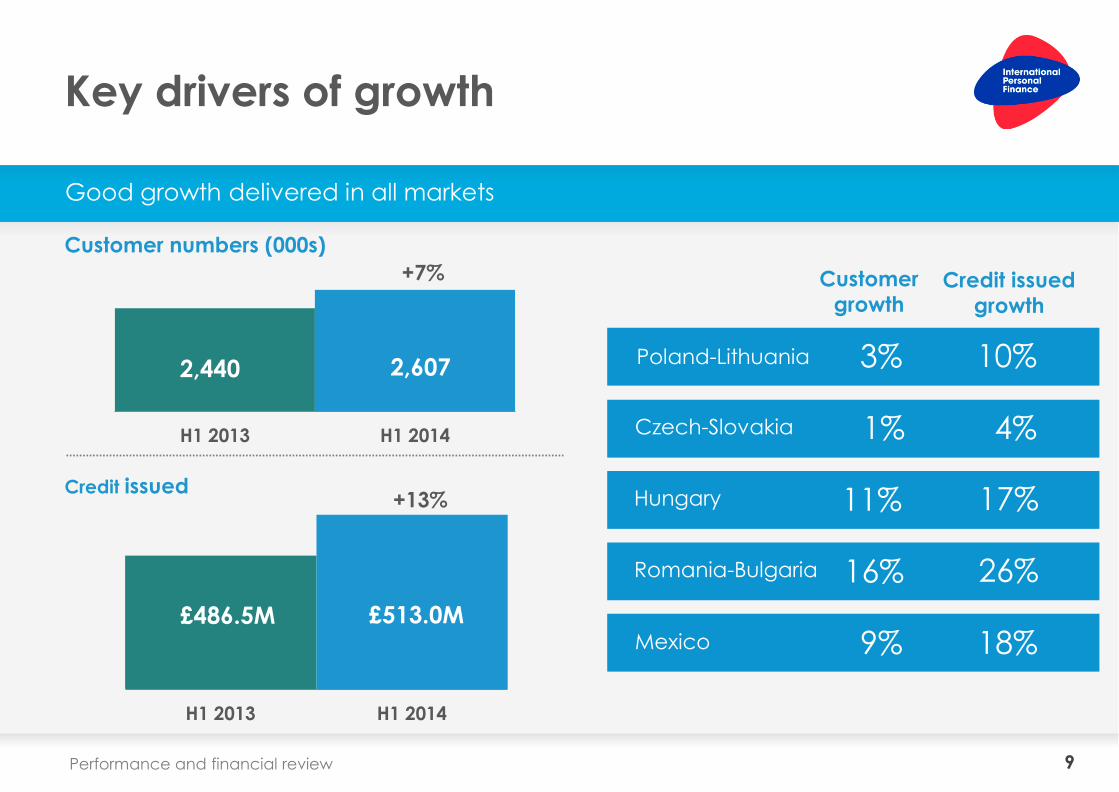
Key drivers of growth
Good growth delivered in all markets
Customer numbers (000s)
Customer
growth
3% Poland-Lithuania
Hungary
16% Romania-Bulgaria
9% Mexico
1% Czech-Slovakia
11%
Credit issued
growth
10%
26%
18%
4%
17% Credit issued
Performance and financial review
H1 2013 H1 2014
H1 2013 H1 2014
2,607 2,440
£513.0M £486.5M
+7%
+13%
10 Performance and financial review
Costs tightly controlled
Impairment comfortably in range and cost reductions continue
Impairment
% revenue* Cost-income
Ratio*
29.7% Poland-Lithuania
Hungary
Romania-Bulgaria
Mexico
Czech-Slovakia 26.9%
20.5%
32.3%
29.8%
32.1%
35.1%
35.7%
49.2%
41.9%
FY 2012 FY 2013
Impairment % revenue Cost-income
H1 2014
26.6% 28.2%*
27.0%
39.8% 39.5%
38.4%*
*Annualised
11
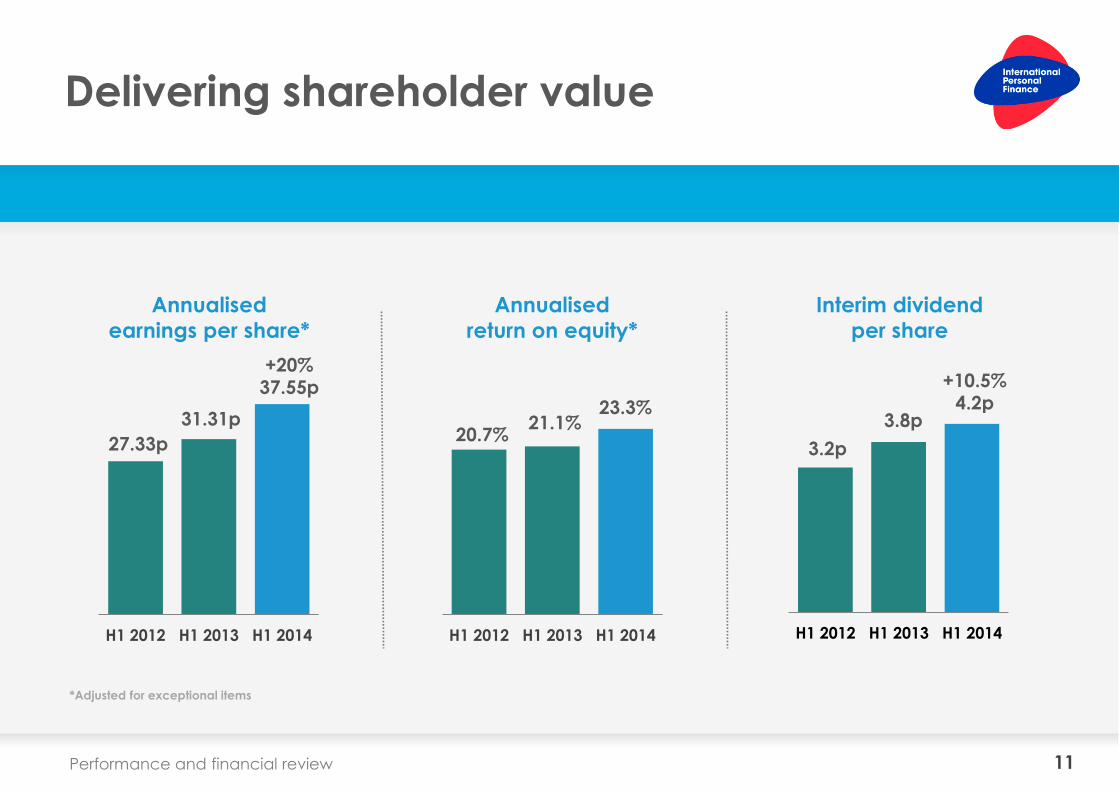
Delivering shareholder value
Annualised
earnings per share*
Annualised
return on equity*
Interim dividend
per share
*Adjusted for exceptional items
Performance and financial review
H1 2012 H1 2013 H1 2014 H1 2012 H1 2013 H1 2014 H1 2012 H1 2013 H1 2014
+20% 37.55p +10.5%
4.2p 23.3% 21.1%
20.7% 27.33p
31.31p
3.2p
3.8p
12
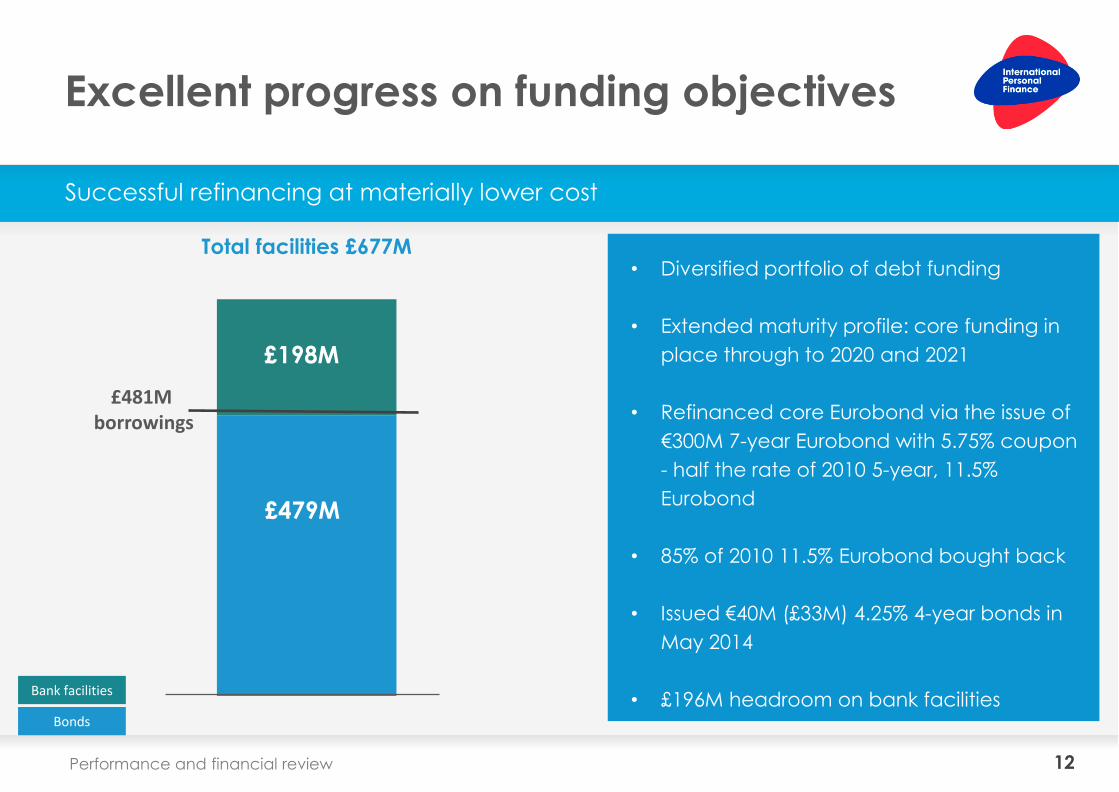
Excellent progress on funding objectives
Successful refinancing at materially lower cost
• Diversified portfolio of debt funding
• Extended maturity profile: core funding in
place through to 2020 and 2021
• Refinanced core Eurobond via the issue of
€300M 7-year Eurobond with 5.75% coupon
- half the rate of 2010 5-year, 11.5%
Eurobond
• 85% of 2010 11.5% Eurobond bought back
• Issued €40M (£33M) 4.25% 4-year bonds in
May 2014
• £196M headroom on bank facilities
Performance and financial review
Total facilities £677M
£481M borrowings
£479M
£198M
Bank facilities
Bonds
13
Committed to work balance sheet harder
Performance and financial review
• Capital ratio reviewed following core Eurobond refinancing
• Materially lower debt cost, stable macroeconomic backdrop
• Target equity to receivables ratio reduced to c.45%
• £50M share buyback underway
• Equity to receivables ratio 48.7% at 30 June 2014

14
David Broadbent Chief Commercial Officer
Growth development

15 Strategy update
Our strategy for growth
Expanding our footprint Improving customer engagement
Developing a sales culture
Effective execution
We will invest in technology to execute our strategy more efficiently
We will provide new products and more digital channels
We will use marketing skills to gain a better understanding of our customers
We intend to grow in our existing markets and new countries, organically or through bolt-on acquisitions
16
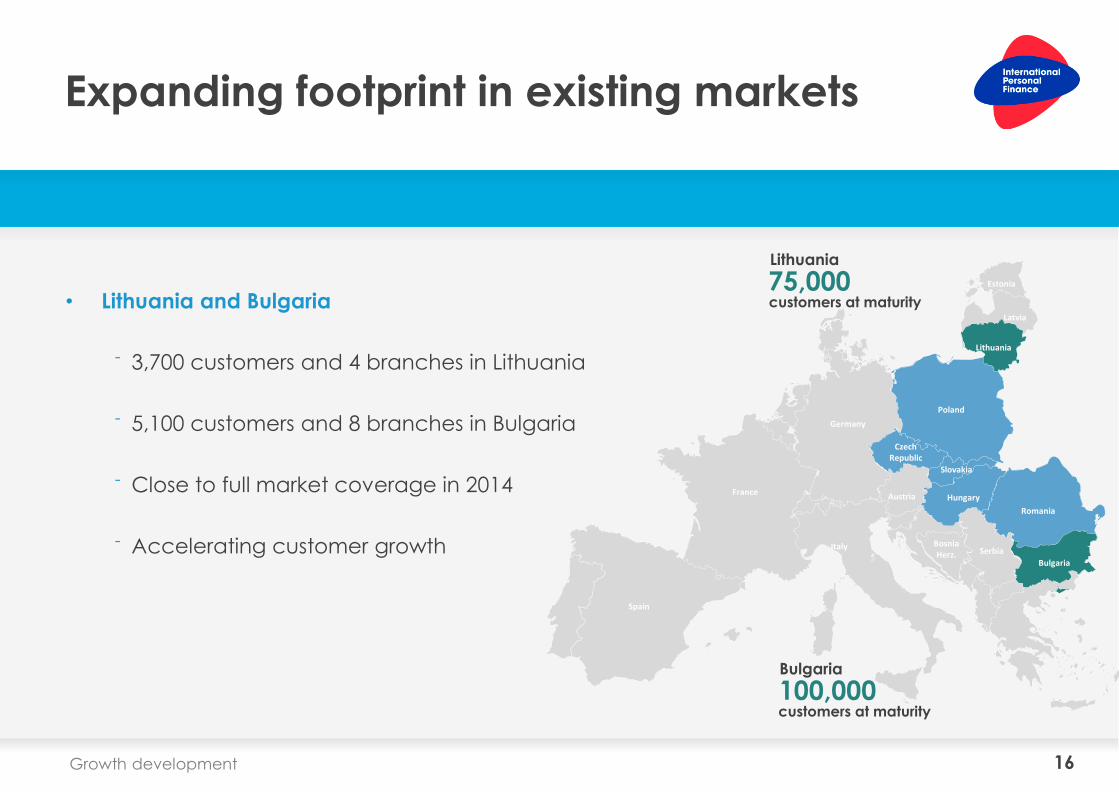
Expanding footprint in existing markets
• Lithuania and Bulgaria
ˉ 3,700 customers and 4 branches in Lithuania
ˉ 5,100 customers and 8 branches in Bulgaria
ˉ Close to full market coverage in 2014
ˉ Accelerating customer growth
Growth development
Germany
France
Spain
Italy
Austria
Serbia Bosnia Herz.
Poland
Czech Republic
Hungary
Romania
Bulgaria
Lithuania
Estonia
Latvia
Slovakia
Bulgaria
100,000 customers at maturity
Lithuania
75,000 customers at maturity
17
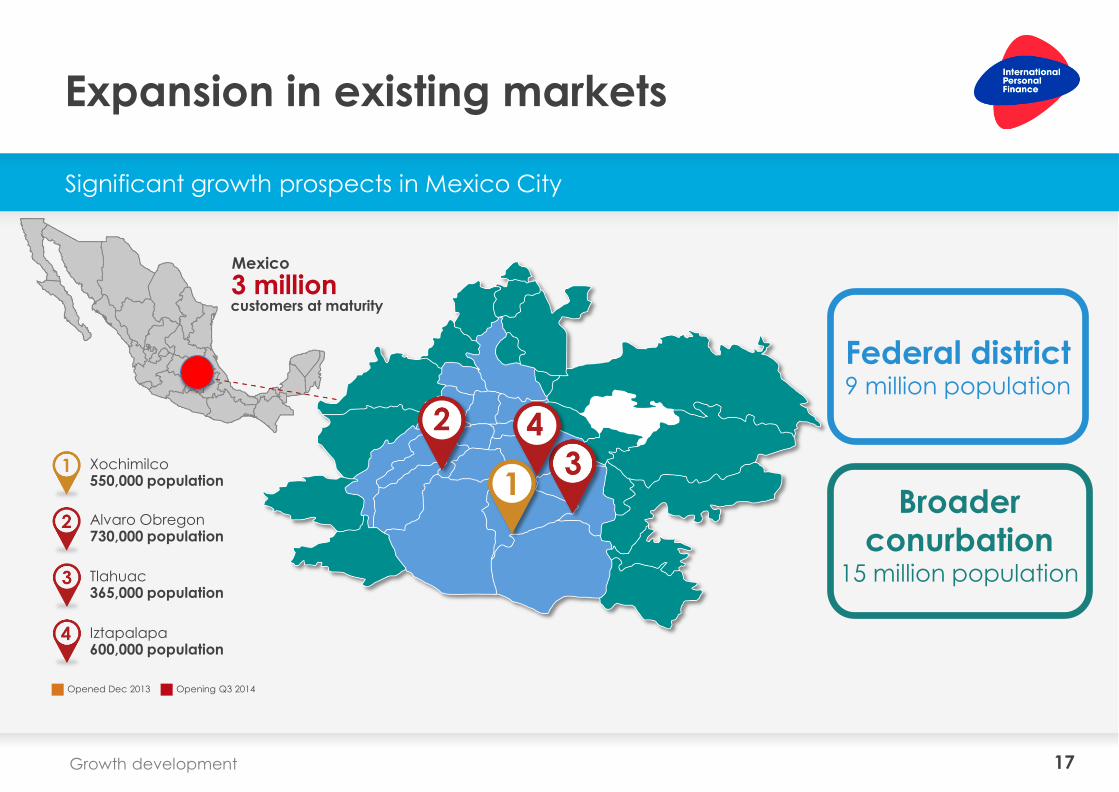
Expansion in existing markets
Growth development
Significant growth prospects in Mexico City
Mexico
3 million customers at maturity
Broader
conurbation 15 million population
Xochimilco 550,000 population
Alvaro Obregon 730,000 population
Tlahuac 365,000 population
Iztapalapa 600,000 population
Opened Dec 2013 Opening Q3 2014
Federal district 9 million population
18
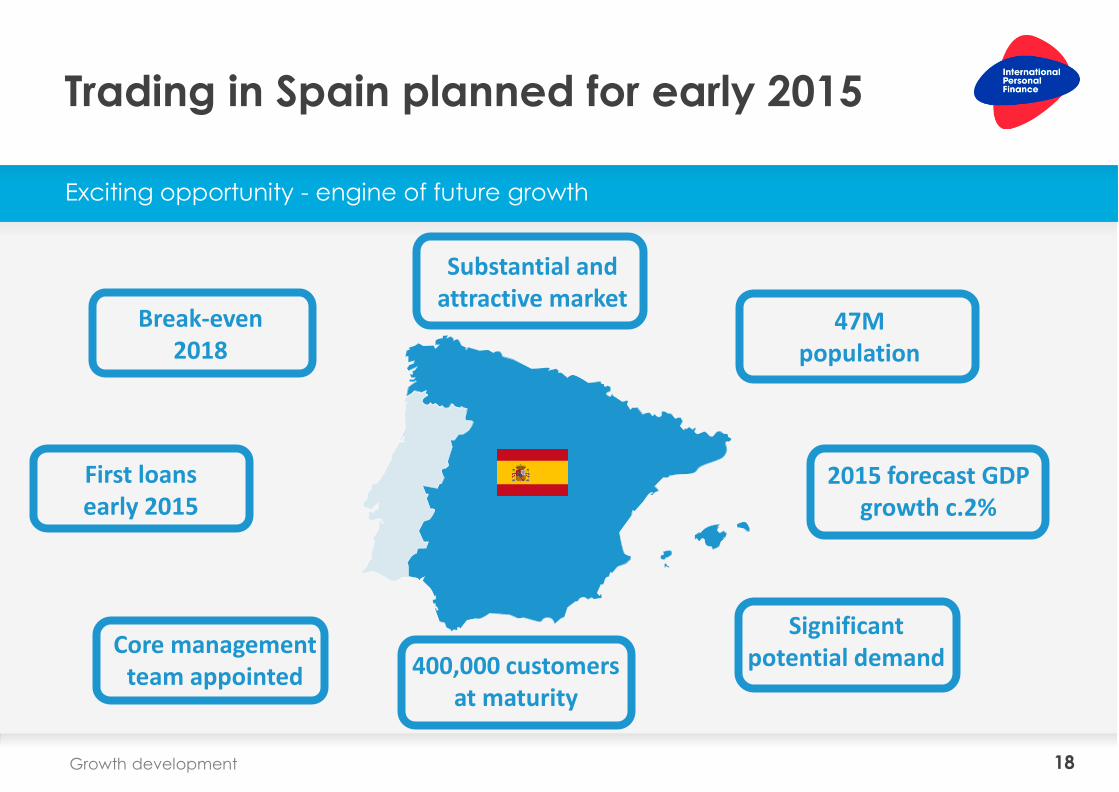
Trading in Spain planned for early 2015
Growth development
Exciting opportunity - engine of future growth
Substantial and attractive market
400,000 customers at maturity
Break-even 2018
First loans early 2015
Significant potential demand
47M population
2015 forecast GDP growth c.2%
Core management team appointed
19
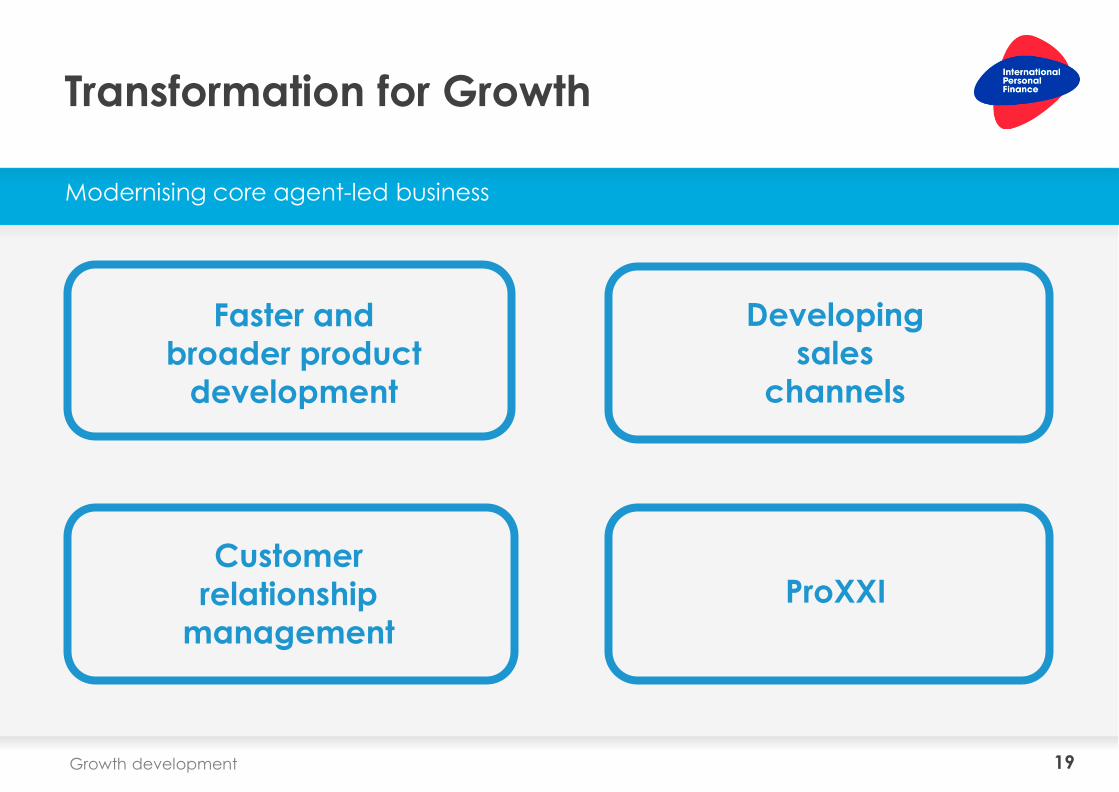
Transformation for Growth
Growth development
Modernising core agent-led business
Developing
sales
channels
ProXXI
Customer
relationship
management
Faster and
broader product
development

20
Growth through new products
Growth development
New products for our agent network
21
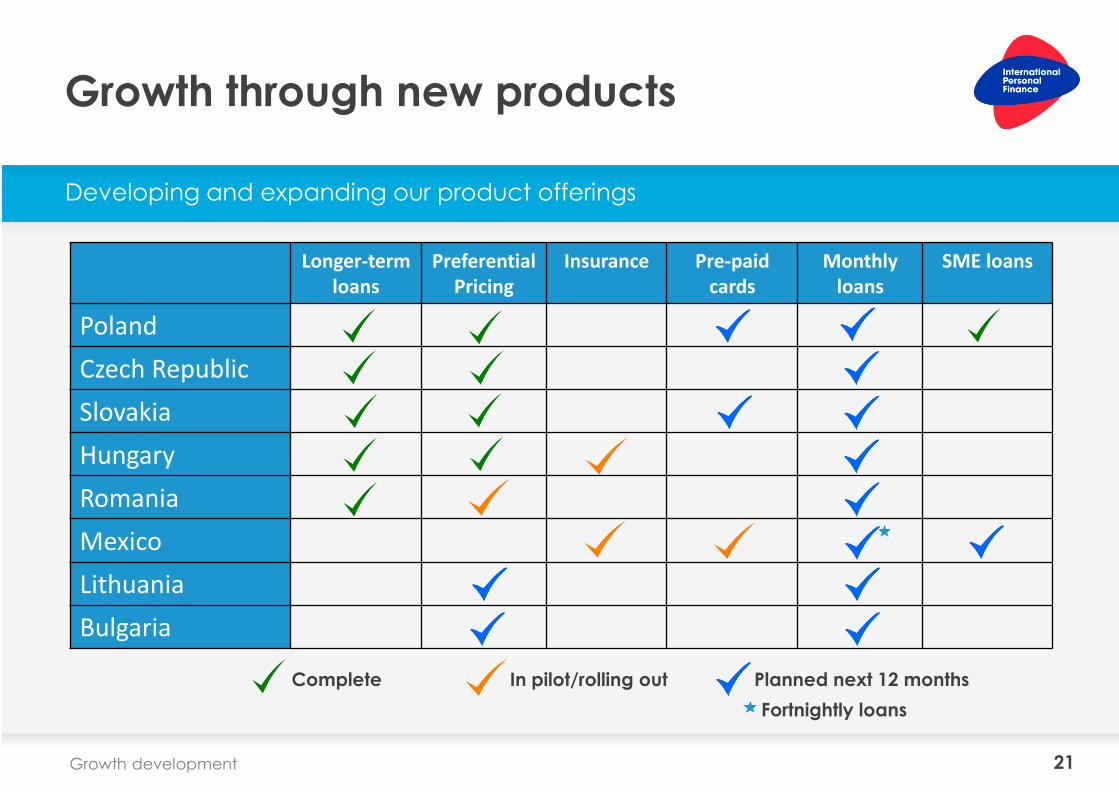
Growth through new products
Growth development
Longer-term loans
Preferential Pricing
Insurance Pre-paid cards
Monthly loans
SME loans
Poland
Czech Republic
Slovakia
Hungary
Romania
Mexico
Lithuania
Bulgaria
Complete In pilot/rolling out Planned next 12 months
Fortnightly loans
Developing and expanding our product offerings

22
Growth through new products
Growth development
New products for our agent network
Core product redesign in Poland
On-line loans under new digital brand

Outlook
23
Gerard Ryan Chief Executive Officer

24
Outlook
• Very good progress against strategy
• Addressing regulatory challenges
and increasing competition
• Strong growth trajectory
• Committed to working the balance
sheet harder
• Entering Spain in 2015
• Confident of achieving further
growth in H2
Half-year results 2014

Questions
25

Appendices
26
27 Appendices
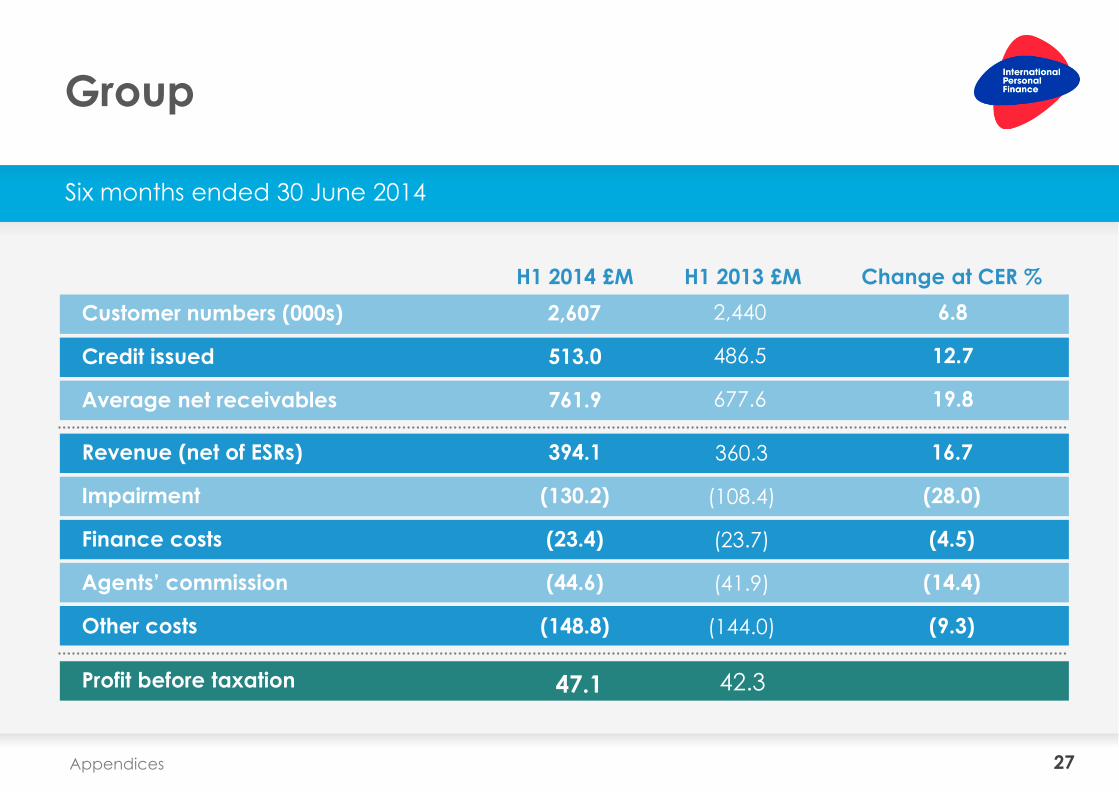
Group
Six months ended 30 June 2014
H1 2014 £M H1 2013 £M Change at CER %
2,607
513.0
761.9
Customer numbers (000s)
Credit issued
Average net receivables
394.1
(130.2)
(23.4)
(44.6)
(148.8)
Revenue (net of ESRs)
Impairment
Finance costs
Agents’ commission
Other costs
Profit before taxation 47.1
2,440
486.5
677.6
6.8
12.7
19.8
360.3
(108.4)
(23.7)
(41.9)
(144.0)
16.7
(28.0)
(4.5)
(14.4)
(9.3)
42.3
28 Appendices
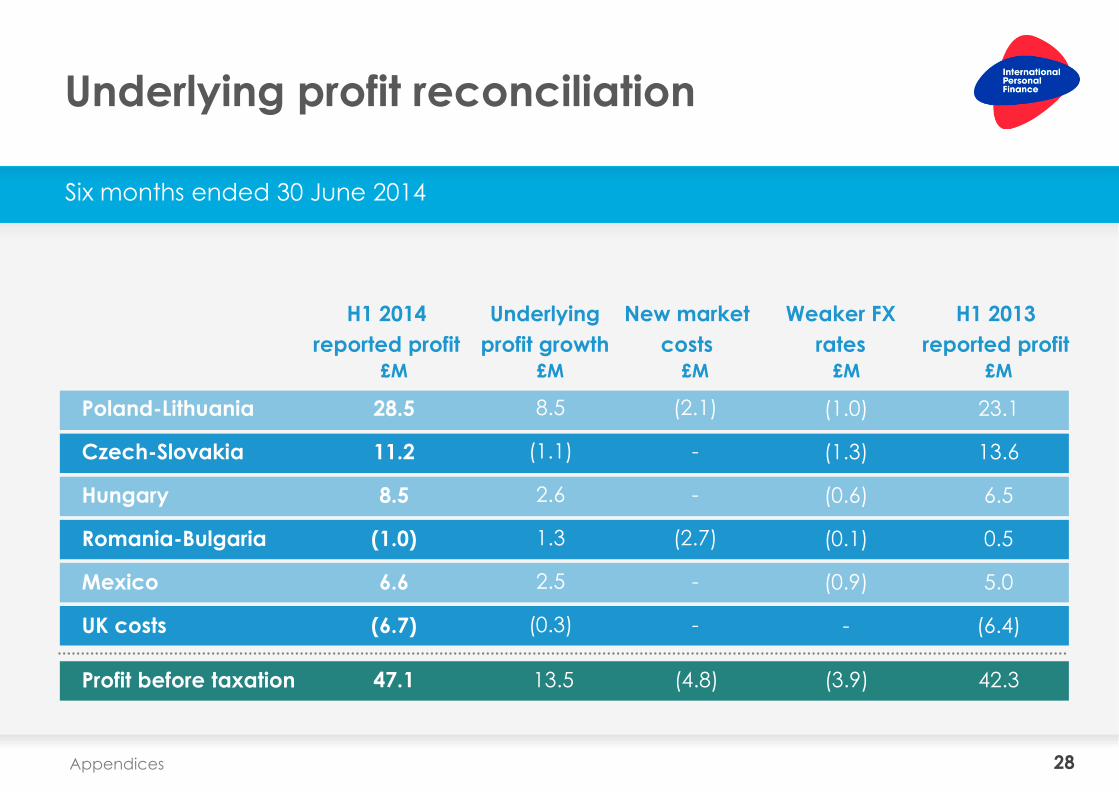
Underlying profit reconciliation
Profit before taxation
Poland-Lithuania
Czech-Slovakia
Hungary
Romania-Bulgaria
Mexico
UK costs
28.5
11.2
8.5
(1.0)
6.6
(6.7)
47.1 13.5 (4.8) (3.9) 42.3
H1 2014
reported profit
Underlying
profit growth
New market
costs
Weaker FX
rates
H1 2013
reported profit
£M £M £M £M £M
8.5
(1.1)
2.6
1.3
2.5
(0.3)
(2.1)
-
-
(2.7)
-
-
(1.0)
(1.3)
(0.6)
(0.1)
(0.9)
-
23.1
13.6
6.5
0.5
5.0
(6.4)
Six months ended 30 June 2014
29 Appendices
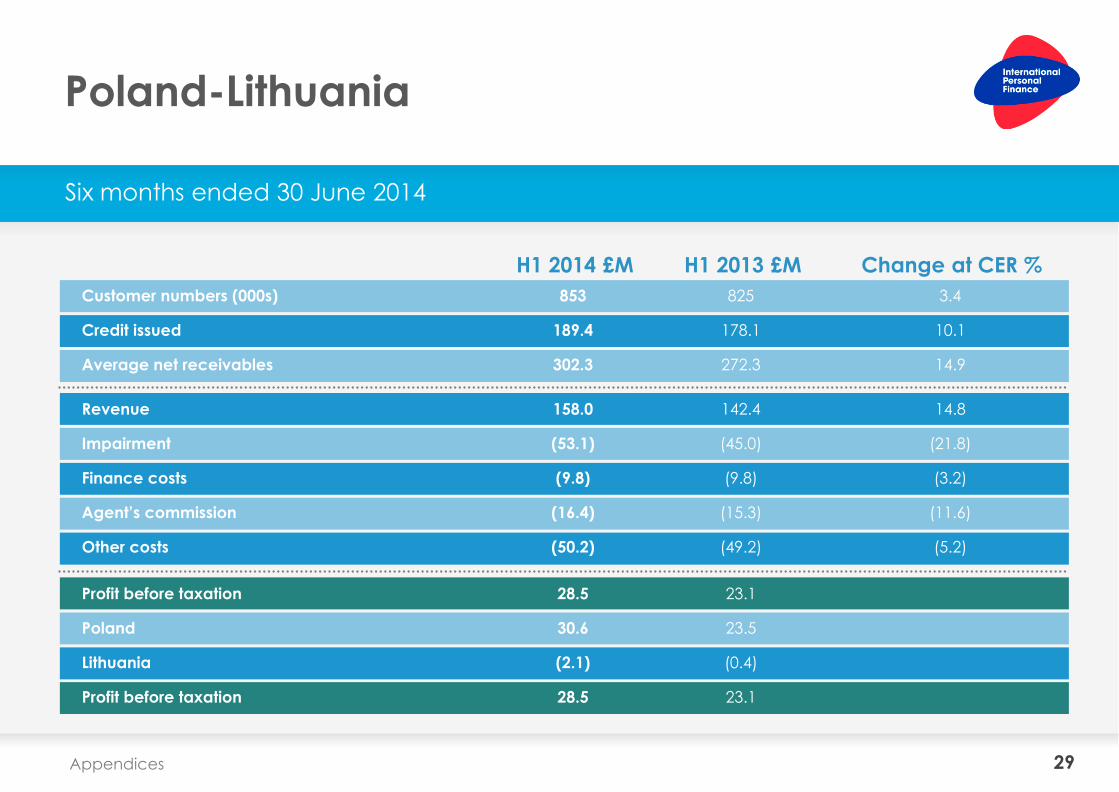
Poland-Lithuania
Six months ended 30 June 2014
H1 2014 £M H1 2013 £M Change at CER %
Customer numbers (000s)
Credit issued
Average net receivables
Revenue
Impairment
Finance costs
Agent’s commission
Other costs
Profit before taxation
Poland
Lithuania
Profit before taxation
853
189.4
302.3
158.0
(53.1)
(9.8)
(16.4)
(50.2)
28.5
30.6
(2.1)
28.5
825
178.1
272.3
142.4
(45.0)
(9.8)
(15.3)
(49.2)
23.1
23.5
(0.4)
23.1
3.4
10.1
14.9
14.8
(21.8)
(3.2)
(11.6)
(5.2)
30
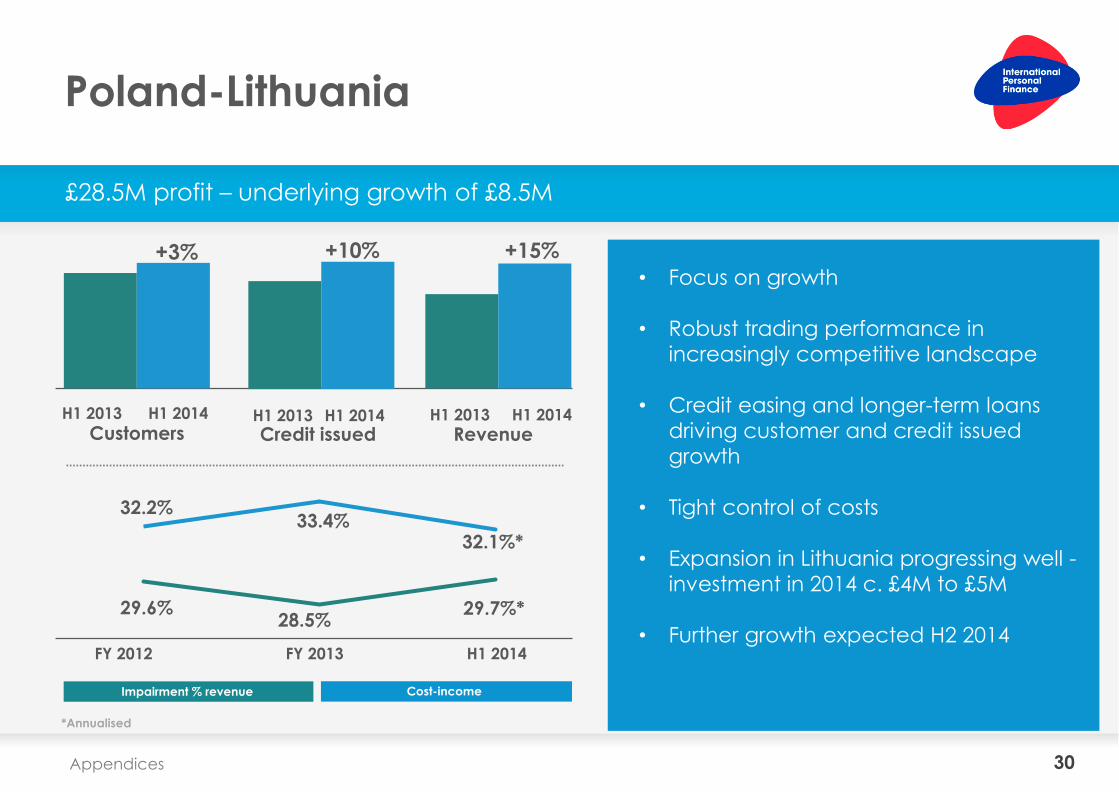
Poland-Lithuania
£28.5M profit – underlying growth of £8.5M
• Focus on growth
• Robust trading performance in
increasingly competitive landscape
• Credit easing and longer-term loans
driving customer and credit issued
growth
• Tight control of costs
• Expansion in Lithuania progressing well -
investment in 2014 c. £4M to £5M
• Further growth expected H2 2014
H1 2013 H1 2014
Customers Credit issued Revenue
FY 2012 FY 2013 H1 2014
Impairment % revenue Cost-income
H1 2013 H1 2014 H1 2013 H1 2014
+10% +3% +15%
32.1%*
29.6%
32.2% 33.4%
29.7%* 28.5%
*Annualised
Appendices
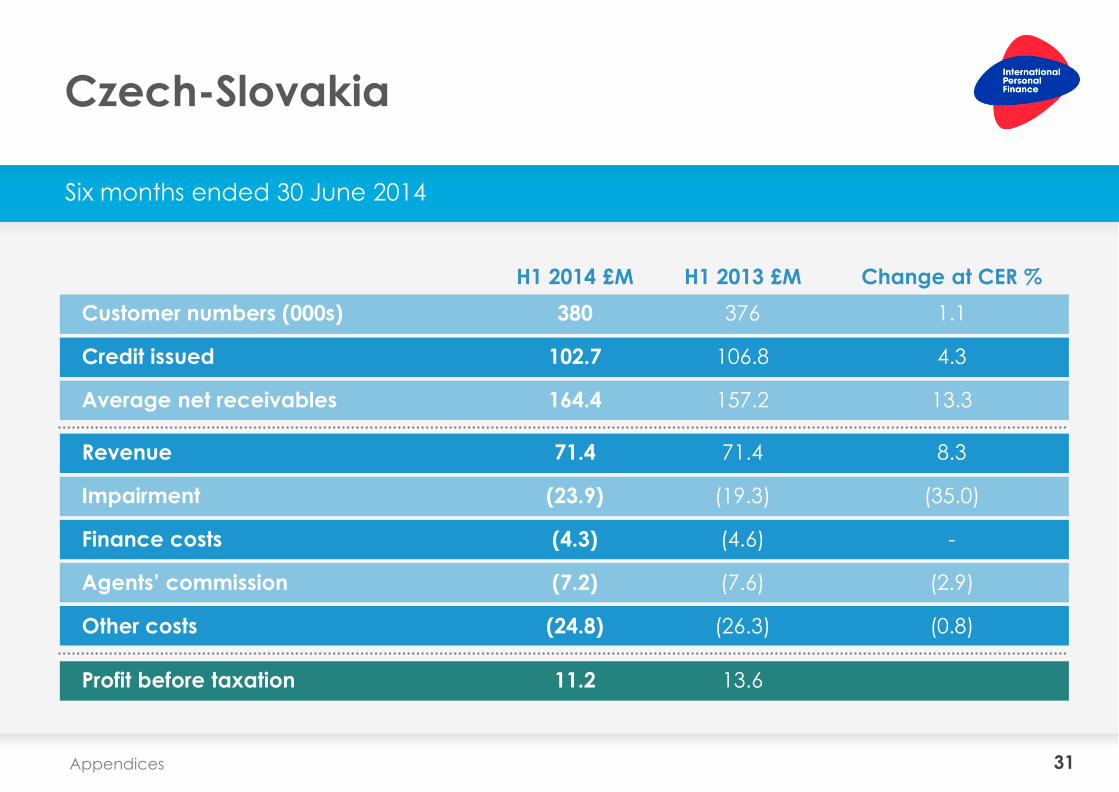
31 Appendices
Czech-Slovakia
Six months ended 30 June 2014
H1 2014 £M H1 2013 £M Change at CER %
380
102.7
164.4
376
106.8
157.2
1.1
4.3
13.3
Customer numbers (000s)
Credit issued
Average net receivables
71.4
(23.9)
(4.3)
(7.2)
(24.8)
71.4
(19.3)
(4.6)
(7.6)
(26.3)
8.3
(35.0)
-
(2.9)
(0.8)
Revenue
Impairment
Finance costs
Agents’ commission
Other costs
11.2
13.6
Profit before taxation
32
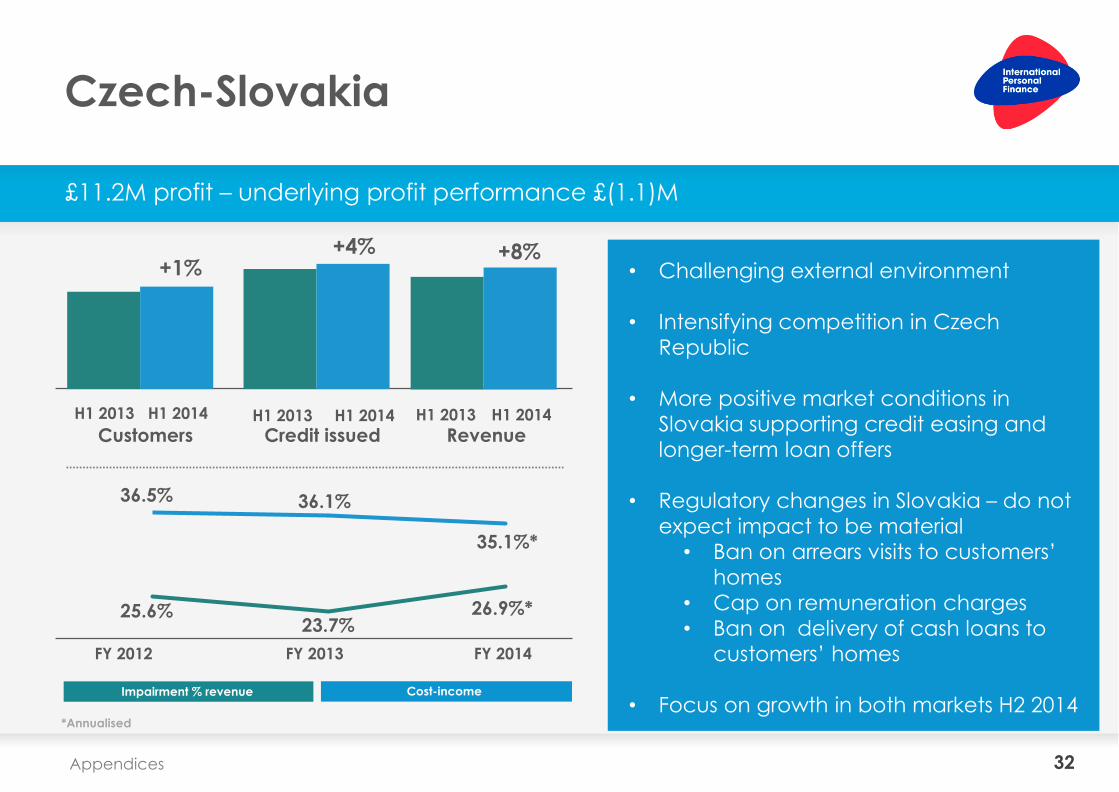
Czech-Slovakia
£11.2M profit – underlying profit performance £(1.1)M
H1 2013 H1 2014
Customers Credit issued Revenue
FY 2012 FY 2013 FY 2014
Impairment % revenue Cost-income
Appendices
H1 2013 H1 2014 H1 2013 H1 2014
35.1%*
25.6%
36.5% 36.1%
26.9%* 23.7%
*Annualised
+4% +1%
+8% • Challenging external environment
• Intensifying competition in Czech
Republic
• More positive market conditions in
Slovakia supporting credit easing and
longer-term loan offers
• Regulatory changes in Slovakia – do not
expect impact to be material
• Ban on arrears visits to customers’
homes
• Cap on remuneration charges
• Ban on delivery of cash loans to
customers’ homes
• Focus on growth in both markets H2 2014
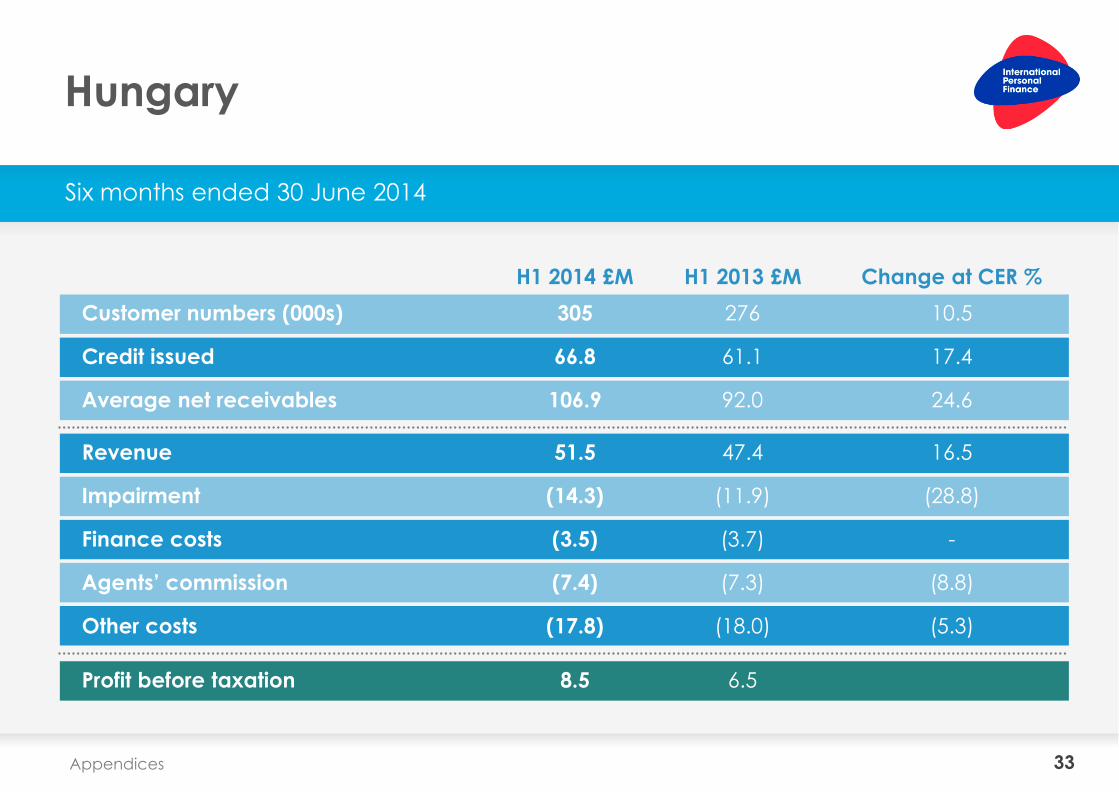
33 Appendices
Hungary
Six months ended 30 June 2014
H1 2014 £M H1 2013 £M Change at CER %
305
66.8
106.9
276
61.1
92.0
10.5
17.4
24.6
Customer numbers (000s)
Credit issued
Average net receivables
51.5
(14.3)
(3.5)
(7.4)
(17.8)
47.4
(11.9)
(3.7)
(7.3)
(18.0)
16.5
(28.8)
-
(8.8)
(5.3)
Revenue
Impairment
Finance costs
Agents’ commission
Other costs
8.5
6.5
Profit before taxation
34
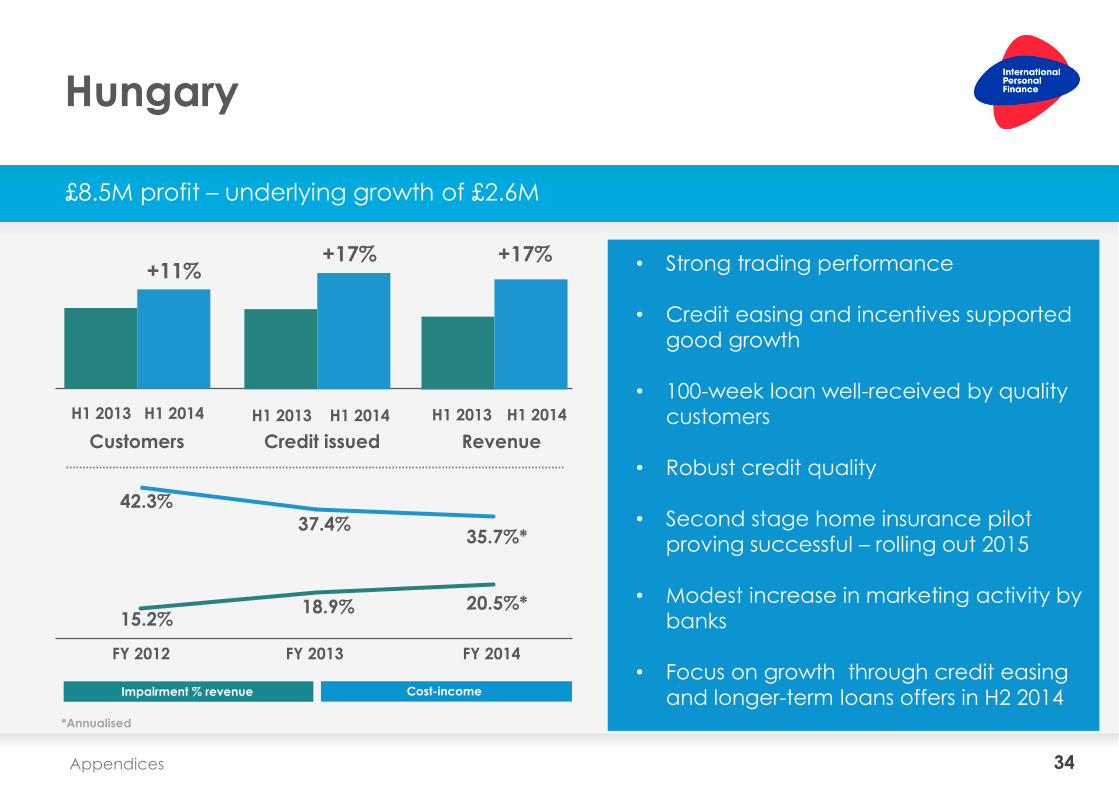
Hungary
£8.5M profit – underlying growth of £2.6M
H1 2013 H1 2014
Customers Credit issued Revenue
FY 2012 FY 2013 FY 2014
Impairment % revenue Cost-income
Appendices
H1 2013 H1 2014 H1 2013 H1 2014
*Annualised
+17% +11%
+17%
35.7%*
15.2%
42.3%
37.4%
20.5%* 18.9%
• Strong trading performance
• Credit easing and incentives supported
good growth
• 100-week loan well-received by quality
customers
• Robust credit quality
• Second stage home insurance pilot
proving successful – rolling out 2015
• Modest increase in marketing activity by
banks
• Focus on growth through credit easing
and longer-term loans offers in H2 2014
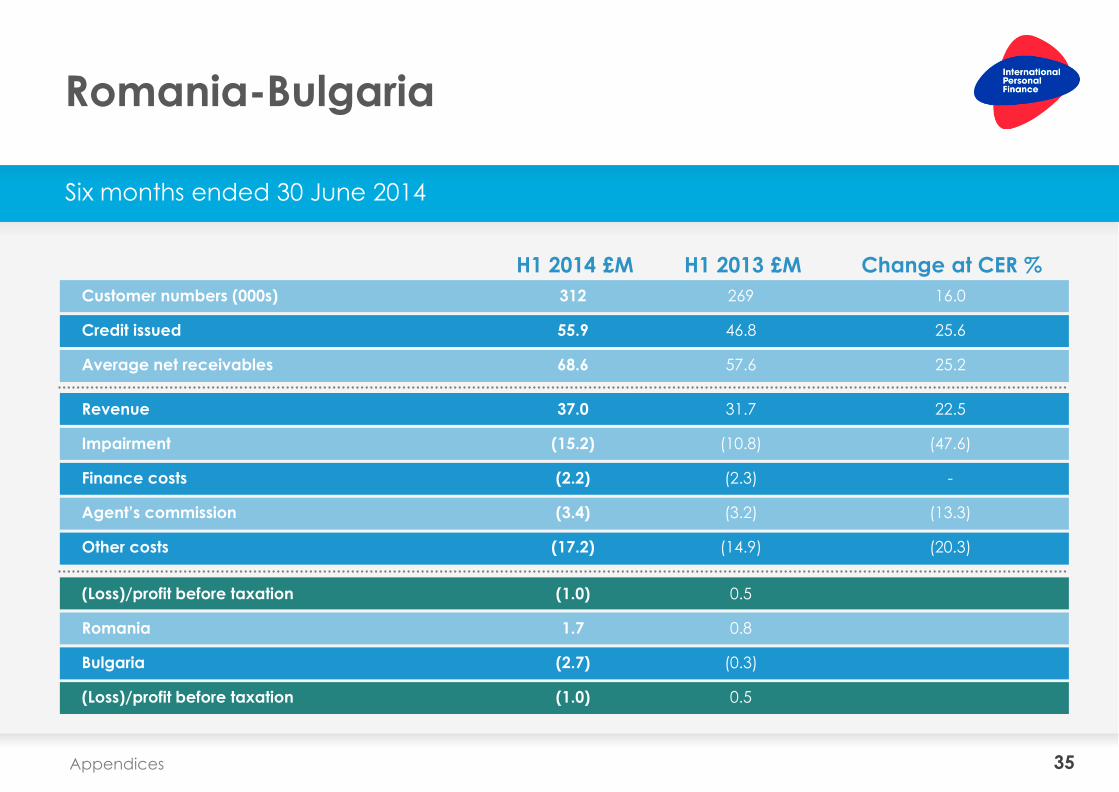
35 Appendices
Romania-Bulgaria
Six months ended 30 June 2014
H1 2014 £M H1 2013 £M Change at CER %
Customer numbers (000s)
Credit issued
Average net receivables
Revenue
Impairment
Finance costs
Agent’s commission
Other costs
(Loss)/profit before taxation
Romania
Bulgaria
(Loss)/profit before taxation
312
55.9
68.6
37.0
(15.2)
(2.2)
(3.4)
(17.2)
(1.0)
1.7
(2.7)
(1.0)
269
46.8
57.6
31.7
(10.8)
(2.3)
(3.2)
(14.9)
0.5
0.8
(0.3)
0.5
16.0
25.6
25.2
22.5
(47.6)
-
(13.3)
(20.3)
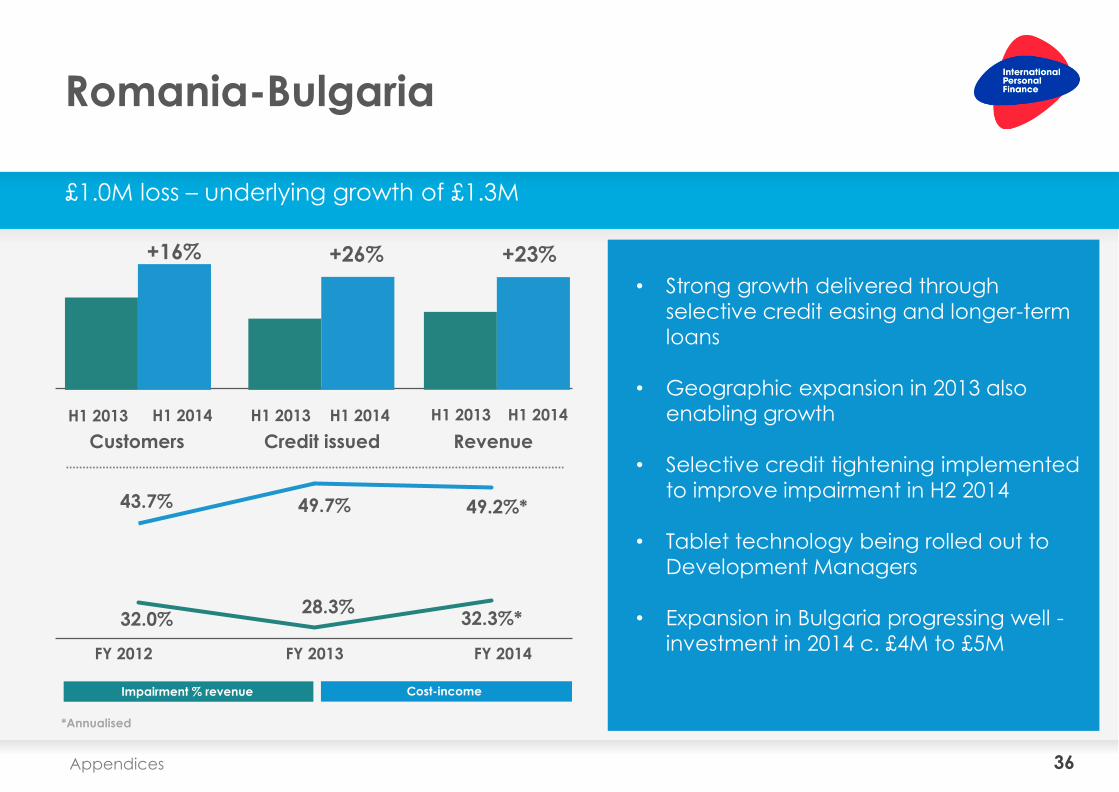
36
Romania-Bulgaria
£1.0M loss – underlying growth of £1.3M
H1 2013 H1 2014
Customers Credit issued Revenue
FY 2012 FY 2013 FY 2014
Impairment % revenue Cost-income
Appendices
H1 2013 H1 2014 H1 2013 H1 2014
*Annualised
+26% +16% +23%
32.3%*
49.2%*
32.0%
43.7% 49.7%
28.3%
• Strong growth delivered through
selective credit easing and longer-term
loans
• Geographic expansion in 2013 also
enabling growth
• Selective credit tightening implemented
to improve impairment in H2 2014
• Tablet technology being rolled out to
Development Managers
• Expansion in Bulgaria progressing well -
investment in 2014 c. £4M to £5M
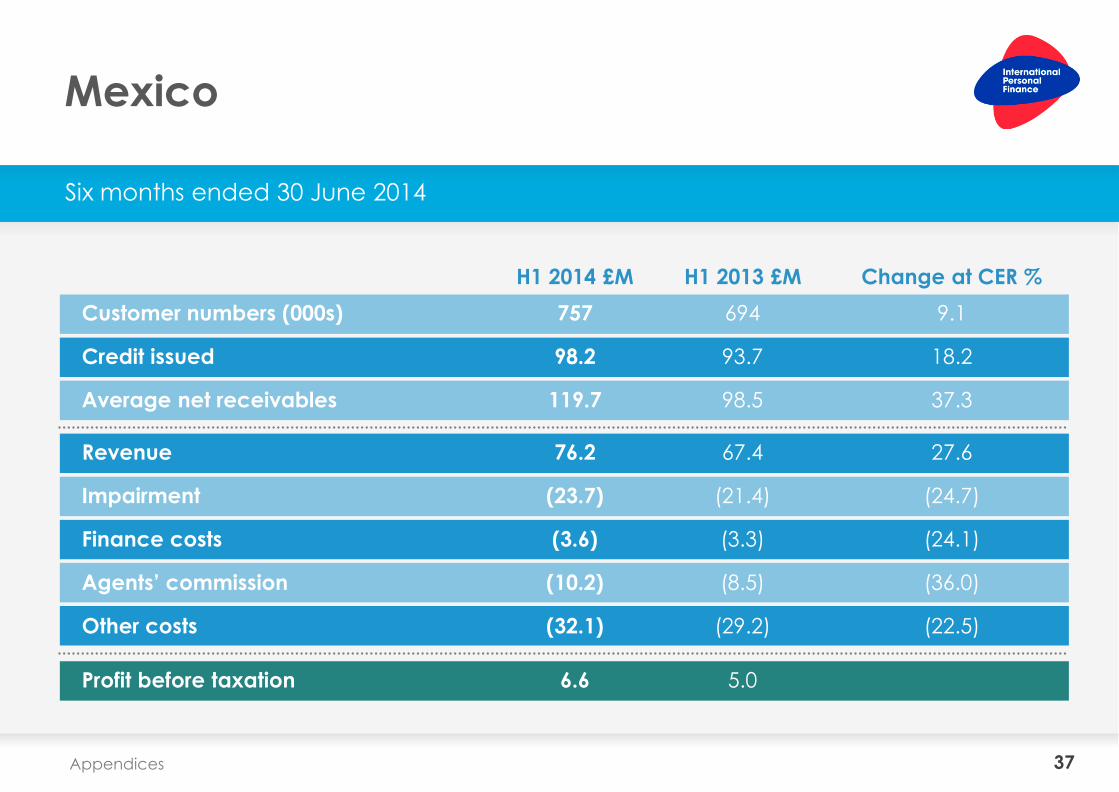
37 Appendices
Mexico
Six months ended 30 June 2014
H1 2014 £M H1 2013 £M Change at CER %
757
98.2
119.7
694
93.7
98.5
9.1
18.2
37.3
Customer numbers (000s)
Credit issued
Average net receivables
76.2
(23.7)
(3.6)
(10.2)
(32.1)
67.4
(21.4)
(3.3)
(8.5)
(29.2)
27.6
(24.7)
(24.1)
(36.0)
(22.5)
Revenue
Impairment
Finance costs
Agents’ commission
Other costs
6.6
5.0
Profit before taxation
38
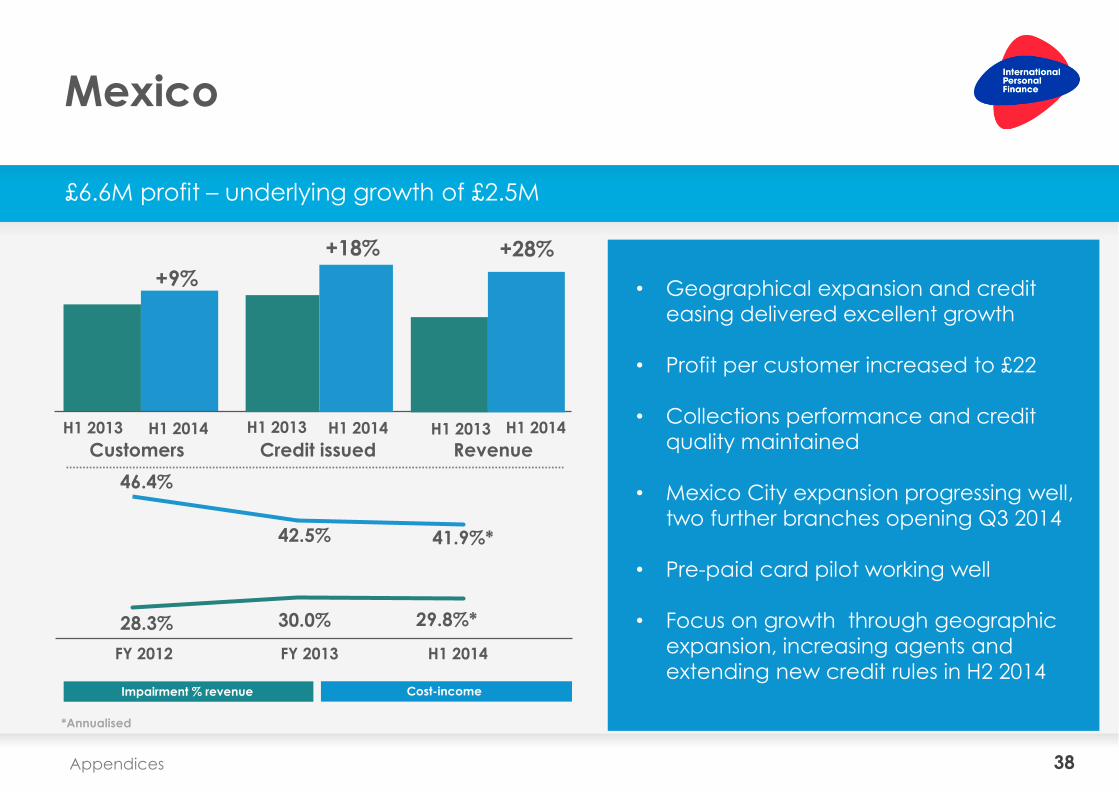
Mexico
£6.6M profit – underlying growth of £2.5M
Customers Credit issued Revenue
FY 2012 FY 2013 H1 2014
Impairment % revenue Cost-income
Appendices
H1 2013 H1 2014 H1 2013 H1 2014 H1 2013 H1 2014
+9% +28%
41.9%*
28.3%
46.4%
42.5%
29.8%* 30.0%
*Annualised
£59.7M
+18% +28%
• Geographical expansion and credit
easing delivered excellent growth
• Profit per customer increased to £22
• Collections performance and credit
quality maintained
• Mexico City expansion progressing well,
two further branches opening Q3 2014
• Pre-paid card pilot working well
• Focus on growth through geographic
expansion, increasing agents and
extending new credit rules in H2 2014
39 Appendices
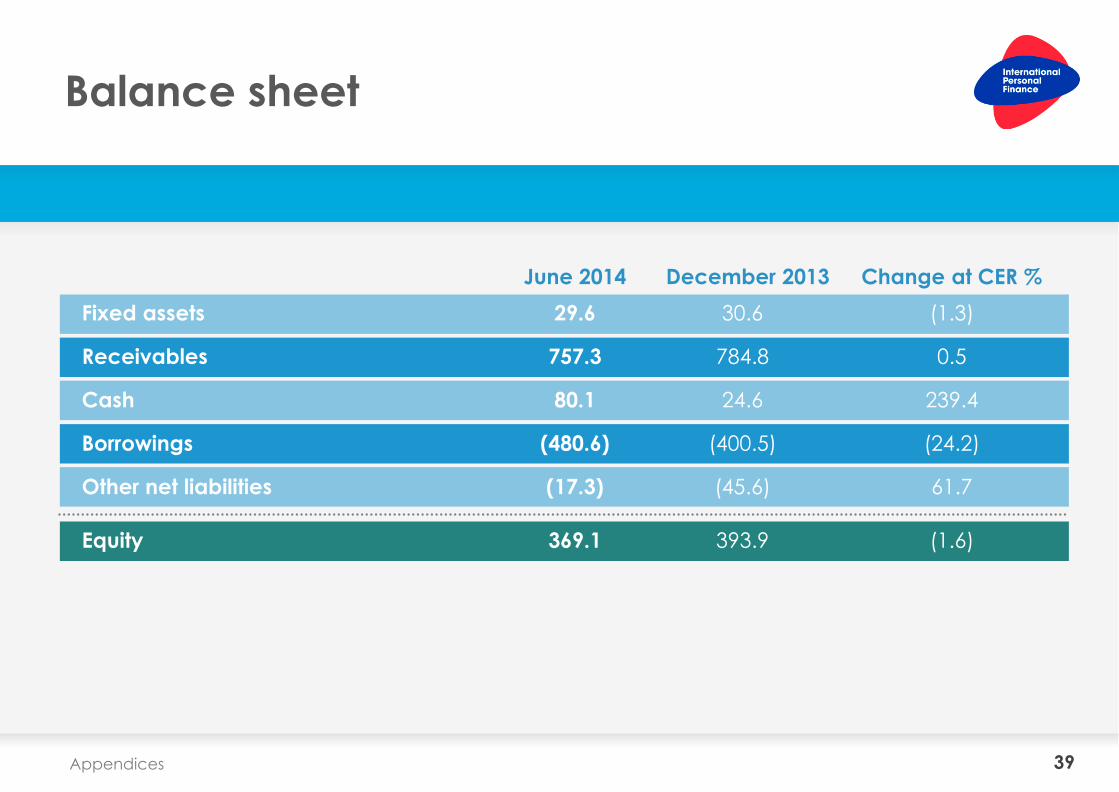
Balance sheet
June 2014 December 2013 Change at CER %
29.6
757.3
80.1
(480.6)
(17.3)
30.6
784.8
24.6
(400.5)
(45.6)
(1.3)
0.5
239.4
(24.2)
61.7
Fixed assets
Receivables
Cash
Borrowings
Other net liabilities
369.1 393.9 Equity (1.6)
40 Appendices
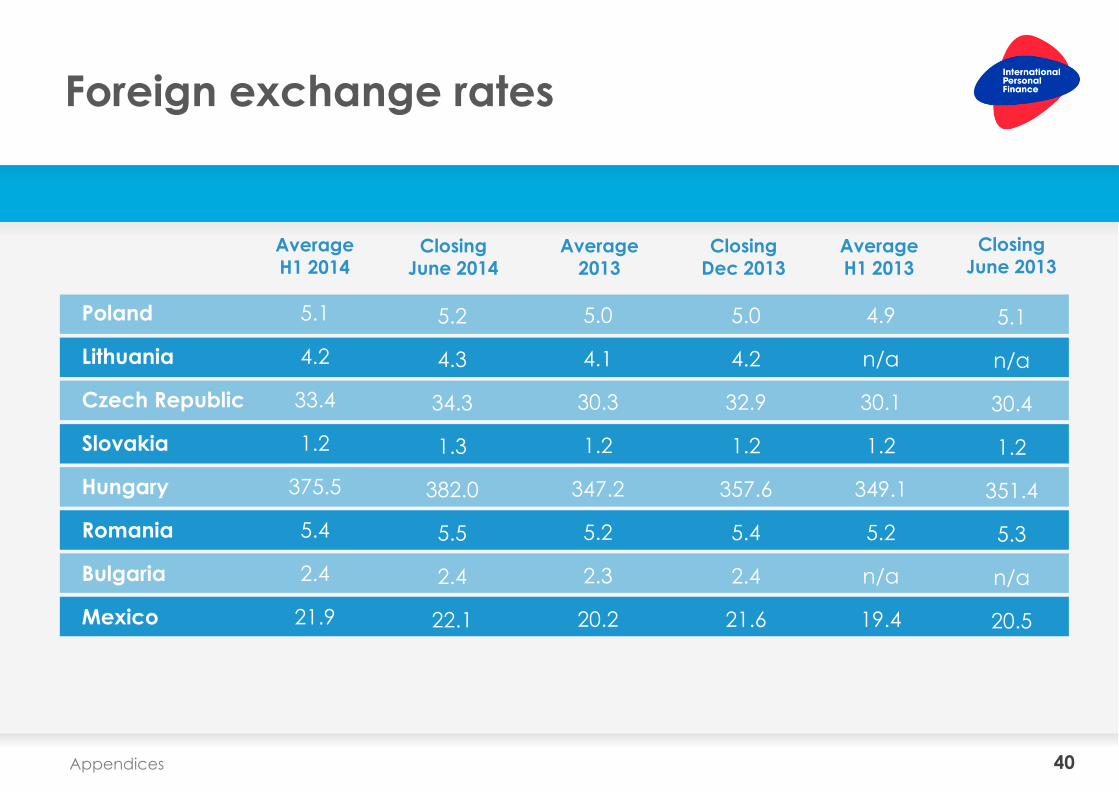
Foreign exchange rates
Poland
Lithuania
Czech Republic
Slovakia
Hungary
Romania
Bulgaria
Mexico
AverageH1 2014
5.1
4.2
33.4
1.2
375.5
5.4
2.4
21.9
AverageH1 2013
5.2
4.3
34.3
1.3
382.0
5.5
2.4
22.1
Closing June 2014
4.9
n/a
30.1
1.2
349.1
5.2
n/a
19.4
Average 2013
5.1
n/a
30.4
1.2
351.4
5.3
n/a
20.5
Closing Dec 2013
5.0
4.1
30.3
1.2
347.2
5.2
2.3
20.2
Closing
June 2013
5.0
4.2
32.9
1.2
357.6
5.4
2.4
21.6
41 Appendices
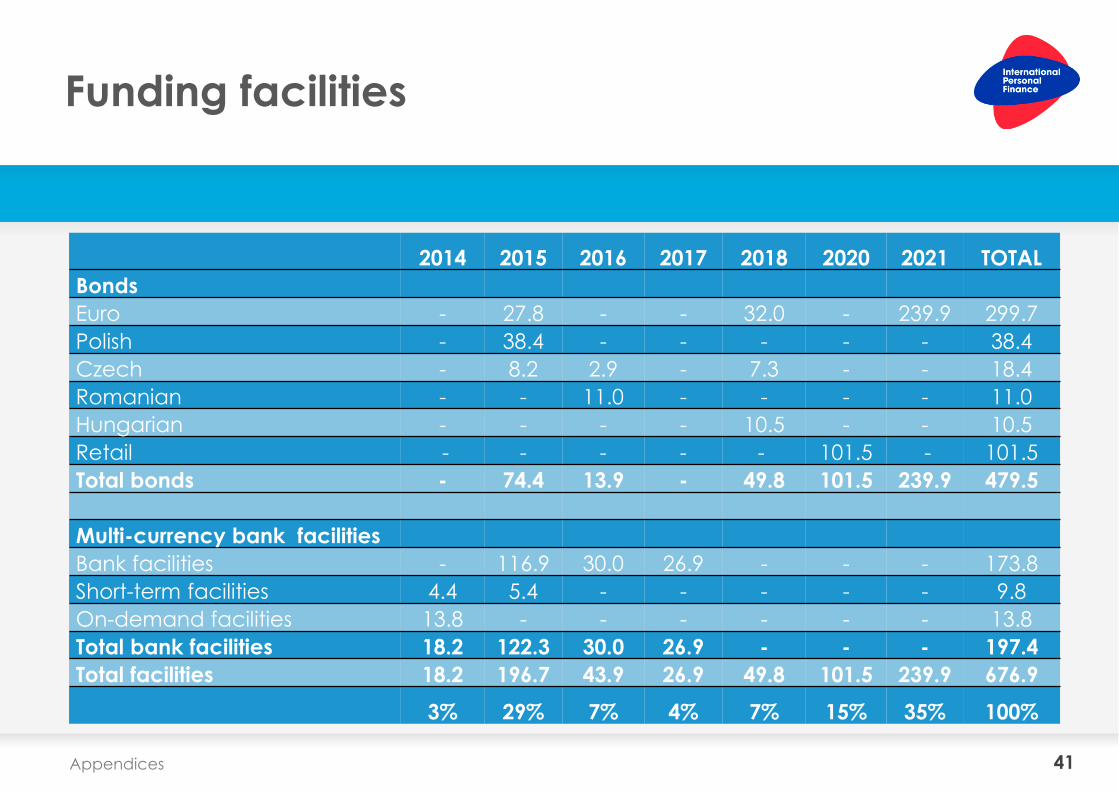
Funding facilities
2014 2015 2016 2017 2018 2020 2021 TOTAL
Bonds
Euro - 27.8 - - 32.0 - 239.9 299.7
Polish - 38.4 - - - - - 38.4
Czech - 8.2 2.9 - 7.3 - - 18.4
Romanian - - 11.0 - - - - 11.0
Hungarian - - - - 10.5 - - 10.5
Retail - - - - - 101.5 - 101.5
Total bonds - 74.4 13.9 - 49.8 101.5 239.9 479.5
Multi-currency bank facilities
Bank facilities - 116.9 30.0 26.9 - - - 173.8
Short-term facilities 4.4 5.4 - - - - - 9.8
On-demand facilities 13.8 - - - - - - 13.8
Total bank facilities 18.2 122.3 30.0 26.9 - - - 197.4
Total facilities 18.2 196.7 43.9 26.9 49.8 101.5 239.9 676.9
3% 29% 7% 4% 7% 15% 35% 100%
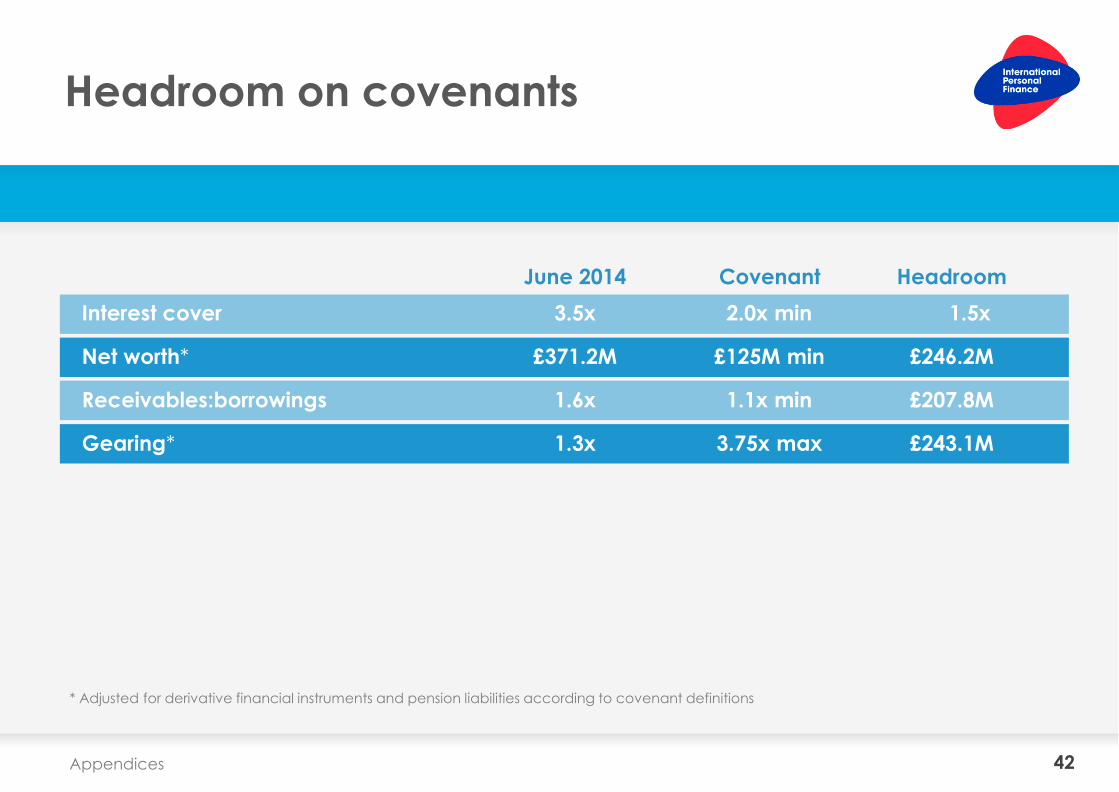
42 Appendices
Headroom on covenants
June 2014 Covenant Headroom
3.5x
£371.2M
1.6x
1.3x
2.0x min
£125M min
1.1x min
3.75x max
1.5x
£246.2M
£207.8M
£243.1M
Interest cover
Net worth*
Receivables:borrowings
Gearing*
* Adjusted for derivative financial instruments and pension liabilities according to covenant definitions
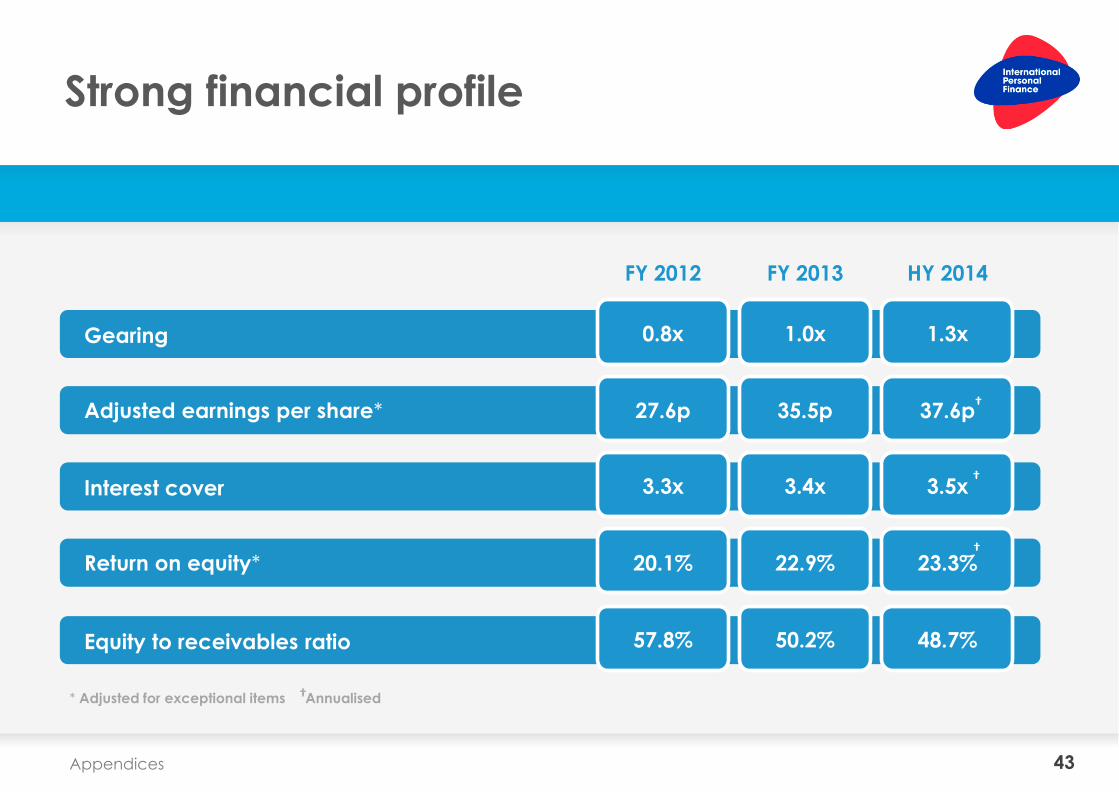
43 Appendices
Strong financial profile
FY 2012 FY 2013 HY 2014
Gearing
Adjusted earnings per share*
0.8x 1.0x 1.3x
27.6p 35.5p 37.6p
Interest cover
Return on equity*
3.3x 3.4x 3.5x
20.1% 22.9% 23.3%
Equity to receivables ratio 57.8% 50.2% 48.7%
* Adjusted for exceptional items Annualised
†
†
†
†

44 Half-year results 2014
Contact
Rachel Moran Investor Relations Manager
International Personal Finance
No 3 Leeds City Office Park
Leeds LS11 5BD
United Kingdom
T: +44 (0)113 285 6700