Embed Size (px)
Citation preview
Half year financial report
Six-month period ended June 30, 2012
Condensed Consolidated Financial Statements Management Report CEO Attestation Statutory Auditors’ Review Report
Schneider Electric – Half year financial report as at June 30, 2012 2
Table of contents Condensed consolidated financial statements ......................................................................... 3
Consolidated statement of comprehensive income ................................................................................. 3
Consolidated statement of cash-flows ..................................................................................................... 5
Consolidated balance sheet ..................................................................................................................... 6
Consolidated statement of changes in equity .......................................................................................... 8
Notes to the consolidated financial statements ........................................................................................ 9
Management report for the period ended June 30, 2012 .................................................... 25
Review of the consolidated financial statements ................................................................................... 25
Significant events of the period .............................................................................................................. 32
Main risks and areas of uncertainty........................................................................................................ 33
Claims, litigations and other risks ........................................................................................................... 33
Transactions with related parties............................................................................................................ 33
CEO attestation ................................................................................................................................ 34
Statutory Auditors’ review report on the six-month period financial information .......... 35
Schneider Electric – Half year financial report as at June 30, 2012 3
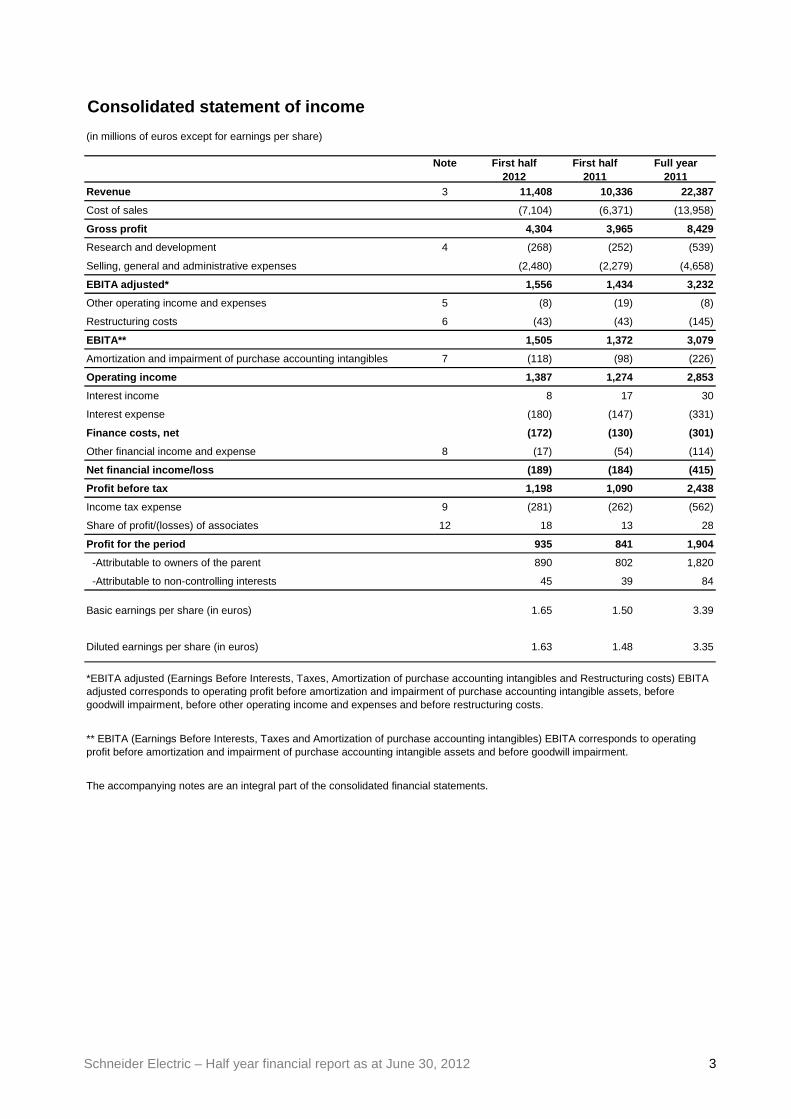
Consolidated statement of income
(in millions of euros except for earnings per share)
Note First half 2012
First half 2011
Full year 2011
Revenue 3 11,408 10,336 22,387
Cost of sales (7,104) (6,371) (13,958)
Gross profit 4,304 3,965 8,429
Research and development 4 (268) (252) (539)
Selling, general and administrative expenses (2,480) (2,279) (4,658)
EBITA adjusted* 1,556 1,434 3,232
Other operating income and expenses 5 (8) (19) (8)
Restructuring costs 6 (43) (43) (145)
EBITA** 1,505 1,372 3,079
Amortization and impairment of purchase accounting intangibles 7 (118) (98) (226)
Operating income 1,387 1,274 2,853
Interest income 8 17 30
Interest expense (180) (147) (331)
Finance costs, net (172) (130) (301)
Other financial income and expense 8 (17) (54) (114)
Net financial income/loss (189) (184) (415)
Profit before tax 1,198 1,090 2,438
Income tax expense 9 (281) (262) (562)
Share of profit/(losses) of associates 12 18 13 28
Profit for the period 935 841 1,904
-Attributable to owners of the parent 890 802 1,820
-Attributable to non-controlling interests 45 39 84
Basic earnings per share (in euros) 1.65 1.50 3.39
Diluted earnings per share (in euros) 1.63 1.48 3.35
The accompanying notes are an integral part of the consolidated financial statements.
*EBITA adjusted (Earnings Before Interests, Taxes, Amortization of purchase accounting intangibles and Restructuring costs) EBITA adjusted corresponds to operating profit before amortization and impairment of purchase accounting intangible assets, before goodwill impairment, before other operating income and expenses and before restructuring costs.
** EBITA (Earnings Before Interests, Taxes and Amortization of purchase accounting intangibles) EBITA corresponds to operating profit before amortization and impairment of purchase accounting intangible assets and before goodwill impairment.
Schneider Electric – Half year financial report as at June 30, 2012 4
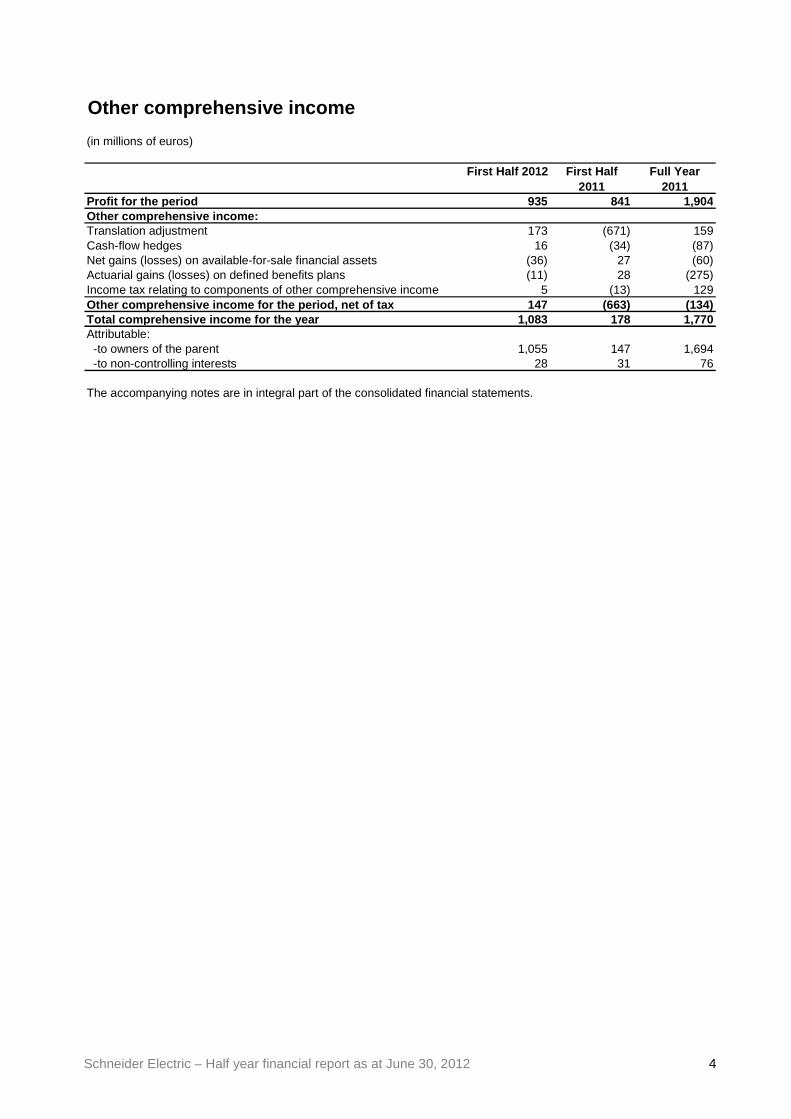
Other comprehensive income
(in millions of euros)
First Half 2012 First Half 2011
Full Year 2011
Profit for the period 935 841 1,904Other comprehensive income:Translation adjustment 173 (671) 159Cash-flow hedges 16 (34) (87)Net gains (losses) on available-for-sale financial assets (36) 27 (60)Actuarial gains (losses) on defined benefits plans (11) 28 (275)Income tax relating to components of other comprehensive income 5 (13) 129Other comprehensive income for the period, net of t ax 147 (663) (134)Total comprehensive income for the year 1,083 178 1,770Attributable: -to owners of the parent 1,055 147 1,694 -to non-controlling interests 28 31 76
The accompanying notes are in integral part of the consolidated financial statements.
Schneider Electric – Half year financial report as at June 30, 2012 5
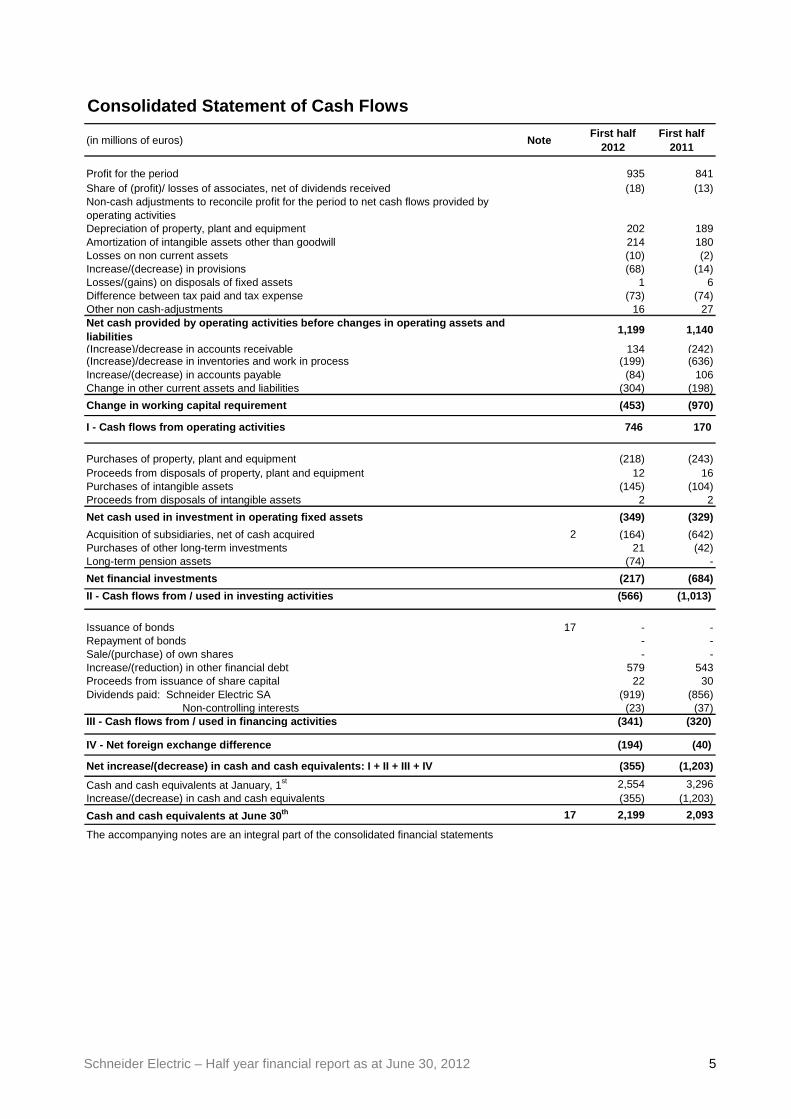
Consolidated Statement of Cash Flows
(in millions of euros) NoteFirst half
2012First half
2011
Profit for the period 935 841Share of (profit)/ losses of associates, net of dividends received (18) (13)Non-cash adjustments to reconcile profit for the period to net cash flows provided by operating activitiesDepreciation of property, plant and equipment 202 189Amortization of intangible assets other than goodwill 214 180Losses on non current assets (10) (2)Increase/(decrease) in provisions (68) (14)Losses/(gains) on disposals of fixed assets 1 6Difference between tax paid and tax expense (73) (74)Other non cash-adjustments 16 27Net cash provided by operating activities before ch anges in operating assets and liabilities
1,199 1,140
(Increase)/decrease in accounts receivable 134 (242)(Increase)/decrease in inventories and work in process (199) (636)Increase/(decrease) in accounts payable (84) 106Change in other current assets and liabilities (304) (198)
Change in working capital requirement (453) (970)
I - Cash flows from operating activities 746 170
Purchases of property, plant and equipment (218) (243)Proceeds from disposals of property, plant and equipment 12 16Purchases of intangible assets (145) (104)Proceeds from disposals of intangible assets 2 2
Net cash used in investment in operating fixed asse ts (349) (329)
Acquisition of subsidiaries, net of cash acquired 2 (164) (642)Purchases of other long-term investments 21 (42)Long-term pension assets (74) -
Net financial investments (217) (684)
II - Cash flows from / used in investing activities (566) (1,013)
Issuance of bonds 17 - -Repayment of bonds - -Sale/(purchase) of own shares - -Increase/(reduction) in other financial debt 579 543Proceeds from issuance of share capital 22 30Dividends paid: Schneider Electric SA (919) (856) Non-controlling interests (23) (37)III - Cash flows from / used in financing activities (341) (320)
IV - Net foreign exchange difference (194) (40)
Net increase/(decrease) in cash and cash equivalent s: I + II + III + IV (355) (1,203)
Cash and cash equivalents at January, 1st 2,554 3,296Increase/(decrease) in cash and cash equivalents (355) (1,203)
Cash and cash equivalents at June 30 th 17 2,199 2,093
The accompanying notes are an integral part of the consolidated financial statements
Schneider Electric – Half year financial report as at June 30, 2012 6
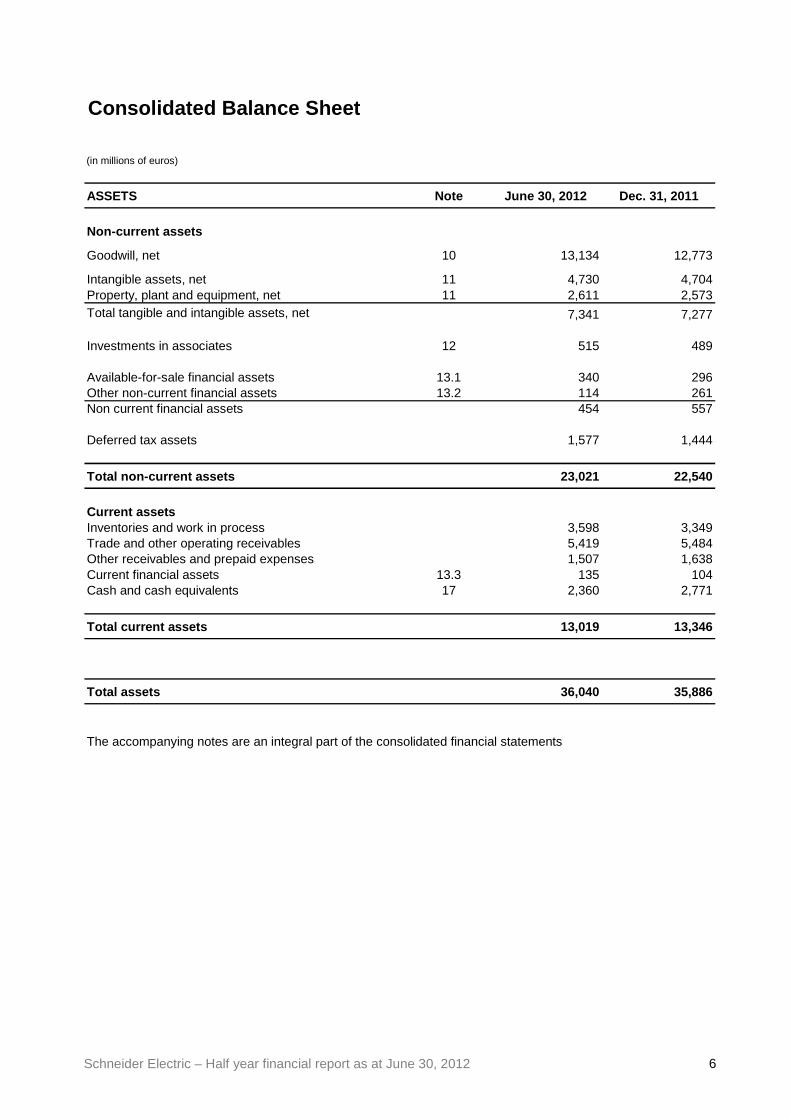
Consolidated Balance Sheet
(in millions of euros)
ASSETS Note June 30, 2012 Dec. 31, 2011
Non-current assets
Goodwill, net 10 13,134 12,773
Intangible assets, net 11 4,730 4,704Property, plant and equipment, net 11 2,611 2,573Total tangible and intangible assets, net 7,341 7,277
Investments in associates 12 515 489
Available-for-sale financial assets 13.1 340 296Other non-current financial assets 13.2 114 261Non current financial assets 454 557
Deferred tax assets 1,577 1,444
Total non-current assets 23,021 22,540
Current assetsInventories and work in process 3,598 3,349Trade and other operating receivables 5,419 5,484Other receivables and prepaid expenses 1,507 1,638Current financial assets 13.3 135 104Cash and cash equivalents 17 2,360 2,771
Total current assets 13,019 13,346
Total assets 36,040 35,886
The accompanying notes are an integral part of the consolidated financial statements
Schneider Electric – Half year financial report as at June 30, 2012 7
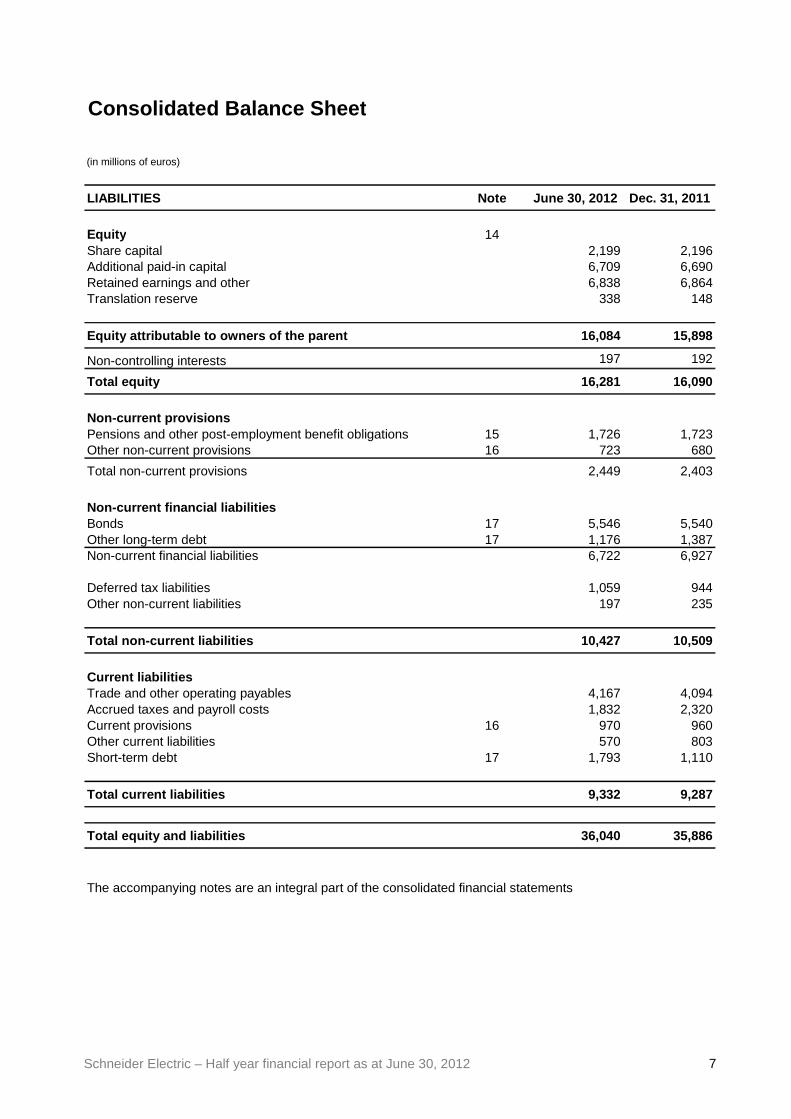
Consolidated Balance Sheet
(in millions of euros)
LIABILITIES Note June 30, 2012 Dec. 31, 2011
Equity 14Share capital 2,199 2,196Additional paid-in capital 6,709 6,690Retained earnings and other 6,838 6,864Translation reserve 338 148
Equity attributable to owners of the parent 16,084 15,898
Non-controlling interests 197 192
Total equity 16,281 16,090
Non-current provisionsPensions and other post-employment benefit obligations 15 1,726 1,723Other non-current provisions 16 723 680
Total non-current provisions 2,449 2,403
Non-current financial liabilitiesBonds 17 5,546 5,540Other long-term debt 17 1,176 1,387Non-current financial liabilities 6,722 6,927
Deferred tax liabilities 1,059 944Other non-current liabilities 197 235
Total non-current liabilities 10,427 10,509
Current liabilitiesTrade and other operating payables 4,167 4,094Accrued taxes and payroll costs 1,832 2,320Current provisions 16 970 960Other current liabilities 570 803Short-term debt 17 1,793 1,110
Total current liabilities 9,332 9,287
Total equity and liabilities 36,040 35,886
The accompanying notes are an integral part of the consolidated financial statements
Schneider Electric – Half year financial report as at June 30, 2012 8
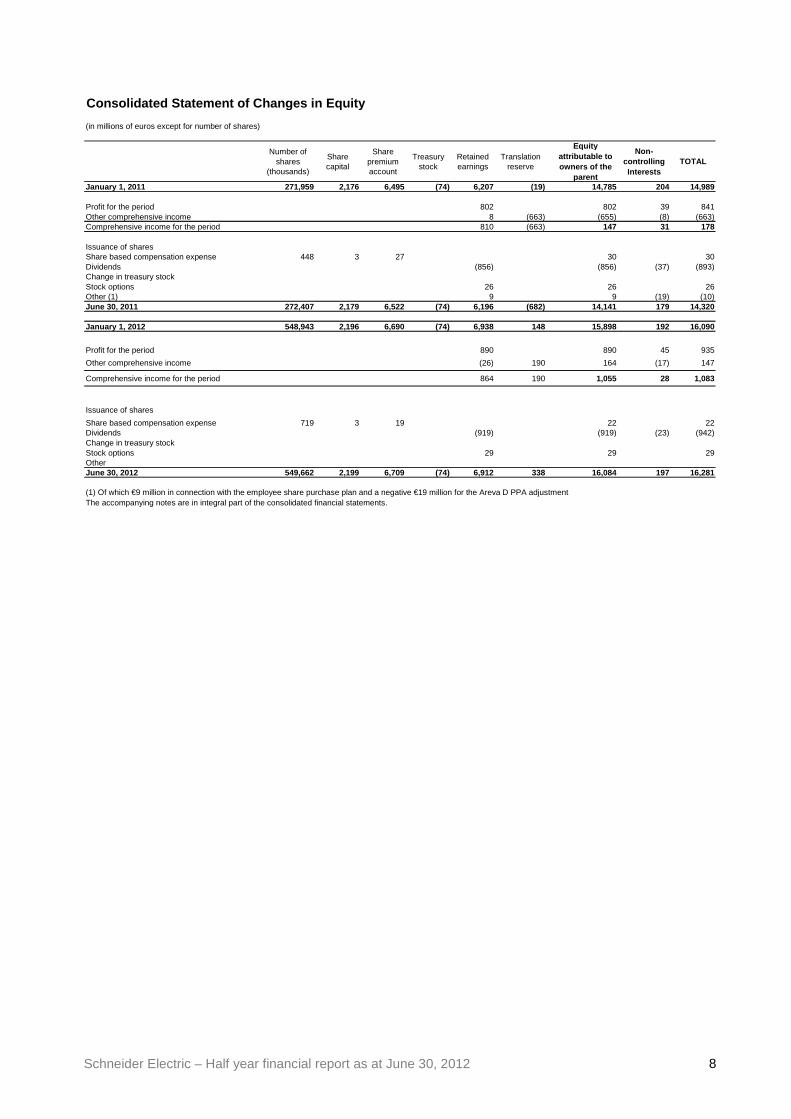
Consolidated Statement of Changes in Equity
(in millions of euros except for number of shares)
Number of shares
(thousands)
Share capital
Share premium account
Treasury stock
Retained earnings
Translation reserve
Equity attributable to owners of the
parent
Non-controlling Interests
TOTAL
January 1, 2011 271,959 2,176 6,495 (74) 6,207 (19) 14,785 204 14,989
Profit for the period 802 802 39 841 Other comprehensive income 8 (663) (655) (8) (663) Comprehensive income for the period 810 (663) 147 31 178
Issuance of sharesShare based compensation expense 448 3 27 30 30 Dividends (856) (856) (37) (893) Change in treasury stockStock options 26 26 26 Other (1) 9 9 (19) (10) June 30, 2011 272,407 2,179 6,522 (74) 6,196 (682) 14,141 179 14,320
January 1, 2012 548,943 2,196 6,690 (74) 6,938 148 15,898 192 16,090
Profit for the period 890 890 45 935
Other comprehensive income (26) 190 164 (17) 147
Comprehensive income for the period 864 190 1,055 28 1,083
Issuance of shares
Share based compensation expense 719 3 19 22 22 Dividends (919) (919) (23) (942) Change in treasury stockStock options 29 29 29 OtherJune 30, 2012 549,662 2,199 6,709 (74) 6,912 338 16,084 197 16,281
The accompanying notes are in integral part of the consolidated financial statements.(1) Of which €9 million in connection with the employee share purchase plan and a negative €19 million for the Areva D PPA adjustment
Schneider Electric – Half year financial report as at June 30, 2012 9
Notes to the Consolidated Financial Statements All amounts in millions of Euros unless otherwise indicated. The accompanying notes are an integral part of the consolidated financial statements. Note 1 - Summary of significant accounting policies
� Accounting standards and basis of preparation
The consolidated financial statements for the six months ended June 30, 2012 have been prepared in accordance with IAS 34 - Interim Financial Reporting. As condensed financial statements, they do not include all the disclosures required by International Financial Reporting Standards (IFRS) and should be read in conjunction with the 2011 annual consolidated financial statements included in the Annual Report filed with the French securities regulator (AMF) under no. D.12-0198, except as regards to the differences in accounting treatment between the annual and interim financial statements described below. The interim consolidated financial statements have been prepared in compliance with the international accounting standards adopted by the European Union as of June 30, 2012. The same accounting methods were used as for the consolidated financial statements for the year ended December 31, 2011. The new following standards and interpretations that were applicable during the period did not have a material impact on the consolidated financial statements for the six months ended June 30, 2012:
- IFRS 7 – Disclosures – Transfer of Financial assets. There are no differences in practice between the standards applied by Schneider Electric as of June 30, 2012 and the IFRS issued by the International Accounting Standards Board (IASB), since the application of standards and interpretations that are mandatory in the IASB standards for reporting periods beginning on or after January 1, 2012 but not yet adopted by the European Union would not have a material impact. Lastly, the Group has not applied the following standards and interpretations that have not yet been adopted by the European Union or that are applicable after June 30, 2012: • Standards adopted
- amendment to IAS 1 – Presentation of Items of Other Comprehensive Income; - IAS 19 revised – Employee benefits;
• Standards not yet adopted - amendment to IAS 12 – Recovery of Underlying Assets; - IAS 28 revised – Investments in associates and joint-ventures; - amendments to IAS 32 – Offsetting Financial assets and Financial liabilities; - amendments to IFRS 7 – Disclosures – Transfer of Financial assets; - IFRS 9 – Financial instruments; - IFRS 10 – Consolidated Financial Statements; - IFRS 11 – Joint Arrangements; - IFRS 12 – Disclosure of Interests in Other entities; - IFRS 13 – Fair value Measurement; - Transition Guidance (Amendments to IFRS 10, IFRS 11 and IFRS 12); - amendment to IFRS 1 – Severe Hyperinflation and Removal of Fixed dates for First-Time Adopters; - Improvements to IFRSs 2009-2011 (May 2012); - IFRIC 20 – Stripping Costs in the Production Phase of a Surface Mine.
Schneider Electric is currently assessing their potential impact on the Group’s consolidated financial statements. At this stage of analysis, the Group does not expect the impact on its consolidated financial statements to be material, except for IFRS 10 and IFRS 11 for which impacts are being assessed, notably on entities currently consolidated with proportional consolidation, and except for IFRS 9 due to uncertainties surrounding the adoption process in Europe.
� Impairment of assets There were no indications of impairment at June 30, 2012. As a result, no impairment tests were performed as of this date.
Schneider Electric – Half year financial report as at June 30, 2012 10
� Seasonal variations Seasonal variations can affect the level of revenue from one quarter to another. For this reason the interim financial results are not necessarily indicative of the Group’s expected full year performance.
� Income tax expense Current and deferred taxes for interim periods are calculated by applying the estimated average effective tax rate for the current year to pre-tax profit for the period. Note 2 - Changes in the scope of consolidation 2.1 Additions and removals
� Acquisitions of the period Schneider Electric finalized on June 12, 2012, the acquisition of M&C Energy Group (“M&C”), based in the United Kingdom, a fast-growing company specialized in energy procurement and sustainability services for both multinationals and small to medium sized enterprises. On June 30, 2012, M&C has not yet been included in consolidation scope and will be consolidated from July 1, 2012. 2.2 Impact of changes in the scope of consolidation
� Follow-up on 2011 acquisitions
In accordance with IFR3 R, Schneider Electric valued the assets acquired and liabilities assumed at their fair value on the date of acquisition. The final allocation of the acquisition of Summit Energy (April 14, 2011), of DIGILINK (May 13, 2011), and of Luminous (June 1, 2011), led principally to the recognition of intangible assets in the amount of €84 million (technology, backlog, inventories and customer relationships) and to revaluations of property, plant and equipment in the amount of €5 million; these assets were valued by independent experts. Contingent liabilities and indemnification assets were recognized for respectively a total amount of €15 million and €3 million. The goodwill is not tax-deductible. The update of provisional allocation from acquisitions of Steck (July 20, 2011) of Telvent (August 31, 2011) and of Leader & Harvest (October 11, 2011) led principally to the recognition of intangible assets in the amount of €362 million (technology, backlog, inventories and customer relationships) and to revaluations of property, plant and equipment in the amount of €12 million; these assets were valued by independent experts. Contingent liabilities were recognized for a total amount of €87 million. The goodwill is not tax-deductible. On June 30, 2012, the main elements of the provisional computation are: • contingent liabilities, since the identification of risks is not completed; • tangible assets, because the estimated fair value of these assets is in progress; • intangible assets, because the assumptions used to value these assets will be refined in 2012. � Impact on cash
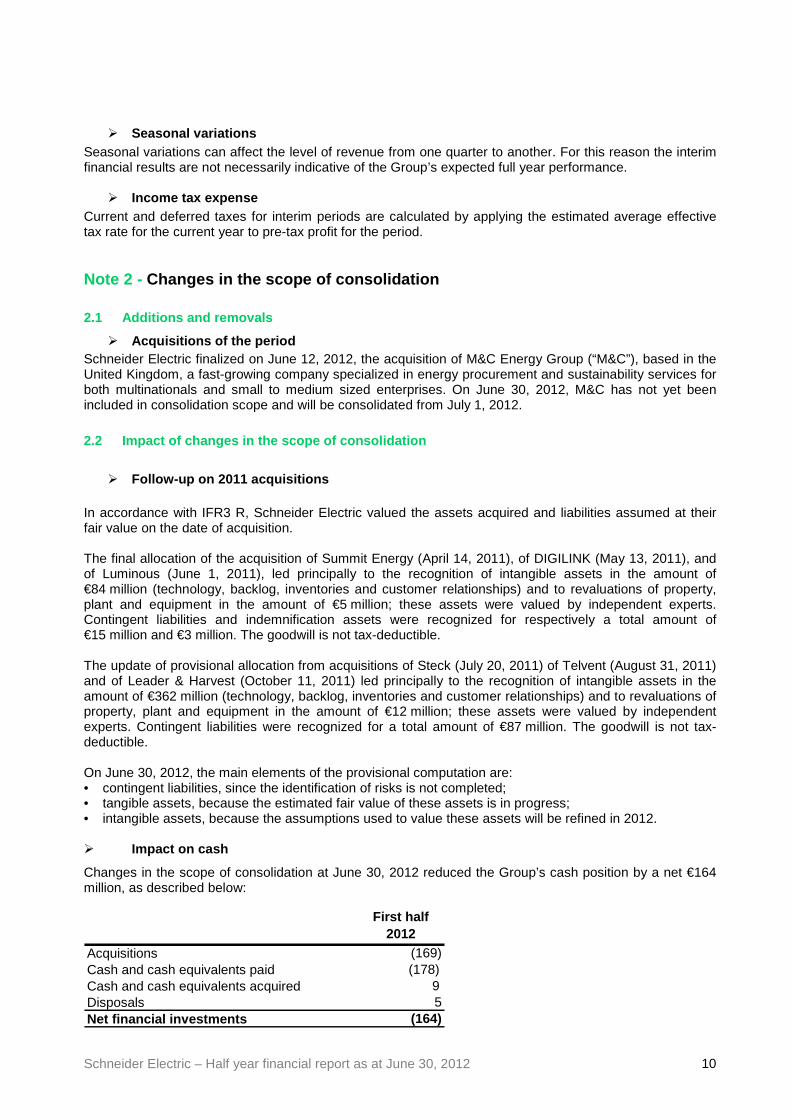
Changes in the scope of consolidation at June 30, 2012 reduced the Group’s cash position by a net €164 million, as described below:
First half 2012
Acquisitions (169)Cash and cash equivalents paid (178)Cash and cash equivalents acquired 9Disposals 5Net financial investments (164)
Schneider Electric – Half year financial report as at June 30, 2012 11
The cash paid for acquisitions is mainly related to M&C. Note 3 - Segment information
The Group is organized into five Businesses (Power, Energy, Industry, IT and Buildings). The five Businesses are: • Power , which includes the activities of Low Voltage (electrical distribution), LifeSpace (wiring devices
and associated interface devices) and Renewables (conversion and connection to the grid); the business is in charge of the end-customer segments Residential and Marine when it relates to solutions integrating the offers of several activities from the Group;
• Infrastructure , combines all Medium Voltage activities including those from Areva Distribution, as well as Telvent; the business is in charge of the end-customer segments Oil and Gas, Electric Utilities and Transportation when it relates to solutions integrating the offers of several activities from the Group;
• Industry , which includes Automation & Control and four end-customer segments: OEMs, Water, Mining Minerals & Metals and Food & Beverages when it relates to solutions integrating the offers of several activities from the Group, as well as Custom Sensors & Technologies business (Sensors & Automotives);
• IT, which covers Critical Power & Cooling Services and three end-customer segments (Bank & Insurance, IT industry and Cloud & Telecom) when it relates to solutions integrating the offers of several activities from the Group;
• Buildings , which includes Building Automation and Security and the end-customer segments Hotels/Retail, Healthcare, Life Sciences, Real Estate and Government/Education.
Data concerning General Management that cannot be allocated to a particular segment are presented under “Corporate costs”. Operating segment data is identical to that presented to the Management Board, which has been identified as the main decision-making body for allocating resources and evaluating segment performance. Performance assessments used by the Management Board are notably based on Adjusted EBITA. Share-based payment is presented under “Corporate costs”. The Management Board does not review assets and liabilities by Business. The same accounting principles governing the consolidated financial statements apply to segment data. Details are provided in the Business Review.
Schneider Electric – Half year financial report as at June 30, 2012 12
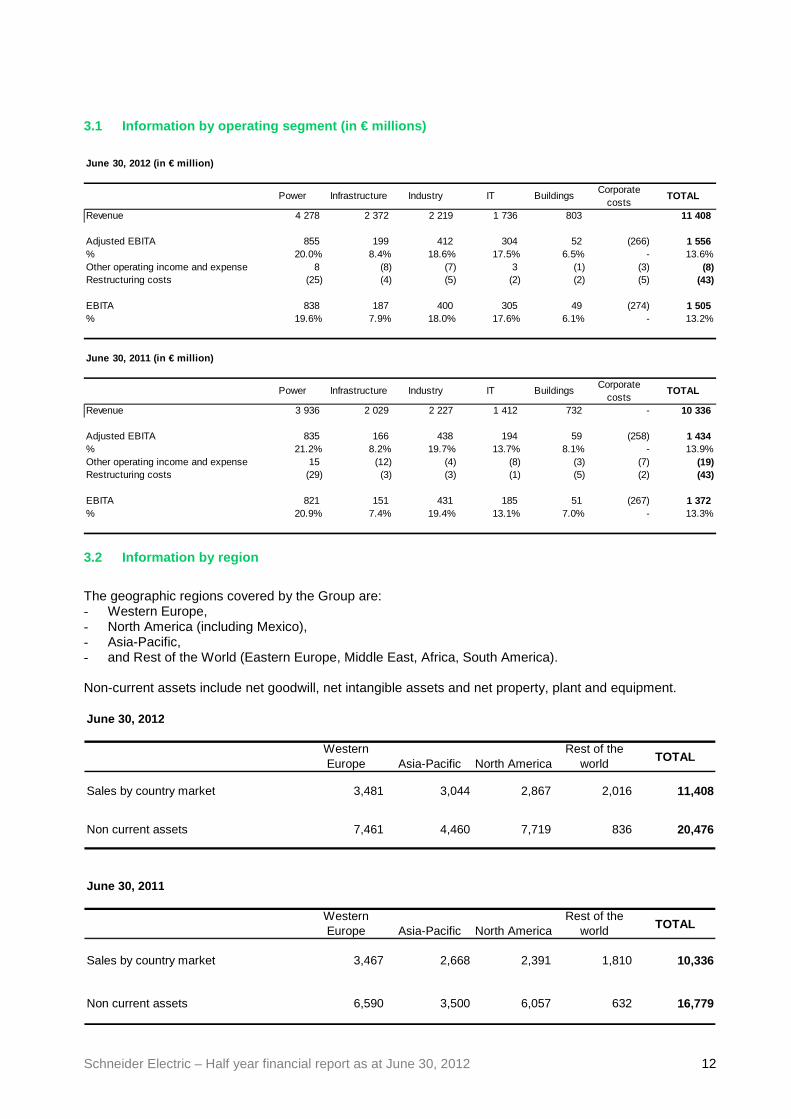
3.1 Information by operating segment (in € millions )
June 30, 2012 (in € million)
Power Infrastructure Industry IT BuildingsCorporate
costsTOTAL
Revenue 4 278 2 372 2 219 1 736 803 11 408
Adjusted EBITA 855 199 412 304 52 (266) 1 556% 20.0% 8.4% 18.6% 17.5% 6.5% - 13.6%Other operating income and expense 8 (8) (7) 3 (1) (3) (8)Restructuring costs (25) (4) (5) (2) (2) (5) (43)
EBITA 838 187 400 305 49 (274) 1 505% 19.6% 7.9% 18.0% 17.6% 6.1% - 13.2%
June 30, 2011 (in € million)
Power Infrastructure Industry IT BuildingsCorporate
costsTOTAL
Revenue 3 936 2 029 2 227 1 412 732 - 10 336
Adjusted EBITA 835 166 438 194 59 (258) 1 434% 21.2% 8.2% 19.7% 13.7% 8.1% - 13.9%Other operating income and expense 15 (12) (4) (8) (3) (7) (19)Restructuring costs (29) (3) (3) (1) (5) (2) (43)
EBITA 821 151 431 185 51 (267) 1 372% 20.9% 7.4% 19.4% 13.1% 7.0% - 13.3%
3.2 Information by region
The geographic regions covered by the Group are: - Western Europe, - North America (including Mexico), - Asia-Pacific, - and Rest of the World (Eastern Europe, Middle East, Africa, South America). Non-current assets include net goodwill, net intangible assets and net property, plant and equipment. June 30, 2012
Western Europe Asia-Pacific North America
Rest of the world TOTAL
Sales by country market 3,481 3,044 2,867 2,016 11,408
Non current assets 7,461 4,460 7,719 836 20,476
June 30, 2011
Western Europe Asia-Pacific North America
Rest of the world TOTAL
Sales by country market 3,467 2,668 2,391 1,810 10,336
Non current assets 6,590 3,500 6,057 632 16,779
Schneider Electric – Half year financial report as at June 30, 2012 13
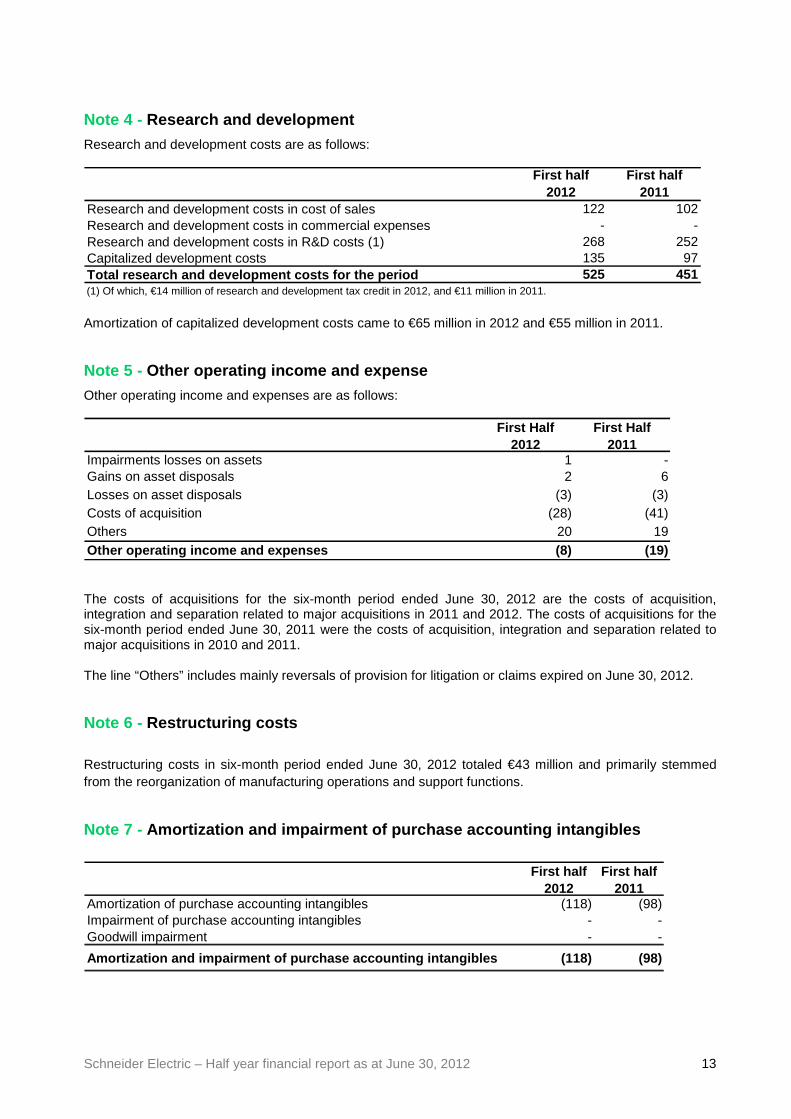
Note 4 - Research and development
Research and development costs are as follows:
First half2012
First half2011
Research and development costs in cost of sales 122 102Research and development costs in commercial expenses - -Research and development costs in R&D costs (1) 268 252Capitalized development costs 135 97Total research and development costs for the period 525 451(1) Of which, €14 million of research and development tax credit in 2012, and €11 million in 2011. Amortization of capitalized development costs came to €65 million in 2012 and €55 million in 2011. Note 5 - Other operating income and expense
Other operating income and expenses are as follows:
First Half2012
First Half2011
Impairments losses on assets 1 -Gains on asset disposals 2 6Losses on asset disposals (3) (3)Costs of acquisition (28) (41)Others 20 19Other operating income and expenses (8) (19) The costs of acquisitions for the six-month period ended June 30, 2012 are the costs of acquisition, integration and separation related to major acquisitions in 2011 and 2012. The costs of acquisitions for the six-month period ended June 30, 2011 were the costs of acquisition, integration and separation related to major acquisitions in 2010 and 2011. The line “Others” includes mainly reversals of provision for litigation or claims expired on June 30, 2012. Note 6 - Restructuring costs
Restructuring costs in six-month period ended June 30, 2012 totaled €43 million and primarily stemmed from the reorganization of manufacturing operations and support functions. Note 7 - Amortization and impairment of purchase accounting intangibles
First half
2012First half
2011Amortization of purchase accounting intangibles (118) (98)Impairment of purchase accounting intangibles - -Goodwill impairment - -
Amortization and impairment of purchase accounting intangibles (118) (98)
Schneider Electric – Half year financial report as at June 30, 2012 14
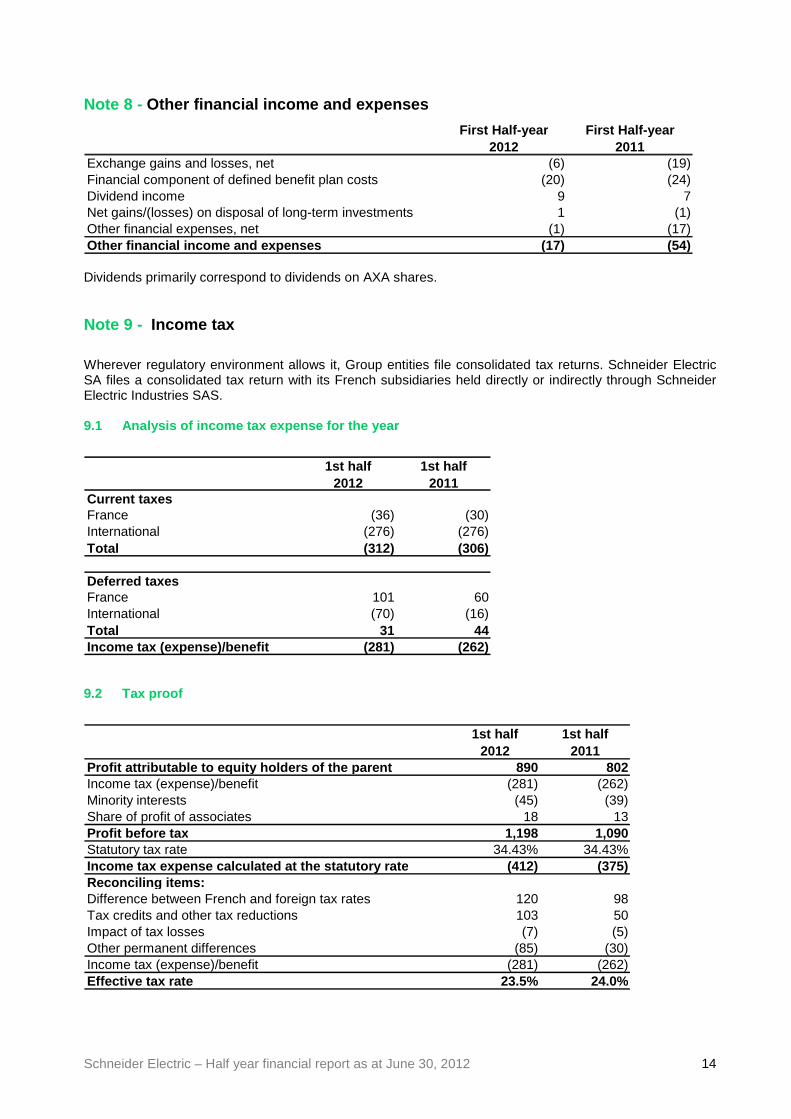
Note 8 - Other financial income and expenses
First Half-year First Half-year2012 2011
Exchange gains and losses, net (6) (19)Financial component of defined benefit plan costs (20) (24)Dividend income 9 7Net gains/(losses) on disposal of long-term investments 1 (1)Other financial expenses, net (1) (17)Other financial income and expenses (17) (54) Dividends primarily correspond to dividends on AXA shares. Note 9 - Income tax
Wherever regulatory environment allows it, Group entities file consolidated tax returns. Schneider Electric SA files a consolidated tax return with its French subsidiaries held directly or indirectly through Schneider Electric Industries SAS. 9.1 Analysis of income tax expense for the year
1st half
20121st half
2011Current taxesFrance (36) (30)International (276) (276)Total (312) (306)
Deferred taxesFrance 101 60International (70) (16)Total 31 44Income tax (expense)/benefit (281) (262) 9.2 Tax proof
1st half
20121st half
2011Profit attributable to equity holders of the parent 890 802Income tax (expense)/benefit (281) (262)Minority interests (45) (39)Share of profit of associates 18 13Profit before tax 1,198 1,090Statutory tax rate 34.43% 34.43%Income tax expense calculated at the statutory rate (412) (375)Reconciling items:Difference between French and foreign tax rates 120 98Tax credits and other tax reductions 103 50Impact of tax losses (7) (5)Other permanent differences (85) (30)Income tax (expense)/benefit (281) (262)Effective tax rate 23.5% 24.0%
Schneider Electric – Half year financial report as at June 30, 2012 15
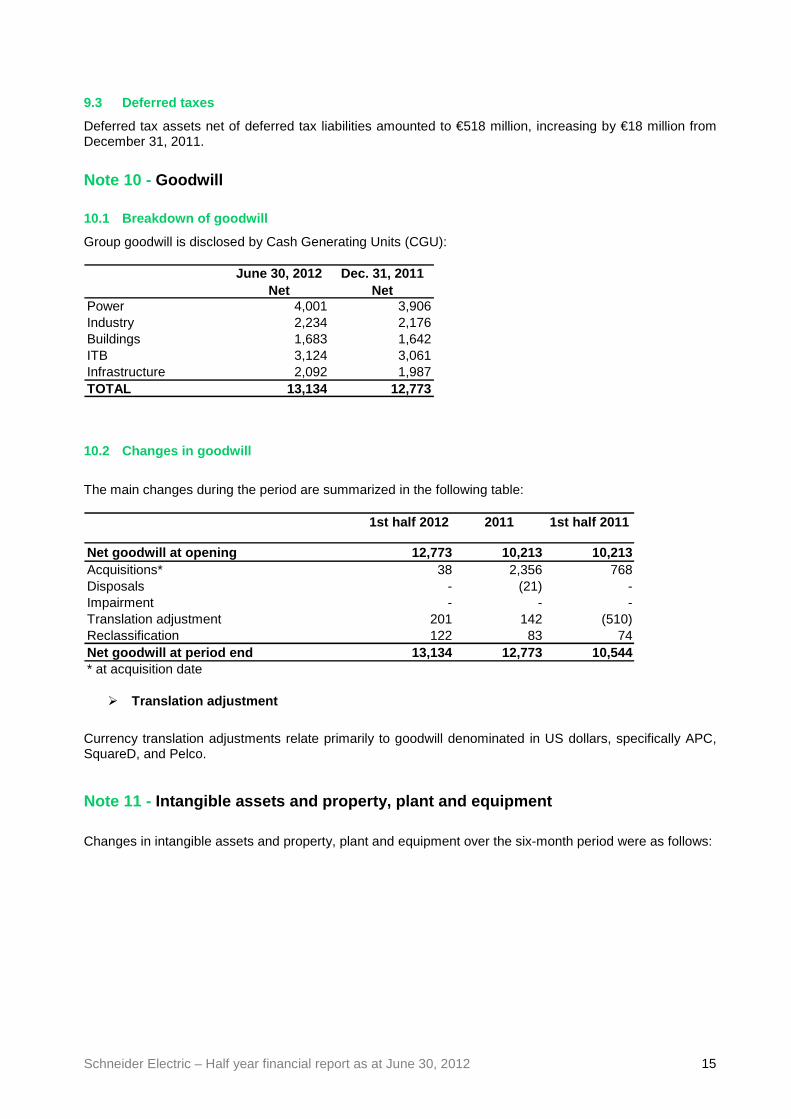
9.3 Deferred taxes
Deferred tax assets net of deferred tax liabilities amounted to €518 million, increasing by €18 million from December 31, 2011.
Note 10 - Goodwill 10.1 Breakdown of goodwill
Group goodwill is disclosed by Cash Generating Units (CGU):
June 30, 2012Net
Dec. 31, 2011Net
Power 4,001 3,906Industry 2,234 2,176Buildings 1,683 1,642ITB 3,124 3,061Infrastructure 2,092 1,987TOTAL 13,134 12,773 10.2 Changes in goodwill
The main changes during the period are summarized in the following table:
1st half 2012 2011 1st half 2011
Net goodwill at opening 12,773 10,213 10,213Acquisitions* 38 2,356 768Disposals - (21) -Impairment - - -Translation adjustment 201 142 (510)Reclassification 122 83 74Net goodwill at period end 13,134 12,773 10,544* at acquisition date
� Translation adjustment
Currency translation adjustments relate primarily to goodwill denominated in US dollars, specifically APC, SquareD, and Pelco. Note 11 - Intangible assets and property, plant and equipment
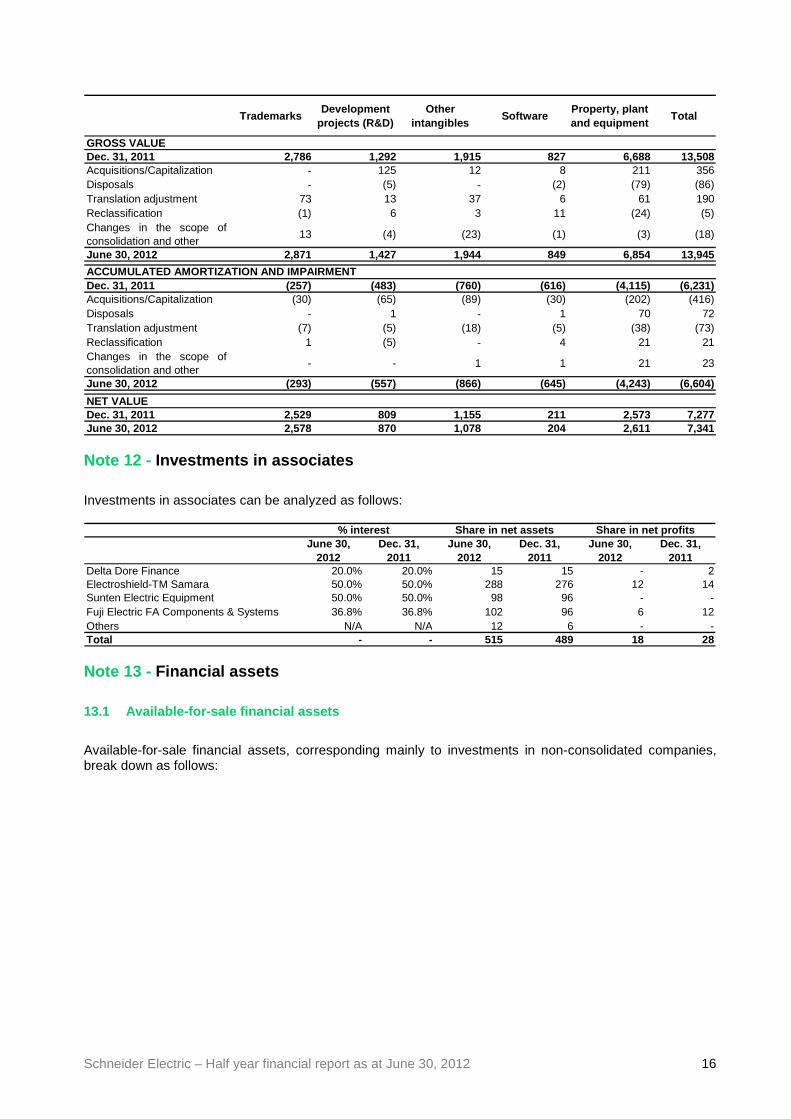
Changes in intangible assets and property, plant and equipment over the six-month period were as follows:
Schneider Electric – Half year financial report as at June 30, 2012 16
TrademarksDevelopment
projects (R&D)Other
intangiblesSoftware
Property, plant and equipment
Total
GROSS VALUEDec. 31, 2011 2,786 1,292 1,915 827 6,688 13,508Acquisitions/Capitalization - 125 12 8 211 356Disposals - (5) - (2) (79) (86)Translation adjustment 73 13 37 6 61 190Reclassification (1) 6 3 11 (24) (5)Changes in the scope ofconsolidation and other
13 (4) (23) (1) (3) (18)
June 30, 2012 2,871 1,427 1,944 849 6,854 13,945
Dec. 31, 2011 (257) (483) (760) (616) (4,115) (6,231)Acquisitions/Capitalization (30) (65) (89) (30) (202) (416)Disposals - 1 - 1 70 72Translation adjustment (7) (5) (18) (5) (38) (73)Reclassification 1 (5) - 4 21 21Changes in the scope ofconsolidation and other
- - 1 1 21 23
June 30, 2012 (293) (557) (866) (645) (4,243) (6,604)
NET VALUEDec. 31, 2011 2,529 809 1,155 211 2,573 7,277June 30, 2012 2,578 870 1,078 204 2,611 7,341
ACCUMULATED AMORTIZATION AND IMPAIRMENT
Note 12 - Investments in associates
Investments in associates can be analyzed as follows:
June 30, 2012
Dec. 31, 2011
June 30, 2012
Dec. 31, 2011
June 30, 2012
Dec. 31, 2011
Delta Dore Finance 20.0% 20.0% 15 15 - 2Electroshield-TM Samara 50.0% 50.0% 288 276 12 14Sunten Electric Equipment 50.0% 50.0% 98 96 - -Fuji Electric FA Components & Systems 36.8% 36.8% 102 96 6 12Others N/A N/A 12 6 - -Total - - 515 489 18 28
% interest Share in net assets Share in net profits
Note 13 - Financial assets
13.1 Available-for-sale financial assets
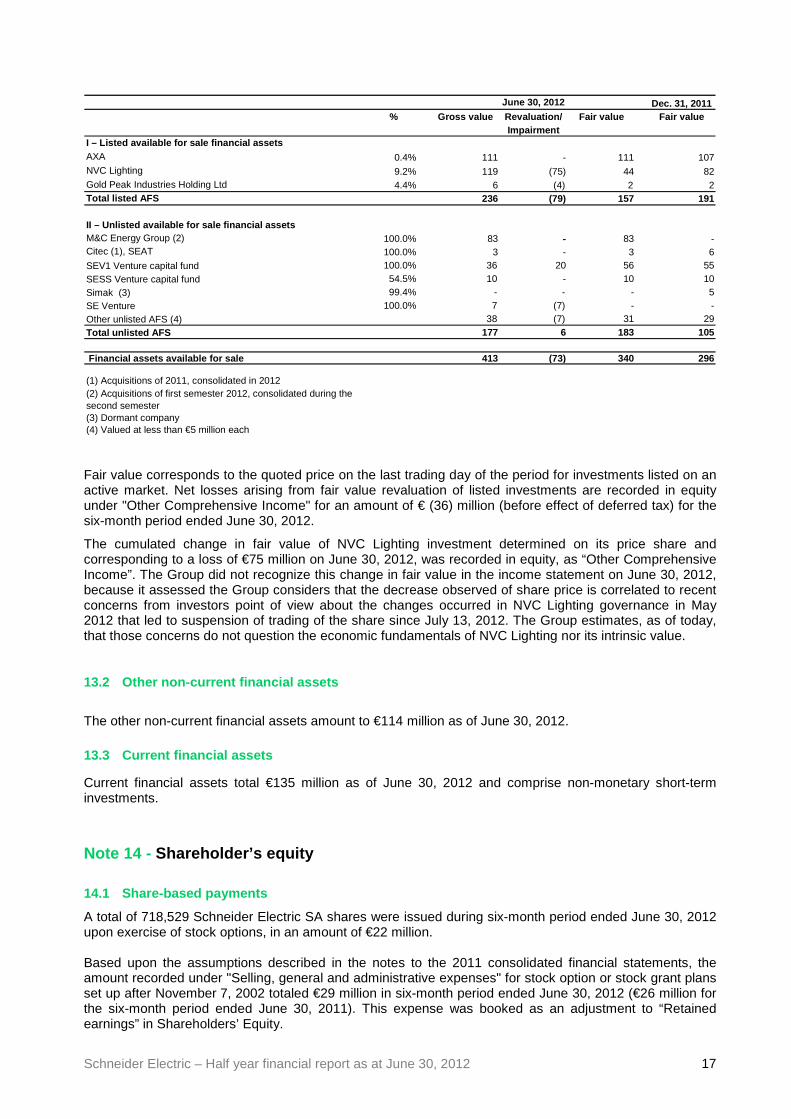
Available-for-sale financial assets, corresponding mainly to investments in non-consolidated companies, break down as follows:
Schneider Electric – Half year financial report as at June 30, 2012 17
Dec. 31, 2011% Gross value Revaluation/ Fair value Fair value
ImpairmentI – Listed available for sale financial assetsAXA 0.4% 111 - 111 107NVC Lighting 9.2% 119 (75) 44 82Gold Peak Industries Holding Ltd 4.4% 6 (4) 2 2Total listed AFS 236 (79) 157 191
II – Unlisted available for sale financial assetsM&C Energy Group (2) 100.0% 83 - 83 -Citec (1), SEAT 100.0% 3 - 3 6SEV1 Venture capital fund 100.0% 36 20 56 55SESS Venture capital fund 54.5% 10 - 10 10Simak (3) 99.4% - - - 5SE Venture 100.0% 7 (7) - -Other unlisted AFS (4) 38 (7) 31 29Total unlisted AFS 177 6 183 105
Financial assets available for sale 413 (73) 340 296
(1) Acquisitions of 2011, consolidated in 2012(2) Acquisitions of first semester 2012, consolidated during the second semester(3) Dormant company(4) Valued at less than €5 million each
June 30, 2012
Fair value corresponds to the quoted price on the last trading day of the period for investments listed on an active market. Net losses arising from fair value revaluation of listed investments are recorded in equity under "Other Comprehensive Income" for an amount of € (36) million (before effect of deferred tax) for the six-month period ended June 30, 2012.
The cumulated change in fair value of NVC Lighting investment determined on its price share and corresponding to a loss of €75 million on June 30, 2012, was recorded in equity, as “Other Comprehensive Income”. The Group did not recognize this change in fair value in the income statement on June 30, 2012, because it assessed the Group considers that the decrease observed of share price is correlated to recent concerns from investors point of view about the changes occurred in NVC Lighting governance in May 2012 that led to suspension of trading of the share since July 13, 2012. The Group estimates, as of today, that those concerns do not question the economic fundamentals of NVC Lighting nor its intrinsic value.
13.2 Other non-current financial assets
The other non-current financial assets amount to €114 million as of June 30, 2012.
13.3 Current financial assets
Current financial assets total €135 million as of June 30, 2012 and comprise non-monetary short-term investments.
Note 14 - Shareholder’s equity
14.1 Share-based payments
A total of 718,529 Schneider Electric SA shares were issued during six-month period ended June 30, 2012 upon exercise of stock options, in an amount of €22 million. Based upon the assumptions described in the notes to the 2011 consolidated financial statements, the amount recorded under "Selling, general and administrative expenses" for stock option or stock grant plans set up after November 7, 2002 totaled €29 million in six-month period ended June 30, 2012 (€26 million for the six-month period ended June 30, 2011). This expense was booked as an adjustment to “Retained earnings” in Shareholders’ Equity.
Schneider Electric – Half year financial report as at June 30, 2012 18
14.2 Worldwide Employee Stock Purchase Plan
Schneider Electric gives its employees the opportunity to become group shareholders thanks to employee share issues. Employees in countries that meet legal and fiscal requirements have the choice between a classic and a leveraged plan.
Under the classic plan , employees may purchase Schneider Electric shares at a 15% to 20% discount to the price quoted for the shares on the stock market. Employees must then hold their shares for five years, except in certain cases provided for by law. The share-based payment expense recorded in accordance with IFRS 2 is measured by reference to the fair value of the discount on the locked-up shares. The lock-up cost is determined on the basis of a two-step strategy that involves first selling the locked-up shares on the forward market and then purchasing the same number of shares on the spot market (i.e., shares that may be sold at any time) using a bullet loan.
This strategy is designed to reflect the cost the employee would incur during the lock-up period to avoid the risk of carrying the shares subscribed under the classic plan. The borrowing cost corresponds to the cost of borrowing for the employees concerned, as they are the sole potential buyers in this market. It is based on the average interest rate charged by banks for an ordinary, non-revolving personal loan with a maximum maturity of five years granted to an individual with an average credit rating.
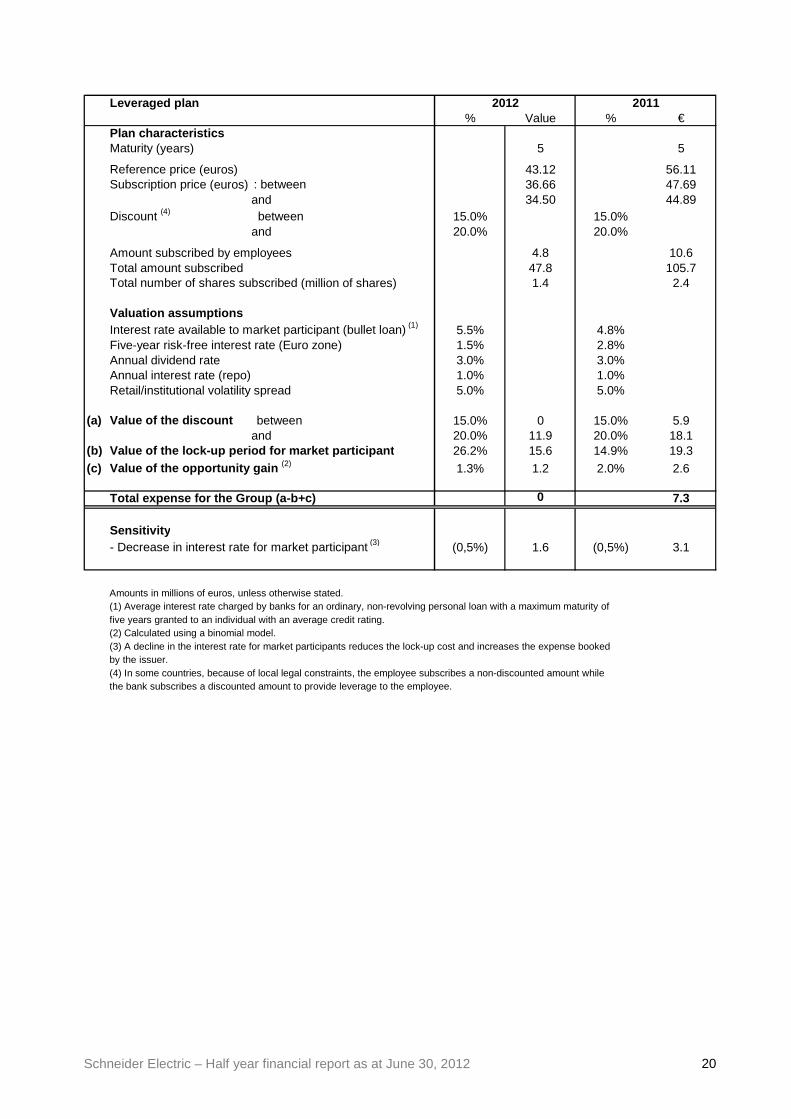
Under the leveraged plan, employees may also purchase Schneider Electric shares at a 15% to 20% discount from the price quoted on the stock market. However, the leveraged plan offers a different yield profile as a third-party bank tops up the employee's initial investment, essentially multiplying the amount paid by the employee. The total is invested in Schneider Electric shares at a preferential price. The bank converts the discount transferred by the employee into funds with a view to securing the yield for the employee and increasing the indexation on a leveraged number (factor of 4.4 in 2012) of directly subscribed shares.
As with the classic plan, the share-based payment expense is determined by reference to the fair value of the discount on the locked-up shares (see above). In addition, it includes the value of the benefit corresponding to the issuer’s involvement in the plan, which means that employees have access to share prices with a volatility profile adapted to institutional investors rather than to the prices and volatility profile they would have been offered if they had purchased the shares through their retail banks. The volatility differential is treated as a discount equivalent that reflects the opportunity gain offered to employees under the leveraged plan.
As regards the first semester 2012, Schneider Electric gave its employees the opportunity to purchase shares at a price of €36.66 or €34.50 per share, depending on the country, as part of its commitment to employee share ownership, on June 14, 2012. This represented a 15% to 20% discount to the reference price of €43.12 calculated as the average opening price quoted for the share during the 20 days preceding the Management Board’s decision to launch the employee share issue.
Altogether, 3.5 million shares were subscribed, increasing the Company’s capital by €124 million as of July 19, 2012. Due to significant changes in valuation assumptions, specifically the interest rate available to market participant, the value of the lock-up period is higher than the discount cost. Therefore the Group did not recognize any cost related to the transaction.
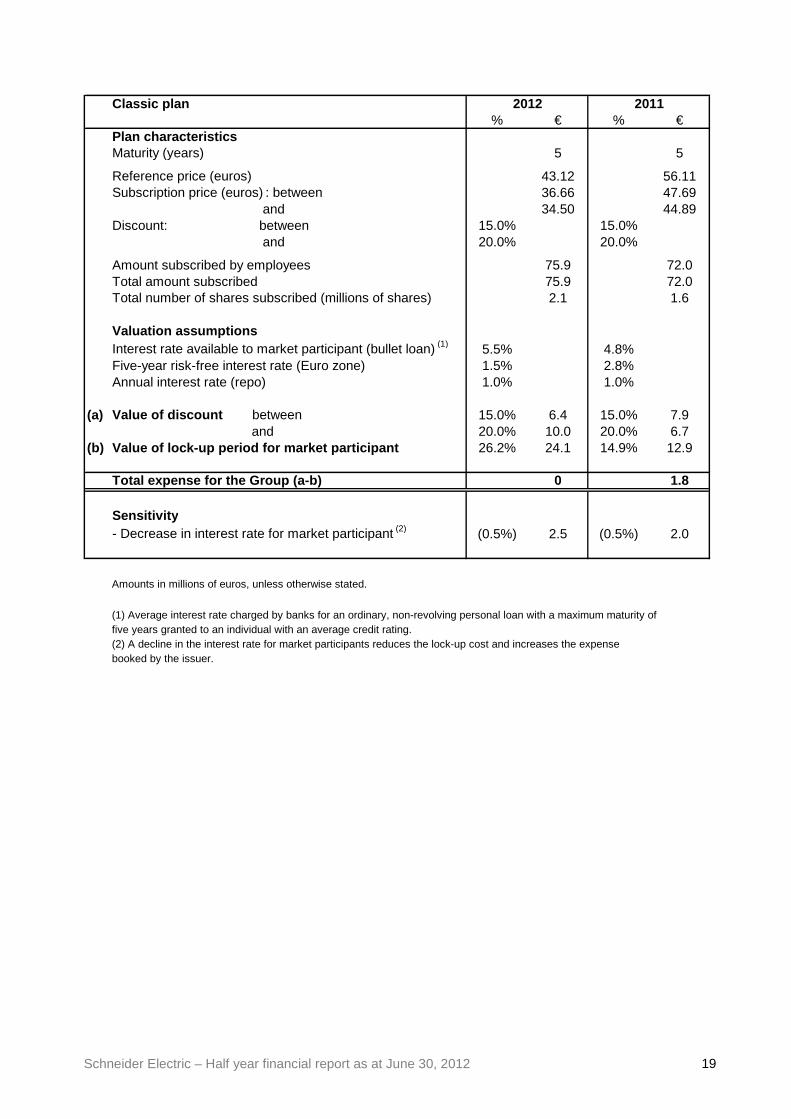
The tables below summarize the main characteristics of the plans, the amounts subscribed, the valuation assumptions and the plans’ cost for 2012 and 2011.
Schneider Electric – Half year financial report as at June 30, 2012 19
Classic plan% € % €
Plan characteristicsMaturity (years) 5 5
Reference price (euros) 43.12 56.11Subscription price (euros) : between 36.66 47.69 and 34.50 44.89Discount: between 15.0% 15.0% and 20.0% 20.0%
Amount subscribed by employees 75.9 72.0Total amount subscribed 75.9 72.0Total number of shares subscribed (millions of shares) 2.1 1.6
Valuation assumptionsInterest rate available to market participant (bullet loan) (1) 5.5% 4.8%Five-year risk-free interest rate (Euro zone) 1.5% 2.8%Annual interest rate (repo) 1.0% 1.0%
(a) Value of discount between 15.0% 6.4 15.0% 7.9 and 20.0% 10.0 20.0% 6.7
(b) Value of lock-up period for market participant 26.2% 24.1 14.9% 12.9
Total expense for the Group (a-b) 0 1.8
Sensitivity- Decrease in interest rate for market participant (2) (0.5%) 2.5 (0.5%) 2.0
Amounts in millions of euros, unless otherwise stated.
(1) Average interest rate charged by banks for an ordinary, non-revolving personal loan with a maximum maturity of five years granted to an individual with an average credit rating.(2) A decline in the interest rate for market participants reduces the lock-up cost and increases the expense booked by the issuer.
2012 2011
Schneider Electric – Half year financial report as at June 30, 2012 20
Leveraged plan% Value % €
Plan characteristicsMaturity (years) 5 5
Reference price (euros) 43.12 56.11Subscription price (euros) : between 36.66 47.69 and 34.50 44.89Discount (4) between 15.0% 15.0% and 20.0% 20.0%
Amount subscribed by employees 4.8 10.6Total amount subscribed 47.8 105.7Total number of shares subscribed (million of shares) 1.4 2.4
Valuation assumptionsInterest rate available to market participant (bullet loan) (1) 5.5% 4.8%Five-year risk-free interest rate (Euro zone) 1.5% 2.8%Annual dividend rate 3.0% 3.0%Annual interest rate (repo) 1.0% 1.0%Retail/institutional volatility spread 5.0% 5.0%
(a) Value of the discount between 15.0% 0 15.0% 5.9 and 20.0% 11.9 20.0% 18.1
(b) Value of the lock-up period for market participant 26.2% 15.6 14.9% 19.3(c) Value of the opportunity gain (2) 1.3% 1.2 2.0% 2.6
Total expense for the Group (a-b+c) 0 7.3
Sensitivity- Decrease in interest rate for market participant (3) (0,5%) 1.6 (0,5%) 3.1
Amounts in millions of euros, unless otherwise stated.(1) Average interest rate charged by banks for an ordinary, non-revolving personal loan with a maximum maturity of five years granted to an individual with an average credit rating.(2) Calculated using a binomial model.(3) A decline in the interest rate for market participants reduces the lock-up cost and increases the expense booked by the issuer.(4) In some countries, because of local legal constraints, the employee subscribes a non-discounted amount while the bank subscribes a discounted amount to provide leverage to the employee.
2012 2011
Schneider Electric – Half year financial report as at June 30, 2012 21
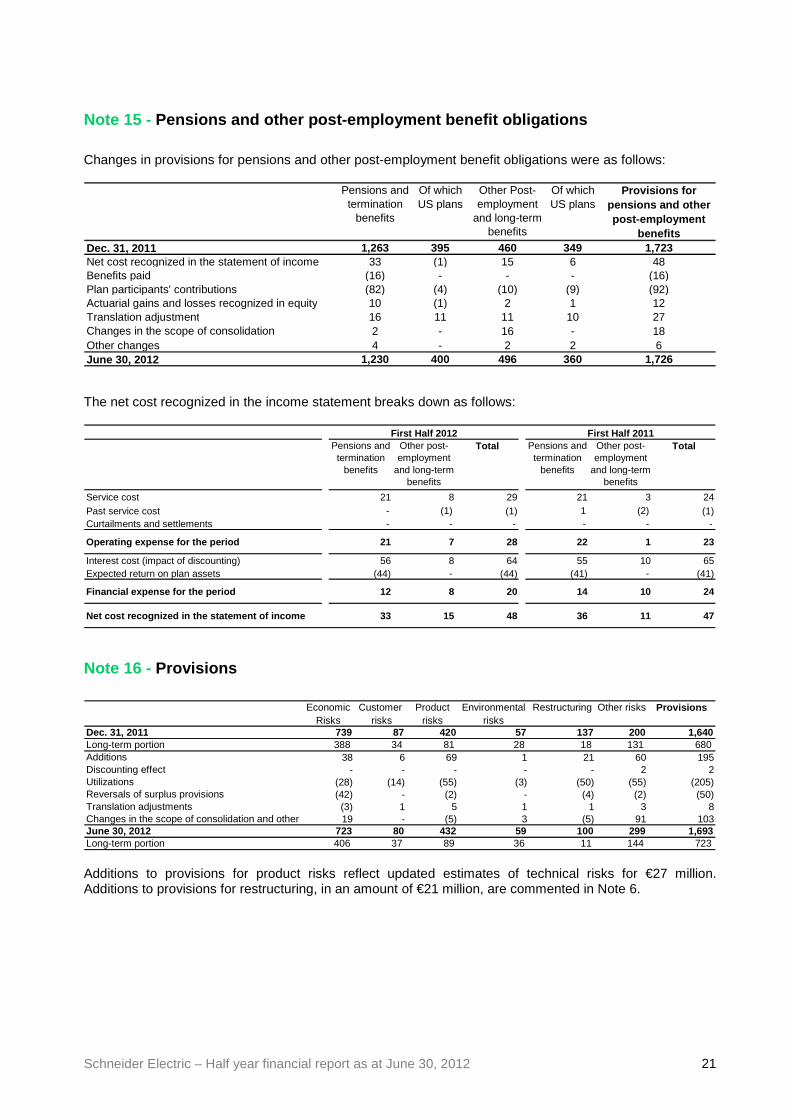
Note 15 - Pensions and other post-employment benefit obligati ons
Changes in provisions for pensions and other post-employment benefit obligations were as follows:
Pensions and termination
benefits
Of which US plans
Other Post-employment
and long-term benefits
Of which US plans
Provisions for pensions and other post-employment
benefitsDec. 31, 2011 1,263 395 460 349 1,723Net cost recognized in the statement of income 33 (1) 15 6 48Benefits paid (16) - - - (16)Plan participants' contributions (82) (4) (10) (9) (92)Actuarial gains and losses recognized in equity 10 (1) 2 1 12Translation adjustment 16 11 11 10 27Changes in the scope of consolidation 2 - 16 - 18Other changes 4 - 2 2 6June 30, 2012 1,230 400 496 360 1,726 The net cost recognized in the income statement breaks down as follows:
Pensions and termination
benefits
Other post-employment
and long-term benefits
Total Pensions and termination
benefits
Other post-employment
and long-term benefits
Total
Service cost 21 8 29 21 3 24Past service cost - (1) (1) 1 (2) (1)Curtailments and settlements - - - - - -
Operating expense for the period 21 7 28 22 1 23
Interest cost (impact of discounting) 56 8 64 55 10 65Expected return on plan assets (44) - (44) (41) - (41)
Financial expense for the period 12 8 20 14 10 24
Net cost recognized in the statement of income 33 15 4 8 36 11 47
First Half 2011First Half 2012
Note 16 - Provisions
Economic Customer Product Environmental Restructuring Other risks Provisions
Risks risks risks risksDec. 31, 2011 739 87 420 57 137 200 1,640Long-term portion 388 34 81 28 18 131 680Additions 38 6 69 1 21 60 195Discounting effect - - - - - 2 2Utilizations (28) (14) (55) (3) (50) (55) (205)Reversals of surplus provisions (42) - (2) - (4) (2) (50)Translation adjustments (3) 1 5 1 1 3 8Changes in the scope of consolidation and other 19 - (5) 3 (5) 91 103June 30, 2012 723 80 432 59 100 299 1,693Long-term portion 406 37 89 36 11 144 723 Additions to provisions for product risks reflect updated estimates of technical risks for €27 million. Additions to provisions for restructuring, in an amount of €21 million, are commented in Note 6.
Schneider Electric – Half year financial report as at June 30, 2012 22
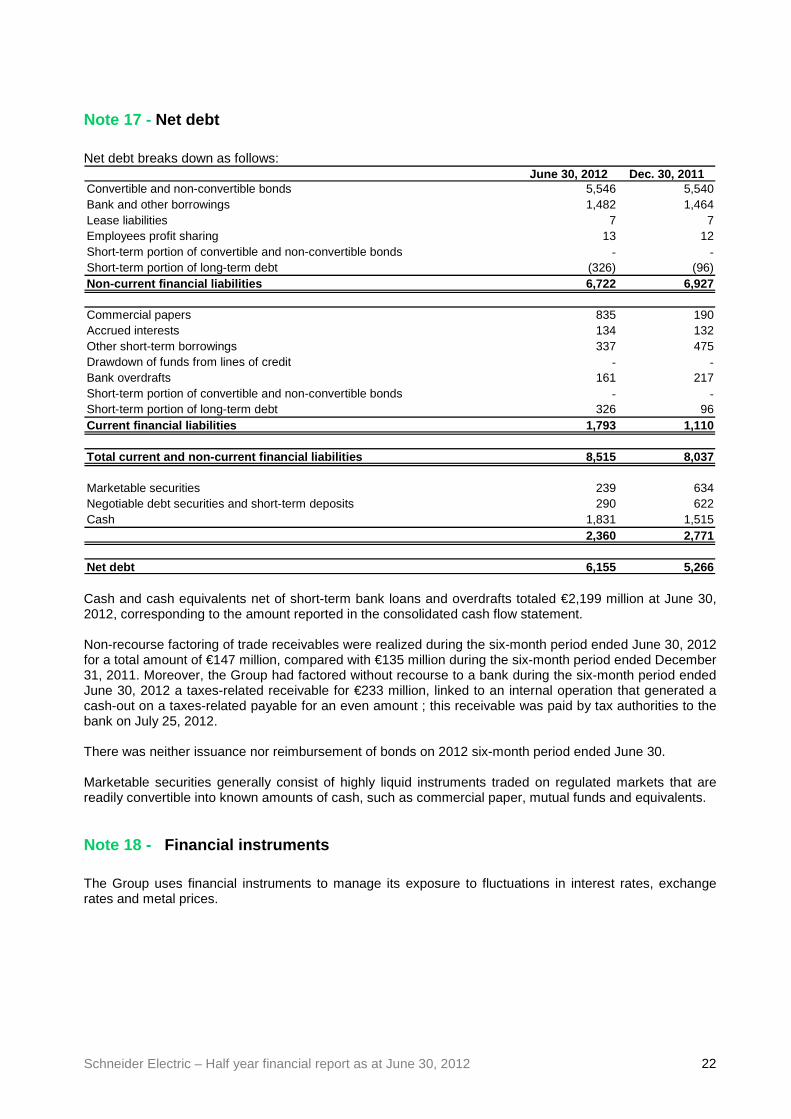
Note 17 - Net debt Net debt breaks down as follows:
June 30, 2012 Dec. 30, 2011Convertible and non-convertible bonds 5,546 5,540Bank and other borrowings 1,482 1,464Lease liabilities 7 7Employees profit sharing 13 12Short-term portion of convertible and non-convertible bonds - -Short-term portion of long-term debt (326) (96)Non-current financial liabilities 6,722 6,927
Commercial papers 835 190Accrued interests 134 132Other short-term borrowings 337 475Drawdown of funds from lines of credit - -Bank overdrafts 161 217Short-term portion of convertible and non-convertible bonds - -Short-term portion of long-term debt 326 96Current financial liabilities 1,793 1,110
Total current and non-current financial liabilities 8,515 8,037
Marketable securities 239 634Negotiable debt securities and short-term deposits 290 622Cash 1,831 1,515
2,360 2,771
Net debt 6,155 5,266 Cash and cash equivalents net of short-term bank loans and overdrafts totaled €2,199 million at June 30, 2012, corresponding to the amount reported in the consolidated cash flow statement. Non-recourse factoring of trade receivables were realized during the six-month period ended June 30, 2012 for a total amount of €147 million, compared with €135 million during the six-month period ended December 31, 2011. Moreover, the Group had factored without recourse to a bank during the six-month period ended June 30, 2012 a taxes-related receivable for €233 million, linked to an internal operation that generated a cash-out on a taxes-related payable for an even amount ; this receivable was paid by tax authorities to the bank on July 25, 2012. There was neither issuance nor reimbursement of bonds on 2012 six-month period ended June 30. Marketable securities generally consist of highly liquid instruments traded on regulated markets that are readily convertible into known amounts of cash, such as commercial paper, mutual funds and equivalents. Note 18 - Financial instruments The Group uses financial instruments to manage its exposure to fluctuations in interest rates, exchange rates and metal prices.
Schneider Electric – Half year financial report as at June 30, 2012 23
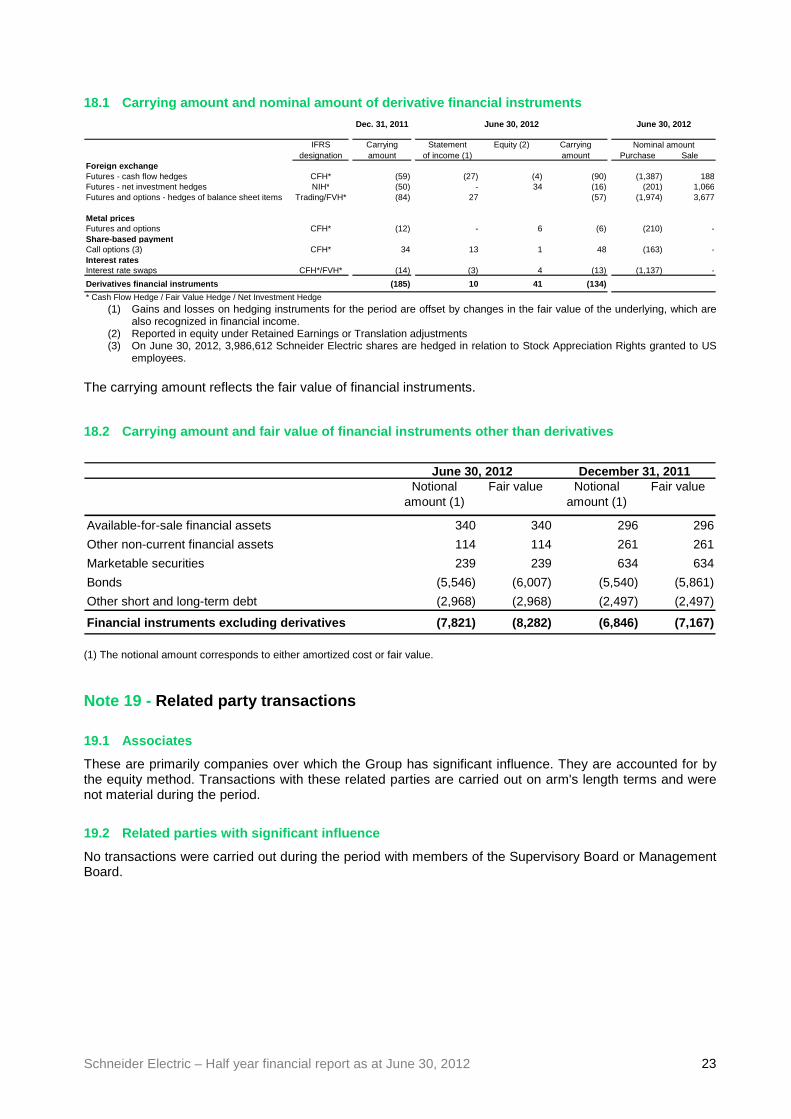
18.1 Carrying amount and nominal amount of derivati ve financial instruments
Dec. 31, 2011
IFRS Carrying Statement Equity (2) Carryingdesignation amount of income (1) amount Purchase Sale
Foreign exchangeFutures - cash flow hedges CFH* (59) (27) (4) (90) (1,387) 188Futures - net investment hedges NIH* (50) - 34 (16) (201) 1,066Futures and options - hedges of balance sheet items Trading/FVH* (84) 27 (57) (1,974) 3,677
Metal pricesFutures and options CFH* (12) - 6 (6) (210) -Share-based paymentCall options (3) CFH* 34 13 1 48 (163) -Interest ratesInterest rate swaps CFH*/FVH* (14) (3) 4 (13) (1,137) -
Derivatives financial instruments (185) 10 41 (134)
* Cash Flow Hedge / Fair Value Hedge / Net Investment Hedge
Nominal amount
June 30, 2012June 30, 2012
(1) Gains and losses on hedging instruments for the period are offset by changes in the fair value of the underlying, which are
also recognized in financial income. (2) Reported in equity under Retained Earnings or Translation adjustments (3) On June 30, 2012, 3,986,612 Schneider Electric shares are hedged in relation to Stock Appreciation Rights granted to US
employees. The carrying amount reflects the fair value of financial instruments. 18.2 Carrying amount and fair value of financial in struments other than derivatives
Notional amount (1)
Fair value Notional amount (1)
Fair value
Available-for-sale financial assets 340 340 296 296
Other non-current financial assets 114 114 261 261
Marketable securities 239 239 634 634
Bonds (5,546) (6,007) (5,540) (5,861)
Other short and long-term debt (2,968) (2,968) (2,497) (2,497)
Financial instruments excluding derivatives (7,821) ( 8,282) (6,846) (7,167)
December 31, 2011June 30, 2012
(1) The notional amount corresponds to either amortized cost or fair value. Note 19 - Related party transactions
19.1 Associates
These are primarily companies over which the Group has significant influence. They are accounted for by the equity method. Transactions with these related parties are carried out on arm's length terms and were not material during the period.
19.2 Related parties with significant influence
No transactions were carried out during the period with members of the Supervisory Board or Management Board.
Schneider Electric – Half year financial report as at June 30, 2012 24
Note 20 - Commitments and contingent liabilities 20.1 Guarantees given and received
Guarantees given and received amounted to €1,148 million and €76 million, respectively, as of June 30, 2012. 20.2 Purchase commitments
� Shares in subsidiaries and affiliates
Commitments to purchase equity investments correspond to put options given to minority shareholders in consolidated companies or relate to earn-out payments. At June 30, 2012, there is one material put related to the 26% interests in Luminous that was valued for an amount of €75 million as Other non-current liabilities. � Information technology services
The Group signed an agreement with CAPGEMINI to outsource certain European IT functions and to develop shared management applications using SAP. The first pilot version was deployed in India in April 2007 and a second version was rolled out in several European countries mid-2008. Schneider Electric capitalized development costs relating to the SAP contract in a net amount of €142 million at June 30, 2012. These costs are being amortized as from 2009 over a 7-year rolling period using an increasing-balance method based on the number of users as deployment is extended across operations. The six-month period ended June 30, 2012 expense related to this outsourcing agreement contractually amounts to €49 million (compared with €51 million in six-month period ended June 30, 2011) including volume and indexation effects provided for in the contract. 20.3 Contingent liabilities
Management is confident that balance sheet provisions for known disputes in which the Group is involved are sufficient to ensure that these disputes do not have a material impact on its financial position or profit. This is notably the case for the potential consequences of a current dispute in Belgium involving former senior executives and managers of the Group. The loan agreements related to the Group's long-term debt do not include any rating triggers. The Group has also signed an agreement concerning statutory employee training rights in France (DIF). In accordance with French national accounting board (CNC) opinion 2004-F, the related costs are treated as an expense for the period when the training is received and no provision is set aside in the periods when the training rights accrue. As of June 30, 2012, accrued rights for employees in French units corresponded to around 1,400,000 hours. Note 21 - Subsequent events
� Issuance of shares to employees
On July 19, 2011, 3.5 million shares were issued in connection with the employee share purchase program described in note 14.2, increasing the share capital by €124 million.
Schneider Electric – Half year financial report as at June 30, 2012 25
MANAGEMENT REPORT FOR THE PERIOD ENDED JUNE 30, 201 2
Consolidated financial statements
Business and Statement of Income highlights
Changes in the scope of consolidation
Acquisitions during the period
On May 4, 2012, Schneider Electric announced that it has signed an agreement to acquire M&C Energy Group (“M&C”), a fast-growing company specialized in energy procurement and sustainability services for both multinationals and small to medium sized enterprises. M&C provides its customers with energy procurement, compliance and performance optimization services mostly on recurring subscription basis. The company has more than 500 employees including 300 energy specialists and an international presence with 21 offices across 15 countries, particularly in Europe and Asia-Pacific. M&C will be consolidated in Group’s financial statements from July 1, 2012.
Acquisitions made in 2011 having an impact on the financial statements of six-month period ended June 30, 2012 *
The following companies acquired in 2011 and consolidated over the full year in 2012 had an impact on the scope of consolidation compared with 2011:
- Lee Technologies, consolidated as from April 1, 2011, - Summit Energy, consolidated as from April 14, 2011, - DIGILINK, consolidated as from May 13, 2011, - APW President Systems, consolidated as from May 19, 2011, - Luminous Power Technologies, consolidated as from June 1, 2011, - Steck Da Amazonia Industria Electrica, consolidated as from July 20, 2011, - Telvent GIT, consolidated as from August 31, 2011, - Leader & Harvest Power Technologies Holdings, consolidated as from October 11, 2011.
(*) Correspond to the dates on which the Group gained control of the acquired companies.
Exchange rate changes Fluctuations in the euro exchange rate had a positive impact in six-month period ended June 30, 2011, increasing consolidated revenue by €435 million and adjusted EBITA by €73 million, due to the depreciation of Euro against most major currencies, in particular the U.S. Dollar and the Chinese Yuan.
Schneider Electric – Half year financial report as at June 30, 2012 26
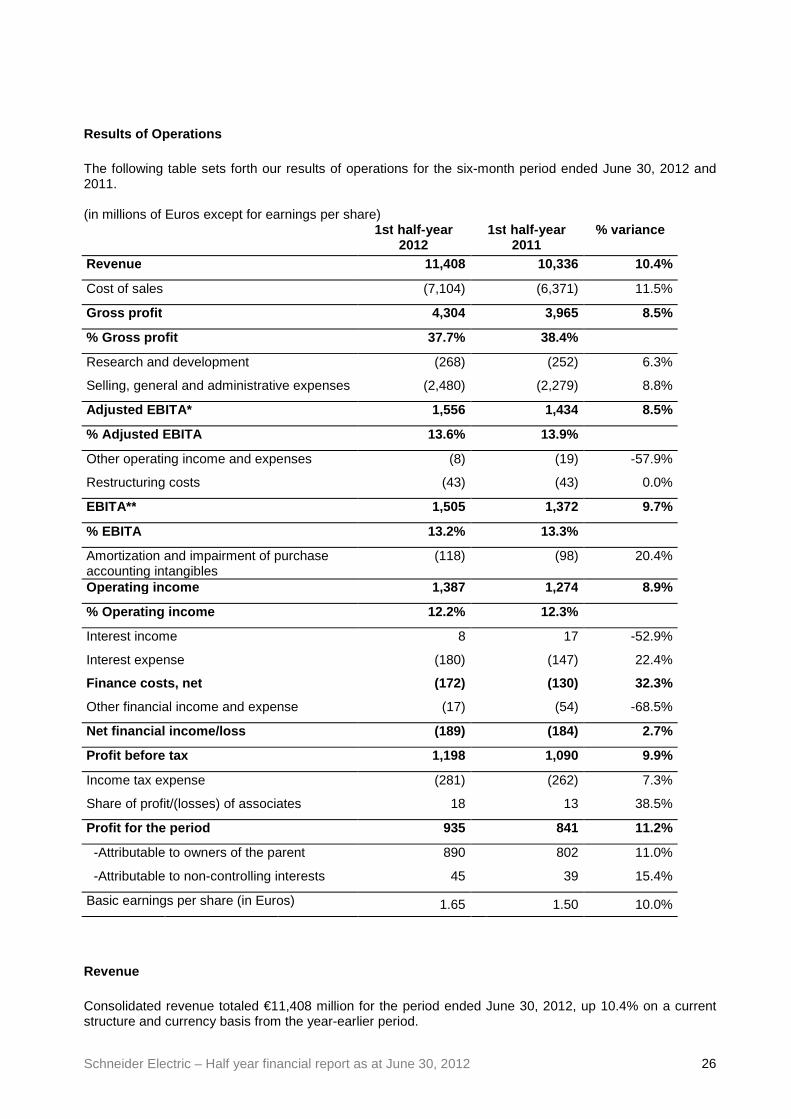
Results of Operations The following table sets forth our results of operations for the six-month period ended June 30, 2012 and 2011. (in millions of Euros except for earnings per share)
1st half -year 2012
1st half -year 2011
% variance
Revenue 11,408 10,336 10.4%
Cost of sales (7,104) (6,371) 11.5%
Gross profit 4,304 3,965 8.5%
% Gross profit 37.7% 38.4%
Research and development (268) (252) 6.3%
Selling, general and administrative expenses (2,480) (2,279) 8.8%
Adjusted EBITA* 1,556 1,434 8.5%
% Adjusted EBITA 13.6% 13.9%
Other operating income and expenses (8) (19) -57.9%
Restructuring costs (43) (43) 0.0%
EBITA** 1,505 1,372 9.7%
% EBITA 13.2% 13.3%
Amortization and impairment of purchase accounting intangibles
(118) (98) 20.4%
Operating income 1,387 1,274 8.9%
% Operating income 12.2% 12.3%
Interest income 8 17 -52.9%
Interest expense (180) (147) 22.4%
Finance costs, net (172) (130) 32.3%
Other financial income and expense (17) (54) -68.5%
Net financial income/loss (189) (184) 2.7%
Profit before tax 1,198 1,090 9.9%
Income tax expense (281) (262) 7.3%
Share of profit/(losses) of associates 18 13 38.5%
Profit for the period 935 841 11.2%
-Attributable to owners of the parent 890 802 11.0%
-Attributable to non-controlling interests 45 39 15.4%
Basic earnings per share (in Euros) 1.65 1.50 10.0%
Revenue Consolidated revenue totaled €11,408 million for the period ended June 30, 2012, up 10.4% on a current structure and currency basis from the year-earlier period.
Schneider Electric – Half year financial report as at June 30, 2012 27
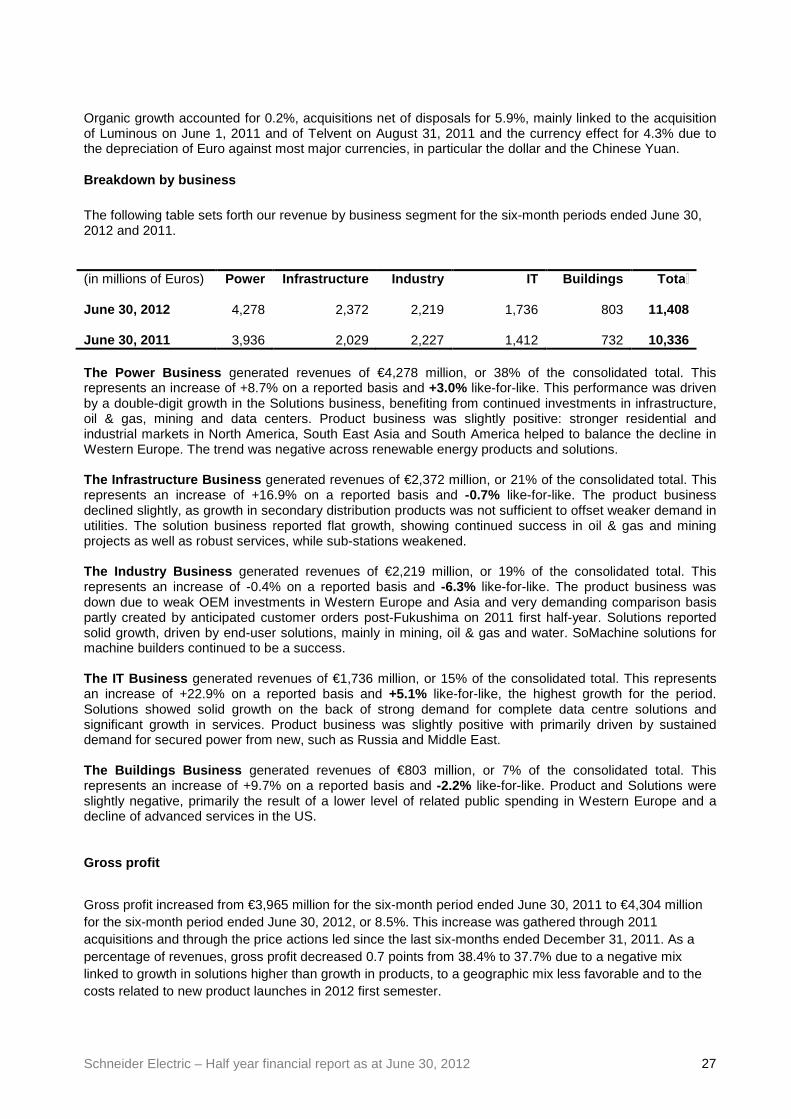
Organic growth accounted for 0.2%, acquisitions net of disposals for 5.9%, mainly linked to the acquisition of Luminous on June 1, 2011 and of Telvent on August 31, 2011 and the currency effect for 4.3% due to the depreciation of Euro against most major currencies, in particular the dollar and the Chinese Yuan.
Breakdown by business
The following table sets forth our revenue by business segment for the six-month periods ended June 30, 2012 and 2011.
(in millions of Euros)
Power Infrastructure Industry IT Buildings Tota
June 30, 2012 4,278 2,372 2,219 1,736 803 11,408 June 30, 2011 3,936 2,029 2,227 1,412 732 10,336 The Power Business generated revenues of €4,278 million, or 38% of the consolidated total. This represents an increase of +8.7% on a reported basis and +3.0% like-for-like. This performance was driven by a double-digit growth in the Solutions business, benefiting from continued investments in infrastructure, oil & gas, mining and data centers. Product business was slightly positive: stronger residential and industrial markets in North America, South East Asia and South America helped to balance the decline in Western Europe. The trend was negative across renewable energy products and solutions. The Infrastructure Business generated revenues of €2,372 million, or 21% of the consolidated total. This represents an increase of +16.9% on a reported basis and -0.7% like-for-like. The product business declined slightly, as growth in secondary distribution products was not sufficient to offset weaker demand in utilities. The solution business reported flat growth, showing continued success in oil & gas and mining projects as well as robust services, while sub-stations weakened. The Industry Business generated revenues of €2,219 million, or 19% of the consolidated total. This represents an increase of -0.4% on a reported basis and -6.3% like-for-like. The product business was down due to weak OEM investments in Western Europe and Asia and very demanding comparison basis partly created by anticipated customer orders post-Fukushima on 2011 first half-year. Solutions reported solid growth, driven by end-user solutions, mainly in mining, oil & gas and water. SoMachine solutions for machine builders continued to be a success. The IT Business generated revenues of €1,736 million, or 15% of the consolidated total. This represents an increase of +22.9% on a reported basis and +5.1% like-for-like, the highest growth for the period. Solutions showed solid growth on the back of strong demand for complete data centre solutions and significant growth in services. Product business was slightly positive with primarily driven by sustained demand for secured power from new, such as Russia and Middle East. The Buildings Business generated revenues of €803 million, or 7% of the consolidated total. This represents an increase of +9.7% on a reported basis and -2.2% like-for-like. Product and Solutions were slightly negative, primarily the result of a lower level of related public spending in Western Europe and a decline of advanced services in the US.
Gross profit
Gross profit increased from €3,965 million for the six-month period ended June 30, 2011 to €4,304 million for the six-month period ended June 30, 2012, or 8.5%. This increase was gathered through 2011 acquisitions and through the price actions led since the last six-months ended December 31, 2011. As a percentage of revenues, gross profit decreased 0.7 points from 38.4% to 37.7% due to a negative mix linked to growth in solutions higher than growth in products, to a geographic mix less favorable and to the costs related to new product launches in 2012 first semester.
Schneider Electric – Half year financial report as at June 30, 2012 28
Support Function costs: Research and development an d selling, general and administrative expenses Research and development expenses, including capitalized development costs and development costs reported as cost of sales, increased by 6.3% from €252 million for the six-month period ended June 30, 2011 to €268 million for the six-month period ended June 30, 2012. As a percentage of revenues, the net cost of research and development remain stable at 2.3% of revenues for six-month period ended June 30, 2012 (2.4% for the six-month period ended June 30, 2011).
Total research and development expense, including capitalized development costs and development costs reported as cost of sales (see Note 4 to the Audited Consolidated Financial Statements included elsewhere in this Offering Memorandum) increased 16.4% from €451 million for the six-month period ended June 30, 2011 to €525 million for the six-month period ended June 30, 2012. As a percentage of revenues, total research and development expenses increased to 4.6% for the six-month period ended June 30, 2012 (compared to 4.4% for the six-month period ended June 30, 2011).
On the first semester 2012, the net effect of capitalized development costs and amortization of capitalized development costs amounts to €70 million on operating income (€42 million on first semester 2011).
Selling, general and administrative expenses increased from €2,279 million for the six-month period ended June 30, 2011 to €2,480 million for the six-month period ended June 30, 2012. As a percentage of revenues, selling, general and administrative expenses decreased to 21.7% for the six-month period ended June 30, 2012 (compared to 22.0% six-month period ended June 30, 2011), cost controlling allowing to compensate inflation.
Combined, total support function costs, that is, research and development expenses together with selling, general and administrative costs, totaled €2,748 million six-month period ended June 30, 2012 compared to €2,531 million six-month period ended June 30, 2011, an increase of 8.6%. As a result, our support functions costs to sales ratio decreased from 24.5% for the six-month period ended June 30, 2011 to 24.1% for the six-month period ended June 30, 2012, thanks to structure optimization.
Other operating income and expenses For the six-month period ended June 30, 2012, other operating income and expenses amounted to a net expense of €8 million, including costs linked to acquisitions for €28 million and other operating income of €20 million. Costs linked to acquisitions are acquisition, integration and separation costs on 2011 and 2012 acquisitions, notably Telvent and M&C. Net other operating income includes mainly reversal of provisions for litigation or claims that expired on June 30, 2012.
For the six-month period ended June 30, 2011, other operating income and expenses amounted to a net expense of €19 million, including costs linked to acquisitions for €41 million and other operating income of €22 million. Costs linked to acquisitions are acquisition, integration and separation costs on 2010 and 2011 acquisitions, notably Areva, Telvent and Leader & Harvest. Net other operating income includes mainly reversal of provisions for litigation or claims that expired on June 30, 2011.
Restructuring costs
For the six-month period ended June 30, 2012, restructuring costs amounted to €43 million compared to also €43 million for the six-month period ended June 30, 2011. These costs related primarily to industrial and support functions restructurings.
Schneider Electric – Half year financial report as at June 30, 2012 29
EBITA and Adjusted EBITA
We define EBITA as earnings before interest, taxes and amortization of purchase accounting intangibles. EBITA comprises operating profit before amortization and impairment of purchase accounting intangible assets and before goodwill impairment.
We define adjusted EBITA as EBITA before restructuring costs and before other operating income and expenses, which includes acquisition, integration and separation costs.
Adjusted EBITA amounted to €1,556 million for the six-month period ended June 30, 2012, compared to €1,434 million for the six-month period ended June 30, 2011, an increase of 8.5%, as the result of effective cost control and continuous focus on price actions and despite lower volume and negative mix effect. As a percentage of revenues, adjusted EBITA decreased from 13.9% for the six-month period ended June 30, 2011 to 13.6% for the six-month period ended June 30, 2012, mainly due to dilution impact of acquisitions.
EBITA increased 9.7% from €1,372 million for the six-month period ended June 30, 2011 to €1,505 million for the six-month period ended June 30, 2012, thanks to the strong increase of Adjusted EBITA, the decrease of other operating expenses, net of income, and the stability of restructuring costs. As a percentage of revenues, EBITA stay stable at 13.2% for the six-month period ended June 30, 2012 (13.3% for the six-month period ended June 30, 2011),
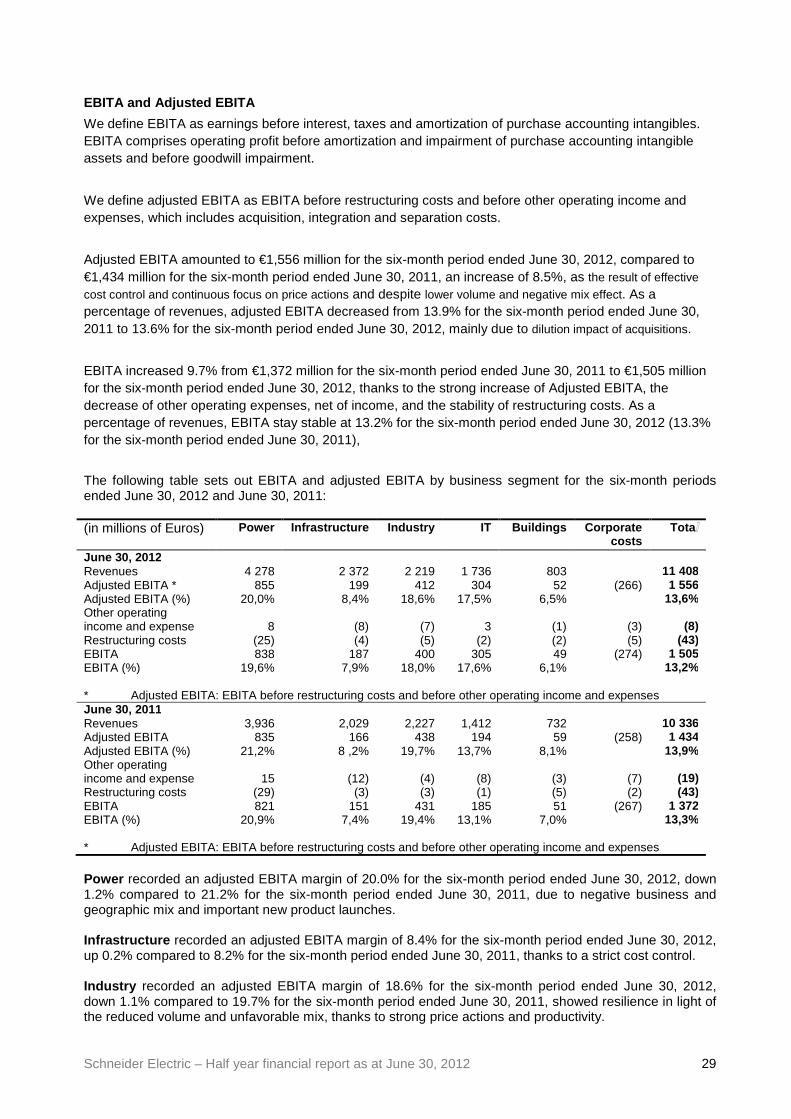
The following table sets out EBITA and adjusted EBITA by business segment for the six-month periods ended June 30, 2012 and June 30, 2011: (in millions of Euros)
Power Infrastructure Industry IT Buildings Corporate costs
Tota
June 30, 2012 Revenues 4 278 2 372 2 219 1 736 803 11 408 Adjusted EBITA * 855 199 412 304 52 (266) 1 556 Adjusted EBITA (%) 20,0% 8,4% 18,6% 17,5% 6,5% 13,6% Other operating income and expense 8 (8) (7) 3 (1) (3) (8) Restructuring costs (25) (4) (5) (2) (2) (5) (43) EBITA 838 187 400 305 49 (274) 1 505 EBITA (%) 19,6% 7,9% 18,0% 17,6% 6,1% 13,2% * Adjusted EBITA: EBITA before restructuring costs and before other operating income and expenses June 30 , 2011 Revenues 3,936 2,029 2,227 1,412 732 10 336 Adjusted EBITA 835 166 438 194 59 (258) 1 434 Adjusted EBITA (%) 21,2% 8 ,2% 19,7% 13,7% 8,1% 13,9% Other operating income and expense 15 (12) (4) (8) (3) (7) (19) Restructuring costs (29) (3) (3) (1) (5) (2) (43) EBITA 821 151 431 185 51 (267) 1 372 EBITA (%) 20,9% 7,4% 19,4% 13,1% 7,0% 13,3% * Adjusted EBITA: EBITA before restructuring costs and before other operating income and expenses Power recorded an adjusted EBITA margin of 20.0% for the six-month period ended June 30, 2012, down 1.2% compared to 21.2% for the six-month period ended June 30, 2011, due to negative business and geographic mix and important new product launches. Infrastructure recorded an adjusted EBITA margin of 8.4% for the six-month period ended June 30, 2012, up 0.2% compared to 8.2% for the six-month period ended June 30, 2011, thanks to a strict cost control. Industry recorded an adjusted EBITA margin of 18.6% for the six-month period ended June 30, 2012, down 1.1% compared to 19.7% for the six-month period ended June 30, 2011, showed resilience in light of the reduced volume and unfavorable mix, thanks to strong price actions and productivity.
Schneider Electric – Half year financial report as at June 30, 2012 30
IT recorded an adjusted EBITA margin of 17.5% for the six-month period ended June 30, 2012, up 3.8% compared to 13.7% for the six-month period ended June 30, 2011, due to sustained growth, price increases and improved performance of solutions. Buildings recorded an adjusted EBITA margin of 6.5% for the six-month period ended June 30, 2012, down 1.6% compared to 8.1% for the six-month period ended June 30, 2011, reflecting weak underlying market trend and negative business mix. Corporate costs for the compared to the six-month period ended June 30, 2012 amounted to €266 million or 2.3% of sales, slightly below 2.5% of sales (€258 million), for the six-month period ended June 30, 2011.
Operating income (EBIT) Operating income increased from €1,274 million for the six-month period ended June 30, 2011 to 1,387 million for the six-month period ended June 30, 2012, an increase of 8.9% despite an increase of amortization of intangibles linked to business combinations of €20 million (€118 million on the six-month period ended June 30, 2012 compared to €98 million six-month period ended June 30, 2011).
Net financial income/loss Net financial loss amounted to €189 million for the six-month period ended June 30, 2012, compared to €184 million for the six-month period ended June 30, 2011. This increase is explained by an increase in Net finance costs, to €172 million for the six-month period ended June 30, 2012, compared to €130 million for the six-month period ended June 30, 2011, linked to the increase in net debt between the two periods. This increase is partially offset by the decrease in other financial costs, net, as well as the exchange loss that led the other financial income and expenses to go from a net expense of €54 million on the six-month period ended June 30, 2011 to a net expense of €17 million for the six-month period ended June 30, 2011.
Tax The effective tax rate was 23.5% for the six-month period ended June 30, 2012 compared to 24.0% for the six-month period ended June 30, 2011. The corresponding tax expense increased from €262 million on the six-month period ended June 30, 2011 to €281 million six-month period ended June 30, 2012.
Share of profit/ (losses) of associates The share of profit of associates amounted to €18 million for the six-month period ended June 30, 2012, compared to €13 million for the six-month period ended June 30, 2011, thanks to the increasing contribution of Electroshield in Russia.
Non-controlling interests Minority interests in net income for the six-month period ended June 30, 2012 totaled €45 million, compared to €39 million for the six-month period ended June 30, 2011. This represented the share in net income attributable, in large part, to the minority interests of certain Chinese companies.
Profit for the period Profit for the period attributable to the equity holders of our parent company amounted to €890 million for the six-month period ended June 30, 2012, that is an 11.0% million increase over the €802 profit for the year recorded in the six-month period ended June 30, 2011.
Earnings per share Earnings per share (taking into account the division of the nominal value of the shares by two, effective as of September 2, 2011) amounted to €1.65 per share for the six-month period ended June 30, 2012 and €1.50 per share for the six-month period ended June 30, 2011.
Schneider Electric – Half year financial report as at June 30, 2012 31
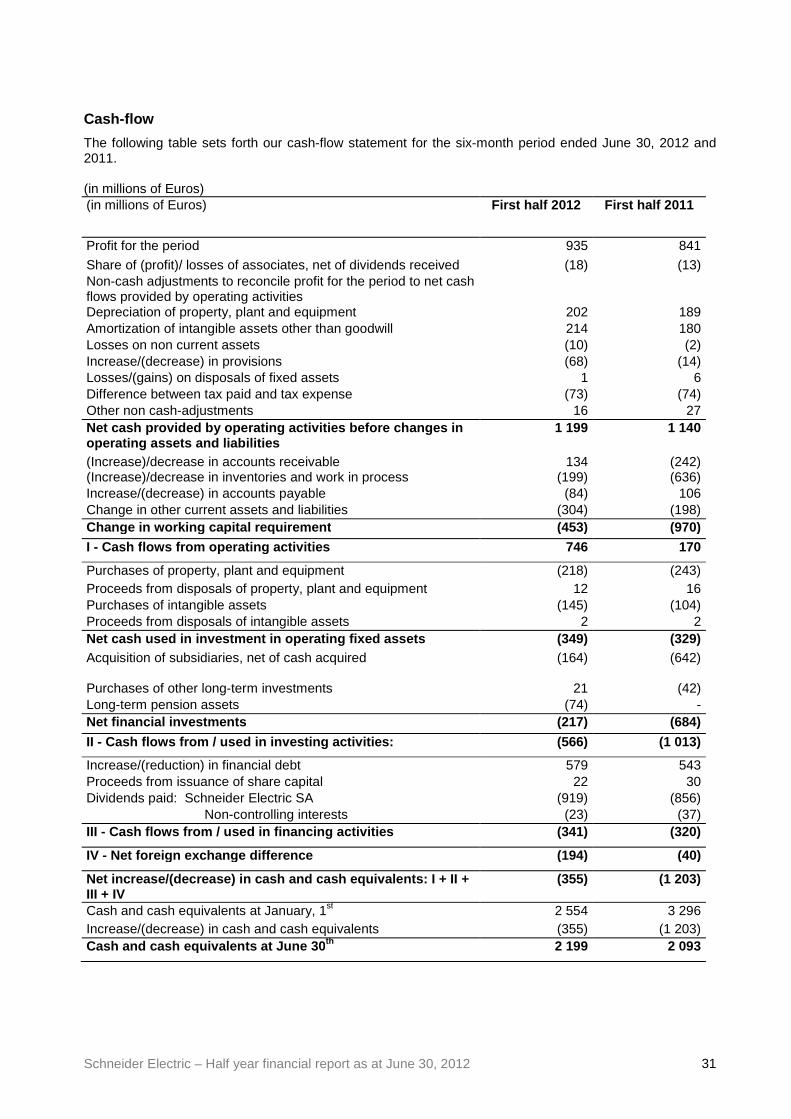
Cash-flow
The following table sets forth our cash-flow statement for the six-month period ended June 30, 2012 and 2011. (in millions of Euros) (in millions of Euros) First half 2012 First half 2011
Profit for the period 935 841
Share of (profit)/ losses of associates, net of dividends received (18) (13) Non-cash adjustments to reconcile profit for the period to net cash flows provided by operating activities
Depreciation of property, plant and equipment 202 189 Amortization of intangible assets other than goodwill 214 180 Losses on non current assets (10) (2) Increase/(decrease) in provisions (68) (14) Losses/(gains) on disposals of fixed assets 1 6 Difference between tax paid and tax expense (73) (74) Other non cash-adjustments 16 27 Net cash provided by operating activities before ch anges in operating assets and liabilities
1 199 1 140
(Increase)/decrease in accounts receivable 134 (242) (Increase)/decrease in inventories and work in process (199) (636) Increase/(decrease) in accounts payable (84) 106 Change in other current assets and liabilities (304) (198) Change in working capital requirement (453) (970)
I - Cash f lows from operating activities 746 170
Purchases of property, plant and equipment (218) (243) Proceeds from disposals of property, plant and equipment 12 16 Purchases of intangible assets (145) (104) Proceeds from disposals of intangible assets 2 2 Net cash used in investment in operating fixed asse ts (349) (329) Acquisition of subsidiaries, net of cash acquired
(164) (642)
Purchases of other long-term investments 21 (42) Long-term pension assets (74) - Net financial investment s (217) (684)
II - Cash flows from / used in investing activities: (566) (1 013)
Increase/(reduction) in financial debt 579 543 Proceeds from issuance of share capital 22 30 Dividends paid: Schneider Electric SA (919) (856) Non-controlling interests (23) (37) III - Cash flows from / used in financing activities (341) (320)
IV - Net foreign exchange difference (194) (40)
Net increase/(decrease) in cash and cash equivalent s: I + II + III + IV
(355) (1 203)
Cash and cash equivalents at January, 1st 2 554 3 296 Increase/(decrease) in cash and cash equivalents (355) (1 203) Cash and cash equivalents at June 30 th 2 199 2 093
Schneider Electric – Half year financial report as at June 30, 2012 32
Operating Activities Net cash provided by operating activities before changes in operating assets and liabilities reached €1,199 million for the six-month period ended June 30, 2012, up 5.2% compared to €1,140 million for the six-month period ended June 30, 2012, and represented 10.5% of revenue in the first semester 2012 compared with 11.0% in the first semester 2011. Change in working capital requirement consumed €453 million in cash in the six-month period ended June 30, 2012, compared to €970 million in consumption in the six-month period ended June 30, 2011, reflecting the strong effort in controlling inventories level compared to the inventory build-up to mitigate supply chain disruption post-Fukushima in the first semester 2011, and a better collection of trade receivables. In all, net cash provided by operating activities quadrupled from €170 million in the six-month period ended June 30, 2011 to €746 million in the six-month period ended June 30, 2012.
Investing Activities Net capital expenditure, which included capitalized development projects, increased 6.1% to €349 million for the six-month period ended June 30, 2012, which was similar to the amount reported in first half 2011 (€329 million for the six-month period ended June 30, 2011), and representing 3.1% of sales. Our acquisitions in 2011 represented a cash outflow, net of cash acquired, of €163 million for the six-month period ended June 30, 2012, corresponding partially to M&C, compared to €642 million in the six-month period ended June 30, 2011 corresponding to several acquisitions including Luminous and Summit.
Financing Activities The increase net of decrease of financial debts amount to €579 million during the six-month period ended June 30, 2012, compared to €543 million during the six-month period ended June 30, 2011. The dividend paid by Schneider Electric was €919 million the six-month period ended June 30, 2012, compared with €856 million the six-month period ended June 30, 2011. Outlook for 2012
The uncertain world economic outlook and mixed business trends in the Group’s key markets continue to limit near term visibility.
In this context, assuming no further deterioration of the economic conditions, the Group confirms its full year outlook of flat to slightly positive organic growth for sales and an adjusted EBITA margin between 14% and 15%.
See Chapter 1, paragraph 5 – Risk Factors of the 2011 Registration Document filed with AMF under no. D. 12-0198 for further information.
Significant events of the period
In addition to the acquisitions described above, the key events of the period were as follows: Executive Committee Mr. Zhu Hai joined the Executive Committee on April 2nd, 2012, whereas Mr. Eric Rondolat left the Executive Committee. Supervisory Board membership At its meeting of May 3, 2012, the Supervisory Board has reappointed Mr. Henri Lachmann as Chairman of the Supervisory Board and Mr. Leo Apotheker as Vice Chairman. The Supervisory Board also renewed Mr. Claude Bébéar in his functions as non-voting director.
Schneider Electric – Half year financial report as at June 30, 2012 33
The Supervisory Board welcomed two new members nominated at the Annual Shareholders’ Meeting of May 3, 2012, Mr. Antoine Gosset-Grainville, replacing Mr. Jérôme Gallot and Mrs Magali Herbaut, replacing Mr. Claude Briquet. The Supervisory Board appointed Mr. Antoine Gosset-Grainville as a member of the Audit Committee. The Audit Committee is now composed of Mr. Gérard de La Martinière, Chairman, and Mr. Noël Forgeard and Mr. Antoine Gosset-Grainville. Main risks and areas of uncertainty for the second half of 2012
The main risks and areas of uncertainty for the second half of the year are the same as those outlined in Chapter 1, paragraph 5 (Risk Factors) of the 2011 Registration Document filed with AMF on March 22, 2012. Claims, litigations and other risks (update to the Registration Document – pages 39-40) No significant event occurred since Registration Document date. Transactions with related parties These transactions are described in Note 19 to the interim consolidated financial statements.
Schneider Electric – Half year financial report as at June 30, 2012 34
Attestation We hereby declare that, to the best of our knowledge, the half-year financial statements as at June 30, 2012 have been prepared in accordance with applicable accounting standards, that they present fairly, in all material respects, the assets, financial position and results of the company and the consolidated group. To the best of my knowledge, the Management Report presents fairly the information mentioned in Article 222-6 of AMF’s general regulations. Rueil-Malmaison, July 31, 2012 On behalf of the Management Board, Jean-Pascal TRICOIRE Chairman of the Management Board and CEO
Schneider Electric – Half year financial report as at June 30, 2012 35
Statutory Auditors' Review Report on the first half -yearly information
This is a free translation into English of the statutory auditors’ review report on the condensed half-yearly consolidated financial statements issued in French and it is provided solely for the convenience of English-speaking users. This report also includes information relating to the specific verification of information given in the Group’s interim management report. This report should be read in conjunction with and construed in accordance with French law and professional standards applicable in France.
To the Shareholders,
In compliance with the assignment entrusted to us by your shareholders’ meeting and in accordance with the requirements of
article L. 451-1-2 III of the French monetary and financial code (Code monétaire et financier), we hereby report to you on:
• the review of the accompanying condensed half-yearly consolidated financial statements of Schneider Electric S.A., for the
period from January 1 to June 30, 2012, and
• the verification of the information contained in the interim management report.
These condensed half-yearly consolidated financial statements are the responsibility of the Management Board. Our role is to
express a conclusion on these financial statements based on our review.
1. Conclusion on the financial statements
We conducted our review in accordance with professional standards applicable in France. A review of interim financial information
consists of making inquiries, primarily of persons responsible for financial and accounting matters, and applying analytical and
other review procedures. A review is substantially less in scope than an audit conducted in accordance with professional standards
applicable in France and consequently does not enable us to obtain assurance that we would become aware of all significant
matters that might be identified in an audit. Accordingly, we do not express an audit opinion.
Based on our review, nothing has come to our attention that causes us to believe that the condensed half-yearly consolidated
financial statements are not prepared in all material respects in accordance with IAS 34 – standard of the IFRSs as adopted by the
European Union applicable to interim financial information.
2. Specific verification
We have also verified the information presented in the interim management report in respect of the condensed half-yearly
consolidated financial statements subject to our review.
We have no matters to report as to its fair presentation and its consistency with the condensed half-yearly consolidated financial
statements.
Courbevoie and Paris-La Défense, July 31, 2012
The Statutory Auditors French original signed by
MAZARS ERNST & YOUNG et Autres
David Chaudat Yvon Salaün