Embed Size (px)
Citation preview

Half year financial report 1–6/2019 26 July 2019

2 I 26 July 2019 I Half year financial report 1-6/2019
HALF YEAR FINANCIAL REPORT JANUARY–JUNE 2019 Positive development in North America, temporary challenges in building solutions in Europe Uponor divested Uponor Infra’s North American business in August 2018 and Zent-Frenger (reported in Building Solutions – Europe segment) in October 2018. The financial information from the comparison period includes their figures. April–June 2019 • Net sales were €292.6 (324.9) million, a decline of 9.9%. Organic growth was -0.5% in constant currency
terms. Net sales for the comparison period without divested Uponor Infra’s North American business and Zent-Frenger would have been €291.7 million.
• Operating profit was €25.3 (28.0) million, a decline of 9.6%. Operating profit improved 12.4% from the comparison period without the divested Uponor Infra’s North American business and Zent-Frenger (2018: €22.5 million). There were no significant items affecting comparability in the second quarter of 2019 or 2018.
• Earnings per share were €0.18 (0.19).
January–June 2019 • Net sales were €541.5 (601.8) million, a decline of 10.0%. Organic growth was -1.1% in constant currency
terms. Net sales for the comparison period without divested Uponor Infra’s North American business and Zent-Frenger would have been €542.0 million.
• Operating profit was €39.5 (45.0) million, a decline of 12.0%. Operating profit improved 10.9% from the comparison period without the divested Uponor Infra’s North American business and Zent-Frenger (2018: €35.7 million).
• Earnings per share were €0.29 (0.30).
• Cash flow from business operations was €-15.9 (-16.5) million.
• Return on investment was 12.2% (13.5%), and gearing 66.7 (64.2). Without the adoption of IFRS 16, gearing would have been 54.2.
Organic growth refers to Uponor’s operations without any divested businesses.
Guidance statement for 2019: Uponor repeats its full-year guidance announced on 13 February 2019: Excluding the impact of currencies, Uponor expects its net sales to reach the level of the year 2018 net sales excluding the divested Uponor Infra’s North American business and Zent-Frenger (€1,107.7 million), and comparable operating profit to improve from the year 2018 comparable operating profit excluding the divested Uponor Infra’s North American business and Zent-Frenger (€83.5 million). Jyri Luomakoski, President and CEO, comments: “On a positive note, during the first half of the year the profitability of our current business portfolio improved, supported by the restructuring decisions concerning Australia, Switzerland and China. The strategic divestitures from 2018 supported the margin improvement as well. However, the second quarter was twofold for Uponor. On the one hand, North America came back on track after a slow start for the year. But Building Solutions – Europe had some temporary production challenges in the second quarter. In Building Solutions – Europe, net sales decreased and we could not maintain the positive profitability development from the first quarter of the year. The scaling up of the production of the new S-Press PLUS fitting also burdened profitability together with continued operational challenges with Virsbo manufacturing

3 I 26 July 2019 I Half year financial report 1-6/2019
facility in Sweden. We are positive that we will be able to stabilise the production of S-Press PLUS during the third quarter, while the results from corrective measures in Virsbo will materialise slower. In Building Solutions – North America, both net sales and profitability improved year-over-year. The capacity issues in the freight industry are also showing signs of improvement, which supported the positive profitability development. Uponor Infra continues to execute its profitability improvement programme and the strategic shift towards designed solutions sales. As part of these initiatives, Uponor Infra divested its Czech subsidiary in April. During the second half of the year, we will continue to focus on profitability improvement initiatives.” Key figures
M€ 4-6/ 2019
4-6/ 2018
Change 1-6/ 2019
1-6/ 2018
Change 1-6/ 2018*)
1-12/2018
Net sales 292.6 324.9 -9.9% 541.5 601.8 -10.0% 542.0 1,196.3 Building Solutions – Europe 125.7 138.7 -9.3% 249.3 263.9 -5.5% 251.9 524.4 Building Solutions – North America 96.3 83.5 +15.3% 171.0 161.1 +6.1% 161.1 340.5 Uponor Infra 72.4 104.1 -30.4% 124.8 179.4 -30.4% 131.7 337.3
Operating expenses 254.7 287.5 -11.4% 477.4 537.9 -11.3% 1,063.6 Depreciation and impairments 13.3 9.7 37.3% 25.8 19.2 34.1% 42.4 Other operating income 0.6 0.2 177.8% 1.2 0.3 306.3% 16.4 Operating profit 25.3 28.0 -9.6% 39.5 45.0 -12.0% 35.7 106.7
Building Solutions – Europe 8.2 11.0 -25.3% 15.4 17.0 -9.1% 16.9 31.1 Building Solutions – North America 13.8 8.8 +56.7% 21.3 19.0 +12.3% 19.0 46.6 Uponor Infra 5.4 10.2 -47.3% 6.0 13.4 -55.8% 4.2 35.1
Comparable operating profit 25.3 28.0 -9.6% 39.5 45.0 -12.0% 35.7 99.3
Building Solutions – Europe 8.2 11.0 -25.3% 15.4 17.0 -9.1% 16.9 35.4 Building Solutions – North America 13.8 8.8 +56.7% 21.3 19.0 +12.3% 19.0 46.6 Uponor Infra 5.4 10.2 -47.3% 6.0 13.4 -55.8% 4.2 23.4
Financial income and expenses -3.2 -2.6 23.0% -6.6 -4.3 54.1% -8.5 Profit before taxes 21.1 24.5 -13.8% 31.0 37.7 -17.8% 93.5 Profit for the period 15.3 17.3 -11.6% 22.4 26.5 -15.5% 63.2 Earnings per share 0.18 0.19 -0.7% 0.29 0.30 -4.8% 0.72
*) Illustrative figures without divested Uponor Infra’s North American business and Zent-Frenger.
M€ 30 June 2019
30 June 2018
Change 31 Dec 2018
Net working capital 163.1 169.0 -3.5% 119.3 Net-interest bearing debt 224.9 218.3 3.0% 139.2 Solvency 39.2 37.8 3.5% 45.1 Gearing 66.7 64.2 3.8% 39.4 Return on investment 12.2 13.5 -9.7% 17.2

4 I 26 July 2019 I Half year financial report 1-6/2019
Uponor divested Uponor Infra’s North American business in August 2018 and Zent-Frenger (reported in Building Solutions – Europe segment) in October 2018. The financial information from the comparison period includes their figures. The impact of IFRS 16 adoption on Uponor's liabilities as of 1 January 2019 was €44.3 million, increasing the amount of lease liabilities, more detailed information on the impacts of IFRS 16 can found on page 15. Webcast of the results briefing and the presentation A webcast in English will be broadcast on 26 July at 10:00 EET. It can be viewed via the Uponor IR mobile app or here https://platform.goodmood.fi/goodmood/uponor/half-year-results-briefing-1-6-2019. The recorded webcast can be viewed via the same link or via the app shortly after the live presentation. All presentation materials will be available at investors.uponor.com > News & downloads. Uponor Corporation’s financial reporting in 2019 25 Oct 2019 Interim report For further information, please contact: Jyri Luomakoski, President and CEO, tel. +358 20 129 2824 Susanna Inkinen, Vice President, Communications and Corporate Responsibility, tel. +358 20 129 2081 DISTRIBUTION: Nasdaq Helsinki Media www.uponor.com www.investors.uponor.com

5 I 26 July 2019 I Half year financial report 1-6/2019
Markets While trade disputes may have weighed more heavily on export-focused industries, construction in both Europe and North America continued to perform at a healthy level, on the whole, during the quarter. In North America, there are indications that the growth in residential segment slowed but remained near last year’s production levels. In non-residential building, a number of segments continued to exhibit growth, helping to offset contraction on the residential side. In Canada, the residential market was largely stable, with activity levels similar to 2018. Significant divergence in construction activity continued to be present in Europe. In Germany, construction remained healthy despite trade concerns in the rest of the economy. In the Nordic region, building activity continued at a good level in Finland, while a slowdown in residential building in Sweden was compensated for somewhat by increased public works projects. The clearest improvement continued to be displayed in Spain. Net sales Uponor’s net sales for the second quarter reached €292.6 (324.9) million, a decline of 9.9%. Positive net currency impact was €4.5 million, mainly due to USD, bringing the decline without currency impact to 11.3%. Net sales of Building Solutions – Europe were €125.7 (138.7) million, a decline of 9.3%. Part of the decline is due to Asia, which net sales are included in the comparison period, but from where Uponor decided to exit in the end of 2018. In addition, in Uponor’s key markets, net sales decreased in Sweden and Finland. In the Netherlands net sales increased and remained on a par in Germany year-over-year. Building Solutions – North America’s net sales were €96.3 (83.5) million, a growth of 15.3% in euro terms or 9.7% in US dollars. This growth came from the US markets. Uponor Infra’s net sales were €72.4 (104.1) million, a decline of 30.4%. The decline is mainly due to the divested North American business, whose net sales are included in the comparison period. In the second quarter of 2018, net sales without the divested North American business would have been €78.0 million. The slight decline in net sales was due to lower sales in Sweden and Poland. Breakdown of net sales by segment (April–June):
M€ 4–6/
2019 4–6/
2018 Change
4–6/
2018*) Building Solutions – Europe 125.7 138.7 -9.3% 131.5 Building Solutions – North America 96.3 83.5 +15.3% 83.5 (Building Solutions – North America (M$) 108.5 98.8 +9.7%) Uponor Infra 72.4 104.1 -30.4% 78.0 Eliminations -1.8 -1.3 Total 292.6 324.9 -9.9% 291.7
Breakdown of net sales by segment (January–June):
M€ 1–6/
2019 1–6/
2018 Change
1–6/
2018*) Building Solutions – Europe 249.3 263.9 -5.5% 251.9 Building Solutions – North America 171.0 161.1 +6.1% 161.1 (Building Solutions – North America (M$) 193.5 194.5 -0.5%

6 I 26 July 2019 I Half year financial report 1-6/2019
Uponor Infra 124.8 179.4 -30.4% 131.7 Eliminations -3.5 -2.6 Total 541.5 601.8 -10.0% 542.0
*) Illustrative figures without divested Uponor Infra’s North American business and Zent-Frenger. Results and profitability Uponor’s gross profit in the second quarter was €97.6 (107.3) million, a decline of €9.7 million. The gross profit margin improved to 33.4% (33.0%), driven by the strategic decisions to divest Uponor Infra’s North American business and Zent-Frenger as well as ceased operations in Asia. Operating profit in the second quarter of 2019 was €25.3 (28.0) million, a decline of 9.6% year-over-year. Operating profit margin was 8.6% (8.6%). There were no significant items affecting comparability in the second quarter of 2019 or 2018. Operating profit improved 12.4% from the comparison period without the divested Uponor Infra’s North American business and Zent-Frenger. Building Solutions – Europe’s operating profit reached €8.2 (11.0) million, showing a decline of 25.3%. The lowered net sales decreased the operating profit. In addition, operational challenges in Virsbo and scaling up the production of the new S-Press PLUS fitting burdened profitability. Building Solutions – North America reported an operating profit of €13.8 (8.8) million, a growth of 56.7% in euro terms and 50.1% in USD. Net sales growth supported the positive profitability development. In addition, the start-up costs of the Hutchinson manufacturing facility burdened the comparison period. Uponor Infra’s operating profit was €5.4 (10.2) million, a decline of 47.3%. The decline is due to the divested North American business in 2018. In the second quarter of 2018, operating profit without the divested North American business would have been €5.2 million. Profitability increased slightly in Finland and designed solutions sales. Profit before taxes for April–June totalled €21.1 (24.4) million. Taxes had a €5.8 million effect on profit for the period, while the amount of taxes in the comparison period was €7.1 million. The estimated tax rate for the full year 2019 is 27.5%, compared to 32.4% at the year-end of 2018. Profit for the period in the second quarter came to €15.3 (17.3) million. Operating profit by segment (April–June): M€
4–6/ 2019
4–6/ 2018
Change
4–6/ 2018*)
Building Solutions – Europe 8.2 11.0 -25.3% 10.5 Building Solutions – North America 13.8 8.8 +56.7% 8.8 (Building Solutions – North America (M$) 15.6 10.4 +50.1% Uponor Infra 5.4 10.2 -47.3% 5.2 Others -1.8 -1.3 Eliminations -0.3 -0.7 Total 25.3 28.0 -9.6% 22.5

7 I 26 July 2019 I Half year financial report 1-6/2019
Operating profit by segment (January–June): M€
1–6/ 2019
1–6/ 2018
Change
1–6/ 2018*)
Building Solutions – Europe 15.4 17.0 -9.1% 16.9 Building Solutions – North America 21.3 19.0 +12.3% 19.0 (Building Solutions – North America (M$) 24.1 22.9 +5.3% Uponor Infra 6.0 13.4 -55.8% 4.2 Others -3.1 -2.3 Eliminations 0.0 -2.1 Total 39.5 45.0 -12.0% 35.7
*) Illustrative figures without divested Uponor Infra’s North American business and Zent-Frenger. The January–June gross profit was €183.9 (200.5) million and gross profit margin 34.0% (33.3%). The January–June operating profit was €39.5 (45.0) million. The operating profit margin, for the first half-year period was 7.3% (7.5%). Financial expenses were €6.6 (4.4) million. The share of the result in associated companies at €-2.0 (-3.0) million is related to Uponor’s 50% share in the joint venture company, Phyn, established in 2016. Profit before taxes for January–June totalled €31.0 (37.6) million. The effect of taxes on profits was €8.5 (11.1) million. The estimated tax rate for the full year 2019 is 27.5%, compared to 32.4% at the year-end of 2018. The profit for the period was €22.4 (26.5) million. Earnings per share, both basic and diluted, for January–June totalled €0.29 (0.30). Equity per share, both basic and diluted, was €3.84 (3.66). Investment and financing Uponor’s gross investments in January–June were €9.8 (24.9) million. The investments were mainly addressed at maintenance and efficiency improvement. Depreciation and impairments were €25.8 (19.2) million. The impact of IFRS 16 adoption on depreciation in January–June was €5.8 million. Cash flow from business operations in January–June came to €-15.9 (-16.5) million. Cash flow from financing and thus cash flow for the January–June period included the first of the two instalments of the dividend payment, €0.25 per share, totalling €18.2 million. The second of the two instalments of the dividend payment, €0.26 per share, will be paid in the third quarter. The total dividend payment for 2019 will amount to €37.2 (35.8) million. The main existing long-term funding programme on 30 June 2019 was the 5-year bilateral loan agreement of €100 million, which will mature in July 2022. In addition, Uponor has outstanding, bilateral long-term loans of €50 million and €20 million, both of which will mature in the summer of 2021. As back-up funding arrangements, Uponor has four €50 million committed bilateral revolving credit facilities in force, totalling €200 million and maturing in 2021–2023; none of these were used during the reporting period.

8 I 26 July 2019 I Half year financial report 1-6/2019
For short-term funding needs, Uponor’s main source of funding is its domestic commercial paper programme, totalling €150 million, of which €20.0 (70.0) million was outstanding on the balance sheet date. Available cash-pools limits granted by Uponor’s key banks amounted to €34.9 million, of which €0.0 (2.6) million was in use on the balance sheet date. At the end of the period, Uponor had €13.2 (32.1) million in cash and cash equivalents. The Group’s solvency, at 39.2% (37.8%), has remained at a good level. Net interest-bearing liabilities were €224.9 (218.3) million. Gearing was 66.7 (64.2) with the four-quarter rolling gearing at 55.2 (55.6). The impact of IFRS 16 adoption on Uponor's liabilities as of 1 January 2019 was €44.3 million, increasing the amount of lease liabilities. Without the impact of IFRS 16, gearing would have been 54.2. Key events On 29 April, Uponor Infra divested its Czech subsidiary, Fintherm. The buyer was EP Industries a.s. In 2018, Fintherm’s net sales were approximately €8 million and it employed 60 persons. On 9 May, Uponor announced that Uponor and Belkin have decided to invest additional USD6 million each, in total USD12 million, in their joint venture Phyn during year 2019. At the end of the second quarter, no additional investment was yet made. Resolutions of the Annual General Meeting 2019 Uponor’s Annual General Meeting, was held in Helsinki, Finland, on 18 March 2019. The AGM adopted the financial statements and the consolidated financial statements for 2018, and released the Board members and the President and CEO from liability. The AGM approved the proposed dividend of €0.51 per share for 2018. The dividend will be paid in two instalments. Existing Board members Annika Paasikivi (chair), Pia Aaltonen-Forsell, Johan Falk, Markus Lengauer, Casimir Lindholm and Eva Nygren were re-elected. The AGM elected Annika Paasikivi as Chair of the Board. Audit firm Deloitte Oy was re-elected as the auditor of the corporation. Further details regarding the Annual General Meeting are available at https://investors.uponor.com/governance/annual-general-meeting/annual-general-meeting-2019. Personnel The number of Group full-time-equivalent employees averaged 3,837 (4,163) in January–June 2019, a decrease of 326 persons from the second quarter of 2018. At the end of the period, the Group had 3,842 (4,351) employees, showing a decrease of 509 employees mainly due to divested business of Fintherm, ceased operations in Asia, as well as operational streamlining in the USA. The comparison period includes also the divested businesses, Uponor Infra’s North America and Zent-Frenger. Changes in Uponor’s Executive Committee On 3 May 2019, Uponor announced the appointment of Minna Yrjönmäki as CFO and a member of the Executive Committee at Uponor Corporation as of 3 August 2019. Shares and shareholders Uponor Corporation’s share capital amounts to €146,446,888 and the number of shares totals 73,206,944. There were no changes in the share capital and the number of shares during the reporting period. The number of Uponor shares traded on Nasdaq Helsinki in the reporting period January–June was 16.1 (16.6) million shares, totalling €157.1 (244.5) million. The market value of share capital at the end of the period was €0.7 (1.0) billion and the number of shareholders 20,013 (19,459).

9 I 26 July 2019 I Half year financial report 1-6/2019
At the end of the quarter, Uponor held a total of 219,527 (44,756) of its own shares. Events after the reporting period There were no events to report on. Short-term risks and uncertainties Uncertainty in the global economy and financial markets may have a negative impact on Uponor’s operations, performance, financial position and sources of capital. Uncertainties will continue in 2019, for example Brexit and the possible trade war between the USA and China. Demand for Uponor’s products depends on business cycles in the construction sector. Uponor mitigates this risk by distributing its business to two main geographical areas: Europe and North America. Uponor also has three business areas: plumbing solutions, indoor climate solutions and infrastructure solutions. Uponor’s products are used in both new construction projects and renovation projects, and in the latter the demand is usually more stable than in more cyclical new construction. Increasing competitive pressure through, for example, private labelling creates a risk for Uponor. There is also a risk associated with product liability related to products manufactured and sold by Uponor. Digitalisation, emerging technologies and capabilities related to those areas are needed to build new business opportunities for Uponor. Uponor’s ability to attract and retain talent to drive change are key to Uponor’s future success. Uponor manages this risk by building its employer brand and helping its current employees to develop, for example, their leadership skills. The prices of raw materials used in the manufacture of Uponor’s products are susceptible to change, driven by several factors including petrochemical and metal product price fluctuations, supply capacity, and market demand among others. In recent years, Uponor has been able to pass most of the effects of such fluctuations onto its selling prices with a reasonable delay. Uponor has entered the ’IoT era’ by launching new intelligent products. Therefore, Uponor is monitoring multiple cyber related risks, such as cyber, data and information threats. Uponor operates under an ISO 9001 quality management system and an ISO 14001 environmental management system, which enhance quality, production safety, environmental law compliance and productivity while reducing the environmental impact and risks related to Uponor's operations. In its project business operations, Uponor is seeking to manage risks related to issues such as project-specific timing and costs. Several factors, including disturbances in the supply chain and IT systems as well as natural disasters can pose a business continuity risk to Uponor. Uponor mitigates the risk with comprehensive business continuity planning and management. The international nature of its operations exposes the company to currency risks associated with various currencies. In 2018, approximately 60% of Uponor’s net sales were generated in currencies other than the euro. Correspondingly, a major part of expenses associated with these net sales were also denominated in the same local currencies, markedly decreasing the associated currency risks. A more detailed risk analysis is provided in the section ‘Key risks associated with business’ in the Annual Report 2018.

10 I 26 July 2019 I Half year financial report 1-6/2019
Short-term market outlook Despite signs that some markets are approaching the end of their extended growth phases, Uponor expects that the markets will remain at a healthy level overall during Q3:
• In the USA, market growth has slowed down, but slight growth is expected to continue throughout 2019.
• The market is expected to remain at a healthy level in Germany. • Although the residential market is weakening in Sweden, construction still remains at a good level. • In Finland as well, the market will remain at a good level, despite signs of weakening.
Guidance for 2019: Uponor repeats its full-year guidance announced on 13 February 2019: Excluding the impact of currencies, Uponor expects its net sales to reach the level of the year 2018 net sales excluding the divested Uponor Infra’s North American business and Zent-Frenger (€1,107.7 million), and comparable operating profit to improve from the year 2018 comparable operating profit excluding the divested Uponor Infra’s North American business and Zent-Frenger (€83.5 million). Helsinki, 26 July 2019 Uponor Corporation Board of Directors

11 I 26 July 2019 I Half year financial report 1-6/2019
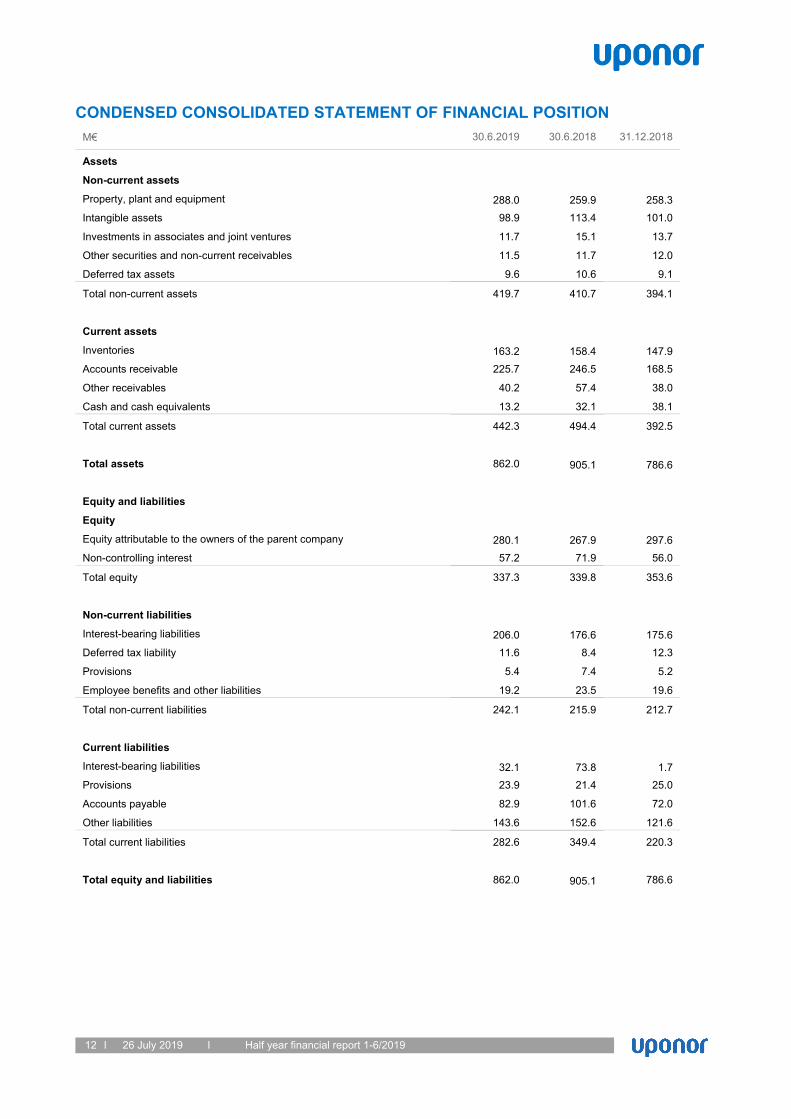
Table part This half year financial report has been compiled in accordance with the IAS 34 reporting standard and it is unaudited. The figures in brackets are the reference figures for the equivalent period in 2018. All figures presented have been rounded and consequently, the sum of individual figures might differ from the presented total figure. The change percentages reported have been calculated from the exact figures and not from the rounded figures published in the half year financial report. CONDENSED CONSOLIDATED STATEMENT OF COMPREHENSIVE INCOME
M€ 1-6/2019 1-6/2018 4-6/2019 4-6/2018 1-12/2018 Net sales 541.5 601.8 292.6 324.9 1,196.3 Cost of goods sold 357.6 401.3 195.0 217.6 795.5 Gross profit 183.9 200.5 97.6 107.3 400.8 Other operating income 1.2 0.3 0.6 0.2 16.4 Dispatching and warehousing expenses 16.6 17.0 7.5 8.8 33.7 Sales and marketing expenses 90.0 98.6 45.5 50.8 191.3 Administration expenses 28.4 29.1 14.3 14.2 60.0 Other operating expenses 10.5 11.1 5.6 5.7 25.5 Operating profit 39.5 45.0 25.3 28.0 106.7 Financial expenses, net 6.6 4.4 3.2 2.7 8.5 Share of results in associated companies and joint ventures -2.0 -3.0 -1.0 -0.9 -4.7 Profit before taxes 31.0 37.6 21.1 24.4 93.5 Income taxes 8.5 11.1 5.8 7.1 30.3 Profit for period 22.4 26.5 15.3 17.3 63.2
Other comprehensive income Items that will not be reclassified subsequently to profit or loss Re-measurements on defined benefit pensions, net of taxes - - - - -1.1 Items that may be reclassified subsequently to profit or loss Translation differences -0.3 -1.4 -2.0 3.0 1.2 Cash flow hedges, net of taxes -1.6 1.4 -0.6 0.9 1.6 Net investment hedges 0.0 -0.4 0.0 -0.7 -0.7 Other comprehensive income for the period, net of taxes -1.8 -0.4 -2.5 3.2 1.0
Total comprehensive income for the period 20.6 26.1 12.8 20.5 64.2
Profit/loss for the period attributable to - Equity holders of parent company 20.9 22.0 13.5 13.6 52.8 - Non-controlling interest 1.5 4.5 1.8 3.7 10.4 Total comprehensive income for the period attributable for - Equity holders of parent company 19.5 22.4 11.4 16.9 54.0 - Non-controlling interest 1.1 3.7 1.4 3.6 10.2 Earnings per share, € 0.29 0.30 0.18 0.19 0.72 Diluted earnings per share, € 0.29 0.30 0.18 0.19 0.72
12 I 26 July 2019 I Half year financial report 1-6/2019
CONDENSED CONSOLIDATED STATEMENT OF FINANCIAL POSITION M€ 30.6.2019 30.6.2018 31.12.2018
Assets
Non-current assets
Property, plant and equipment 288.0 259.9 258.3 Intangible assets 98.9 113.4 101.0
Investments in associates and joint ventures 11.7 15.1 13.7
Other securities and non-current receivables 11.5 11.7 12.0
Deferred tax assets 9.6 10.6 9.1
Total non-current assets 419.7 410.7 394.1
Current assets
Inventories 163.2 158.4 147.9 Accounts receivable 225.7 246.5 168.5
Other receivables 40.2 57.4 38.0
Cash and cash equivalents 13.2 32.1 38.1
Total current assets 442.3 494.4 392.5
Total assets 862.0 905.1 786.6
Equity and liabilities
Equity
Equity attributable to the owners of the parent company 280.1 267.9 297.6 Non-controlling interest 57.2 71.9 56.0
Total equity 337.3 339.8 353.6
Non-current liabilities
Interest-bearing liabilities 206.0 176.6 175.6 Deferred tax liability 11.6 8.4 12.3
Provisions 5.4 7.4 5.2
Employee benefits and other liabilities 19.2 23.5 19.6
Total non-current liabilities 242.1 215.9 212.7
Current liabilities
Interest-bearing liabilities 32.1 73.8 1.7 Provisions 23.9 21.4 25.0
Accounts payable 82.9 101.6 72.0
Other liabilities 143.6 152.6 121.6
Total current liabilities 282.6 349.4 220.3
Total equity and liabilities 862.0 905.1 786.6

13 I 26 July 2019 I Half year financial report 1-6/2019
CONDENSED CONSOLIDATED STATEMENT OF CASH FLOW M€ 1-6/2019 1-6/2018 1-12/2018
Cash flow from operations
Net cash from operations 59.0 60.7 122.5 Change in net working capital -61.2 -60.5 -28.1
Income taxes paid -13.0 -15.0 -12.3
Interest paid -0.9 -1.8 -2.8
Interest received 0.2 0.1 0.6
Cash flow from operations -15.9 -16.5 79.9
Cash flow from investments
Proceeds from disposal of subsidiaries and businesses 3.2 - 53.8
Acquisition of joint venture - -8.1 -8.1
Purchase of fixed assets -9.8 -24.9 -54.0
Proceeds from sale of fixed assets 2.8 0.7 0.9
Loan repayments 0.4 - -
Dividends received 0.0 0.0 0.2
Cash flow from investments -3.4 -32.3 -7.2
Cash flow from financing
Borrowings of debt 0.0 0.1 0.2 Repayment of debt -0.8 -80.1 -80.1
Change in other short-term loan 20.0 72.1 -0.4
Dividends paid -18.2 -17.6 -35.8
Purchase of own shares - - -1.9
Return of capital to Infra Oy’s non-controlling interest - - -22.4
Payment of lease liabilities -6.6 -0.5 -1.0
Cash flow from financing -5.6 -26.0 -141.4
Conversion differences for cash and cash equivalents 0.1 -0.1 -0.2
Change in cash and cash equivalents -24.9 -74.9 -68.9
Cash and cash equivalents at 1 January 38.1 107.0 107.0
Cash and cash equivalents at end of period 13.2 32.1 38.1
Changes according to balance sheet -24.9 -74.9 -68.9

14 I 26 July 2019 I Half year financial report 1-6/2019
STATEMENT OF CHANGES IN EQUITY
M€ A B C D* E F G H I Balance at 1 Jan 2019 146.4 50.2 3.3 -9.7 -2.2 109.6 297.6 56.0 353.6
Profit for the period 20.9 20.9 1.5 22.4 Other comprehensive income for the period -1.6 0.2 -1.4 -0.4 -1.8 Dividend (€0.51 per share) -37.2 -37.2 -37.2 Share-based incentive plan 0.2 0.1 0.3 0.3 Balance at 30 June 2019 146.4 50.2 1.7 -9.6 -2.0 93.4 280.1 57.2 337.3
Balance at 1 Jan 2018 146.4 50.2 1.7 -10.4 -0.4 92.7 280.2 68.2 348.4 Effect of IFRS 2 amendment 1.0 1.0 1.0 Revised balance at 1 Jan 2018 146.4 50.2 1.7 -10.4 -0.4 93.7 281.2 68.2 349.4
Profit for the period 22.0 22.0 4.5 26.5 Other comprehensive income for the period 1.4 -1.0 0.4 -0.8 -0.4 Dividend (€0.49 per share) -35.8 -35.8 -35.8 Share-based incentive plan 0.1 0.0 0.1 0.1 Balance at 30 June 2018 146.4 50.2 3.0 -11.4 -0.3 80.0 267.9 71.9 339.8
*) Includes a €-14.3 (-13.9) million effective part of net investment hedging at the end of period.
A – Share capital B – Share premium C – Other reserves D* – Translation reserve E – Treasury shares F – Retained earnings G – Equity attributable to owners of the parent company H – Non-controlling interest I – Total equity

15 I 26 July 2019 I Half year financial report 1-6/2019
NOTES TO THE CONSOLIDATED HALF YEAR FINANCIAL STATEMENTS ACCOUNTING PRINCIPLES The half year financial report has been prepared in compliance with International Financial Reporting Standards (IFRS) as adopted by the EU and IAS 34 Interim Financial Reporting. In its interim reports, Uponor Group follows the same principles as in the annual financial statements for 2017, except for the adoption of new standards effective as of January 1, 2019. New standards adopted beginning on January 1, 2019 IFRS 16 Leases IFRS 16 Leases became effective on January 1, 2019 and supersedes the IAS 17 -standard and related interpretations. The standard sets out the principles for the recognition, measurement, presentation and disclosure of leases. Uponor adopted IFRS 16, Leases using the modified retrospective method of adoption with the date of initial application of 1 January 2019. Under this method, the standard is applied retrospectively with the cumulative effect of initially applying the standard recognised at the date of initial application. This means that the comparatives have not been adjusted for the period ending 31.12.2018. Uponor recognized a right-of-use asset and lease liability for lease contracts previously categorized as operating leases under IAS 17. The right-of-use asset is recognized at an amount equal to the lease liability at the present value of the lease payments that are not paid on January 1, 2019. The adoption of IFRS 16 did not have any impact on equity. Prior to the adoption of IFRS 16, lease agreements were classified as either finance leases or operating leases under IAS 17. A lease was classified as a finance lease if it transferred substantially all of the risks and rewards incidental to ownership of the leased asset. Otherwise it was classified as an operating lease. Finance leases were capitalized at the commencement of the lease at the inception date fair value of the asset or if lower, at the present value of the minimum lease payments. Similarly, lease obligations, deducted by financing expenses, were recognized in interest bearing liabilities. The finance lease assets were depreciated over their useful life or within the shorter lease term. Interest costs were expensed in the consolidated statement of comprehensive income during the lease term. Leases in which the lessor retained risks and rewards incidental to ownership of the asset were classified as operating leases. The rents related to operating leases were recognized as expenses in profit or loss on a straight line basis over the lease term. The undiscounted commitments were presented in the notes to the financial statements. IFRS 16 requires lessees to account for the majority of lease contracts under a single on-balance sheet model. Lessees recognize a right-of-use asset and lease liability at the inception of the lease discounted to the present value of future lease payments. Previously recognized operating expenses for leases are replaced by depreciations of the right-of-use asset and interest expenses over the lease term. Leases previously classified as finance leases Uponor did not change the initial carrying amounts of recognised assets and liabilities at the date of initial application for leases previously classified as finance leases applying IAS 17. For these leases, Uponor has already recognized tangible assets and lease liabilities prior to the adoption of IFRS 16. The requirements of IFRS 16 was applied to these leases from January 1, 2019. After the transition these lease contracts will be treated in a similar way as all the lease contracts meeting the capitalization criteria of IFRS 16. Leases previously classified as operating leases The majority of lease agreements Uponor has entered into were previously classified as operating leases. These lease agreements consist mainly of real estate (offices and warehouses including land areas), cars and forklifts. The adoption of IFRS 16 has changed the accounting for these leases. Uponor applies the practical expedients relating to the short term and low-value leases. Uponor has not recognized right-of-use assets and liabilities for short-term leases with a lease term of 12 months or less or for leases of low value assets. Furthermore, Uponor does not apply IFRS 16 to intangible assets. Uponor also uses the practical expedients of the modified retrospective approach and does not thus include lease contracts which end within 12 months from the date of the initial application of IFRS 16 and do not contain a purchase option. Uponor recognised lease liabilities for those leases previously classified as operating leases, except for short-term leases and leases of low-value assets on January 1, 2019 based on the present value of the remaining lease payments, discounted using the incremental borrowing rate at the date of application, and a right-of-use asset with an equivalent value. In assessing the lease term, Uponor has estimated the expected termination date. In estimating the termination date, Uponor considers e.g. the expenditure related to the termination of the lease and the importance of the underlying asset to its operations. Uponor has entered into lease agreements valid until further notice relating mainly to real estate leases. Based on the foregoing, as at January 1, 2019 Uponor recognized an addition of €44.3 million of right-of-use assets and €44.3 million of lease liabilities.

16 I 26 July 2019 I Half year financial report 1-6/2019
AMOUNTS RECOGNISED IN CONDENSED CONSOLIDATED STATEMENT OF FINANCIAL POSITION
M€ 1.1.2019 IFRS 16 31.12.2018
Property, plant and equipment ROU assets 47.2 47.2
Capitalised finance lease assets -2.9 2.9
Interest-bearing liabilities, non-current
Lease liability 37.7 34.1 3.6
Interest-bearing liabilities, current
Lease liability 11.0 10.2 0.8 As a result of applying IFRS 16 the equity ratio decreased by 2.4 percentage points, the gearing increased by 12.5 percentage points and the net interest-bearing liabilities increased by 32 percentage points when adjusting 31.12.2018 figures with IFRS 16 impact. Additionally, the adoption of IFRS 16 will impact the income statement of Uponor. From January 1, 2019 onwards Uponor will recognize a depreciation charge in the income statement instead of an operating expense and an interest expense related to the lease liability. This change will have only minor impact on operating profit and net result will decrease slightly. IFRS 16 will also impact the presentation of cash flows. Lease expenditure was previously presented as cash flow from operations in its entirety but in the future only the interest expense related to leases shall be presented in the cash flow from operations. The majority of the expenditure related to lease payments is presented in the cash flow from financing activities. Summary of new accounting policies Lease liabilities At the commencement date of the lease, Uponor recognises lease liabilities measured at the present value of lease payments to be made over the lease term. The lease payments include fixed payments, inclusive of in-substance fixed payments, less any lease incentives receivable and variable lease payments that depend on an index or a rate, initially measured using the index or rate as at the commencement date. The lease contracts may also contain payments of penalties for terminating the leases. Uponor includes the termination penalty in the lease payments if it has determined that there is a reasonable certainty of terminating the lease. VAT is not included in the carrying amount of the leasing liability. Uponor has analysed the expected lease term and thereby assessed whether it is reasonably certain that any options to extend or terminate the agreements will be exercised for the lease contracts. Uponor calculates the present value of the lease payments using the interest rate implicit in the lease if this is readily available. For contracts where the interest rate implicit in the lease is not readily available, the incremental borrowing rate is used. The incremental borrowing rate is defined in IFRS 16 as the rate of interest that a lessee would have to pay to borrow over a similar term, and with a similar security, the funds necessary to obtain an asset of a similar value to the right-of-use asset in a similar economic environment. Uponor has determined the incremental borrowing rates taking into consideration the financial environment of the contract, the maturity of the lease agreements as of 31.12.2018 and the different economic environments. Based on these factors Uponor uses an interest rate matrix to determine the appropriate discount rate in different lease contracts where the interest rate implicit in the lease is not readily available. Right-of-use assets Uponor recognizes right-of-use assets at the commencement date of the lease which is the date that the underlying asset is available for use. Right-of-use assets are measured at cost less any accumulated depreciation and impairment losses, and adjusted for any remeasurement of lease liabilities. The cost of right-of-use assets includes the amount of lease liabilities recognised, initial direct costs incurred, and lease payments made at or before the commencement date less any lease incentives received. Unless the Group is reasonably certain to obtain ownership of the leased asset at the end of the lease term, the recognised right-of-use assets are depreciated on a straight-line basis over the shorter of its estimated useful life and the lease term. Right-of-use assets are subject to impairment in future periods. Short-term leases and leases of low-value assets Uponor applies the short-term lease recognition exemption to its short-term leases and does not recognize at 1 January 2019 leases with a lease term of 12 months or less from the commencement date. In determining whether a contract is a short-term contract Uponor takes into account reasonable certainty of exercising extension and termination options similarly as for other leases. If a lease contains a purchase option, Uponor does not consider it to be a short-term lease. Lease payments relating to short-term leases are recognized as an expense on a straight-line basis over the lease term. Uponor also applies the recognition exemption related to leases of low-value assets and recognizes leases of low-value assets as an expense on a straight-line basis over the lease term. In determining whether a lease contains a low-value asset, Uponor considers the value of the underlying asset when new and not in its current age and condition. Significant judgment IFRS 16 requires lessees to determine the lease term as the non-cancellable period of a lease adjusted with any option to extend or terminate the lease, if the use of such option is reasonably certain. Uponor has analysed the expected lease term and thereby assessed whether it is reasonably certain that any options to extend or terminate the agreements will be exercised for the lease contracts. Uponor has lease agreements with either a fixed lease term or which are valid until further notice. Uponor evaluates the lease term on a case by case basis. For lease agreements valid until further notice, Uponor has determined the lease term using the expected

17 I 26 July 2019 I Half year financial report 1-6/2019
termination date based on its best estimate. Uponor considers any significant leasehold improvements undertaken over the term, costs relating to the termination of the lease, such as negotiation costs, relocation costs, costs of identifying another underlying asset suitable for the lessee’s needs, costs of integrating a new asset into the lessee’s operations, or termination penalties and similar costs, including costs associated with returning the underlying asset in a contractually specified condition or to a contractually specified location. Additionally, the importance of that underlying asset to the lessee’s operations are considered, for example, whether the underlying asset is a specialised asset, the location of the underlying asset and the availability of suitable alternatives. Uponor will revise the lease term if there is a change in the non-cancellable period of a lease.
PROPERTY, PLANT AND EQUIPMENT AND INTANGIBLE ASSETS M€ 30.6.2019 30.6.2018 31.12.2018
Gross investment 9.8 24.9 54.0 - % of net sales 1.8 4.1 4.5
Book value of disposed fixed assets 2.2 0.5 0.7
Depreciation and impairments* 25.8 19.2 42.4
* 2019 include ROU asset depreciations 5.8M€
PERSONNEL
Converted to full time employees 1-6/2019 1-6/2018 1-12/2018
Average 3,837 4,163 4,074 At the end of the period 3,842 4,351 3,928
OWN SHARES 30.6.2019 30.6.2018 31.12.2018
Own shares held by the company, pcs 219,527 44,756 244,756 - of share capital, % 0.3 % 0.1 0.3
- of voting rights, % 0.3 % 0.1 0.3
Accounted par value of own shares held by the company, M€ 0.4 0.1 0.5 SEGMENT INFORMATION
1-6/2019 1-6/2018 M€ External Internal Total External Internal Total Net sales by segment Building Solutions - Europe 247.5 1.8 249.3 262.8 1.1 263.9 Building Solutions - North America 171.0 0.0 171.0 161.1 0.0 161.1 Uponor Infra 123.0 1.7 124.8 177.9 1.5 179.4 Eliminations 0.0 -3.5 -3.5 - -2.6 -2.6 Total 541.5 - 541.5 601.8 - 601.8 4-6/2019 4-6/2018 M€ External Internal Total External Internal Total Net sales by segment Building Solutions - Europe 124.8 0.9 125.7 138.1 0.6 138.7 Building Solutions - North America 96.3 0.0 96.3 83.5 0.0 83.5 Uponor Infra 71.5 0.9 72.4 103.3 0.8 104.1 Eliminations 0.0 -1.8 -1.8 - -1.4 -1.4 Total 292.6 - 292.6 324.9 - 324.9 1-12/2018 M€ External Internal Total Net sales by segment Building Solutions - Europe 521.6 2.6 524.2 Building Solutions - North America 340.5 0.0 340.5 Uponor Infra 334.2 3.1 337.3 Eliminations 0.0 -5.7 -5.7 Total 1,196.3 - 1,196.3 M€ 1-6/2019 1-6/2018 4-6/2019 4-6/2018 1-12/2018 Operating profit by segment Building Solutions - Europe 15.4 17.0 8.2 11.0 31.1

18 I 26 July 2019 I Half year financial report 1-6/2019
Building Solutions - North America 21.3 19.0 13.8 8.8 46.6 Uponor Infra 6.0 13.4 5.4 10.1 35.1 Others -3.1 -2.3 -1.8 -1.3 -5.2 Eliminations 0.0 -2.1 -0.3 -0.6 -0.9 Total 39.5 45.0 25.3 28.0 106.7
M€ 1-6/2019 1-6/2018 1-12/2018 Segment depreciation and impairments Building Solutions - Europe 9.5 6.7 16.4 Building Solutions - North America 10.4 6.7 15.1 Uponor Infra 5.0 5.3 9.9 Others 0.8 0.5 1.0 Eliminations 0.0 0.0 0.0 Total 25.8 19.2 42.4
Segment investments Building Solutions - Europe 4.1 6.4 15.3 Building Solutions - North America 3.3 14.3 27.6 Uponor Infra 2.2 4.0 9.5 Others 0.2 0.2 1.6 Total 9.8 24.9 54.0
M€ 30.6.2019 30.6.2018 31.12.2018
Segment assets Building Solutions - Europe 401.6 403.5 357.0 Building Solutions - North America 306.4 265.7 286.1 Uponor Infra 193.1 245.3 171.5 Others 361.0 382.3 358.5 Eliminations -400.1 -391.7 -386.5 Total 862.0 905.1 786.6
Segment liabilities Building Solutions - Europe 357.3 351.4 305.0 Building Solutions - North America 240.4 197.8 232.0 Uponor Infra 77.7 96.6 58.3 Others 288.9 336.3 261.7 Eliminations -439.6 -416.8 -424.1 Total 524.7 565.3 432.9 1-6/2019 1-6/2018 1-12/2018 Segment personnel, average Building Solutions - Europe 1,970 2,102 2,073 Building Solutions - North America 888 920 925 Uponor Infra 898 1,063 999 Others 80 78 77 Total 3,837 4,163 4,074
Reconciliation M€ 1-6/2019 1-6/2018 1-12/2018
Operating profit by segment Total result for reportable segments 42.7 49.4 112.8 Others -3.1 -2.3 -5.2 Eliminations 0.0 -2.1 -0.8 Operating profit 39.5 45.0 106.7 Financial expenses, net 6.6 4.4 8.5 Share of results in associated companies and joint ventures -2.0 -3.0 -4.7 Profit before taxes 31.0 37.6 93.5

19 I 26 July 2019 I Half year financial report 1-6/2019
Revenue from contract with customers The Group disaggregates revenue recognised from contracts with customers into categories that depict how the nature, amount, timing and uncertainty of revenue and cash flows are affected by economic factors. Set out below is the disaggregation of the Group's revenue from contract with customers, including reconciliation of the revenue:
1-6/2019 1-6/2018
M€ Sale of goods
Rendering of services
Total Sale of goods
Rendering of services
Total
Revenue from contract with customers by segment Building Solutions - Europe 244.2 3.3 247.5 244.6 18.2 262.8 Building Solutions - North America 171.0 0.0 171.0 161.1 0.0 161.1 Uponor Infra 112.8 10.3 123.0 172.6 5.3 177.9 External customer, total 528.0 13.5 541.5 578.3 23.5 601.8 Internal 3.5 3.5 2.6 2.6 Total 531.5 13.5 545.0 580.9 23.5 604.4 Eliminations -3.5 -3.5 -2.6 -2.6 Total revenue from contracts with customer 528.0 13.5 541.5 578.3 23.5 601.8
4-6/2019 4-6/2018
M€ Sale of goods
Rendering of services
Total Sale of goods
Rendering of services
Total
Revenue from contract with customers by segment Building Solutions - Europe 123.2 1.7 124.8 127.6 10.5 138.1 Building Solutions - North America 96.3 0.0 96.3 83.5 0.0 83.5 Uponor Infra 65.3 6.2 71.5 100.6 2.6 103.3 External customer, total 284.8 7.9 292.6 311.8 13.1 324.9 Internal 1.8 0.0 1.8 1.3 0.0 1.3 Total 286.6 7.9 294.4 313.1 13.1 326.2 Eliminations -1.8 0.0 -1.8 -1.3 0.0 -1.3 Total revenue from contracts with customer 284.8 7.9 292.6 311.8 13.1 324.9
CONTINGENT LIABILITIES AND ASSETS
M€ 30.6.2019 30.6.2018 31.12.2018
Commitments of purchase PPE (Property, plant, equipment) 6.4 16.9 7.4 Other commitments 0.0 0.7 0.0
- on own behalf
Pledges at book value 0.1 0.1 0.1 Mortgages issued 1.9 2.0 1.9
Guarantees issued 0.7 5.4 0.6
- on behalf of a subsidiary
Guarantees issued 29.4 30.7 27.3
Letter of Comfort commitments undertaken on behalf of subsidiaries
are not included in the above figures
Pledges at book value 0.1 0.1 0.1 Mortgages issued 1.9 2.0 1.9
Guarantees issued 30.1 36.1 27.9
Total 32.0 38.2 29.9

20 I 26 July 2019 I Half year financial report 1-6/2019
FINANCIAL ASSETS AND LIABILITIES BY MEASUREMENT CATEGORY
M€ IFRS 7 Fair value hierarchy level 30.6.2019 30.6.2018 31.12.2018
Non-current financial assets Fair value through other comprehensive income Electricity derivatives 1 0.6 0.9 1.0 Amortised cost
Other non-current receivables 10.7 10.6 10.8
Other shares and holdings 0.2 0.2 0.2
Current financial assets
Fair value through other comprehensive income
Electricity derivatives 1 0.6 1.2 1.5
Fair value through profit or loss
Other derivative contracts 2 2.2 1.5 2.4
Amortised cost
Accounts receivable and other receivables 251.7 273.2 192.3
Cash and cash equivalents 13.2 32.1 38.1
Financial assets total 279.2 319.7 246.3
Non-current financial liabilities Amortised cost Interest bearing liabilities 206.0 176.6 175.6 Current financial liabilities Fair value through other comprehensive income Other derivative contracts 2 1.2 0.5 0.6
Fair value through the profit or loss
Other derivative contracts 2 1.1 2.4 0.5
Amortised cost
Interest bearing liabilities 32.1 73.8 1.7
Accounts payable and other liabilities 148.4 150.9 98.2
Financial liabilities total 388.8 404.2 276.6 The carrying value of financial assets and liabilities is considered to correspond to their fair value. The Group’s financial instruments are classified according to IFRS 7 fair value hierarchies. Uponor applies the hierarchy as follows: - The fair value of electricity derivatives is measured based on stock exchange prices. (Hierarchy 1) - The fair value of currency forward agreements is measured based on price information from common markets and commonly used
valuation methods. (Hierarchy 2) DISPOSAL OF SUBSIDIARIES AND BUSINESSES On 29 April, Uponor Infra and EP Industries a.s. signed a share purchase agreement for Uponor Infra’s Czech subsidiary Fintherm. The sales price for the transaction was €3.4 million and the profit of €0.5 million has been booked to other operating income.
M€ 2019
Book value of disposed assets and liabilities Property, plant and equipment 2.0 Inventory 1.9
Accounts receivable and other receivables 1.3
Cash and cash equivalents 0.2
Total assets 5.4

21 I 26 July 2019 I Half year financial report 1-6/2019
Interest-bearing non-current liabilities 0.4 Accounts payable and other current liabilities 1.2
Total liabilities 1.7
Net assets 3.7
Cash received from sales 3.4
Cash and cash equivalents disposed of 0.2
Cash flow effect 3.2 KEY FIGURES
1-6/2019 1-6/2018 1-12/2018
Earnings per share, € 0.29 0.30 0.72
Operating profit, % 7.3 7.5 8.9
Return on equity, % (p.a.) 13.0 15.4 18.0
Return on investment, % (p.a.) 12.2 13.5 17.2
Solvency ratio, % 39.2 37.8 45.1
Gearing, % 66.7 64.2 39.4
Gearing, % rolling 4 quarters 55.2 55.6 53.0
Net interest-bearing liabilities 224.9 218.3 139.2
Equity per share, € 3.84 3.66 4.08
- diluted 3.84 3.66 4.08
Trading price of shares
- low, € 8.52 13.22 8.13
- high, € 11.06 17.62 17.62
- average, € 9.77 14.76 12.24
Shares traded
- 1,000 pcs 16,082 16,566 40,763
- M€ 157.1 244.5 499.0

22 I 26 July 2019 I Half year financial report 1-6/2019
QUARTERLY DATA
4-6/
2019 1-3/
2019 10-12/
2018 7-9/
2018 4-6/
2018 1-3/
2018
Net sales, M€ 292.6 248.9 282.6 311.9 324.9 276.9 - Building Solutions – Europe 125.7 123.5 128.5 131.8 138.7 125.2 - Building Solutions – North America 96.3 74.7 90.5 88.9 83.5 77.6 Building Solutions – North America, $ 108.5 85.0 103.3 103.8 98.8 95.7 - Uponor Infra 72.4 52.4 65.3 92.6 104.1 75.3 Gross profit, M€ 97.6 86.2 94.2 106.1 107.3 93.2 - Gross profit, % 33.4 34.6 33.3 34.0 33.0 33.7
Operating profit, M€ 25.3 14.3 17.1 44.6 28.0 17.0 - Building Solutions – Europe 8.2 7.2 5.1 9.0 11.0 6.0 - Building Solutions – North America 13.8 7.5 13.7 13.9 8.8 10.2 Building Solutions – North America, $ 15.6 8.5 15.7 16.3 10.4 12.5 Uponor Infra 5.4 0.6 -0.2 21.9 10.1 3.3 - Others -1.8 -1.3 -1.2 -1.7 -1.3 -1.0 Operating profit, % of net sales 8.6 5.7 6.1 14.3 8.6 6.1 - Building Solutions – Europe 6.5 5.9 4.0 6.9 7.9 4.8 - Building Solutions – North America 14.4 10.0 15.2 15.8 10.5 13.1 - Uponor Infra 7.5 1.1 -0.4 23.6 9.8 4.4
Profit for the period, M€ 15.4 7.1 6.7 30.0 17.3 9.2
Balance sheet total, M€ 862.0 848.3 786.6 842.8 905.1 855.5
Earnings per share, € 0.18 0.10 0.08 0.34 0.19 0.11 Equity per share, € 3.84 3.68 4.08 4.02 3.66 3.43 Market value of share capital, M€ 699.1 746.0 631.0 824.3 1,006.6 993.4
Return on investment, % (p.a.) 12.2 8.0 17.2 19.1 13.5 9.9 Net interest-bearing liabilities at the end of the period, M€ 224.9
236.0 139.2
156.7
218.3
211.9
Gearing, % 66.7 72.8 39.4 42.2 64.2 66.3 Gearing, % rolling 4 quarters 55.2 54.6 53.0 54.1 55.6 56.4
Gross investment, M€ 5.0 4.8 17.8 11.3 15.0 9.9 - % of net sales 1.7 1.9 6.3 3.6 4.6 3.6

23 I 26 July 2019 I Half year financial report 1-6/2019
ITEMS AFFECTING COMPARABILITY AND RECONCILIATIONS TO IFRS Uponor provides comparable operating profit and comparable gross profit in order to provide useful and comparable information of its operative business performance. Comparable operating or gross profit excludes items affecting comparability (IAC). Items affecting comparability are exceptional transactions that are unrelated to normal business operations. Such items often include issues such as capital gains and losses, additional costs arising from site closures and other restructuring, additional write-downs, or reversals of write-downs, expenses due to accidents and disasters, environmental matters, legal proceedings and changes in regulation.
4-6/ 2019
1-3/ 2019
10-12/ 2018
7-9/ 2018
4-6/ 2018
1-3/ 2018
Items affecting comparability
Restructuring charges 0.0 0.0 -6.9 -1.4 - - Capital gains and losses on sale of non-current assets 0.0 0.0 3.5 12.2 - - Total items affecting comparability in operating profit 0.0 0.0 -3.4 10.8 - -
Items affecting comparability, total 0.0 0.0 -3.4 10.8 - -
Comparable gross profit Gross profit 97.6 86.2 94.2 106.1 107.3 93.2 Less: Items affecting comparability in gross profit - - - - - - Comparable gross profit 97.6 86.2 94.2 106.1 107.3 93.2 % of sales 33.4 34.6 33.3 34.0 33.0 33.7 Comparable operating profit
Operating profit 25.3 14.3 17.1 44.6 28.0 17.0 Less: Items affecting comparability in operating profit 0.0 0.0 -3.4 10.8 - - Comparable operating profit 25.3 14.3 20.5 33.8 28.0 17.0 % of sales 8.6 5.7 7.2 10.9 8.6 6.1 Comparable operating profit by segment
Building Solutions - Europe
Operating profit 8.2 7.2 5.1 9.0 11.0 6.0 Less: Items affecting comparability in operating profit 0.0 0.0 -2.9 -1.4 - - Comparable operating profit 8.2 7.2 8.0 10.4 11.0 6.0 % of sales 6.5 5.9 6.2 7.9 7.9 4.8 Building Solutions - North America
Operating profit 13.8 7.5 13.7 13.9 8.8 10.2 Comparable operating profit 13.8 7.5 13.7 13.9 8.8 10.2 % of sales 14.4 10.0 15.2 15.8 10.5 13.1 Uponor Infra
Operating profit 5.4 0.6 -0.2 21.9 10.1 3.3 Less: Items affecting comparability in operating profit - - -0,5 12.2 - - Comparable operating profit 5.4 0.6 0.3 9.7 10.1 3.3 % of sales 7.5 1.1 0.3 10.4 9.8 4.4 Others
Operating profit -1.8 -1.3 -1.2 -1.7 -1.3 -1.0 Less: Items affecting comparability in operating profit - - - - - - Comparable operating profit -1.8 -1.3 -1.2 -1.7 -1.3 -1.0 % of sales na na na na na na

24 I 26 July 2019 I Half year financial report 1-6/2019
DEFINITIONS OF KEY RATIOS Return on Equity (ROE), %
Profit before taxes – taxes = –––––––––––––––––––––––––––––––––––––––– x 100 Total equity, average Return on Investment (ROI), % Profit before taxes + interest and other financing costs = ––––––––––––––––––––––––––––––––––––-----------–––– x 100 Balance sheet total – non-interest-bearing liabilities, average Solvency, % Total equity = ––––––––––––––––––––––––––––––––––––----- x 100 Balance sheet total – advance payments received Gearing, % Net interest-bearing liabilities = –––––––––––––––––––––––––––––––––--------- x 100 Total equity Net interest-bearing liabilities = Interest-bearing liabilities – cash and cash equivalents excluding restricted cash Earnings per share (EPS) Profit for the period attributable to equity holders of the parent company = –––––––––––––––––––––––––––––––––––––––––––––––––--------------
Average number of shares adjusted for share issue in financial period excluding treasury shares
Equity per share ratio Equity attributable to the owners of the parent company = ––––––––––––––––––––––––––––––––––––––––––––----------– Number of shares adjusted for share issue at end of year Average share price Total value of shares traded (€) = ––––––––––––––––––––––––––– Total number of shares traded Gross profit margin Gross profit = ––––––––––––––––––––––––––– x 100 Net sales Operating profit margin Operating profit = ––––––––––––––––––––––––––– x 100 Net sales Comparable gross profit margin Gross profit – items affecting comparability = ––––––––––––––––––––––––––––––––––––––––––––----------– x 100 Net sales Comparable operating profit margin Operating profit – items affecting comparability = ––––––––––––––––––––––––––––––––––––––––––––----------– x 100 Net sales